4.3. Learn
The ML Learn Plugin allows for a Machine Learning Model to be trained.
python bin/lucy.egg plugins ml_learn -h
Primary Arguments
Main specifications for a Learn task.
| Argument | Detail |
|---|---|
| -input | PATH. File path to the input data. |
| -output | PATH. File path to where the output summary file will be saved. It is recommend that this ‘file be saved as a JSON. |
| -mfile | PATH. File path to where the resulting Pickled model fill will be saved. This is a serialized pickle (.pkl) file. |
| -clabel | STR. Used with ‘-classify’ and ‘-regression’. The name of the target/response/output column. |
Preprocessing
Manipulation of the data before using it.
| Argument | Detail |
|---|---|
| -autoclean | NONE. The use of this command cleans the data based on a pre-defined set of rules. |
| -independents | COMMA SEPARATED LIST. A subset of column names that will be used for Learning. The subset will automatically include a ‘-clabel’ if specified. |
| -normalize | METHOD. (‘standard’, ‘minmax’) Normalizes the columns of ALL numerical data using the selected scaling method. |
| -degree | INT. (1 - 5) Generates new input data to be polynomial combinations of the original input dataset. This transformation can be used when the input data is numerical. |
| -cv | METHOD. (‘yes’, ‘no’) Turn on Cross-validation. Currently, option ‘yes’ enables K-fold cross-validation. |
| -cval | INT. Used with ‘-cv’ when the K-fold Cross-Validation has been selected. The value given is the ‘K’ number of folds. |
Cluster
Unsupervised learning methods used to train models that put observations into similar categories.
| Argument | Detail |
|---|---|
| -cluster | ALGO. (‘kmeans’, ‘meanshift’) Unsupervised Learning algorithms that groups similar data points. |
| -nc | INT. Used with ‘-cluster kmeans’. The number of clusters that the observations will be put into based on found similarity. The default value is 3. |
| -bandwidth | FLOAT. Used with ‘-cluster meanshift’. Reflects the distribution of the observations. The bandwidth selected must be done while being aware of range(s) of the dataset. A dataset that has been normalized using a minmax scalar will have numerical values between 0 and 1. This means that the bandwidth should also be between 0 and 1. |
Classify
Supervised learning methods used to train models based on categorical target values.
| Argument | Detail |
|---|---|
| -classify | ALGO. (‘dtree’, ‘rfc’, ‘gnb’, ‘logistic’) Learns a classification model using the algorithm given. |
| -cval | FLOAT. (0 - 100) Used with ‘-classify dtree’, ‘-classify rfc’, or ‘-classify gnb’. Percentage of the data to be used for cross-validation. The default value is 1. |
| -criterion | CRITERION. (‘gini’, ‘entropy’) Used with ‘-classify dtree’ and ‘-classify rfc’. The method to measure the quality of the split. The default is ‘gini’. |
| -nestimators | INT. Used with ‘-classify rfc’. The number of trees in the forest. The default value is 10. |
Regression
Supervised learning methods used to train models based on numerical target values.
| Argument | Detail |
|---|---|
| -regression | ALGO. (‘linear’, ‘lasso’, ‘ridge’, ‘svr’, ‘rfr’, ‘dtreereg’, ‘gpr’) Learns a regression model using the algorithm given. |
| -grid-response | NONE. Used with ‘-regression’. Works for input feature space sizes of 1 or 2. With the response, this results in a list of points that are 2D or 3D. Input prediction points are arranged based on the range(s) of the input values. The idea is that ‘-grid-response’ generates points that can be used to construct the regression line or a surface. Currently provides 10^p points, where ‘p’ is the number of input parameters. |
| -optimize | METHOD. (‘min’, ‘max’) Uses the model to determine the inputs required to obtain a prediction value that meets the optimize method selected. Used with ‘-regression linear/lasso/ridge’. |
Learn Examples
Input
A Learn routine begins by choosing the file path of where the input data is to be read from.
python bin/lucy.egg plugins ml_learn -input ./input_data.csv
Output
A Learn routine ends where the output data is to be saved. This file is in a json format and is packed with information. That is useful to the user and will contain the information necessary to reconstruct the Learned model without the requirement of python.
python bin/lucy.egg plugins ml_learn -input ./input_data.csv -output
./out.json
Preprocessing
Dimension Reduction
Dimensionality Reduction is the process transforming data to a lower dimensional space. Ideally, this lower dimensional space will retain many of the same properties as the original data set.
Feature Importance
Lucy uses two metrics for measuring Feature Importance given only a Target column. Currently, these metrics can only be obtained when running a Lucy Learn routine.
- Correlation - The correlation of each numeric input variable and a numeric Target
- Gini Importance - The importance measure of each input variable for a given target.
To obtain these, the option
-feature-importanceis used with no argument required. These values are populate when specifying a-clabeland are saved in the Lucy-Response JSON when specify a path for the Lucy-Response using-output.Consider the iris dataset and the following command:
python bin/lucy.egg plugins ml_learn -input iris.csv -output
iris_output.json -clabel class -classify dtree -feature-importance
The Lucy-Response is populated wth the following scores:
{
    ...
    "payload": {
        ...
        "feature_importance": {
            "gini_importance": {
                "sepal_width": 0.006145984326963746,
                "petal_width": 0.4852350158451978,
                "sepal_length": 0.0059189255008685404,
                "petal_length": 0.50270007432697
            }
        }
    }
}
Dimensional Reduction Suggestions
-dim-reduct
Principal Component Analysis
PCA is a linear dimensionality reduction technique that uses Singular Value Decomposition to project the original data to a lower dimensional space. Lucy keeps the principal components that explain 99% of the variance of the original data. These components are then used to transform the original data to a space of a lower dimension. The resulting columns do not share any direct relation to the features of the original data.
python bin/lucy.egg plugins ml_learn -input ./input.csv -output
./out.json -regression linear -label target -pca
The resulting PCA dataset is saved under ‘pca_dataset’ in the output file. This can be used in place of the original input. This PCA dataset would need to be saved as a csv and a new instance of Learn would need to be initiated where the input data is the pca_dataset along with the copied over target column.
Note
Currently, these dimensional reduction insight options can only be used when running a successful Learn process. The dimension reduction results are not used. They are options for the user to consider.
Independents
-independents
Normalize
-normalize
Autoclean
Autoclean is a way to clean a dataset before before performing the Learn task. Details of the exact procedures performed by Autoclean can be found at Clean’s Autoclean
The argument -autoclean is used in order to clean the dataset before the
Learn task is applied.
python bin/lucy.egg plugins ml_learn -input ./input_data.csv -output
./out.json -regression linear -clabel target -autoclean
Clustering
Clustering is a unsupervised learning technique that discovers natural grouping in a dataset.
K-Means
The K-Means clustering algorithm groups samples into a user-defined p number of groups. The group a sample belongs to is based on what centroid it is closest to. There are p centroids. The location of these centroids are found through interation from the K-Means algorithm. The algorithm scales well with a large number of samples.
Consider the Iris Dataset containing 3 different classes:
| sepal_length | sepal_width | petal_length | petal_width | class |
|---|---|---|---|---|
| 5.1 | 3.5 | 1.4 | 0.2 | 0 |
| 7 | 3.2 | 4.27 | 1.4 | 1 |
| 6.3 | 3.3 | 6 | 2.5 | 2 |
| … | … | … | … | … |
Plotting the petal length vs. the petal width shows a fairly clear separation in the three class.
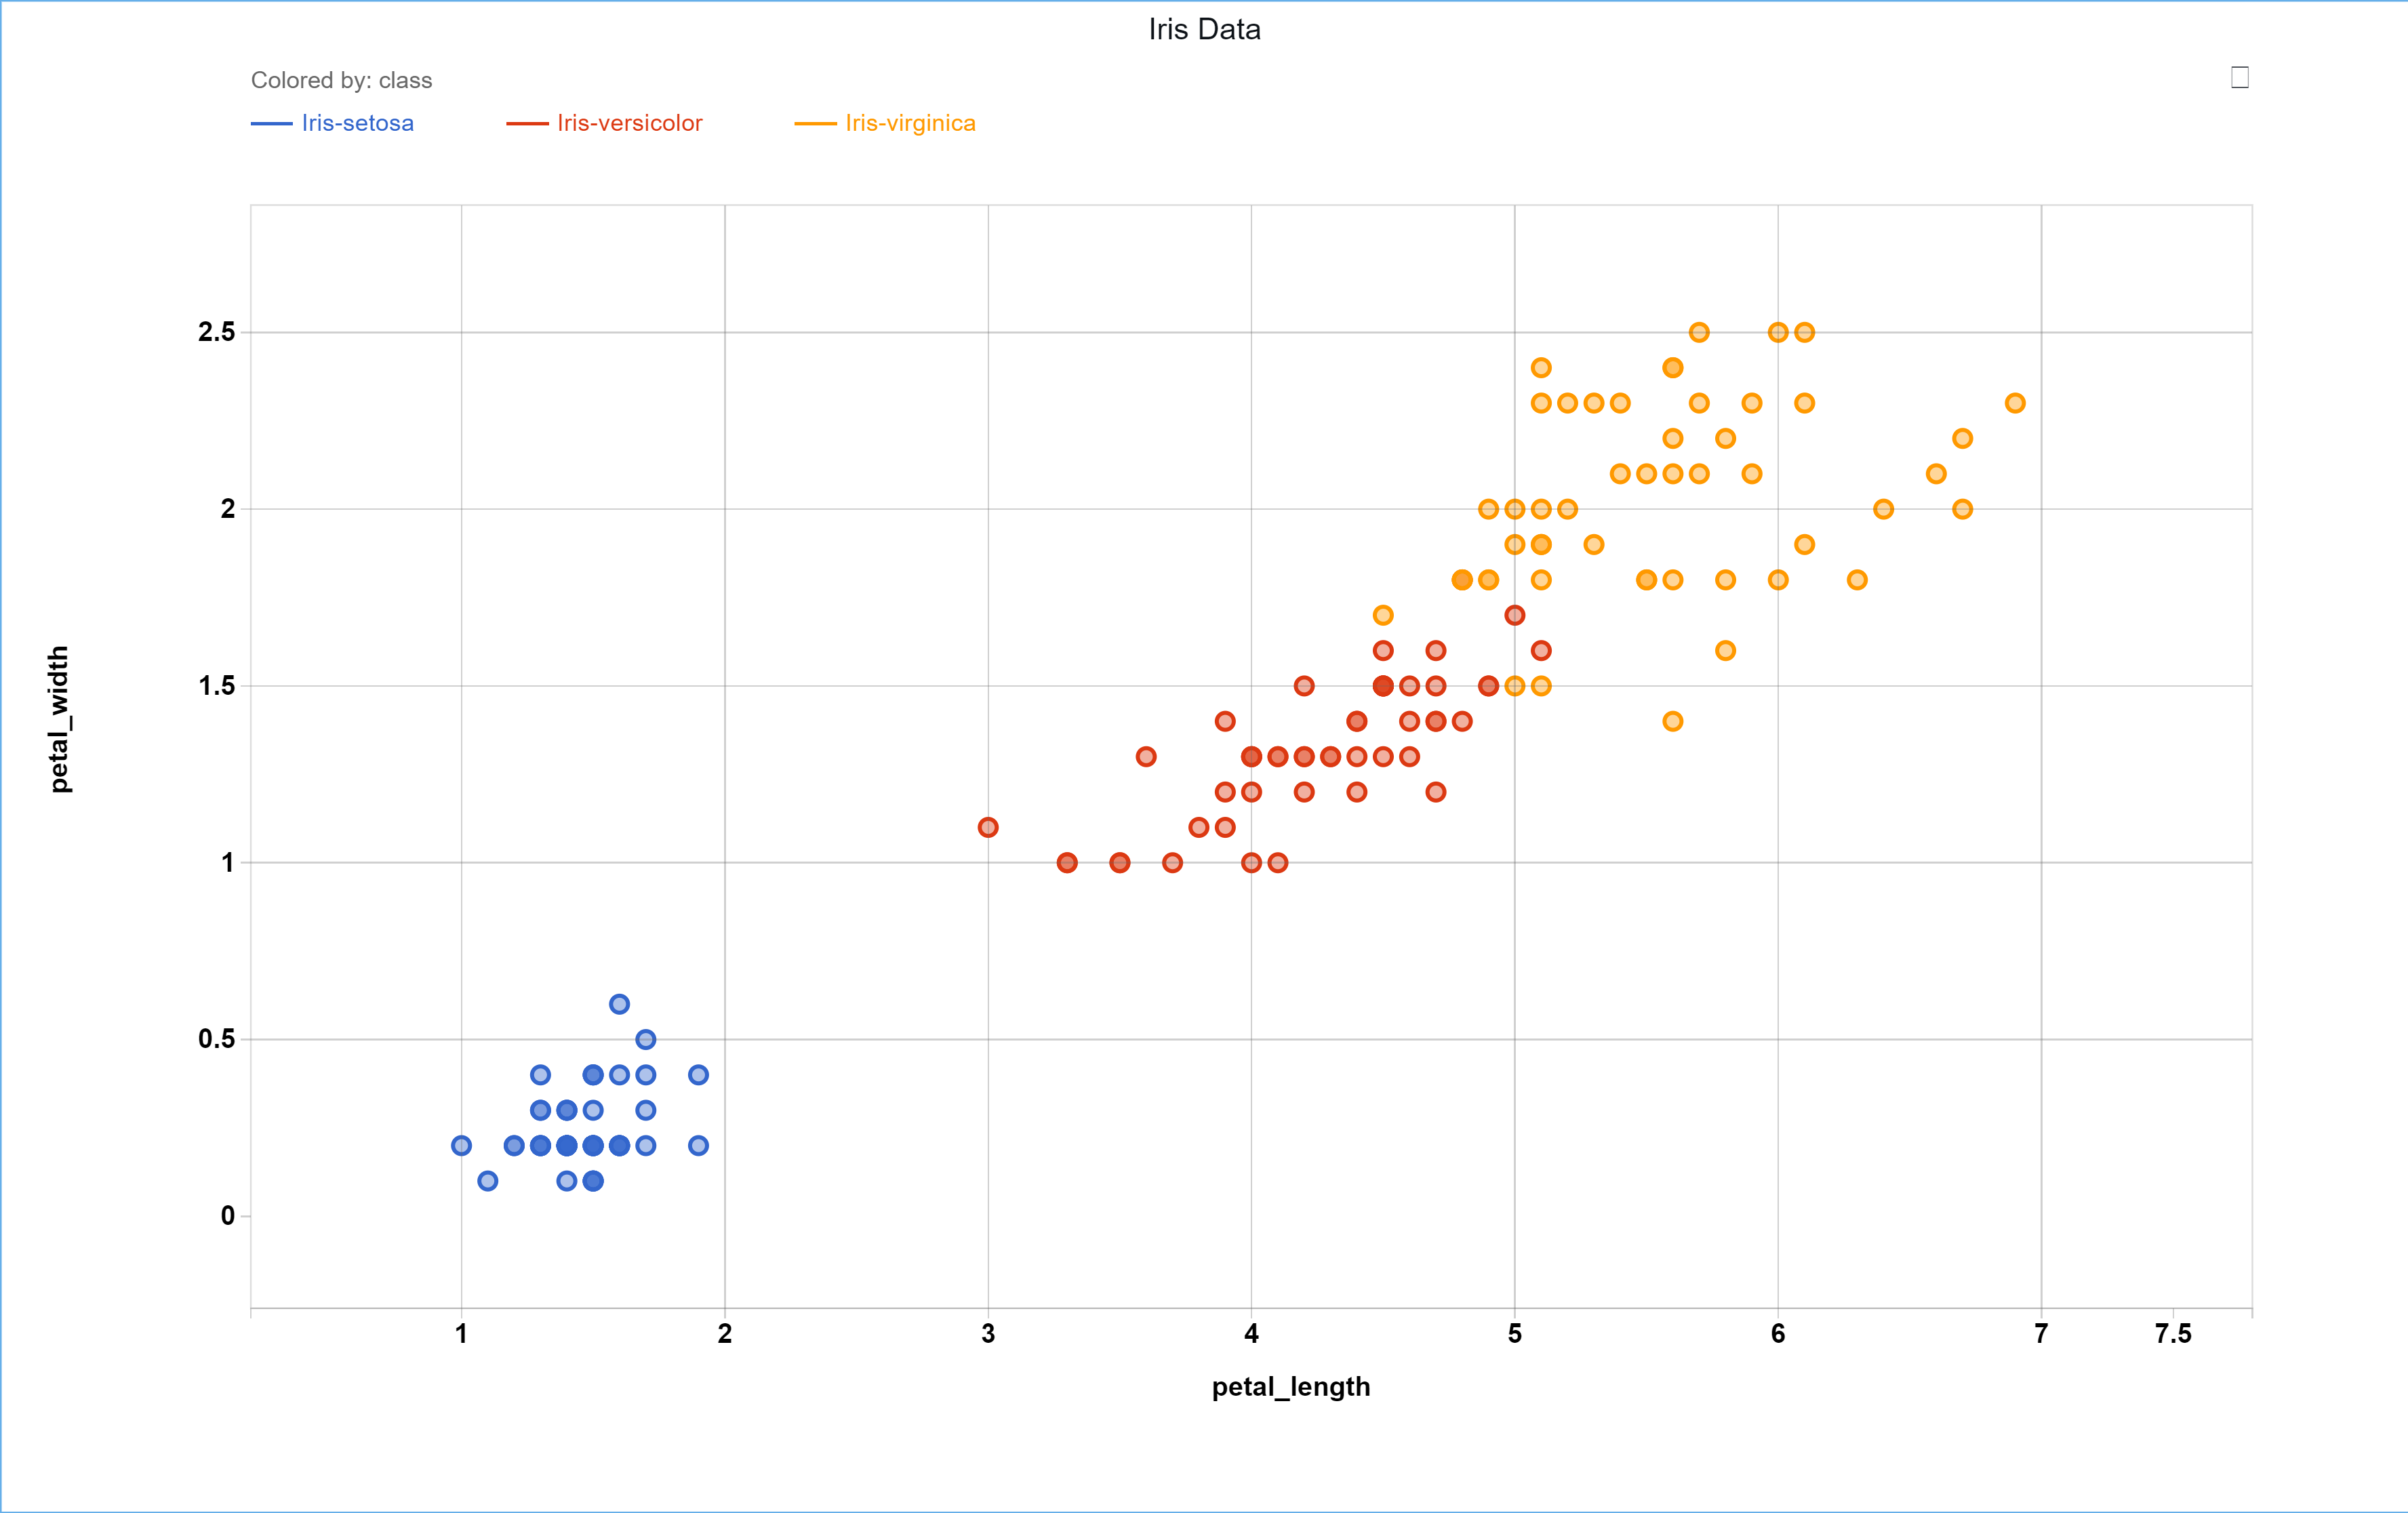
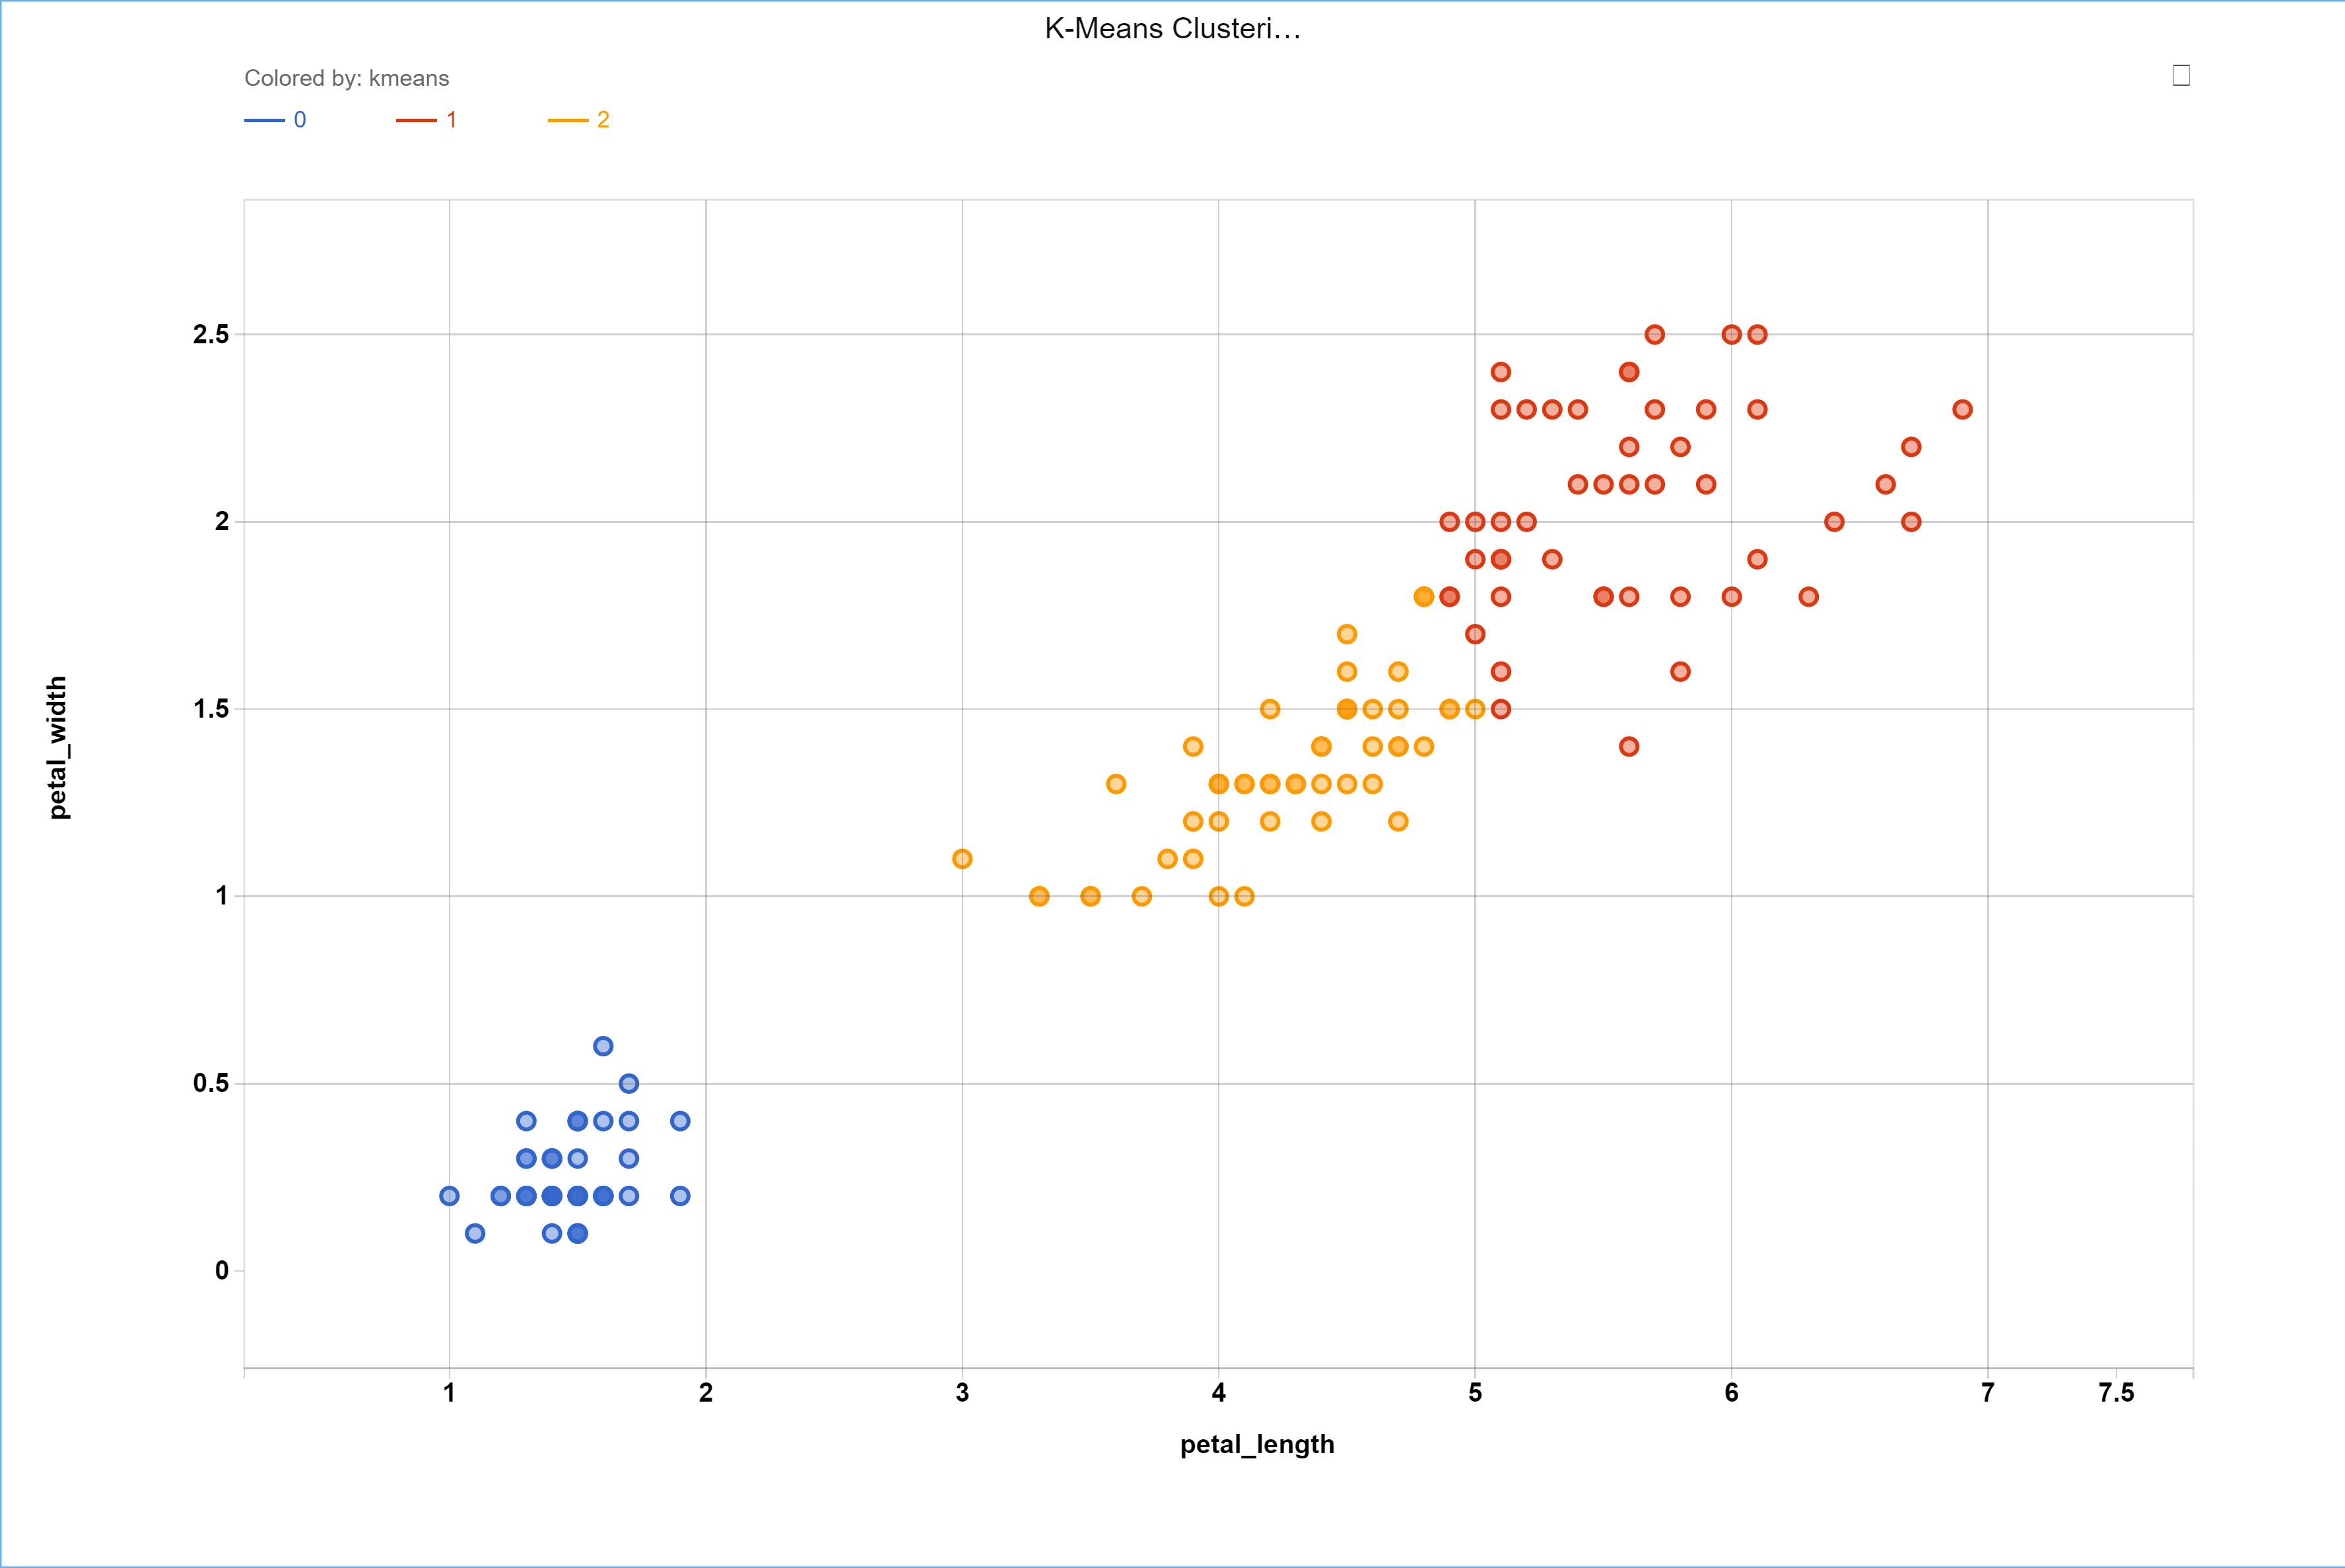
Now let’s use K-Means clustering to visually compare these results. It is
recommended number of cluster be fit to the problem in mind. This can be
accomplished using -nc.
python bin/lucy.egg plugins ml_learn -input ./input_data.csv -output
./out.json -independents petal_length,petal_width -cluster kmeans -nc 3
The resulting group assignments are saved in the Lucy-Response JSON file saved
at the -output path. The found labels are saved as a dictionary where the
key is the id (or the order) in which the the input points were provided to the
LEARN routine. The number of unique values these points are assigned to is equal
to the -nc provided. They location where these can be found in the
Lucy-Response is shown below:
{
    ...
    "payload": {
        ...
        "model_dict": {
            "labels_": {
                "139": 0,
                "138": 2,
                "24": 1,
                ...
            }
        }
    }
}
‘payload’ -> ‘model_dict’ -> ‘labels_’.
To visualize the results, the samples can be assigned the groups they have been given from the K-Means clustering in the same order the input data was given. The results can be seen below.
Additionally, the location of the centroids can be found in the output JSON at ‘payload’ -> ‘model_dict’ -> ‘cluster_centers_’. For this example the centroids were found to be
cluster_centers_ = [
    [1.4639999999999995,
     0.24400000000000022],
    [4.269230769230769,
     1.3423076923076924],
    [5.595833333333332,
     2.0374999999999996]
]
Note
There are no labels associated with the result. This is an unsupervised learning algorithm. The samples are grouped but the groups are not assigned any labels since there are no labels to learn from.
Mean Shift
MeanShift clustering aims to discover blobs in a smooth density of samples. It is a centroid based algorithm that works by updating candidates for centroids to be the mean of the points within a given region called the bandwidth. These candidates are then filtered in a post-processing stage to eliminate near-duplicates to form the final set of centroids.
Consider the Iris Dataset containing 3 different classes:
| sepal_length | sepal_width | petal_length | petal_width | class |
|---|---|---|---|---|
| 5.1 | 3.5 | 1.4 | 0.2 | 0 |
| 7 | 3.2 | 4.27 | 1.4 | 1 |
| 6.3 | 3.3 | 6 | 2.5 | 2 |
| … |
Plotting the petal length vs. the petal width shows a fairly clear separation in the three class.
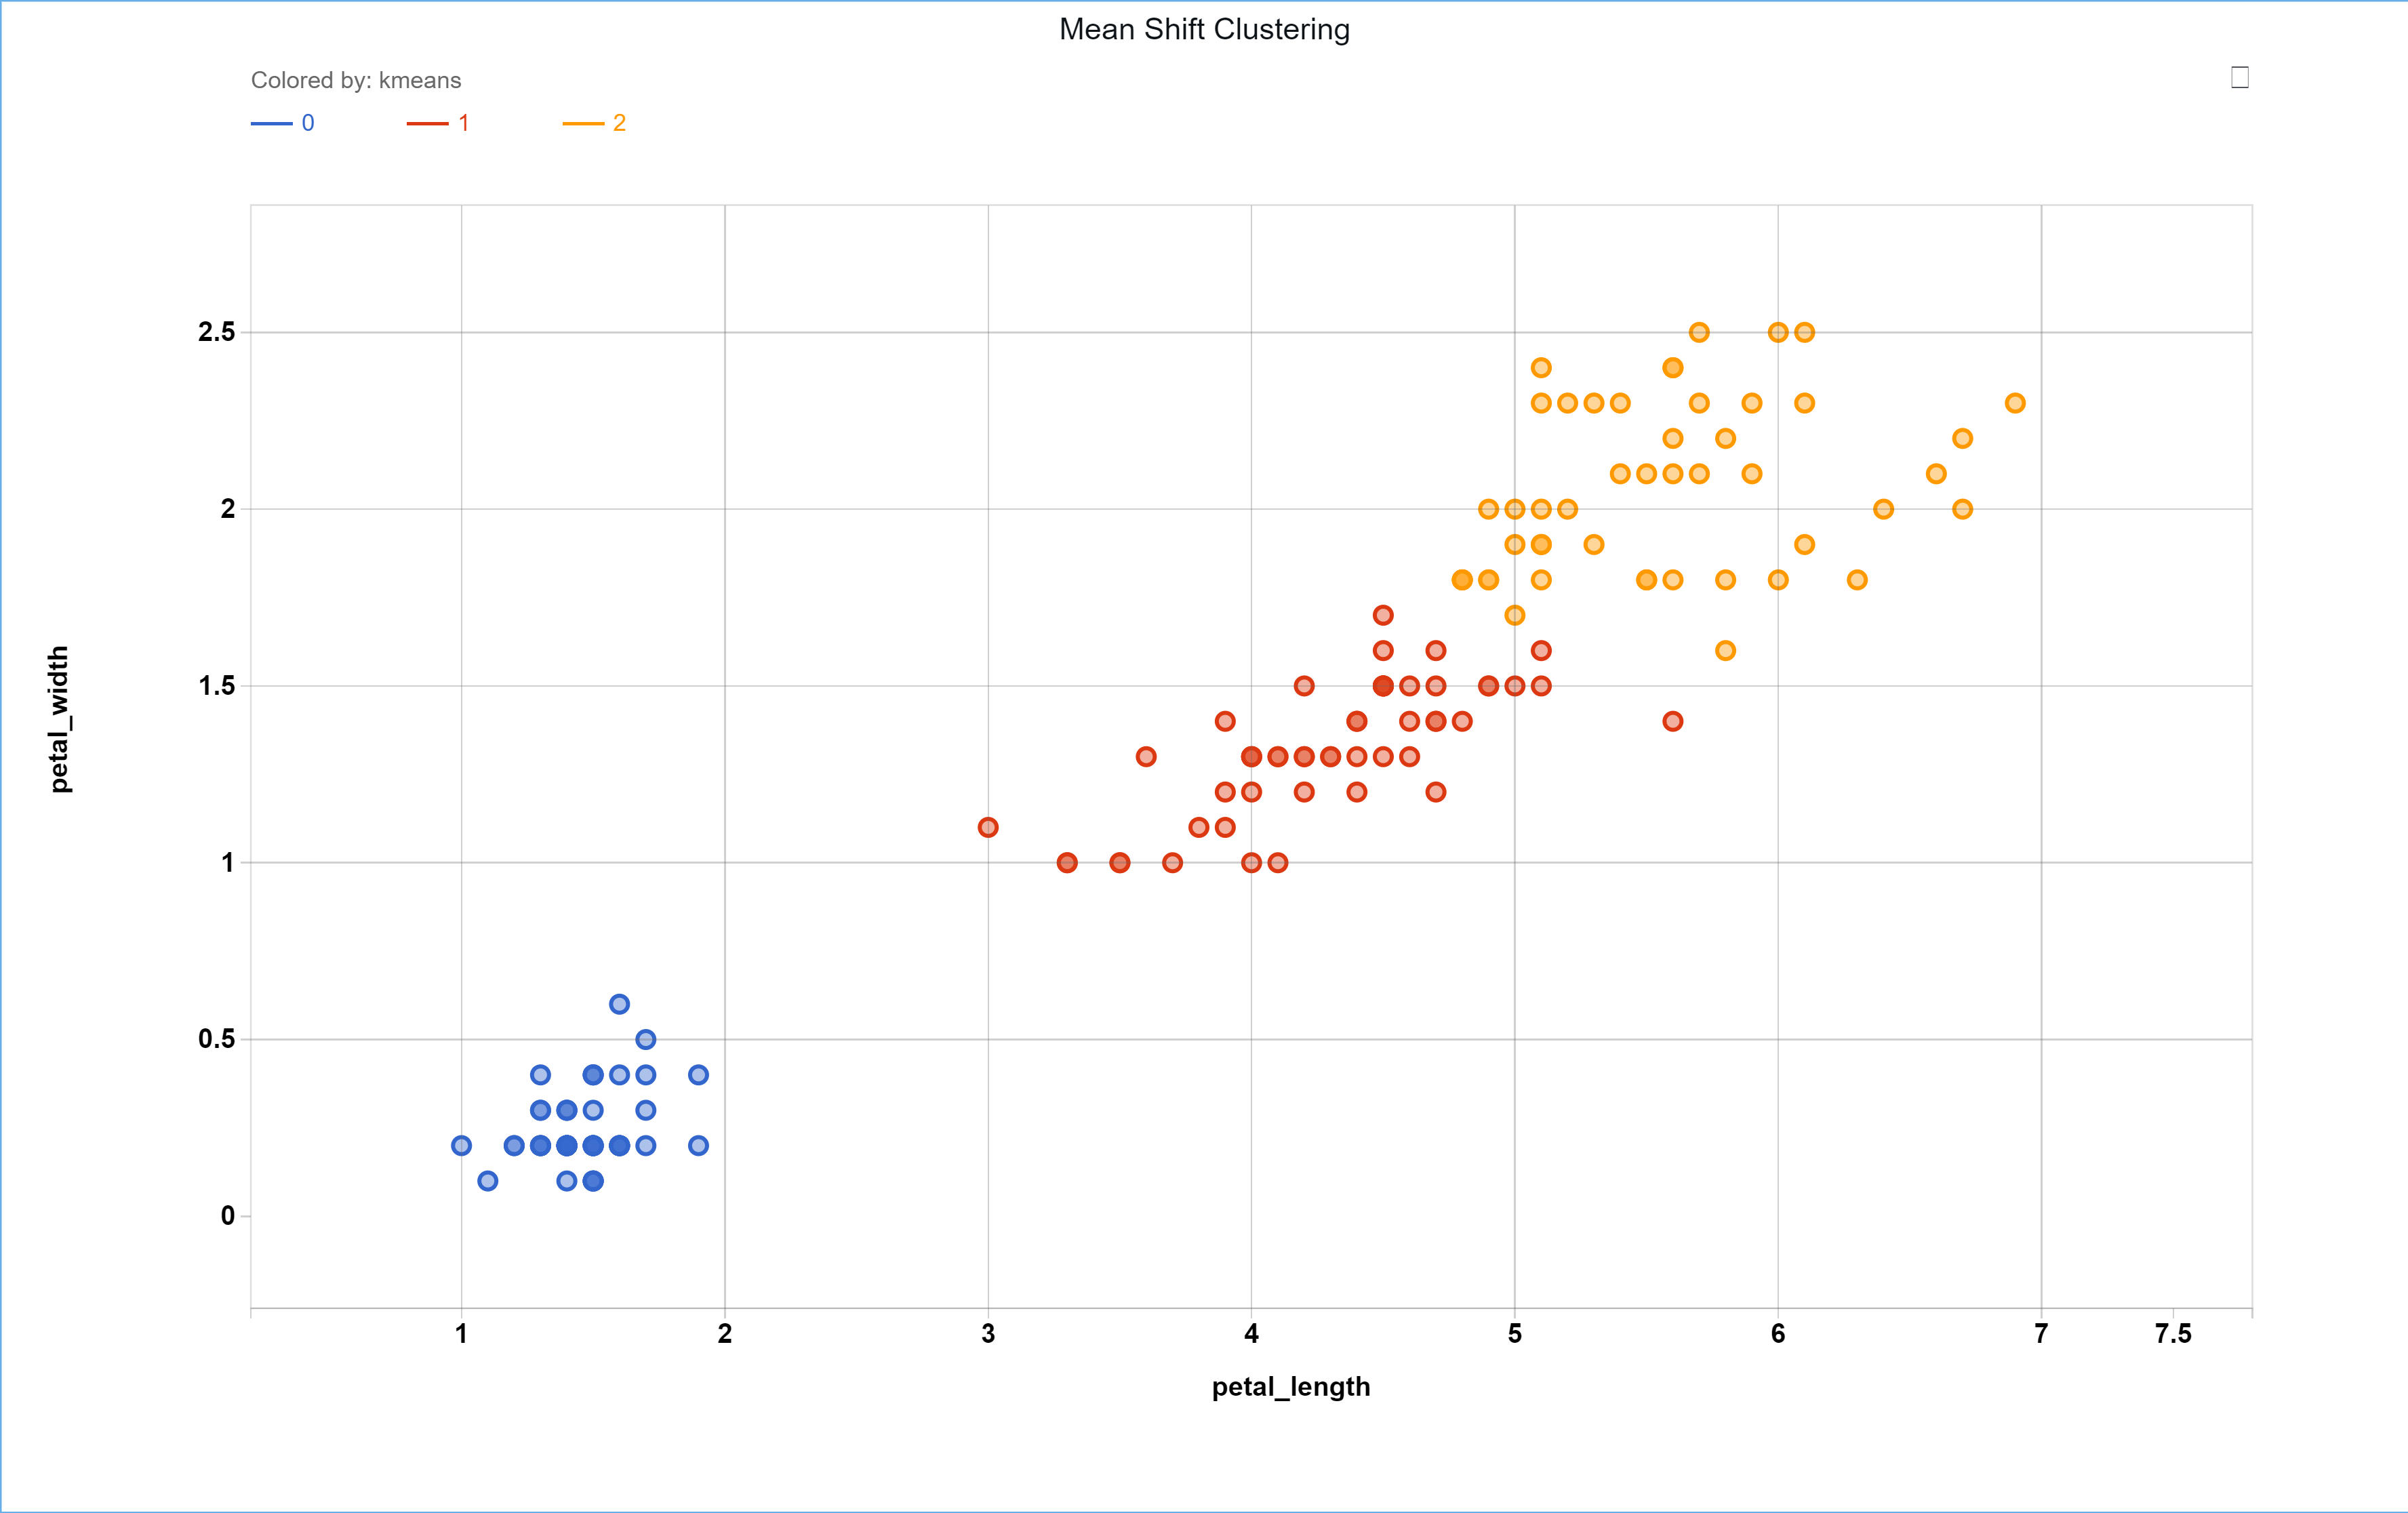
Now let’s use Mean Shift clustering to visually compare its results with the true category separation. A bandwidth should be specified. It is recommended that the data be normalized before performing the algorithm. This will narrow the required bandwidth to be between 0 and 1.
python bin/lucy.egg plugins ml_learn -input ./input_data.csv -output
./out.json -independents petal_length,petal_width -cluster meansshift
-bandwidth 0.5 -normalize standard
The resulting group assignments can be found in the ouput JSON at the location ‘payload’ -> ‘model_dict’ -> ‘labels_’. To visualize the results, the samples can be assigned the groups they have been given from the Mean Shift clustering in the same order the input data was given. The results can be seen below.
Additionally, the location of the centroids can be found in the output JSON at ‘payload’ -> ‘model_dict’ -> ‘cluster_centers_’. For this example the centroids are reflective of the normalized data and are found to be
cluster_centers_ = [
    [-1.3005214861029293,
     -1.2509378621062448],
    [0.37427641672771905,
     0.24821582279821572],
    [0.8873031279121748,
     1.0261947088710563]
]
Note
There ended up being 3 total clusters but this won’t always be the case. The number of clusters is based on the bandwidth. As bandwidth increases the number of clusters will decrease.
Classification
Supervised learning methods used to train models based on categorical target values.
WIP
Decision Tree Classifier
The trained model is a single Decision Tree whose target column is categorical.
Consider the Iris Dataset containing 3 different classes:
| sepal_length | sepal_width | petal_length | petal_width | class |
|---|---|---|---|---|
| 5.1 | 3.5 | 1.4 | 0.2 | 0 |
| 7 | 3.2 | 4.27 | 1.4 | 1 |
| 6.3 | 3.3 | 6 | 2.5 | 2 |
| … |
There are a few requirements when performing classification using a Decision
Tree. We need -input data, to specify a -clabel, and use -classify
dtree. Additionally, we will need to specify a mfile if we want to save
the resulting model to use later in PREDICT. If we want some readable
information about the model, we can specify -output to save an informative
Lucy-Response in a JSON format.
Putting everything together we have the commend:
python bin/lucy.egg plugins ml_learn -input iris.csv -output
dtree_LucyResponse.json -mfile iris_dtree.pkl -classify dtree -clabel class
The structure of the Tree is saved at:
{
    ...
    "payload": {
        ...
        "model_dict": {
            ...
            tree_data: {
                ...
            }
       }
    }
}
Something to consider for a future version:
Something. Let's assume that the data has undergone a train-test-split. *Perhaps this will be a feature in the future, but for now it will need to be done manually or done with `Sklearn's train_test_splitRandom Forest
WIP
Regression
Supervised learning methods used to train models based on numerical target values.
Linear Regression
python bin/lucy.egg plugins ml_learn -input ./input.csv -output./out.json
-regression linear -label target
Lasso Regression
python bin/lucy.egg plugins ml_learn -input ./input.csv -output./out.json
-regression lasso -label target
Ridge Regression
python bin/lucy.egg plugins ml_learn -input ./input.csv -output./out.json
-regression Ridge -label target
Support Vector Regression
python bin/lucy.egg plugins ml_learn -input ./input.csv -output./out.json
-regression svr -label target
Decision Tree Regression
python bin/lucy.egg plugins ml_learn -input ./input.csv -output./out.json
-regression dtreereg -label target
Random Forest Regression
python bin/lucy.egg plugins ml_learn -input ./input.csv -output./out.json
-regression rfr -label target
Gaussian Process Regression
python bin/lucy.egg plugins ml_learn -input ./input.csv -output./out.json
-regression gpr -label target
Logistic Regression
should be moved to classification