11. Data Tables
Data tables in d3VIEW provide an effective and efficient way of reviewing and tracking metadata. Data tables can be found all over the platform but are most prominently used with the Simulations, Physical Tests, Databases and Simlytiks applications.
Features
- Clean and simple interface to visualize tabular data
- Easy selecting and Grouping
- Highly customizable
- Export easily
What Will Be Covered
- Basic Features
- Advanced Features
- Tables in Simlytiks
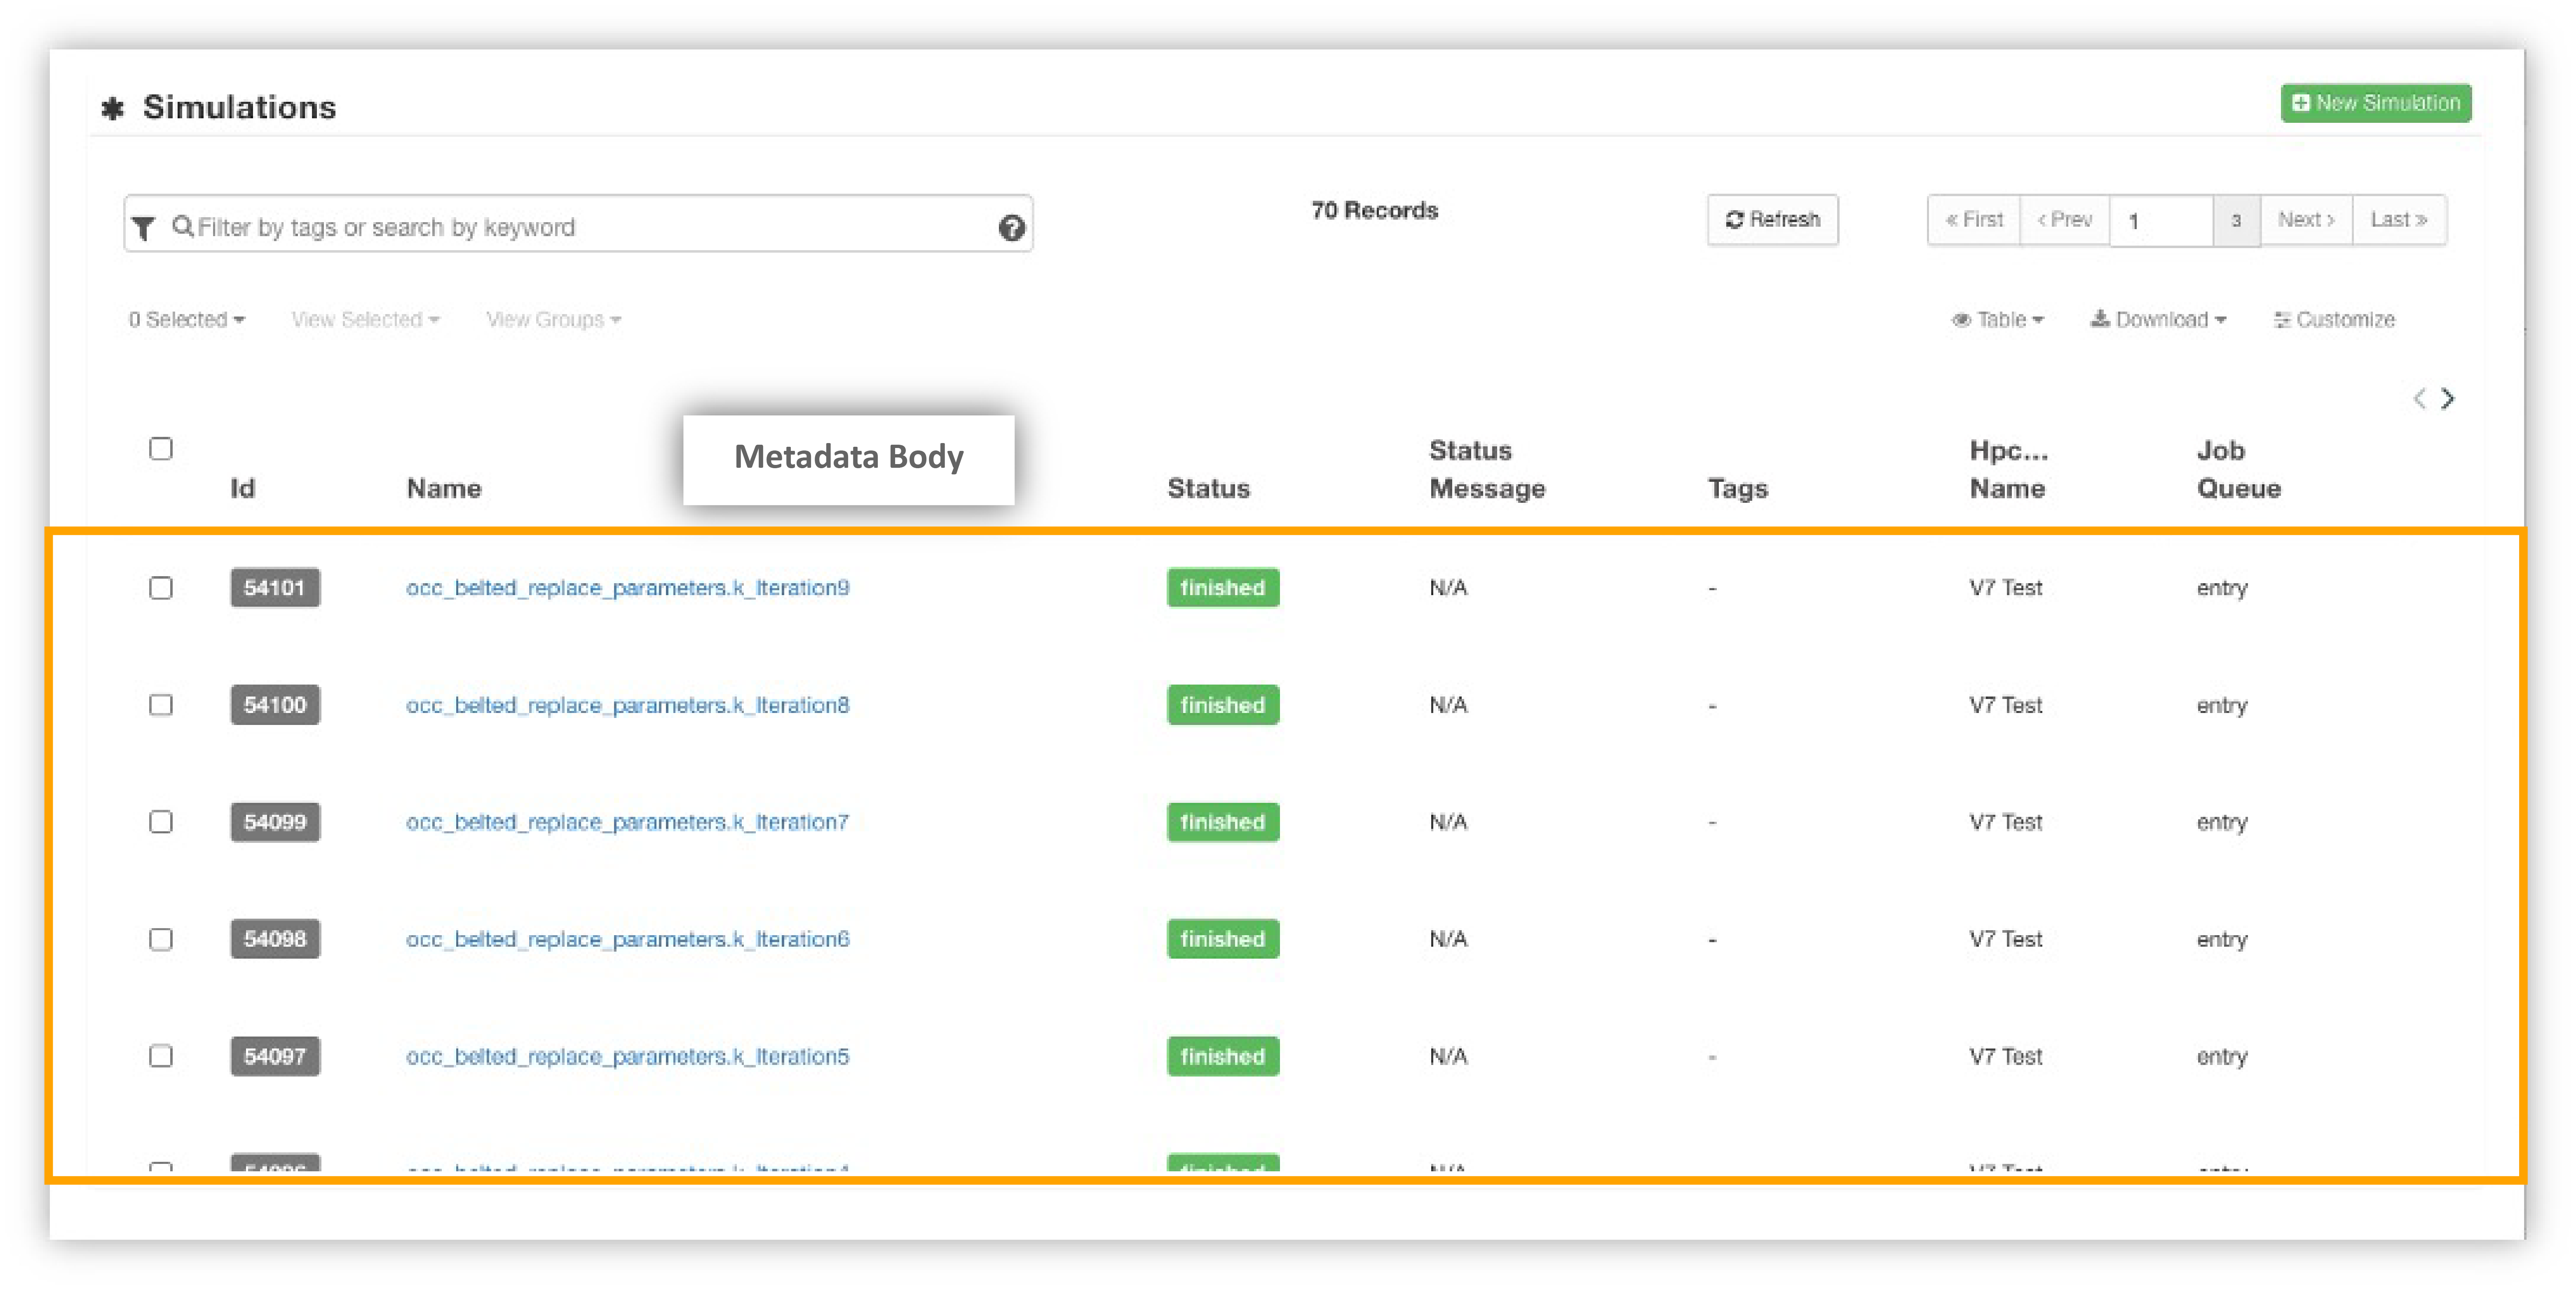
11.1. Basic Features
Data tables structure and sort data into columns and rows. Use the mouse to scroll through to the columns not currently visible on the page.
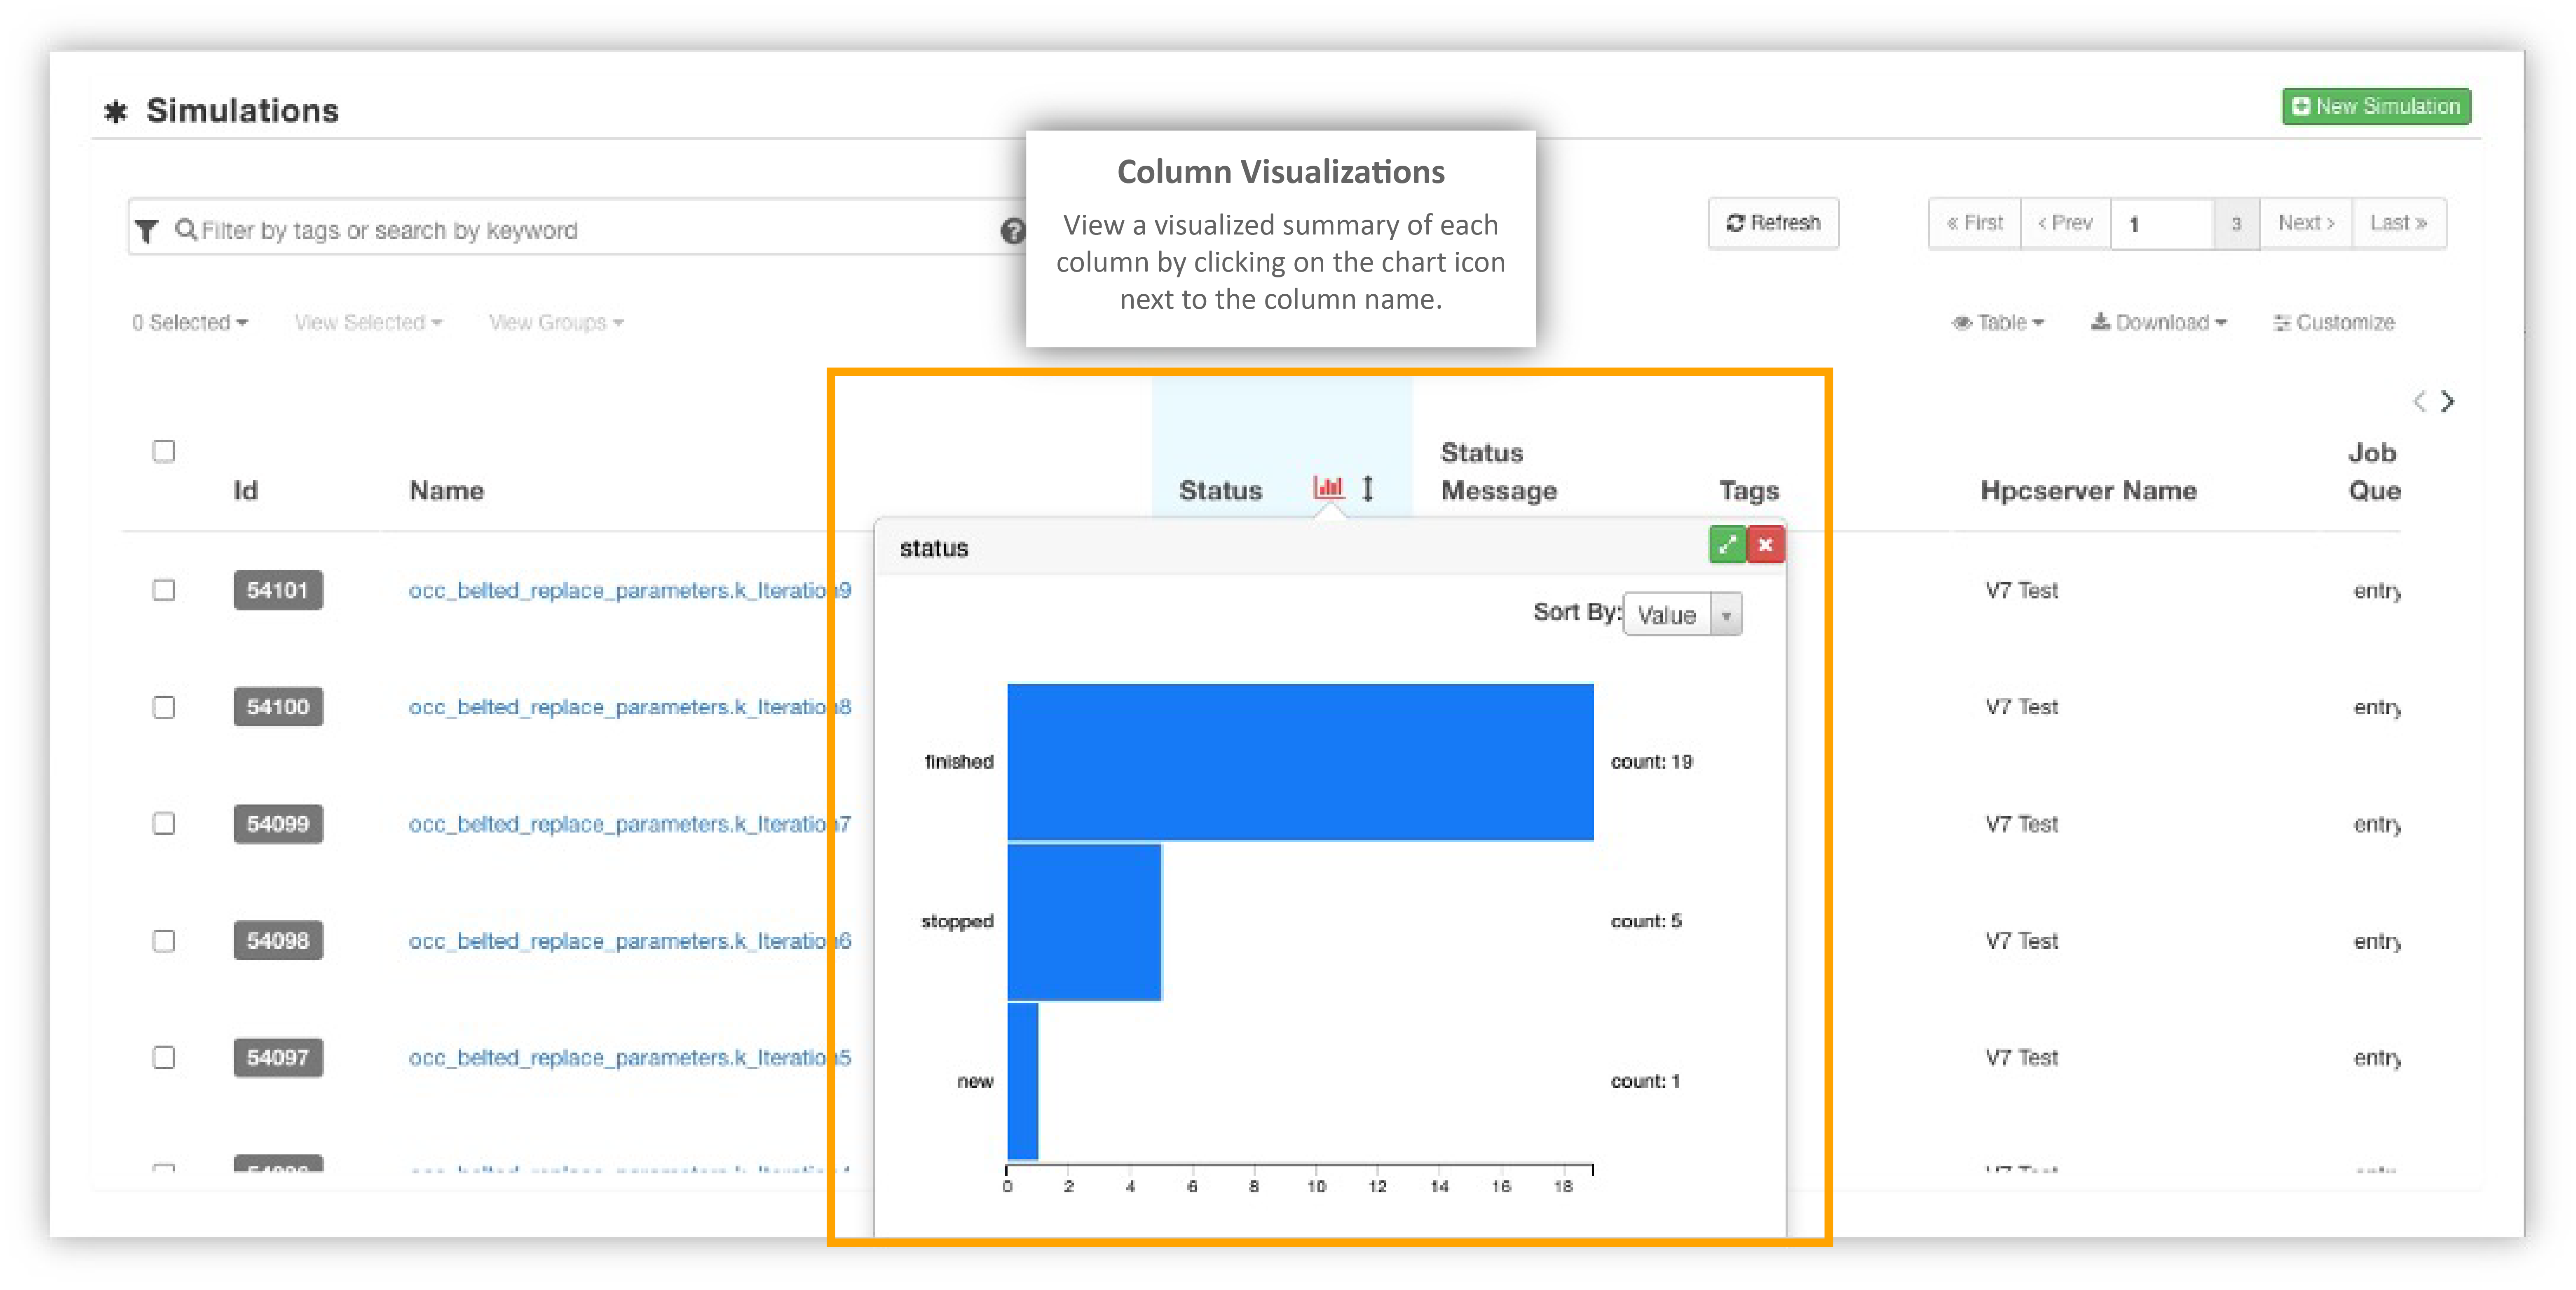
Viewing Data
View a visualized summary of each column by clicking on the chart icon next to the column name.
Column Visualizations
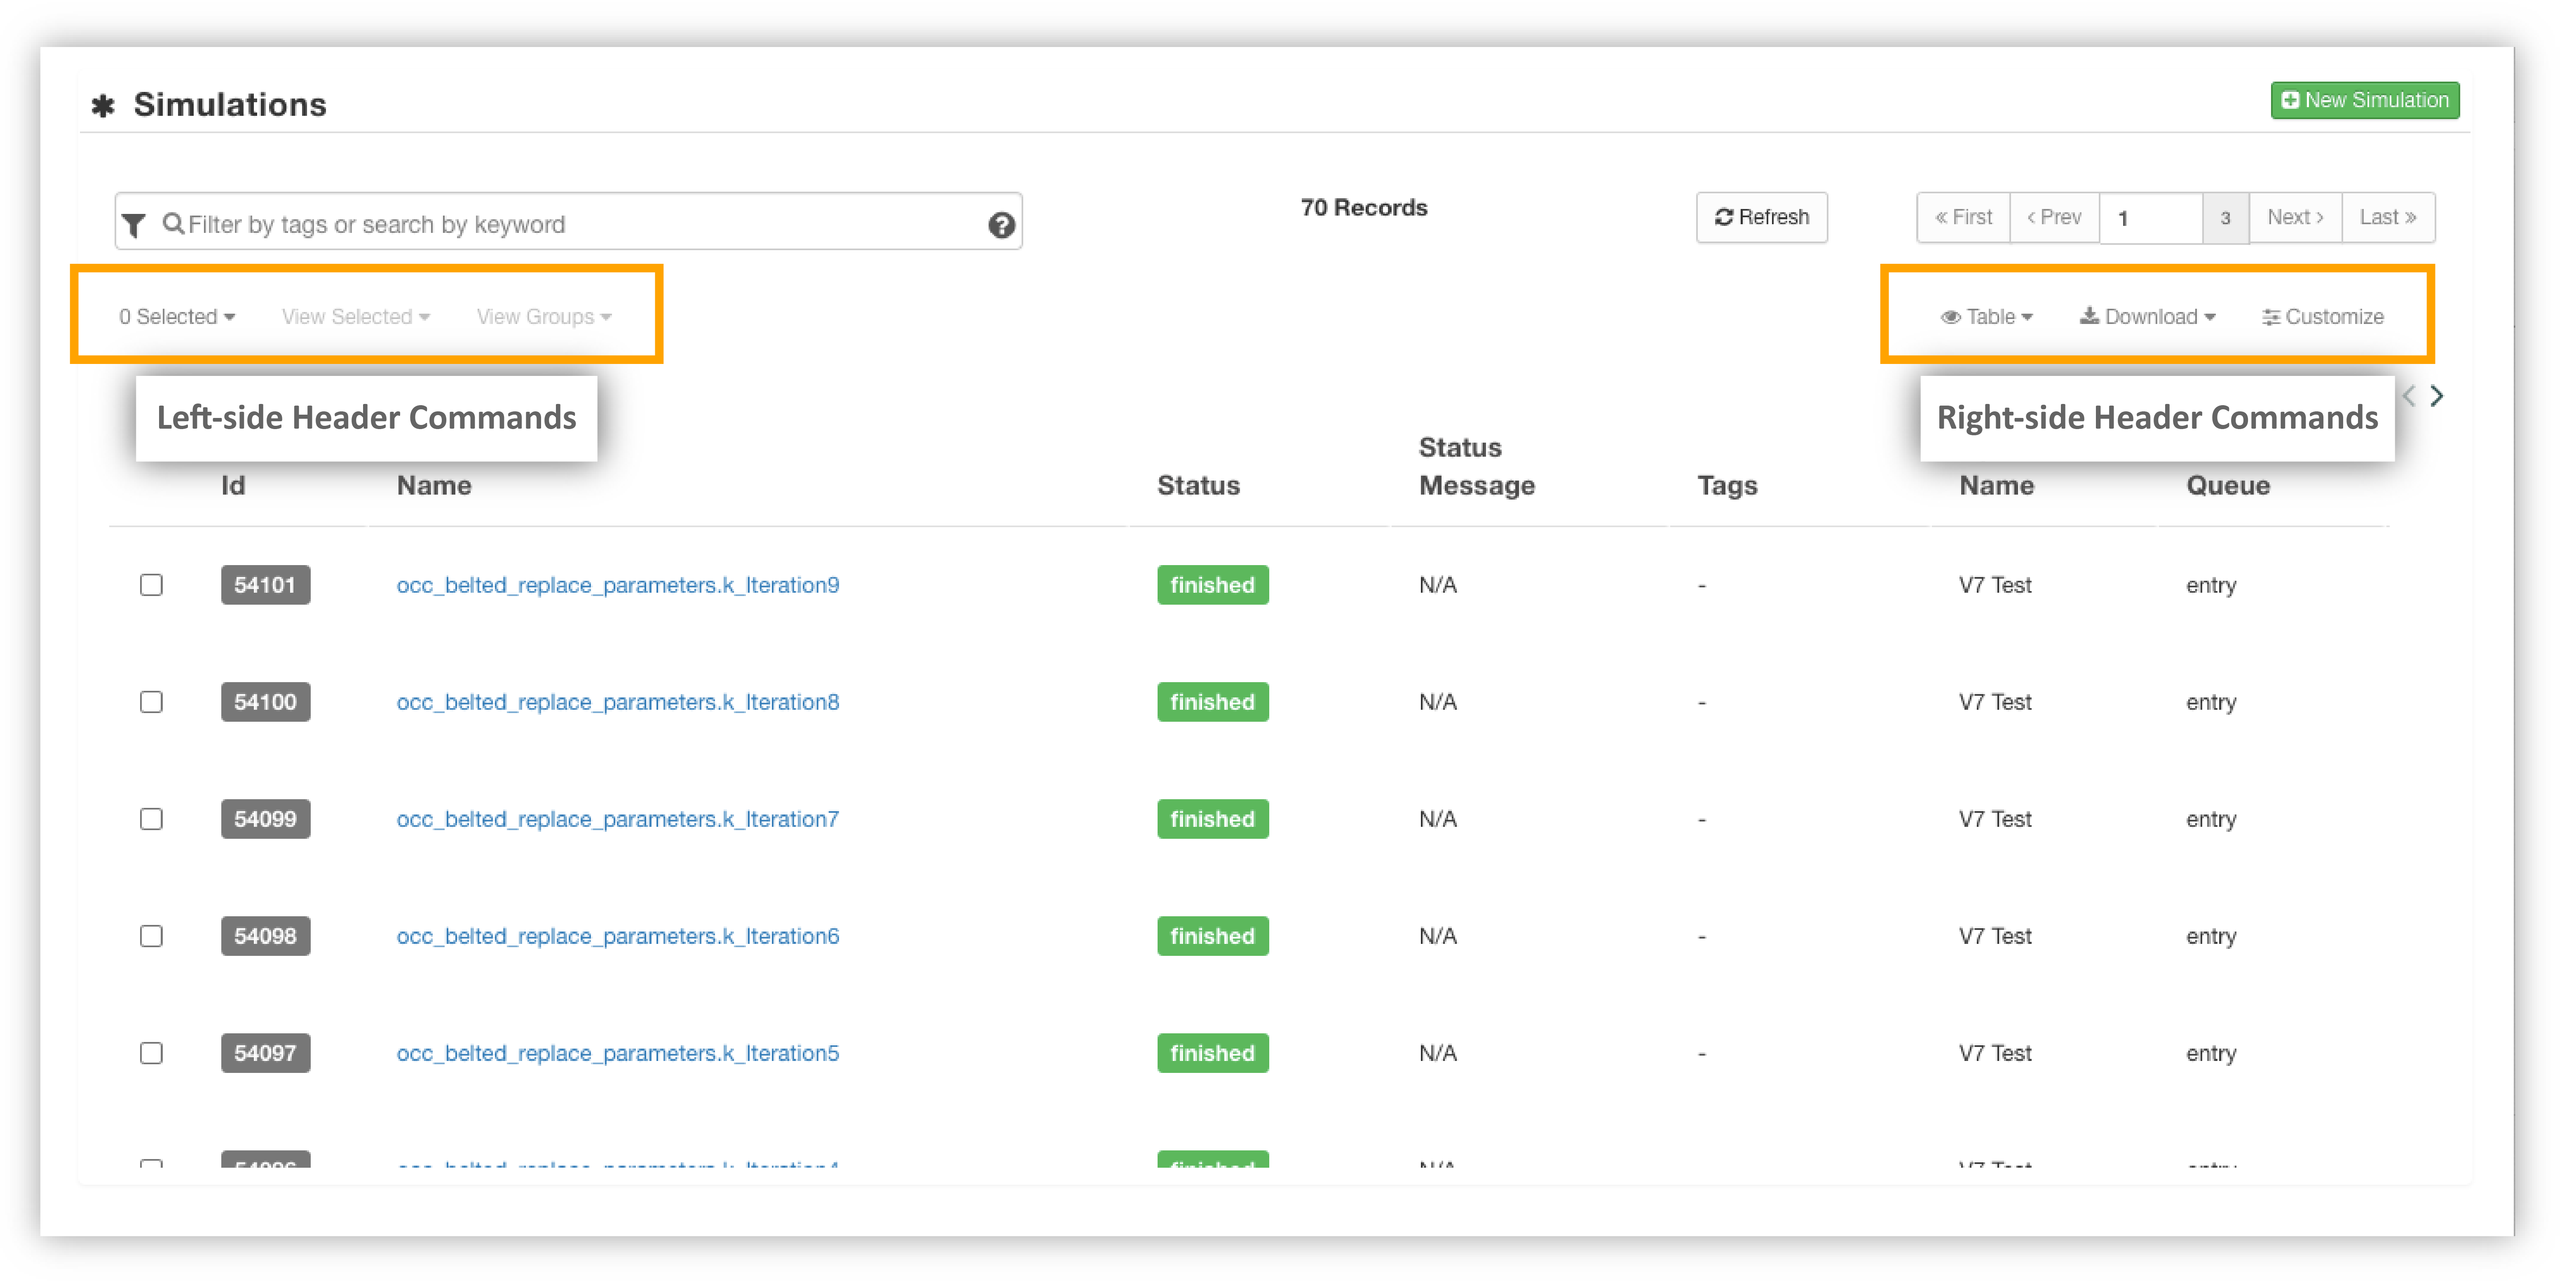
Data table commands can be found on the right and left sides of the table header.
Header Options
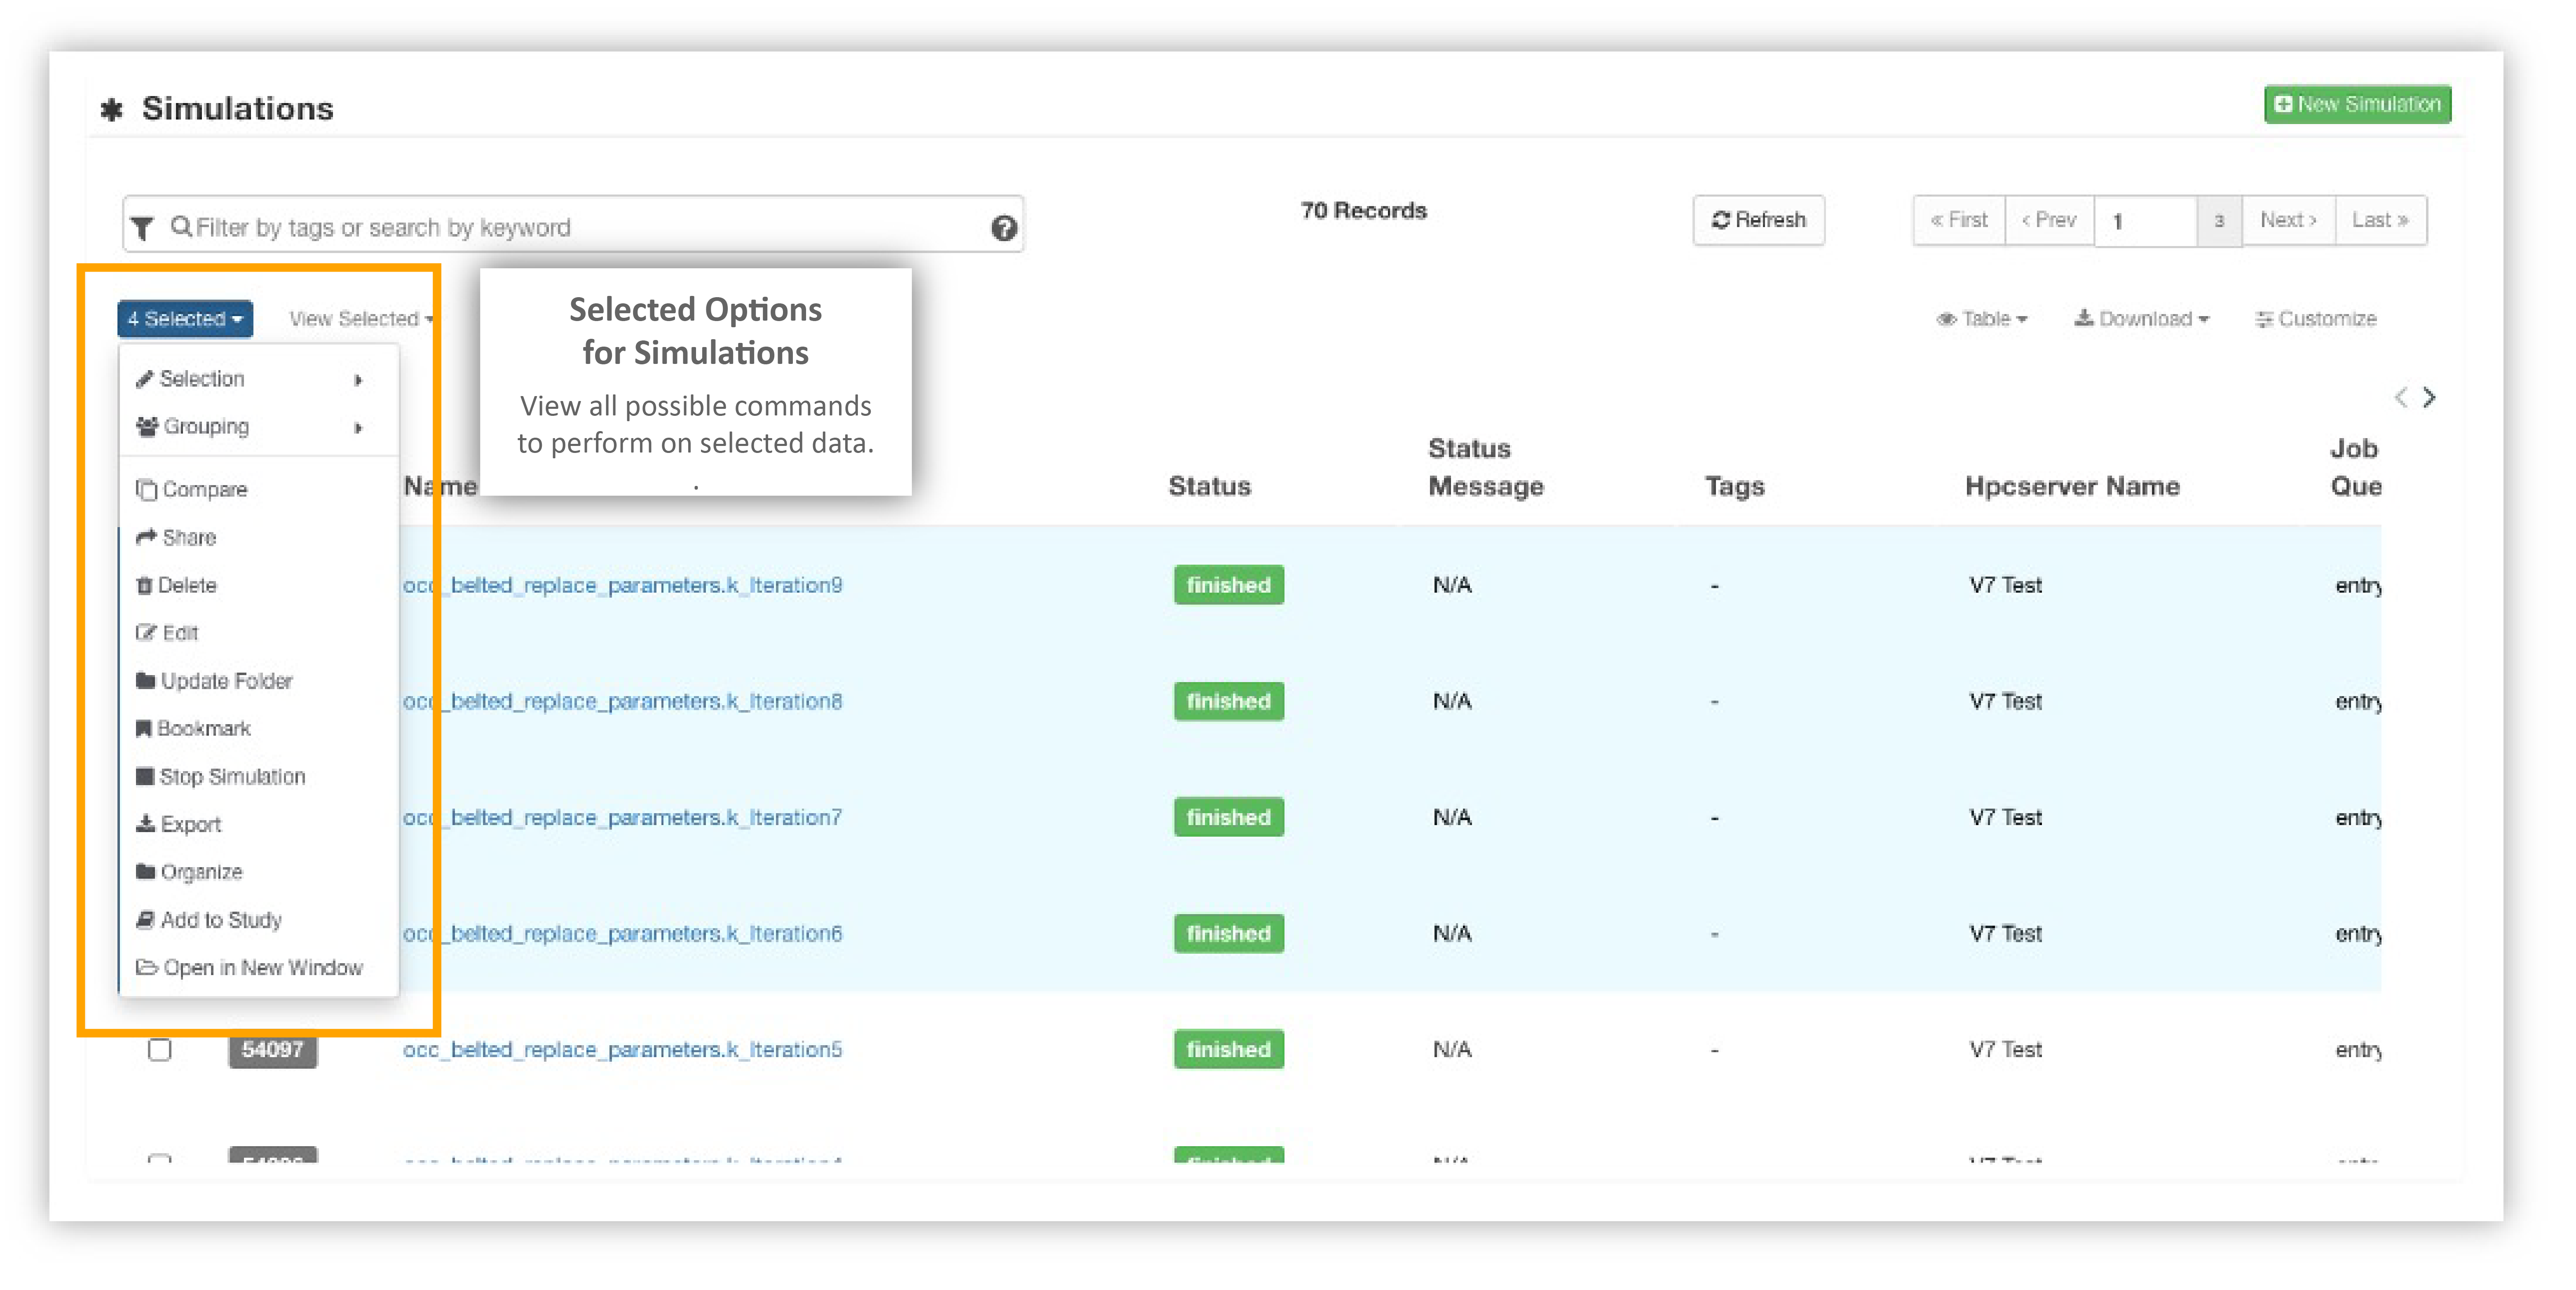
Selecting Data
Select data by clicking on the check marks next to a row or drag-selecting multiple rows using the mouse. Once selected, find commands to perform on the data under the selected drop-down menu on the left-side header. Depending on where we are viewing a table on the platform, there will be different options under this drop-down menu. The following image presents the options for Simulations
Selected Options Simulations
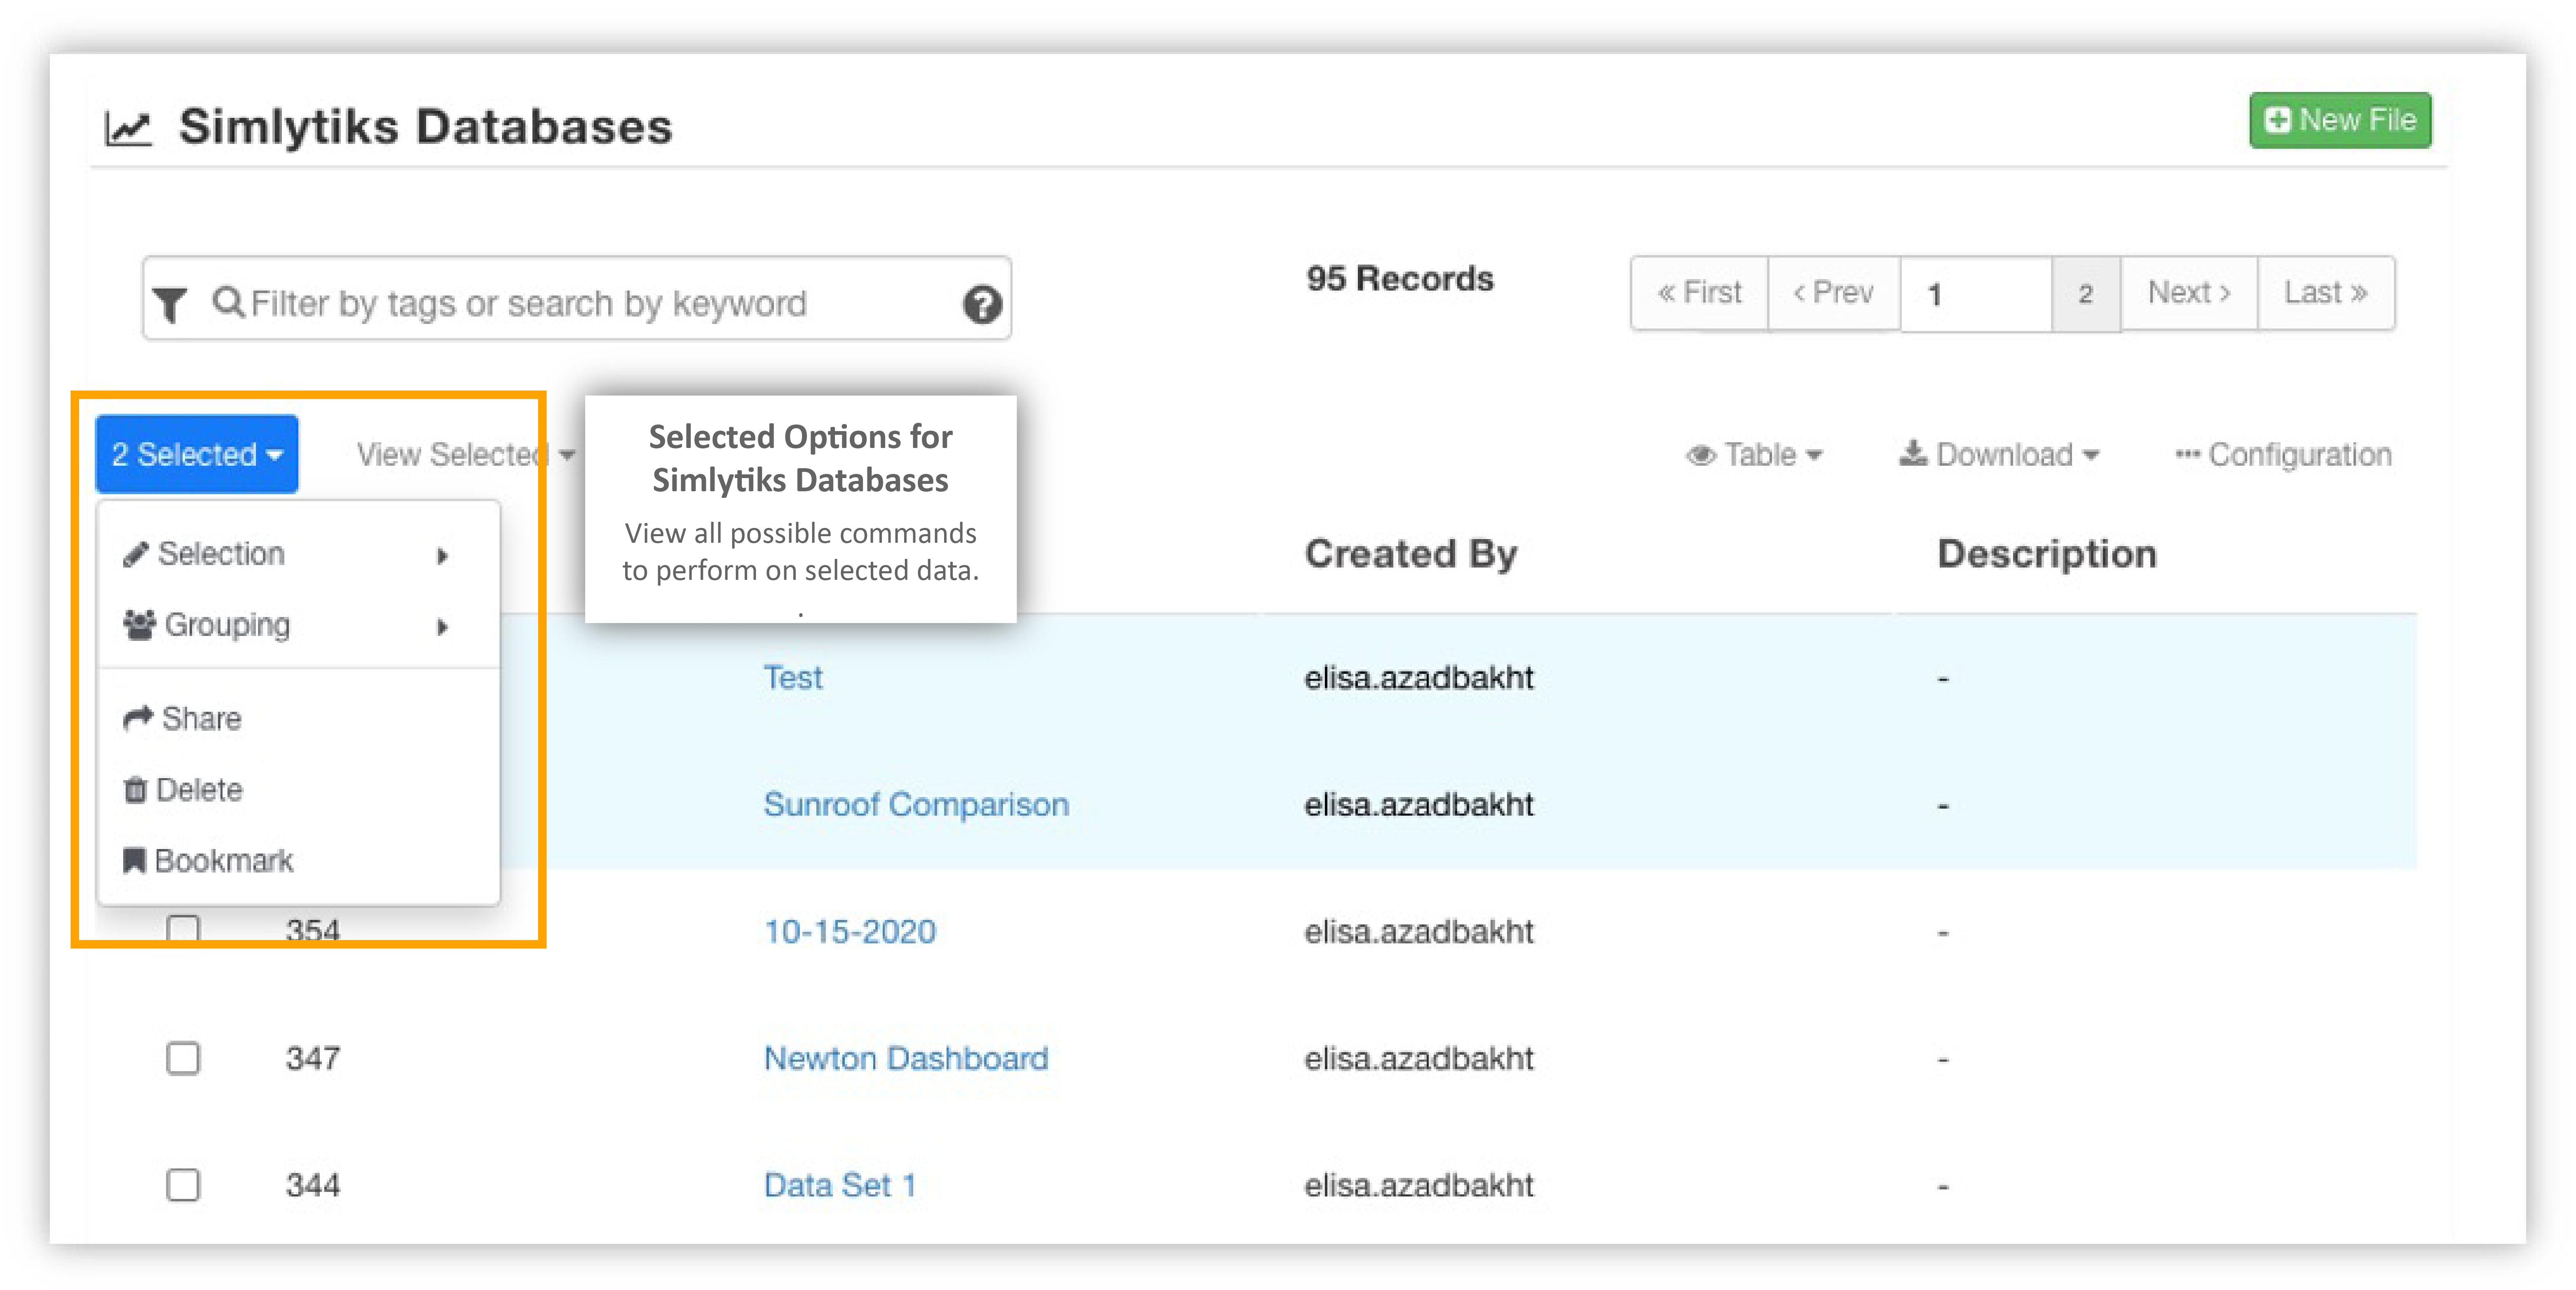
These options are for the Simlytiks Databases table.
Selected Options Simlytiks Databases
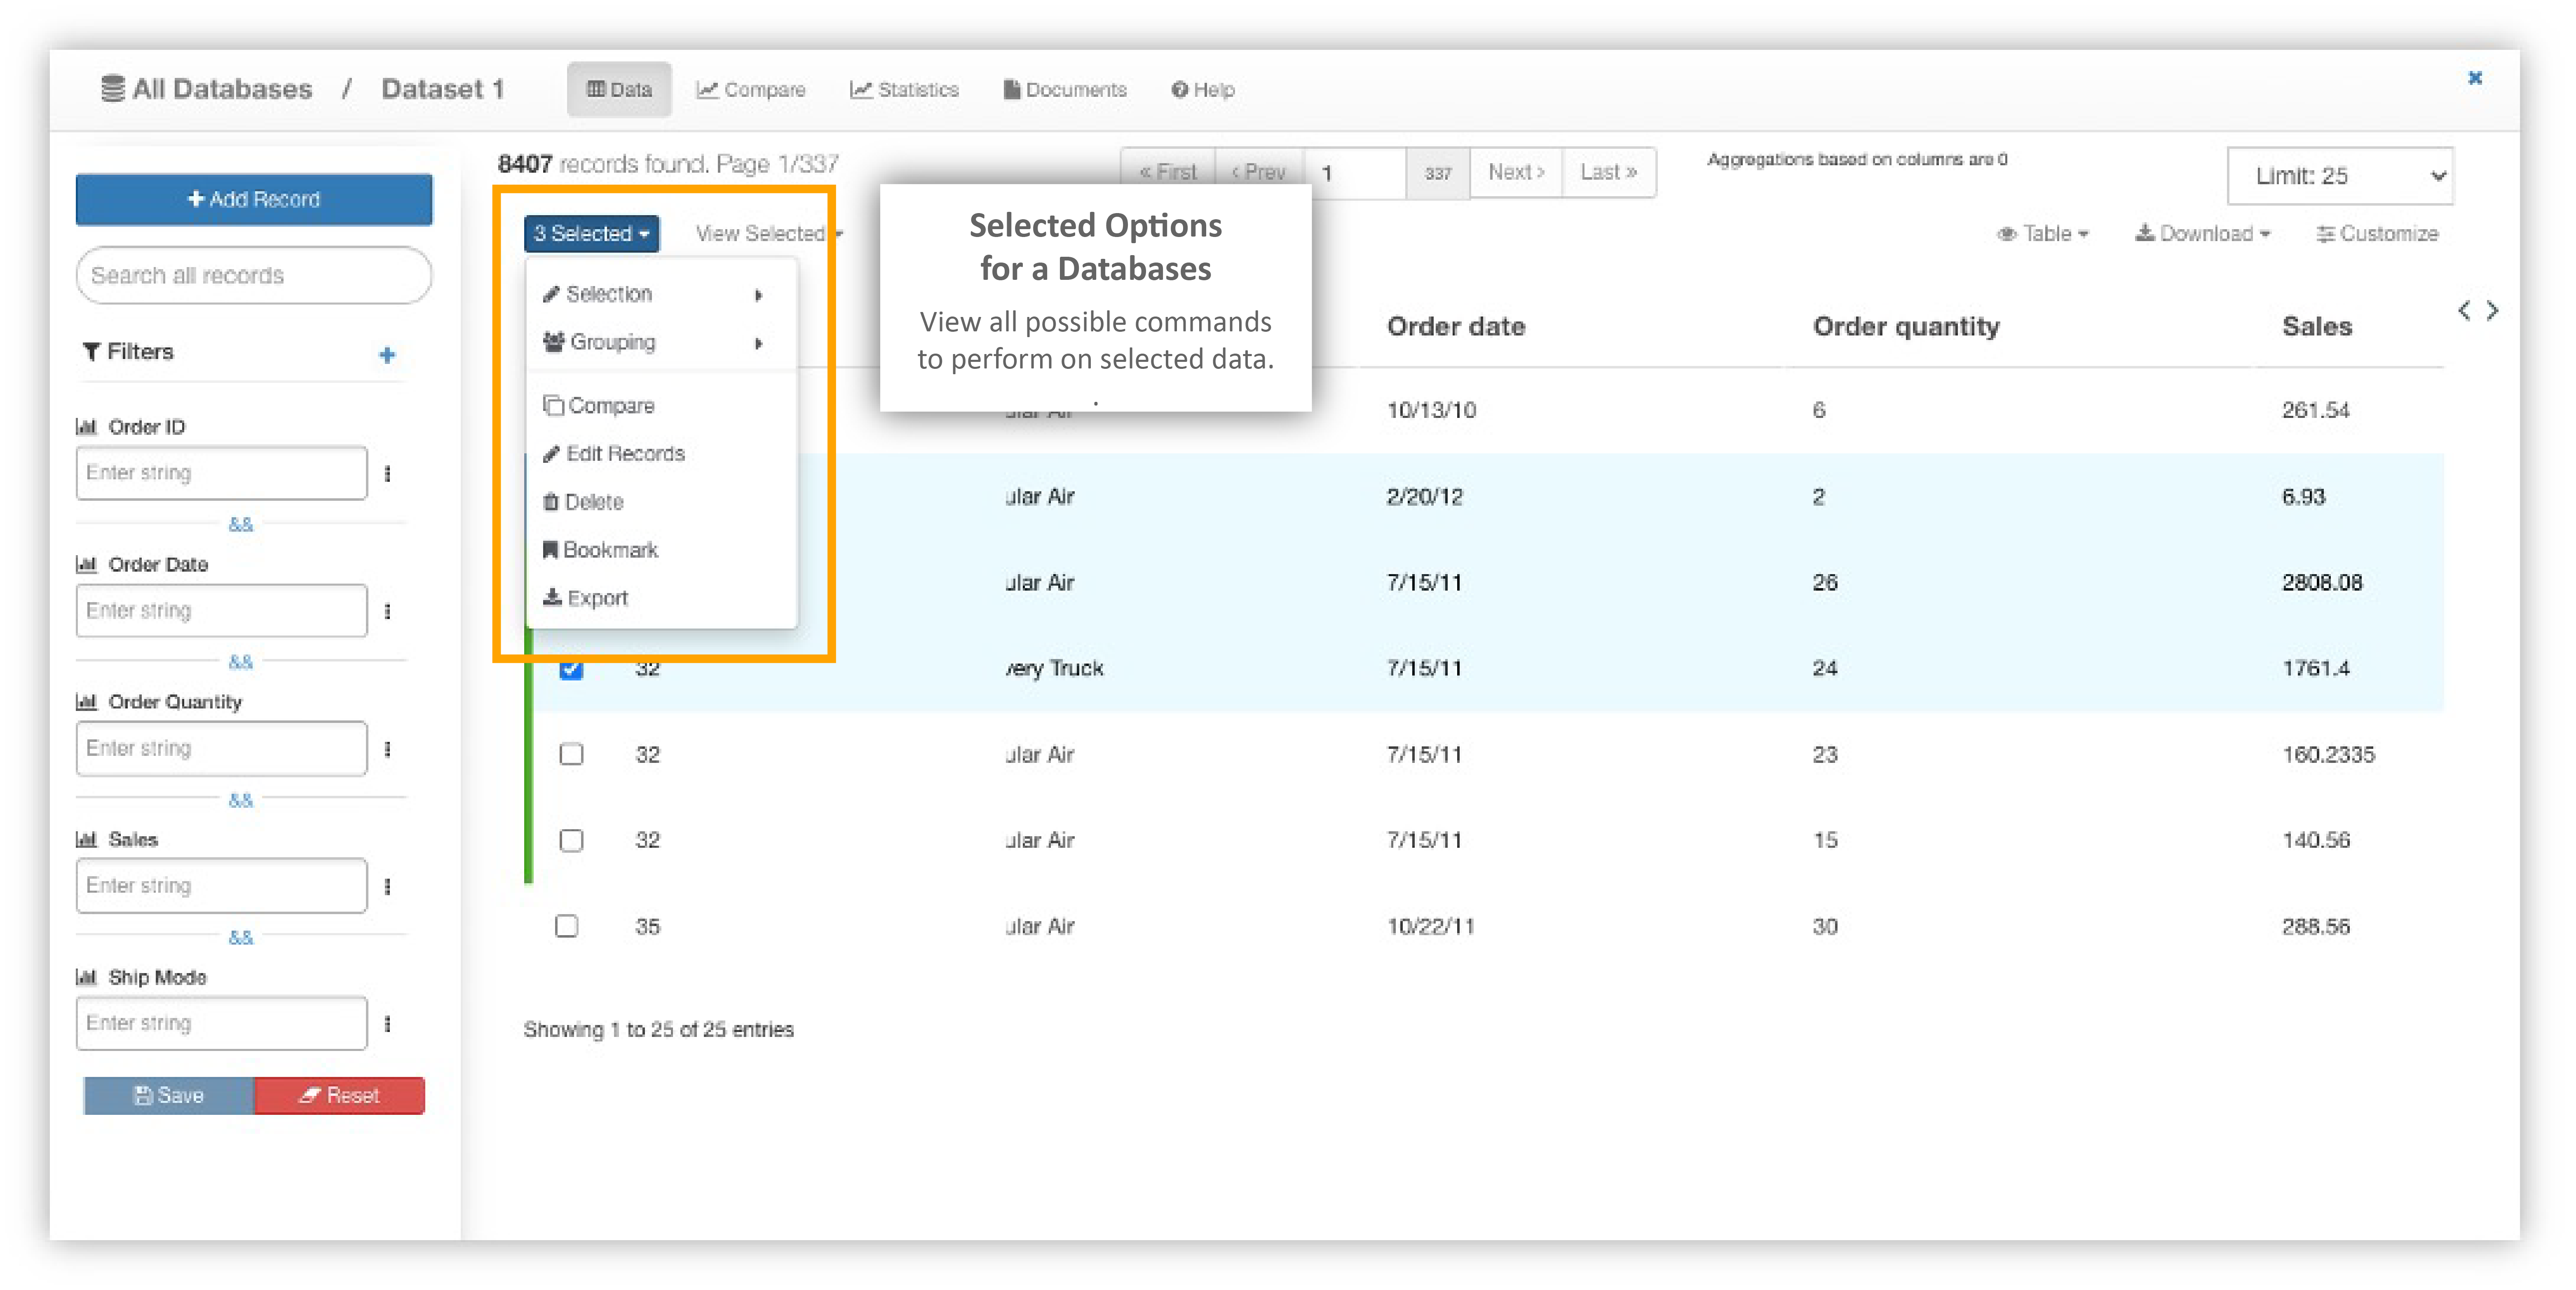
Here are the Selection options for a table of records in Databases.
Selected Options Database Records
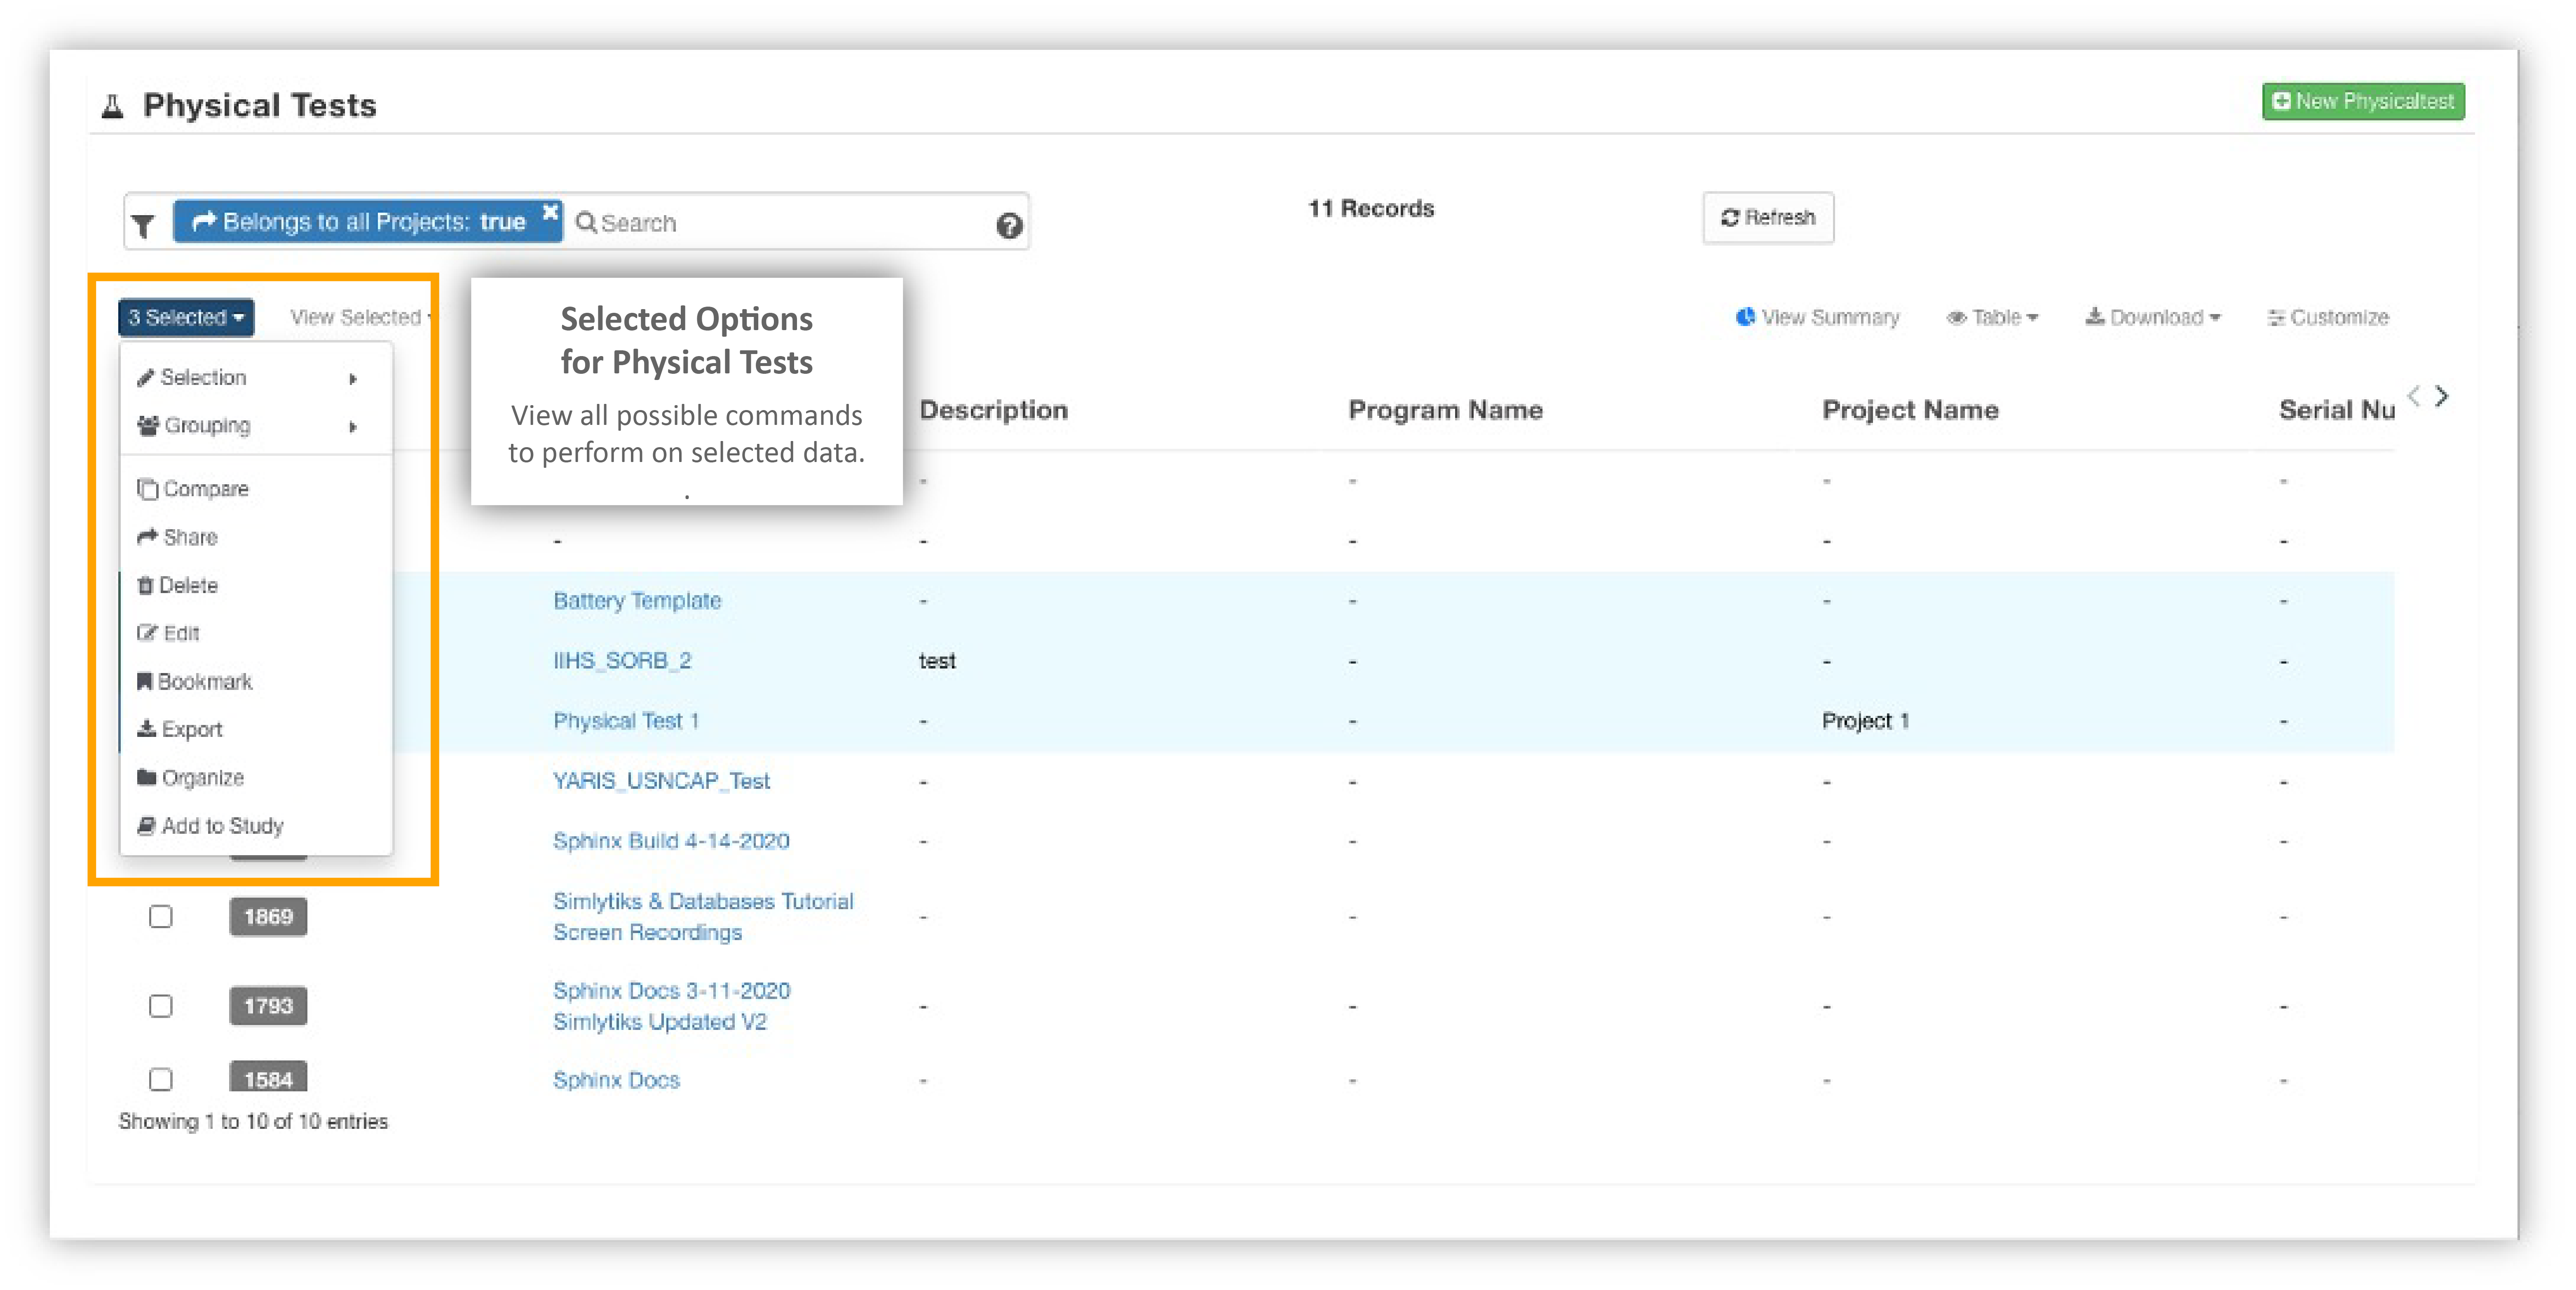
These are the options for Physical Tests, which are much like the ones for Simulations.
Selected Options Physical Tests
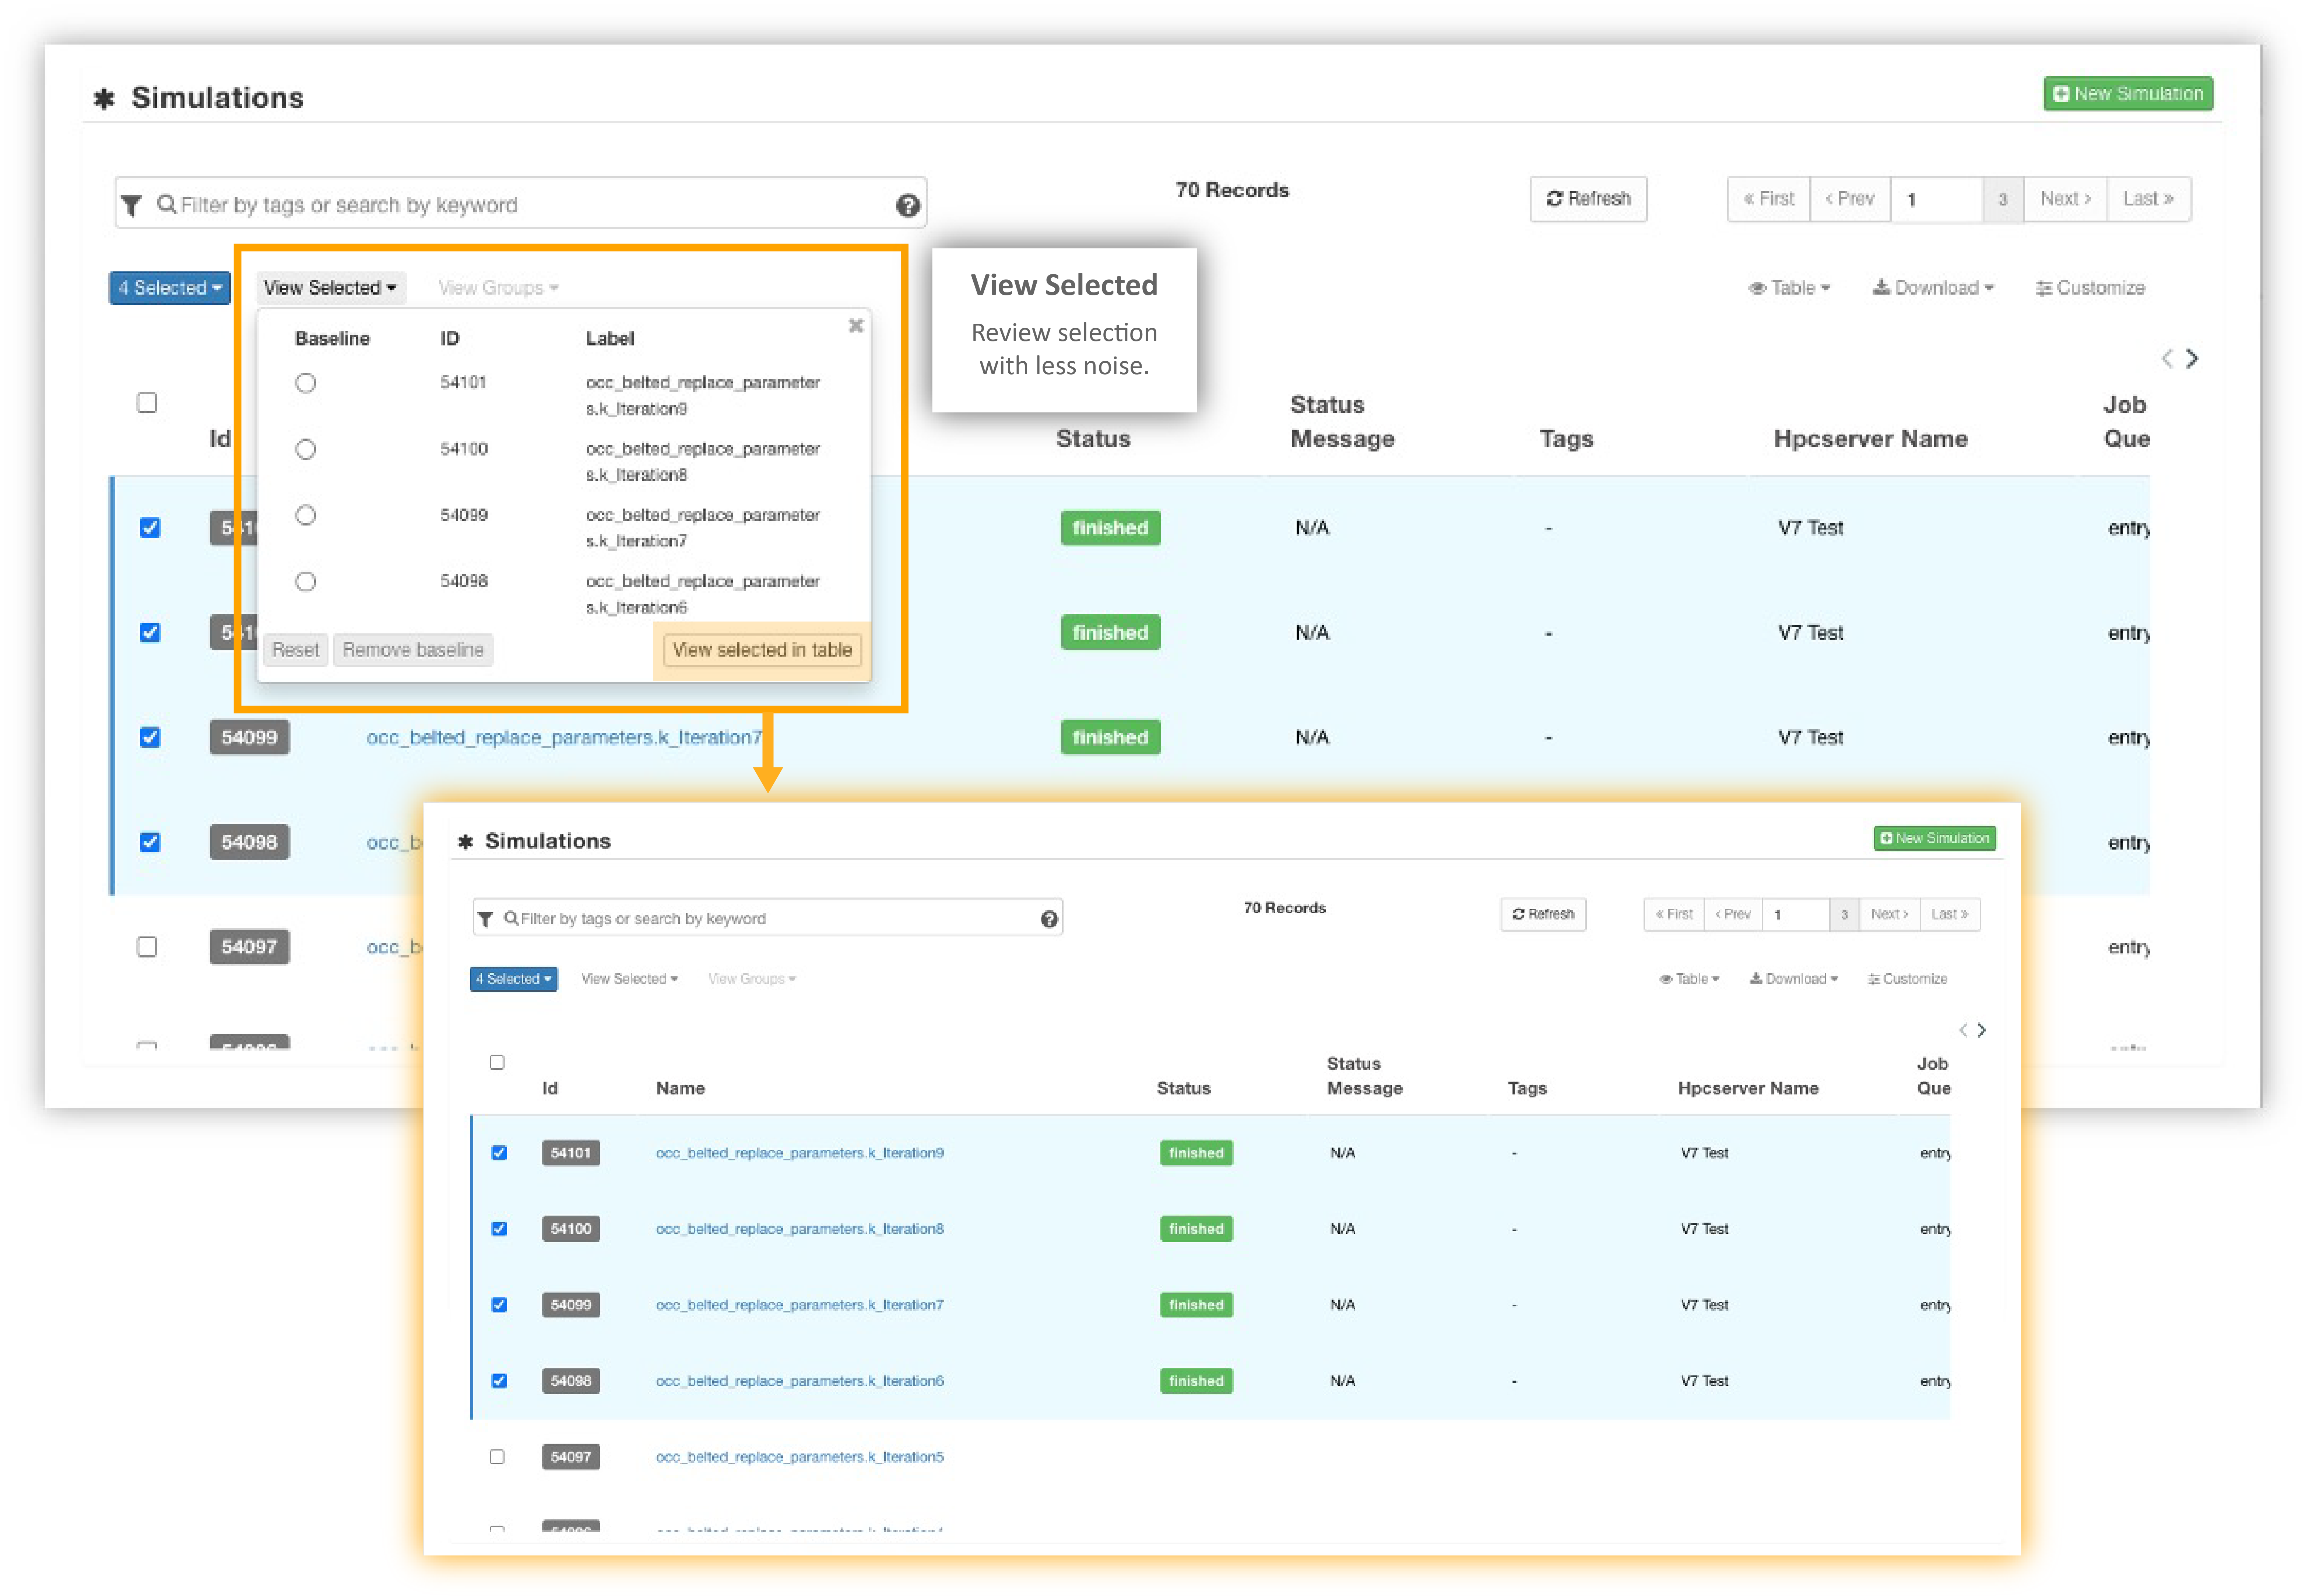
The next drop-down, View Selected, allows us to review our selection with less noise.
View Selected
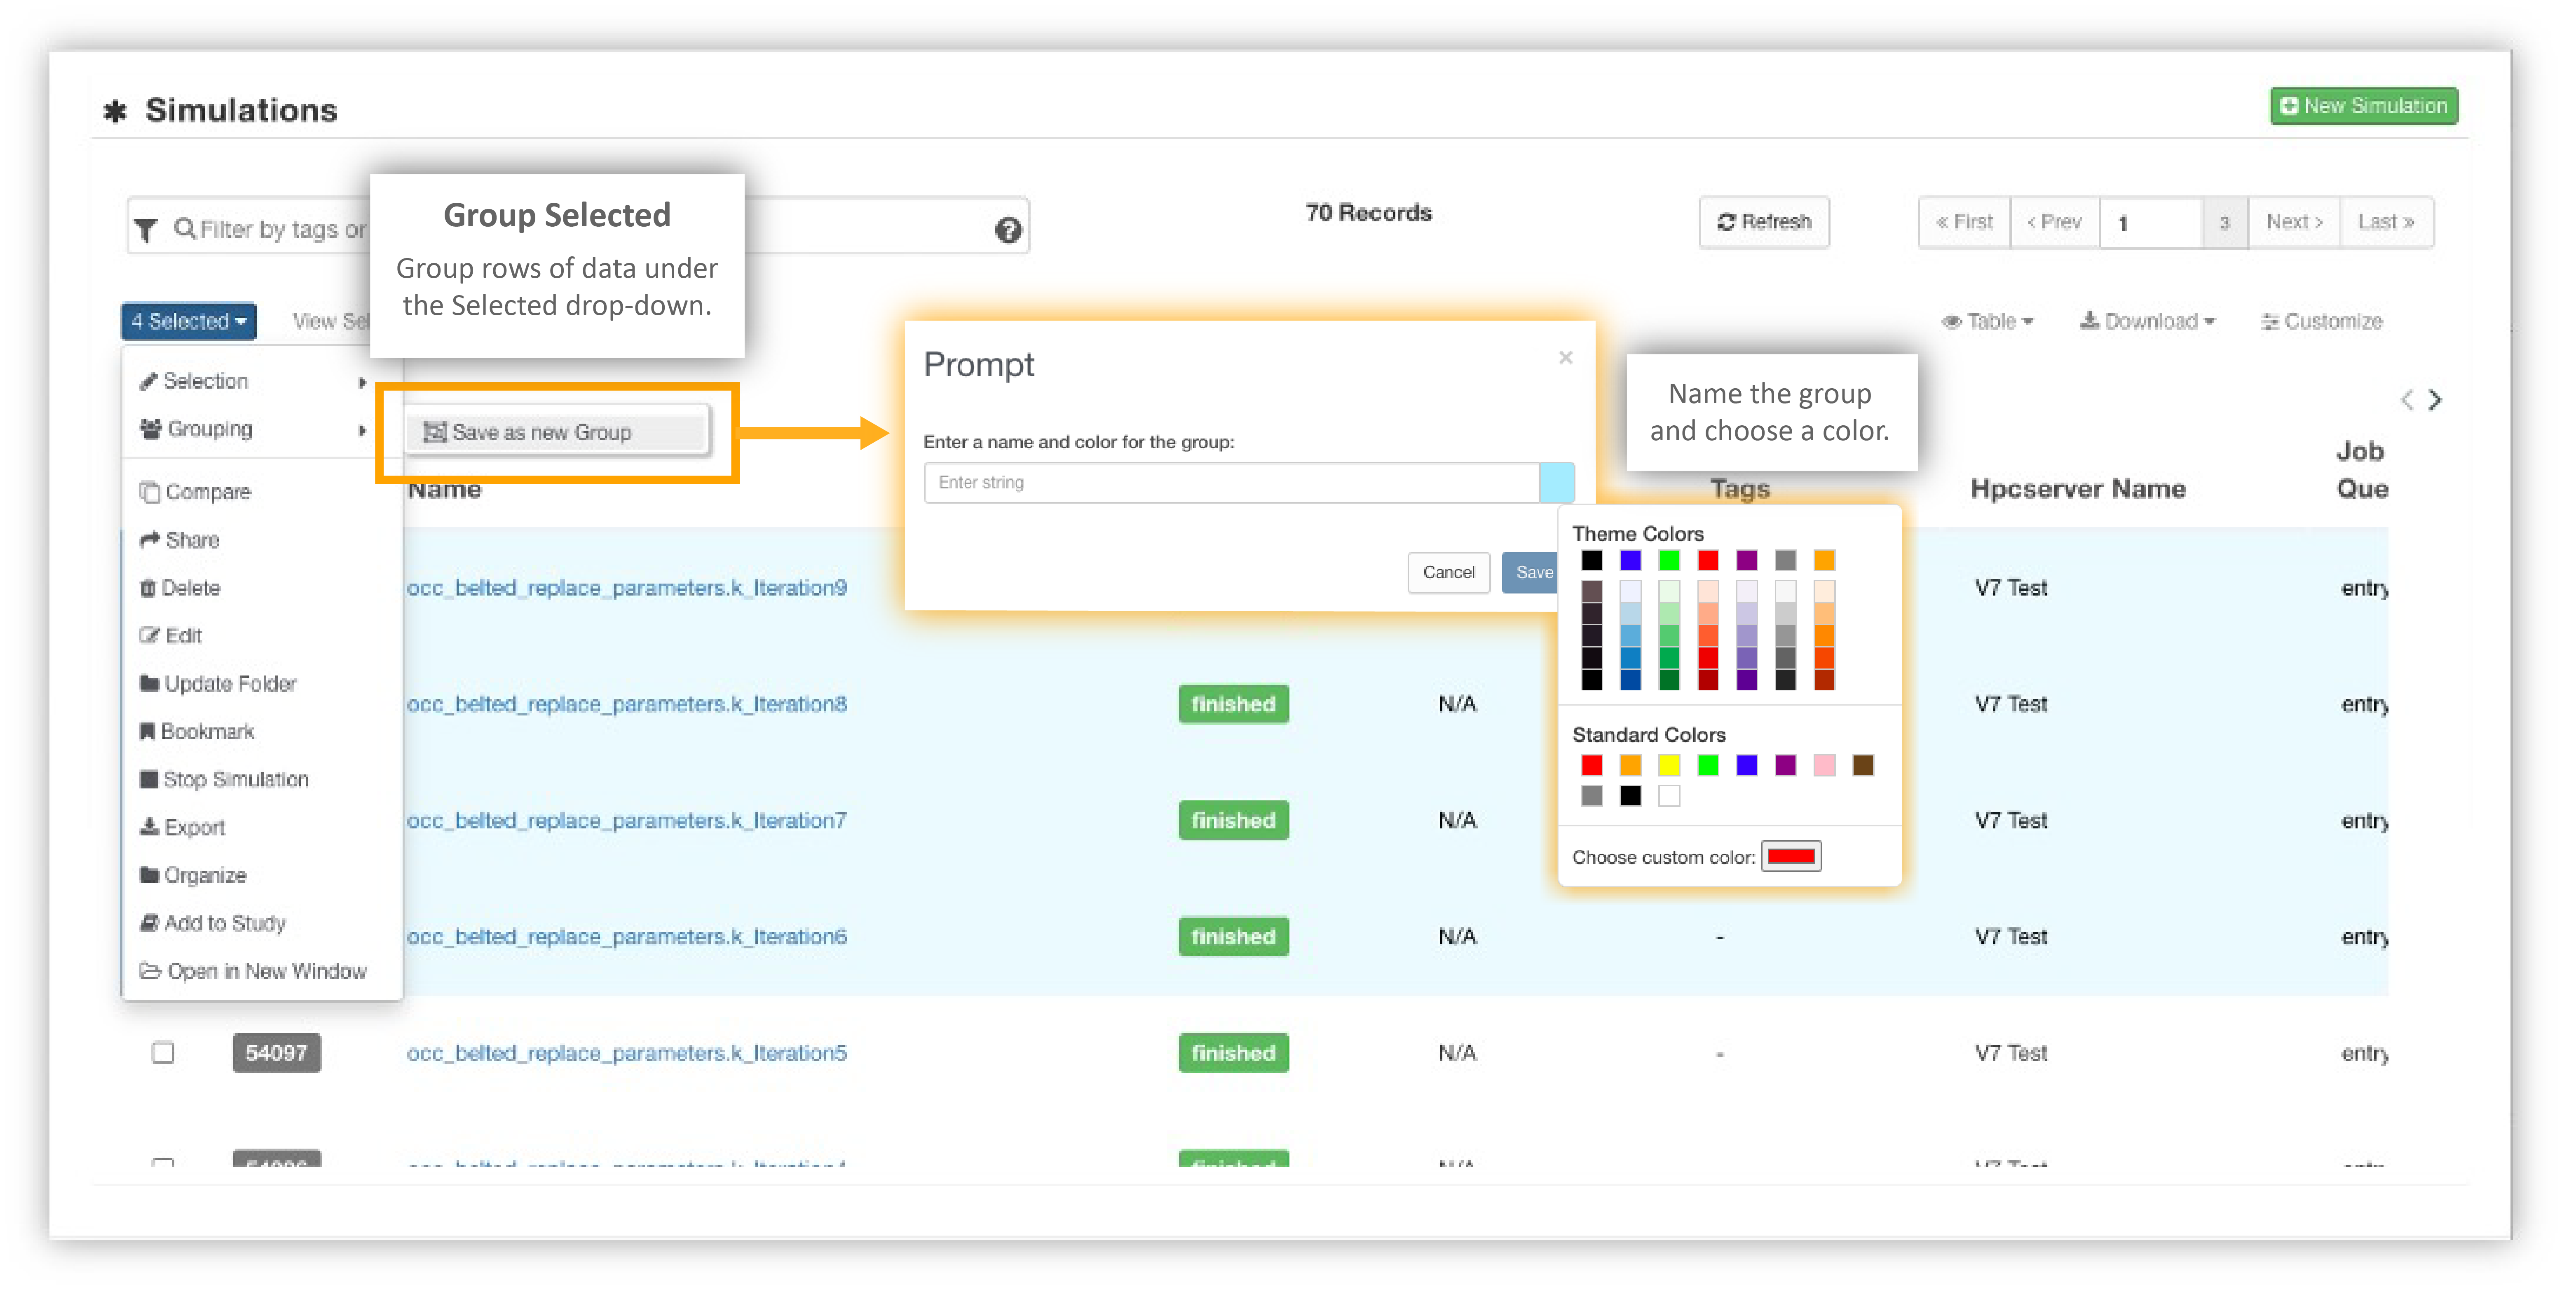
Grouping Data
Group rows of data under the Selected drop-down options. Click on the “Save as new Group” option. In the prompt window, name the group and give it a color.
Create a Group
View the group color at the beginning of a row. The third drop-down from the left is for viewing groups. Click on the group(s) we wish to view then on “View Groups” to filter out the rest of the table data.
View Groups
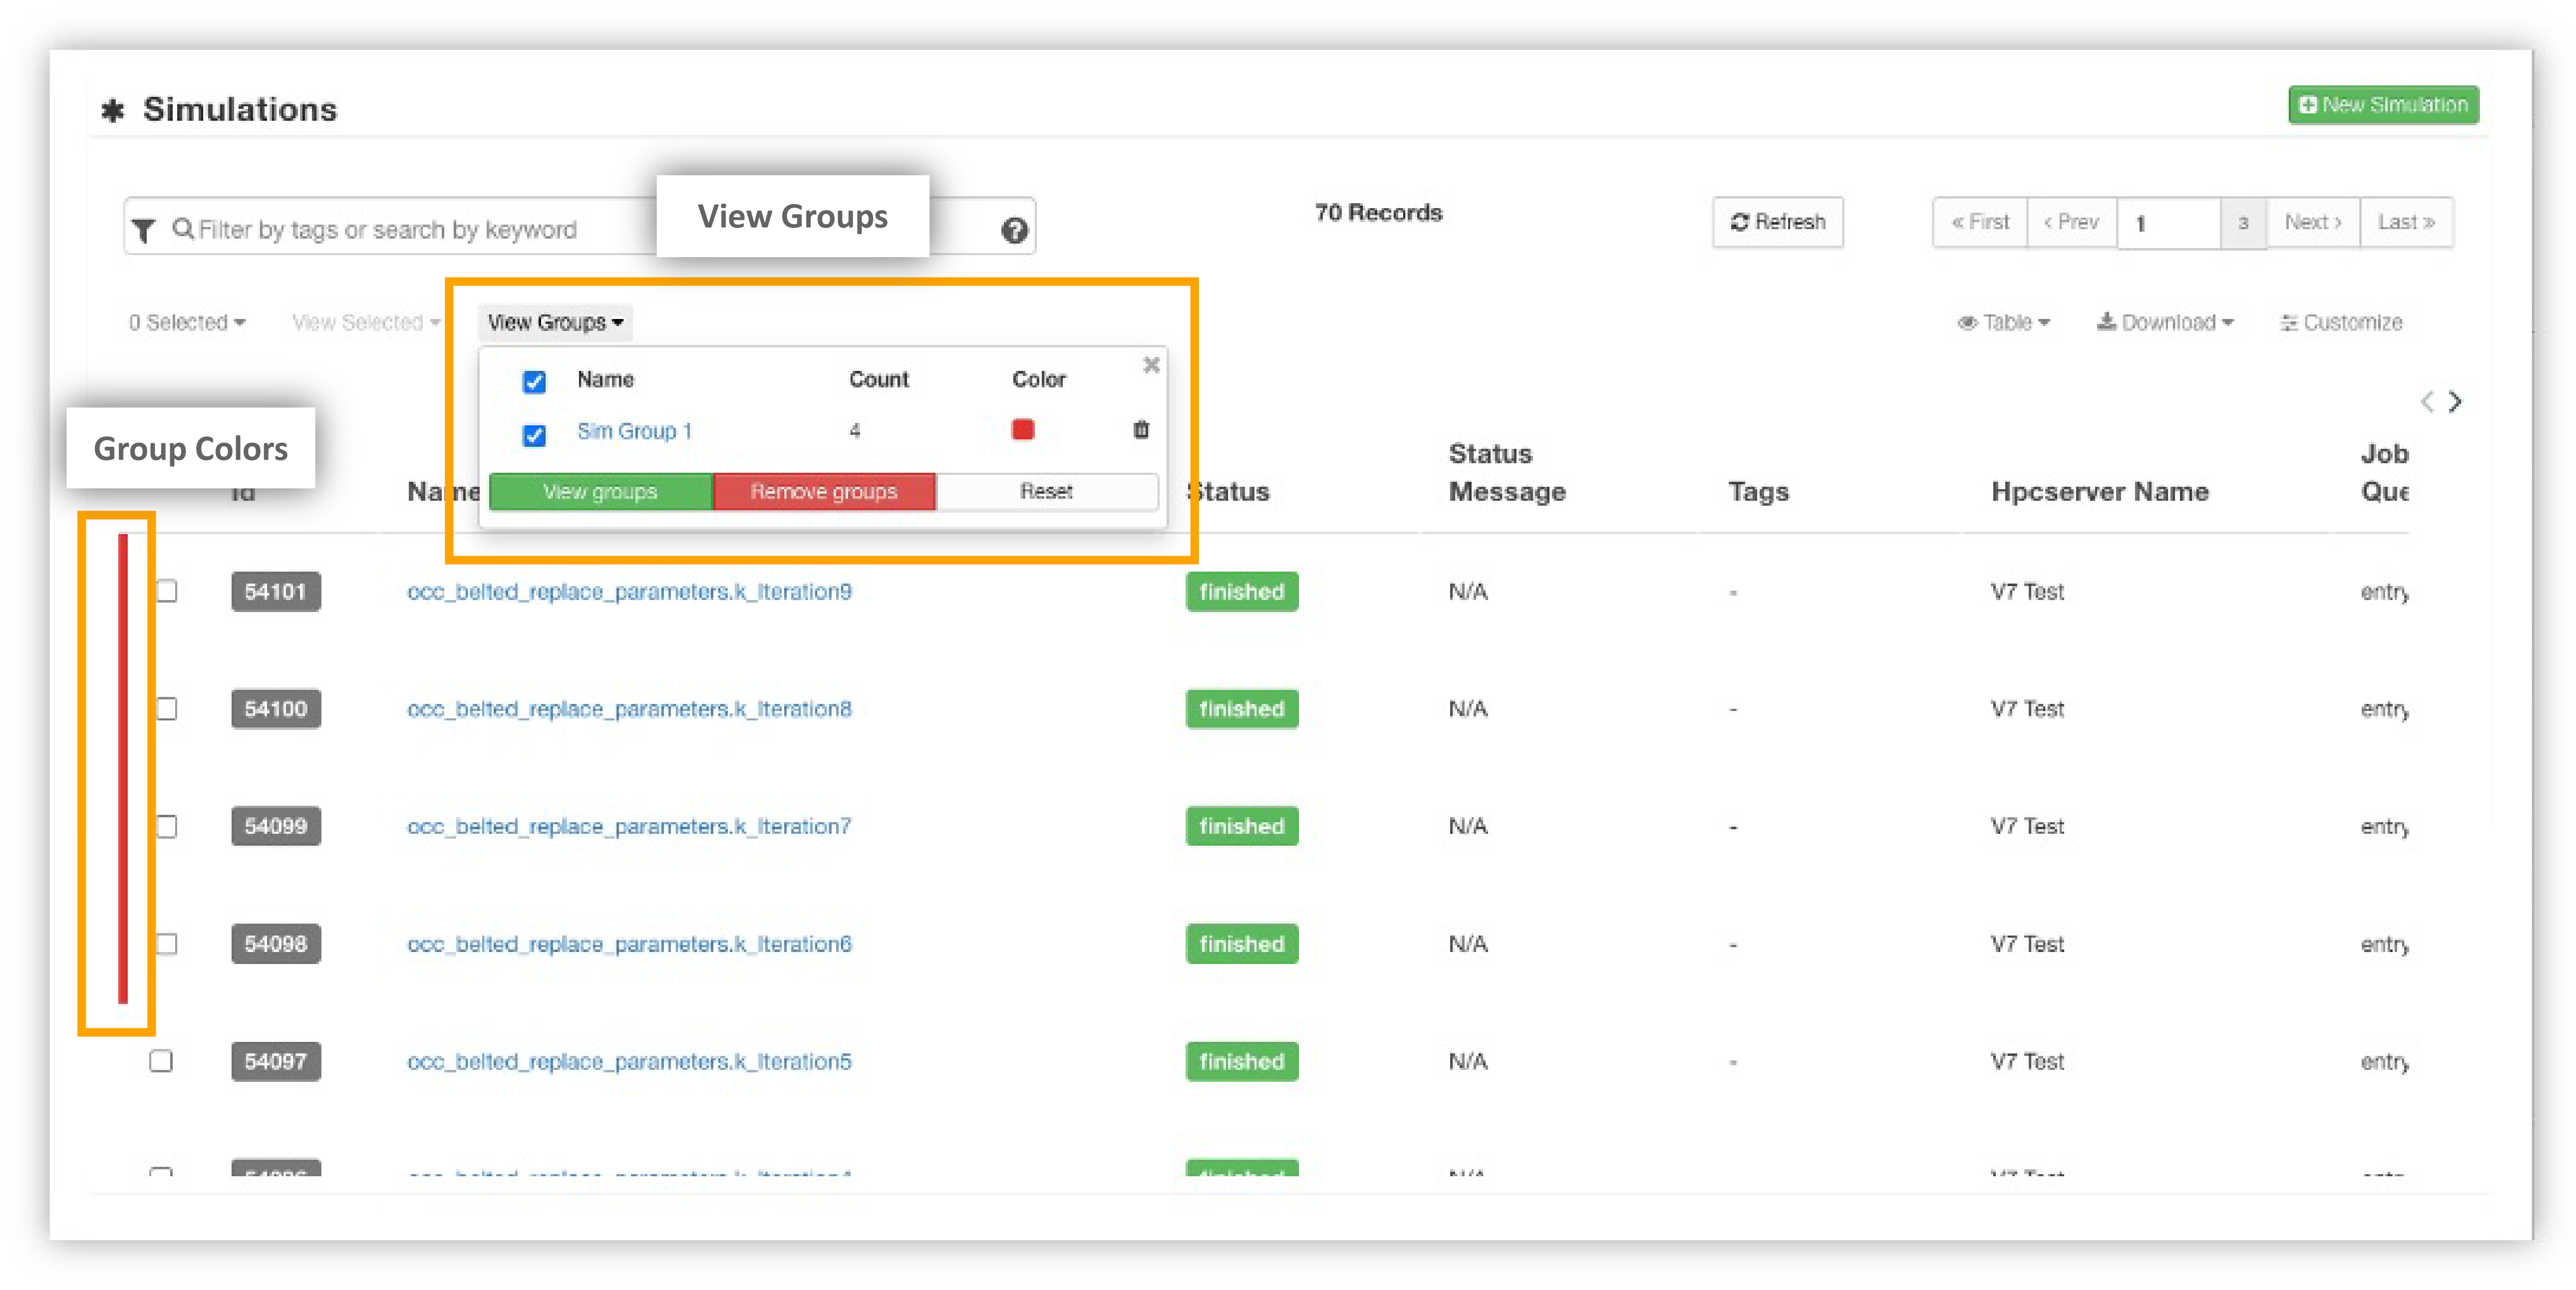
Grouping allows for studying and comparing designated records more efficiently.
Visualization Options
The Table View menu at the top right changes the way the data table is visualized. Depending on where we are viewing our table, certain views can helps us understand our data in different ways.
Visualization Options
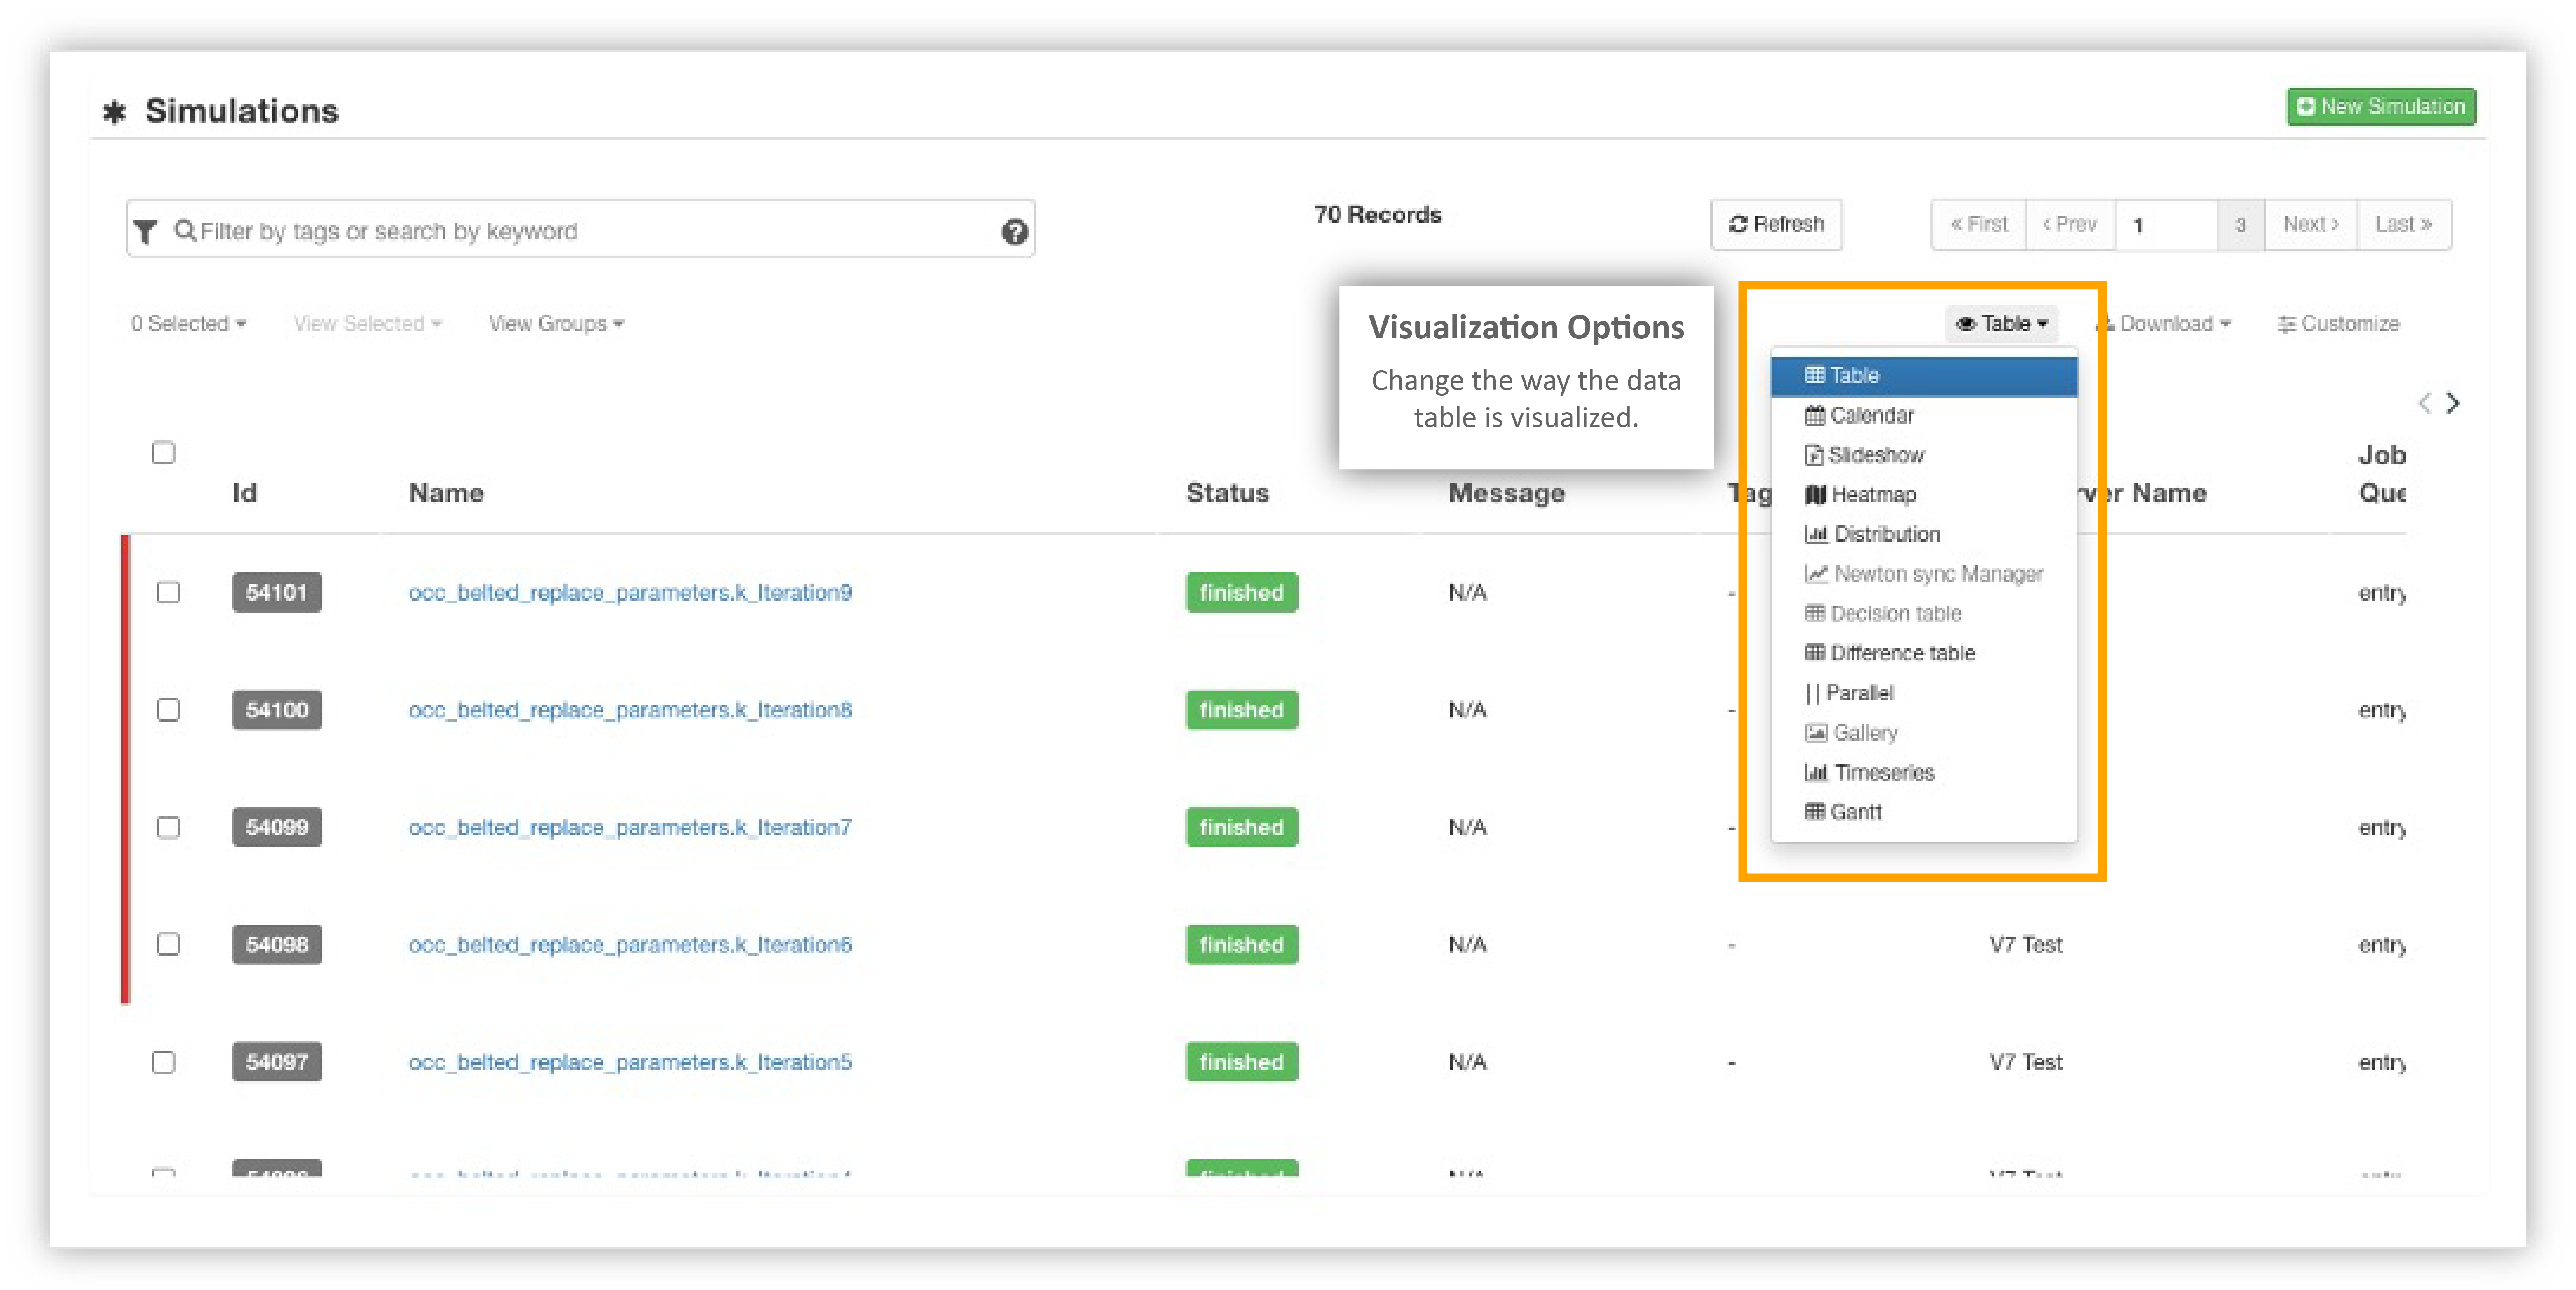
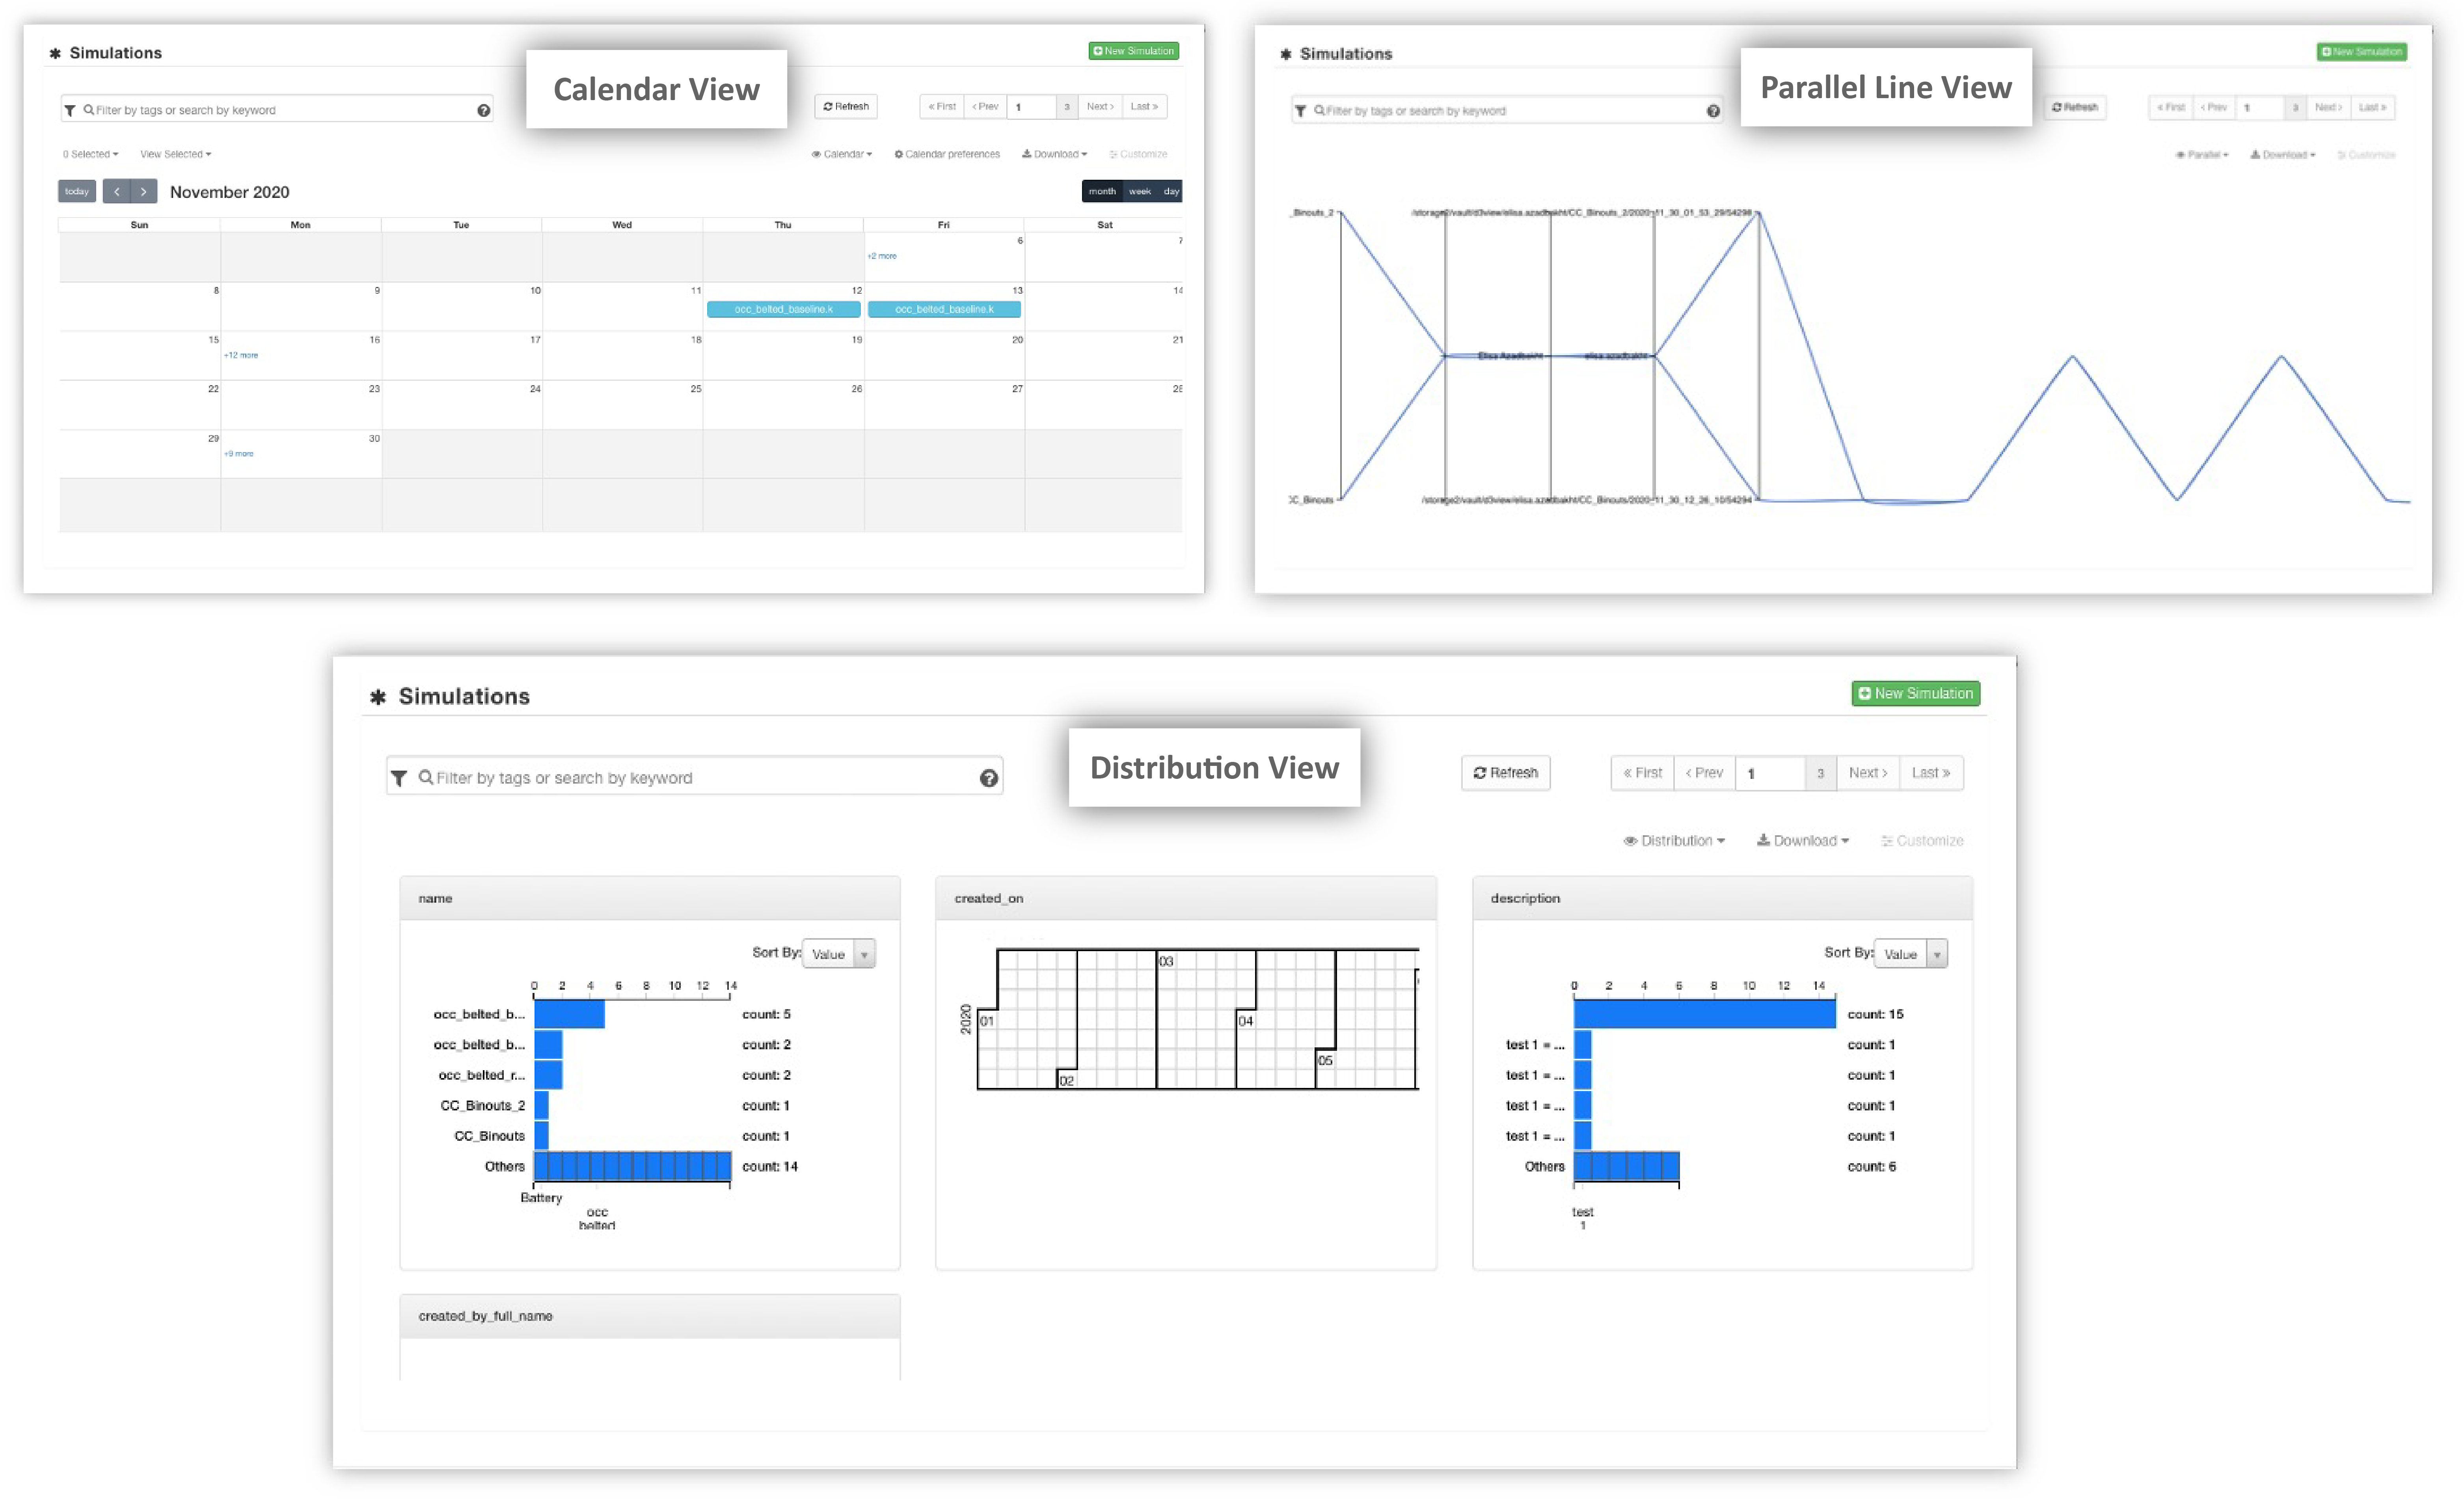
For example, changing the view to Distribution in this instance groups simulations based on column categories. Other options include calendar and parallel line.
Visualization Options Examples
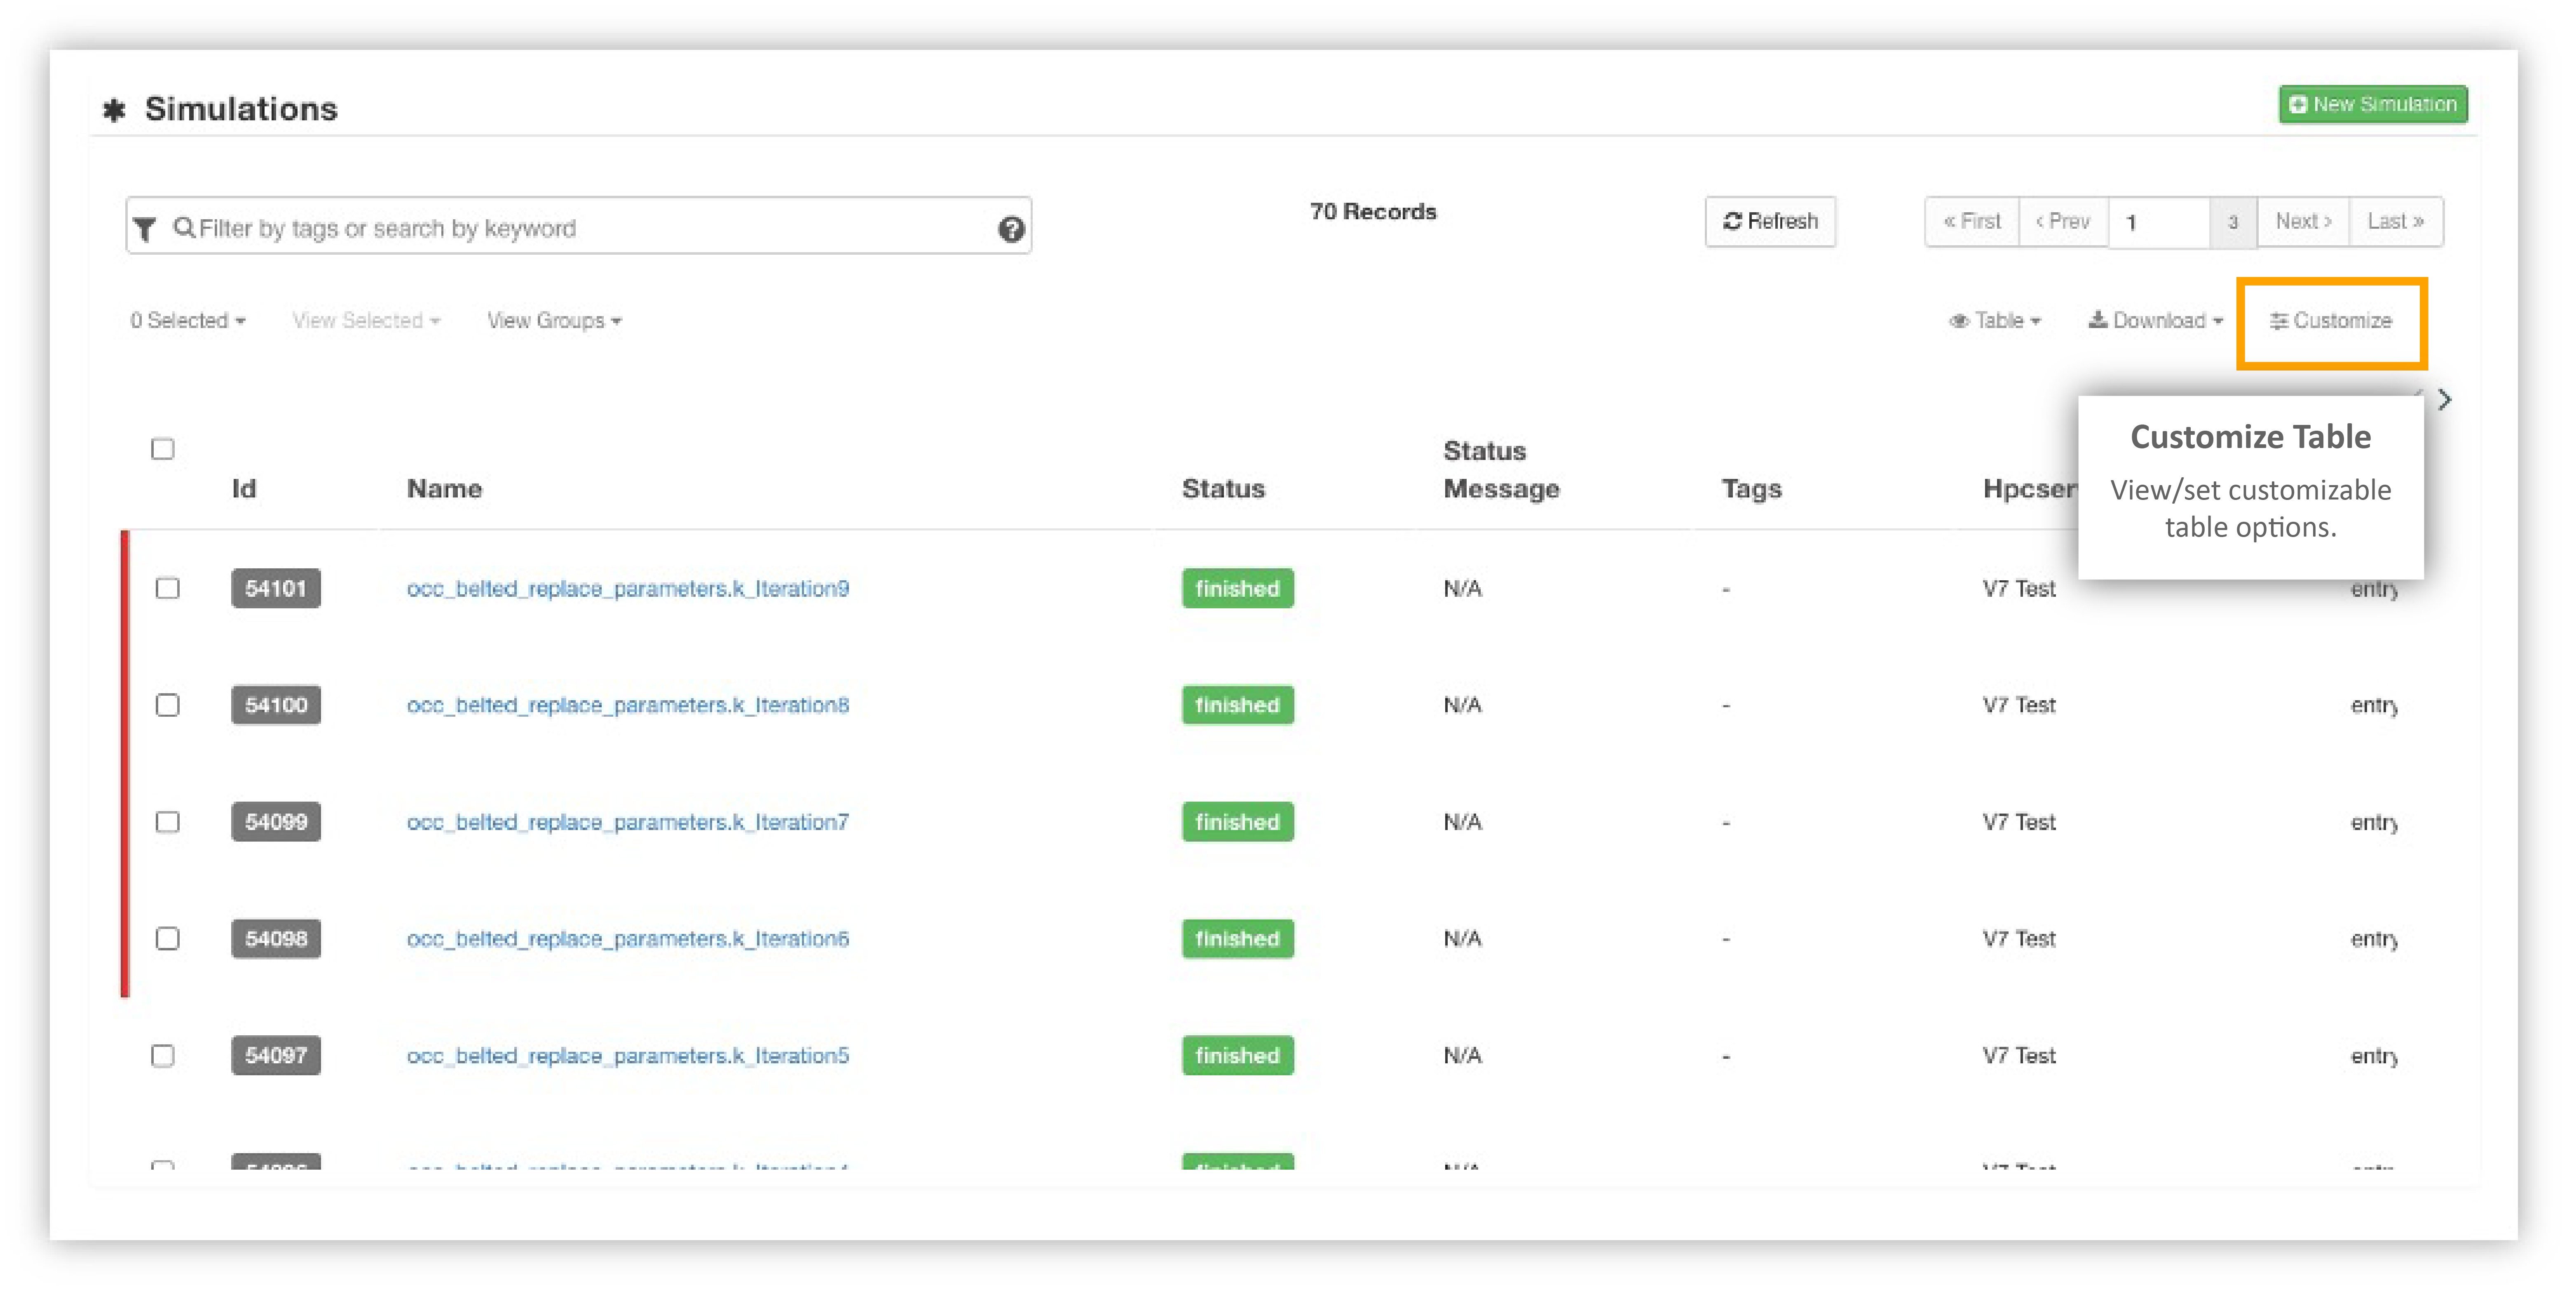
Customization Settings
Click on Customize to see how we can customize our table.
Customization Settings
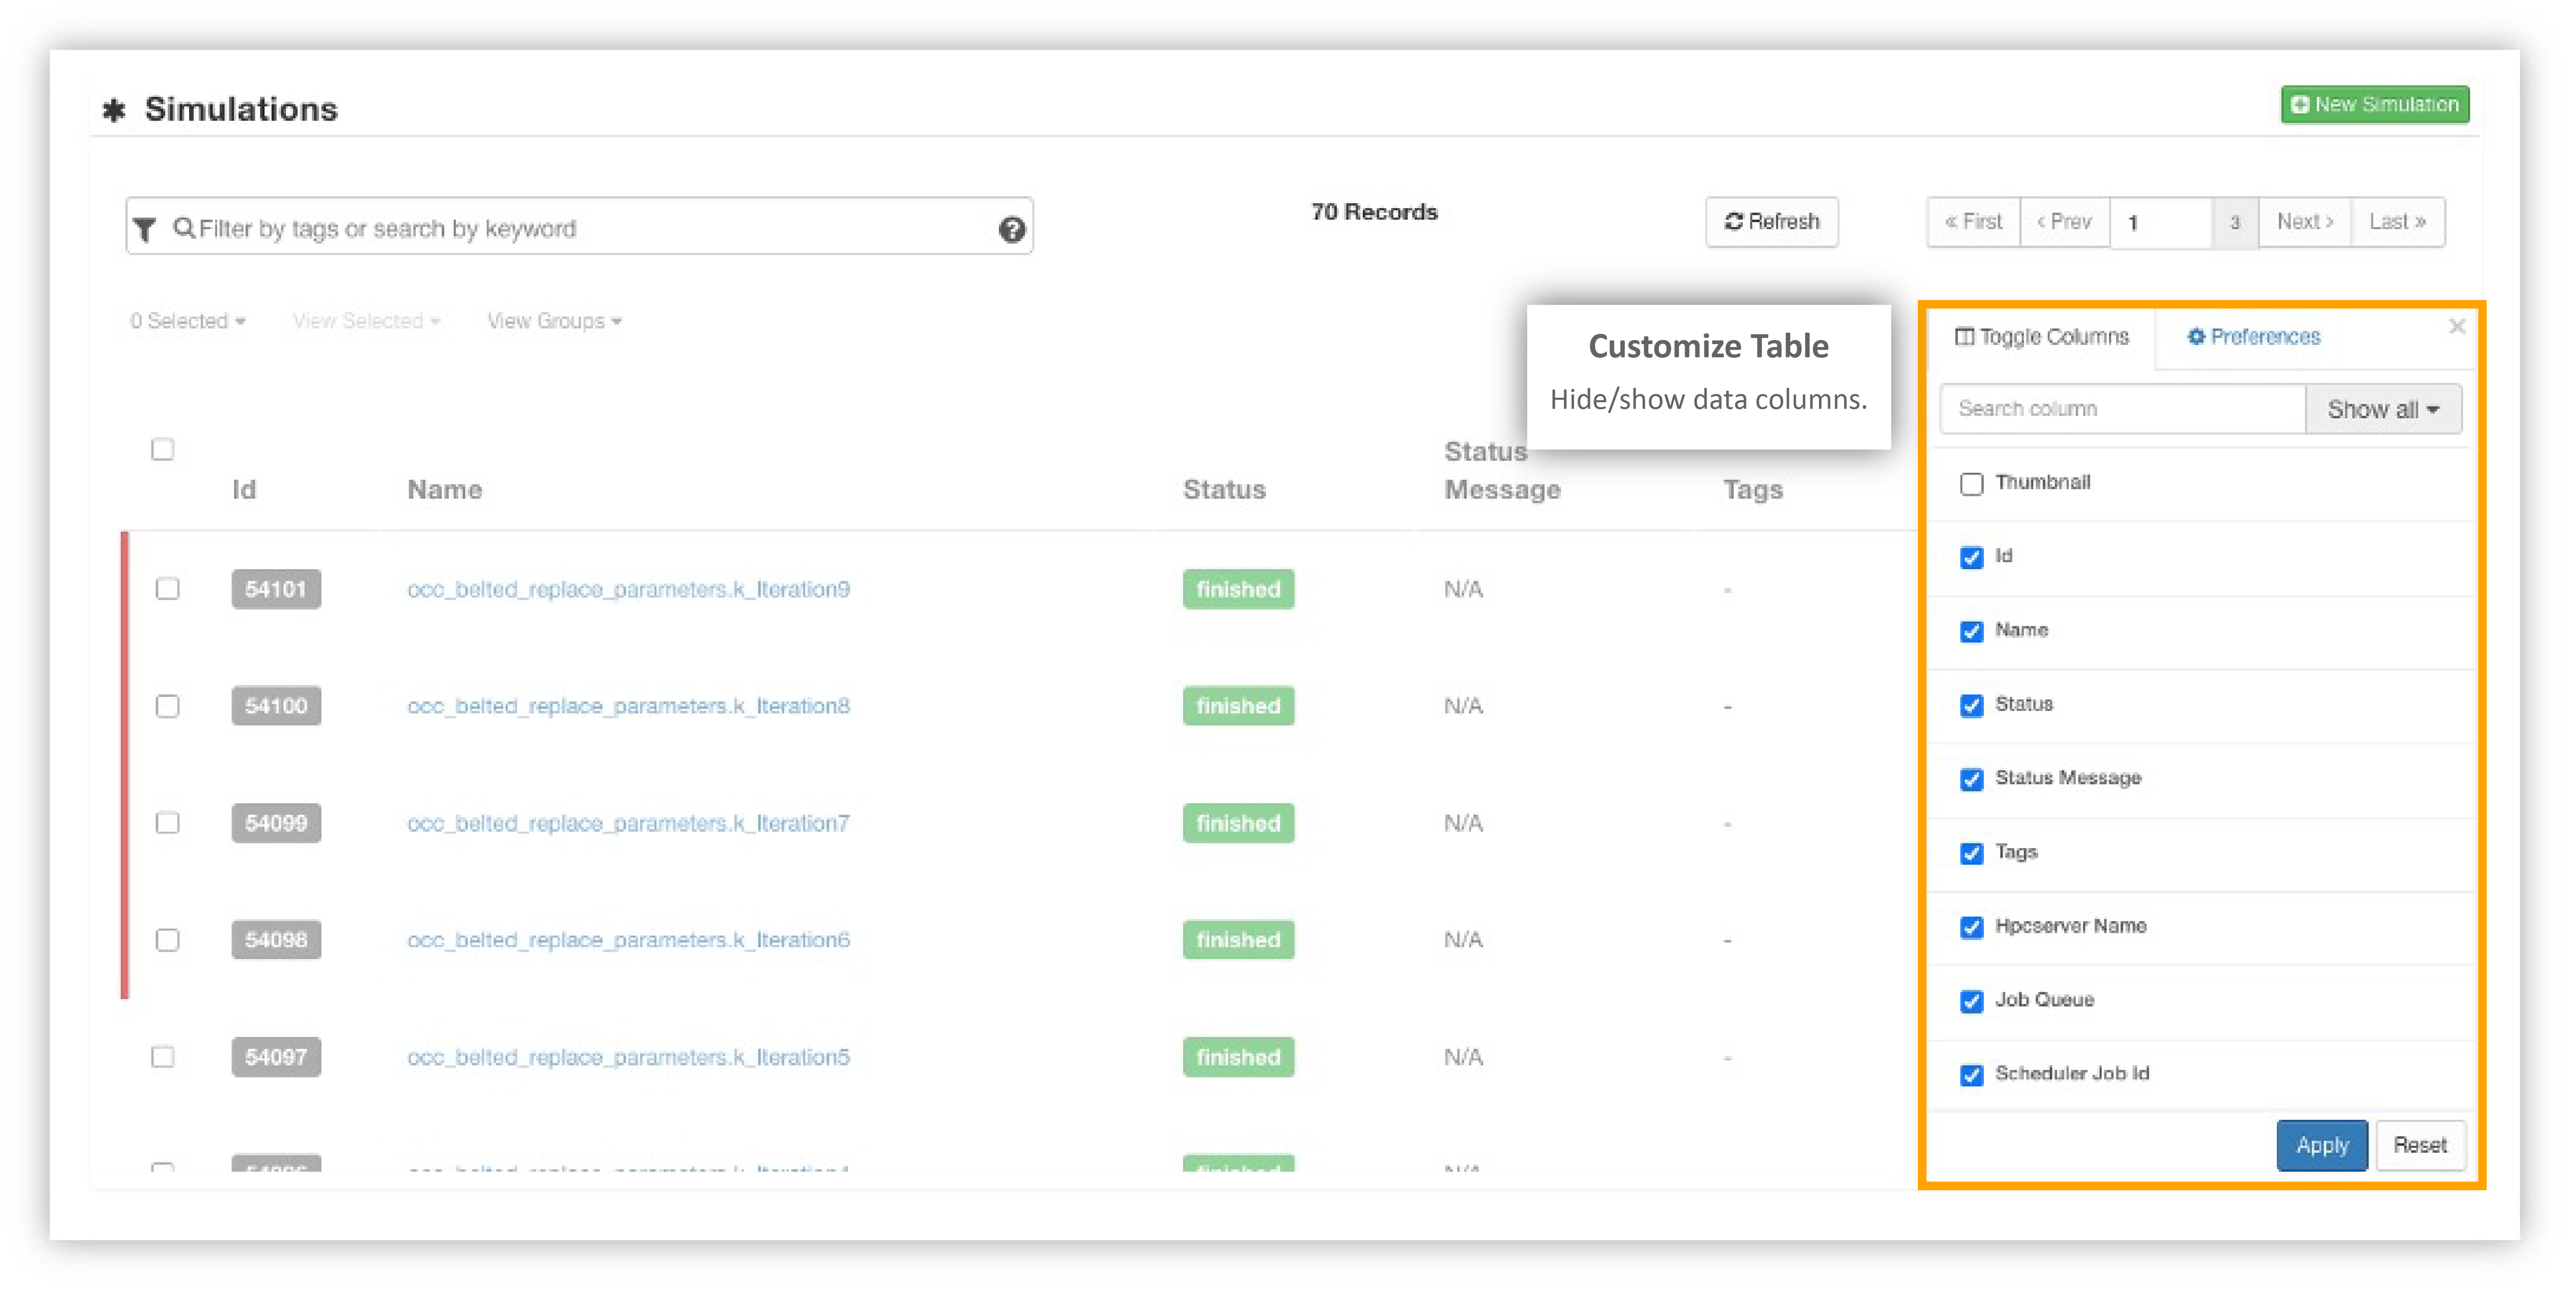
Hide/show columns on the table under this tab.
Customize Columns
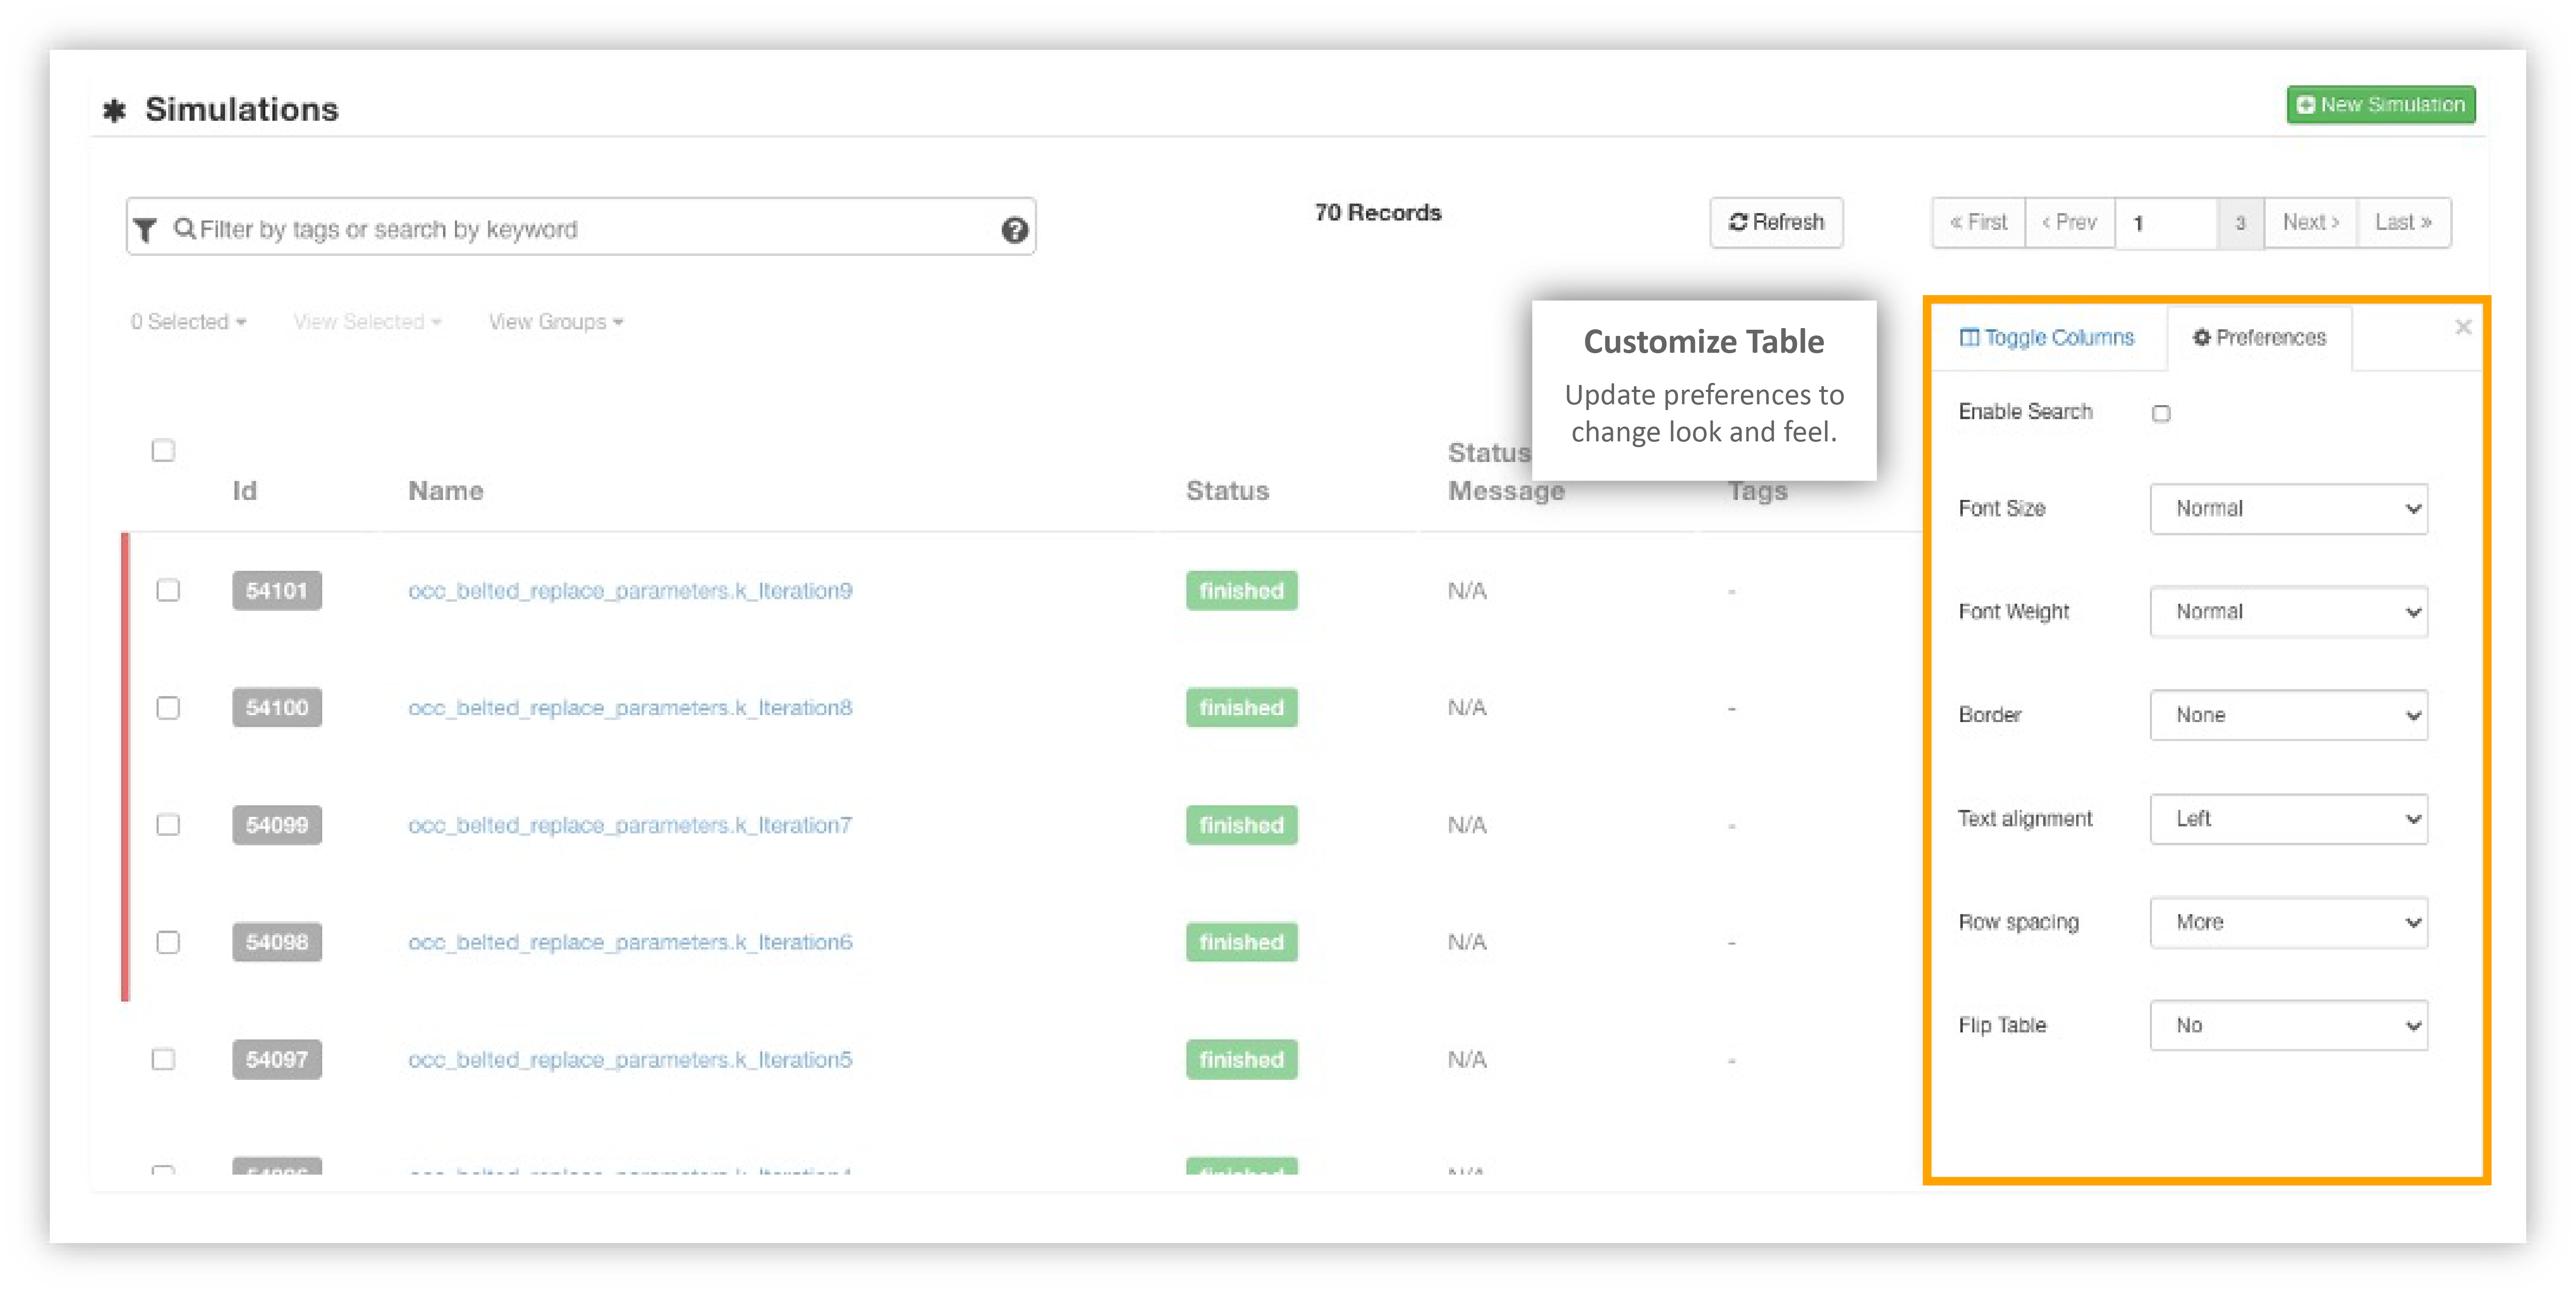
Edit the basic look of the table under here. Change aspects such as font weight or border type.
Table Settings
Customizing our tables allows us to view or study them with more efficiency.
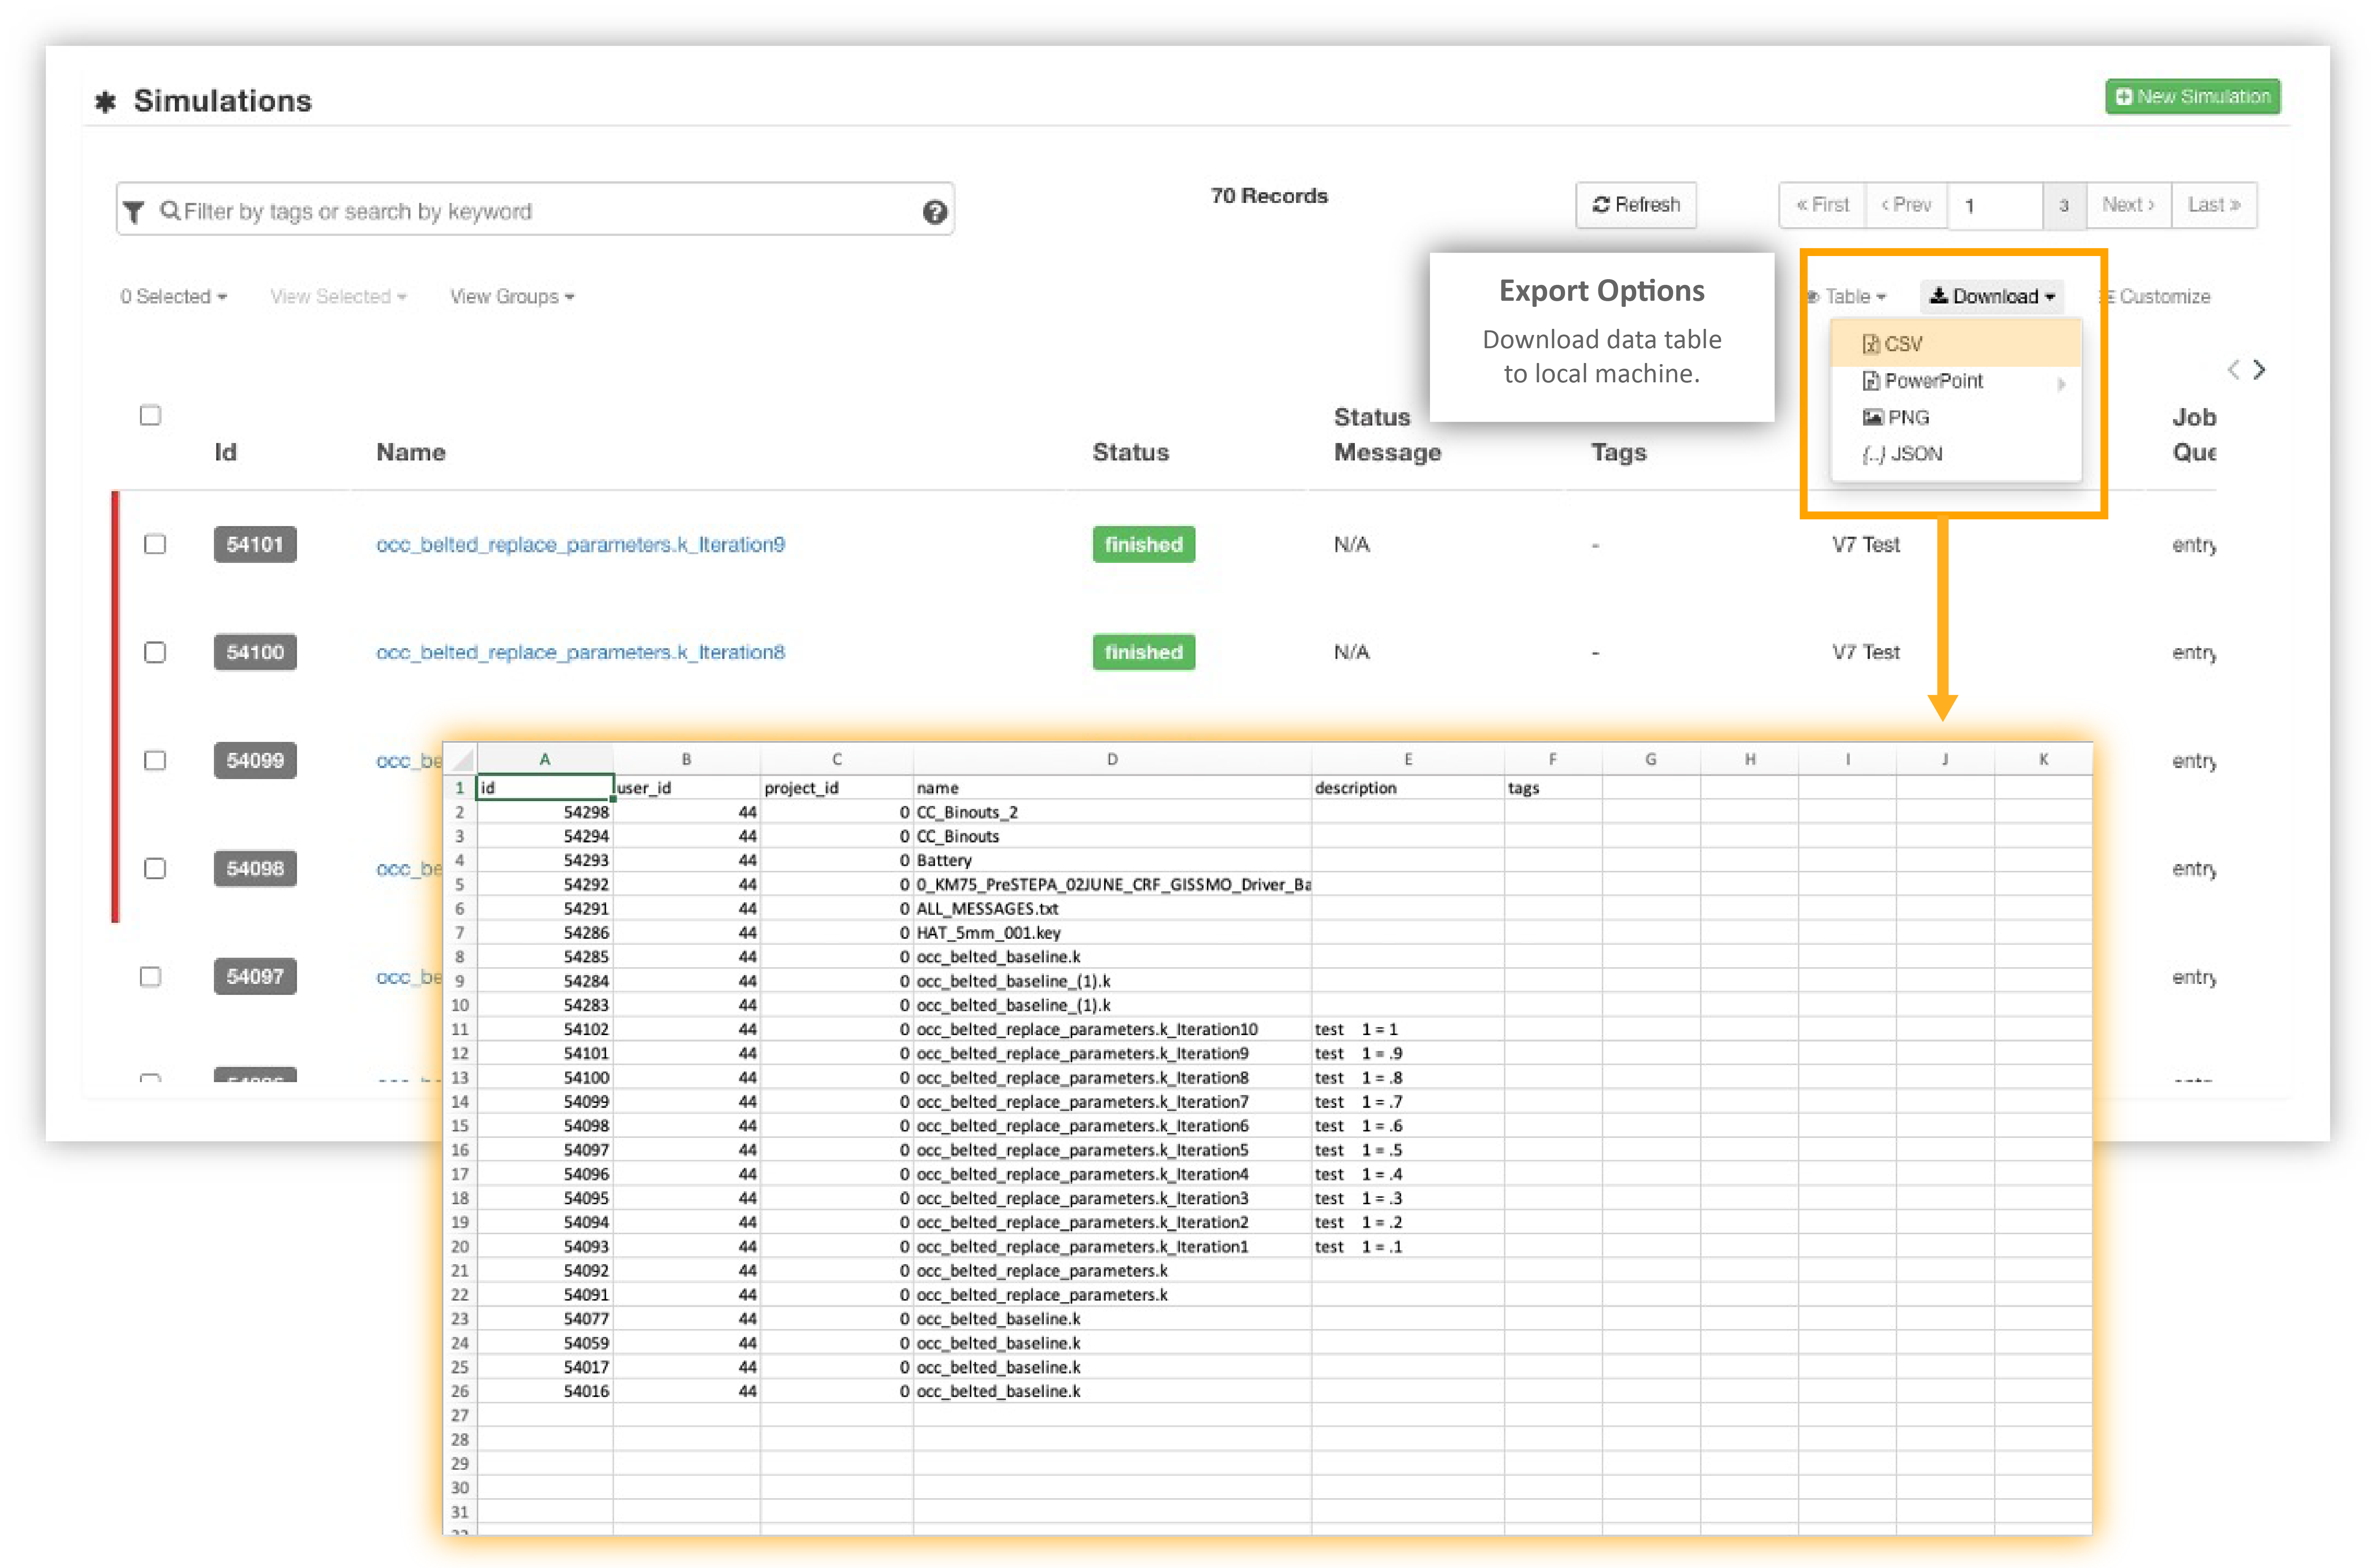
Exporting Data
We can download our data table to our local machine under this menu. We’ll click on the option we wish to download and configure it by choosing a name and data for the exported file. The only exception is the PNG option which will start to download immediately.
Export Table
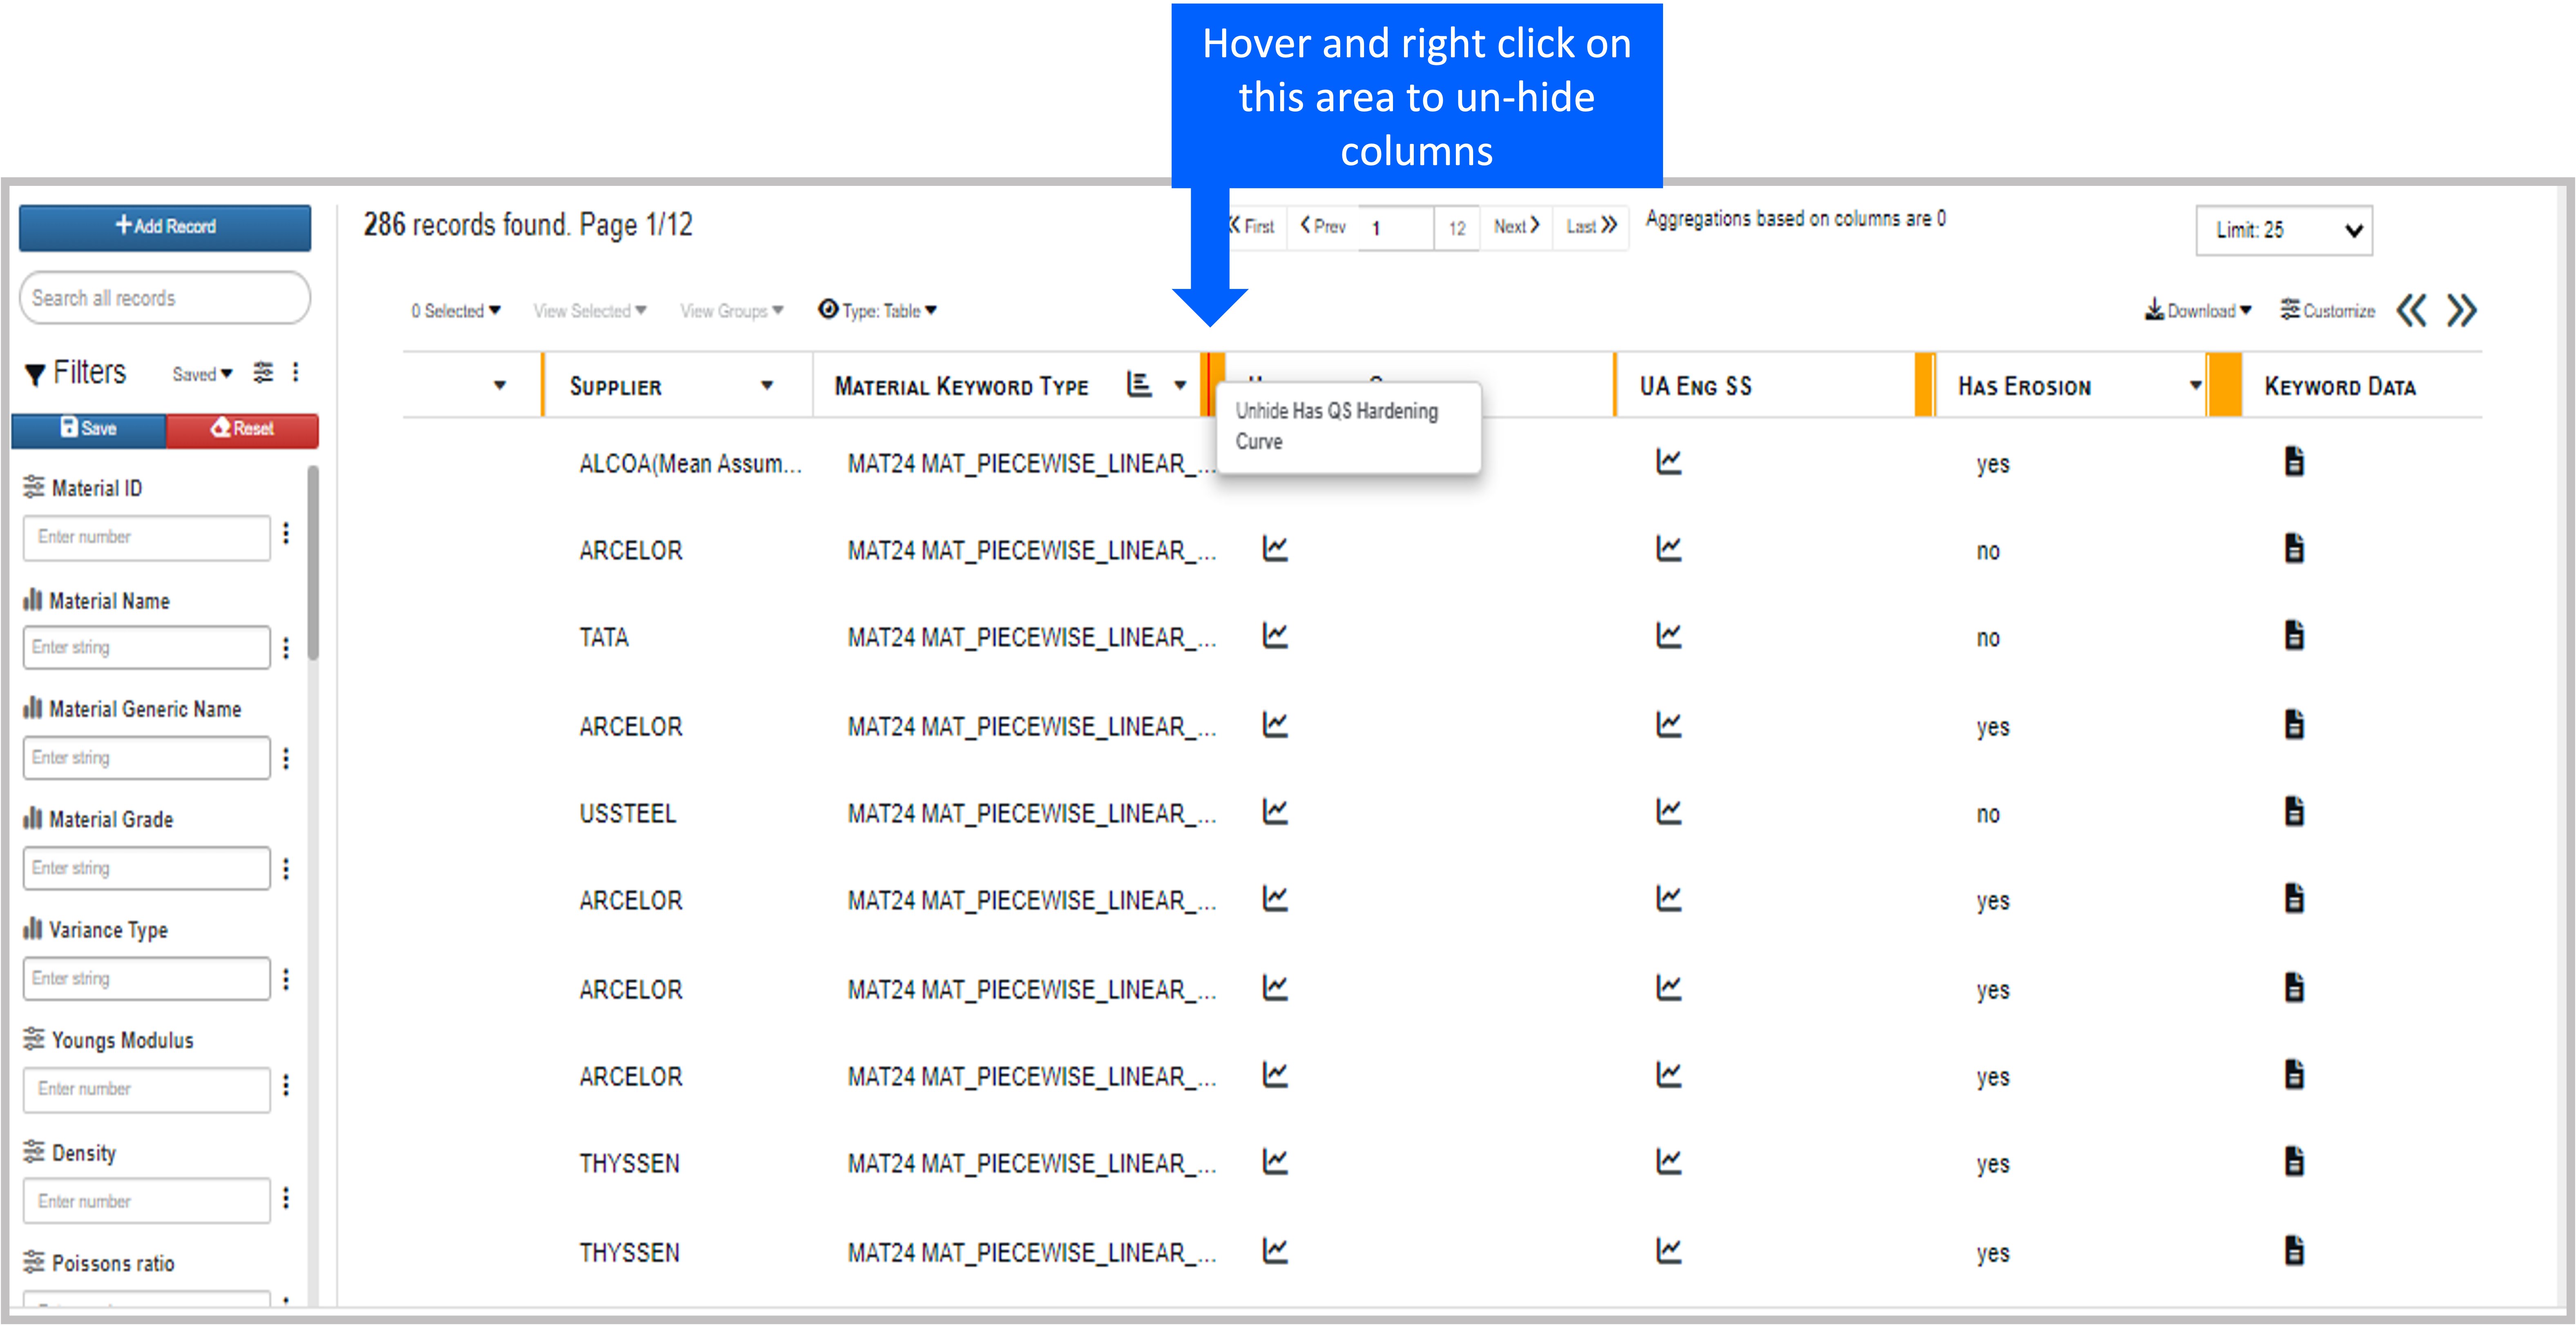
Unhide Columns
Unhide any columns directly from the data table by hovering and right-clicking on the area.
Unhide Columns
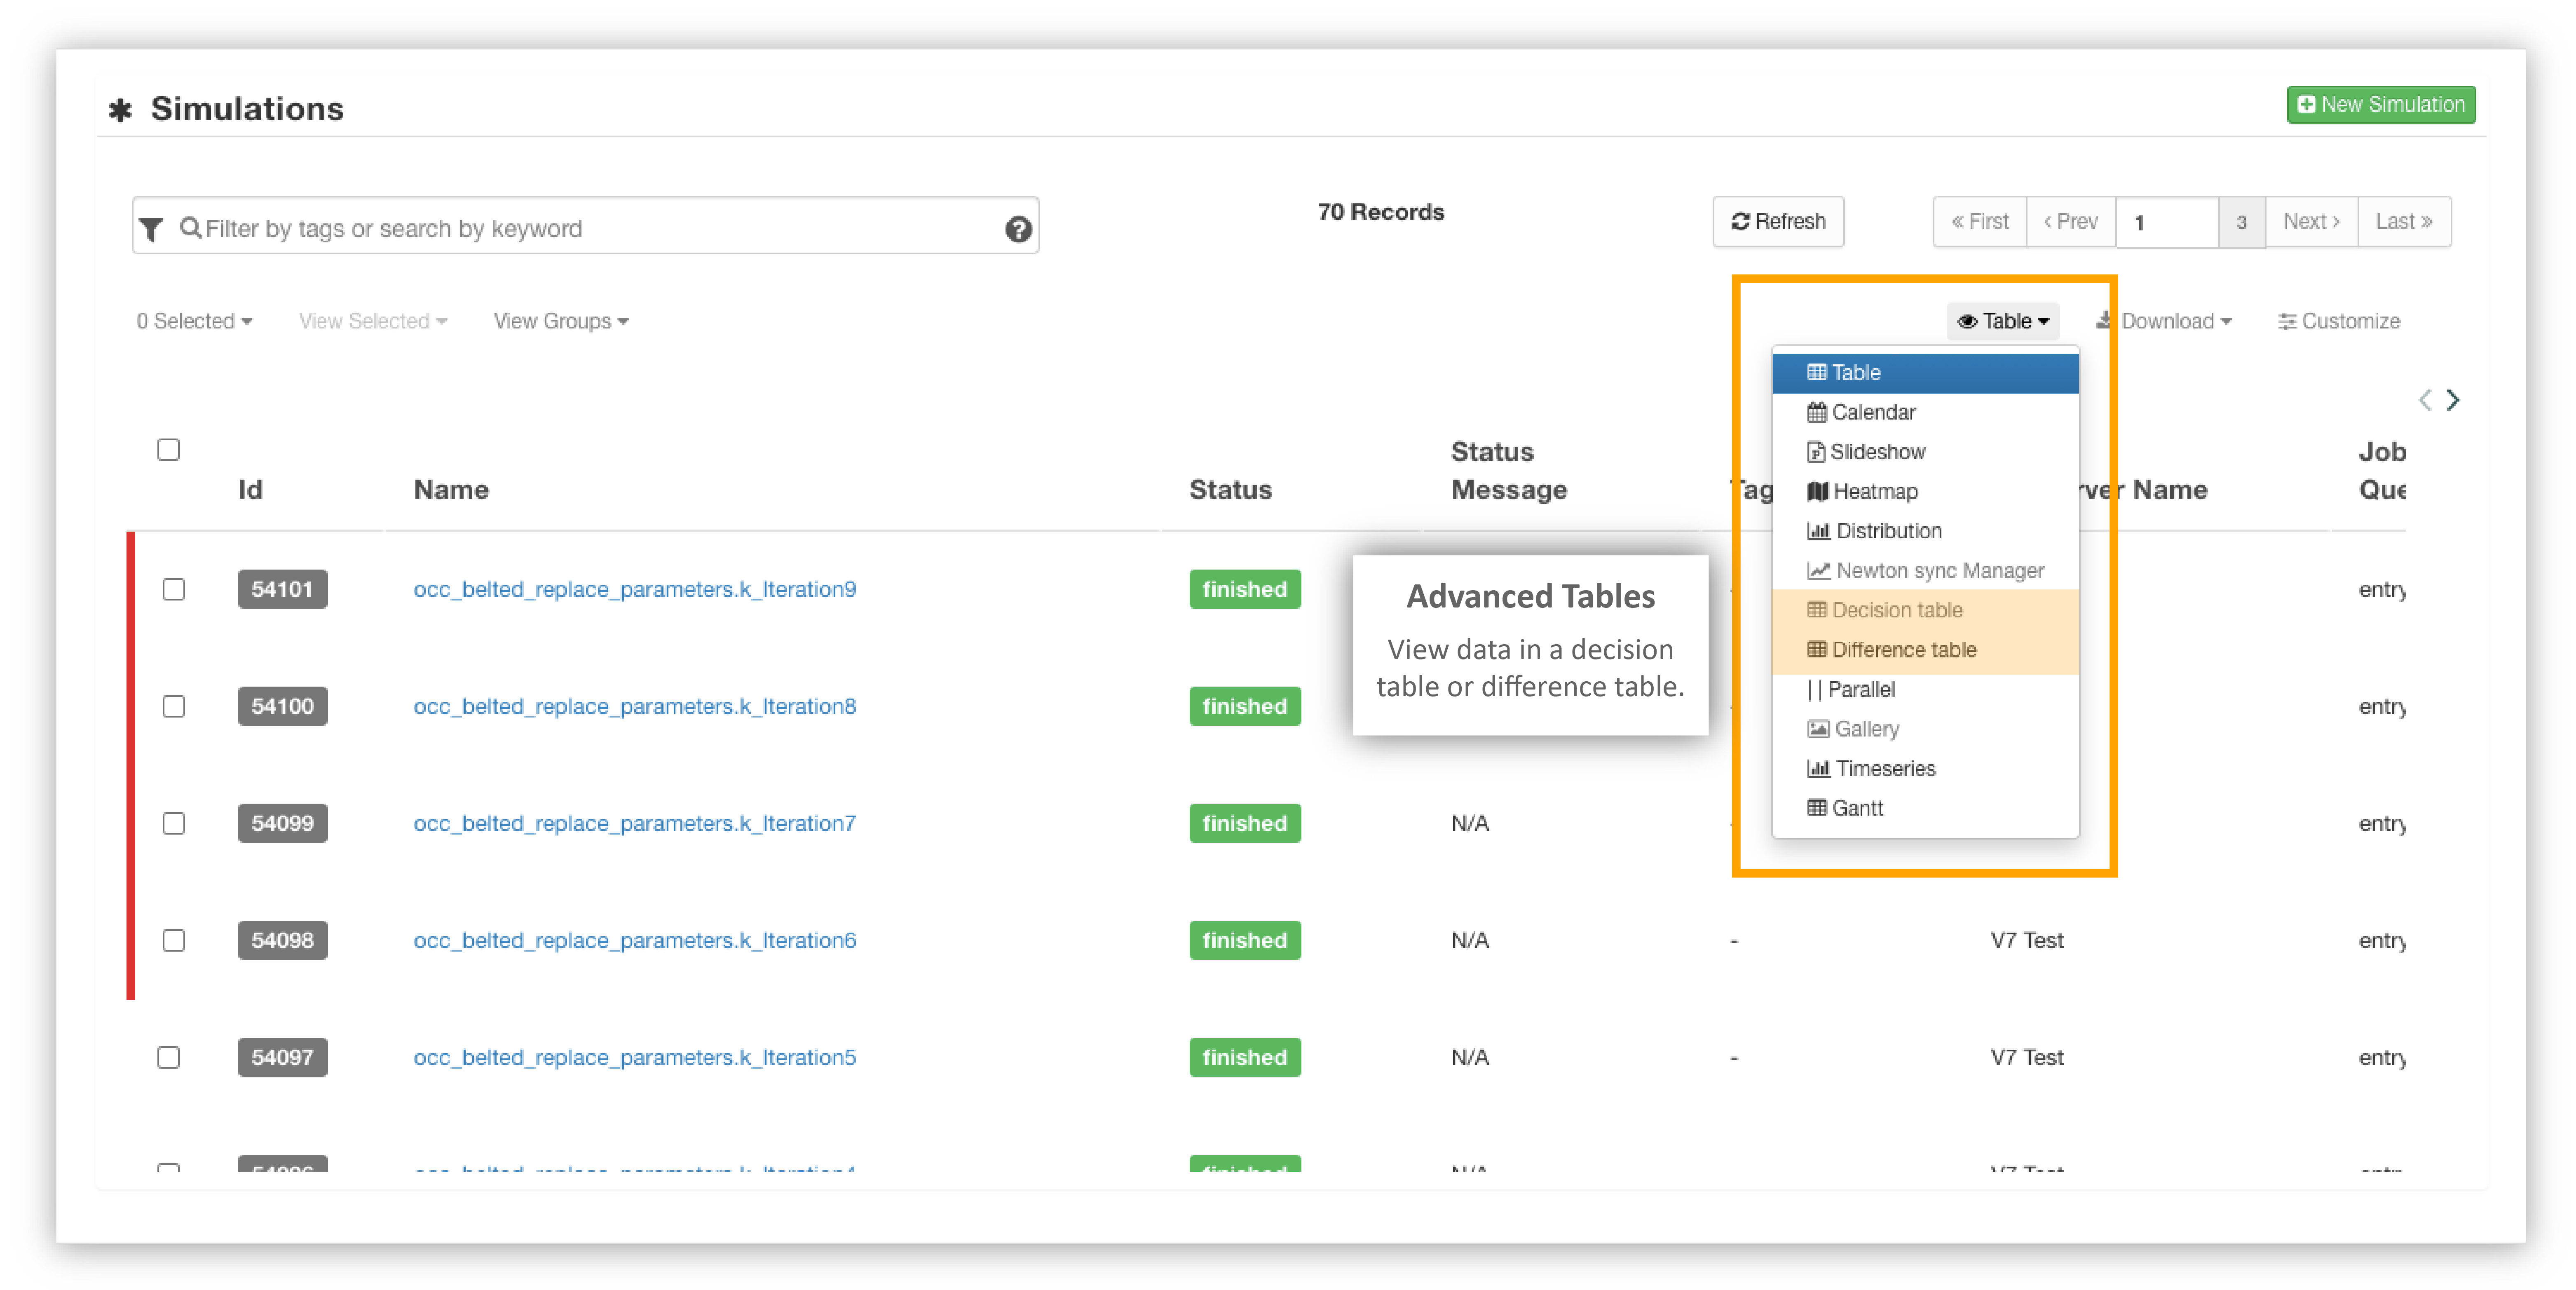
11.2. Advanced Features
As we discussed earlier, we can visualize tables in different ways. Under this menu is also where we can find two other table types.
Advanced Tables
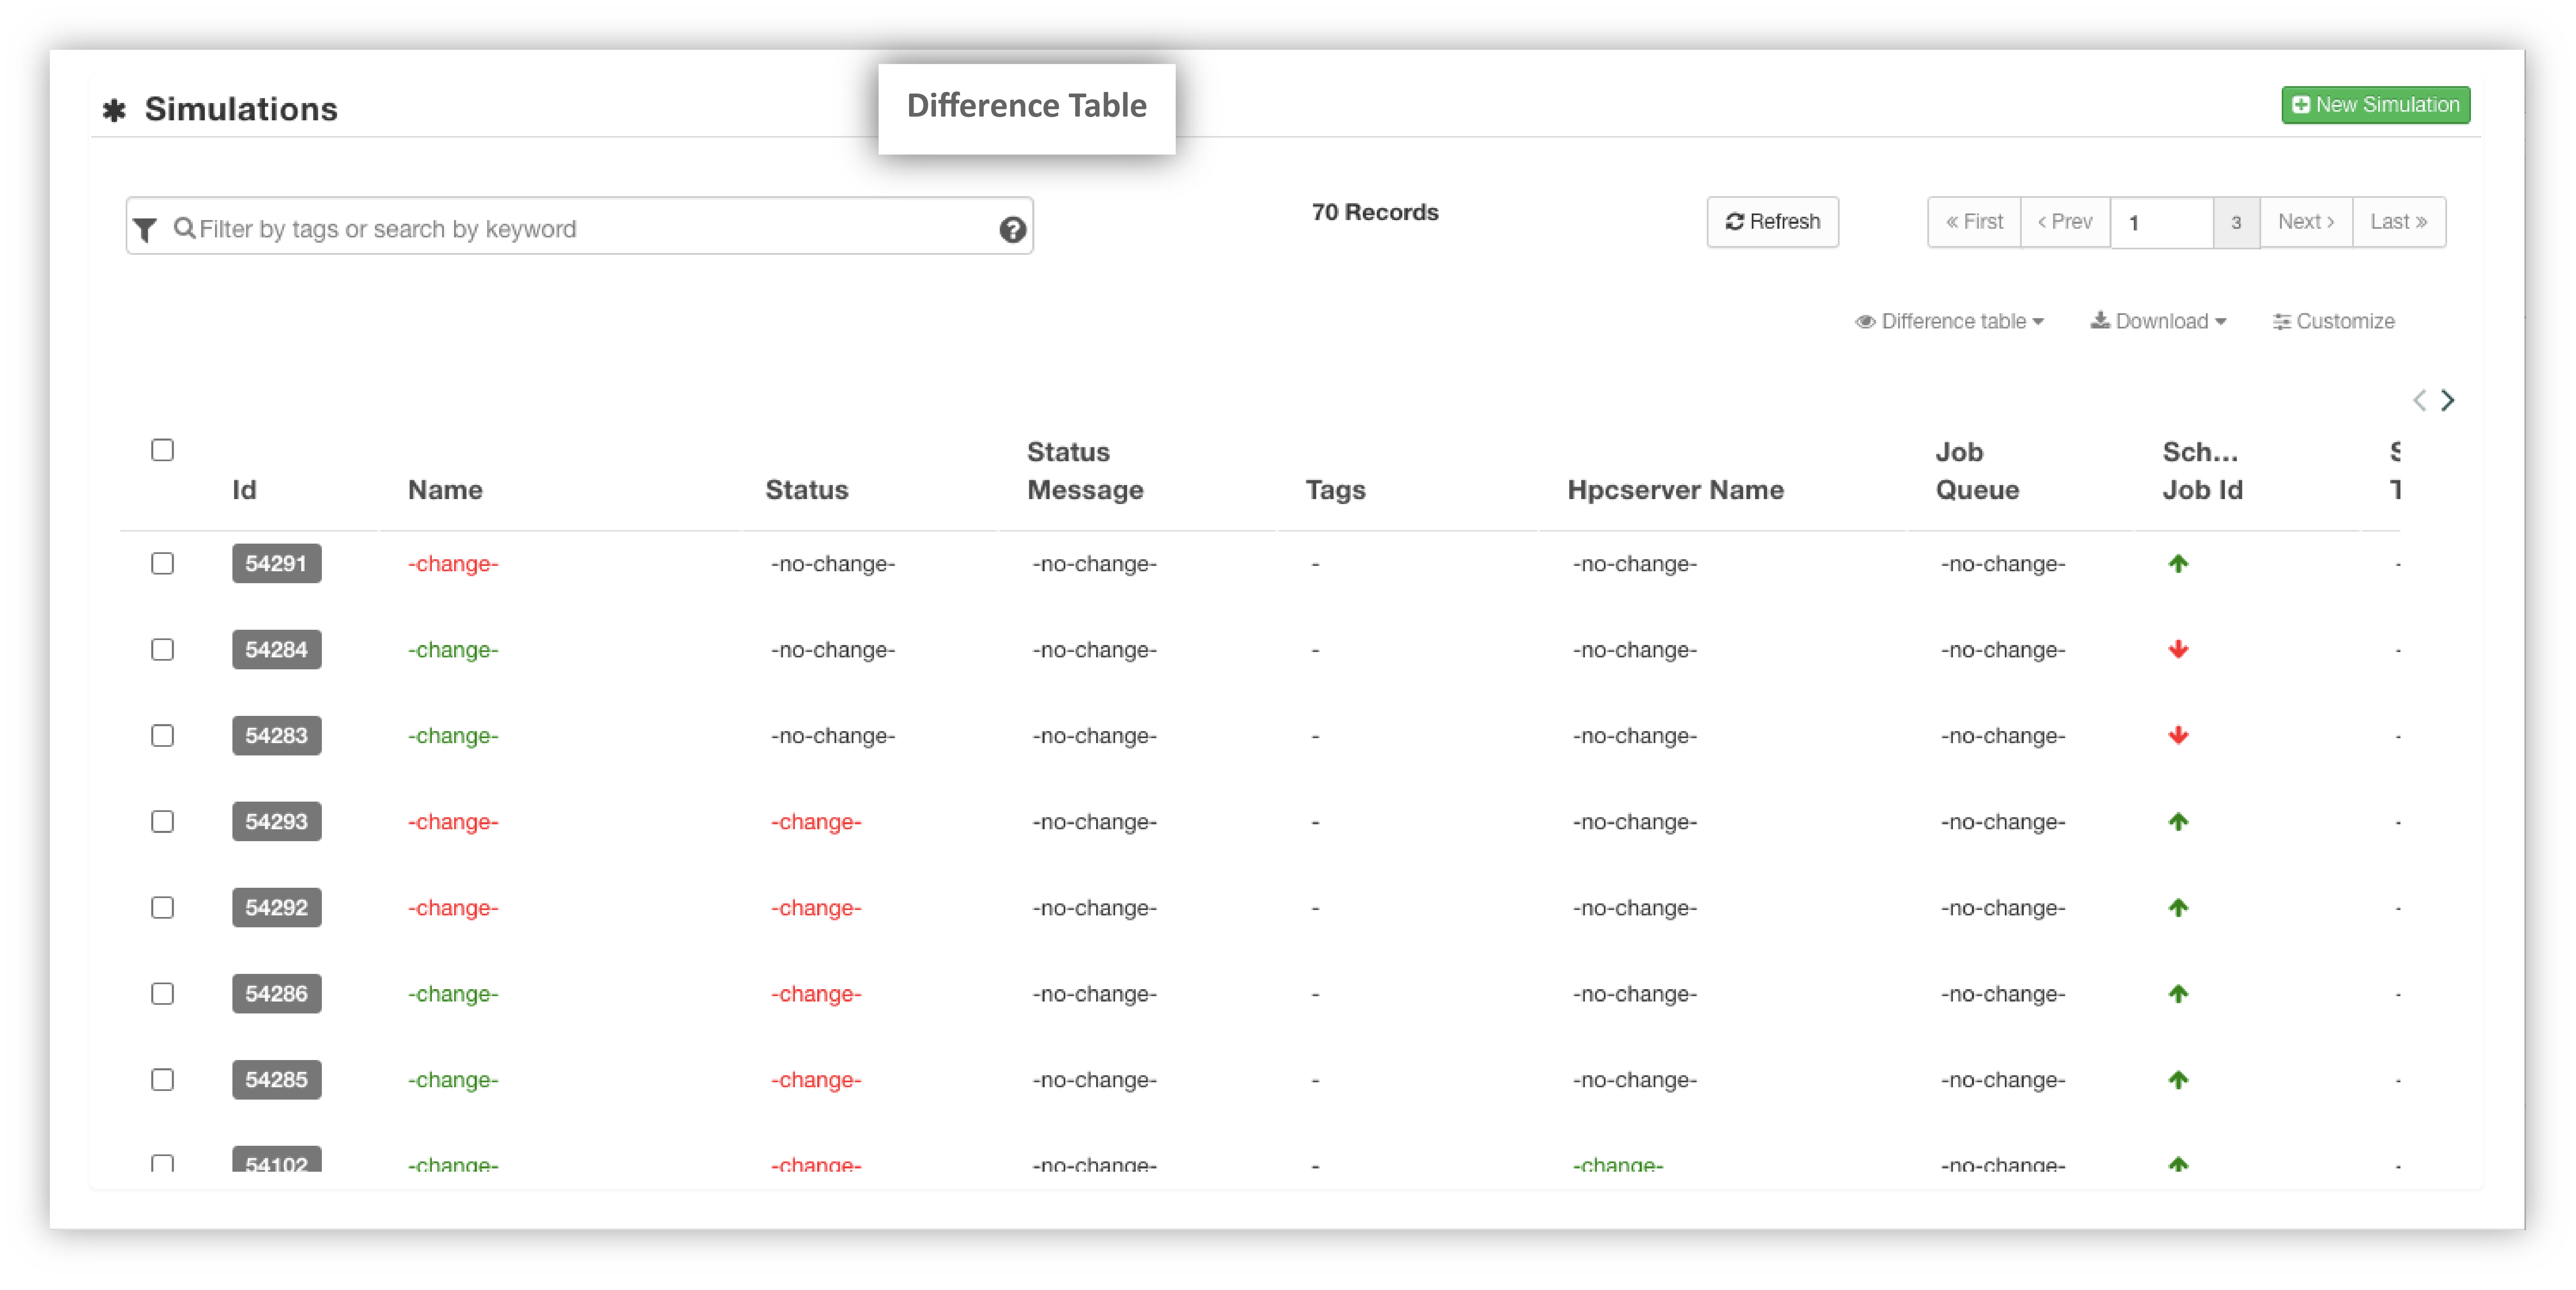
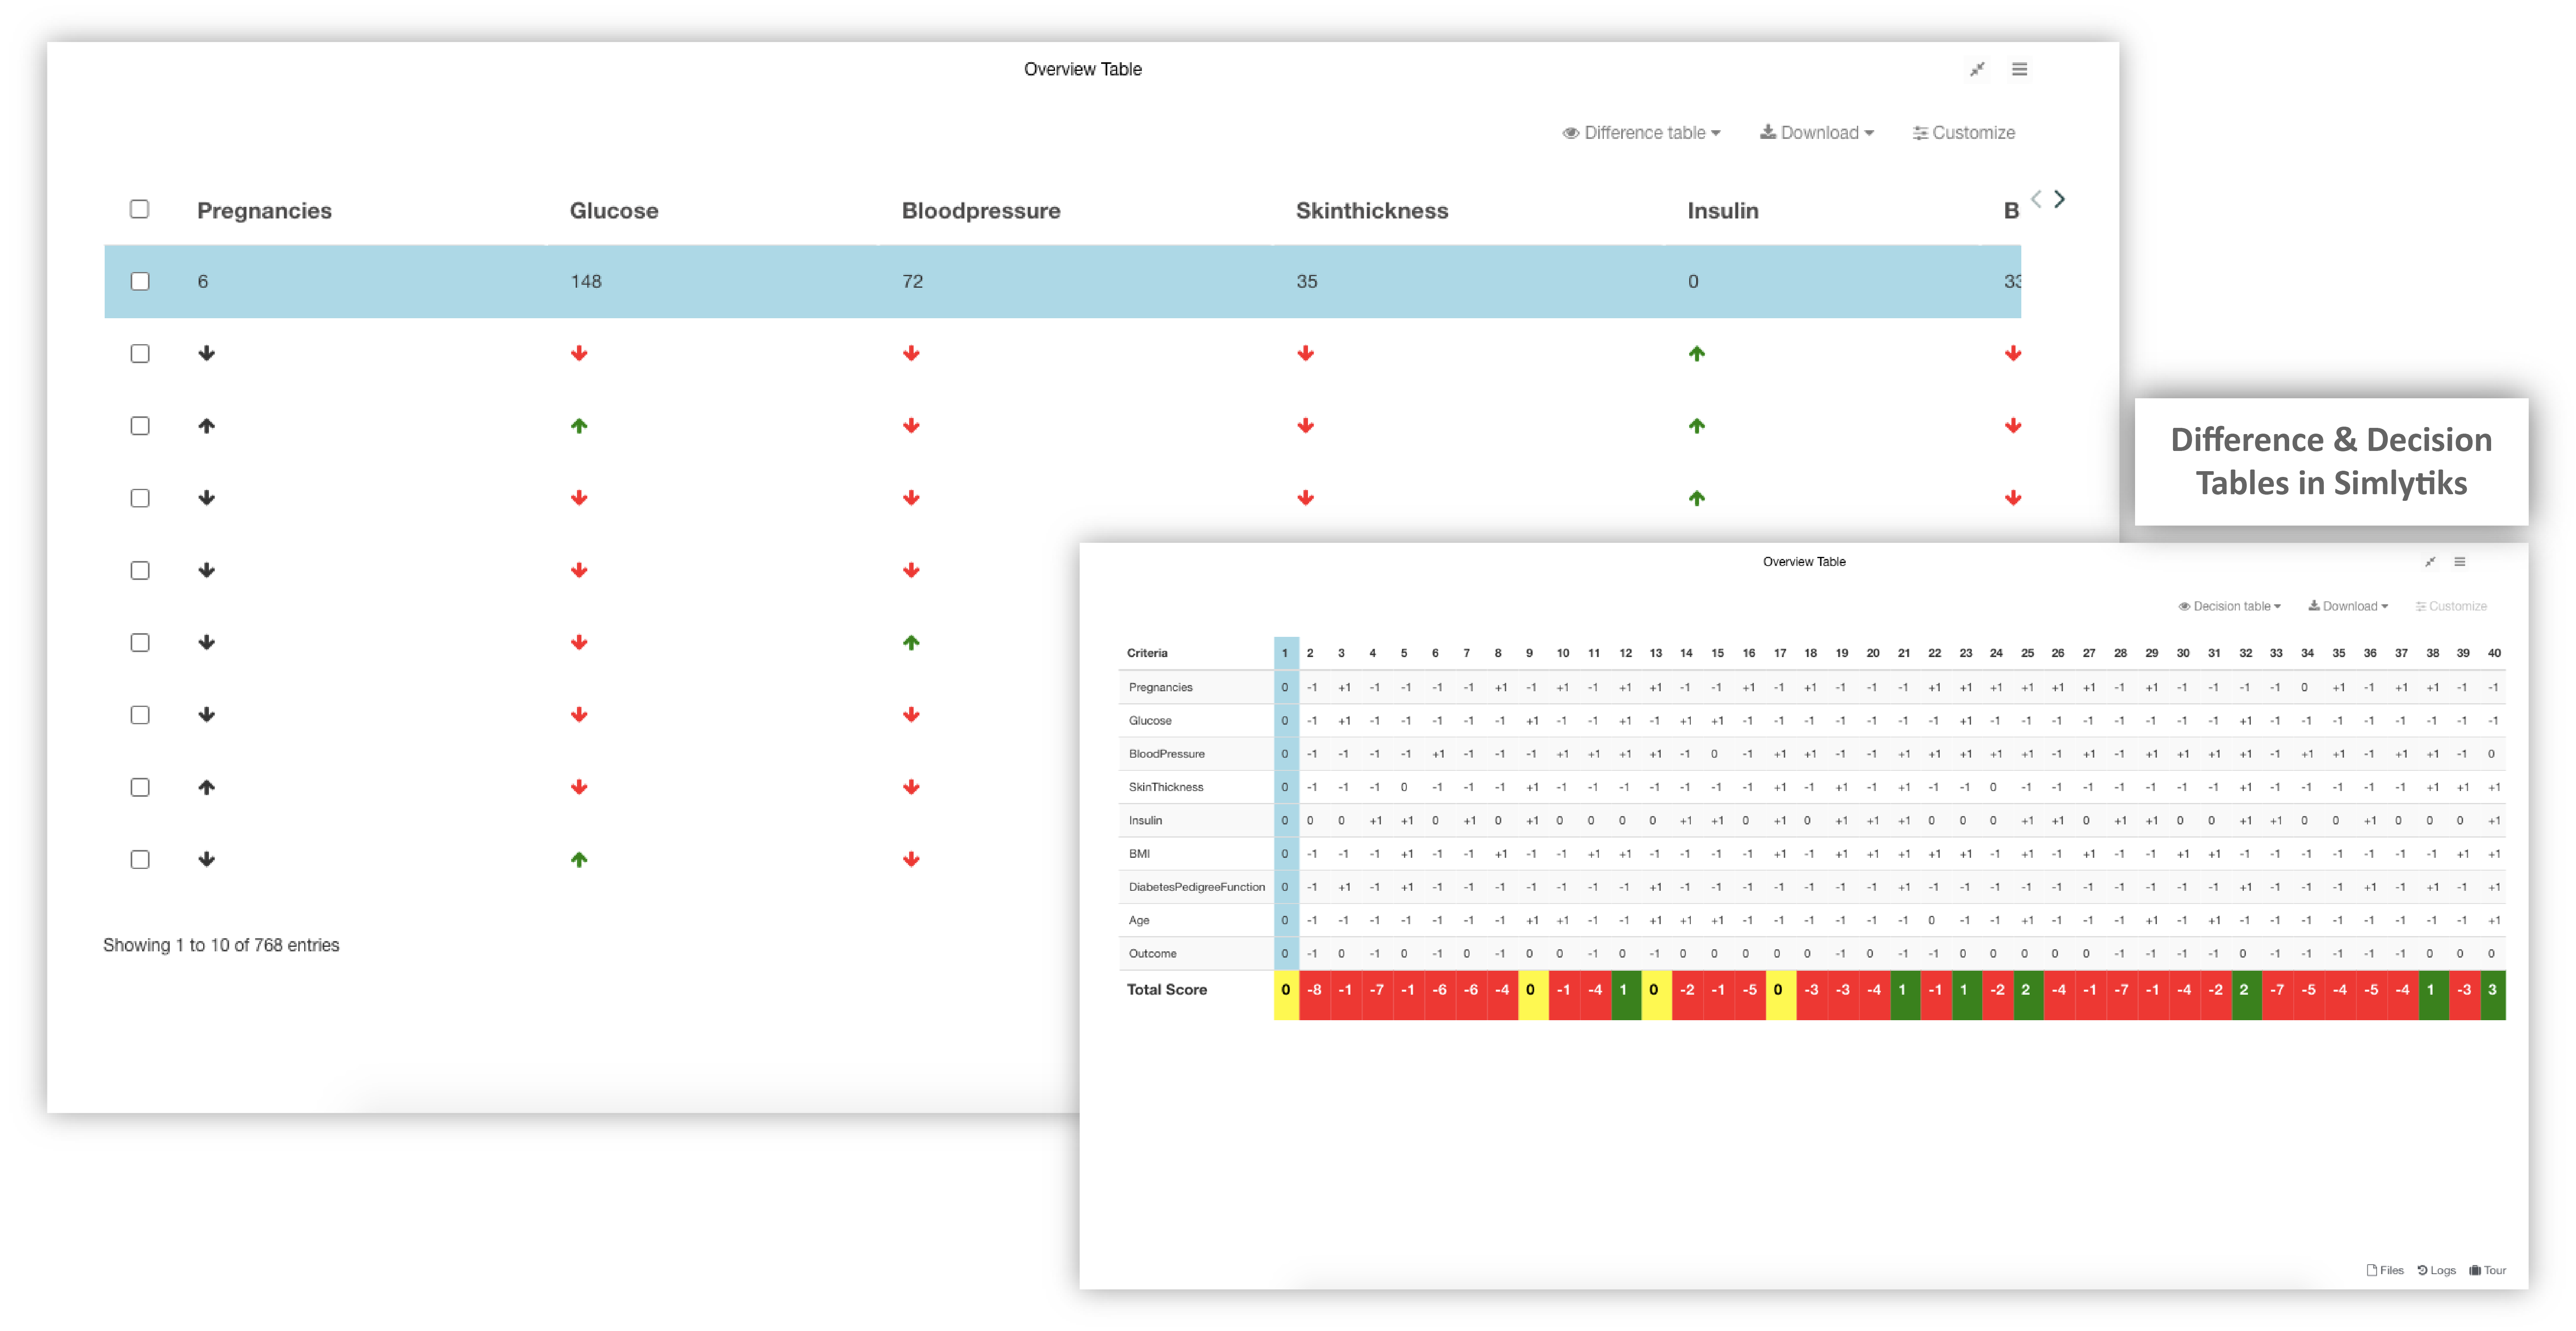
Difference tables show data sequences based on its differences.
Difference Table
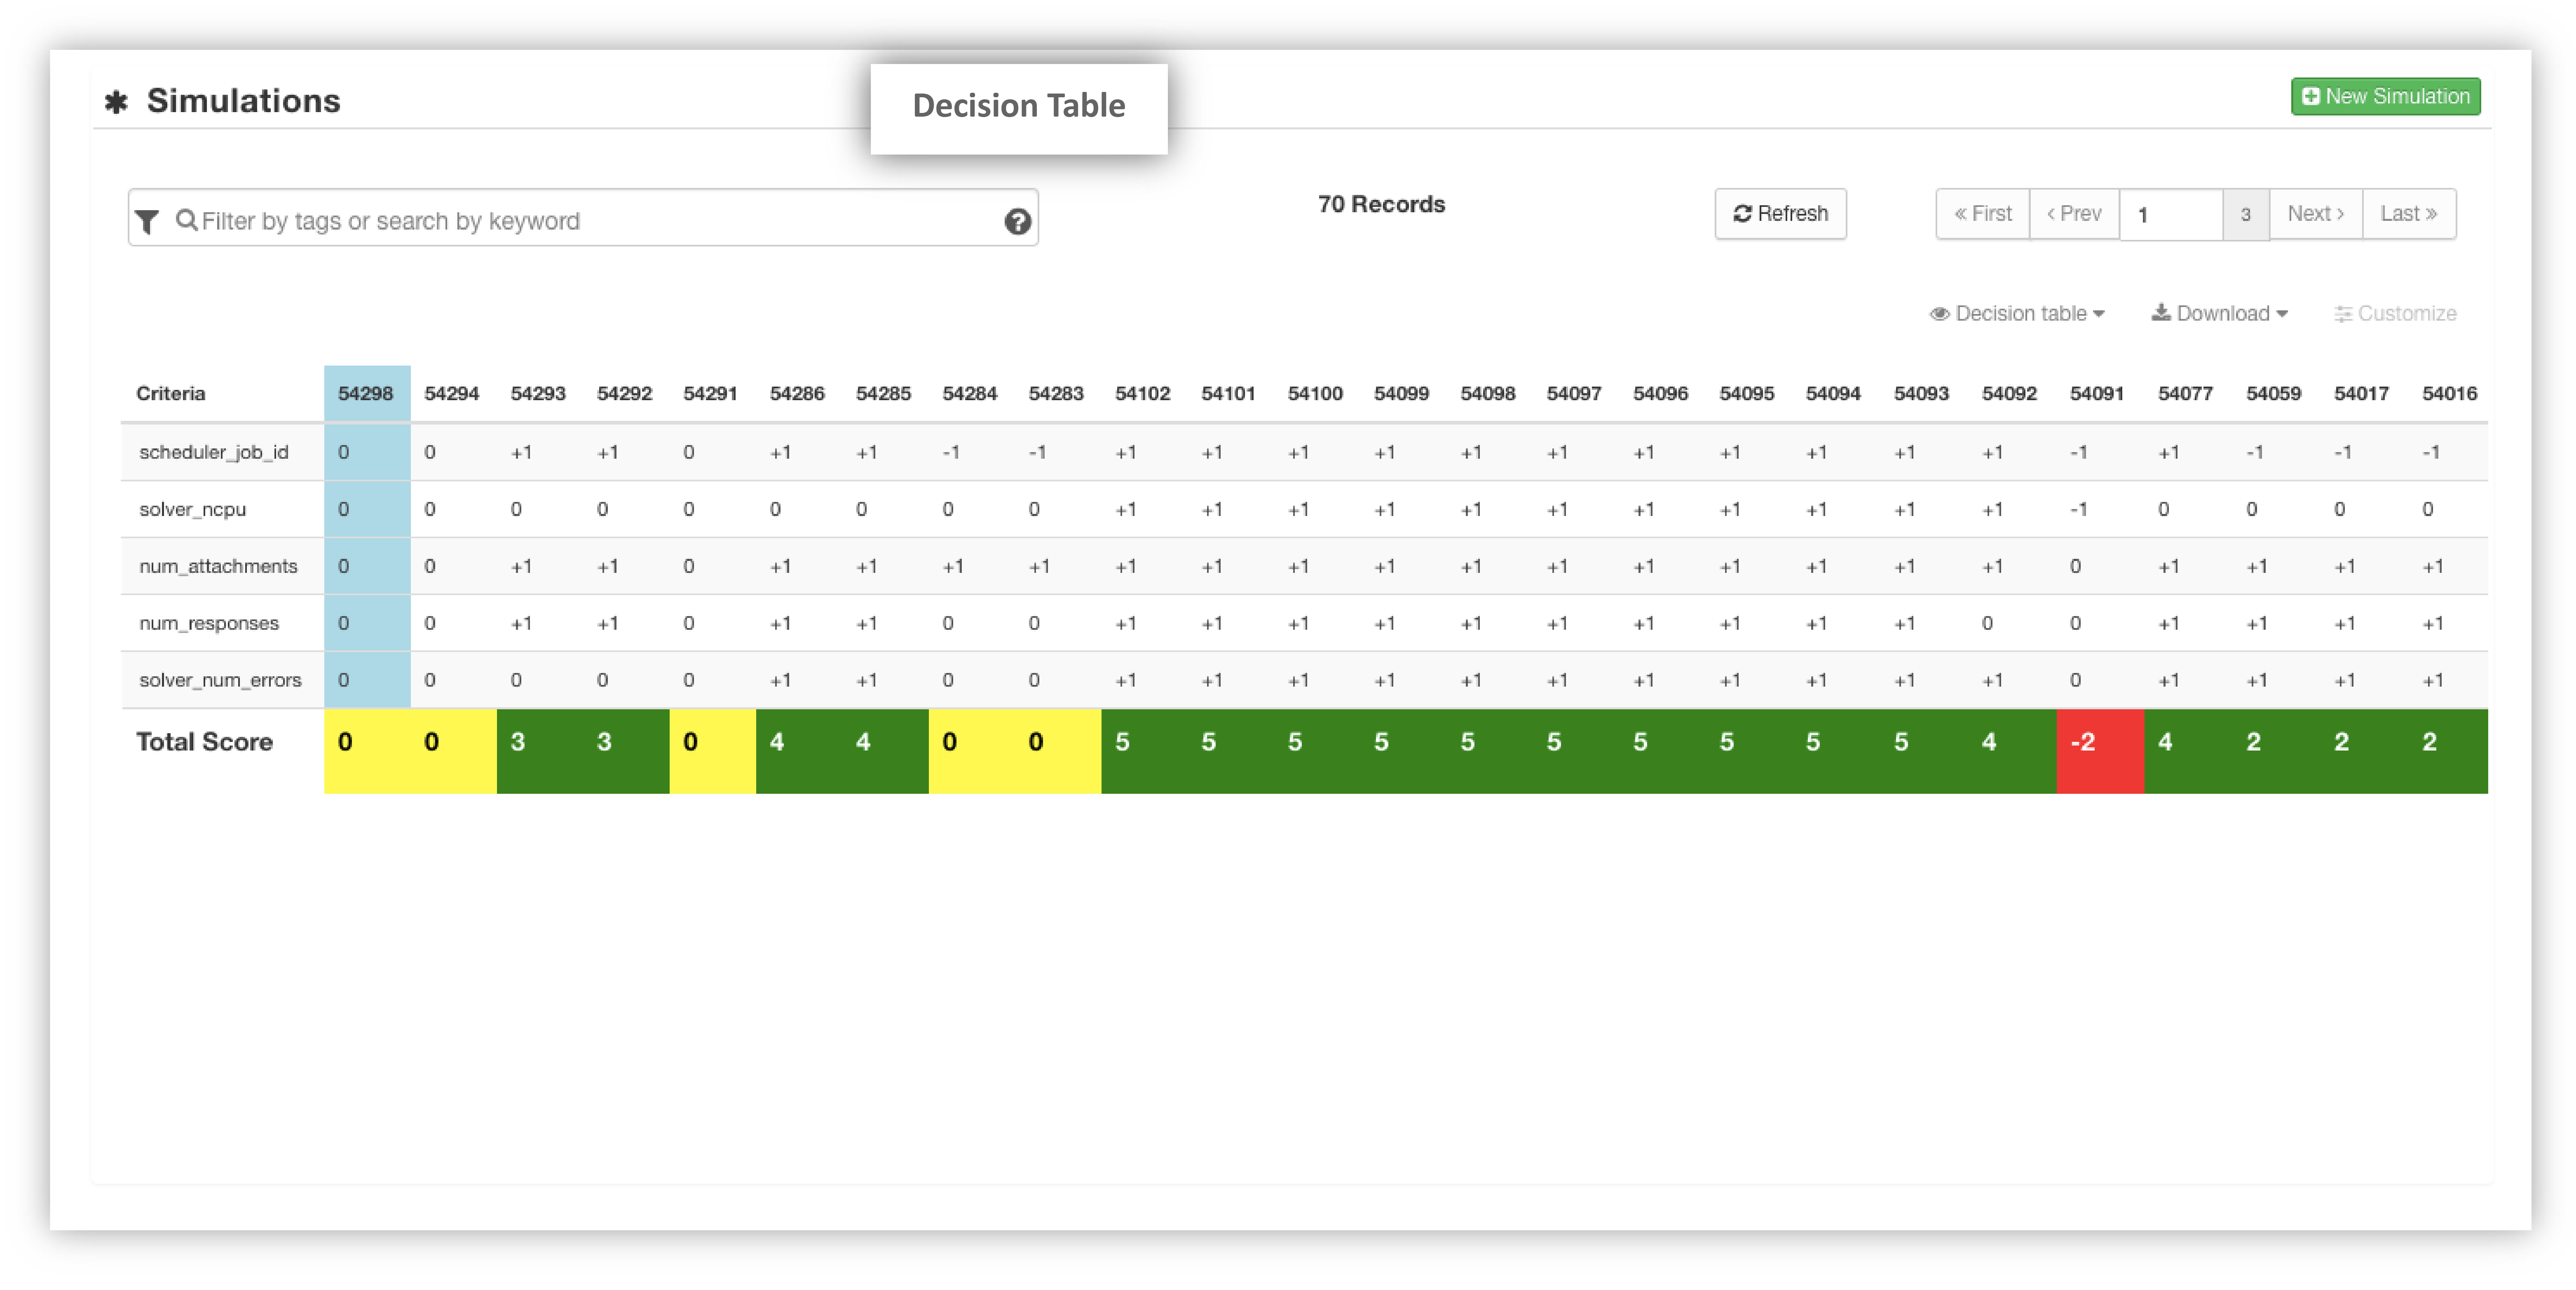
Decision tables show actions to perform based on table conditions.
Decision Table
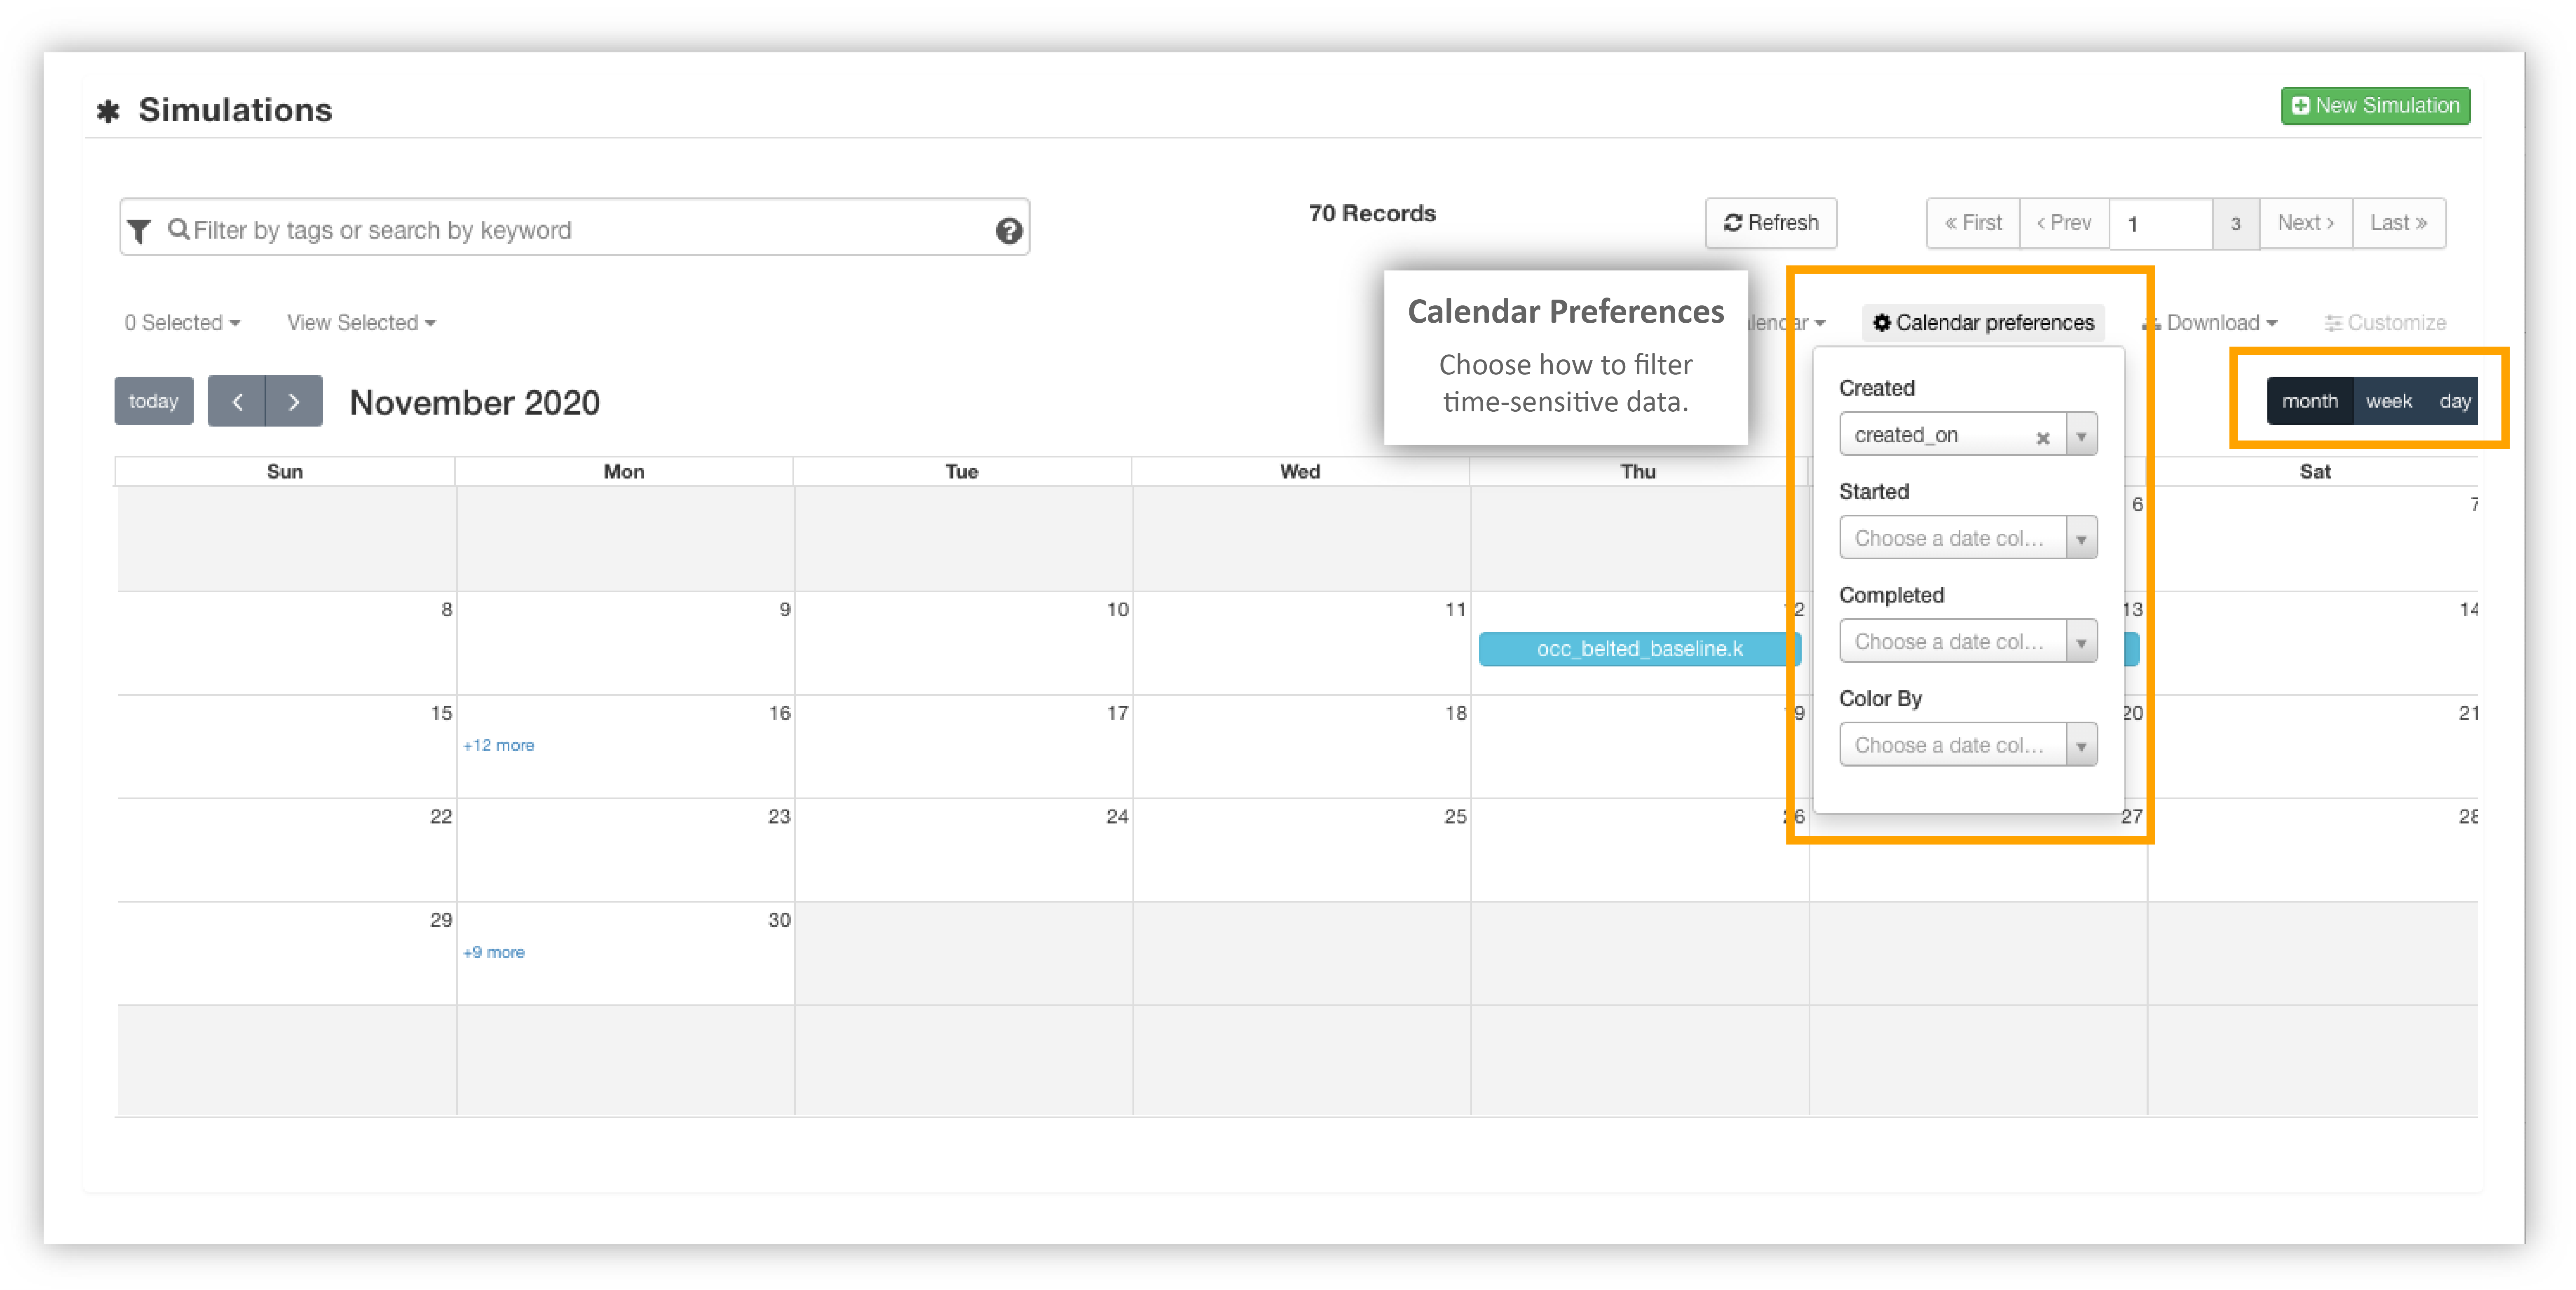
The calendar view mentioned earlier has some extra helpful settings. Change calendar preferences based on dates View the calendar via monthly, weekly or daily. Dates are based on data columns.
Image
11.3. Tables in Simlytiks
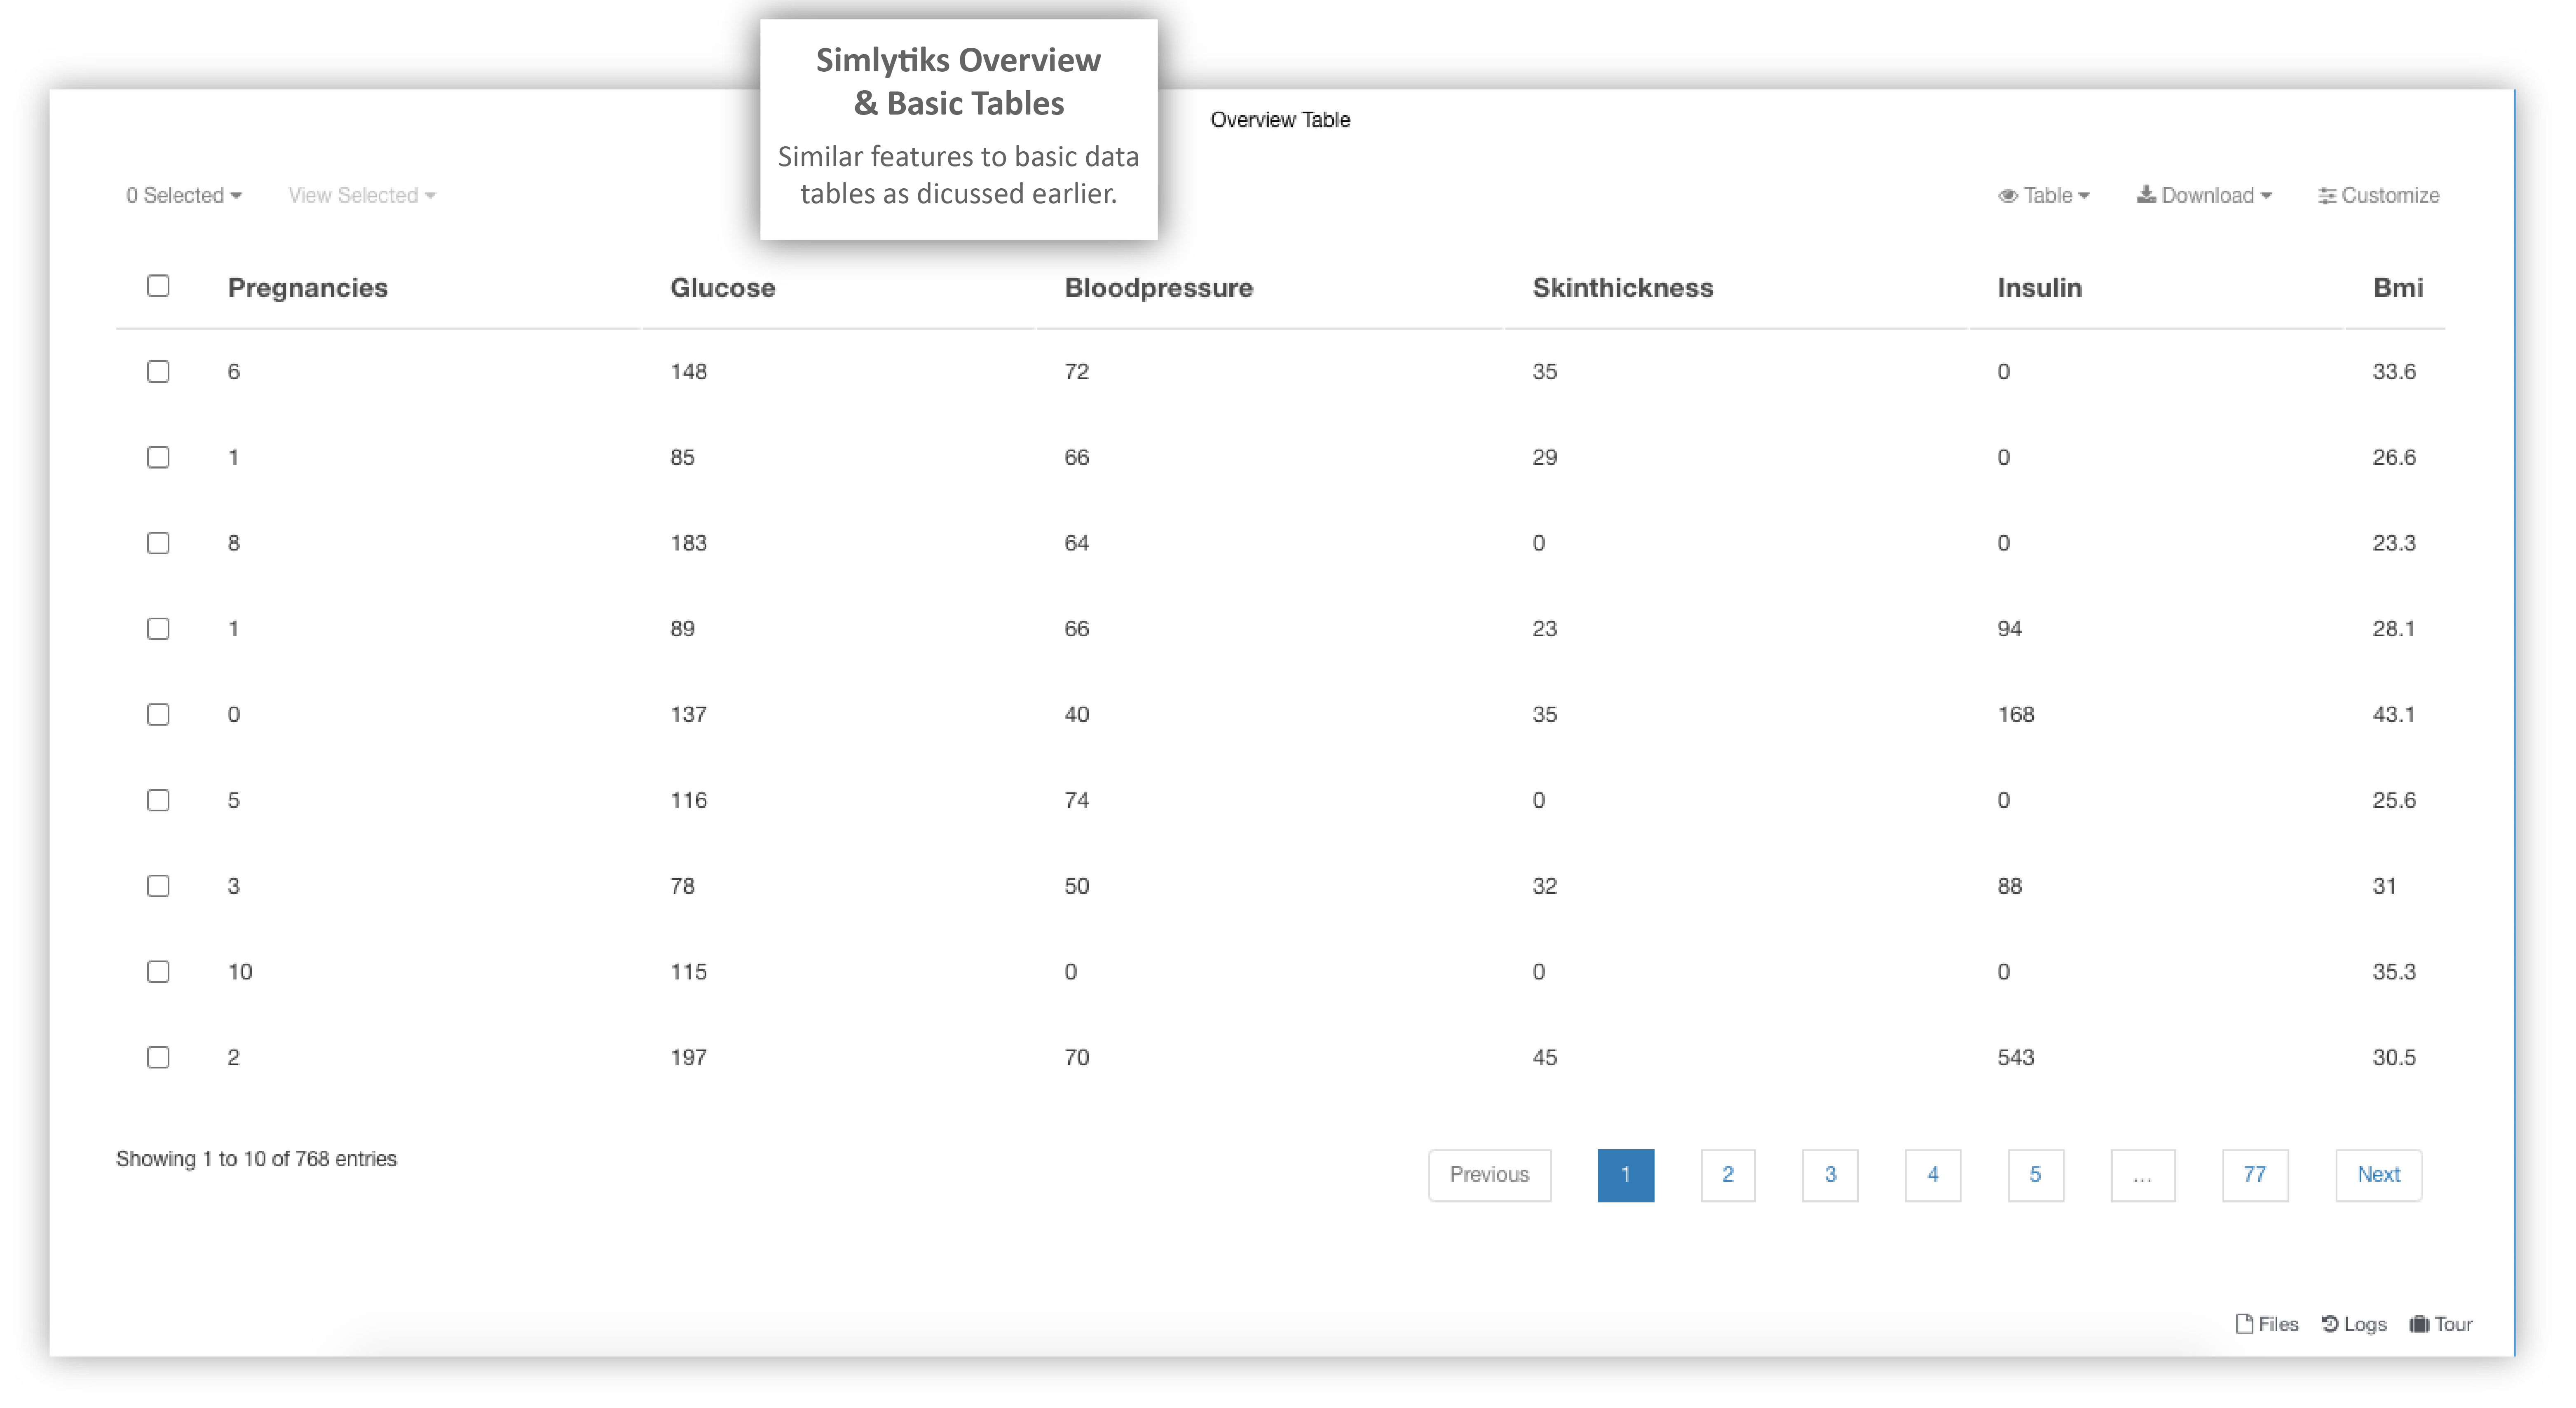
Overview Tables and Basic Table visualizers will have the similar table features as previously discussed. We’ll see an overview table upon opening a new dataset in Simlytiks.
Simlytiks Overview
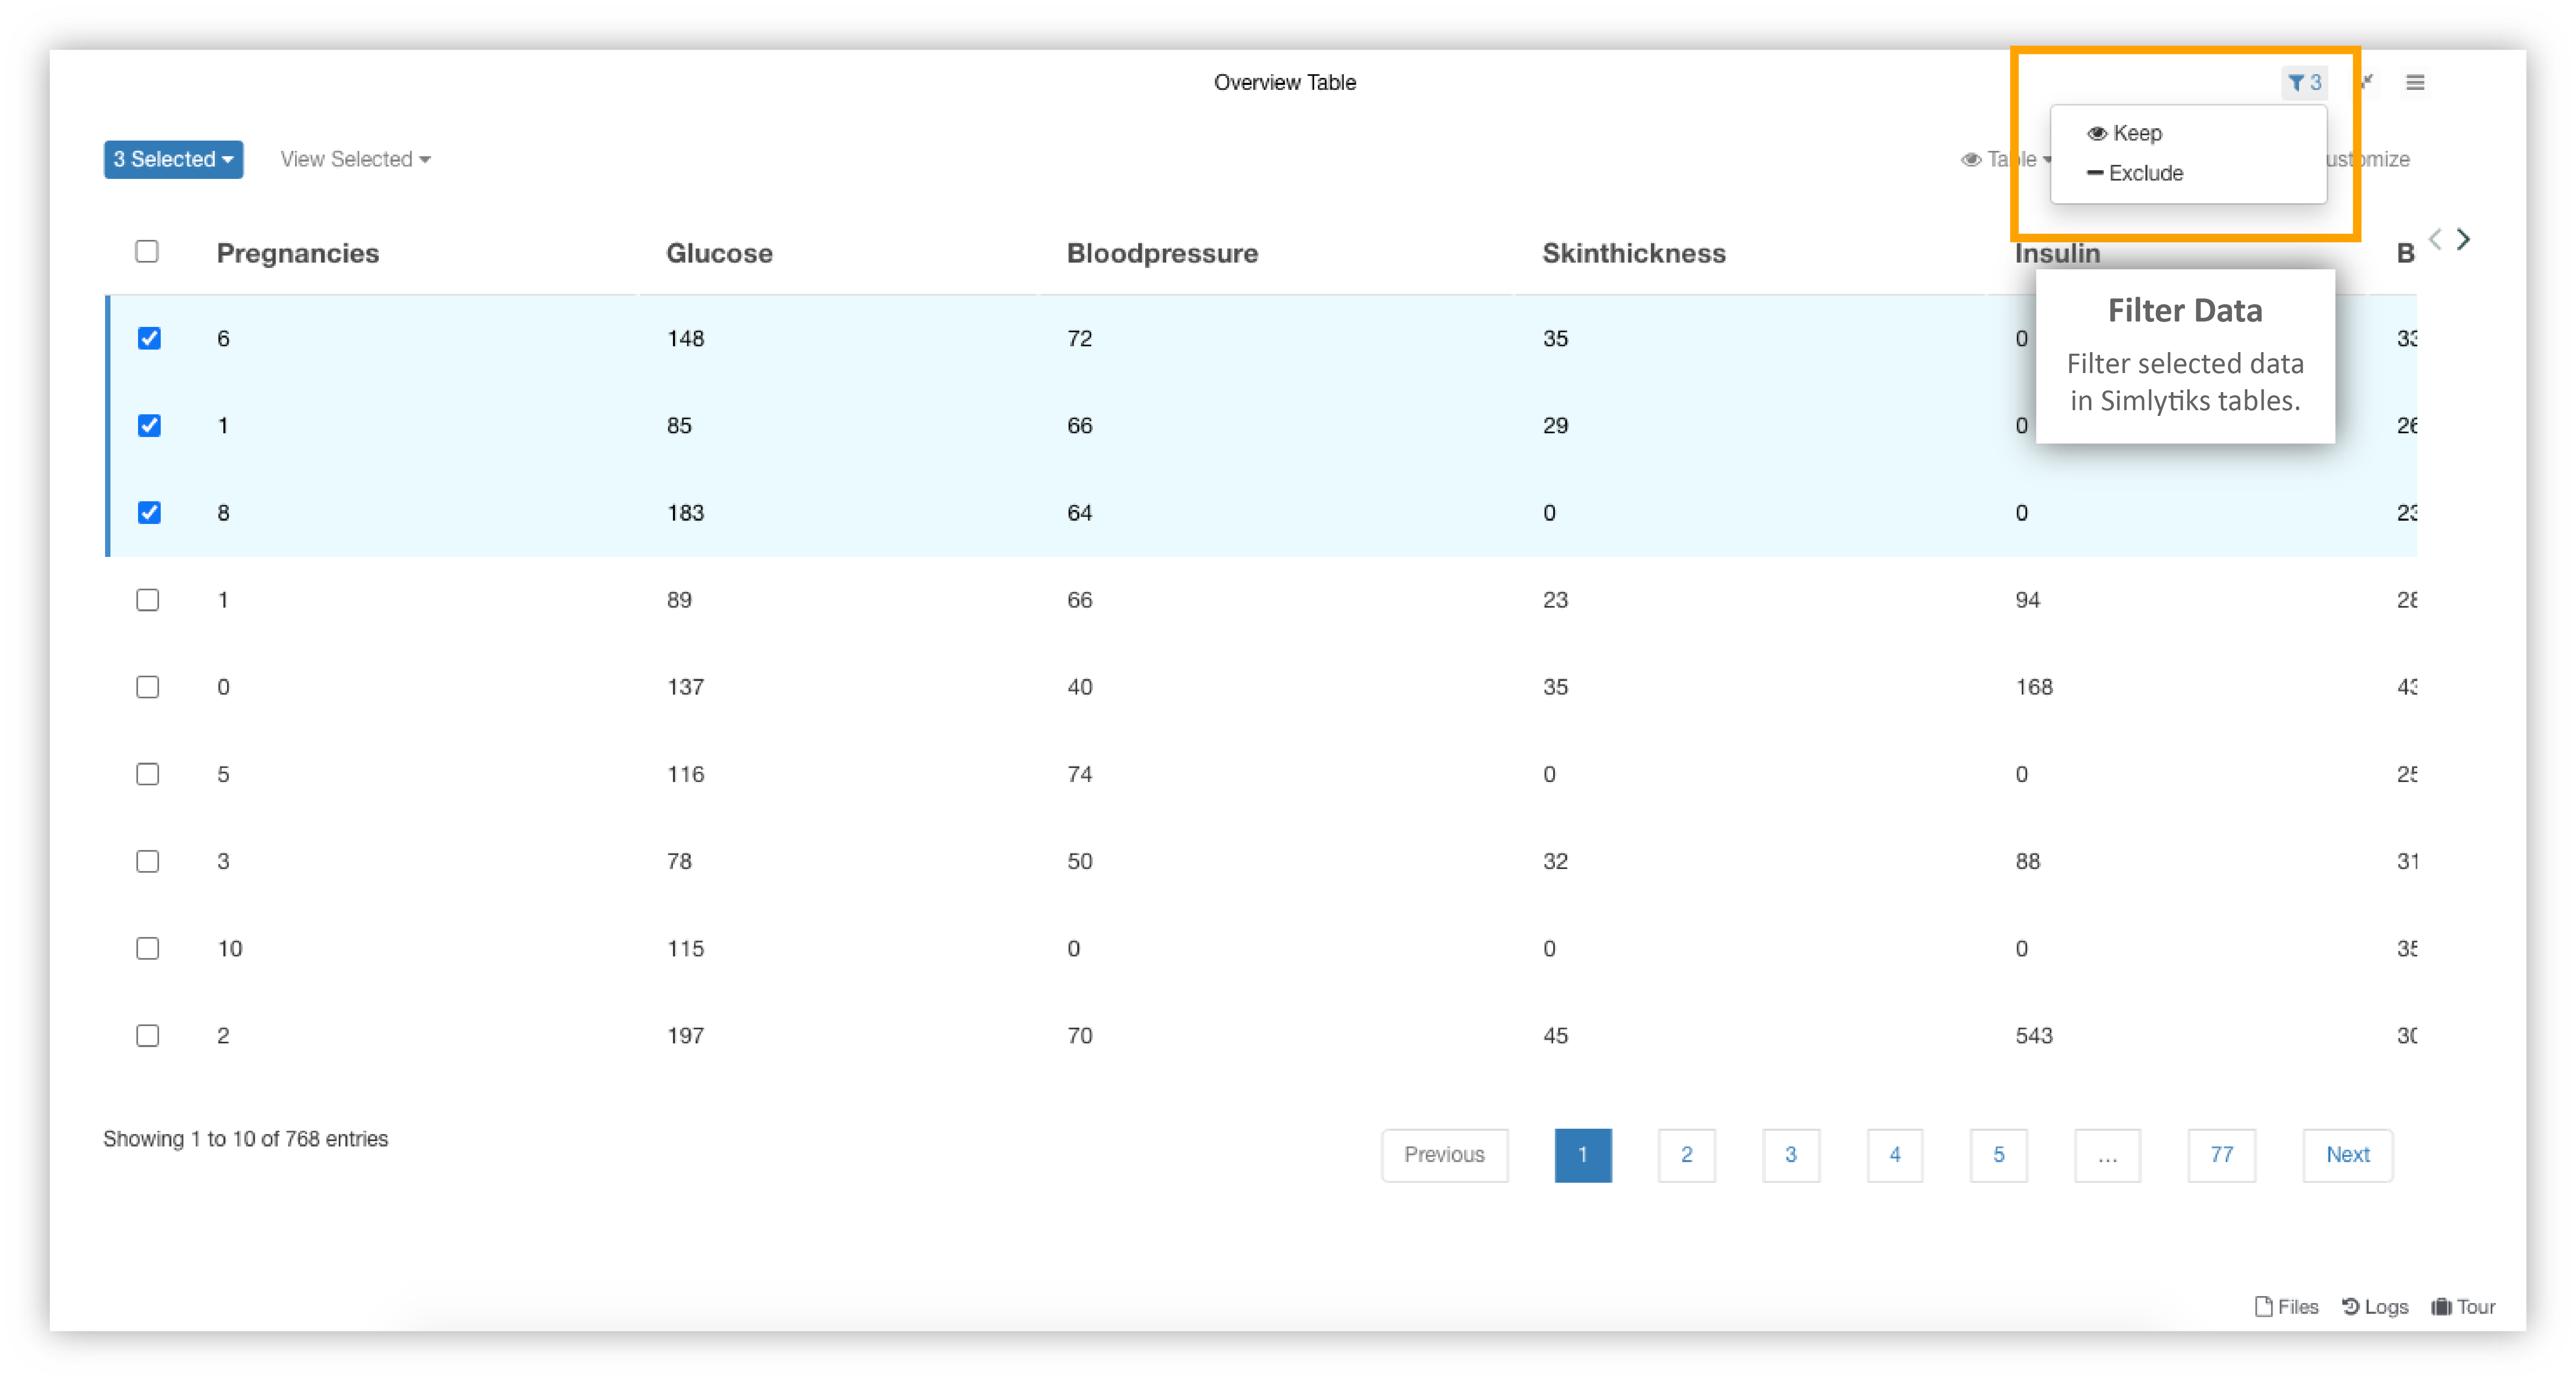
When selecting in Simlytiks tables, we can filter the selected data.
Filter Data in Simlytiks
Not only can we find Difference and Decision tables under table view, but we can also set them up under the visualizer menu.
Simlytiks Difference and Decision Tables
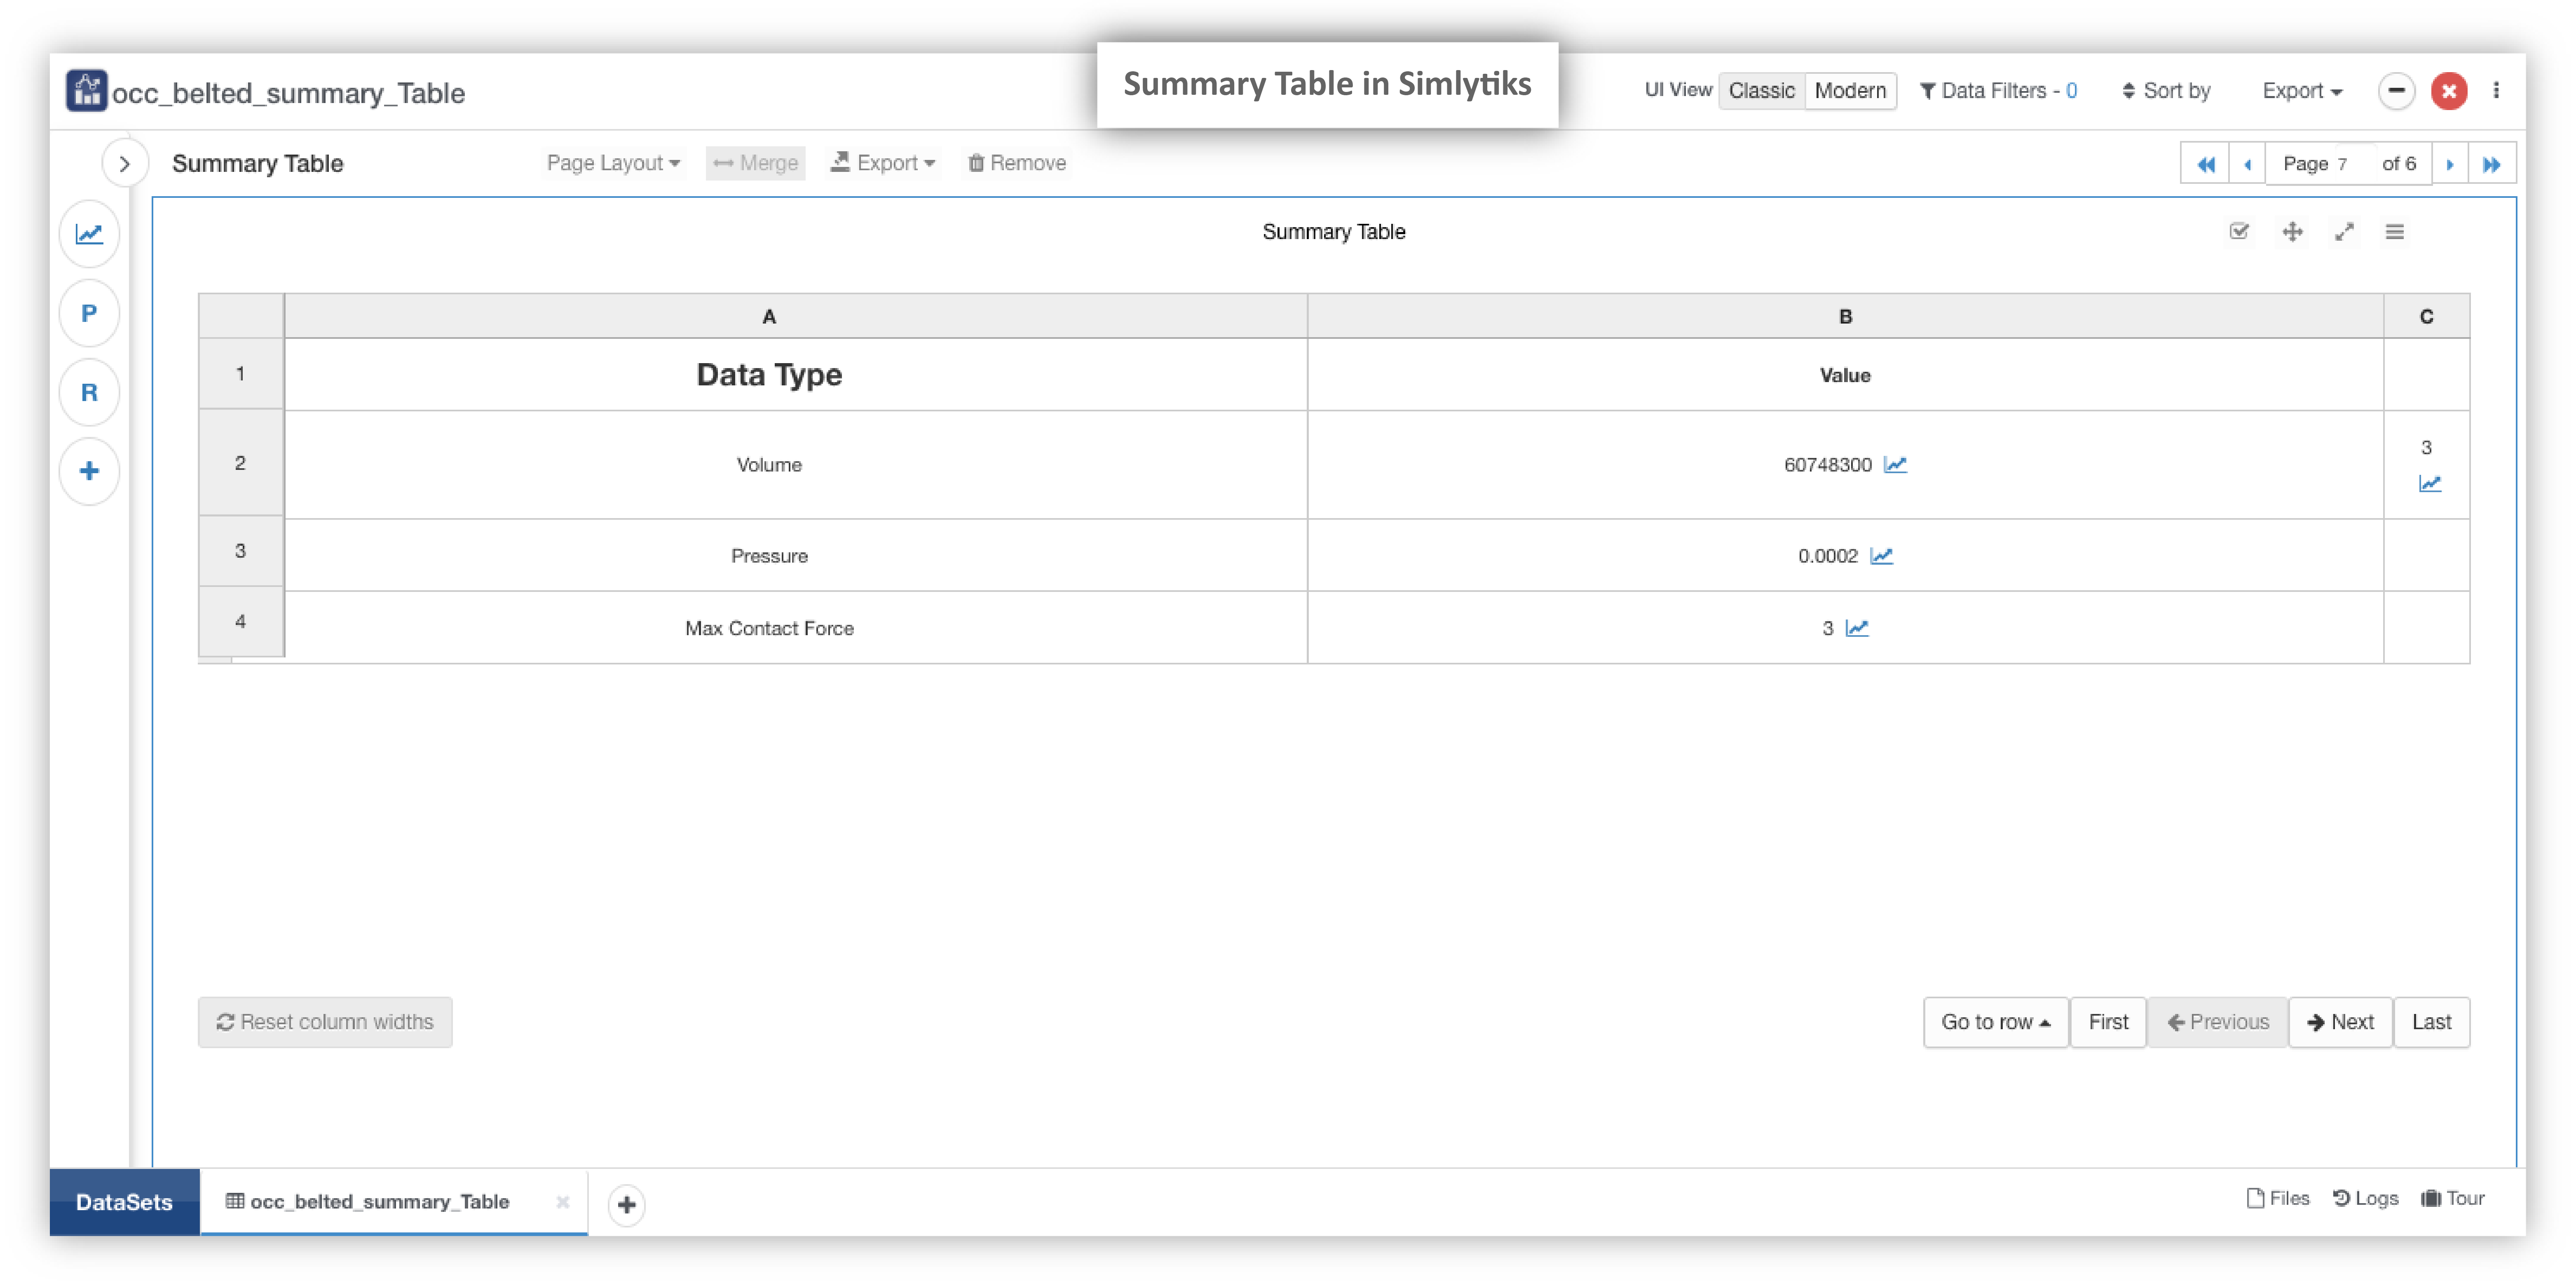
Summary tables are unique visualizers in Simlytiks. Each cell can contain complex data such as curves, visualizers or images. These tables are a great way to get a full view of our data under one visualizer window.
Simlytiks Summary Table
For additional questions about how to navigate the d3VIEW platform, please feel free to email our team at: support@d3view.com or visit our FAQs page in the d3VIEW documentation.