4. Physical Tests
“Physical Tests” supports storing, organizing and visualization of experimental data. Keep your “real-world” testing data all in one place, manage all of your experimental results and compare them with other records including your simulations.
What Will Be Covered
- Importing New Tests
- Exploring Contents of Tests
- Comparing Tests with other Records
Accessing
Open the application menu at the top left corner, and click on the Physical Tests icon or name to navigate to the page.
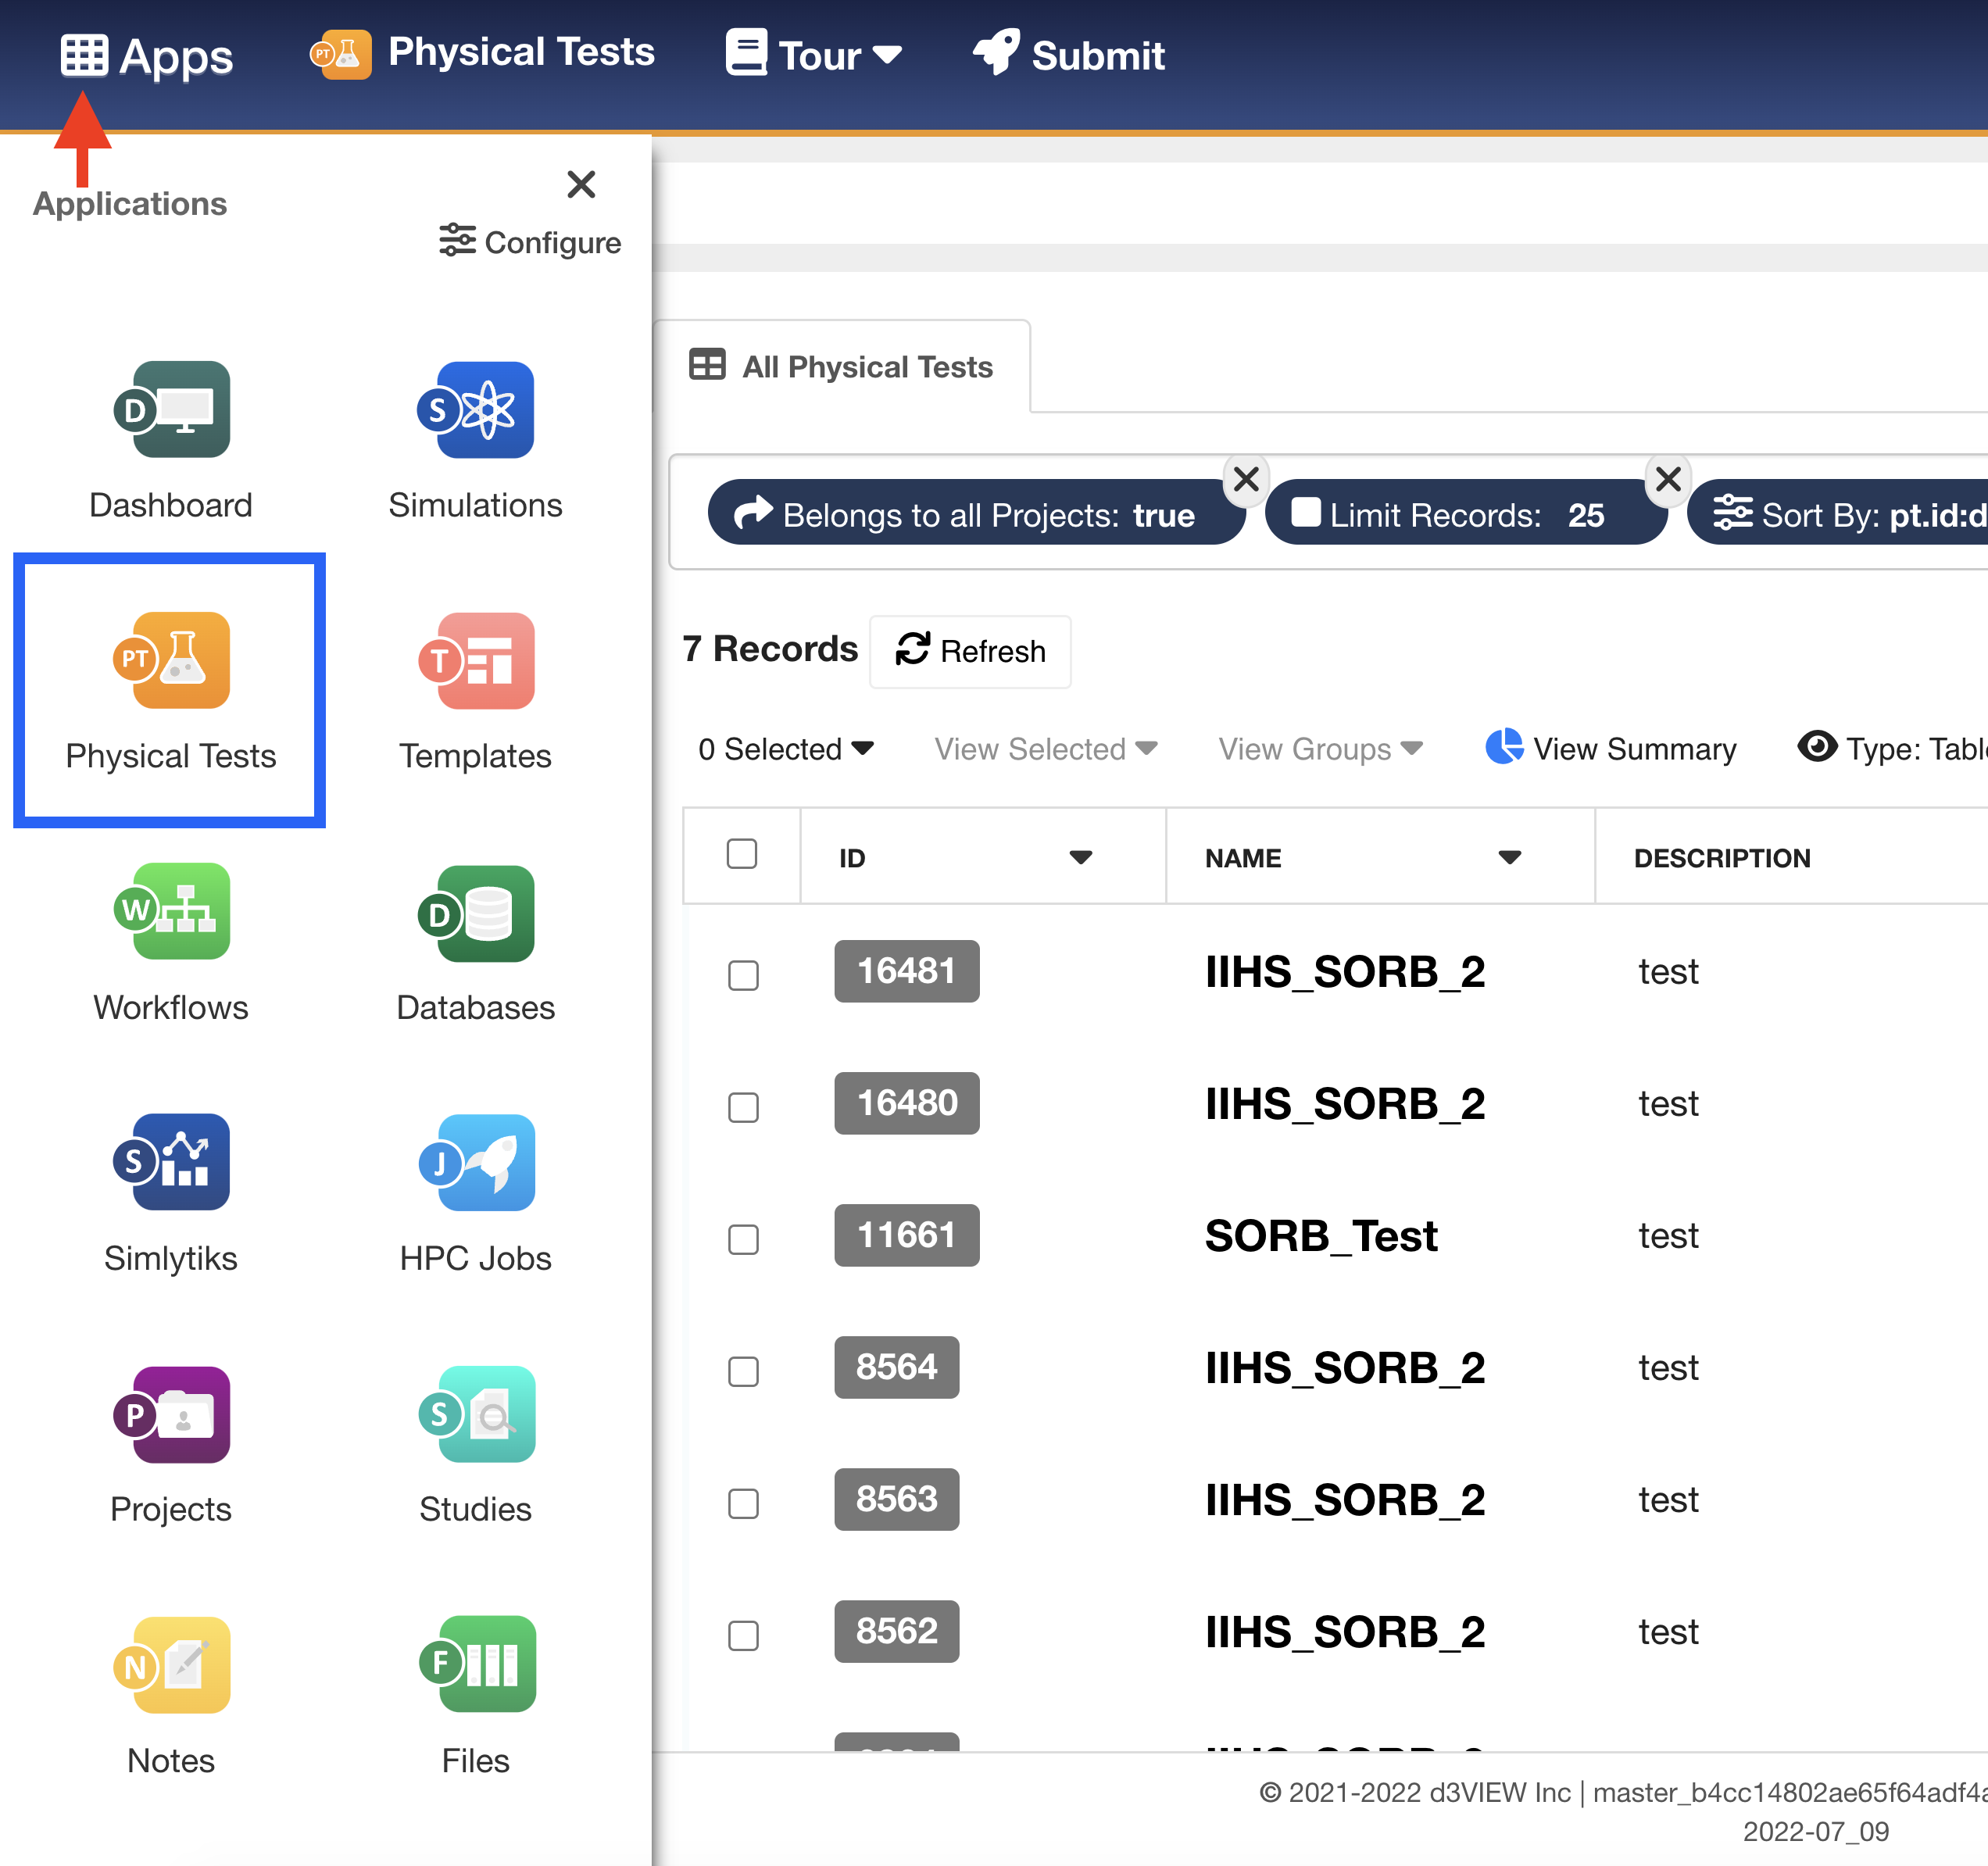
Access Physical Tests Page
4.1. Importing New Tests
Importing new tests is fairly simple. In order to get the most out of your physical tests with the platform, make sure to stick to these recommended file sources.
Importable files for Physical Tests include:
- Excel
- CSV
- BMS
- SSV
- DAT
Importing One
Click on “New Test” in the upper right-hand corner of your screen on the Physical Tests main page.
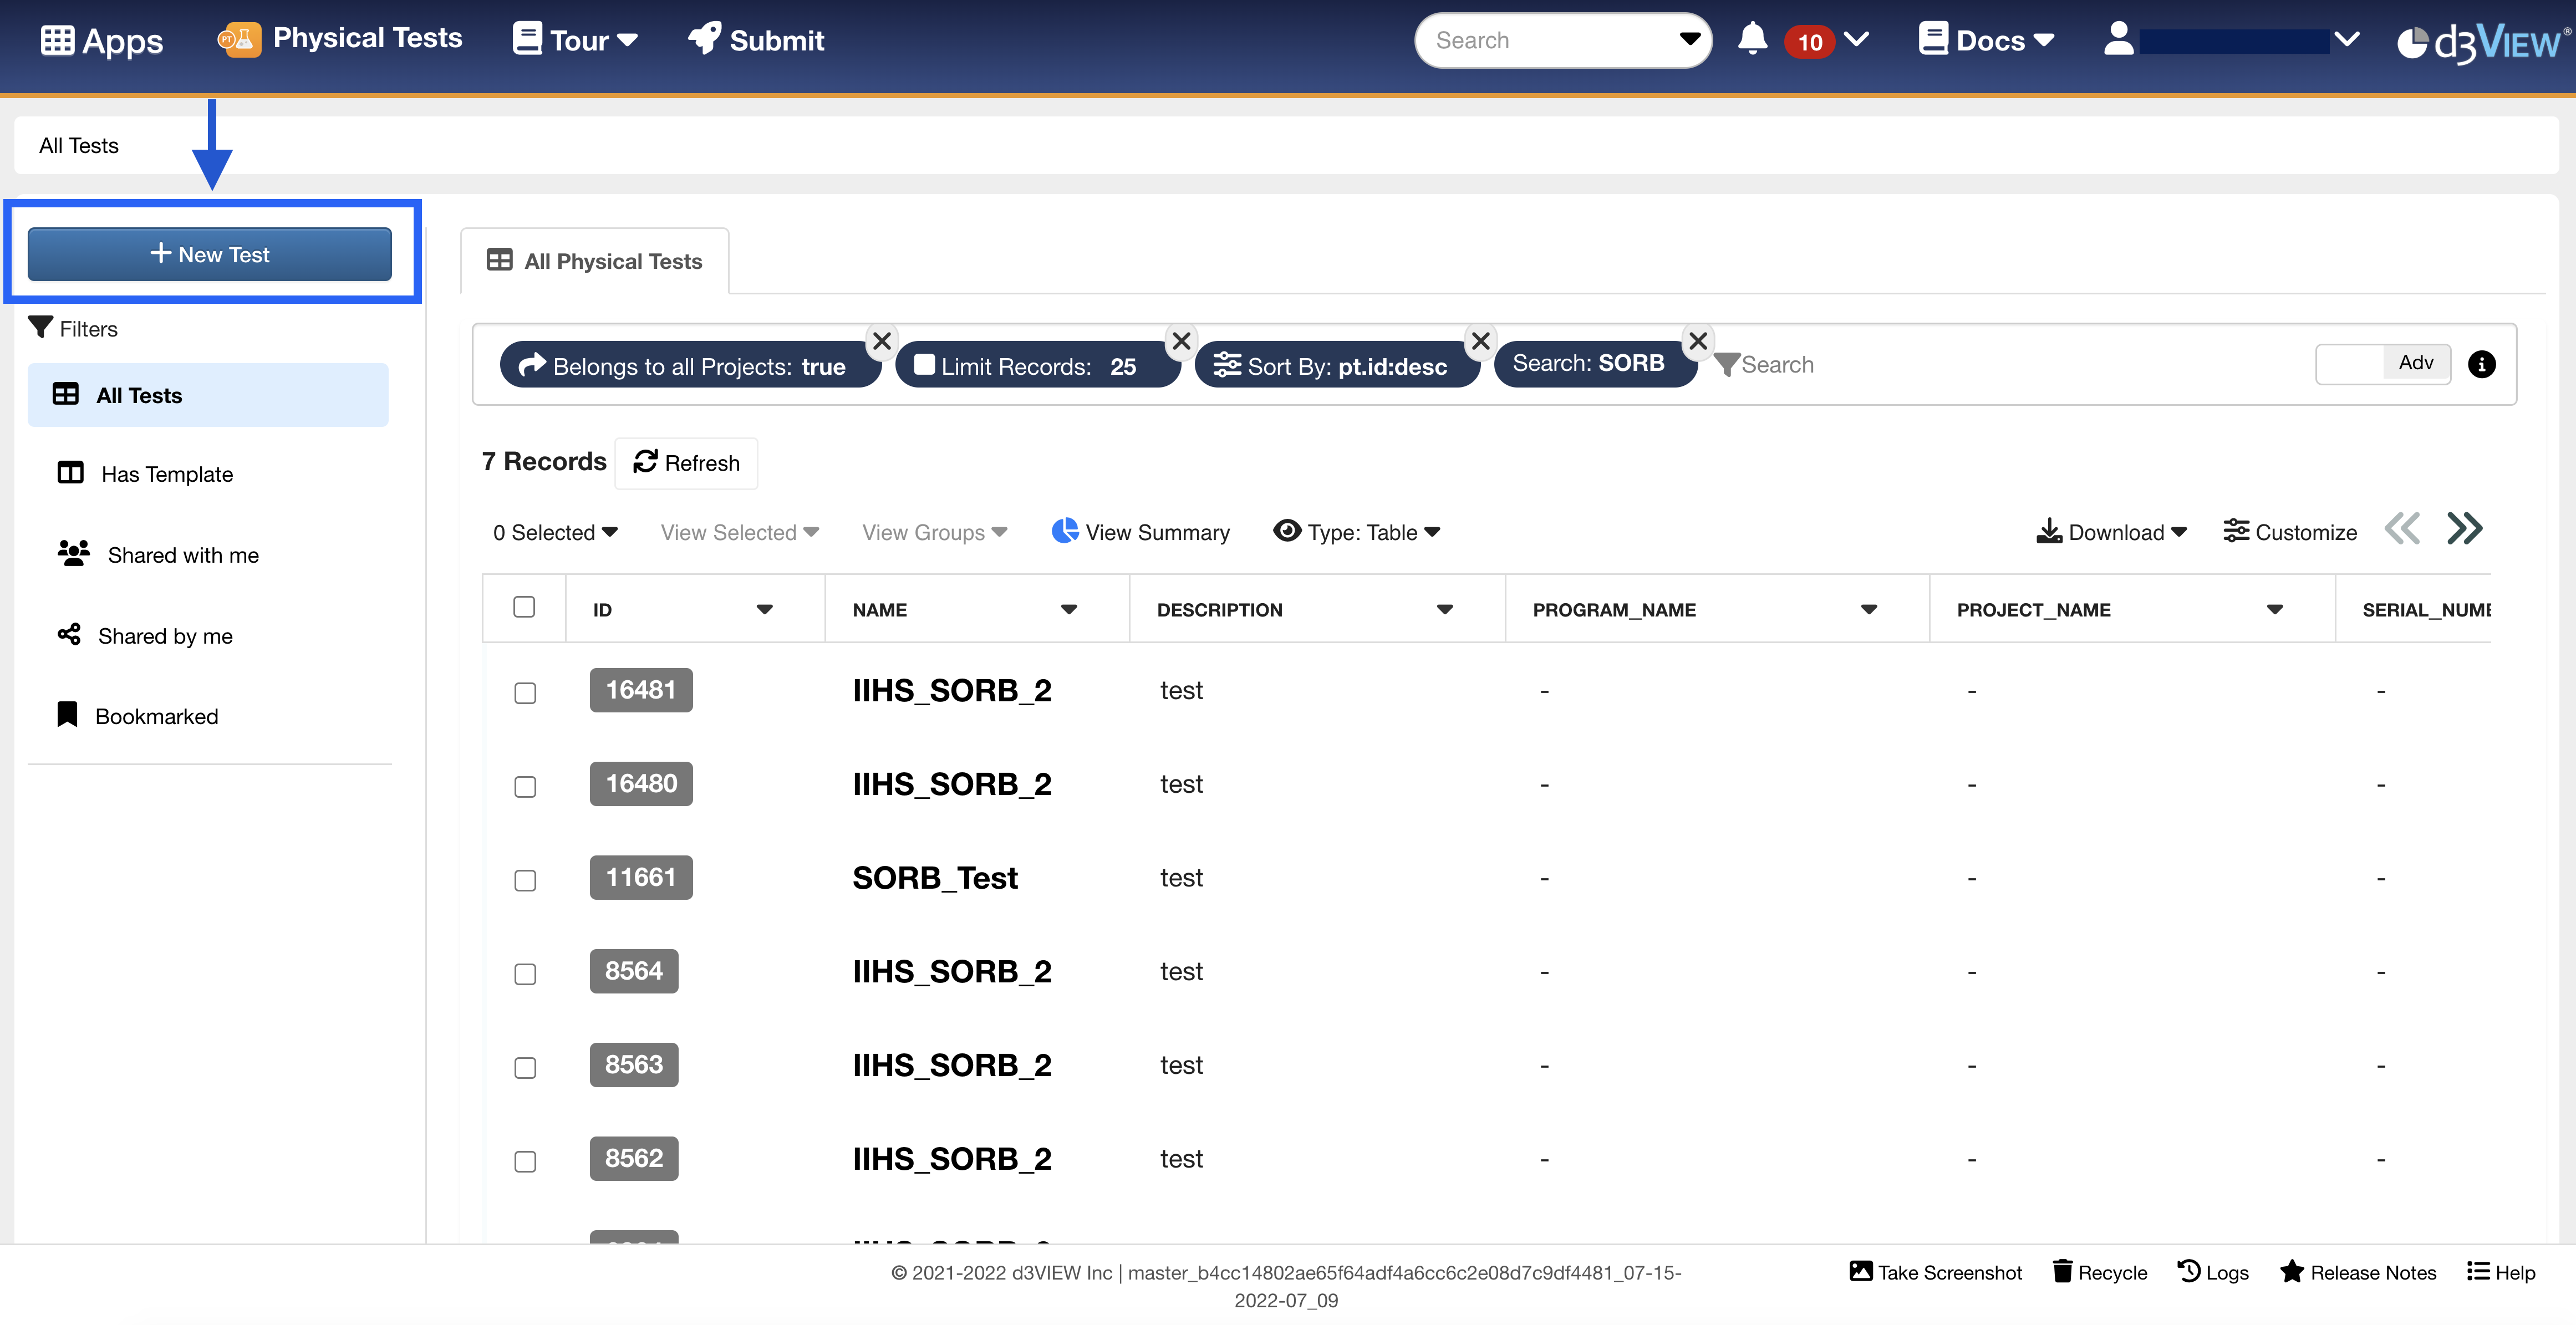
Figure 1: Opening New Test Window
Upload a file or multiple files from your computer by drag-and-dropping or clicking on the orange dotted line box (1). You can also browse the server files (2) by clicking on the associated link. Multiple files will upload as one test on this tab.
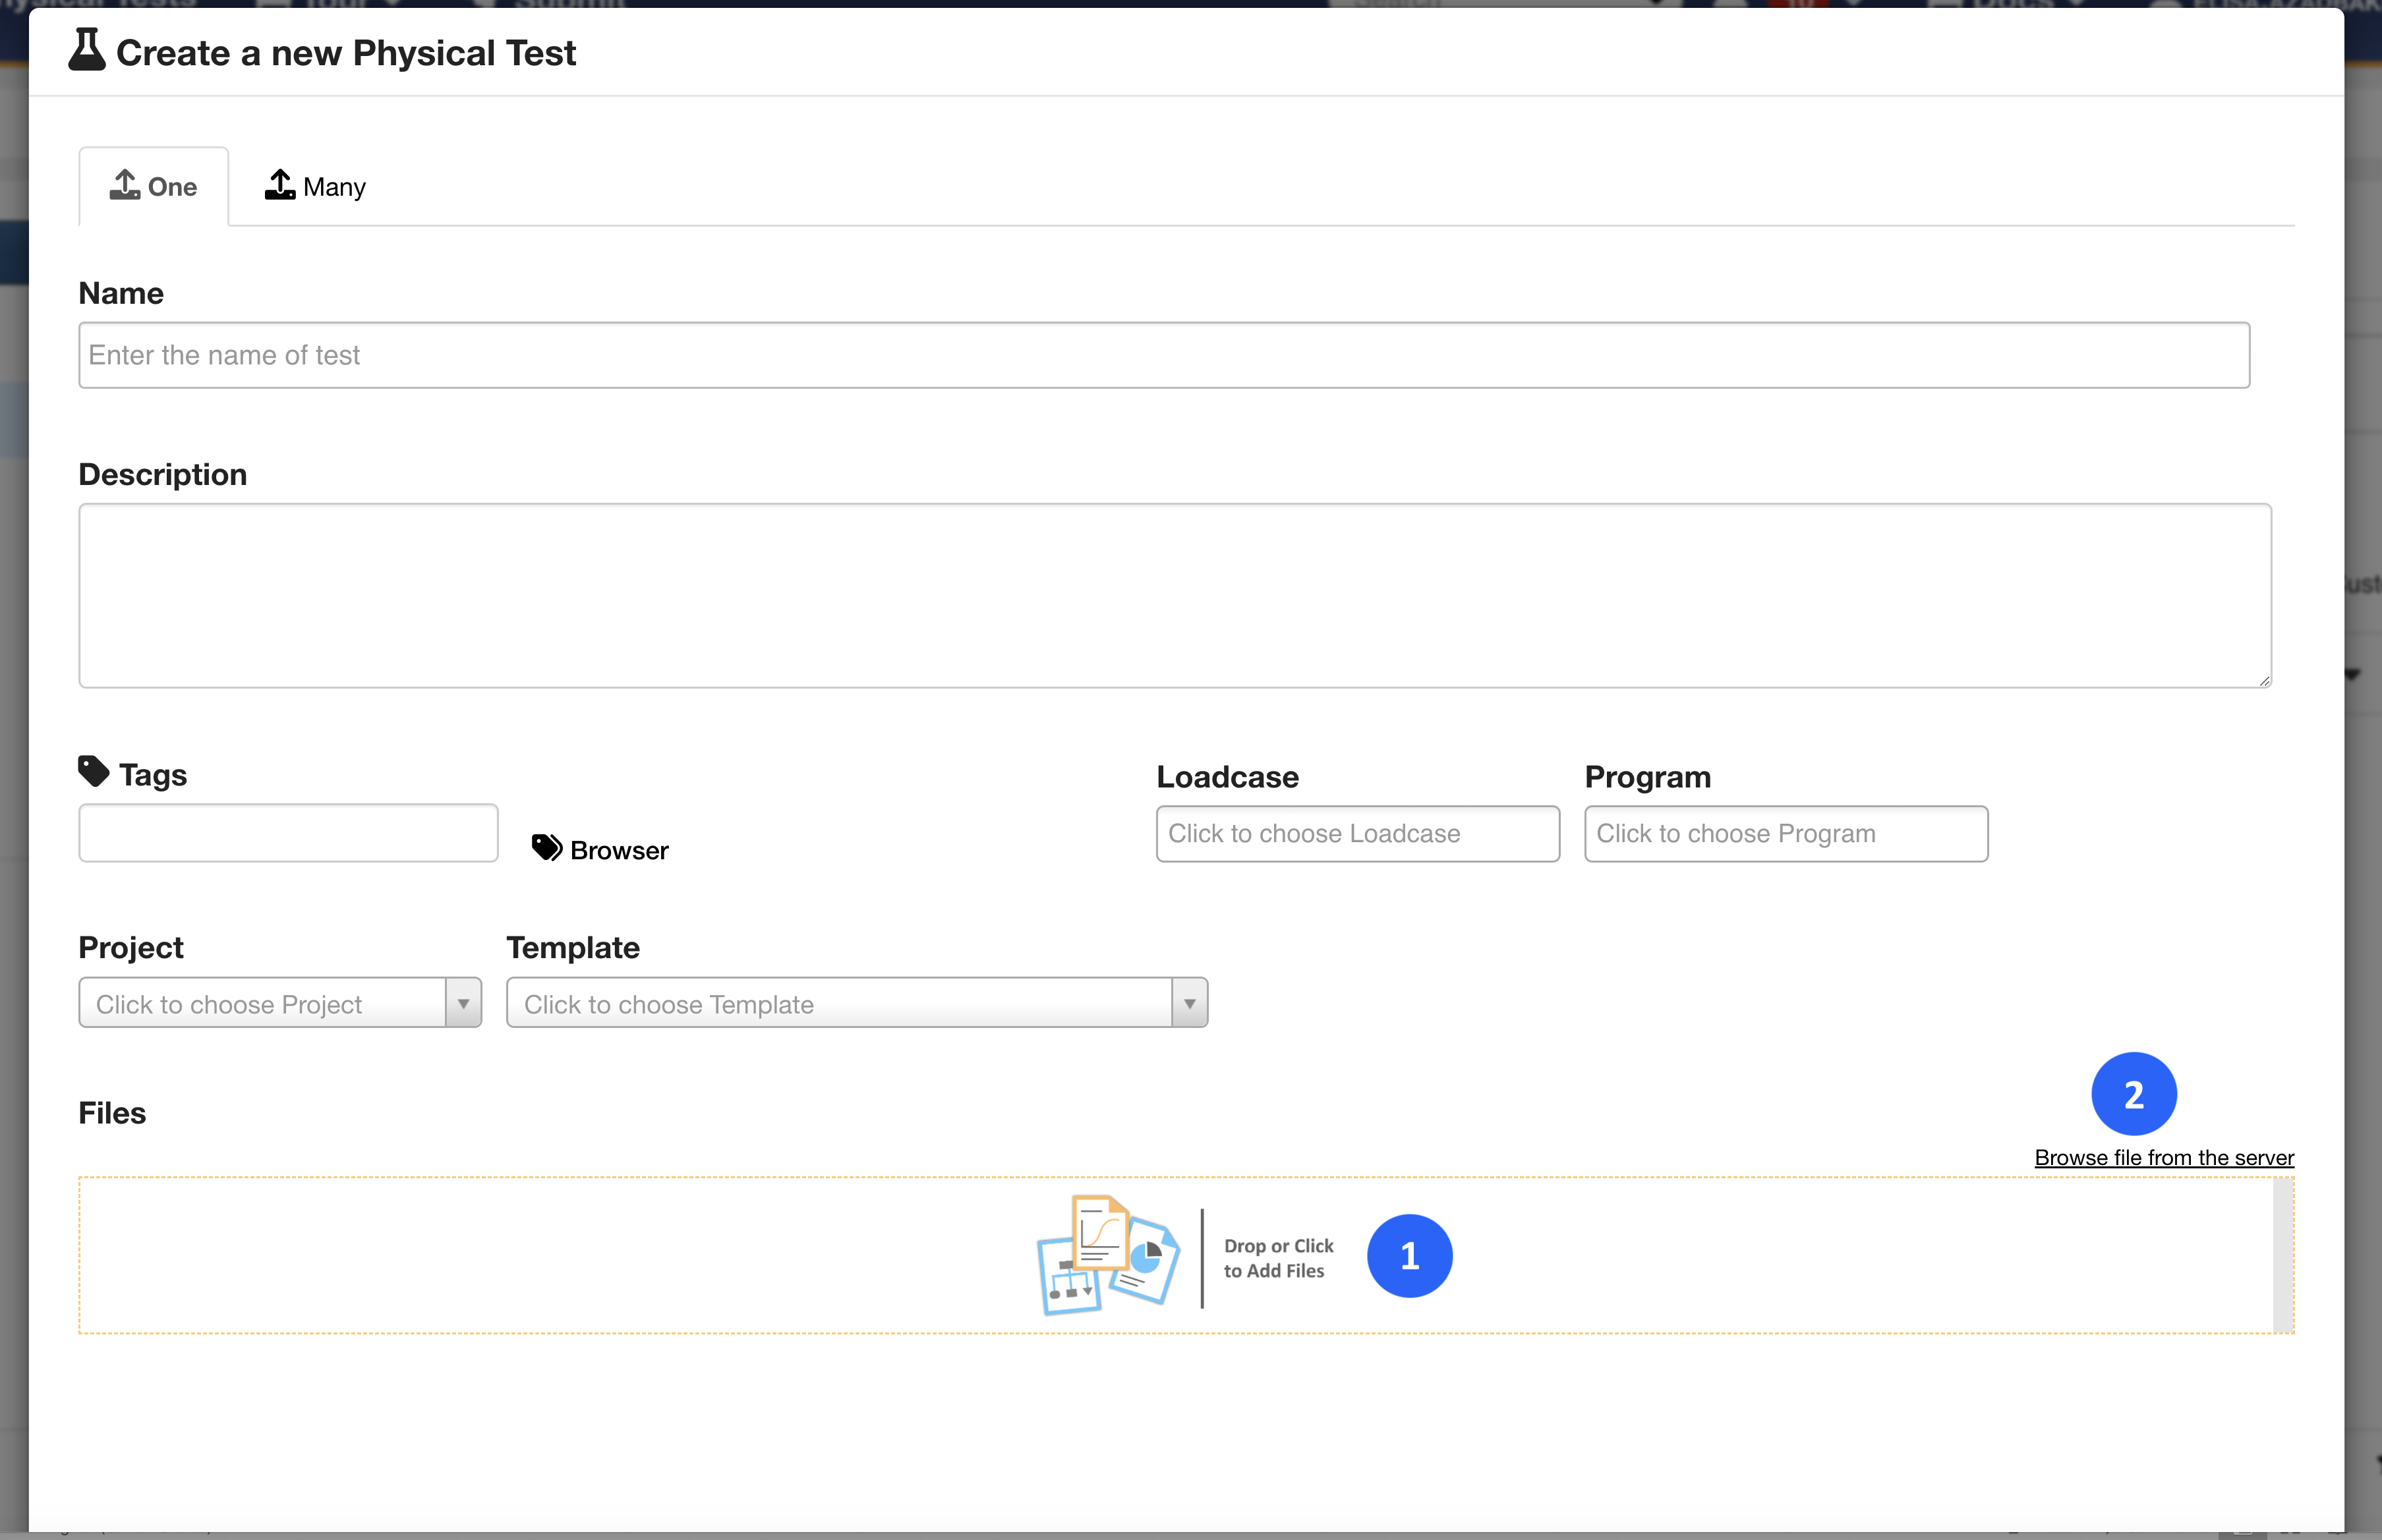
Figure 2: Upload Files from Computer or Server
Clicking on “Browse Server Files” will open up the following window. Please see the Simulations section to learn more about sifting through these files.
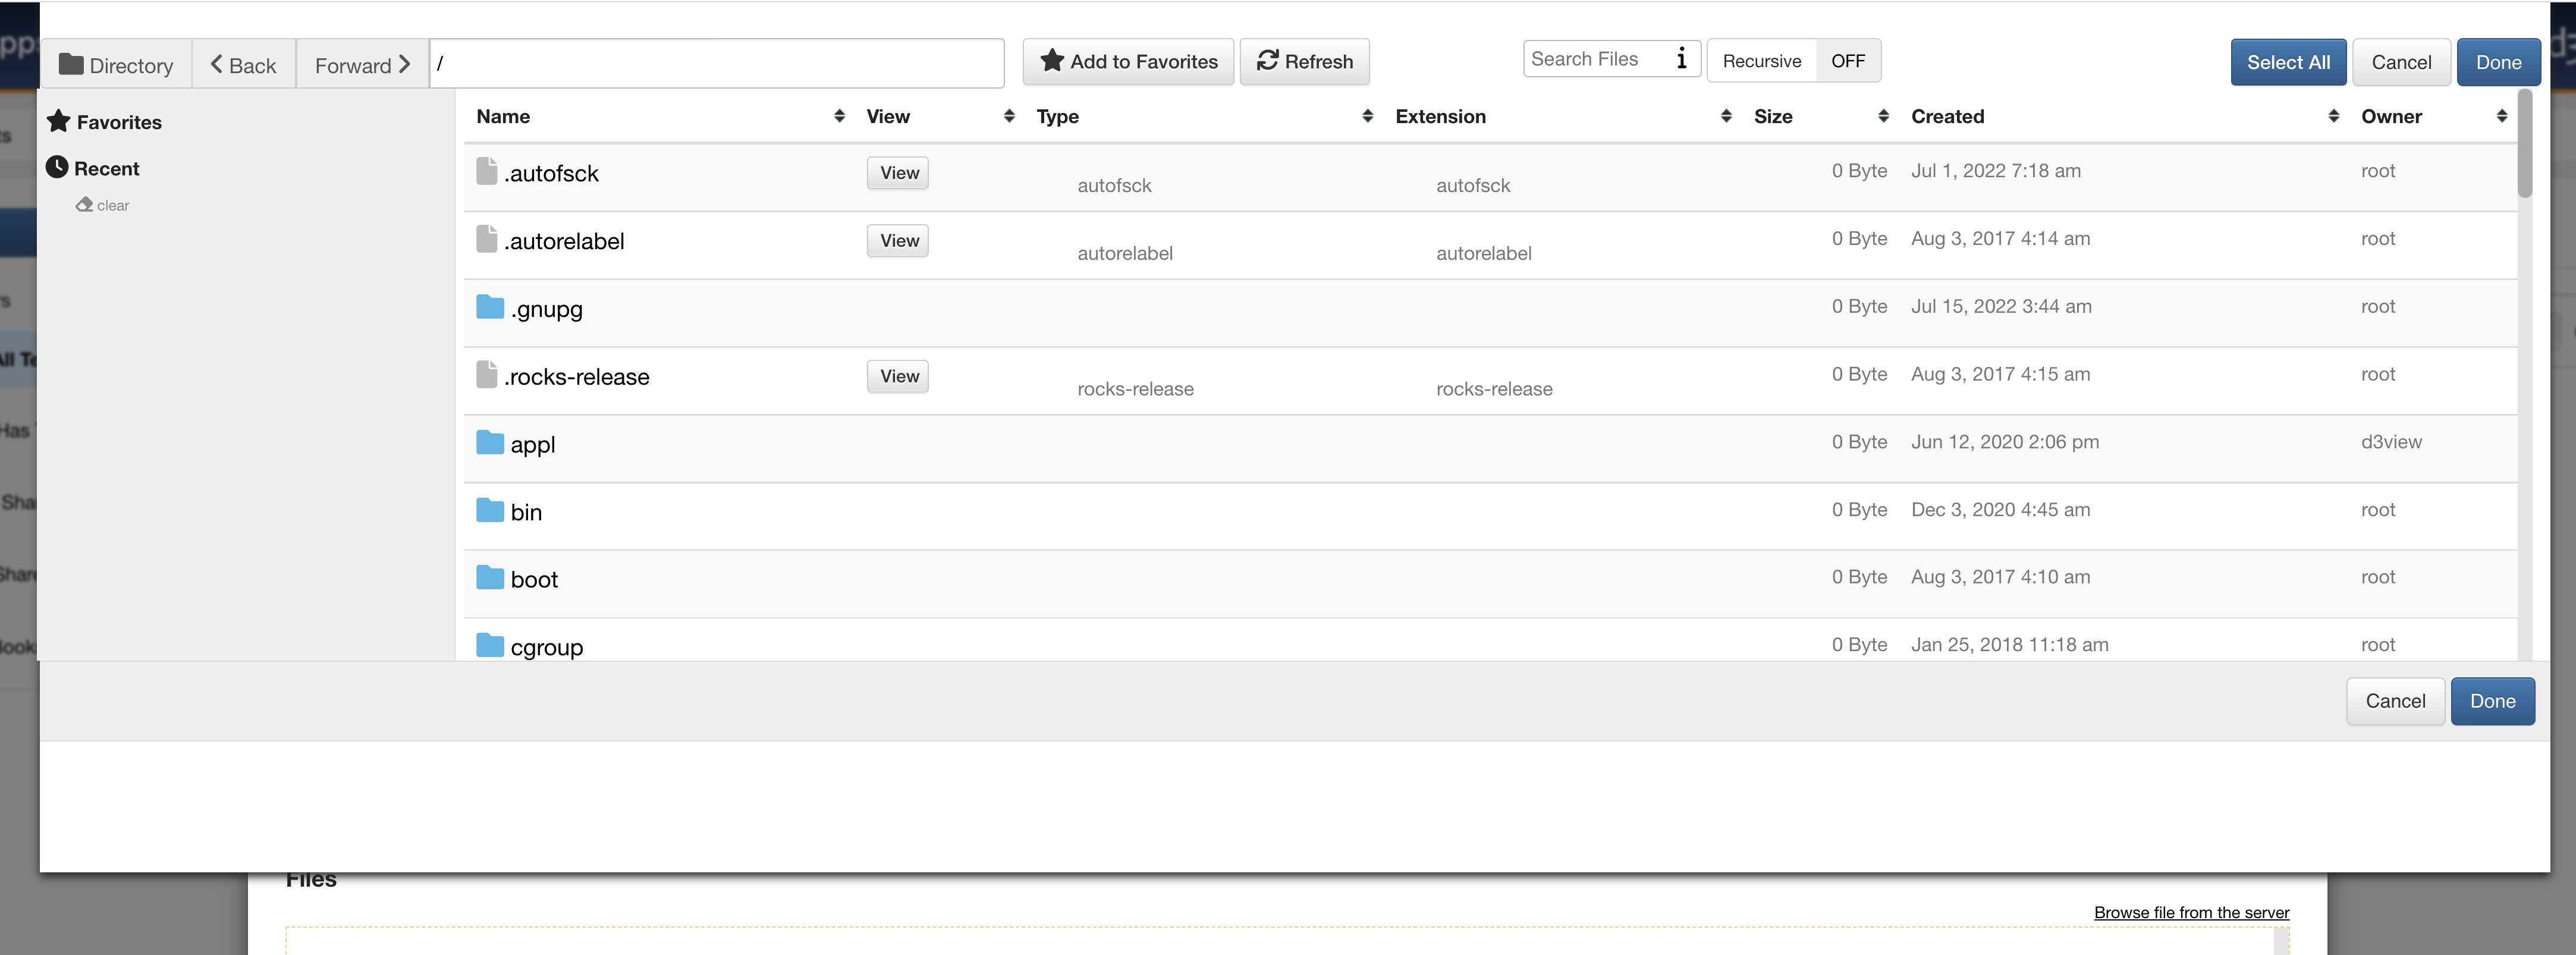
Figure 3: Browse Server Files
Make sure to give your test a name and, if needed, specify the program, loadcase, project or template. d3VIEW provides programs, loadcases and some templates you can select for your test. Once you have set these specifications, click on “Process” to finish the upload.
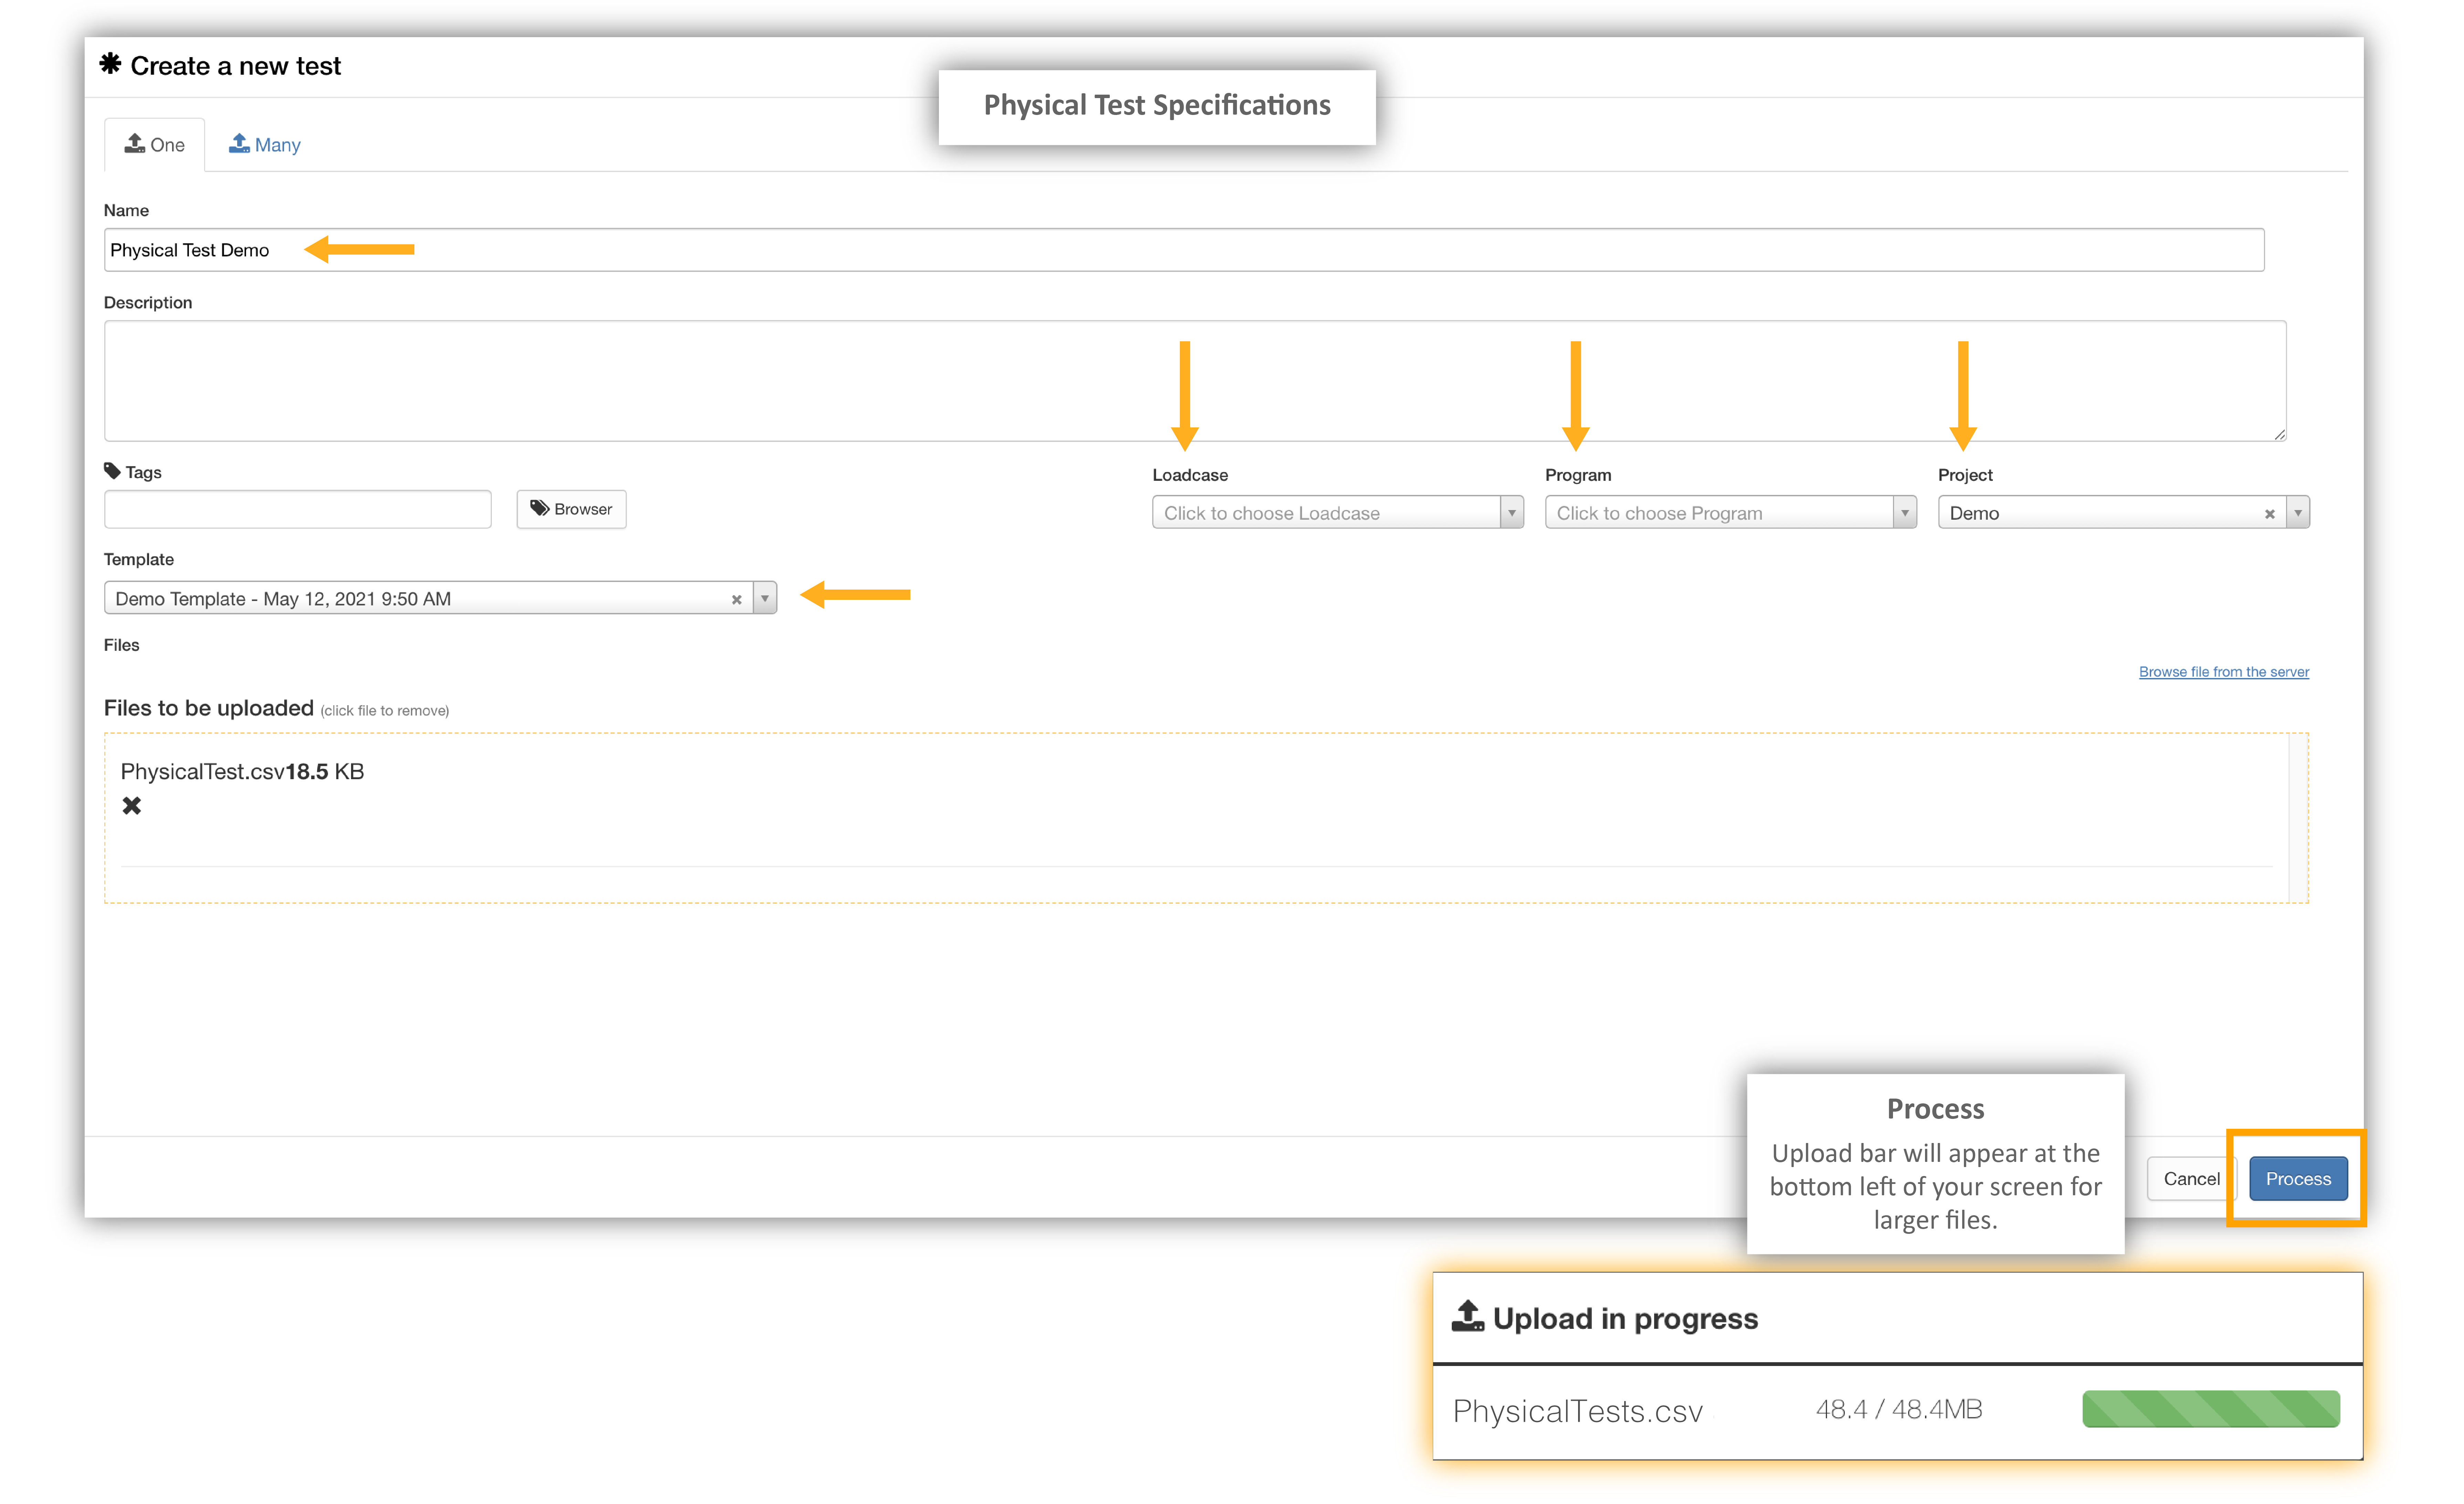
Figure 4: Process Test Import
Importing Many
If you have multiple tests with in the same file or with the same specifications, you can use the “Many” to upload them more efficiently. Upload your files same as before by drag-and-dropping, clicking or exploring server files. Since you are uploading multiple tests, you will not be able to specify any names.
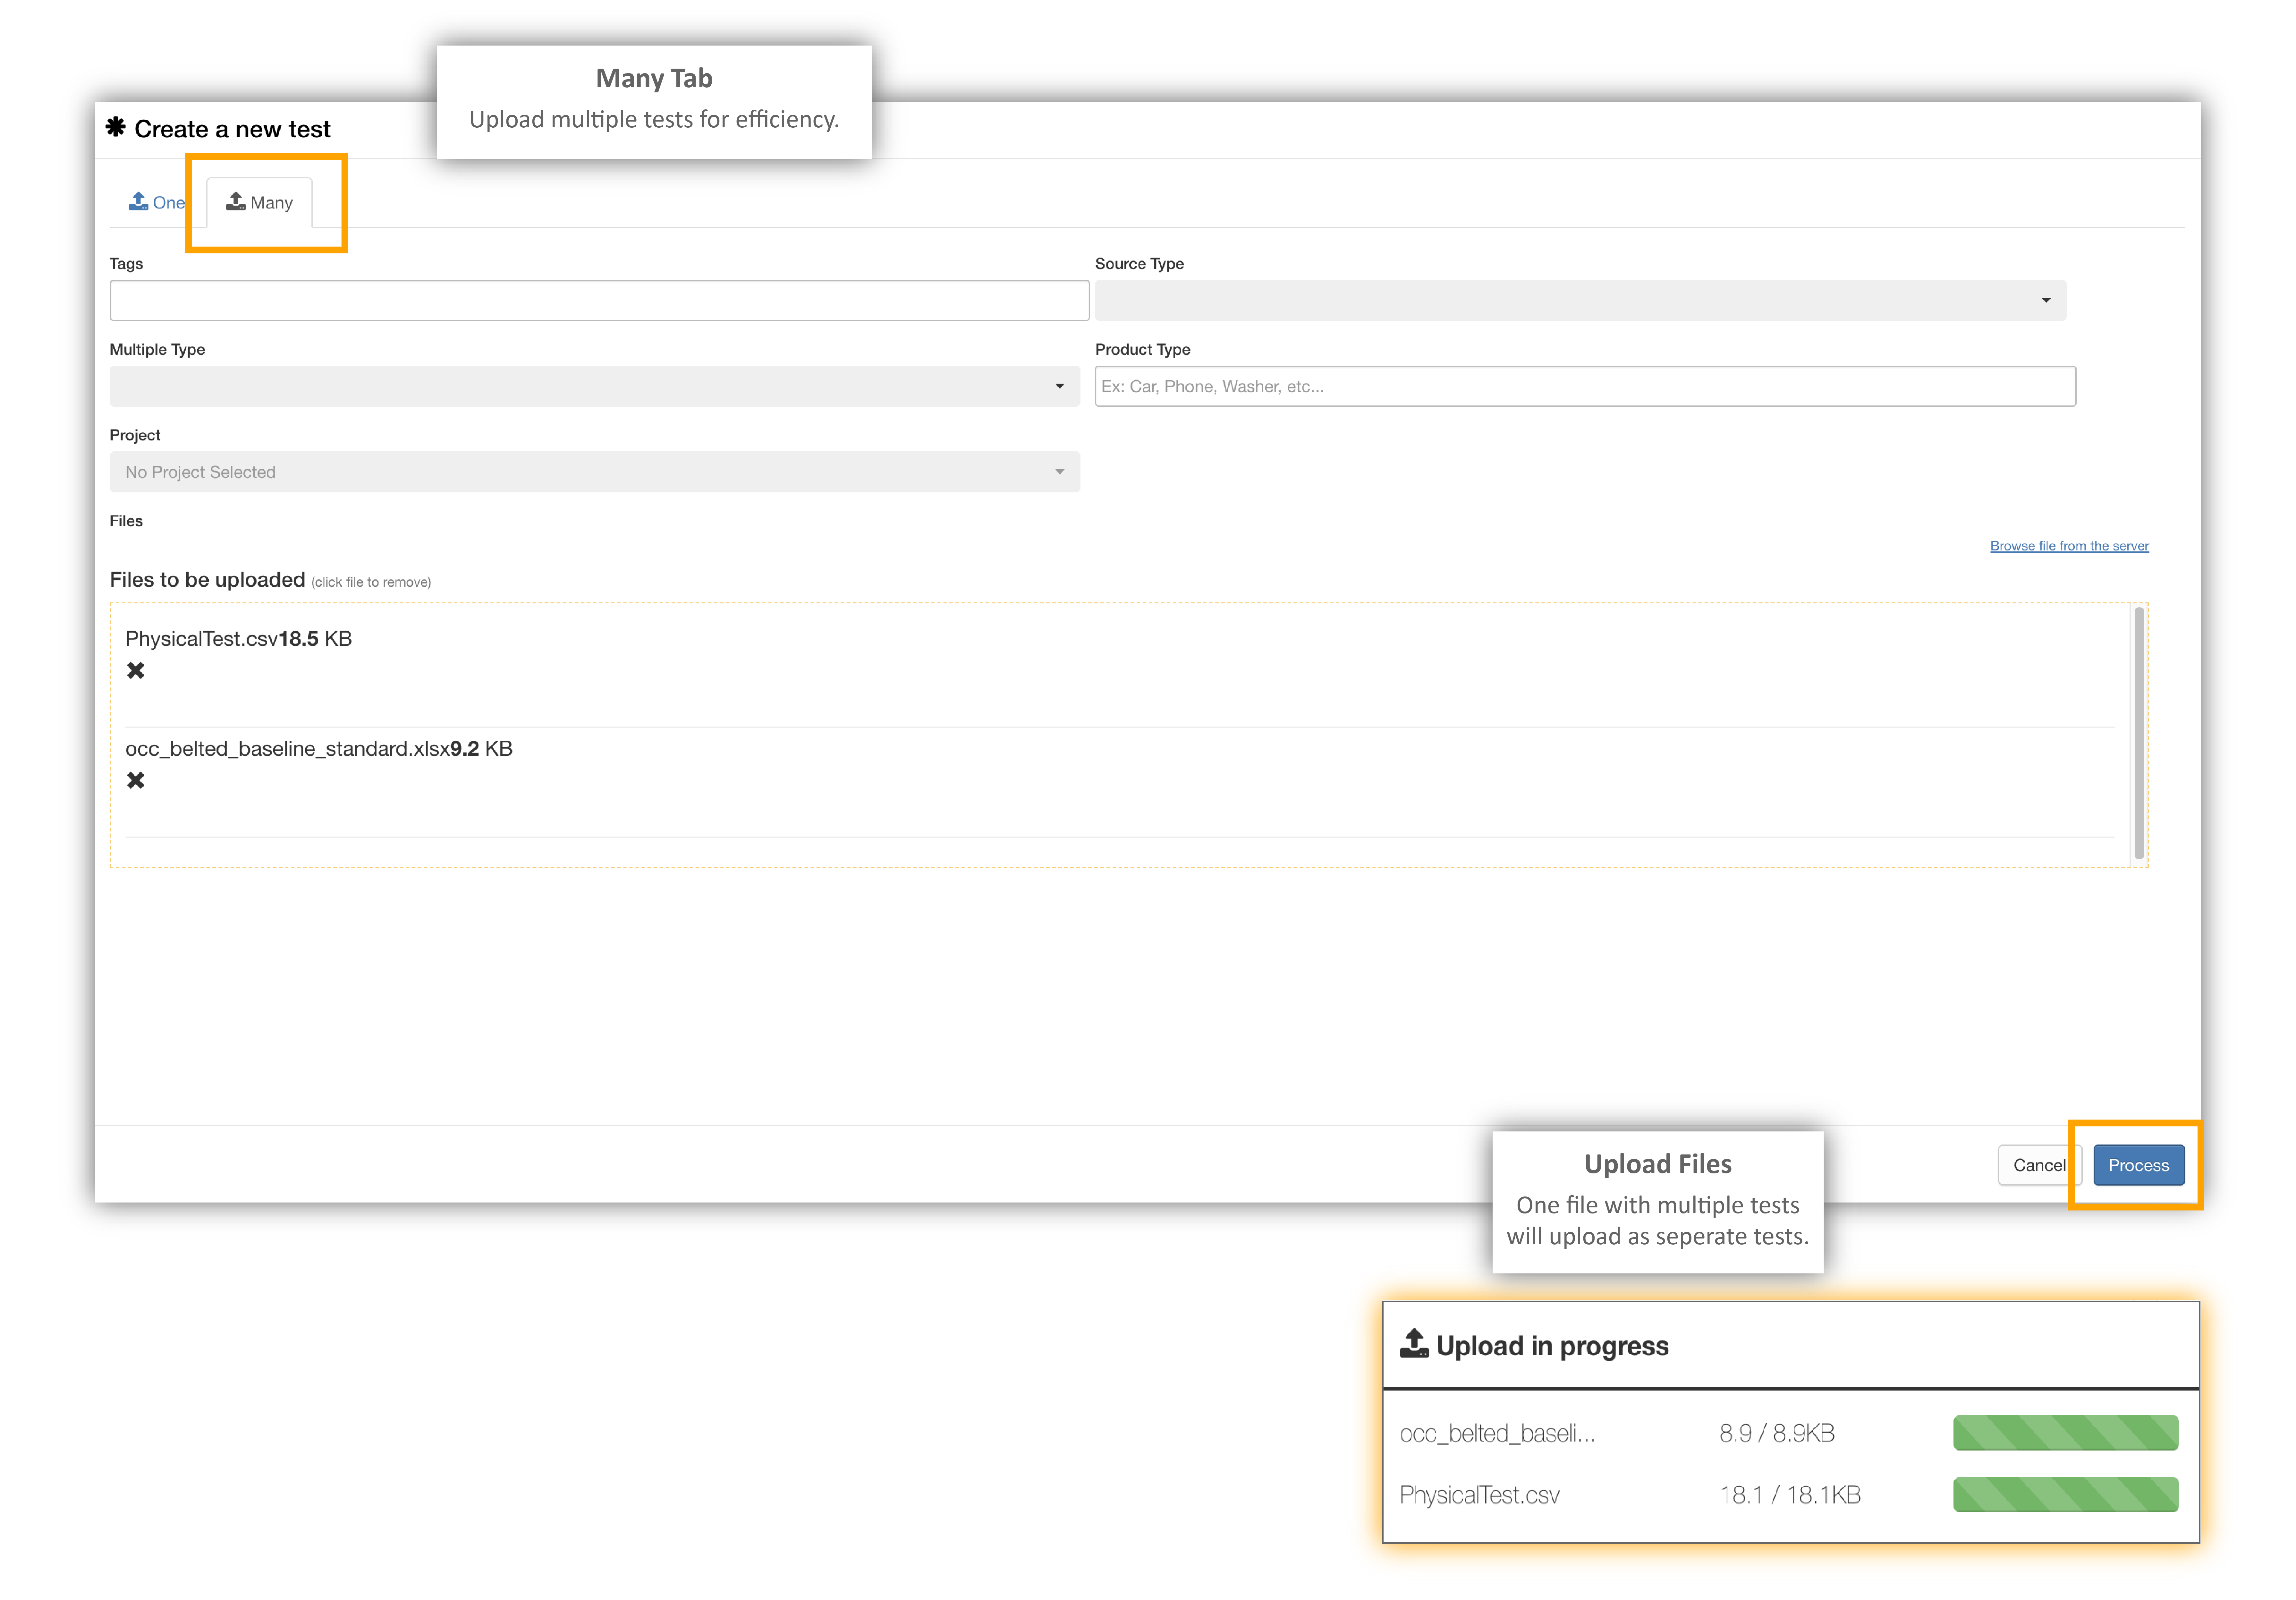
Figure 5: Upload Many Tab
4.2. All Tests Overview
On the Physical Test main page, we have options to sort, review, customize and export all our tests. Let’s review.
Filtering
Use the left side panel generic quick filters to sift through tests quickly.
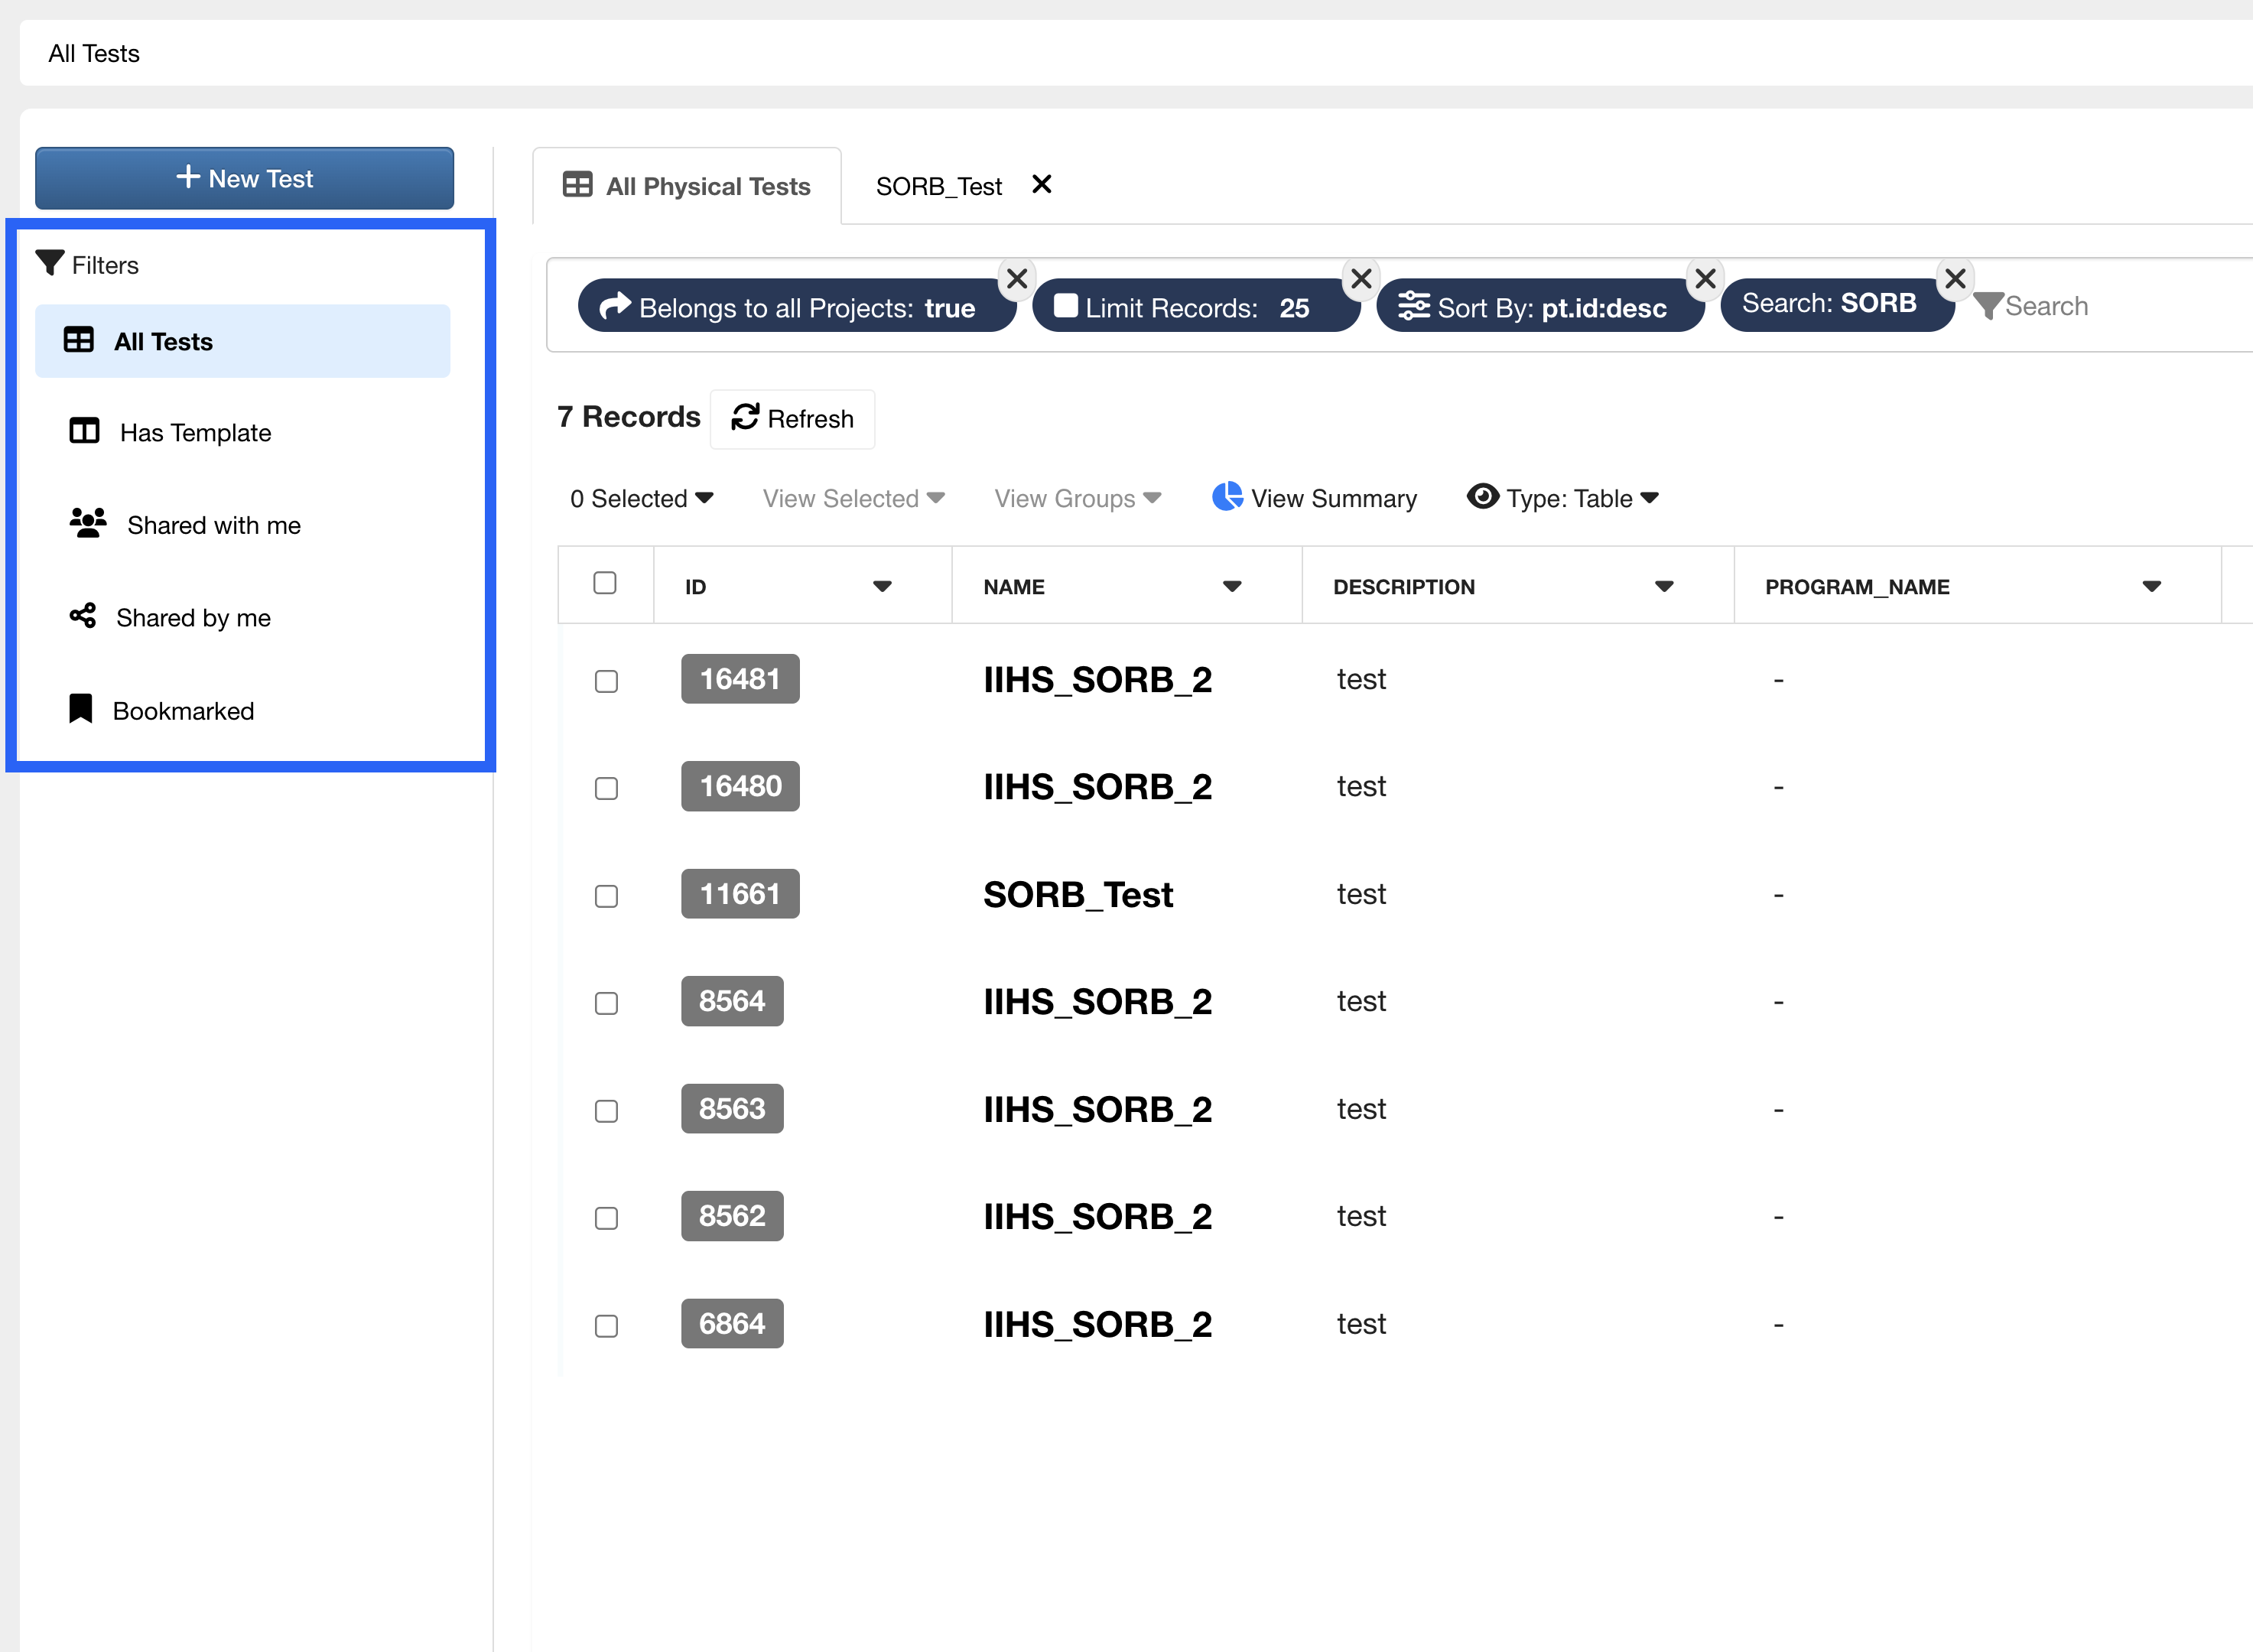
Figure 1: Generic Quick Filters
We can also use advanced filters at the top of our test table to search and find specific tests.
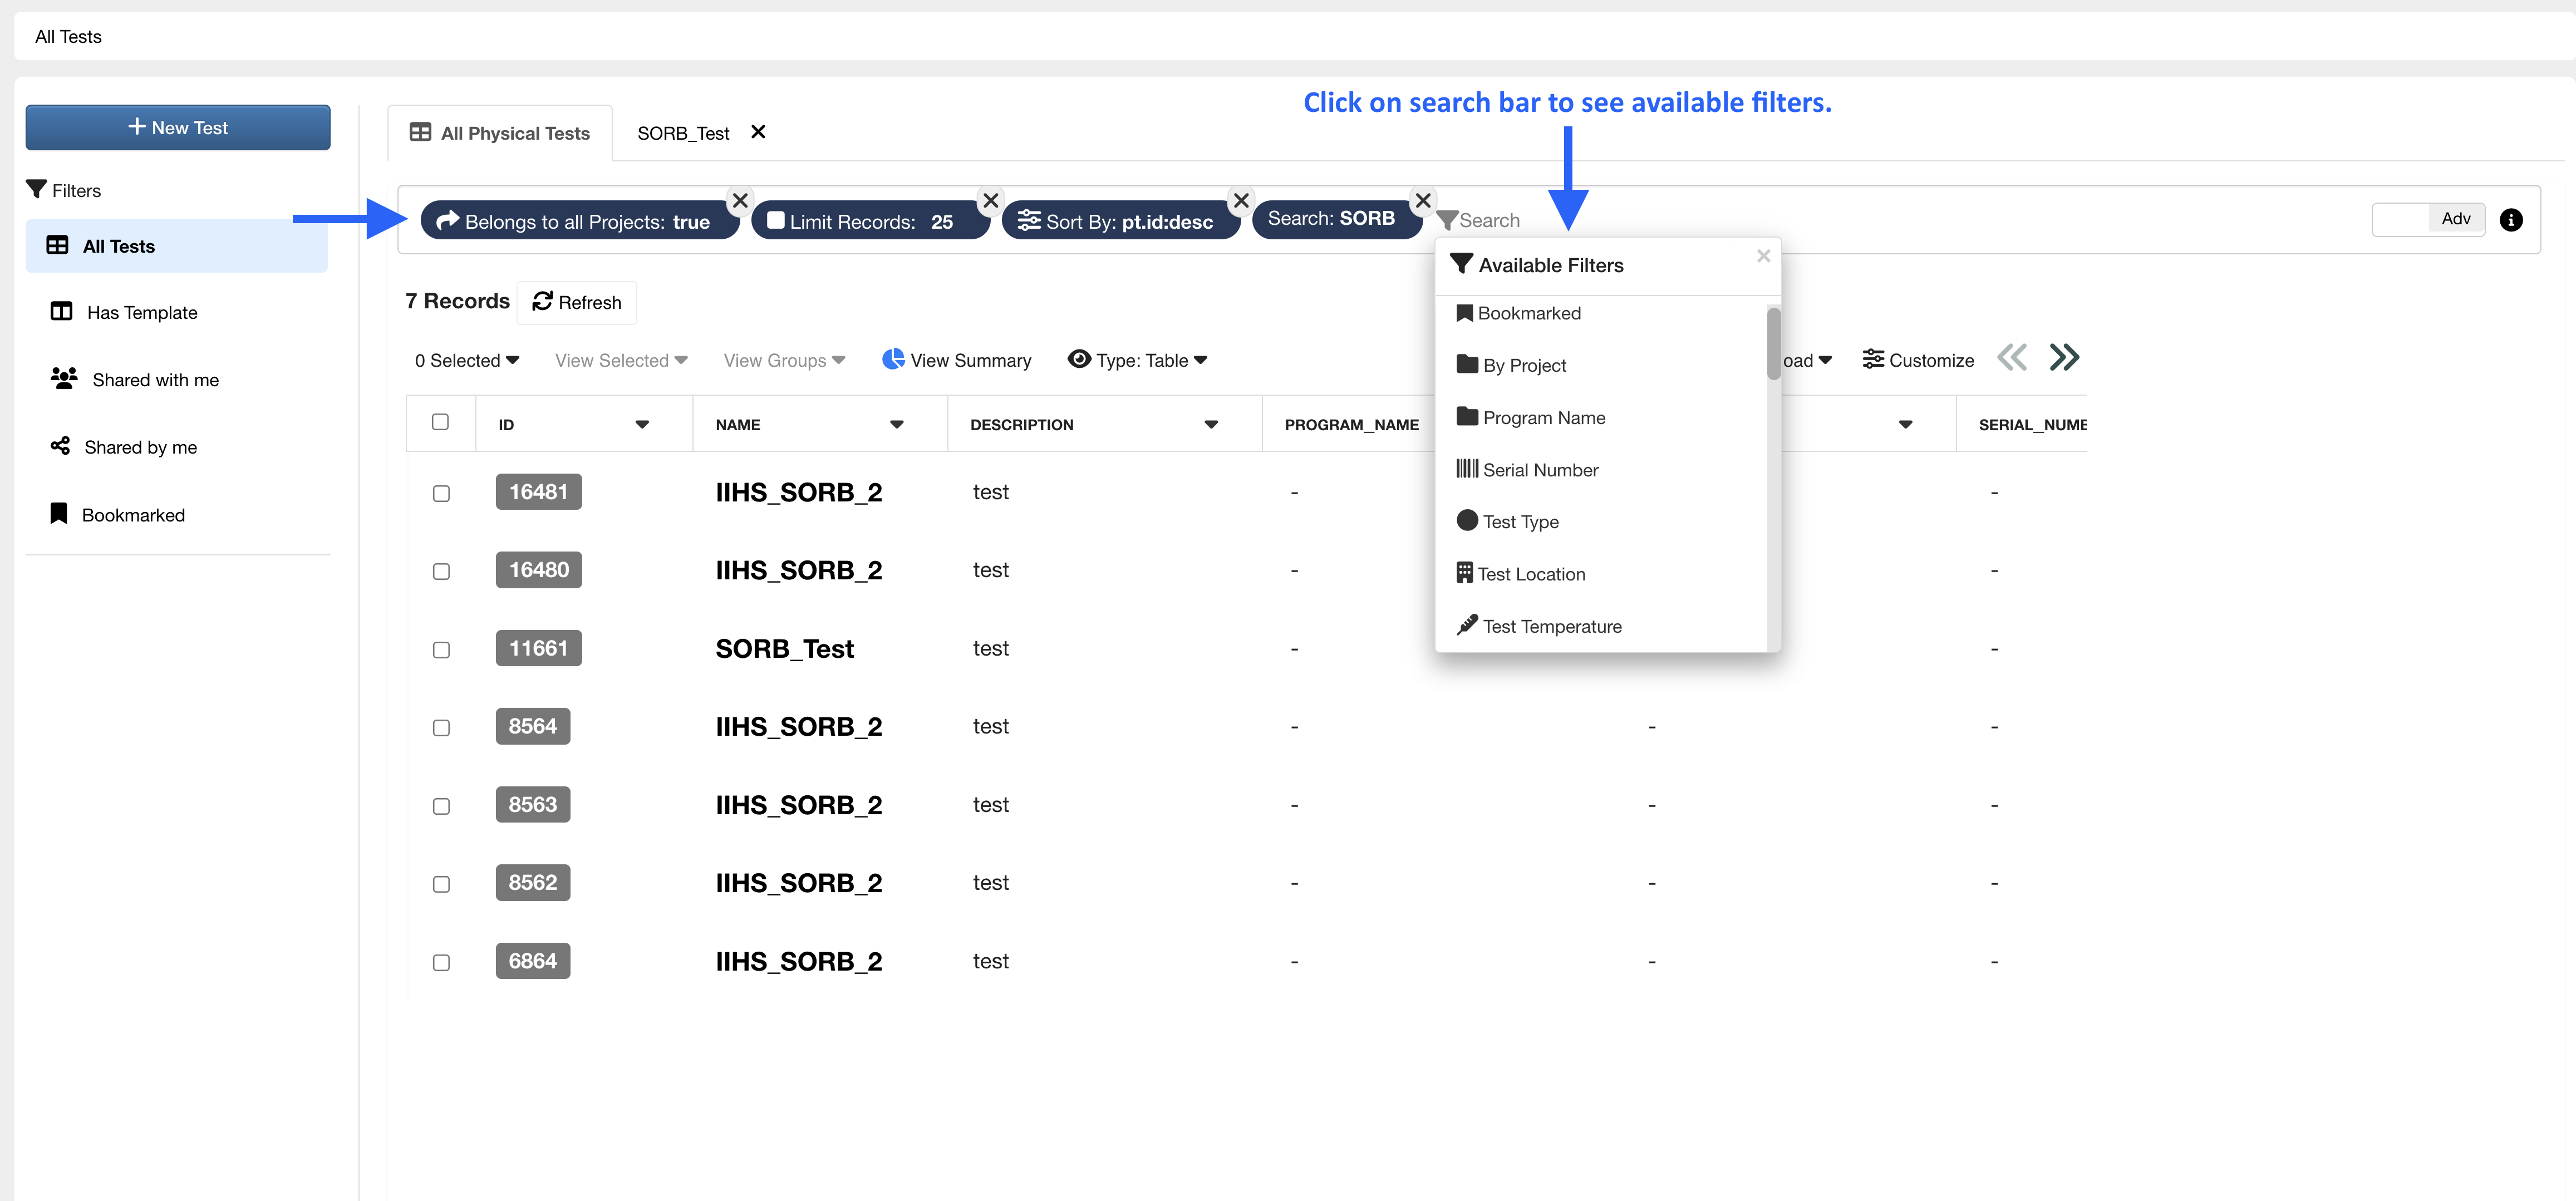
Figure 2: Advanced Specific Filters
Reviewing
View a summary of all tests by clicking this option at the top of the table.
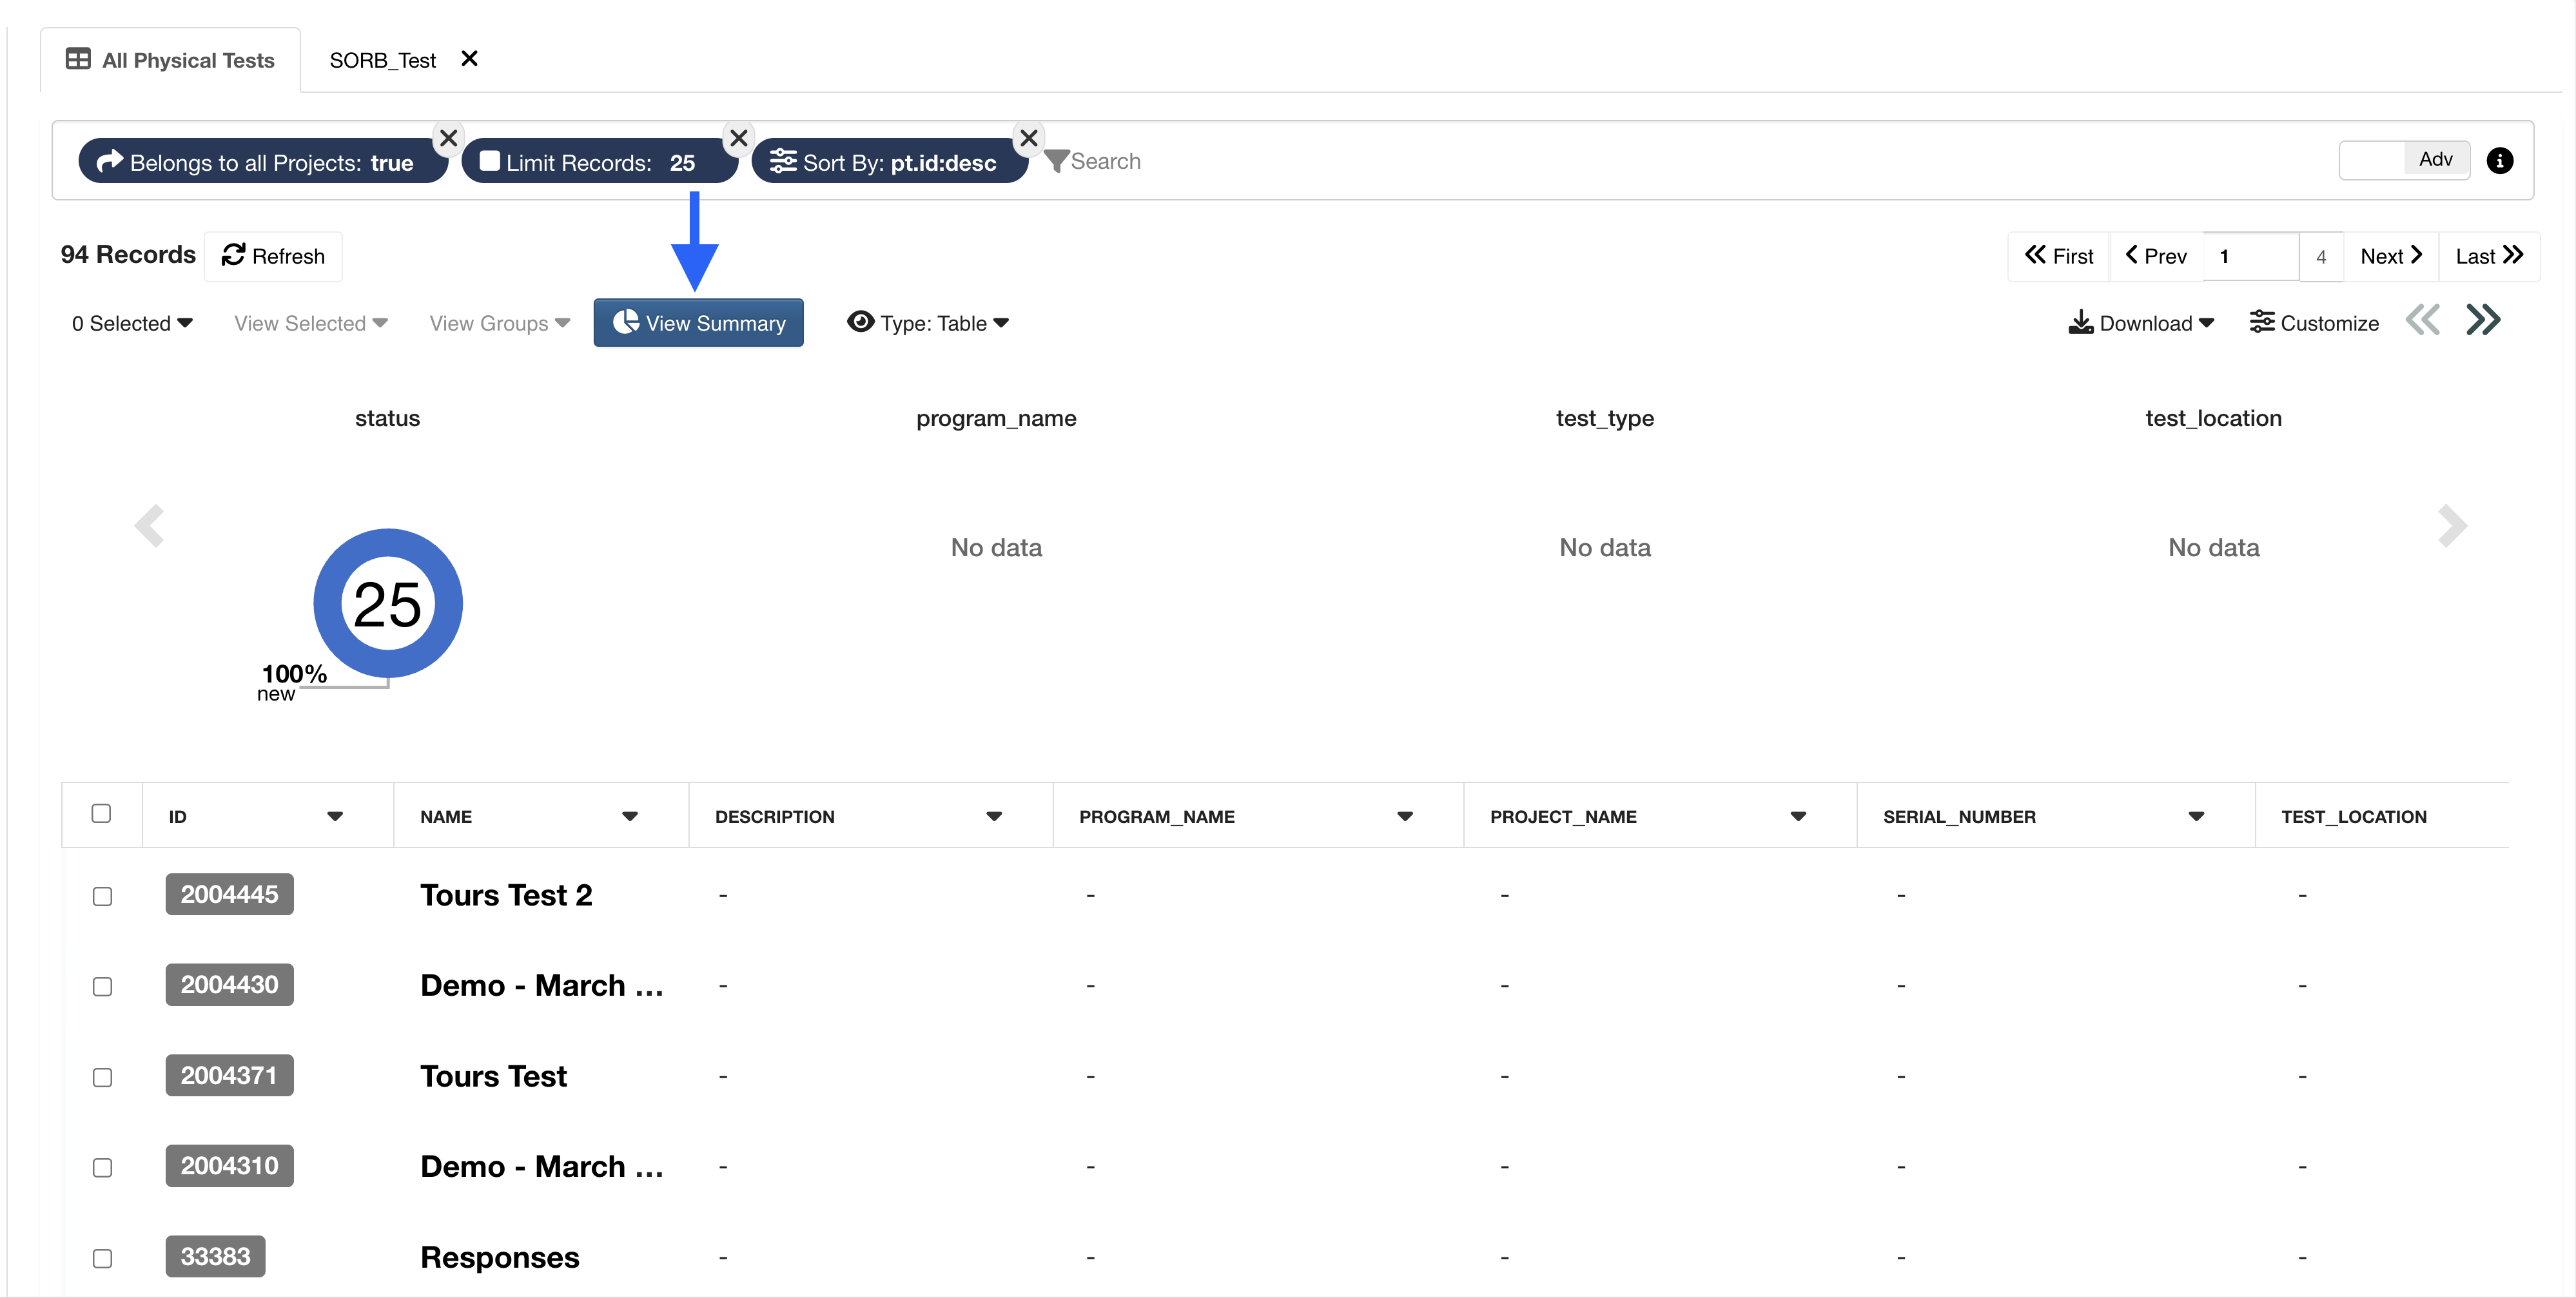
Figure 3: Test Summary
We can also view our table in alternative visualizations under the eye icon type.
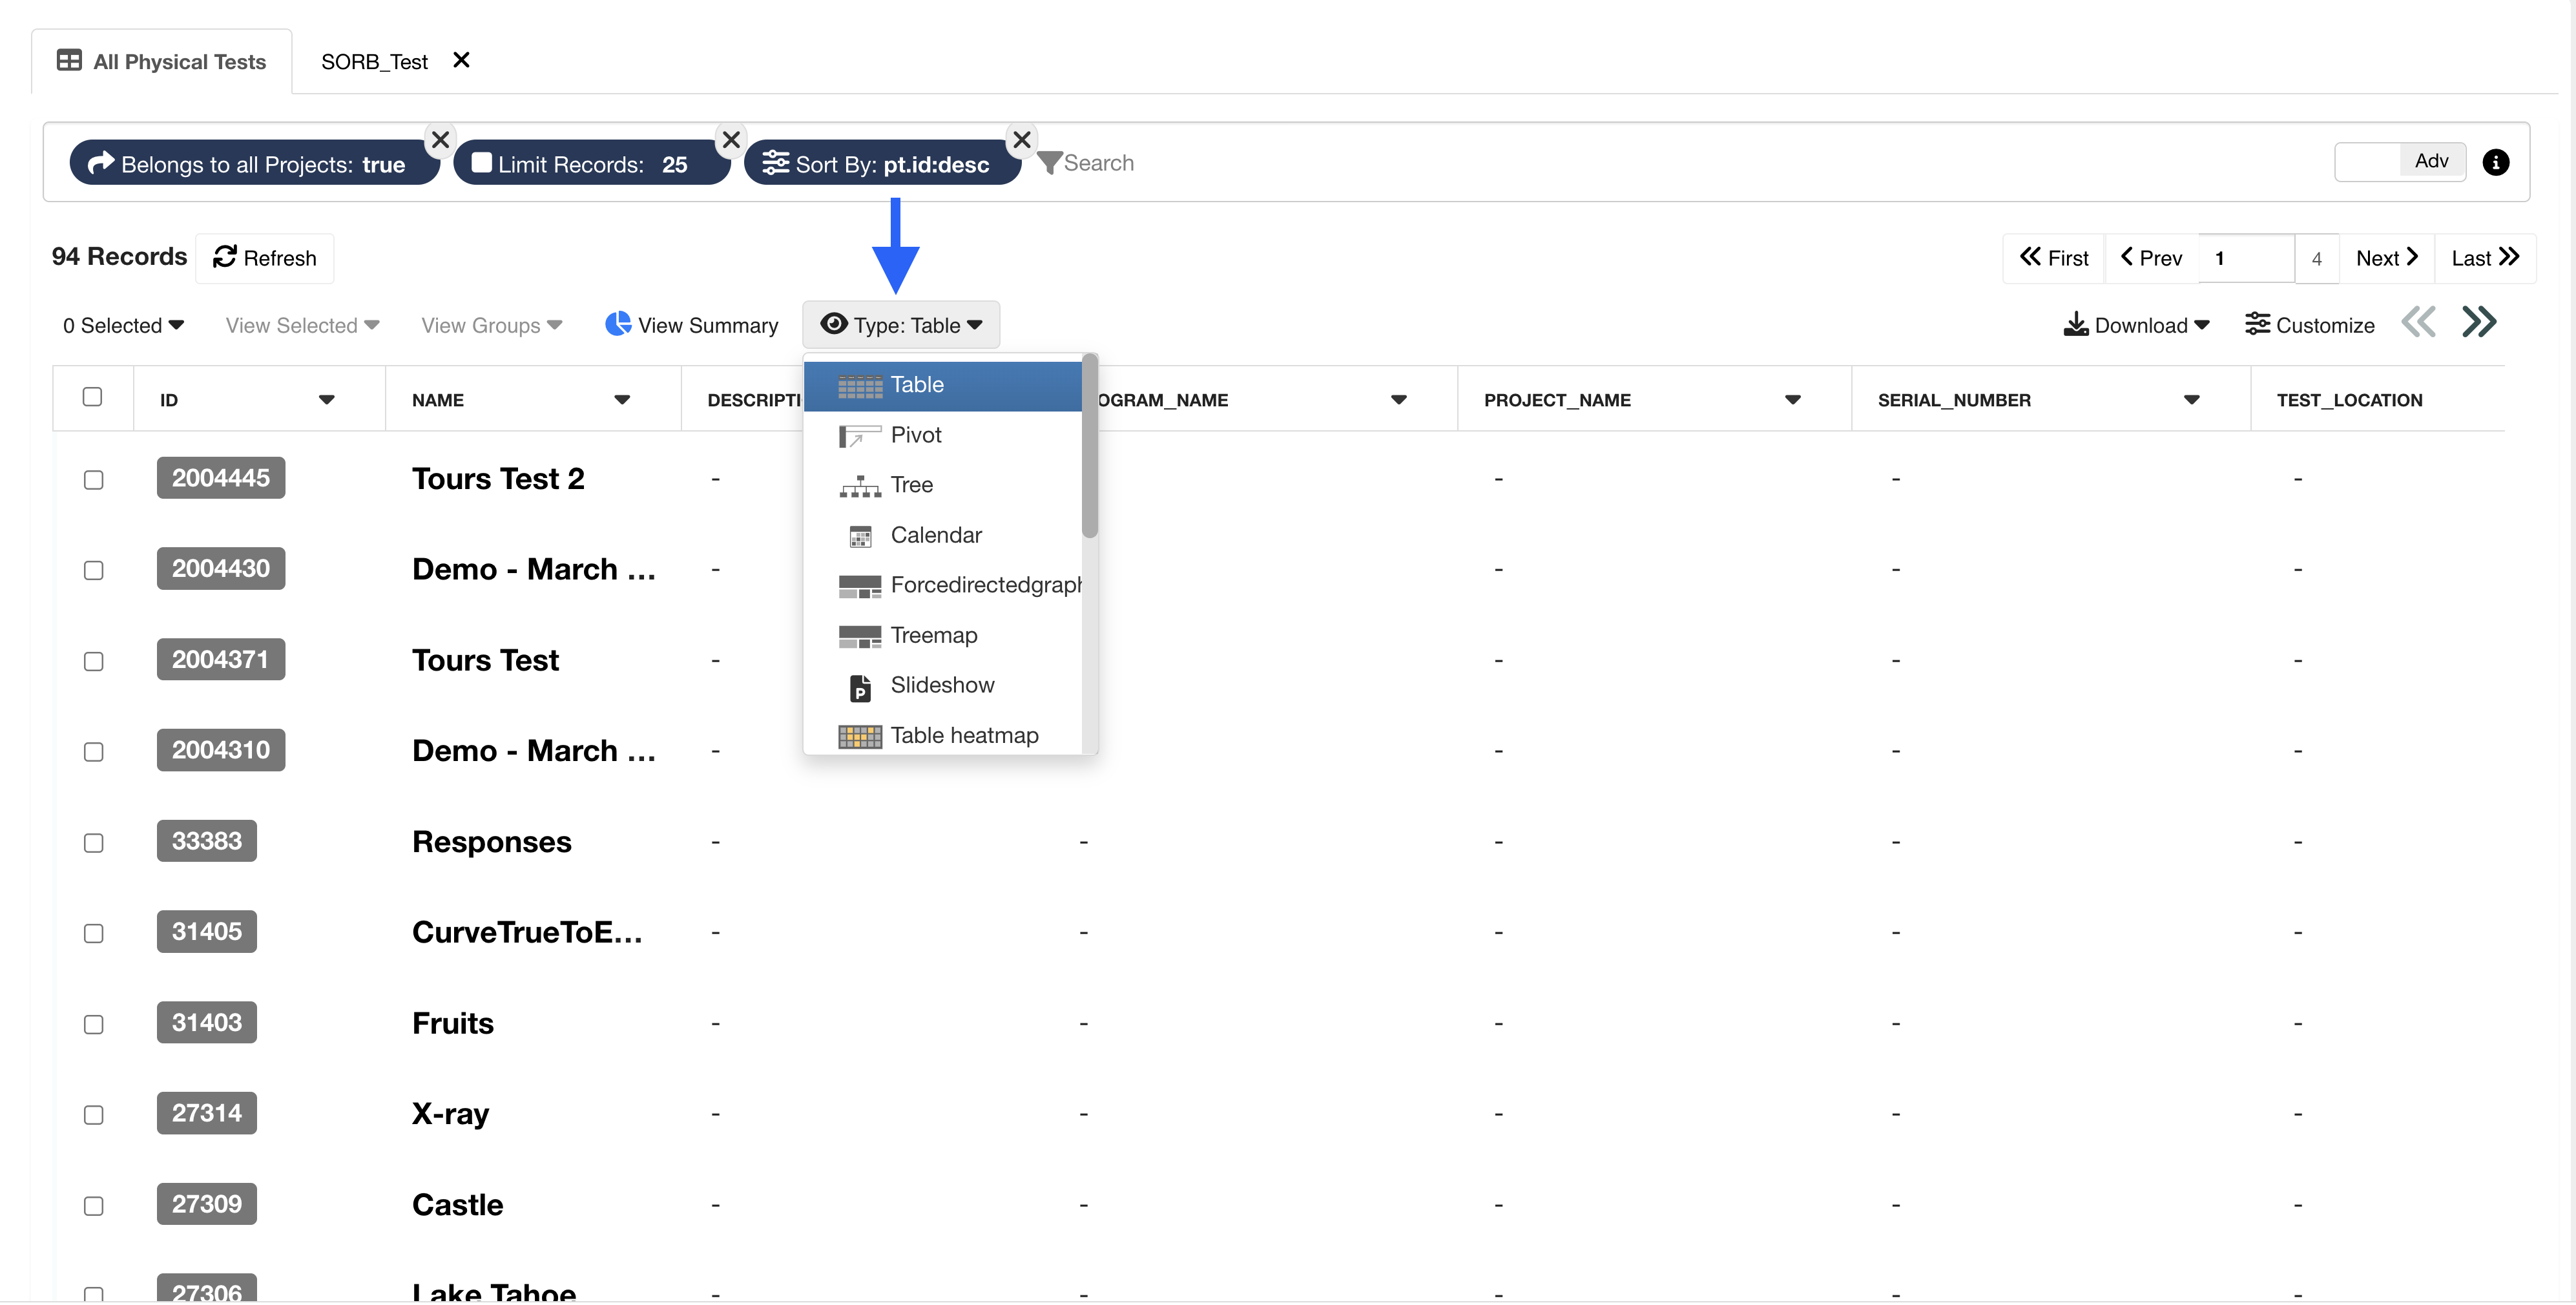
Figure 4: Test Table Views
When choosing a different visualization, we’ll be prompted to set up chart specifications in order to visualize it as we desire.
Customizing
We can customize our table by clicking on this option on the top right corner over the test table.
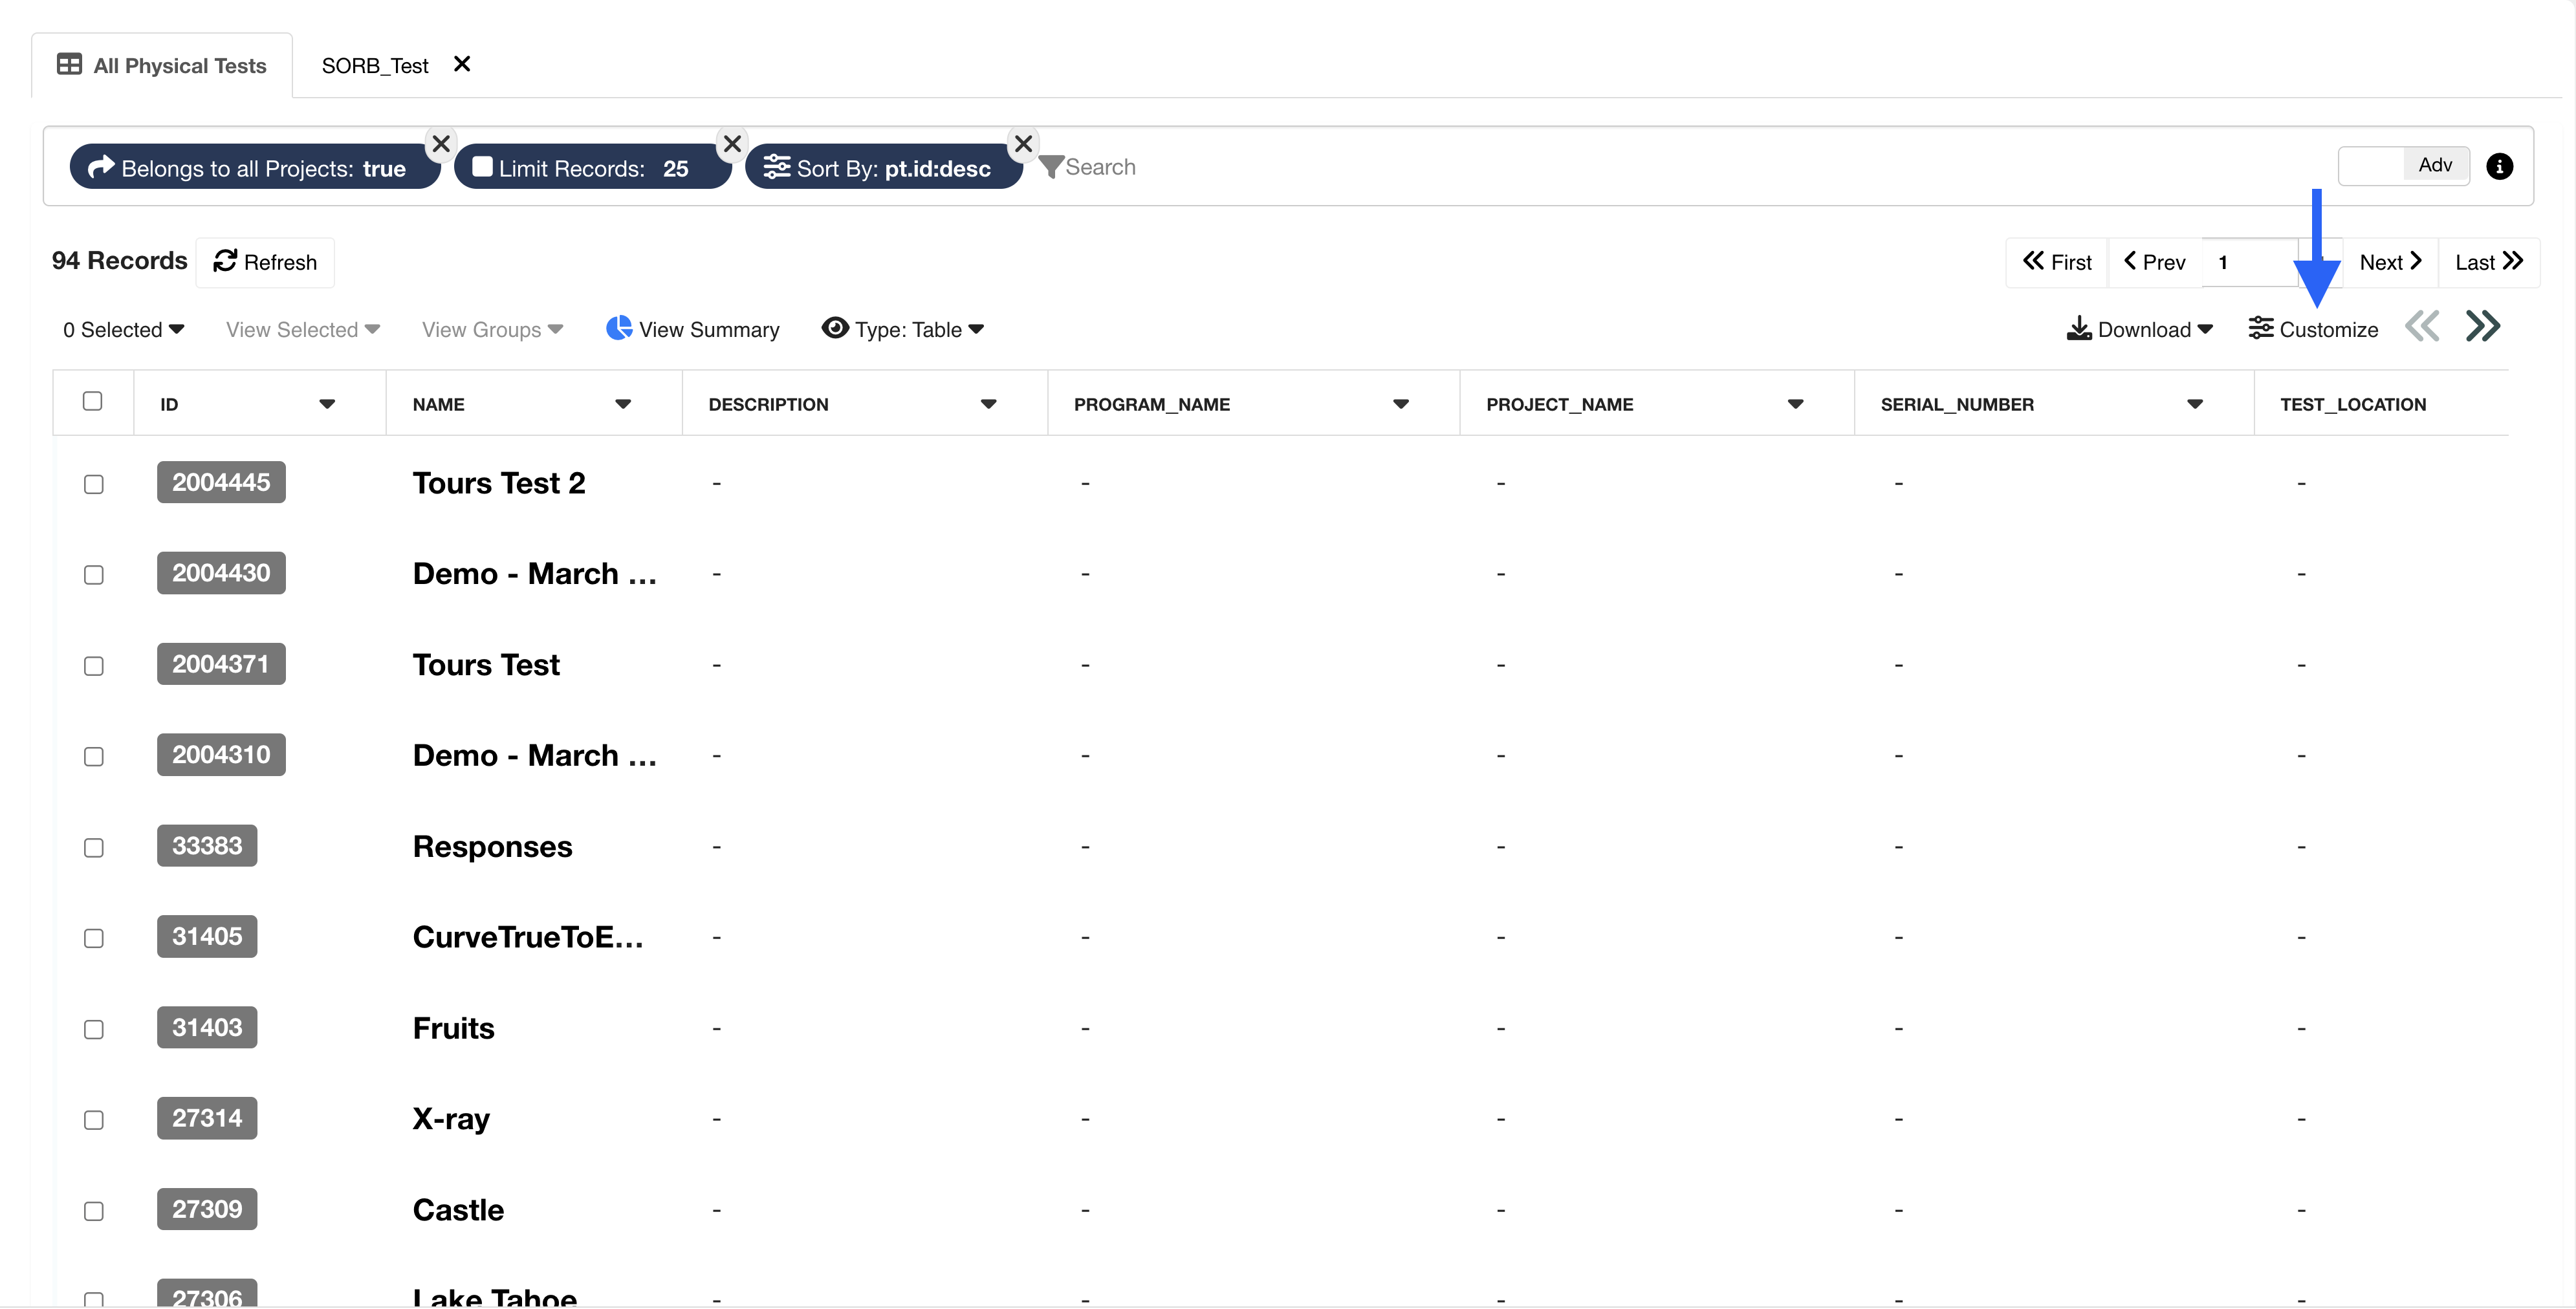
Figure 5: Customize Test Table
Change the look of the table or reorder and exclude columns.
Exporting
Use the Download option on the top right of the test table to export tests in a multitude of ways.
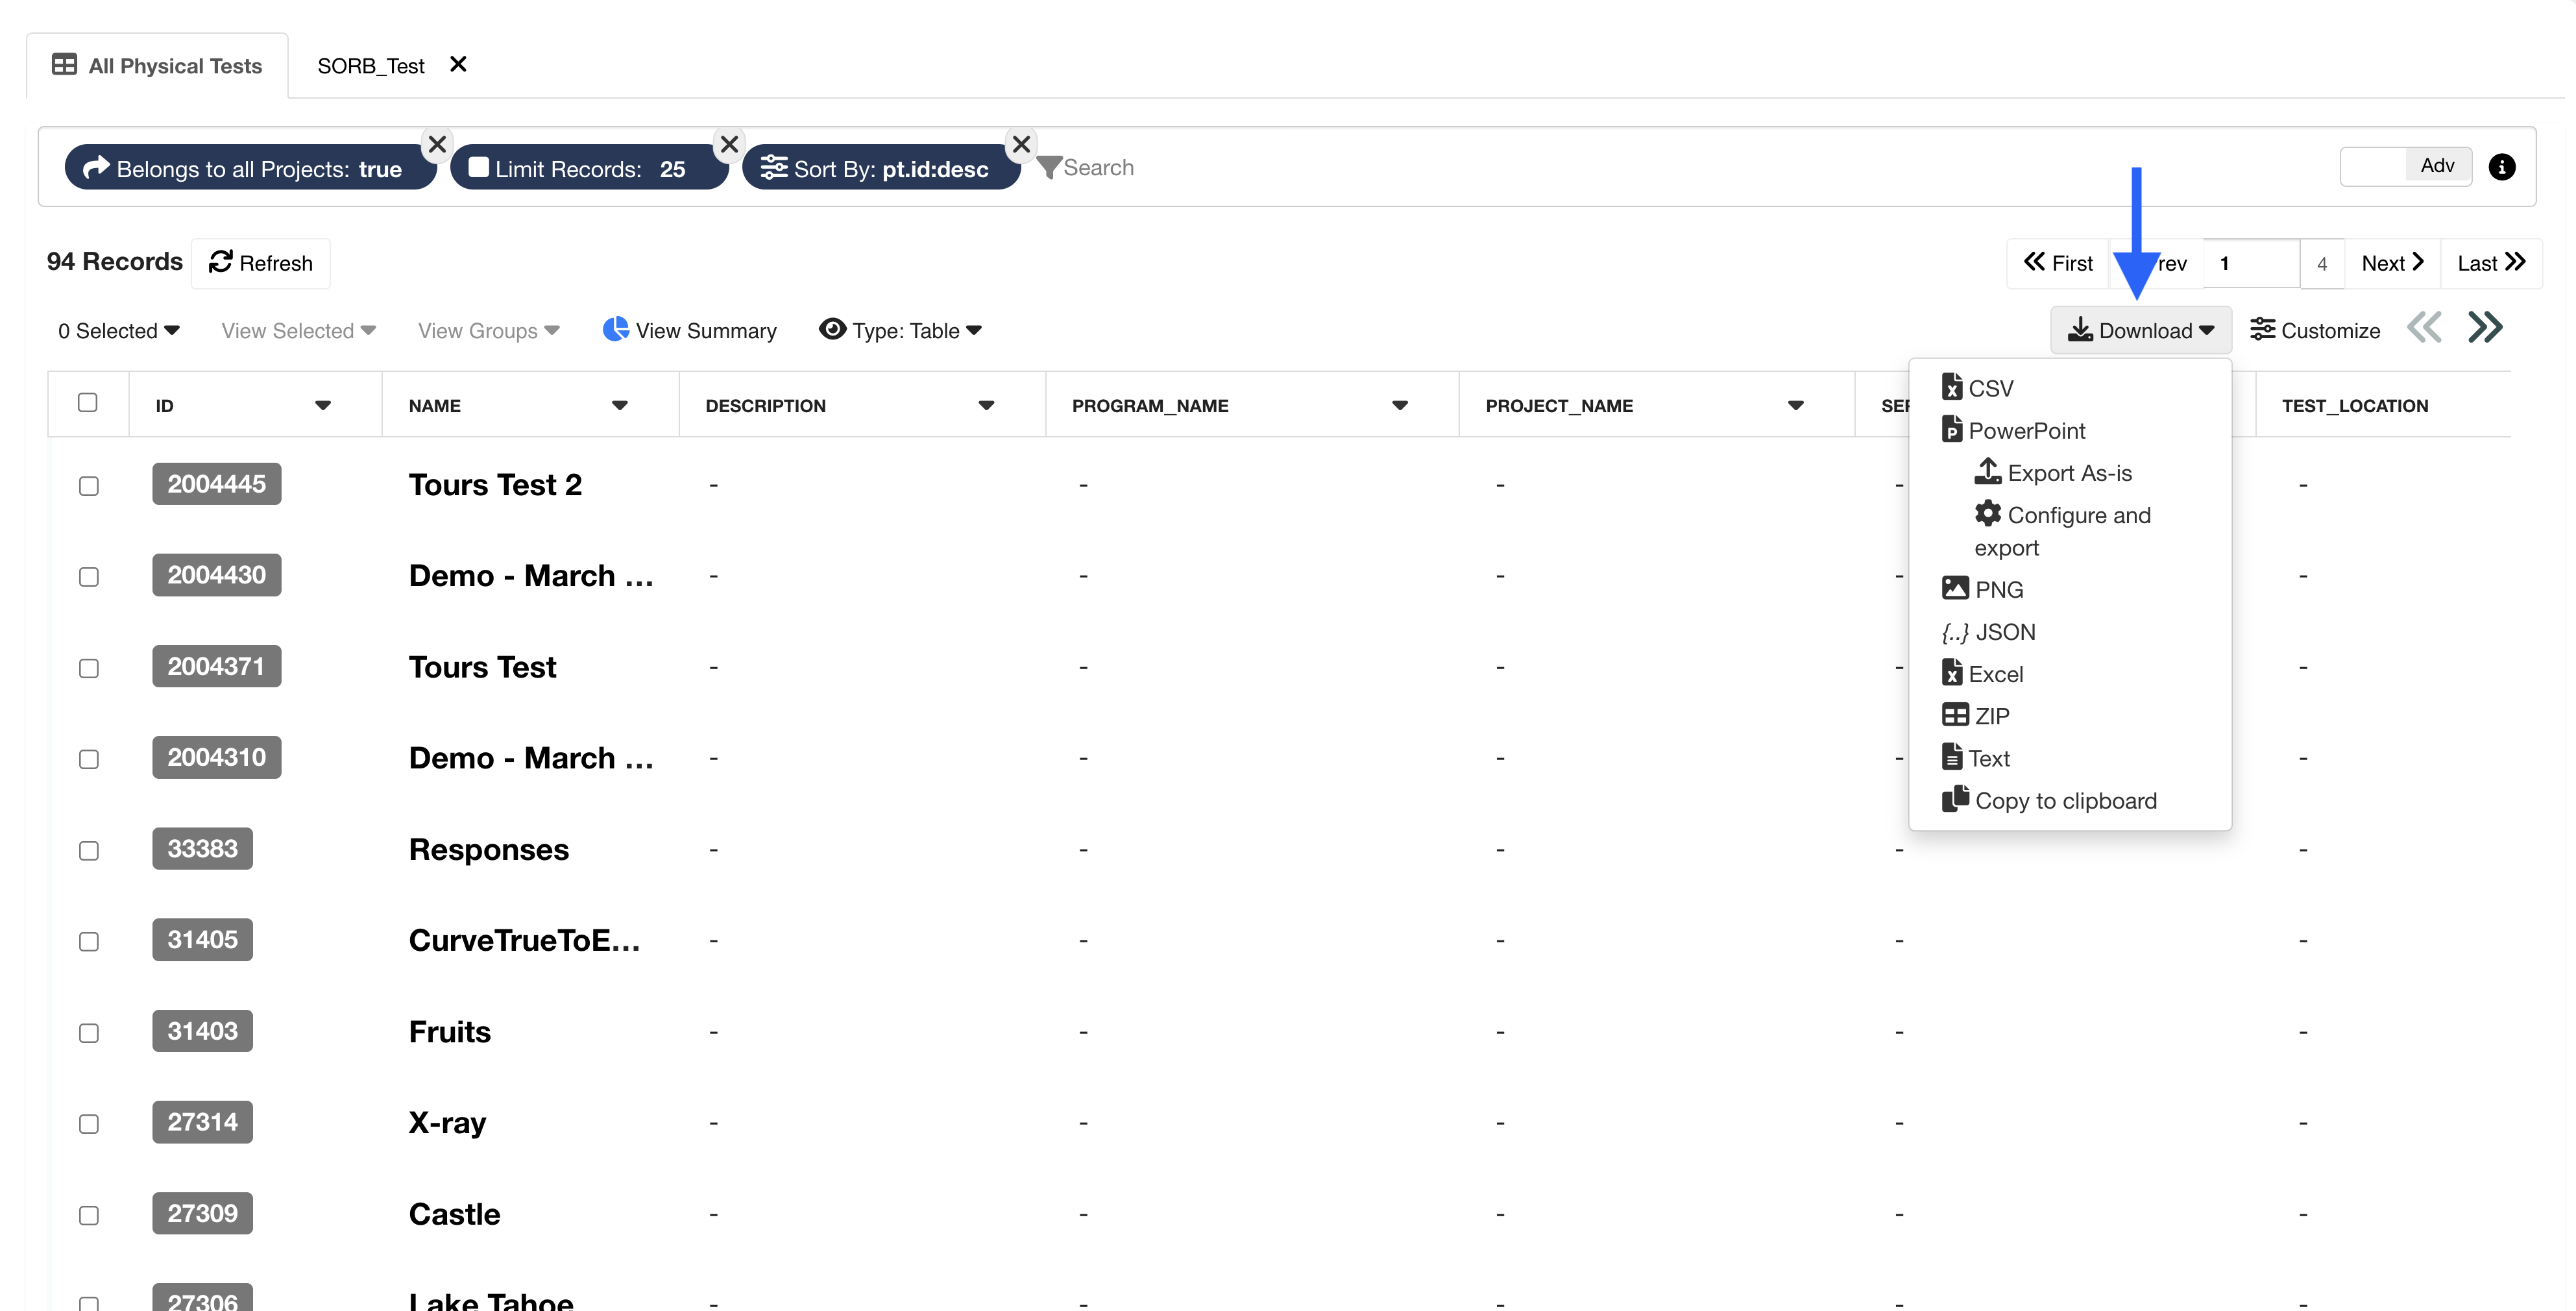
Figure 6: Customize Test Table
4.3. Exploring Test Contents
On the Physical Tests name page, click on the name of a test in the table to view its contents in a new tab.
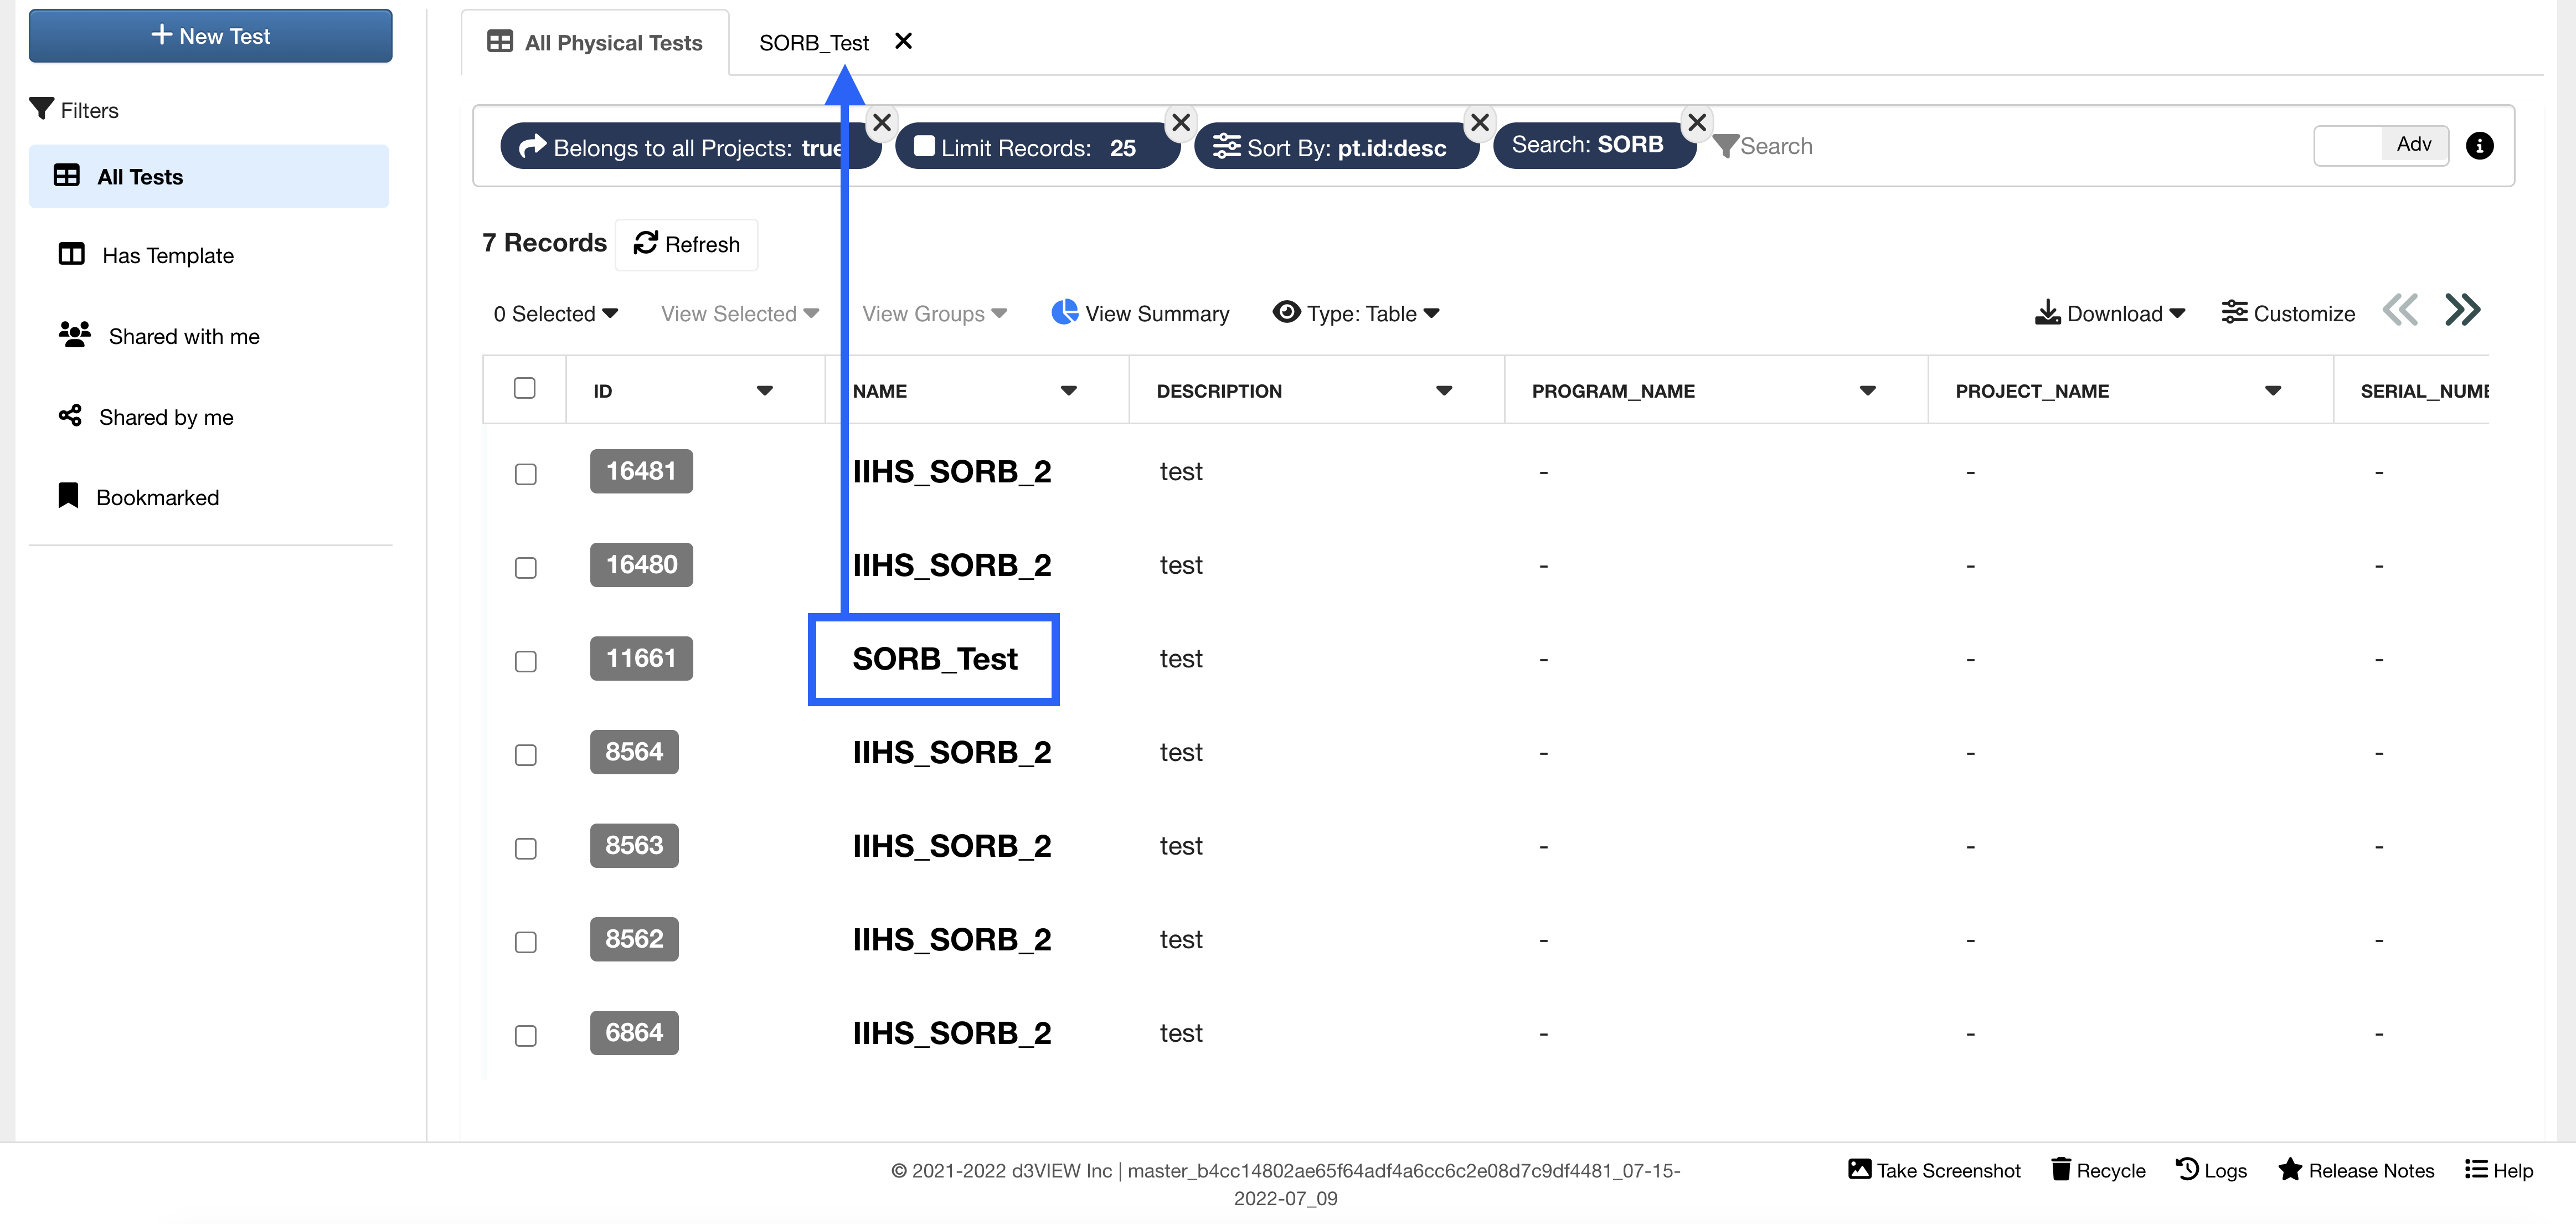
Figure 1: Open Physical Test
The first section (1) presents an overview of the test. You can review responses, files and comments in the other tabs. You can also share, edit and delete this particular Physical Test (2).
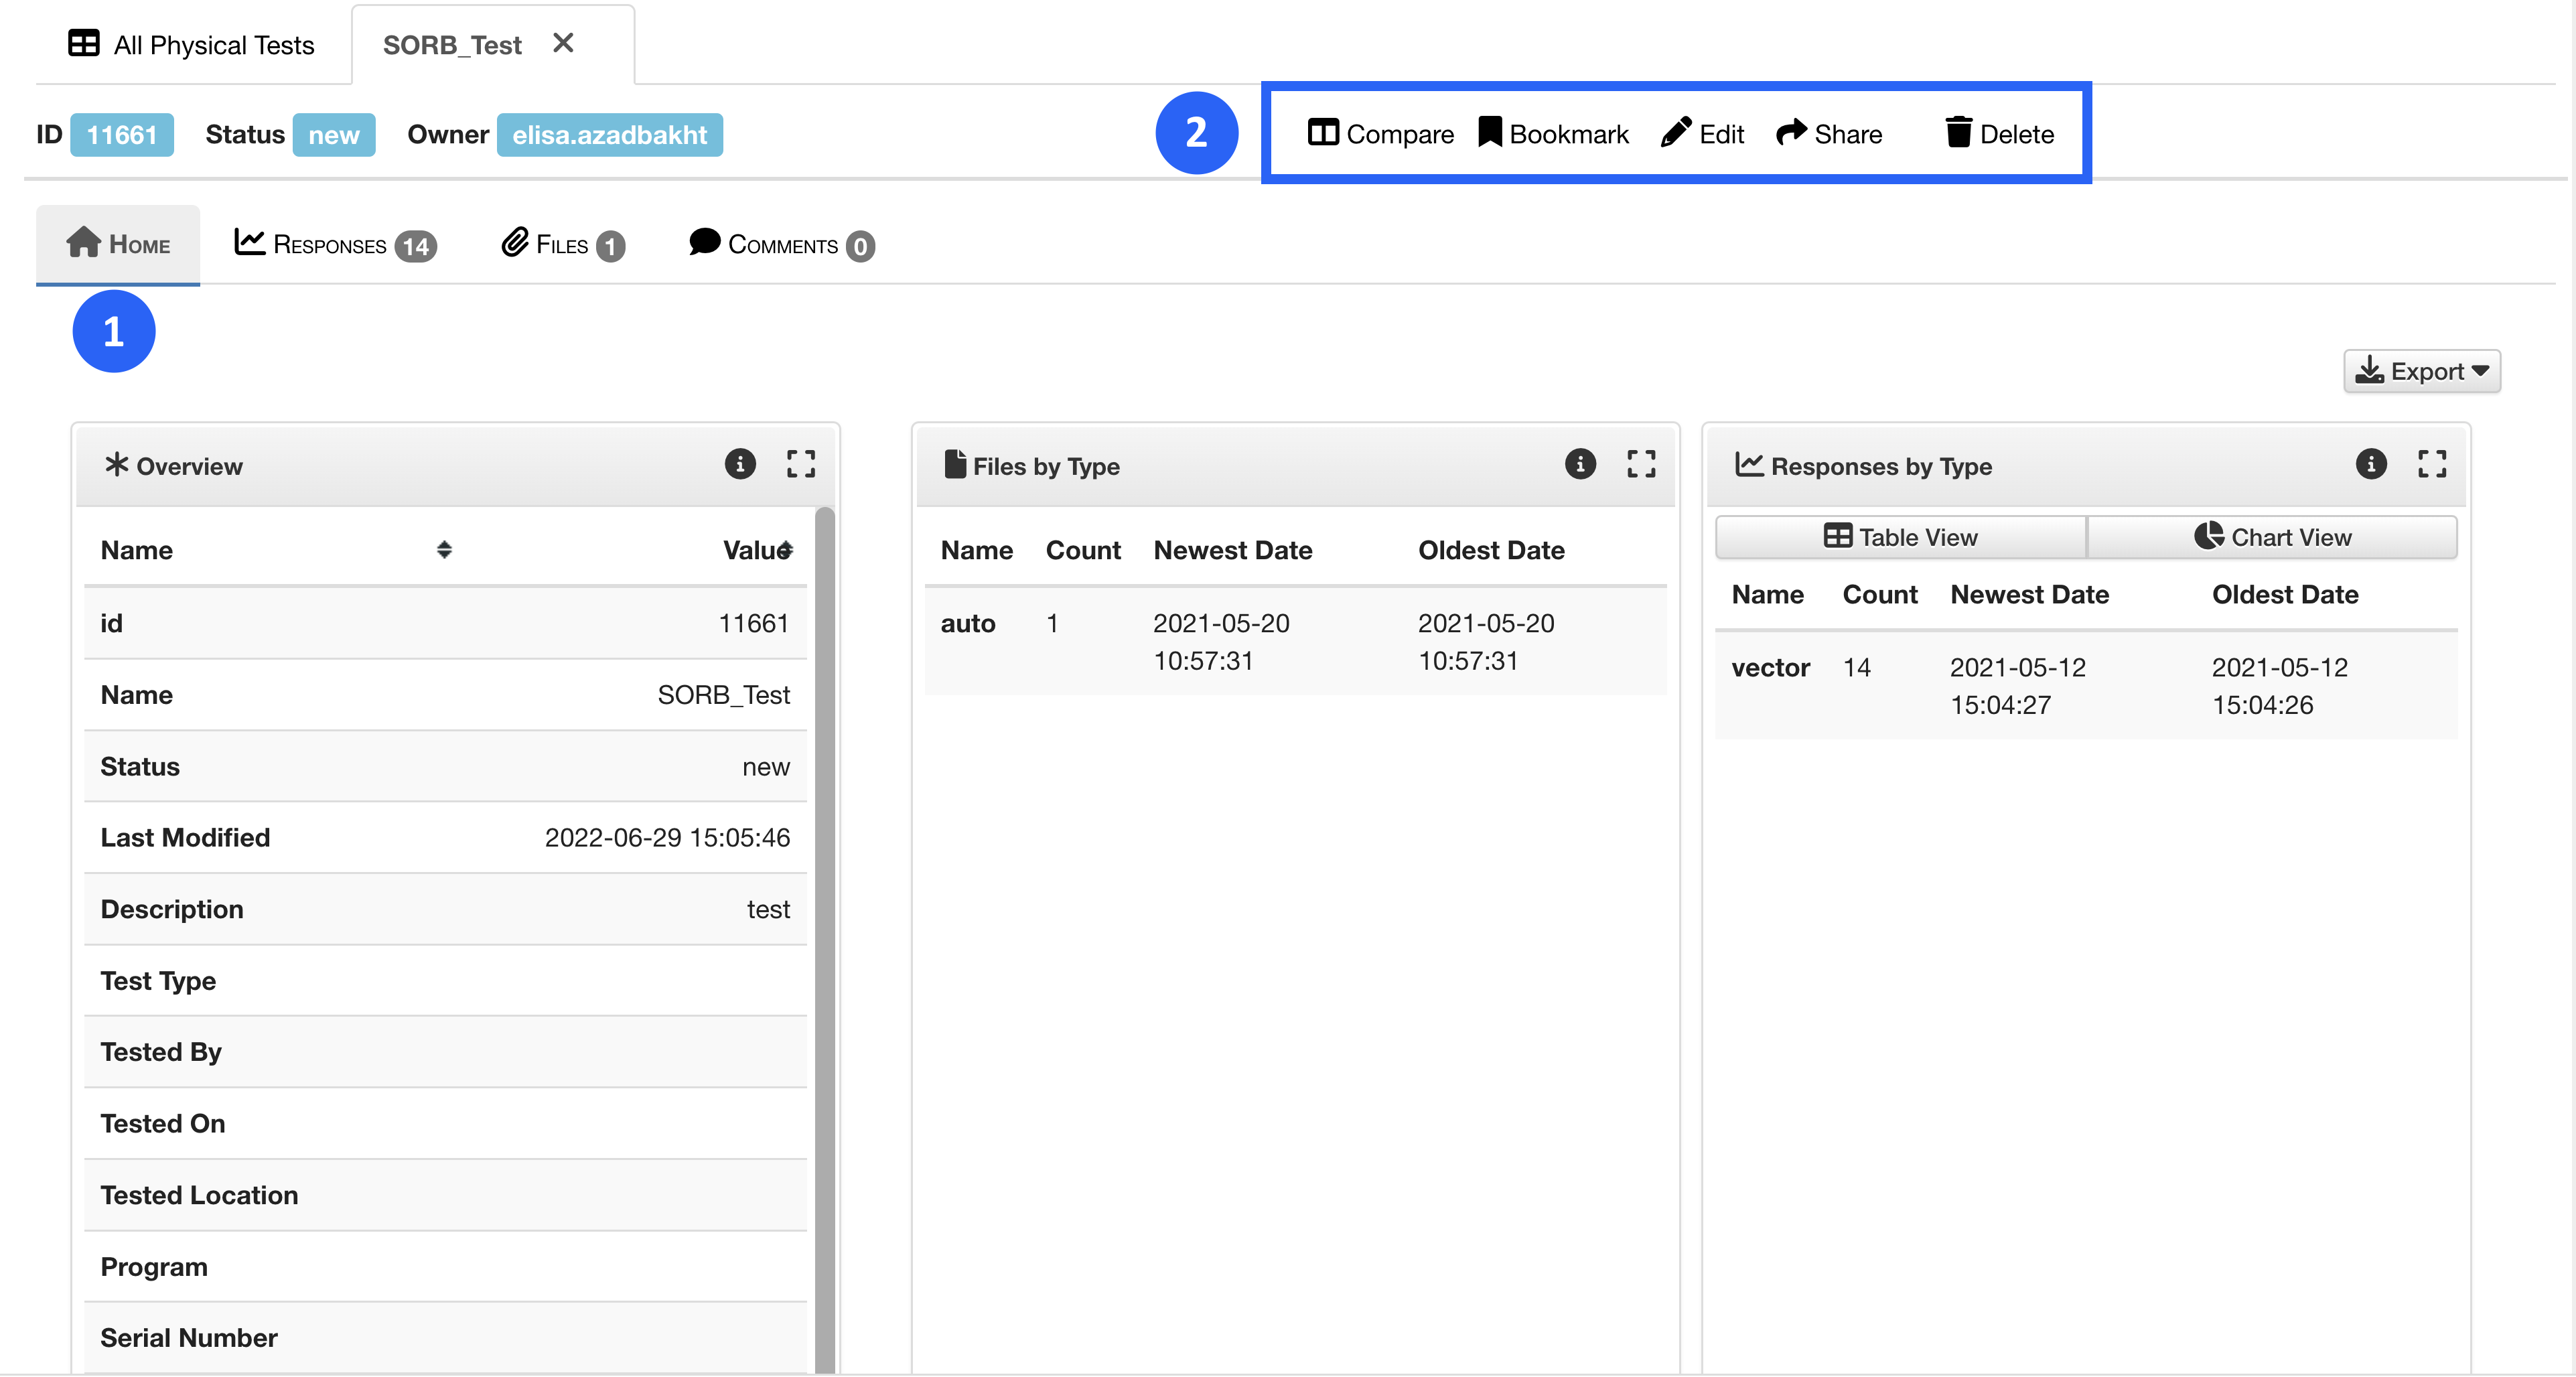
Figure 2: View Physical Test
Adding / Viewing Responses
The Responses tab presents your responses’ summaries and visualizes them when ever possible. Click on the 3 dots next to a response to view actions you can perform on the responses.
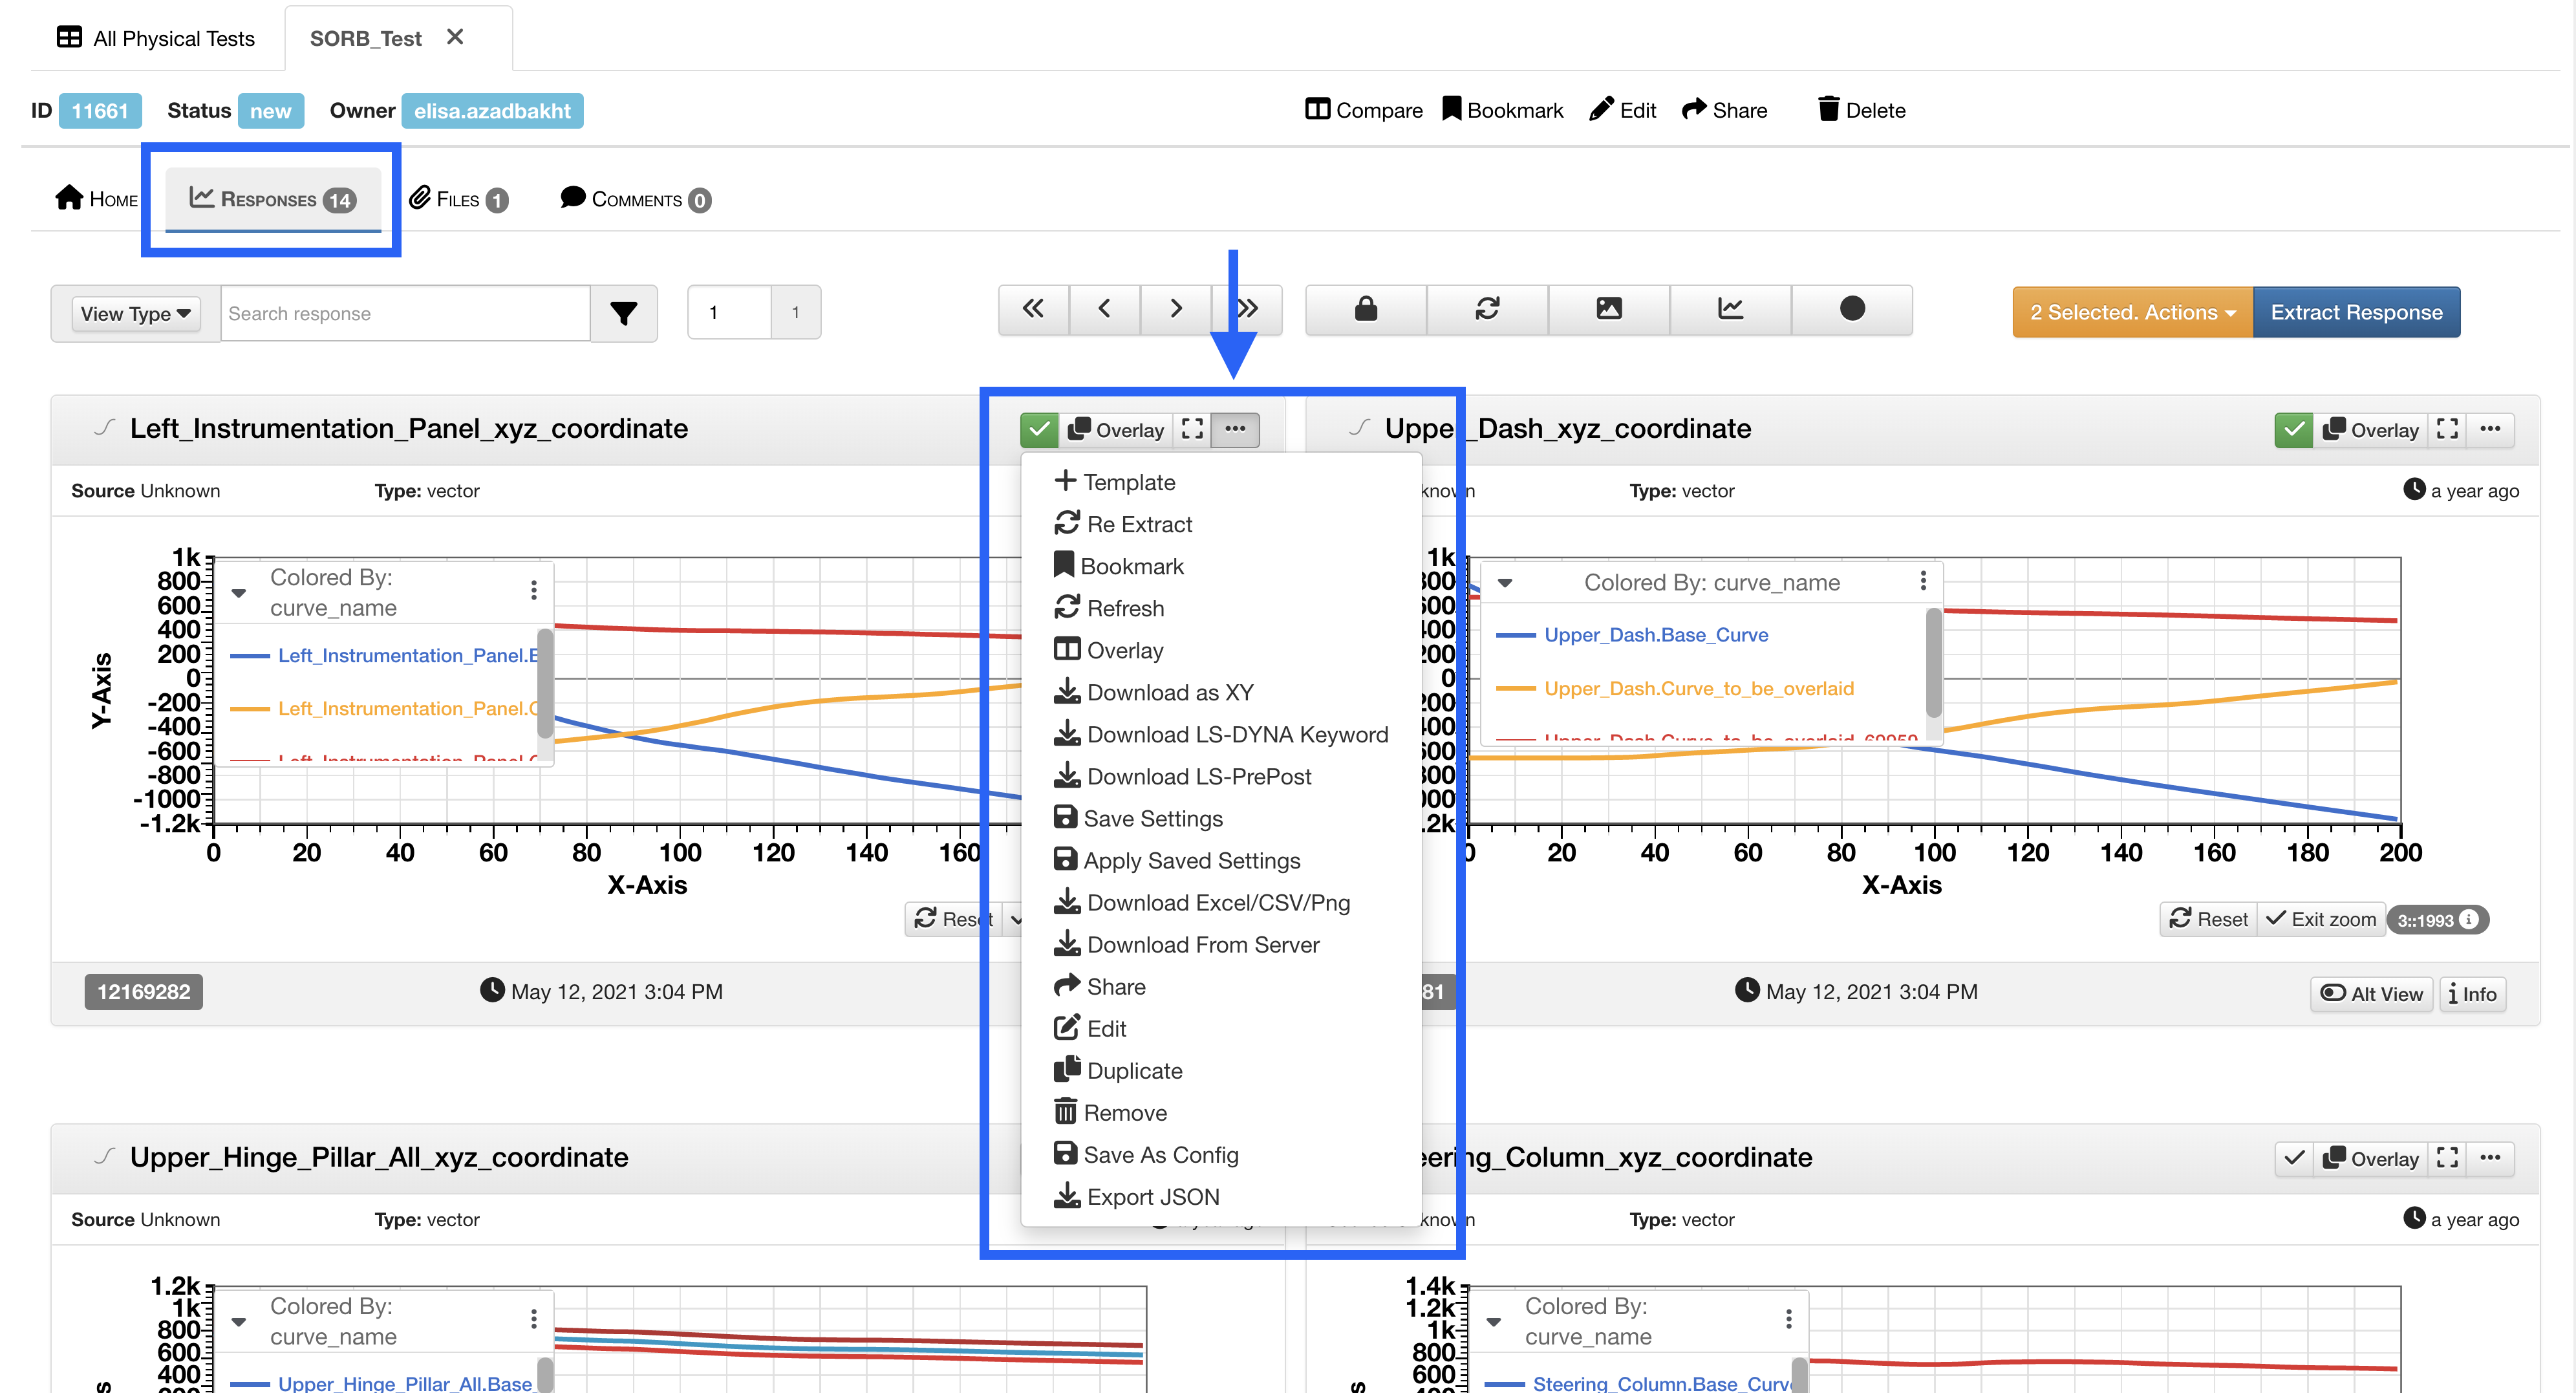
Figure 3: Physical Test Response Actions
You can also select (check) multiple responses and hit the “Selected” drop-down to view all the bulk actions you can perform on them.
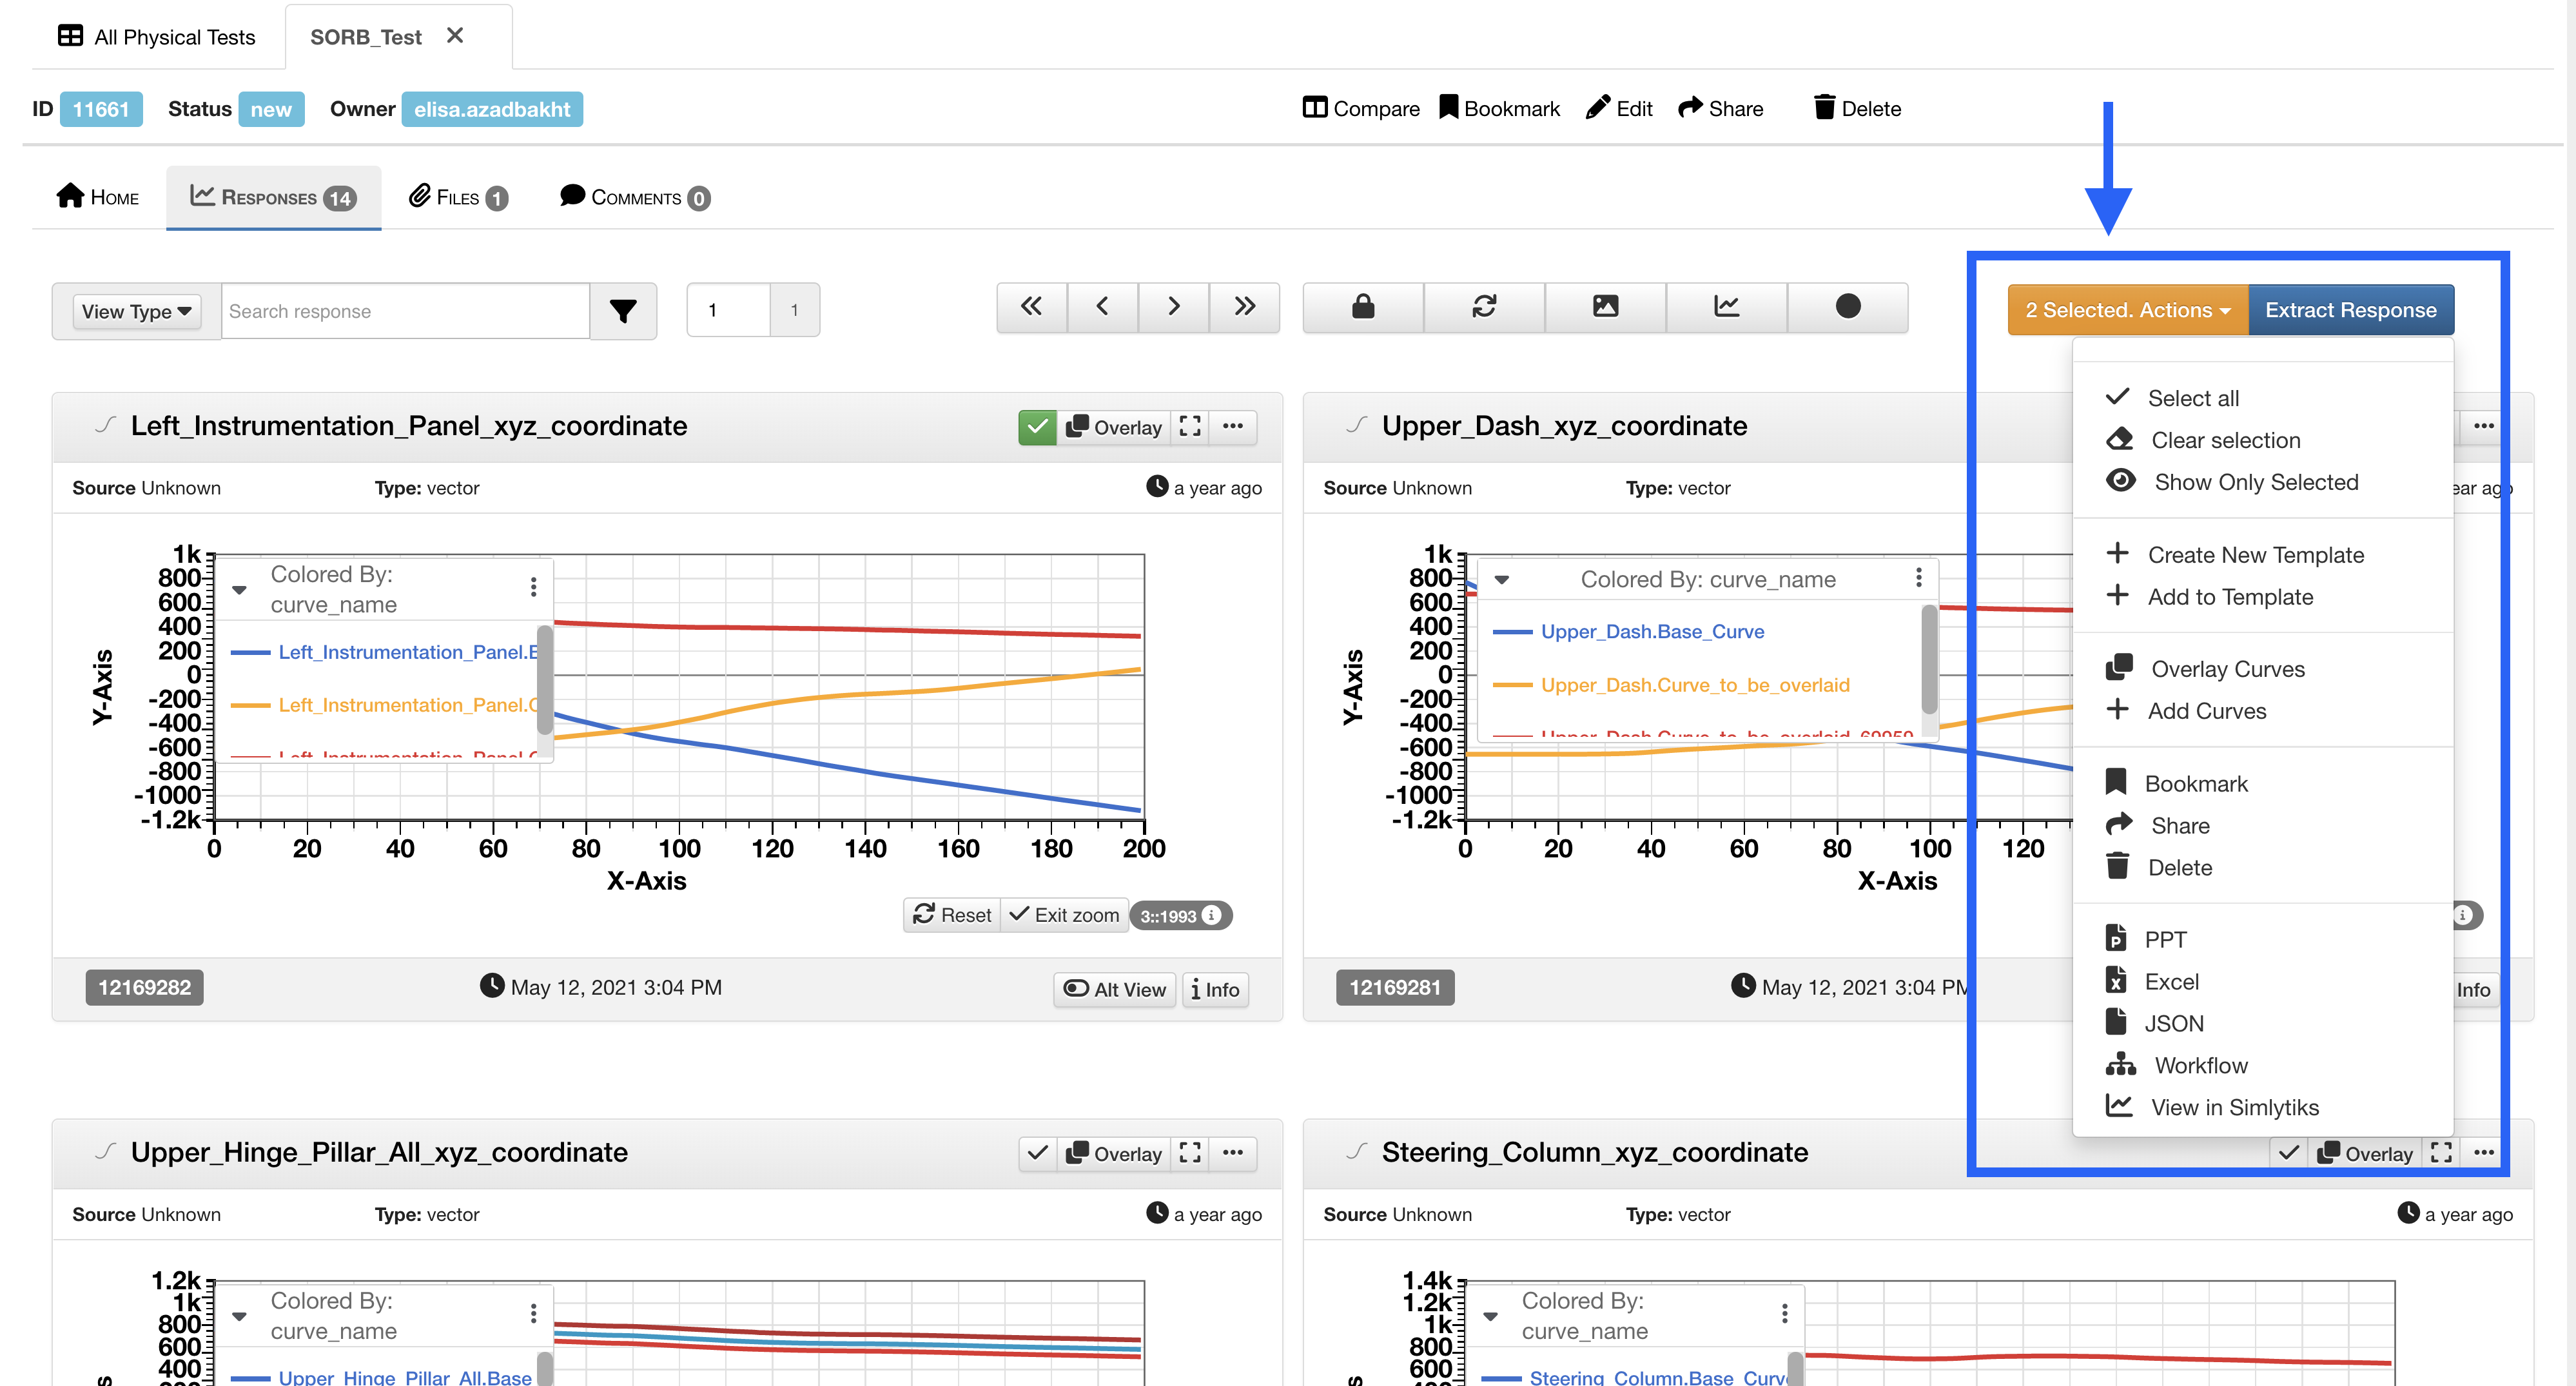
Figure 4: Physical Test Response Actions
Click on “Extract Responses” to create more responses or to apply a template.
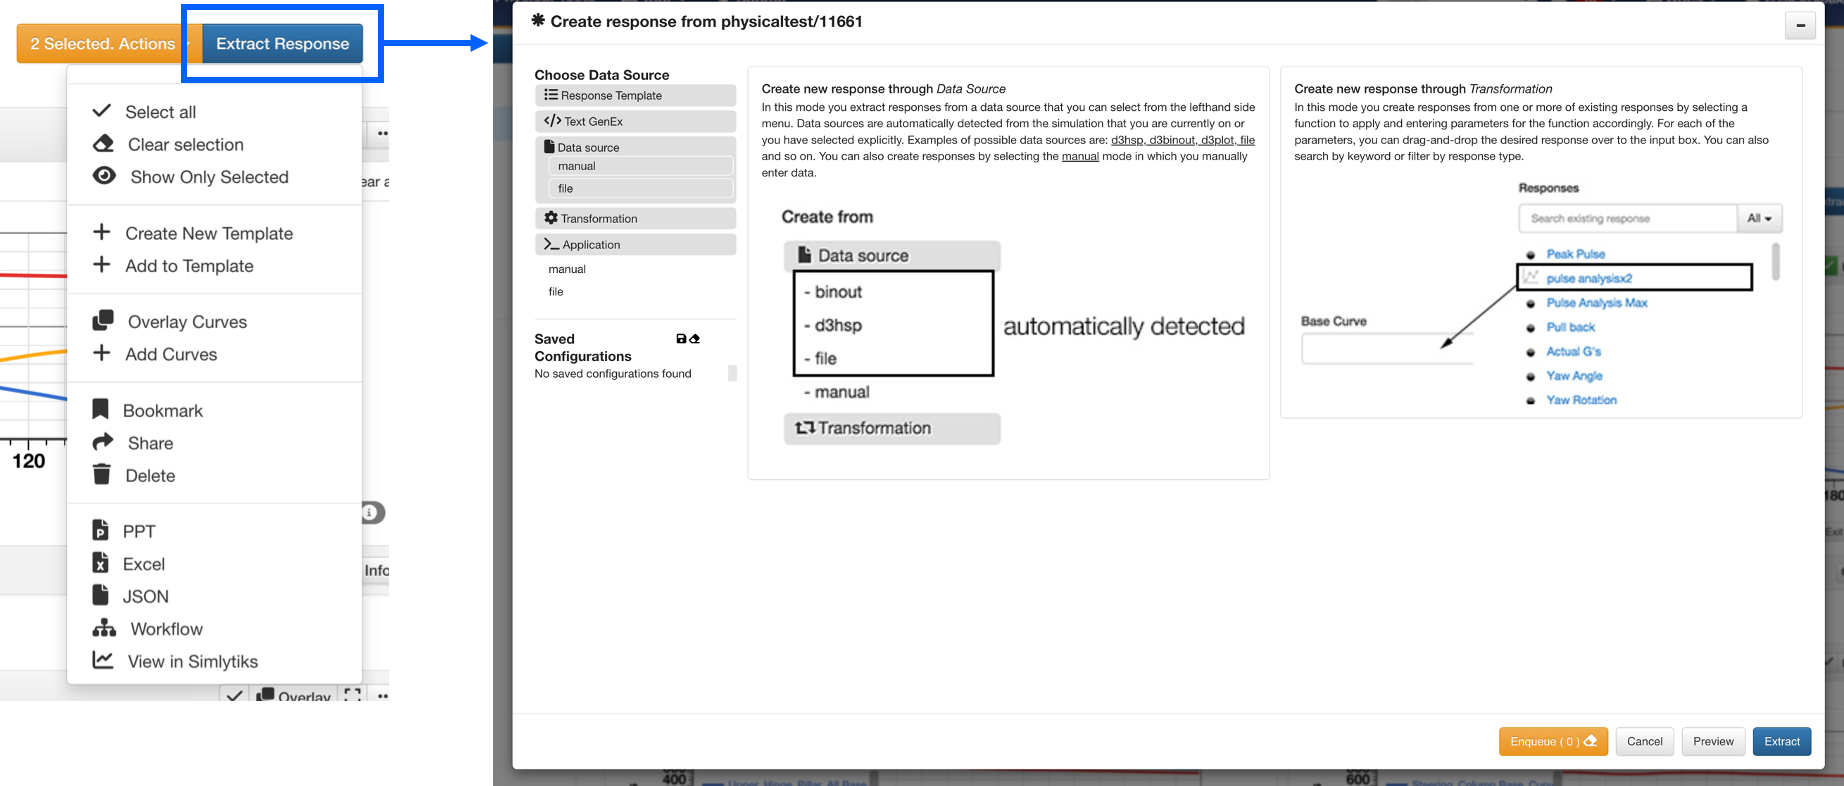
Figure 5: Add Physical Test Response
Curve Responses link with d3VIEW’s Curve Viewing Application Newton for enhanced analysis. To learn about Newton, follow this link.
Filtering Responses
Click on the filter icon at the top to use customized filters for sifting through your physical test responses.
- thumbnail:: /_images/Images/Physical_Tests/FilterResponses.png
title: Filter Responses
Figure 6: Filter Responses
The datatype filter has an array of filetypes to choose from including MDF/DAT file options which have been adde as of February 16, 2022.
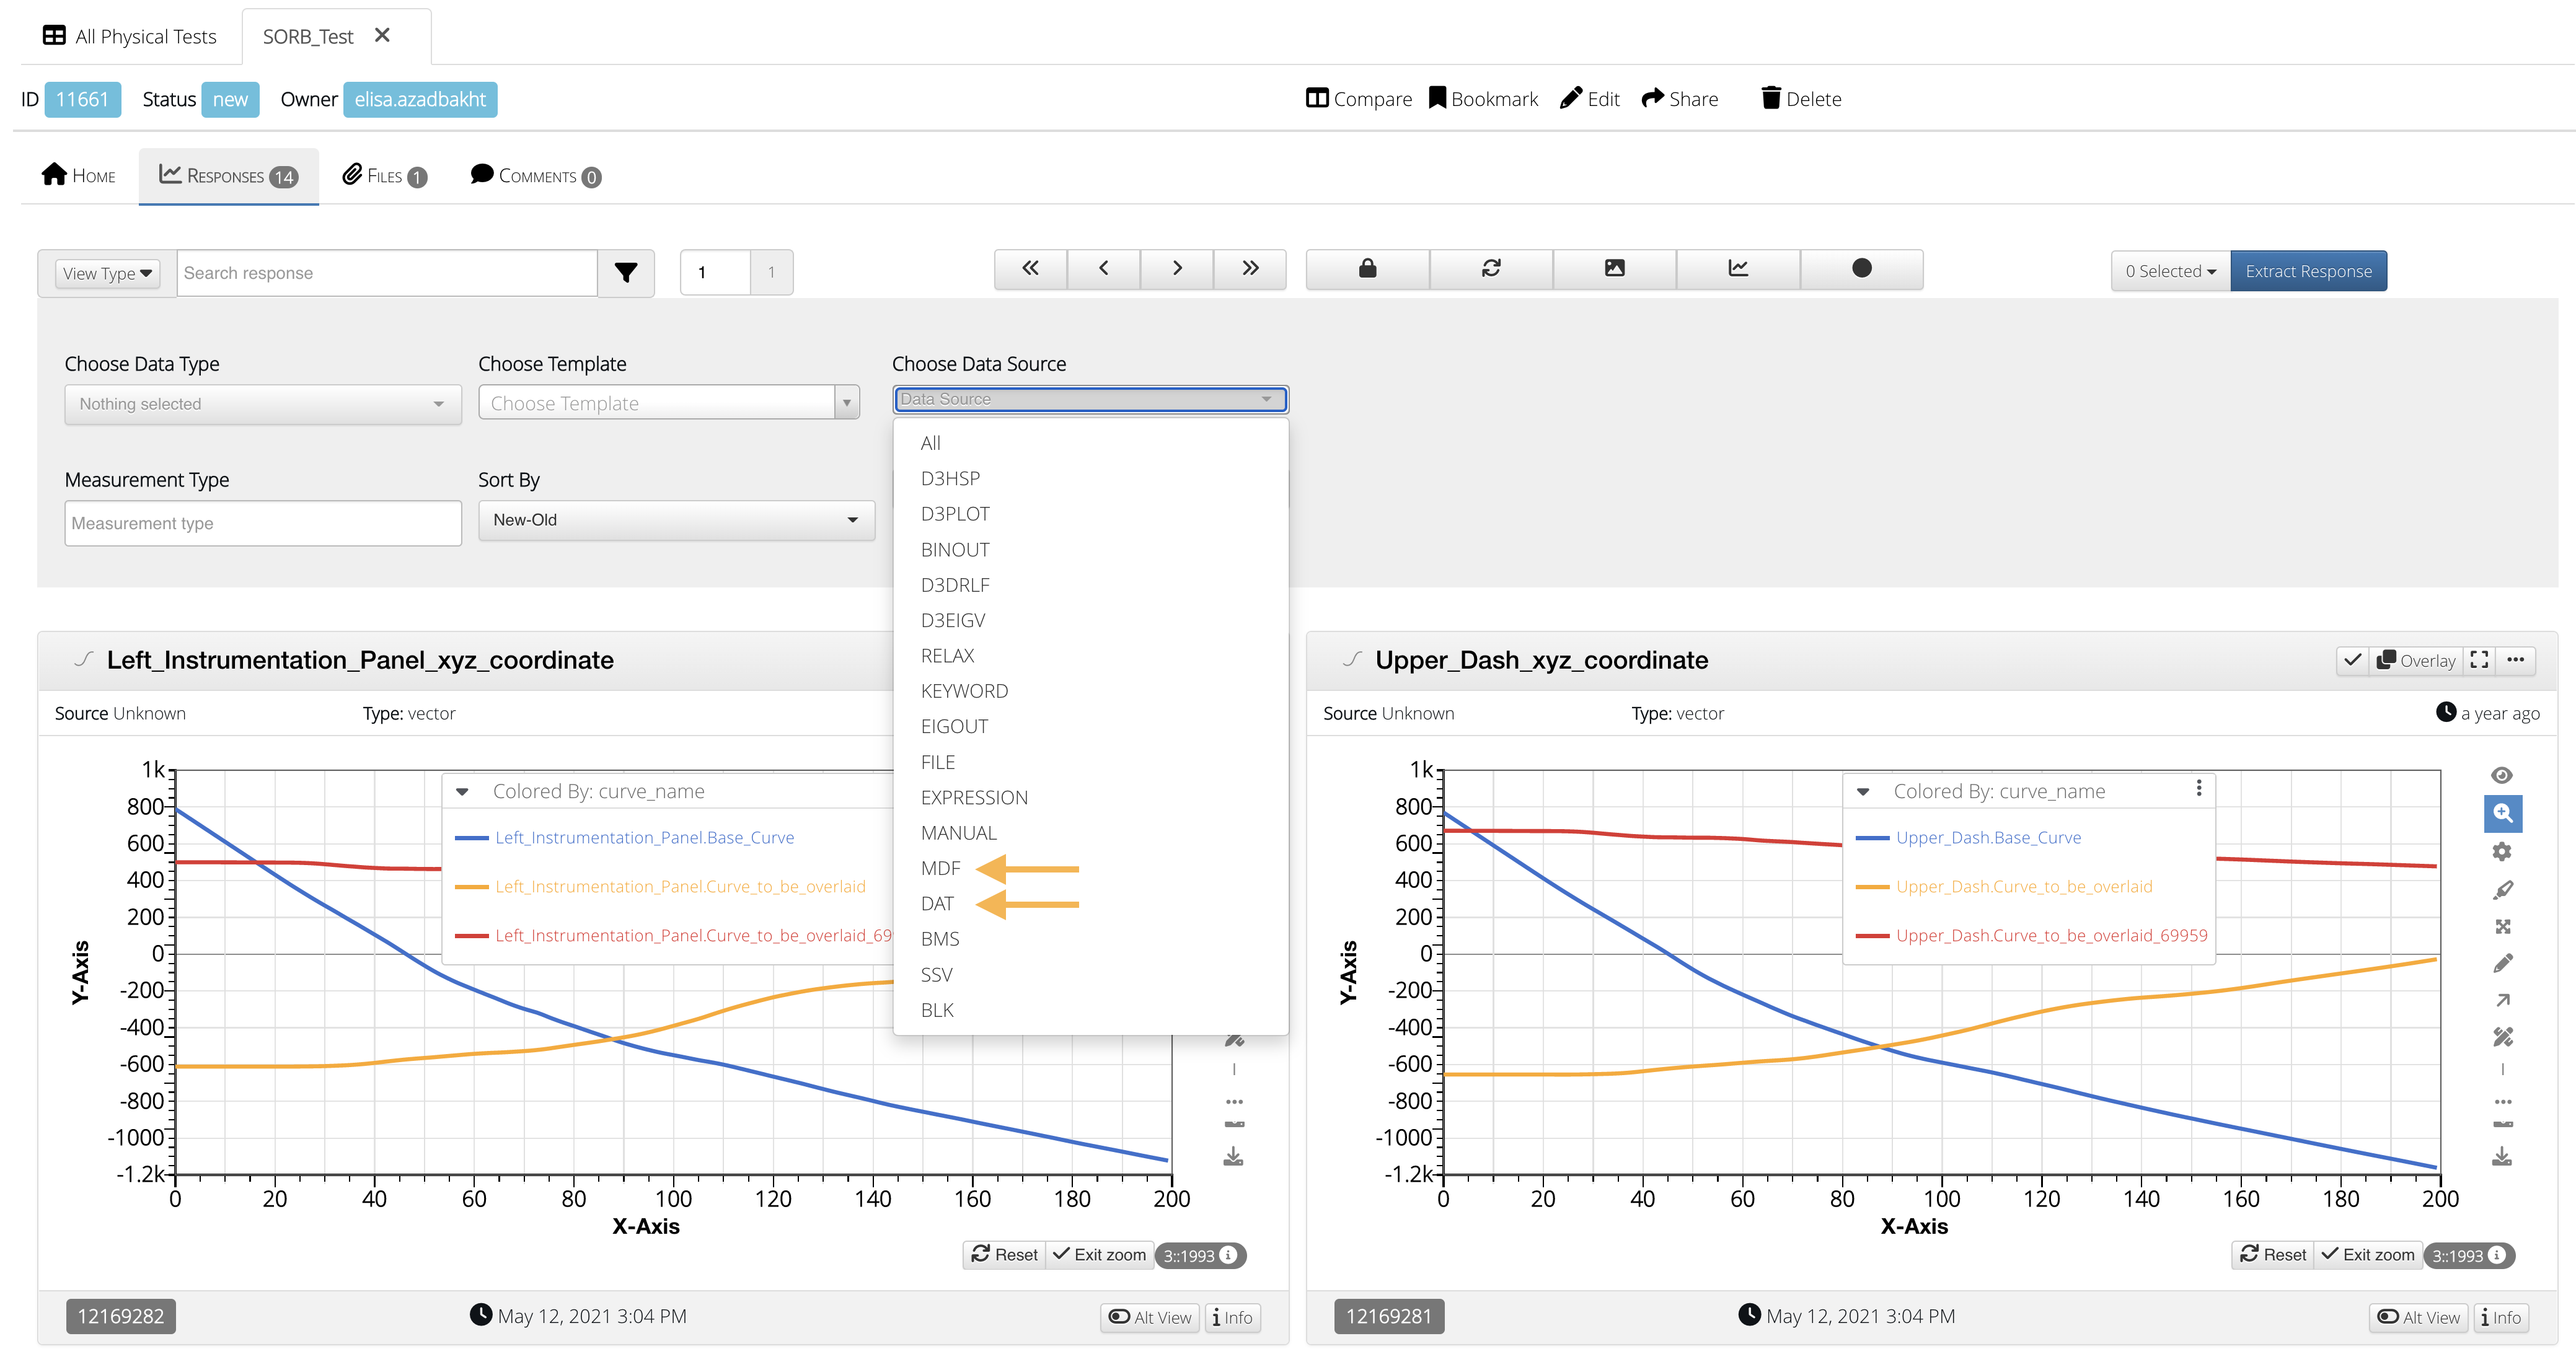
Figure 7: Filter Data Source
Adding / Viewing Files
Click on the “Files” tab of your physical test to review your uploaded files. You can also add more files by clicking on the “Add File” button and using the upload box.
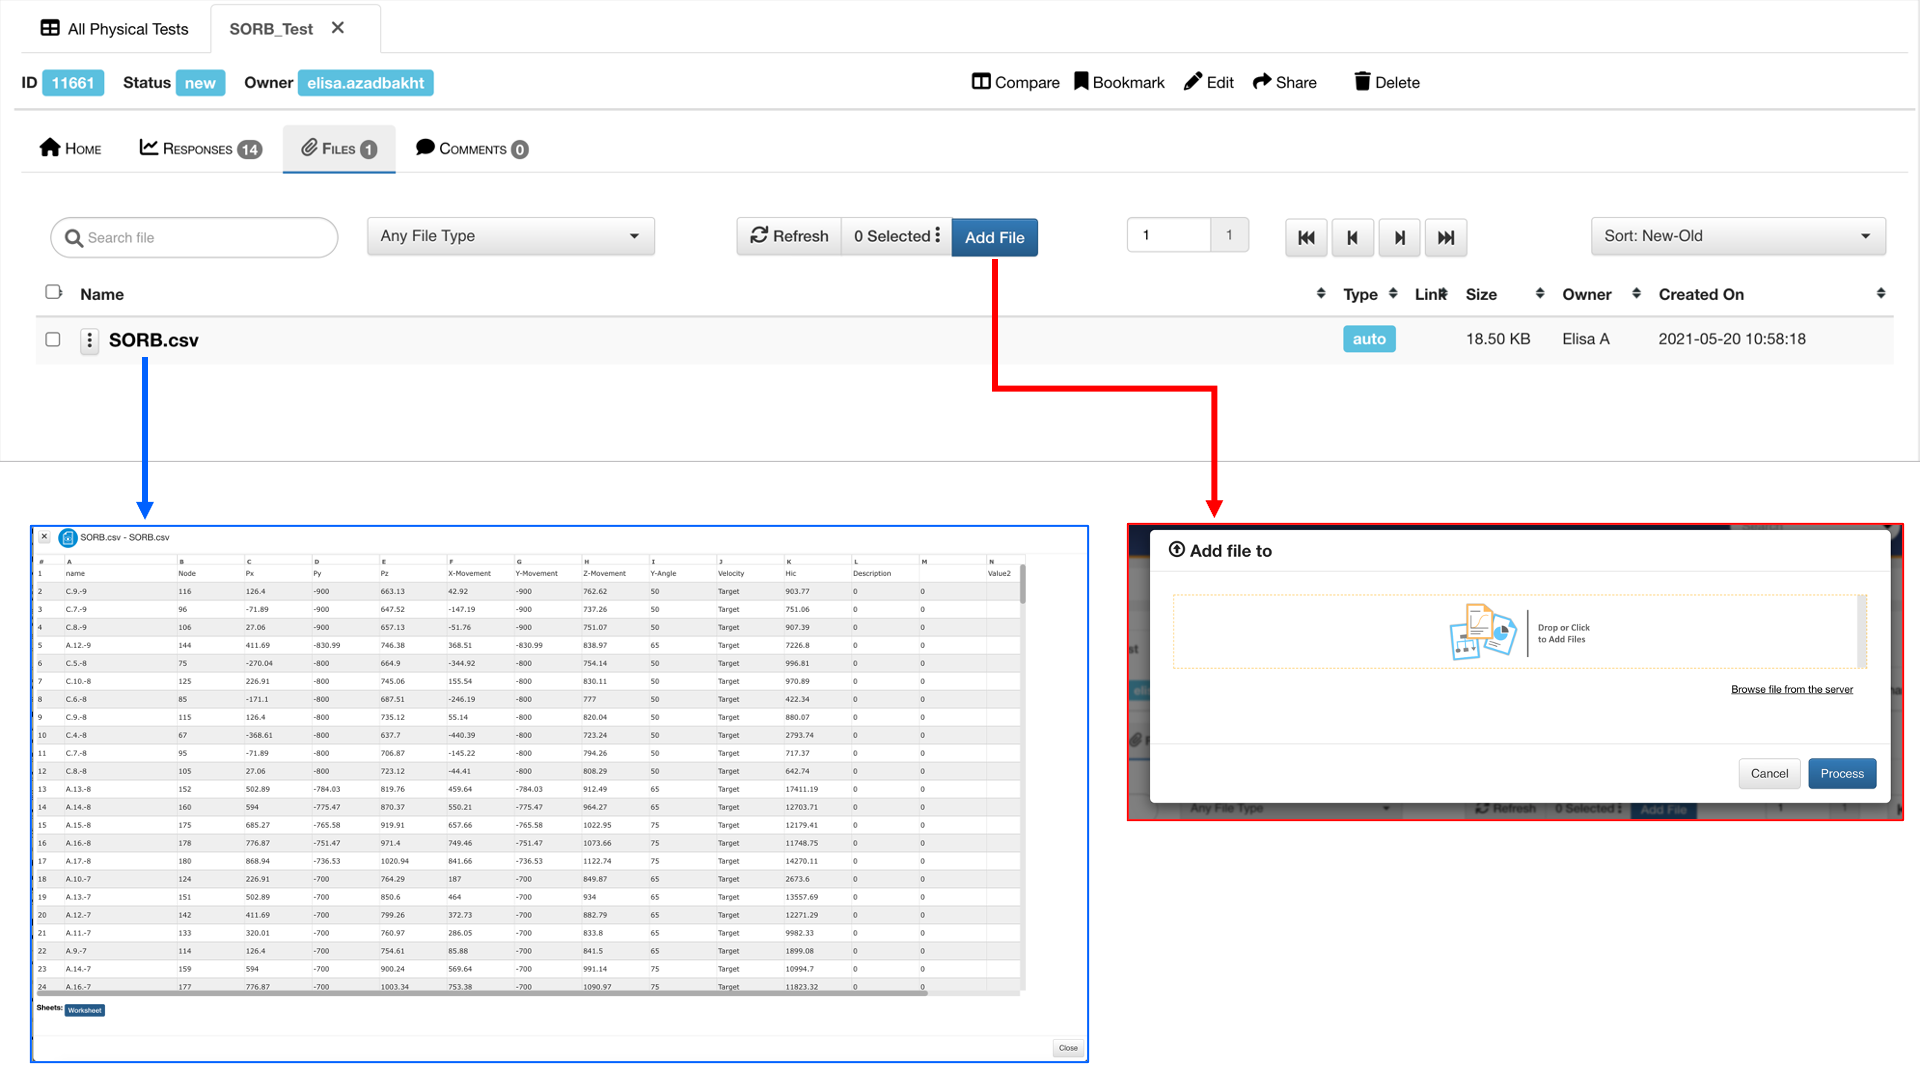
Figure 8: Physical Test Files
4.4. Comparing Tests with other Records
The platform makes it easy to compare your physical tests with other records, including your simulations, through the Simlytiks visualization application. Start by clicking the check mark box next to a test to select it. Select as many as you would like to compare, and then click “Compare” under the “Selected” drop-down menu.
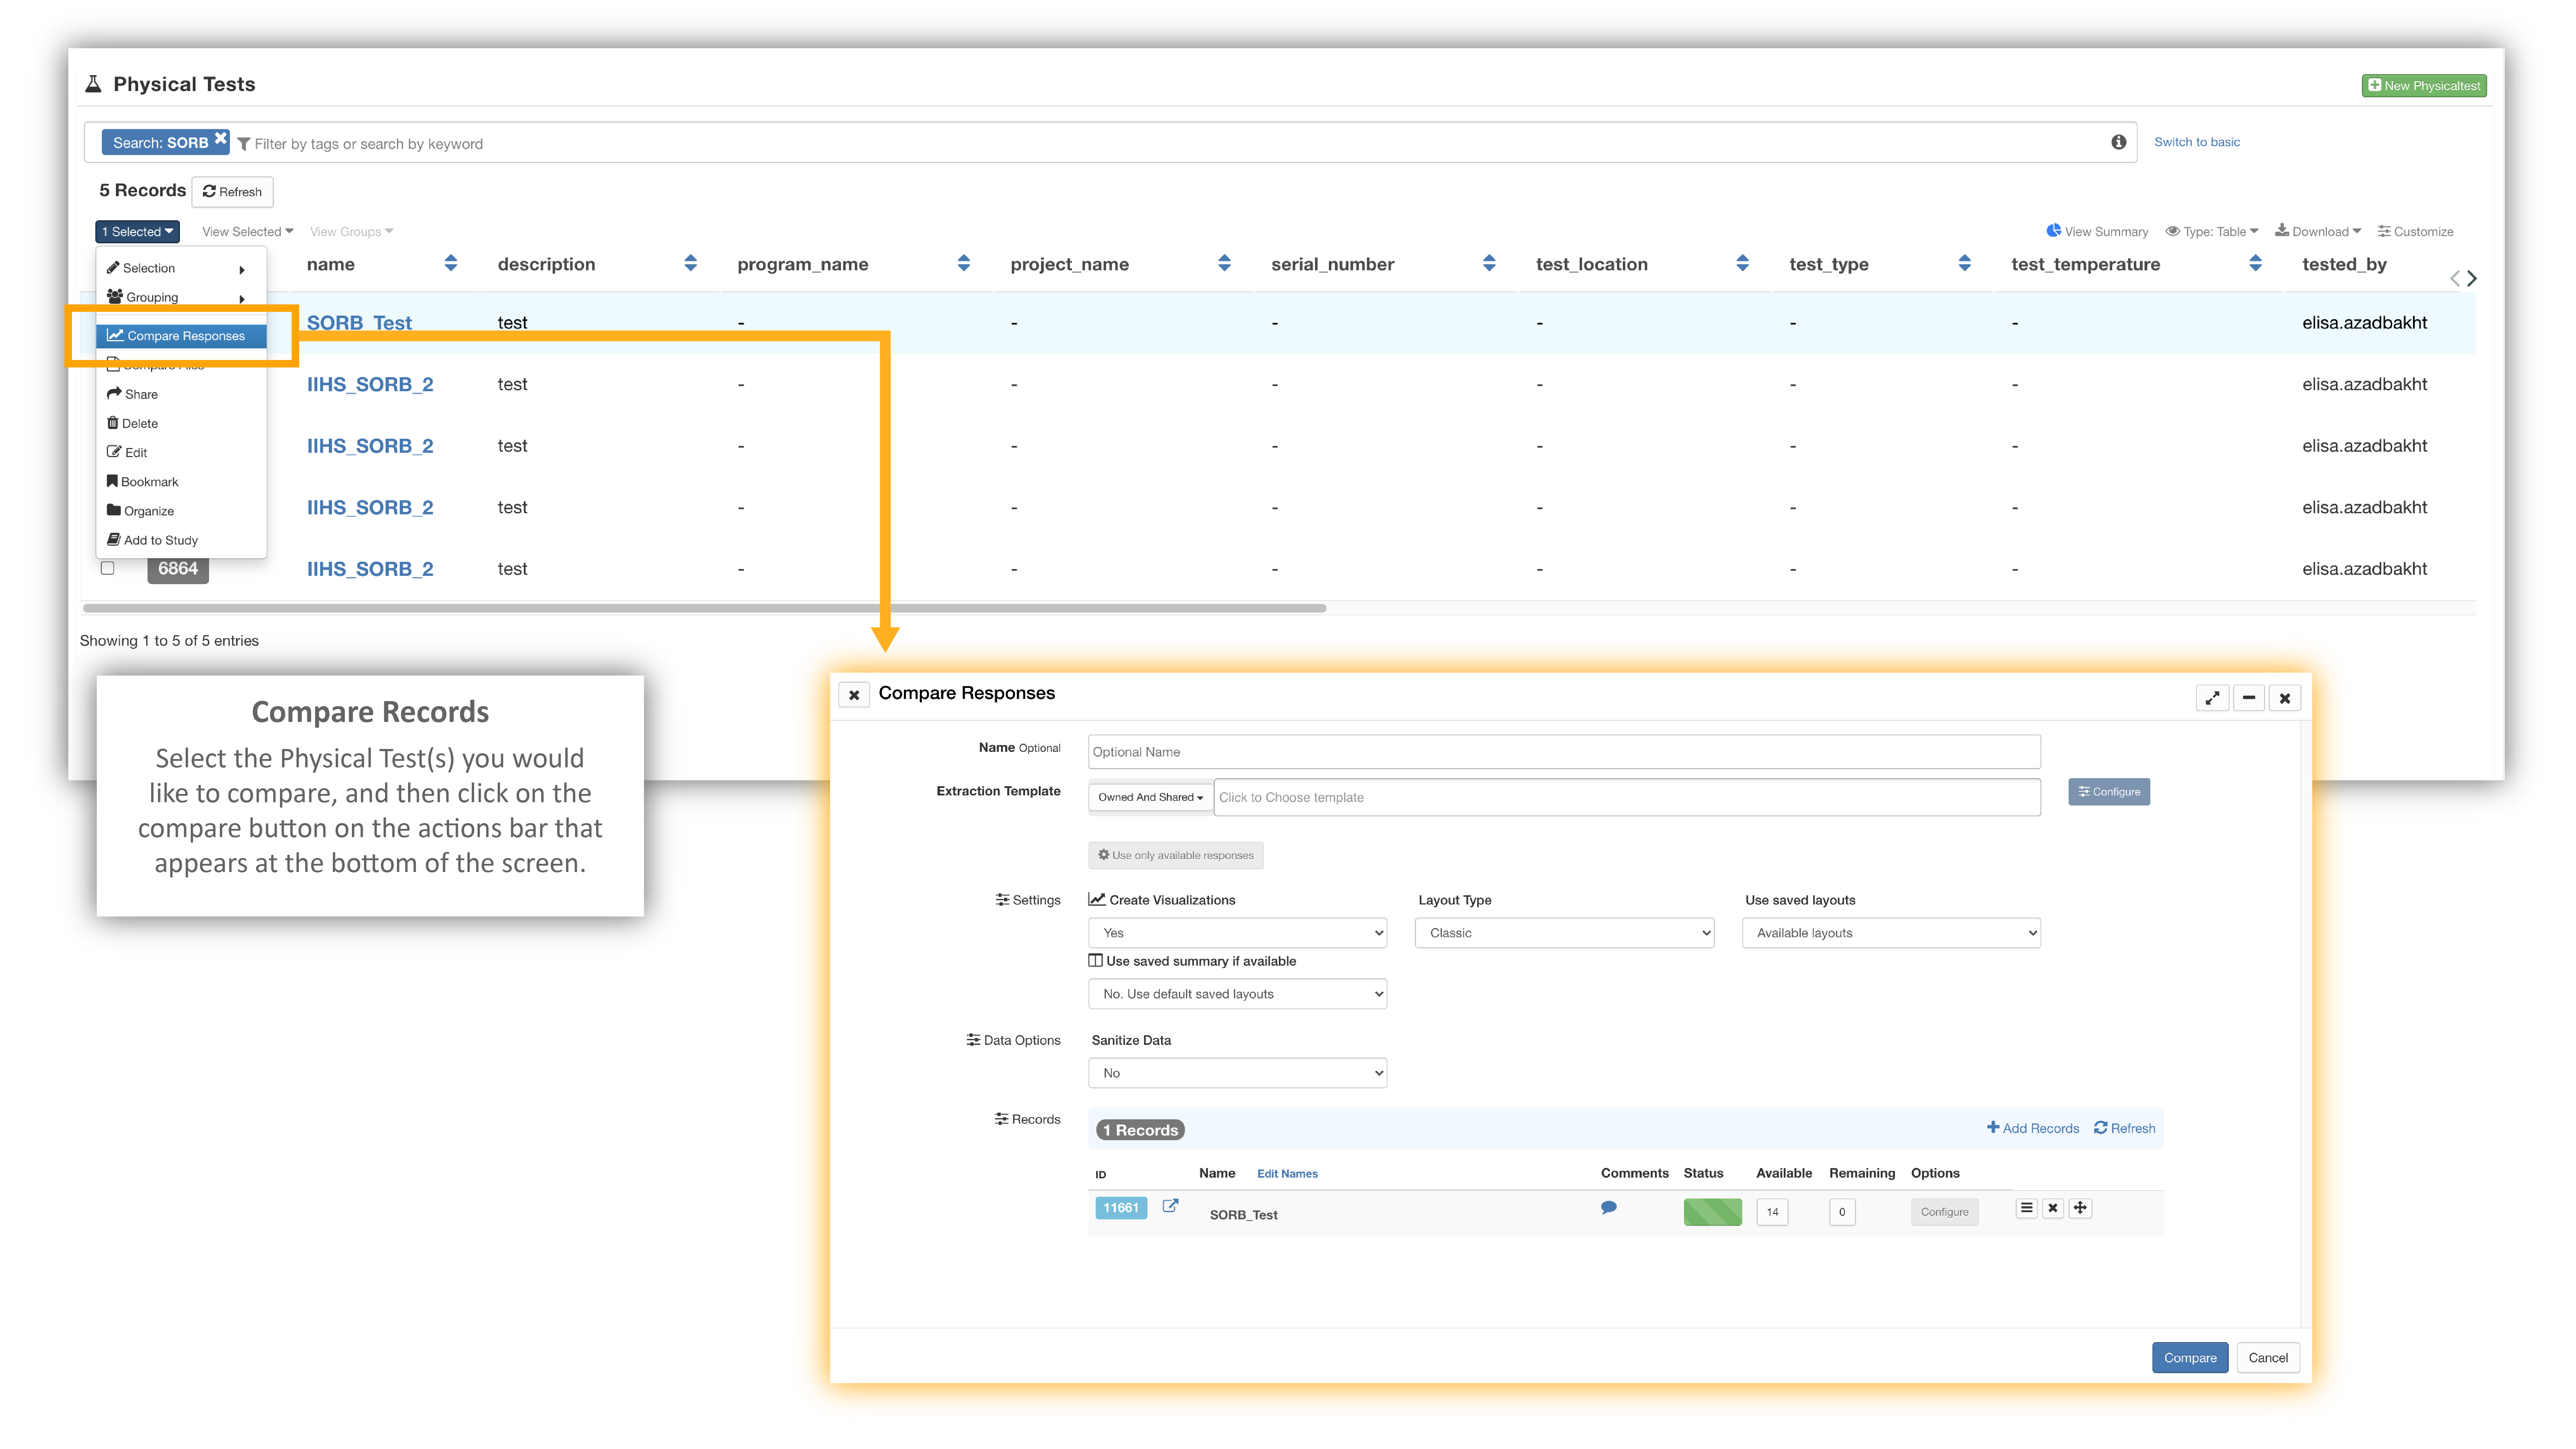
Figure 1: Opening Compare Records Window
Once the window pops up, you can click “Add Records” in the middle to search for and add more records to compare.
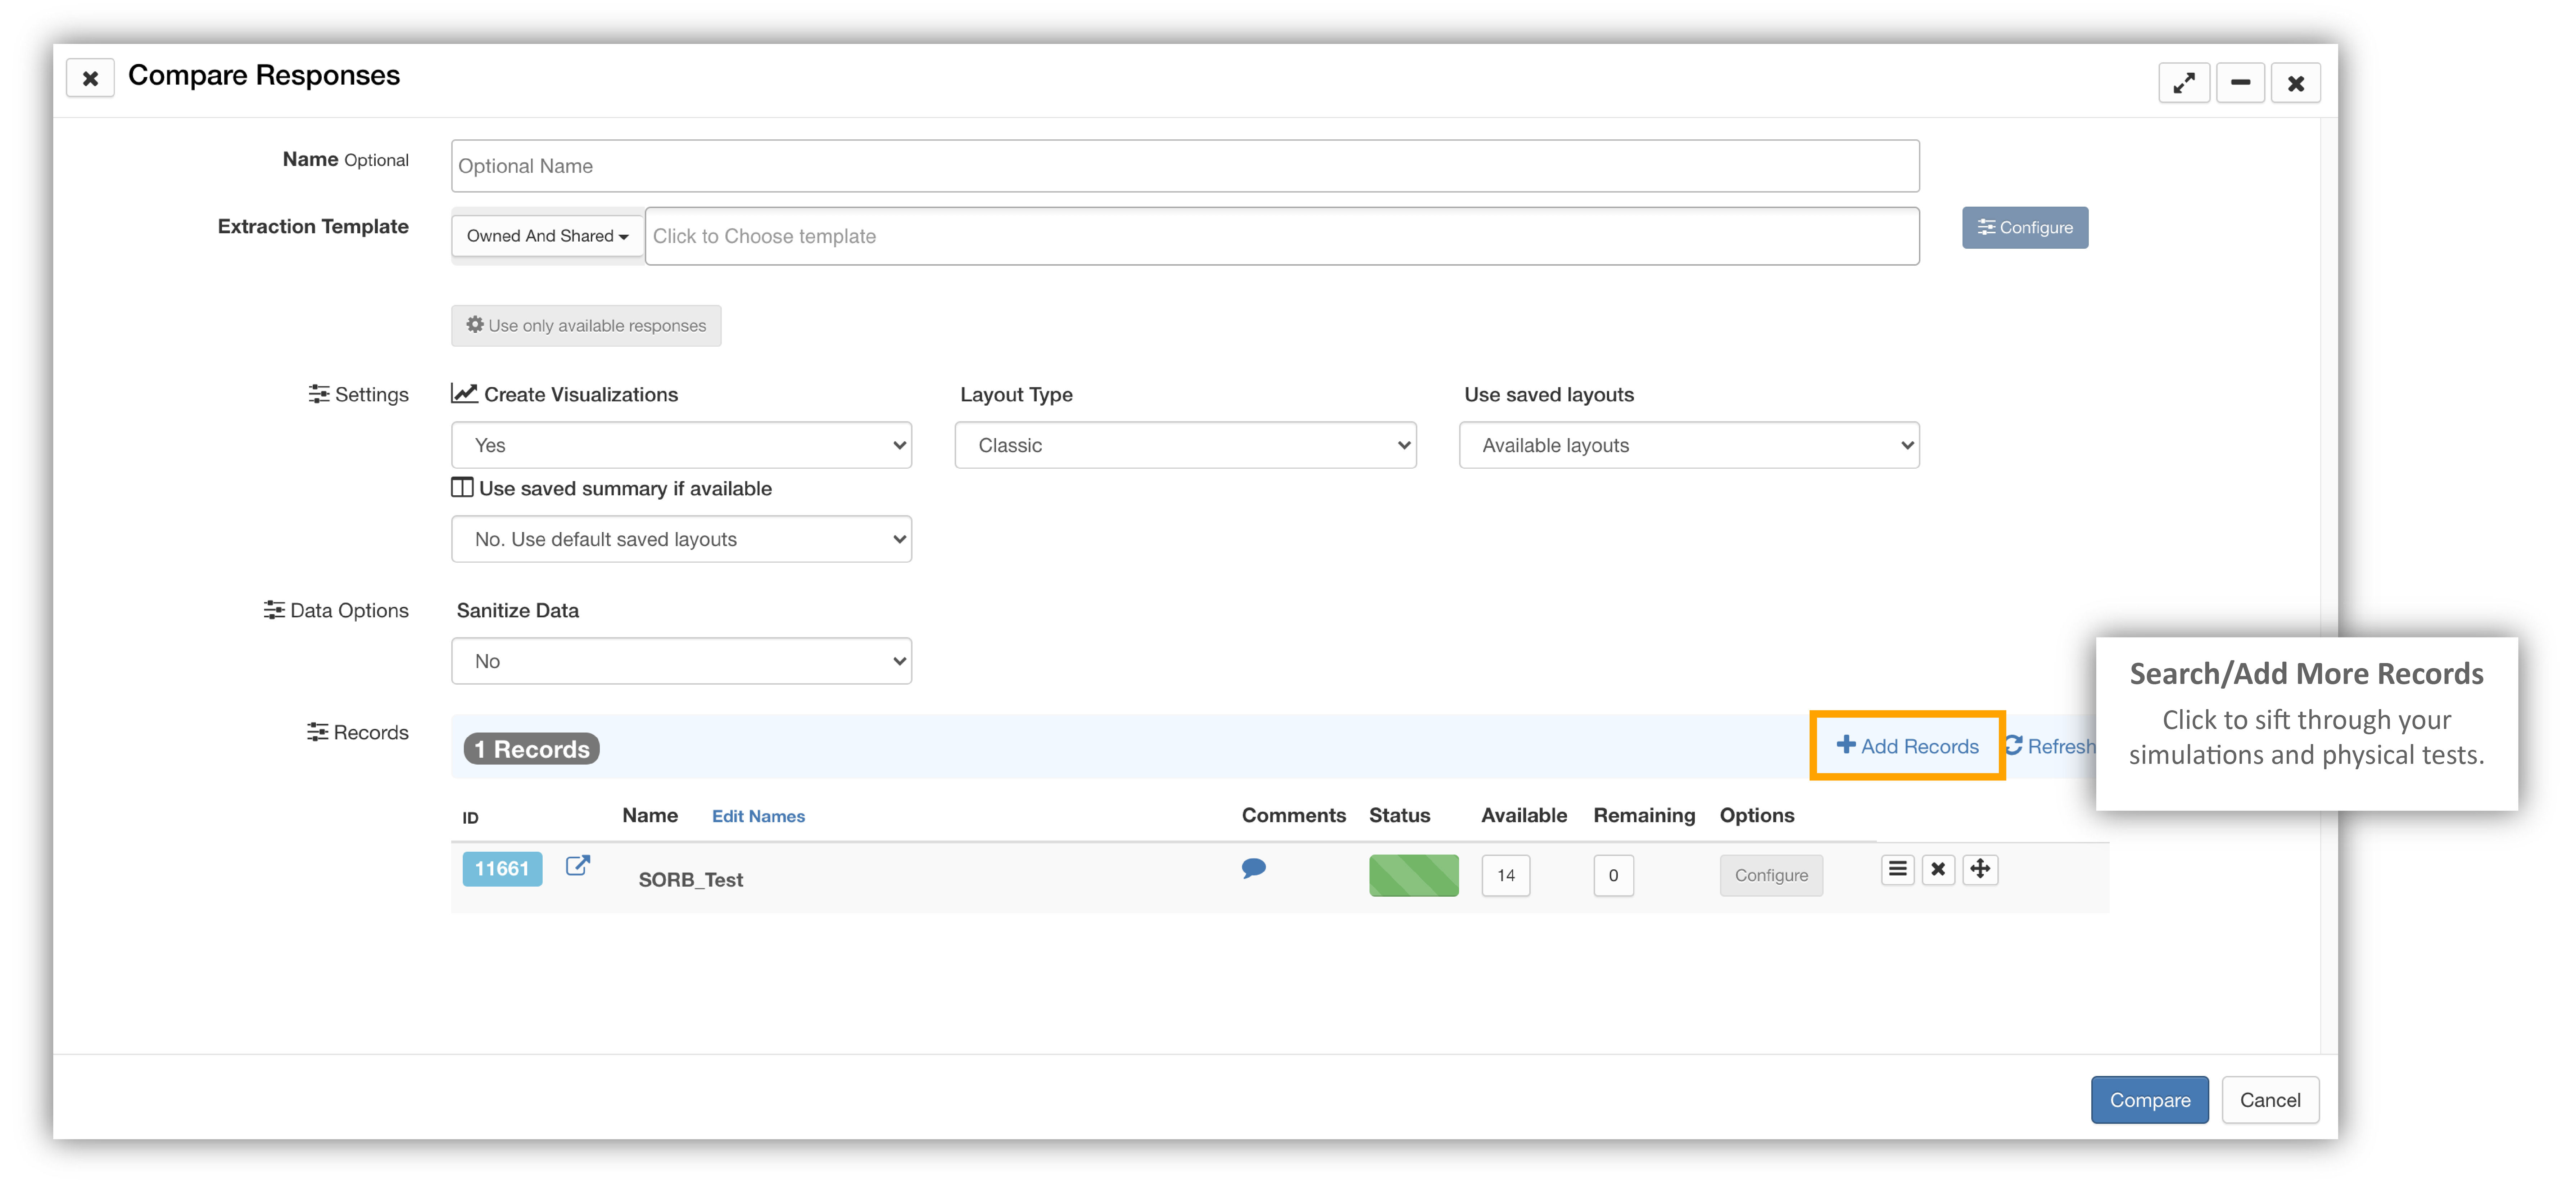
Figure 2: Add More Records Button
Then, use the “Choose data (records)” drop-down menu to switch between your physical tests and simulations. All your separate records for the particular chosen section will be shown on the list to the left. Click the “Select” button next to a particular record to add or drag it to the “Selected” list to the right.
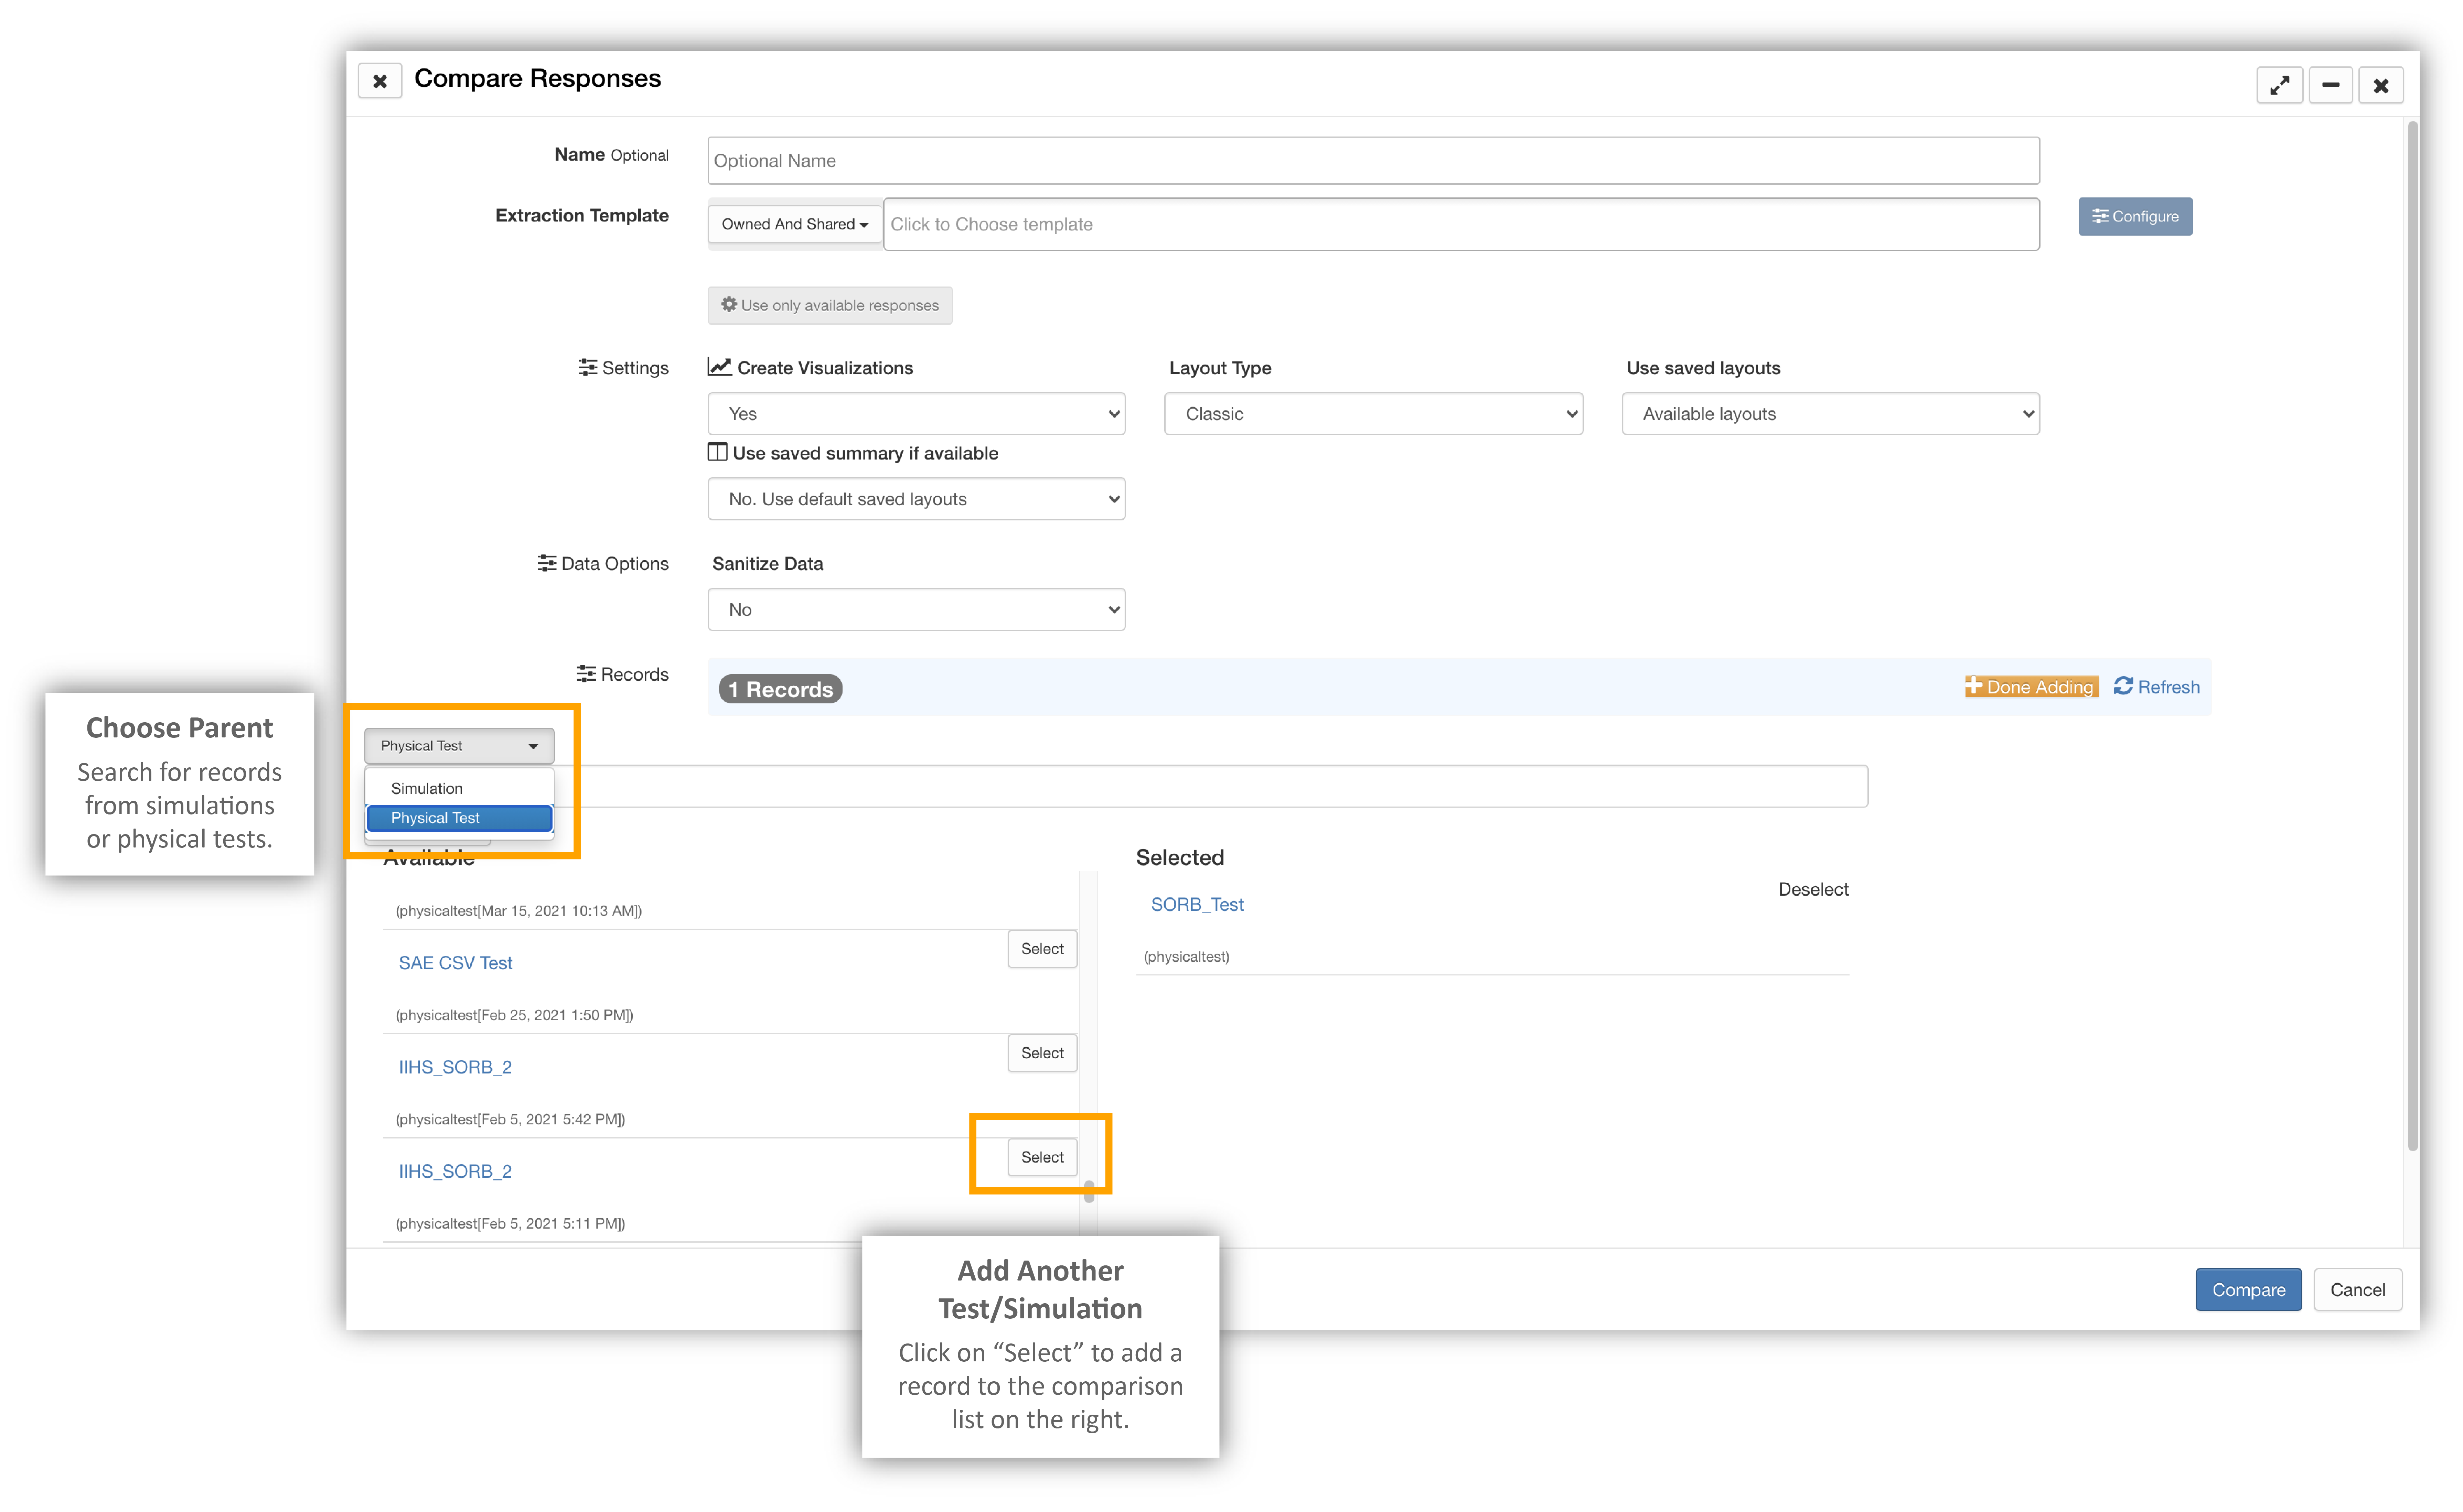
Figure 3: Search for and Add Records
Once you have chosen all the records you would like to compare, make sure to choose any corresponding templates. Then, click on the “Process” button at the bottom to open the records in the Simlytiks application.
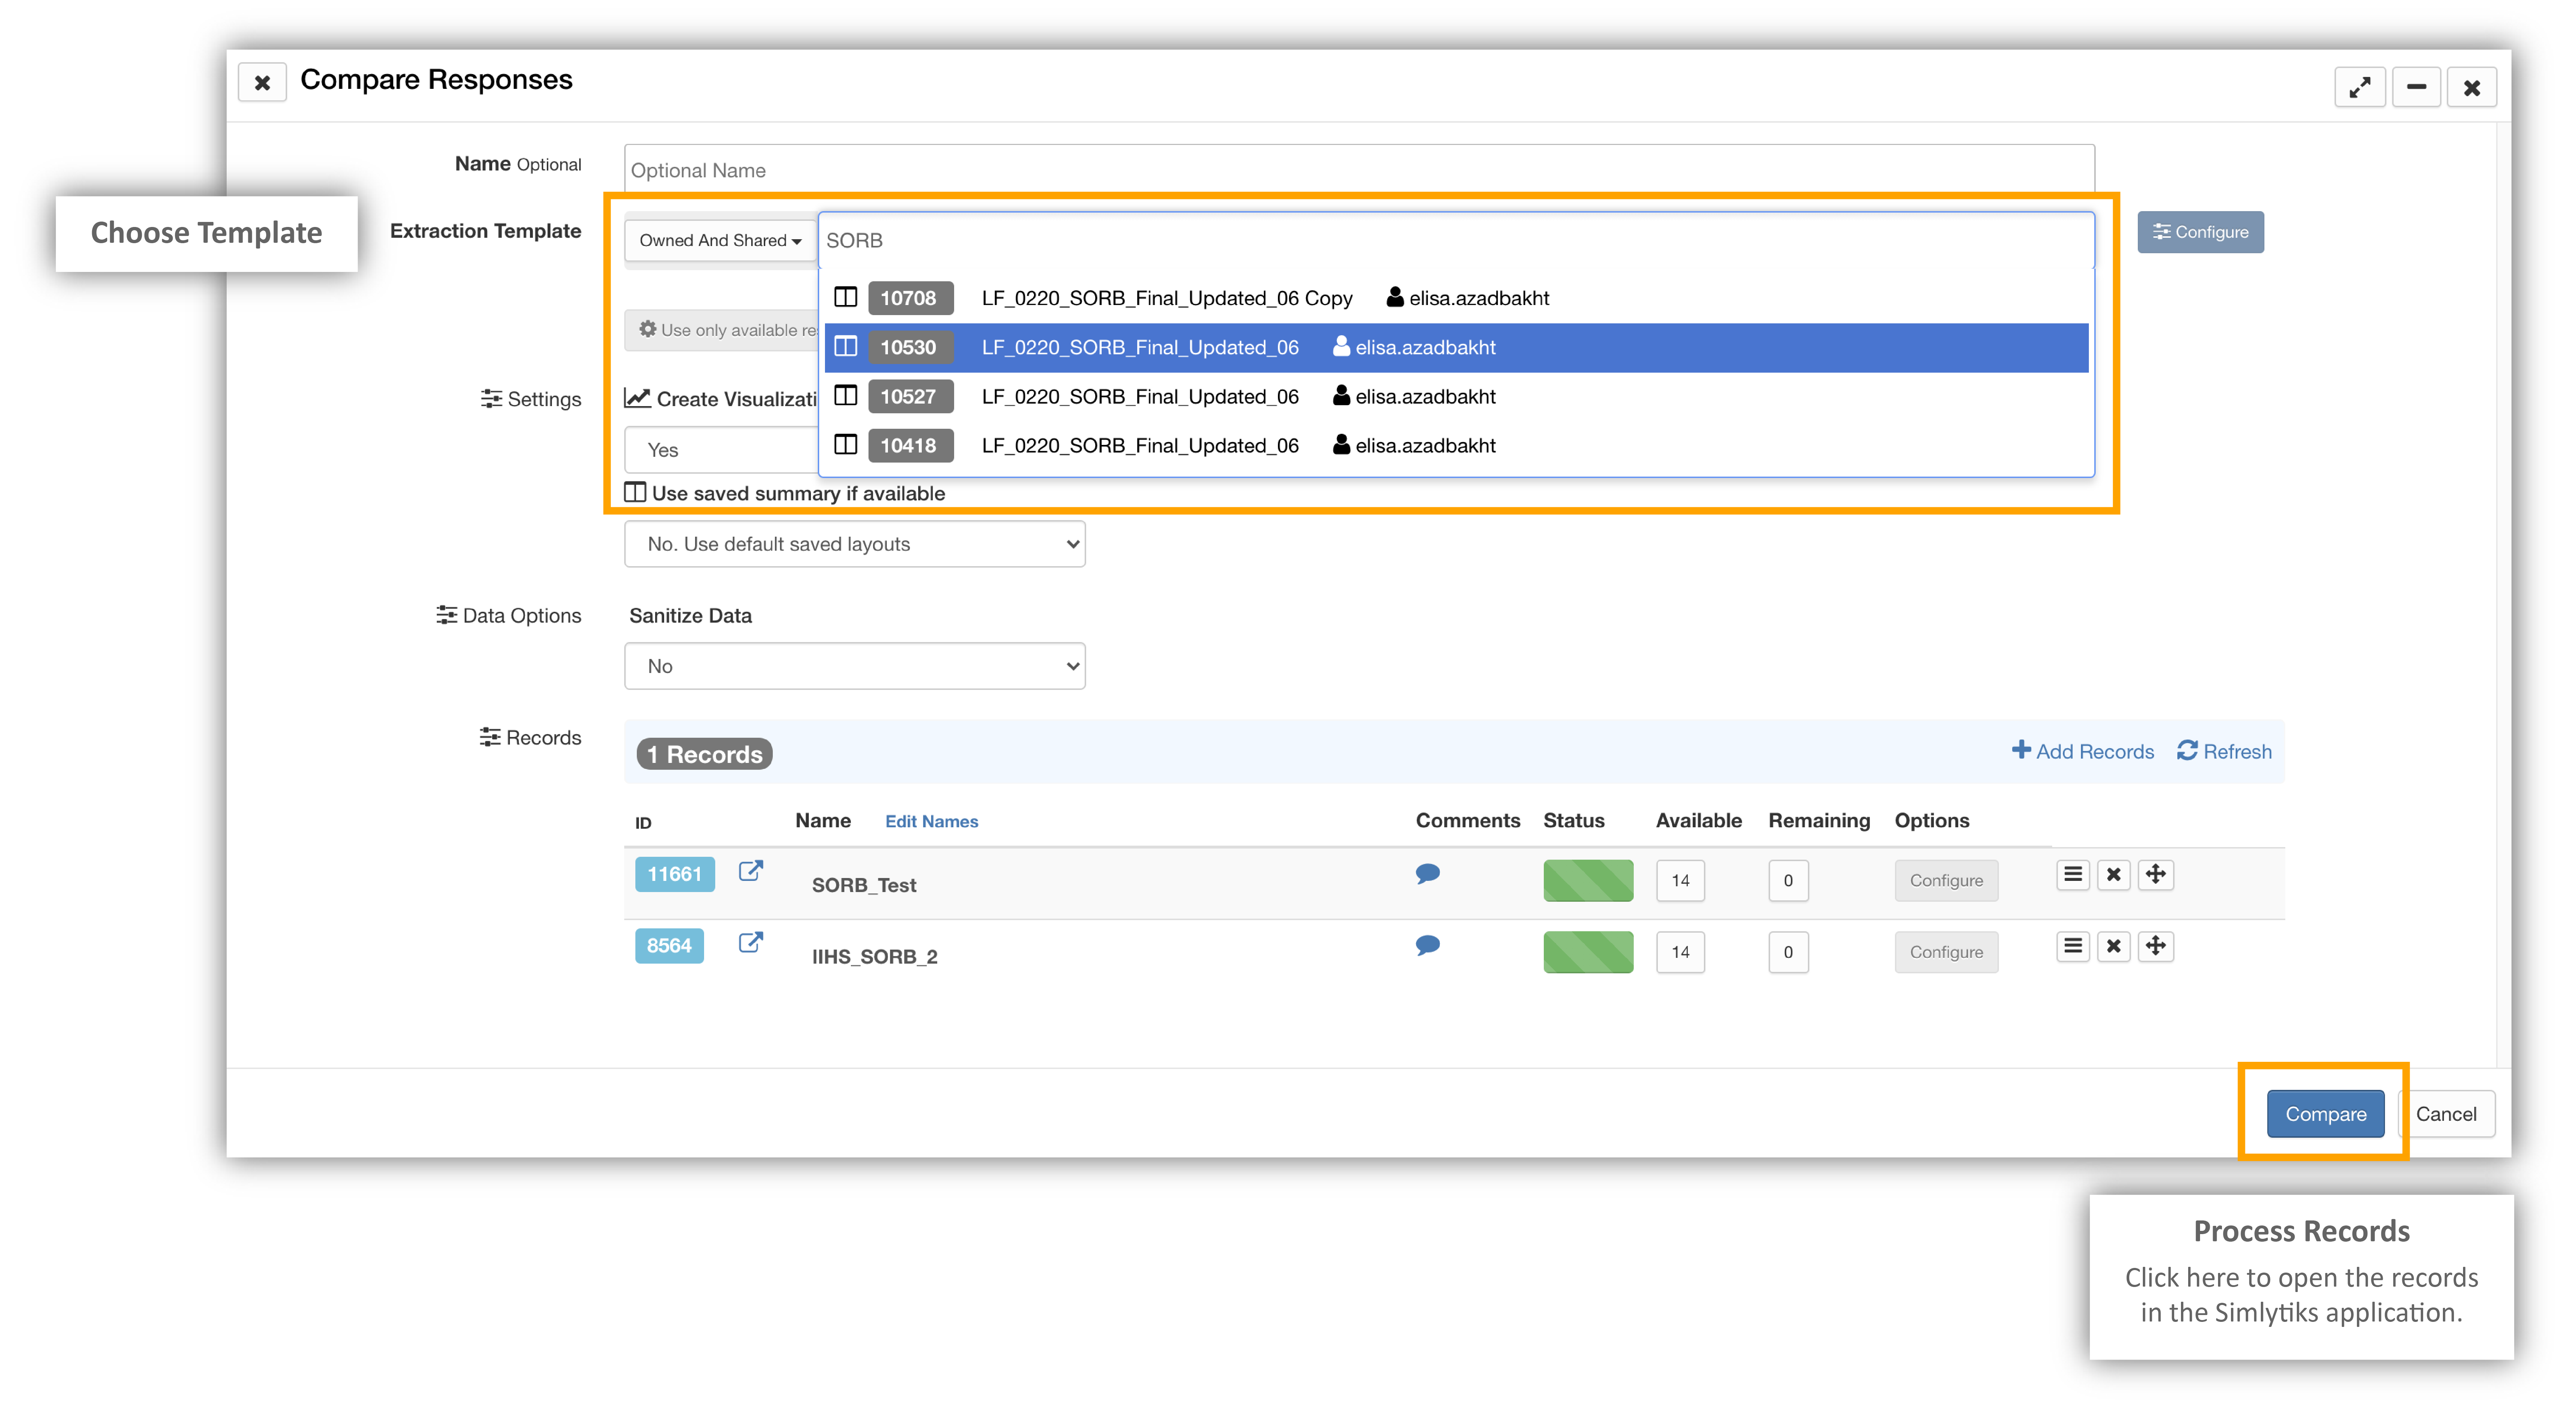
Figure 4: Process Records for Comparison
Here, you can visualize aspects of the records for comparison. Please see the Simlytiks section to better understand how to visualize your records.
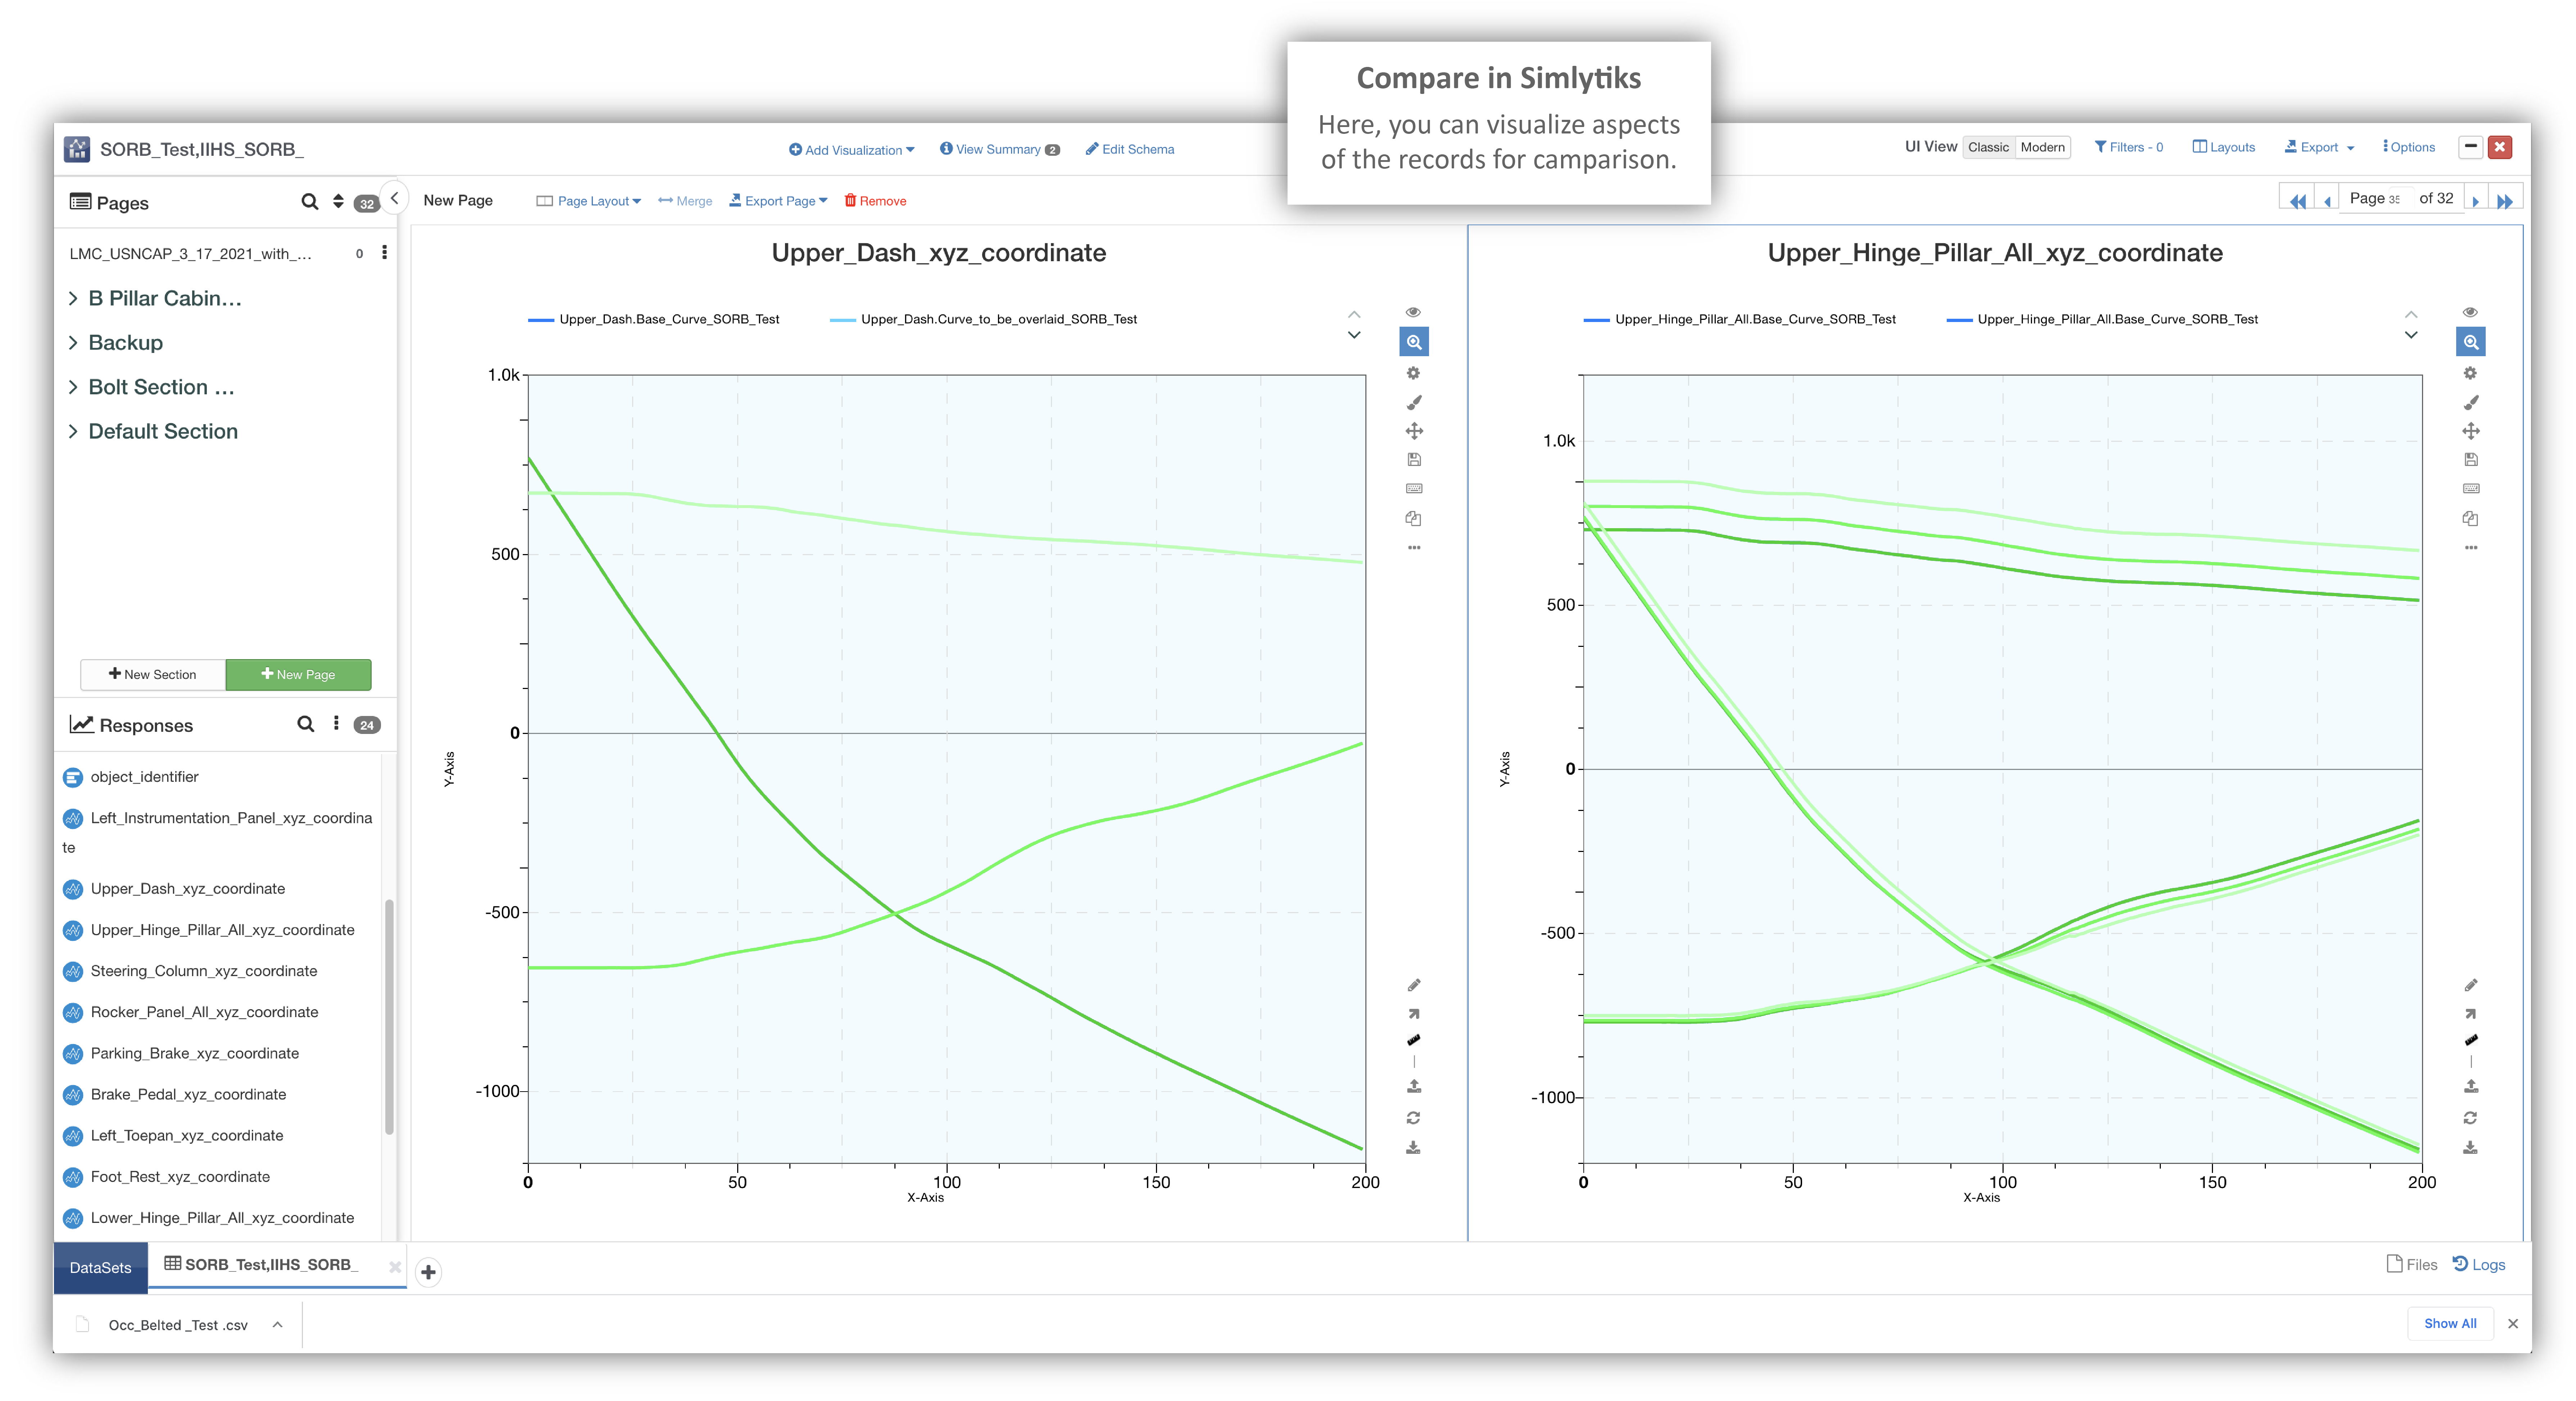
Figure 5: Visualize Records in Simlytiks
New as of June 1, 2002, you can turn on record view for Simlytiks Pivot Table visualizer by enabling the Link Cells to Tests/Simulations option.

Figure 6: Link Simulation/Test Records
For additional questions about how to navigate the d3VIEW platform, please feel free to email our team at: support@d3view.com.