5. Databases
d3VIEW’s Databases application provides an effective solution for organizing and storing large amounts of data. The application efficiently cleans and structures data so it is easier to visualize, understand and study. Databases’ centralized data management system eases sharing between multiple users, while the built-in interactive visualizers powerfully support productive decision-making.
Features
- Define simple and scientific databases
- Filters and aggregators
- Easy sharing and exporting
- Comparisons and visualizations
- Save and apply layouts
What Will Be Covered
- Creating a Database
- Viewing a Database
- Visualizing a Database
5.1. Creating a Database
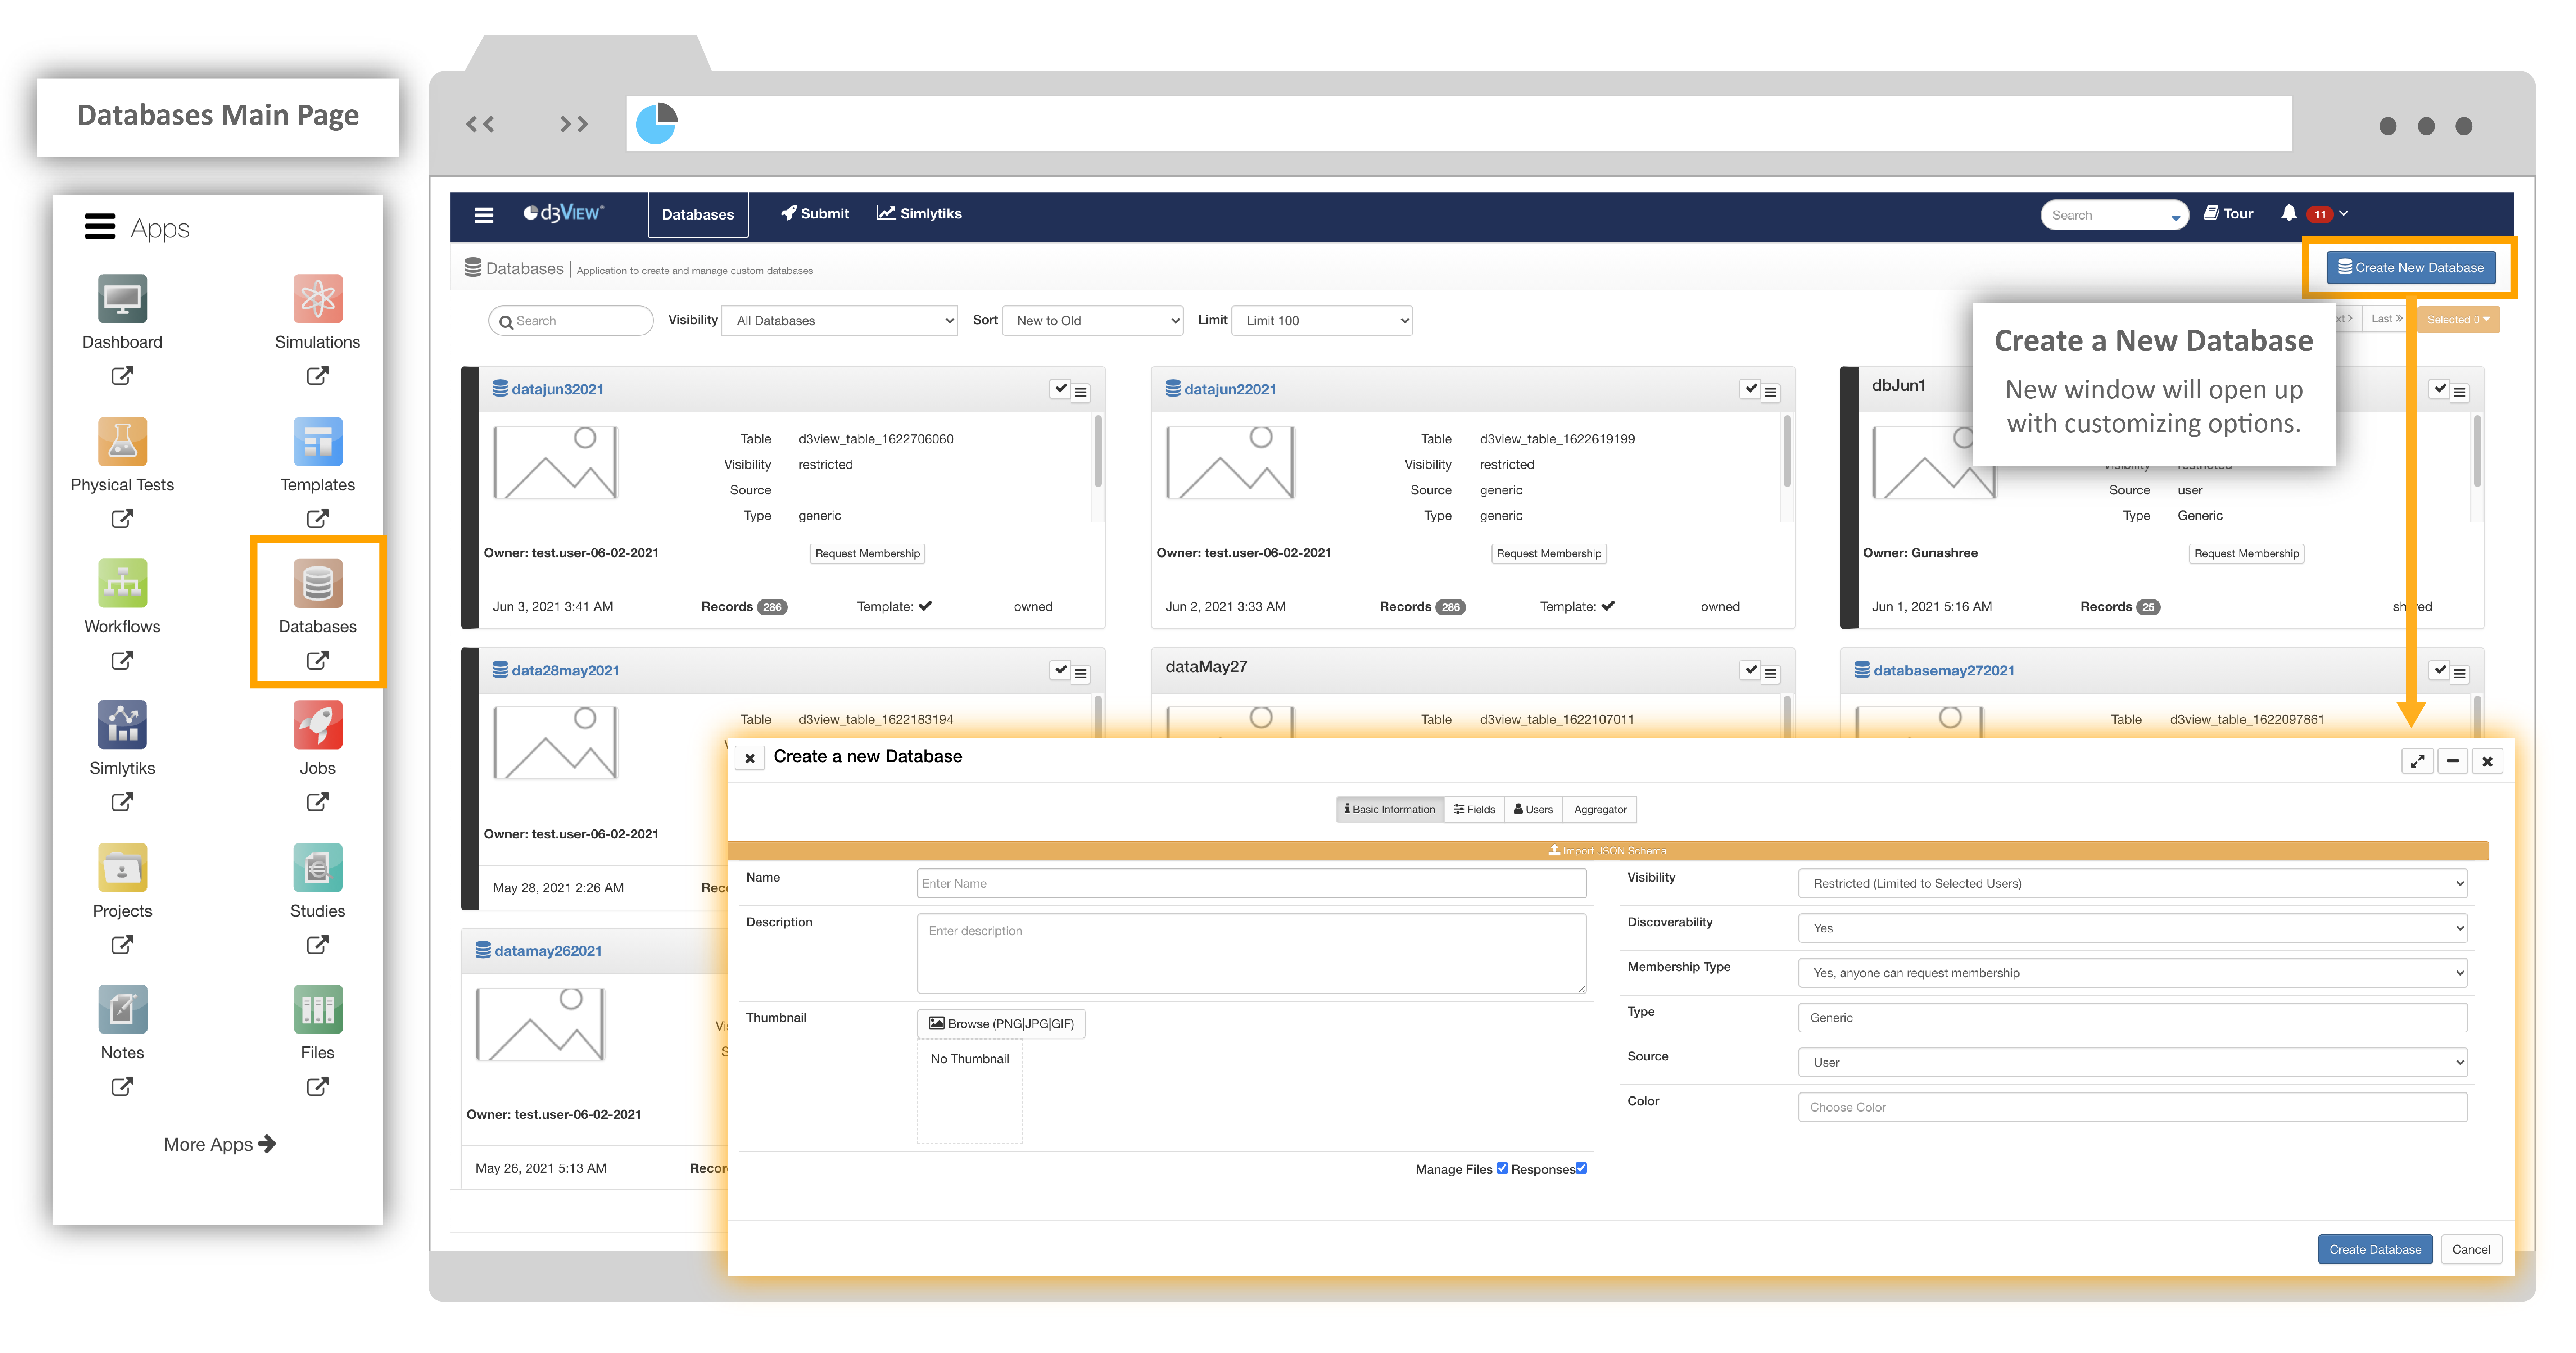
The first step in structuring your data for studying and comparing is creating the database. You can create different Databases based on how they are defined, which data is imported, which users have access and how the data is aggregated. Here, you tell the application exactly how to organize and structure your data. Start by clicking on ‘Create Database’ in the top right corner of the screen.
Create Database
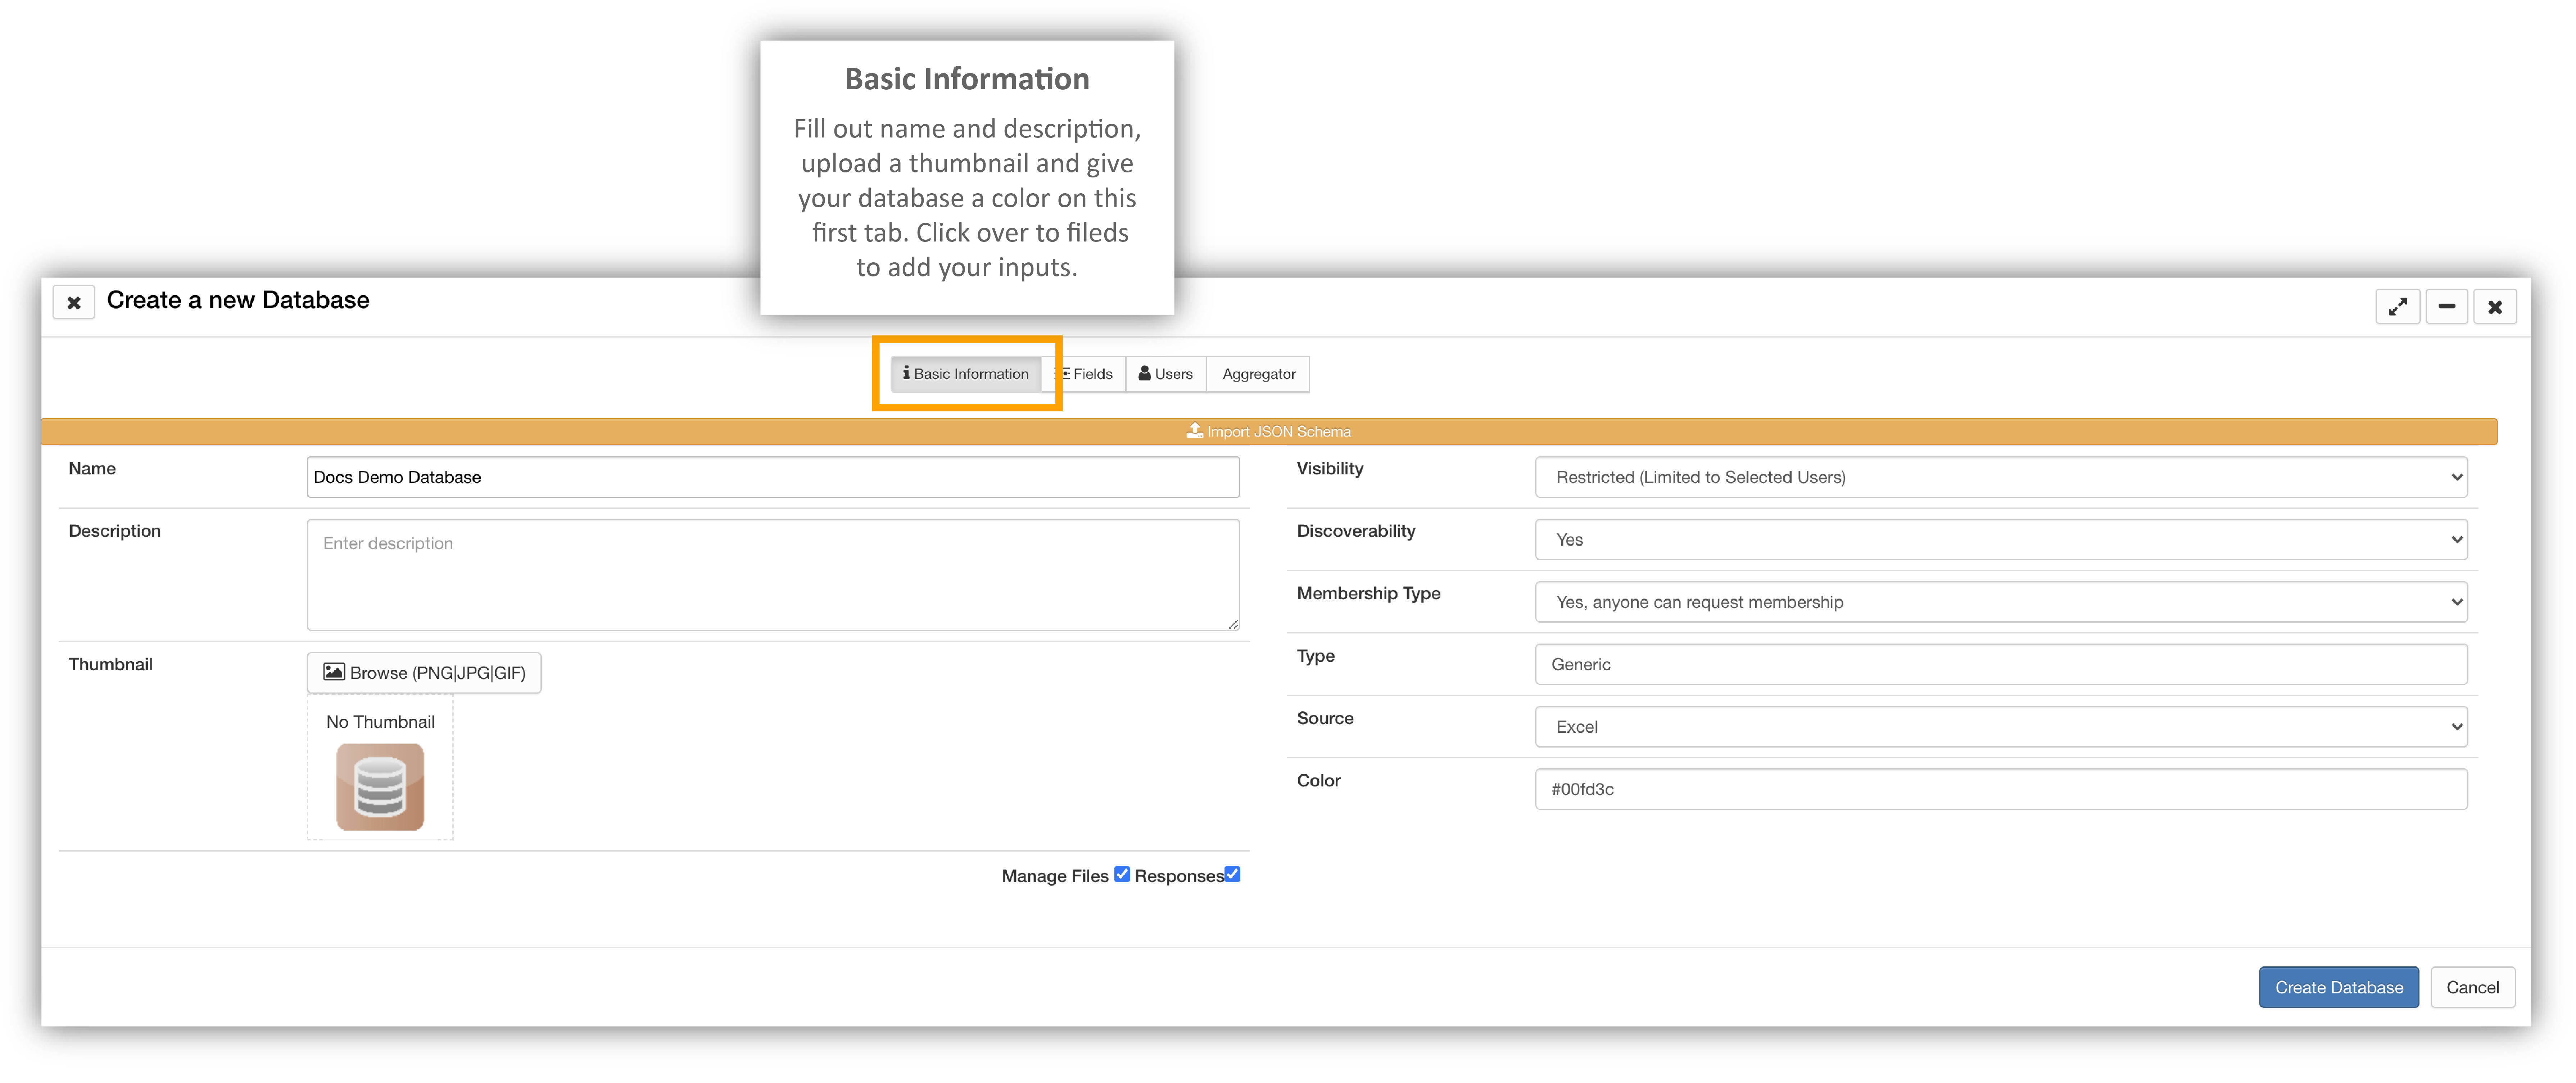
Use the first tab to define your basic information like the database name, description and color. Then, click over the the next tab ‘Fields’ to get started on defining your Database.
Define Database
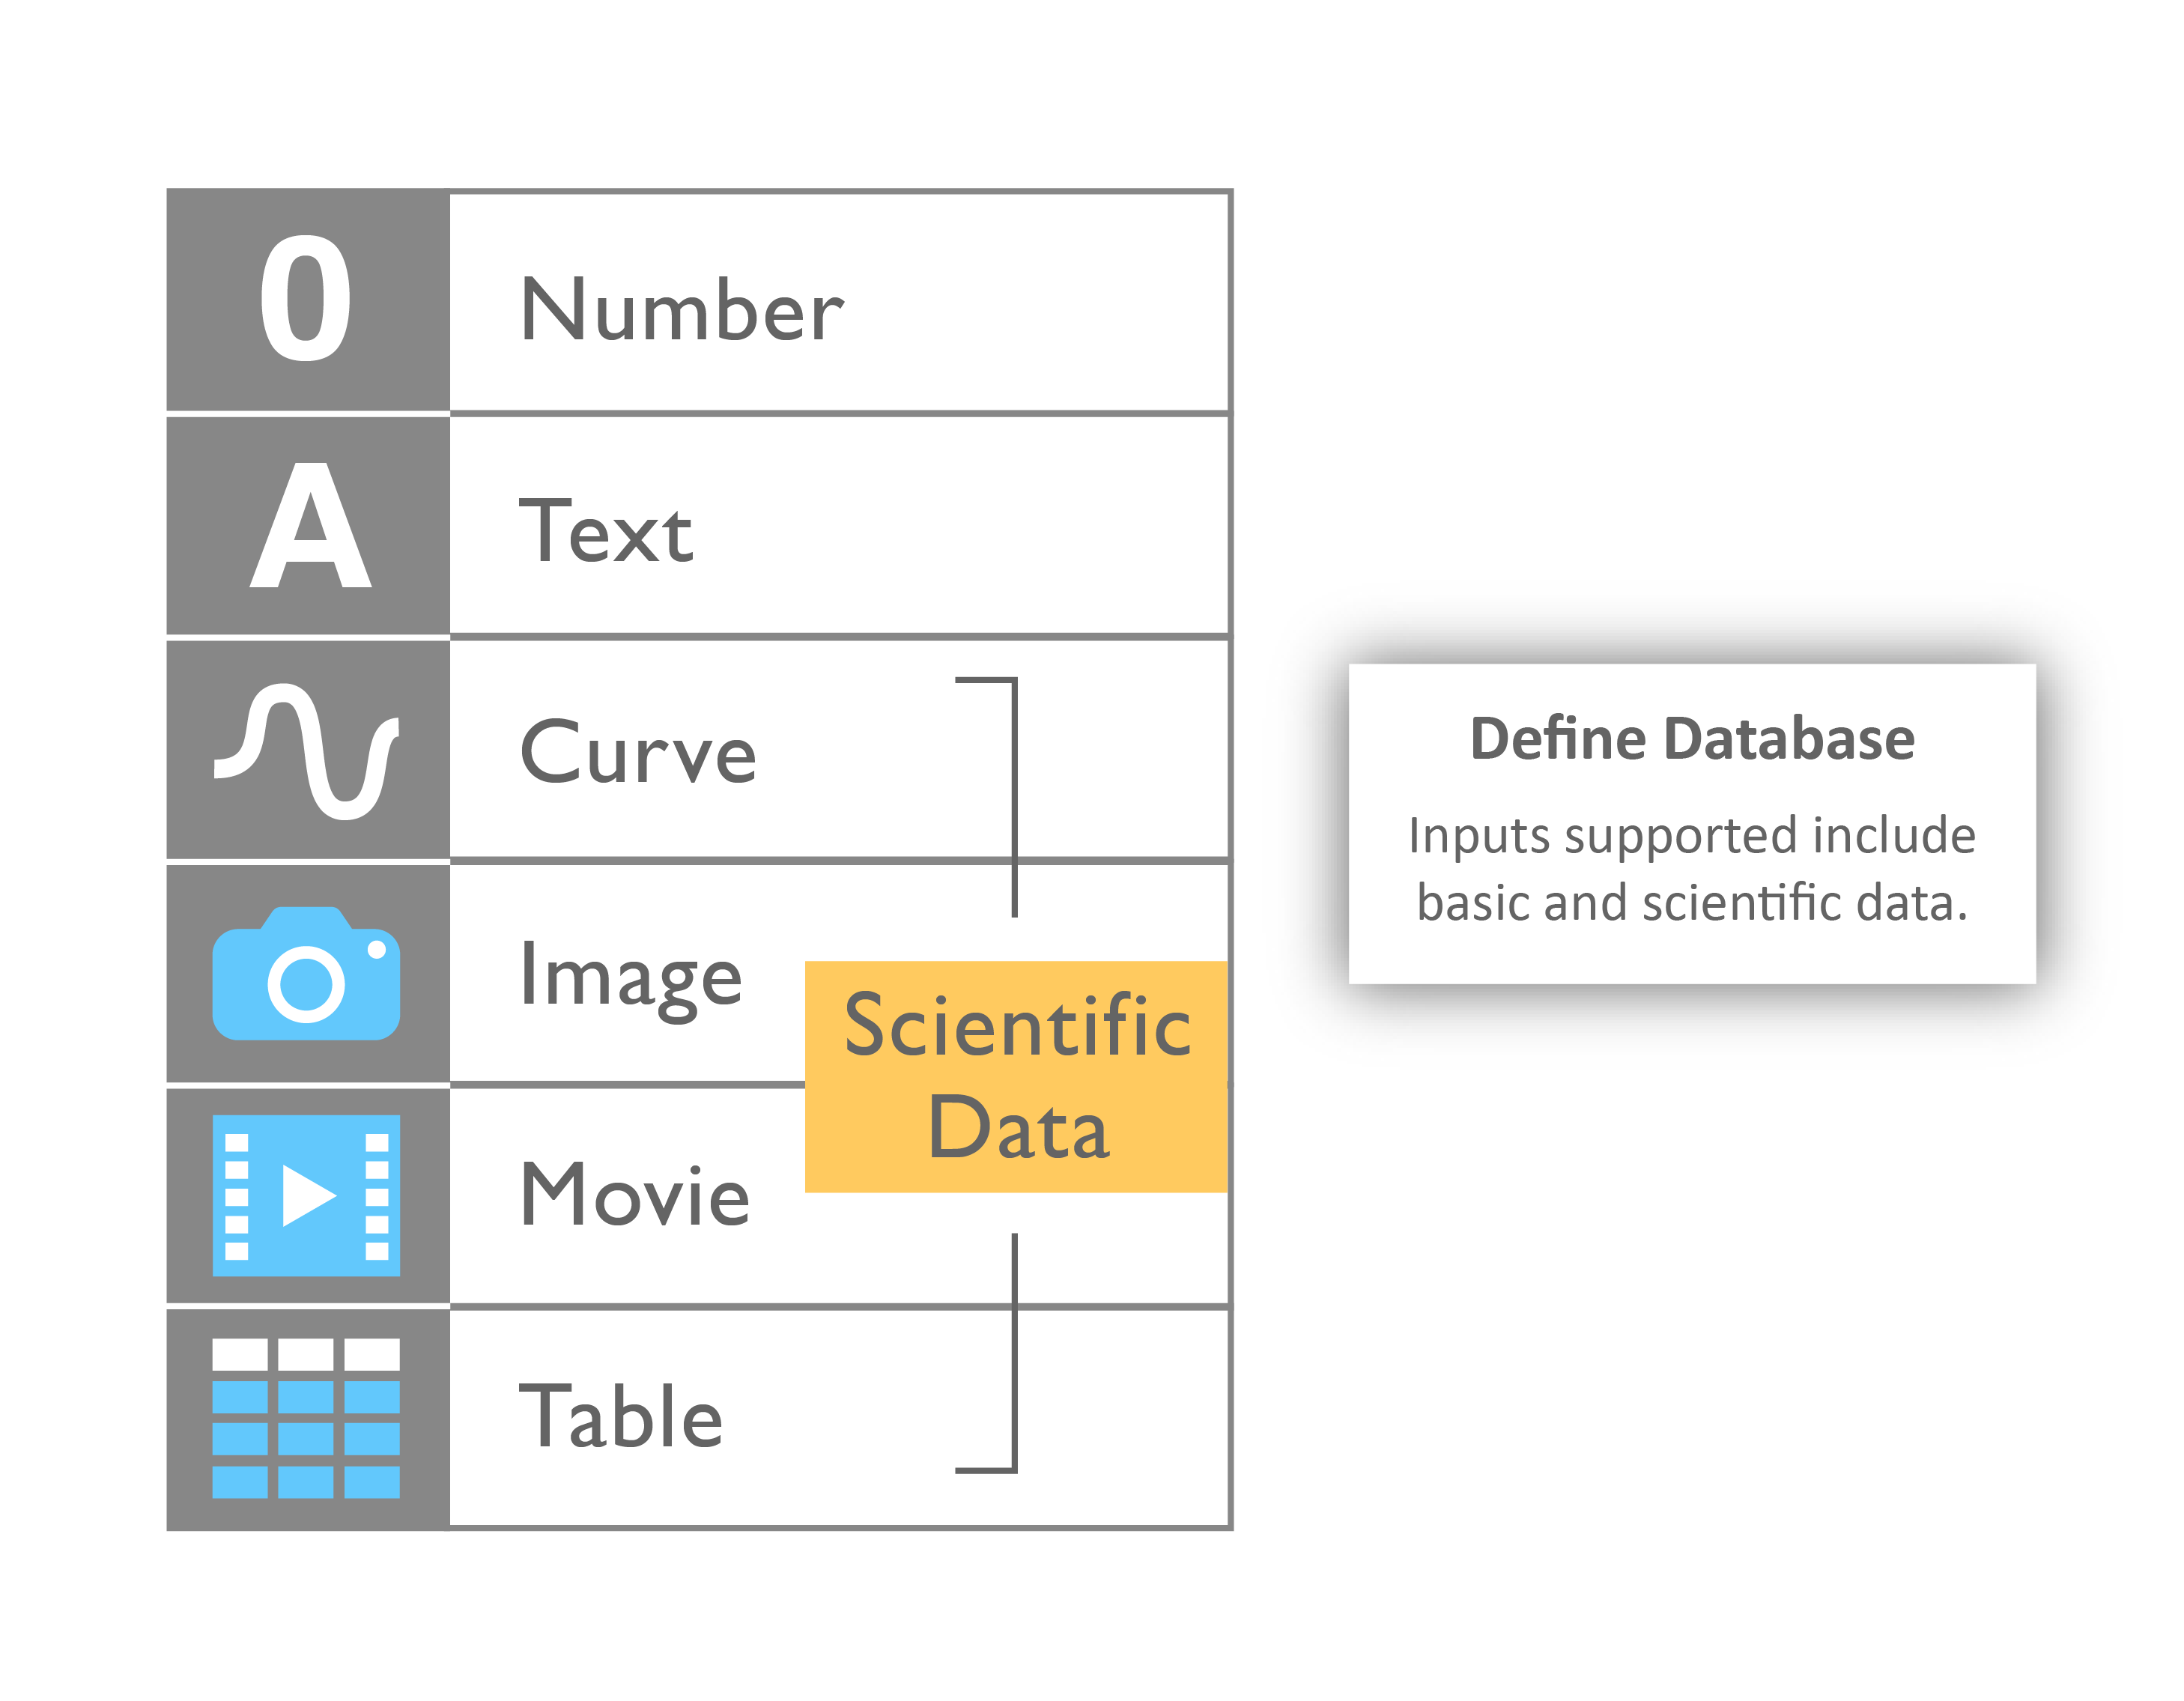
Define and Import
The application allows Databases to be defined in both basic and scientific data.
Some input fields include:
You can import your filters, as well as the data to go along with your filters, from a CSV, TSV, JSON or Excel file.
Inputs Import
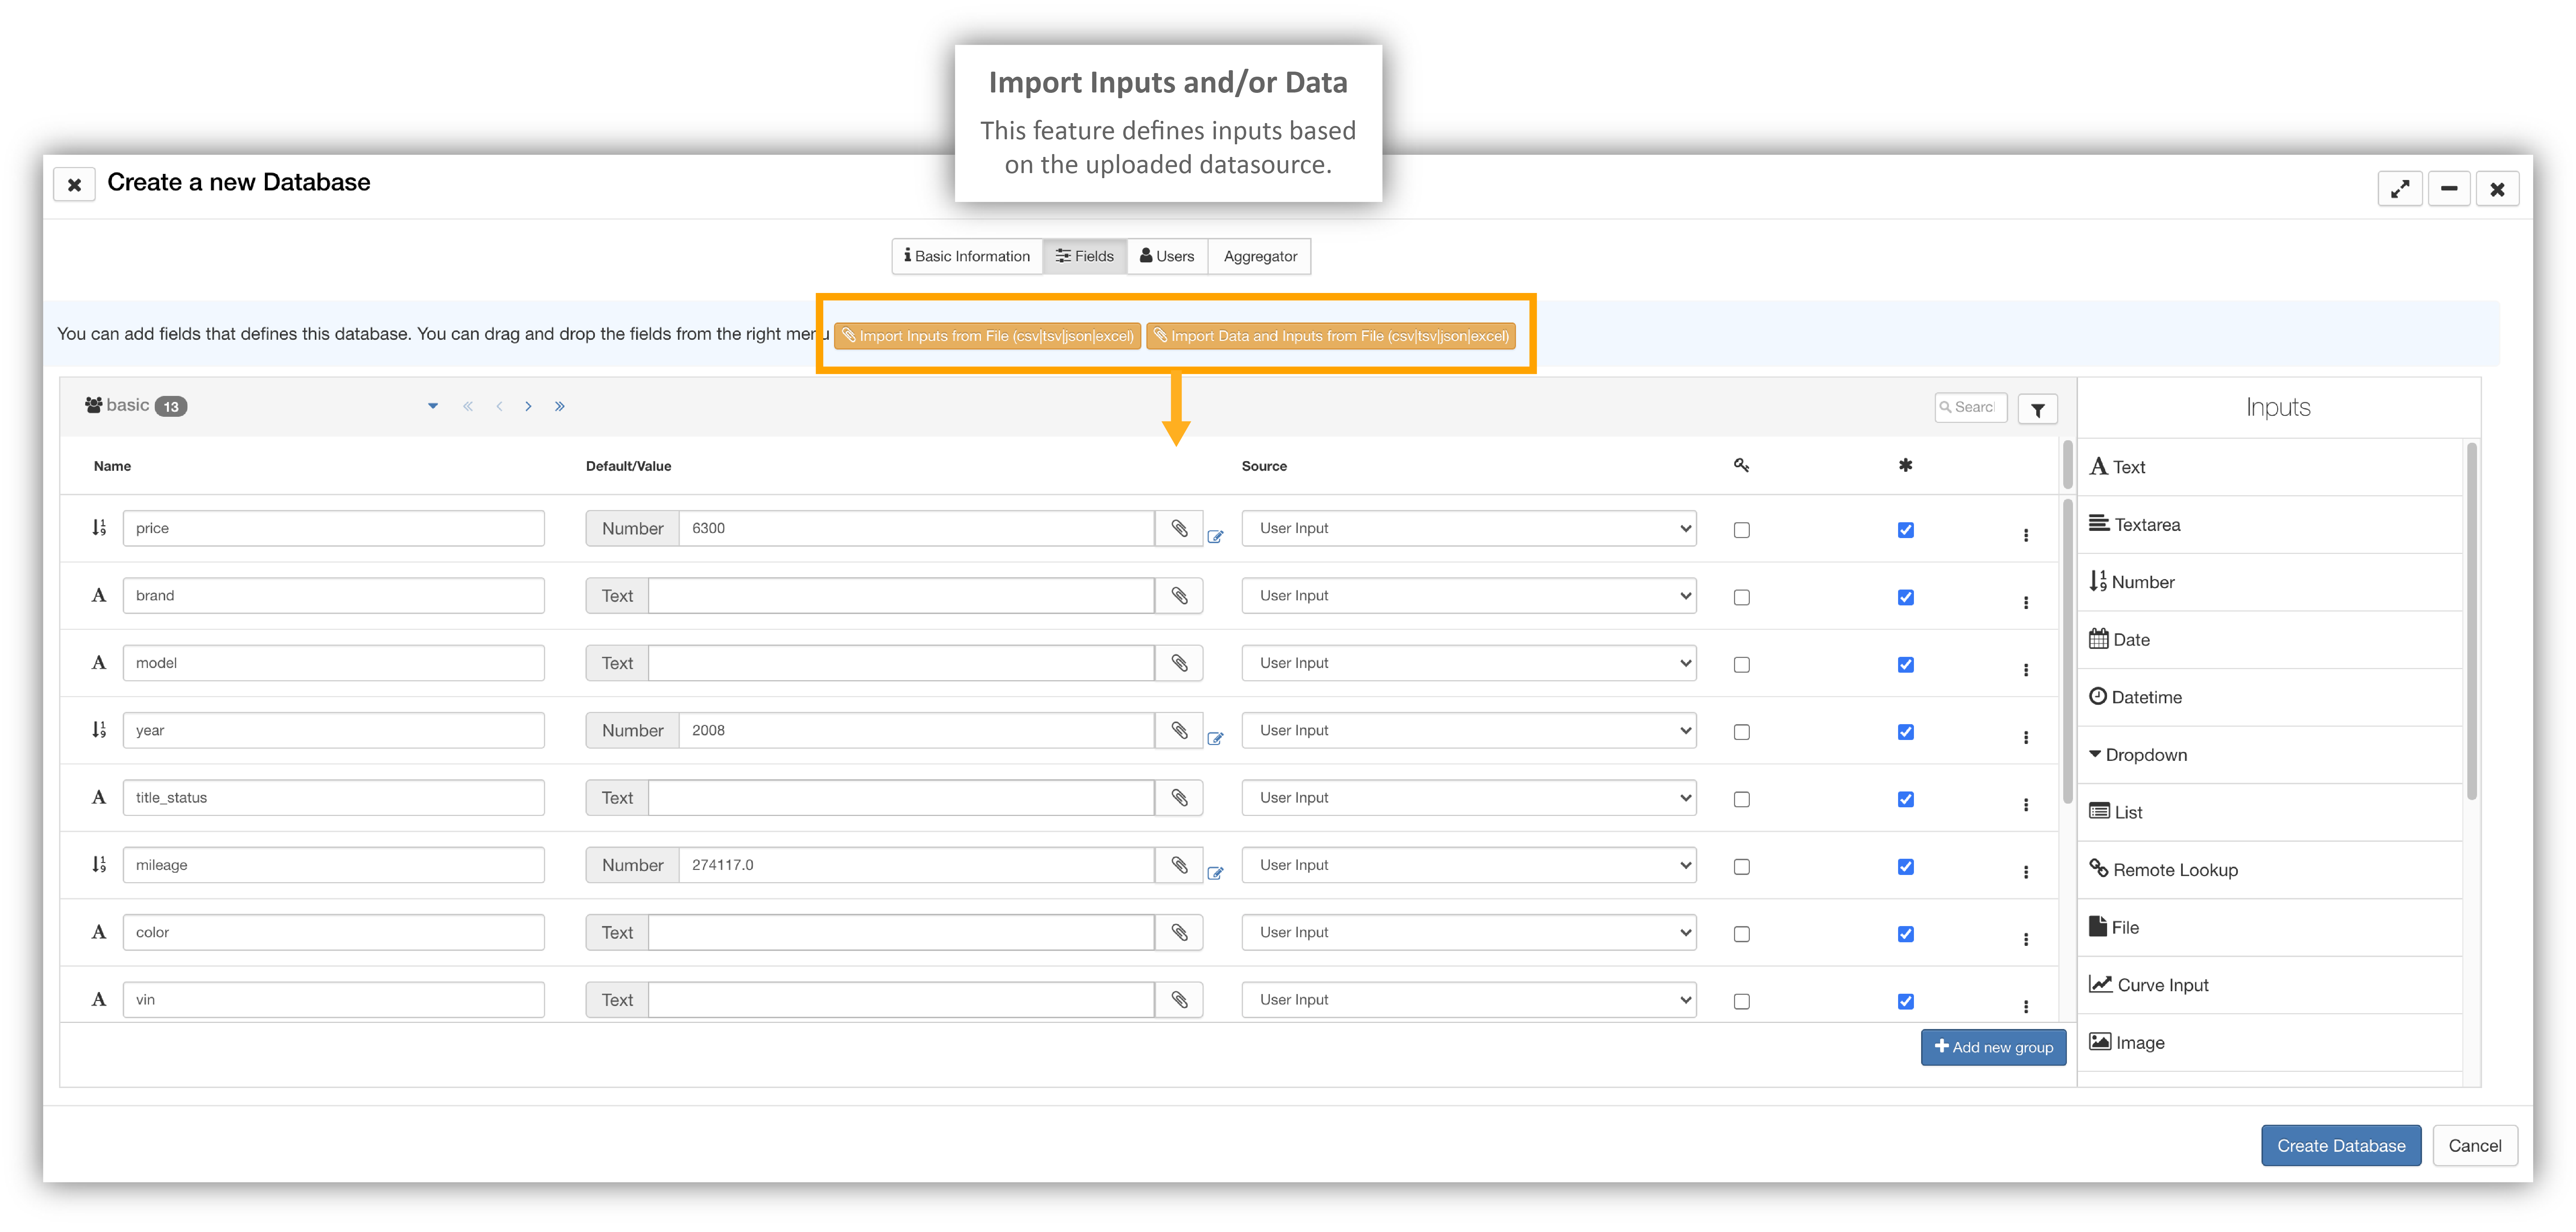
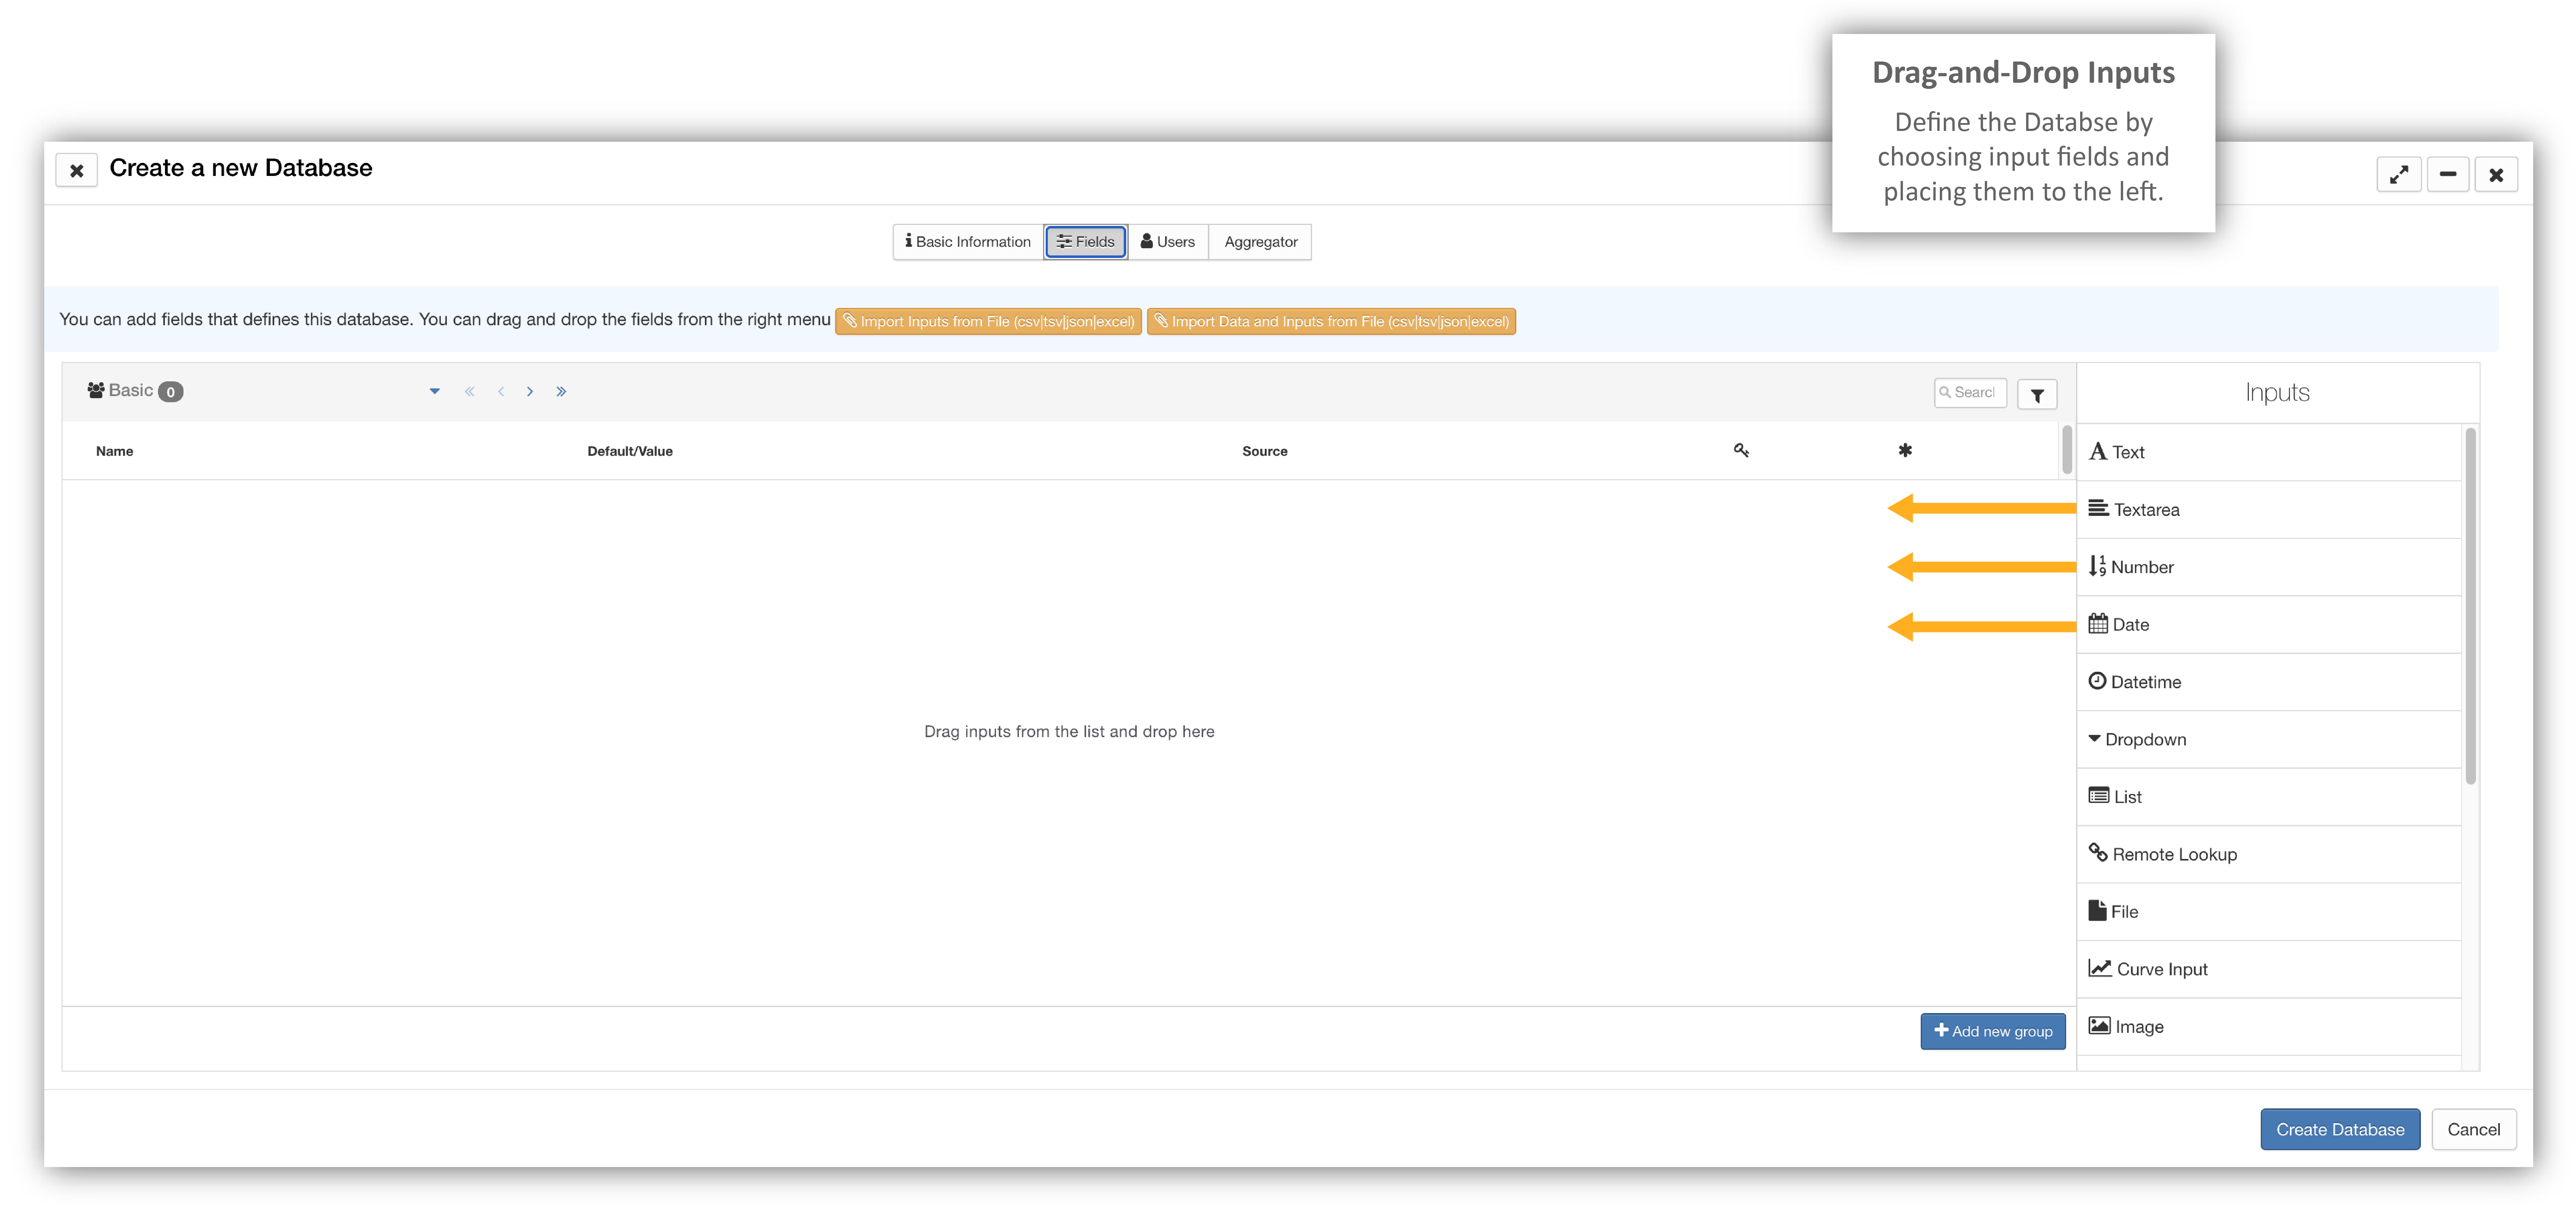
Choose which inputs, or filters, you would like to define your database by dragging-dropping them from the right into the menu.
Inputs Define
NEW as of February, 2022, you can use a color picker as an input for databases.
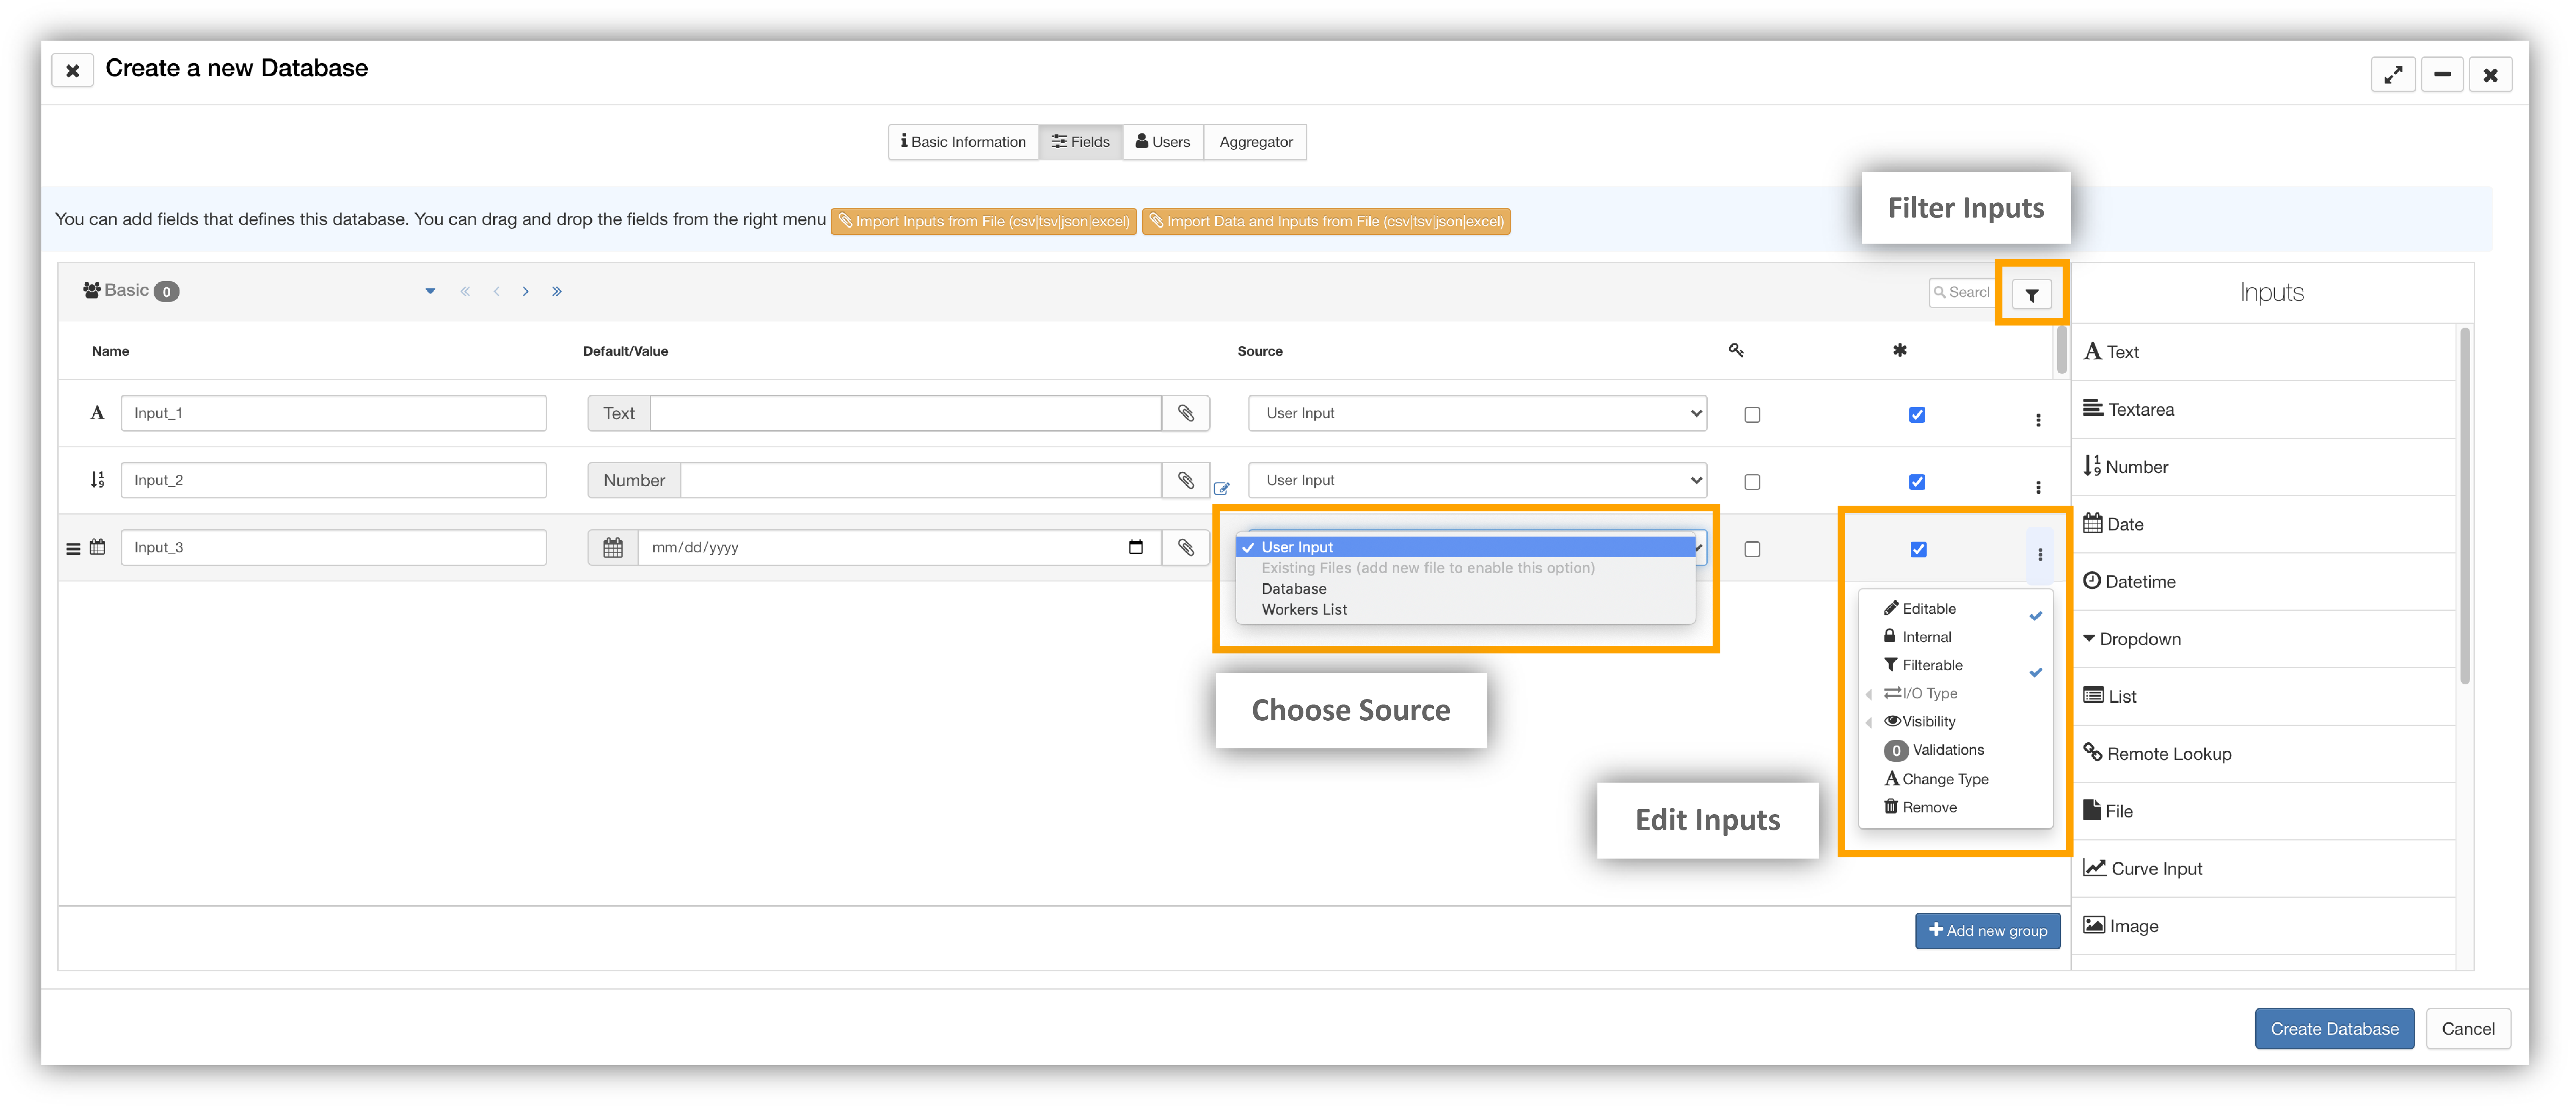
You can reorder your filters or add a new group of filters to help define your data. You can also hide certain filters as well as condition them under other filters.
Filters
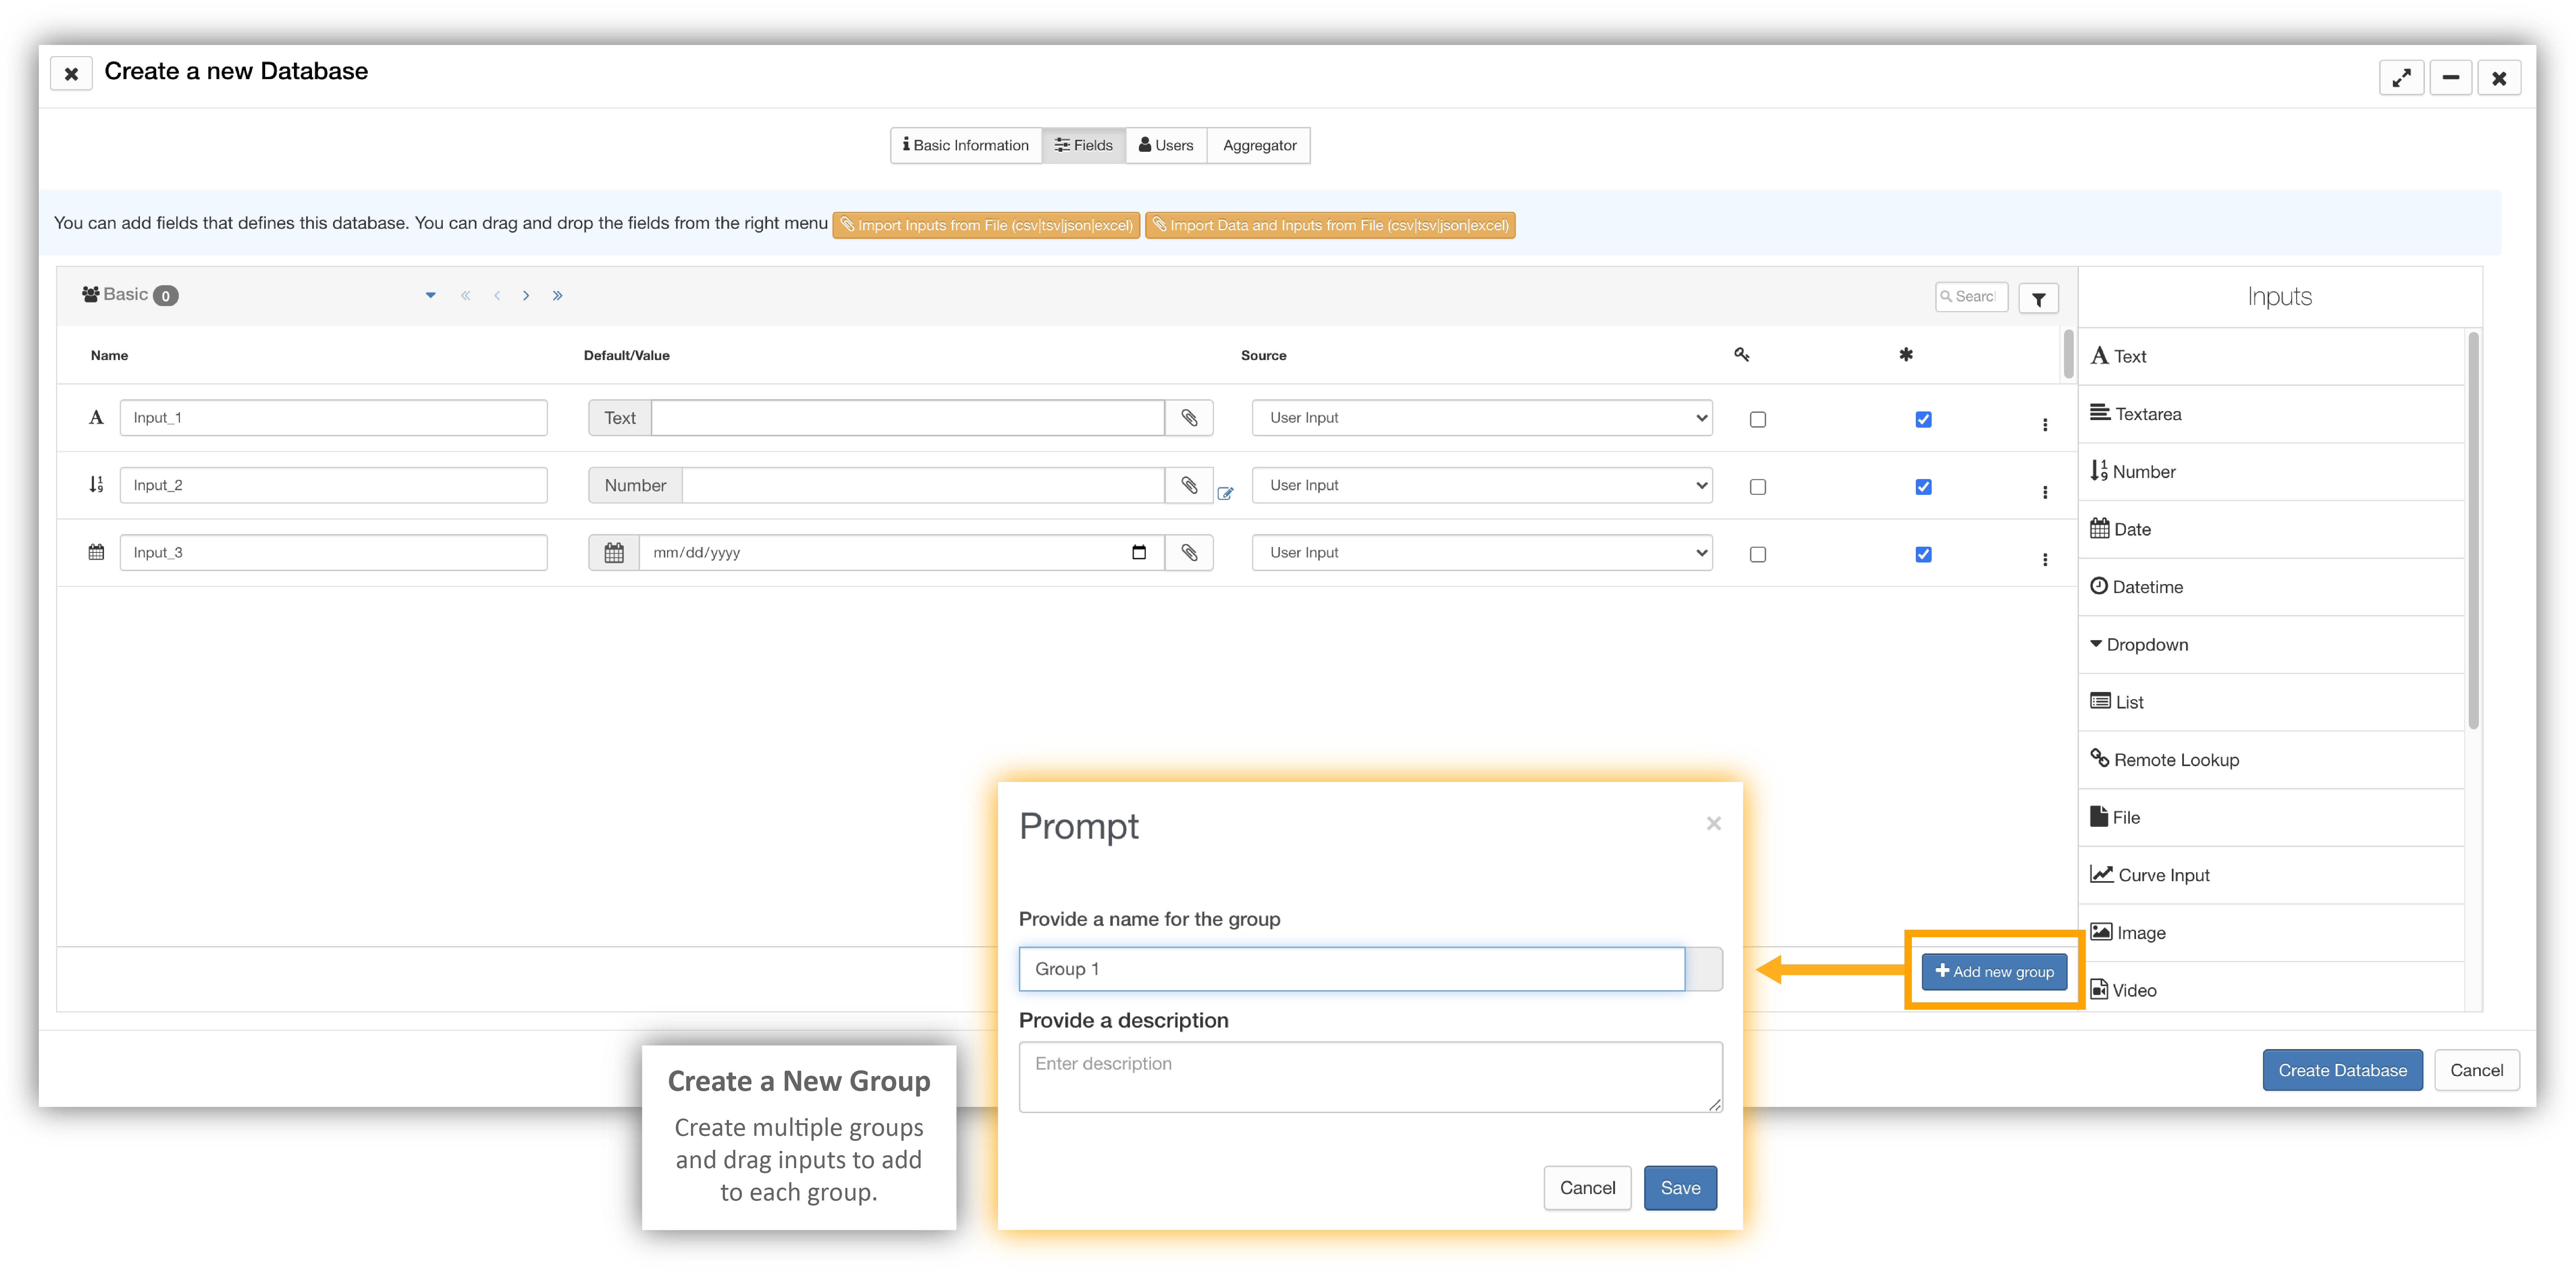
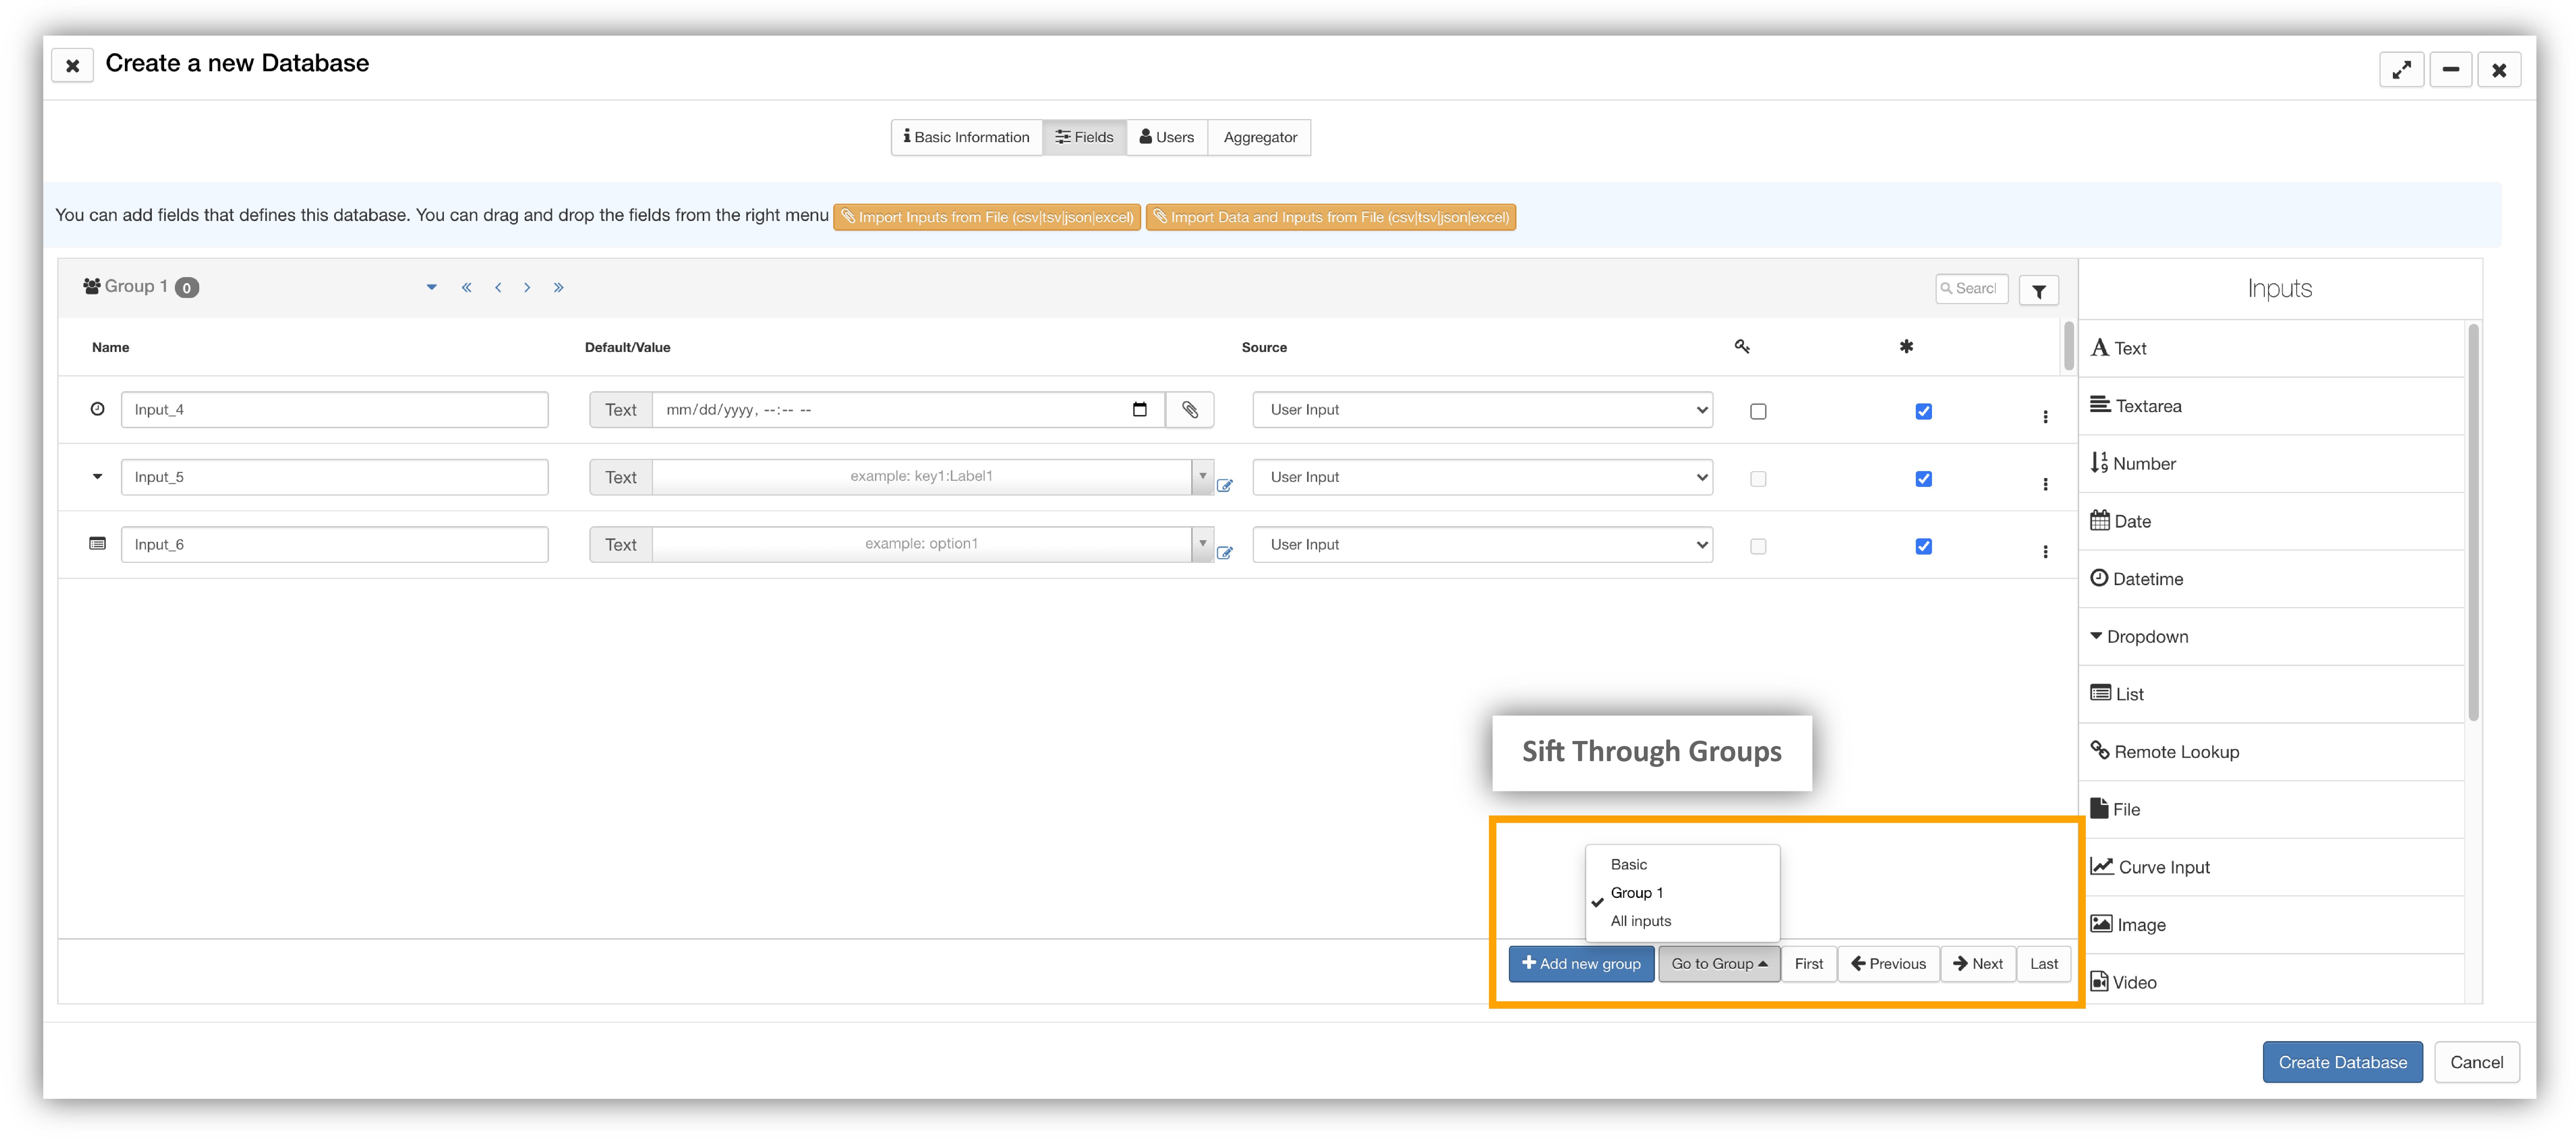
Click on the new group button to add multiple groups. Drag-and-drop inputs for each group. Groups will be shown separately on the page. Sift through them by hitting the arrows at the top of the input window.
Add Group
Sift through them by hitting the arrows at the top of the input window.
Sift Through Groups
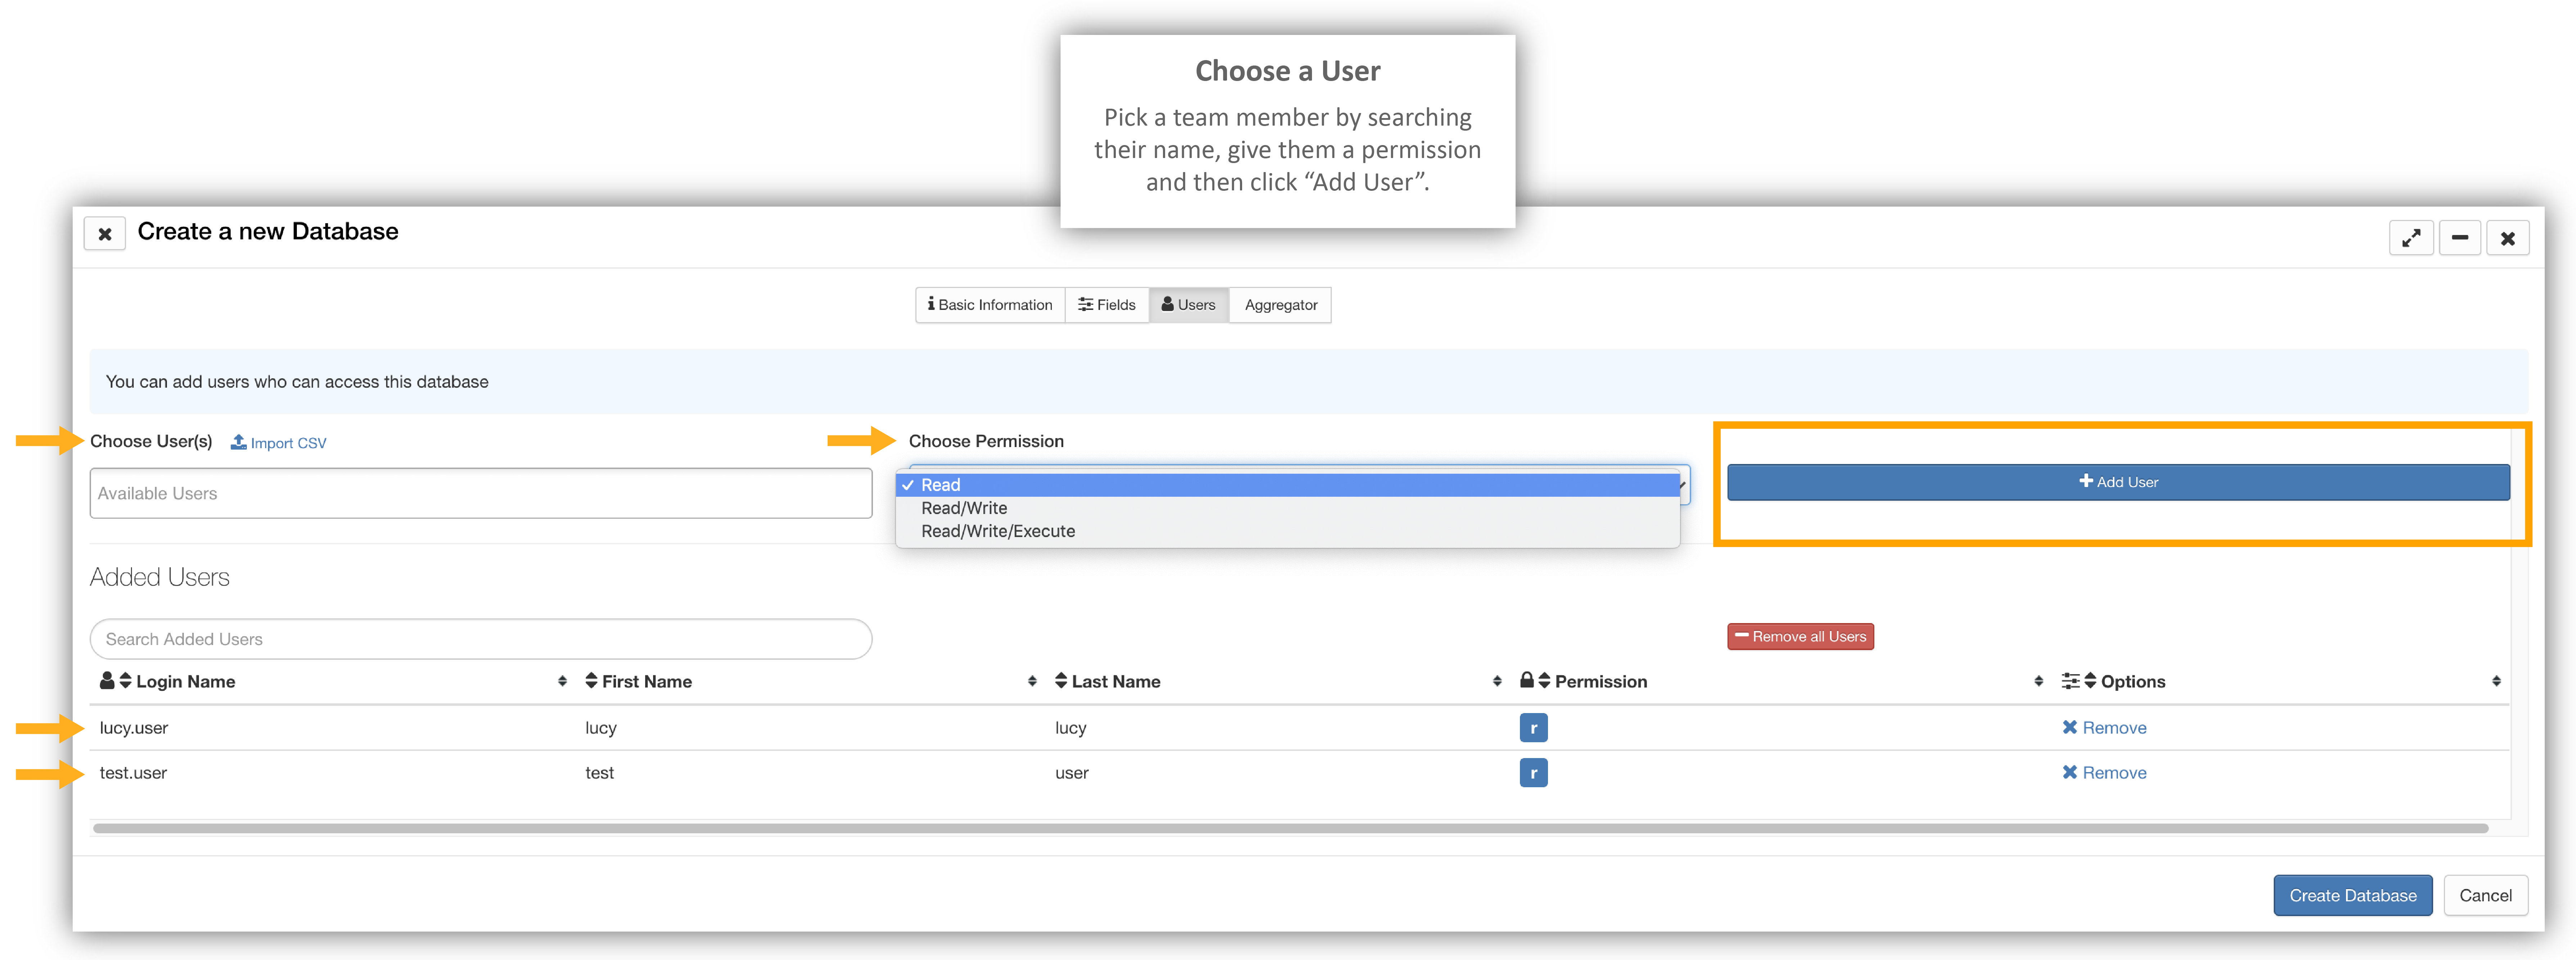
Users
Under the users tab, you can choose your team members and permit them to read or read and write. Aggregators and filters are useful when you have multiple datasources you would like to compile together, structuring them for analysis and deriving particular information from each source.
Defining Users
Databases Through Workflows
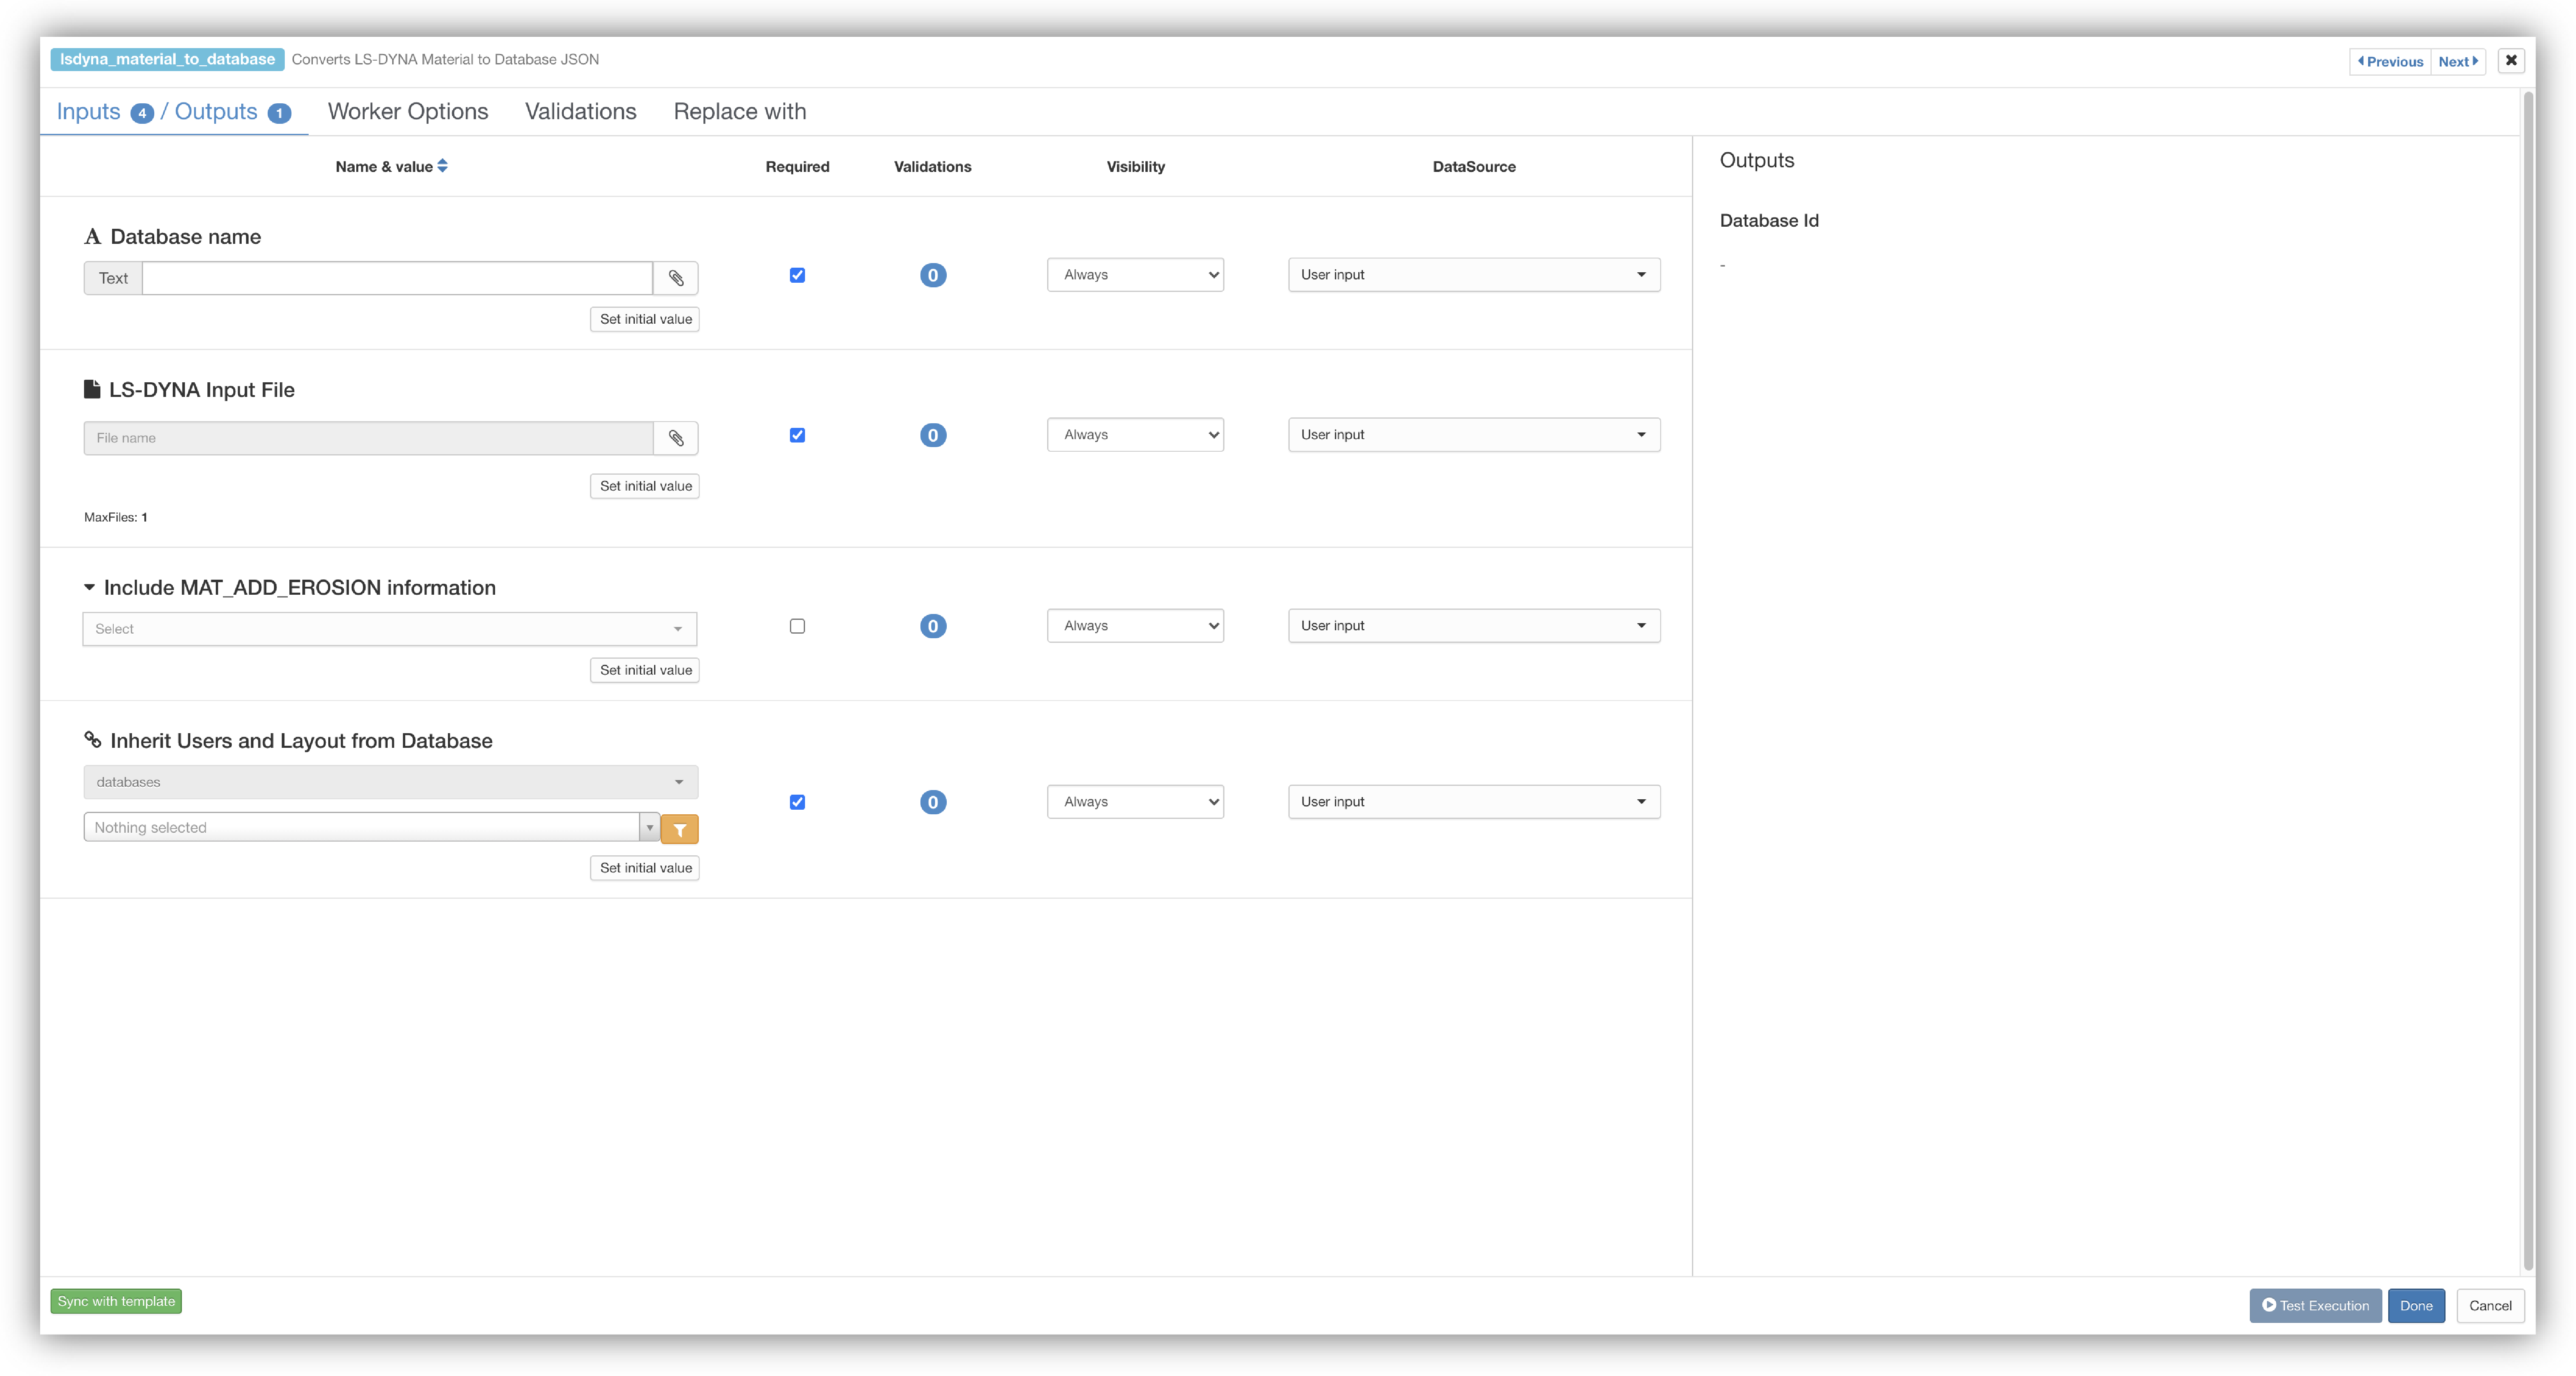
You can set-up a workflow to create a database or add/delete records from a database. Here are the four Database workers you can utilize. Please make your way to the Workflows section of this Tutorial Documentation for a step-by-step on how to create a database using one of these workers.
LS-DYNA Material to Database
Converts LS-DYNA Material to Database JSON
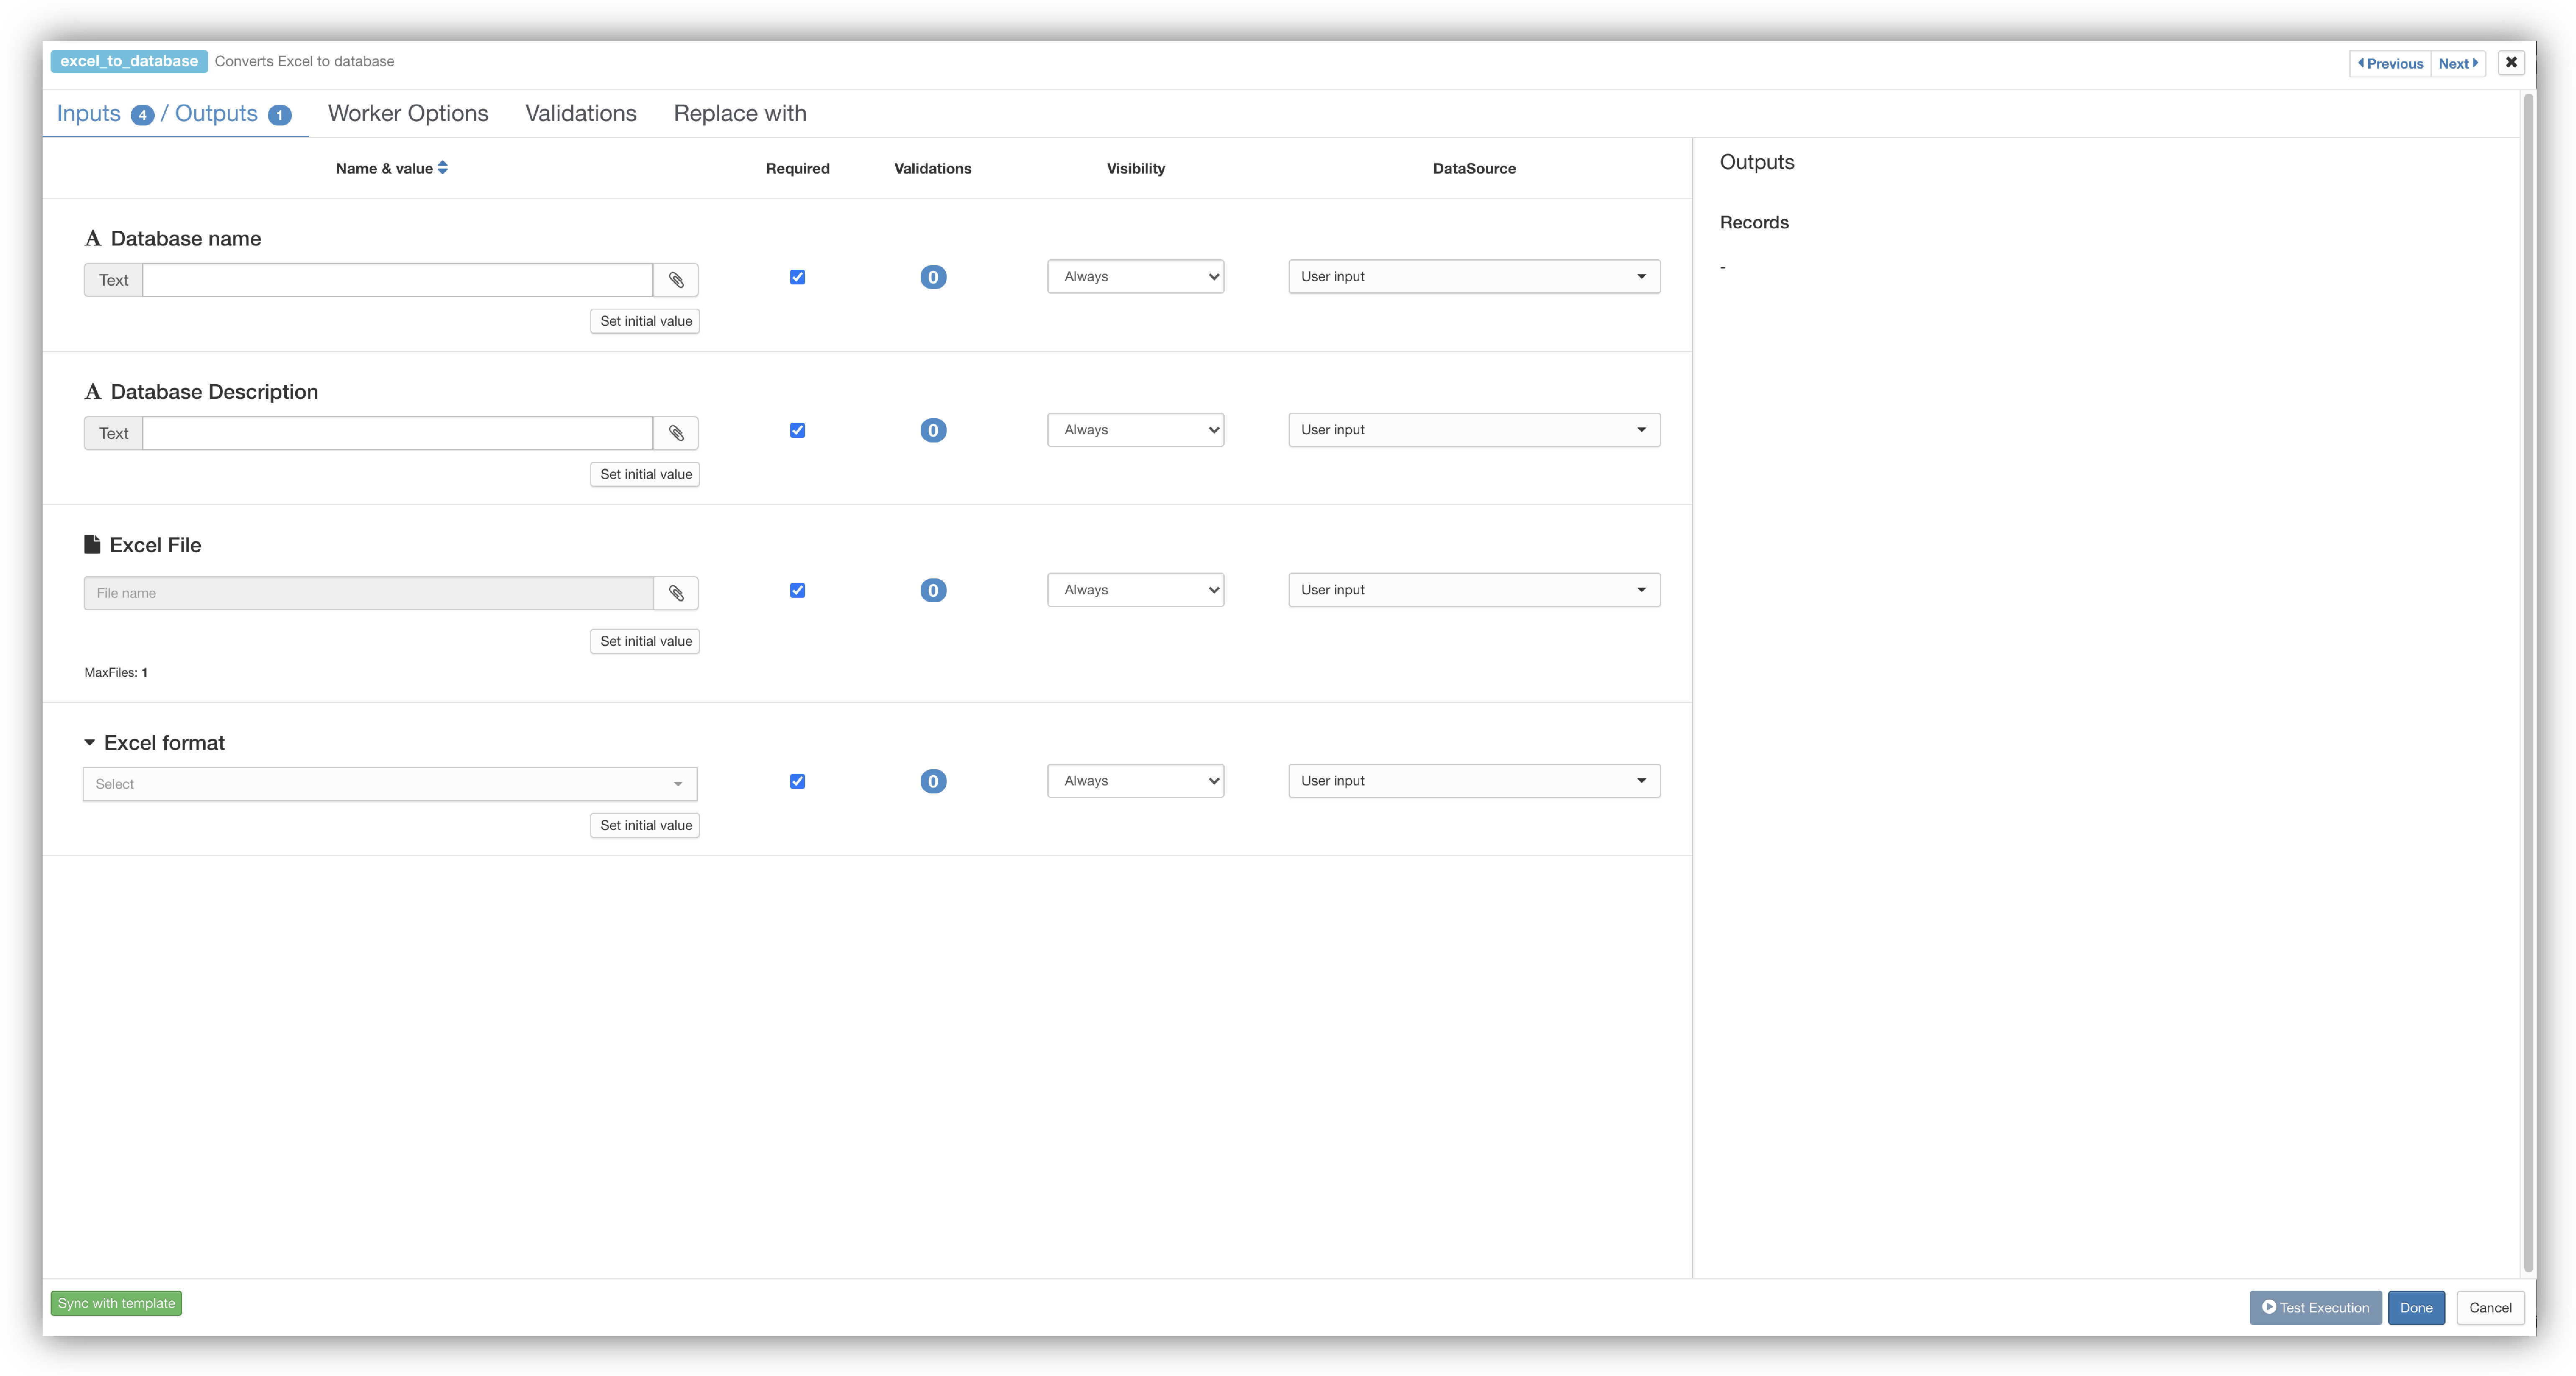
Excel to Database
Converts Excels to Database
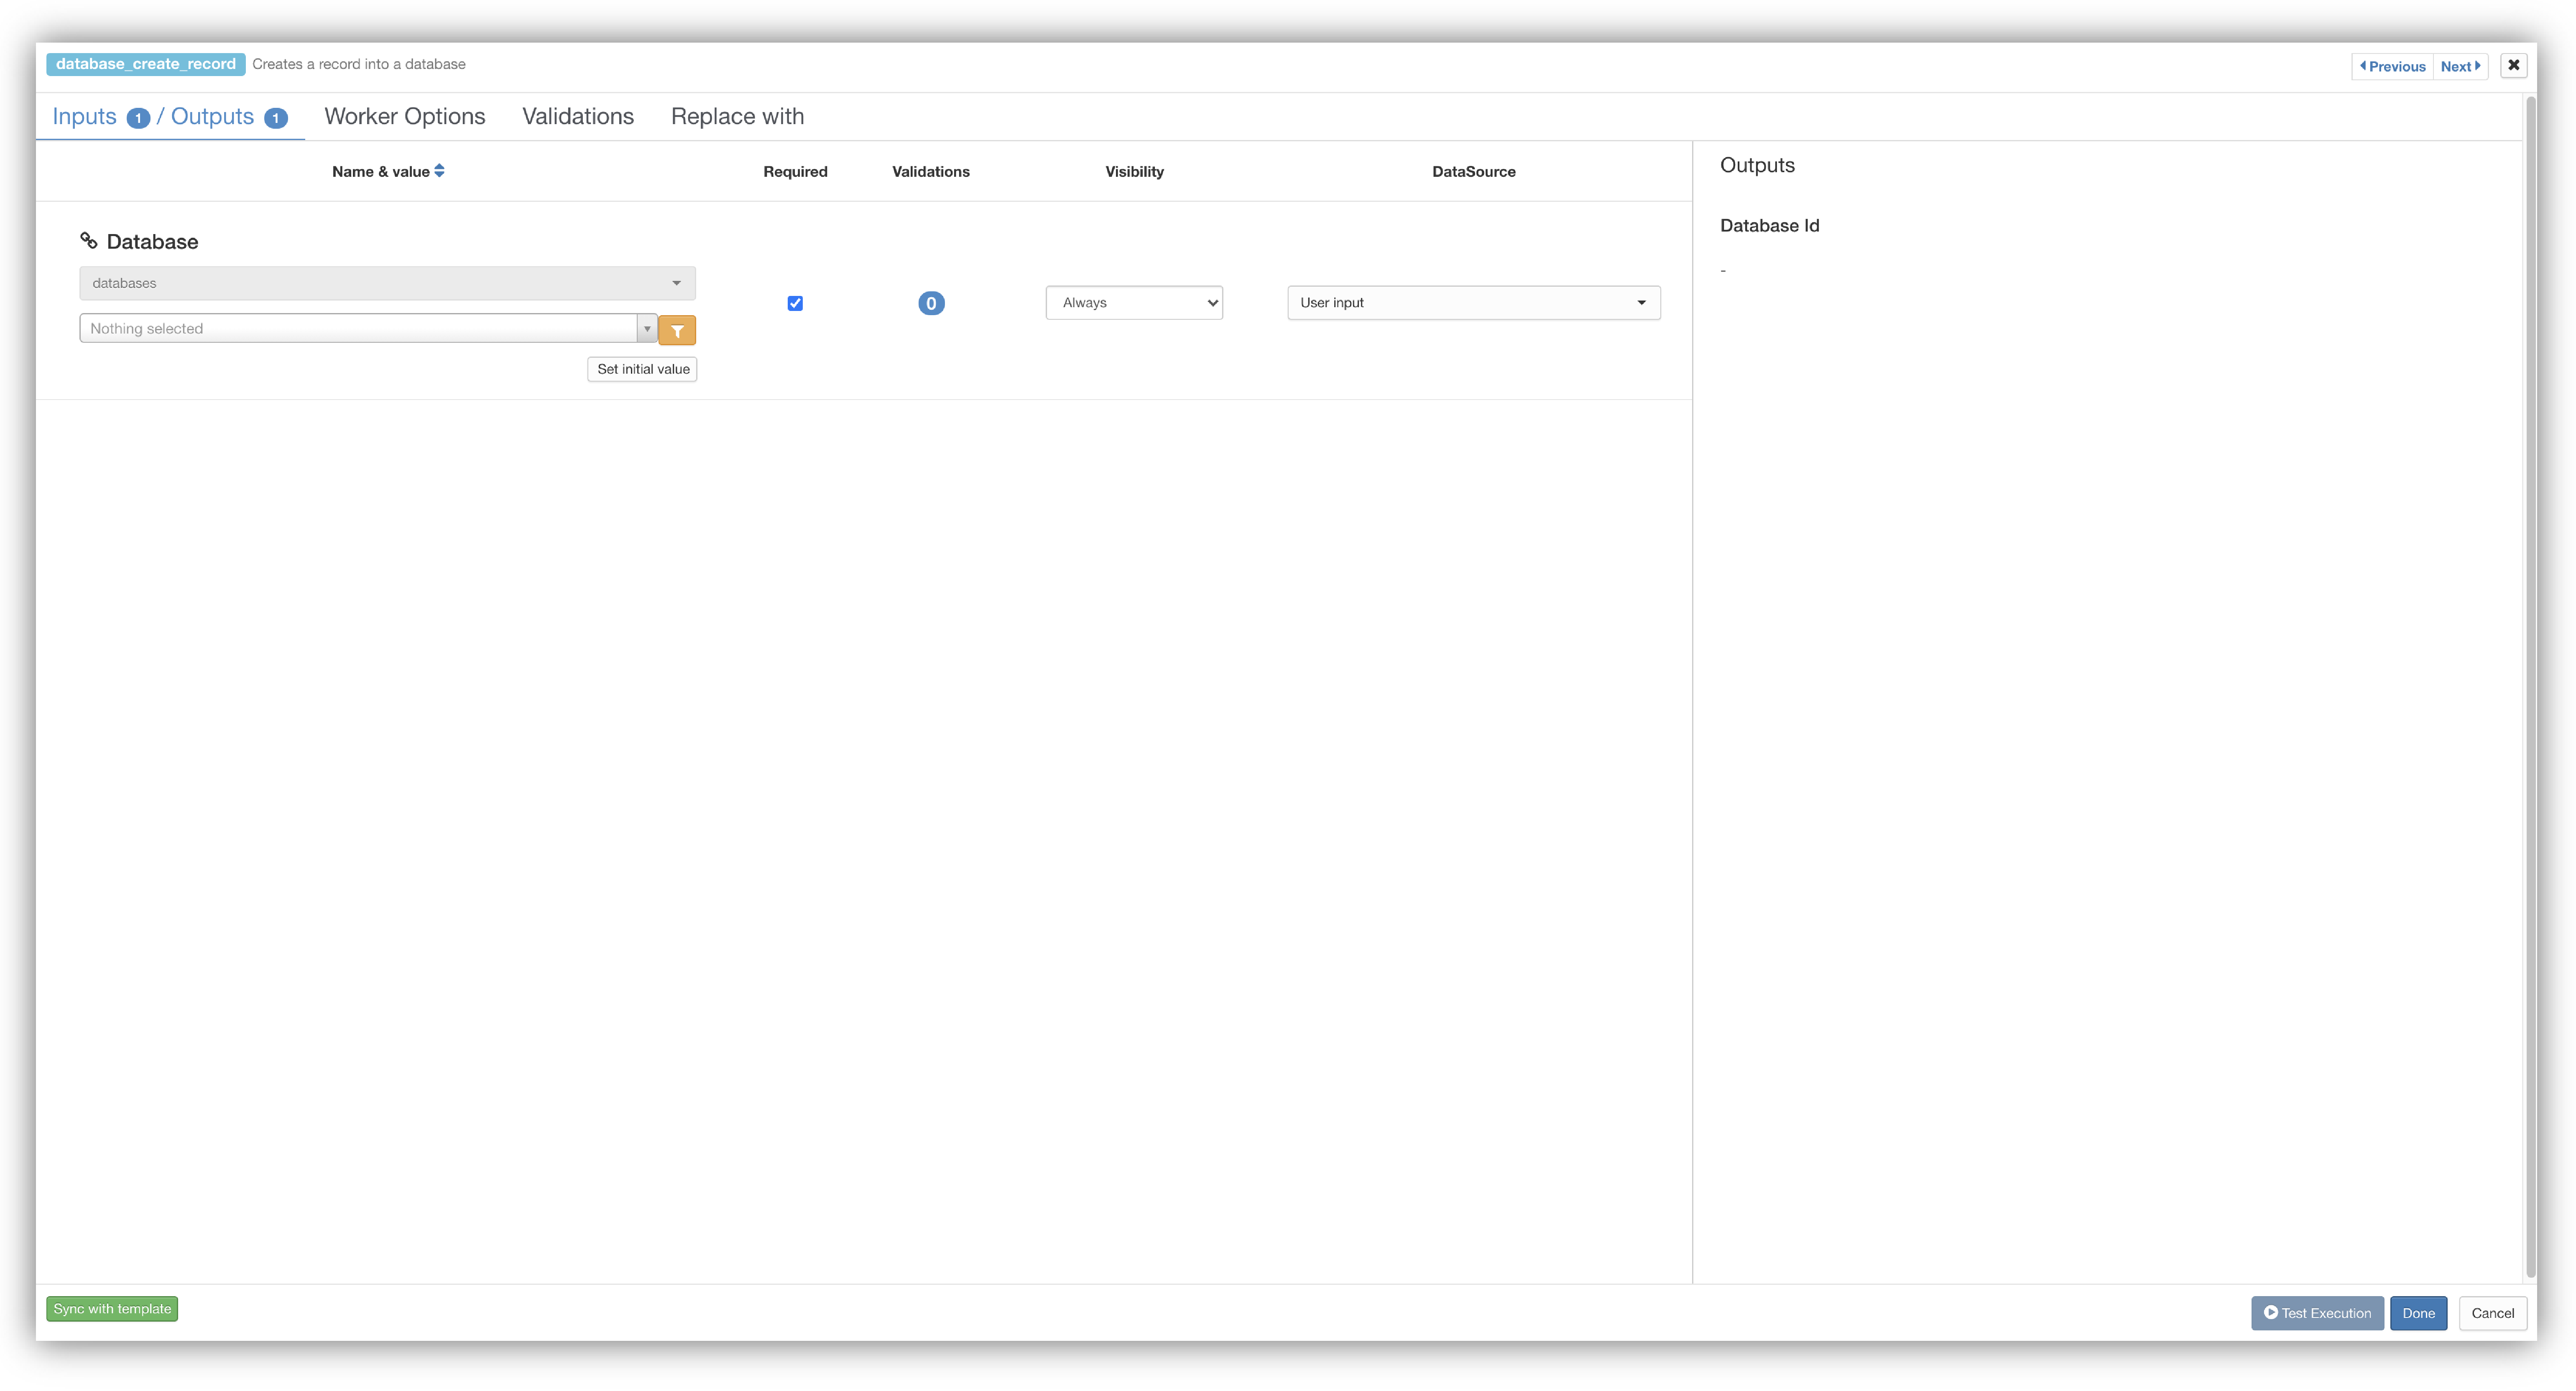
Database Create Record
Creates a record into a Database
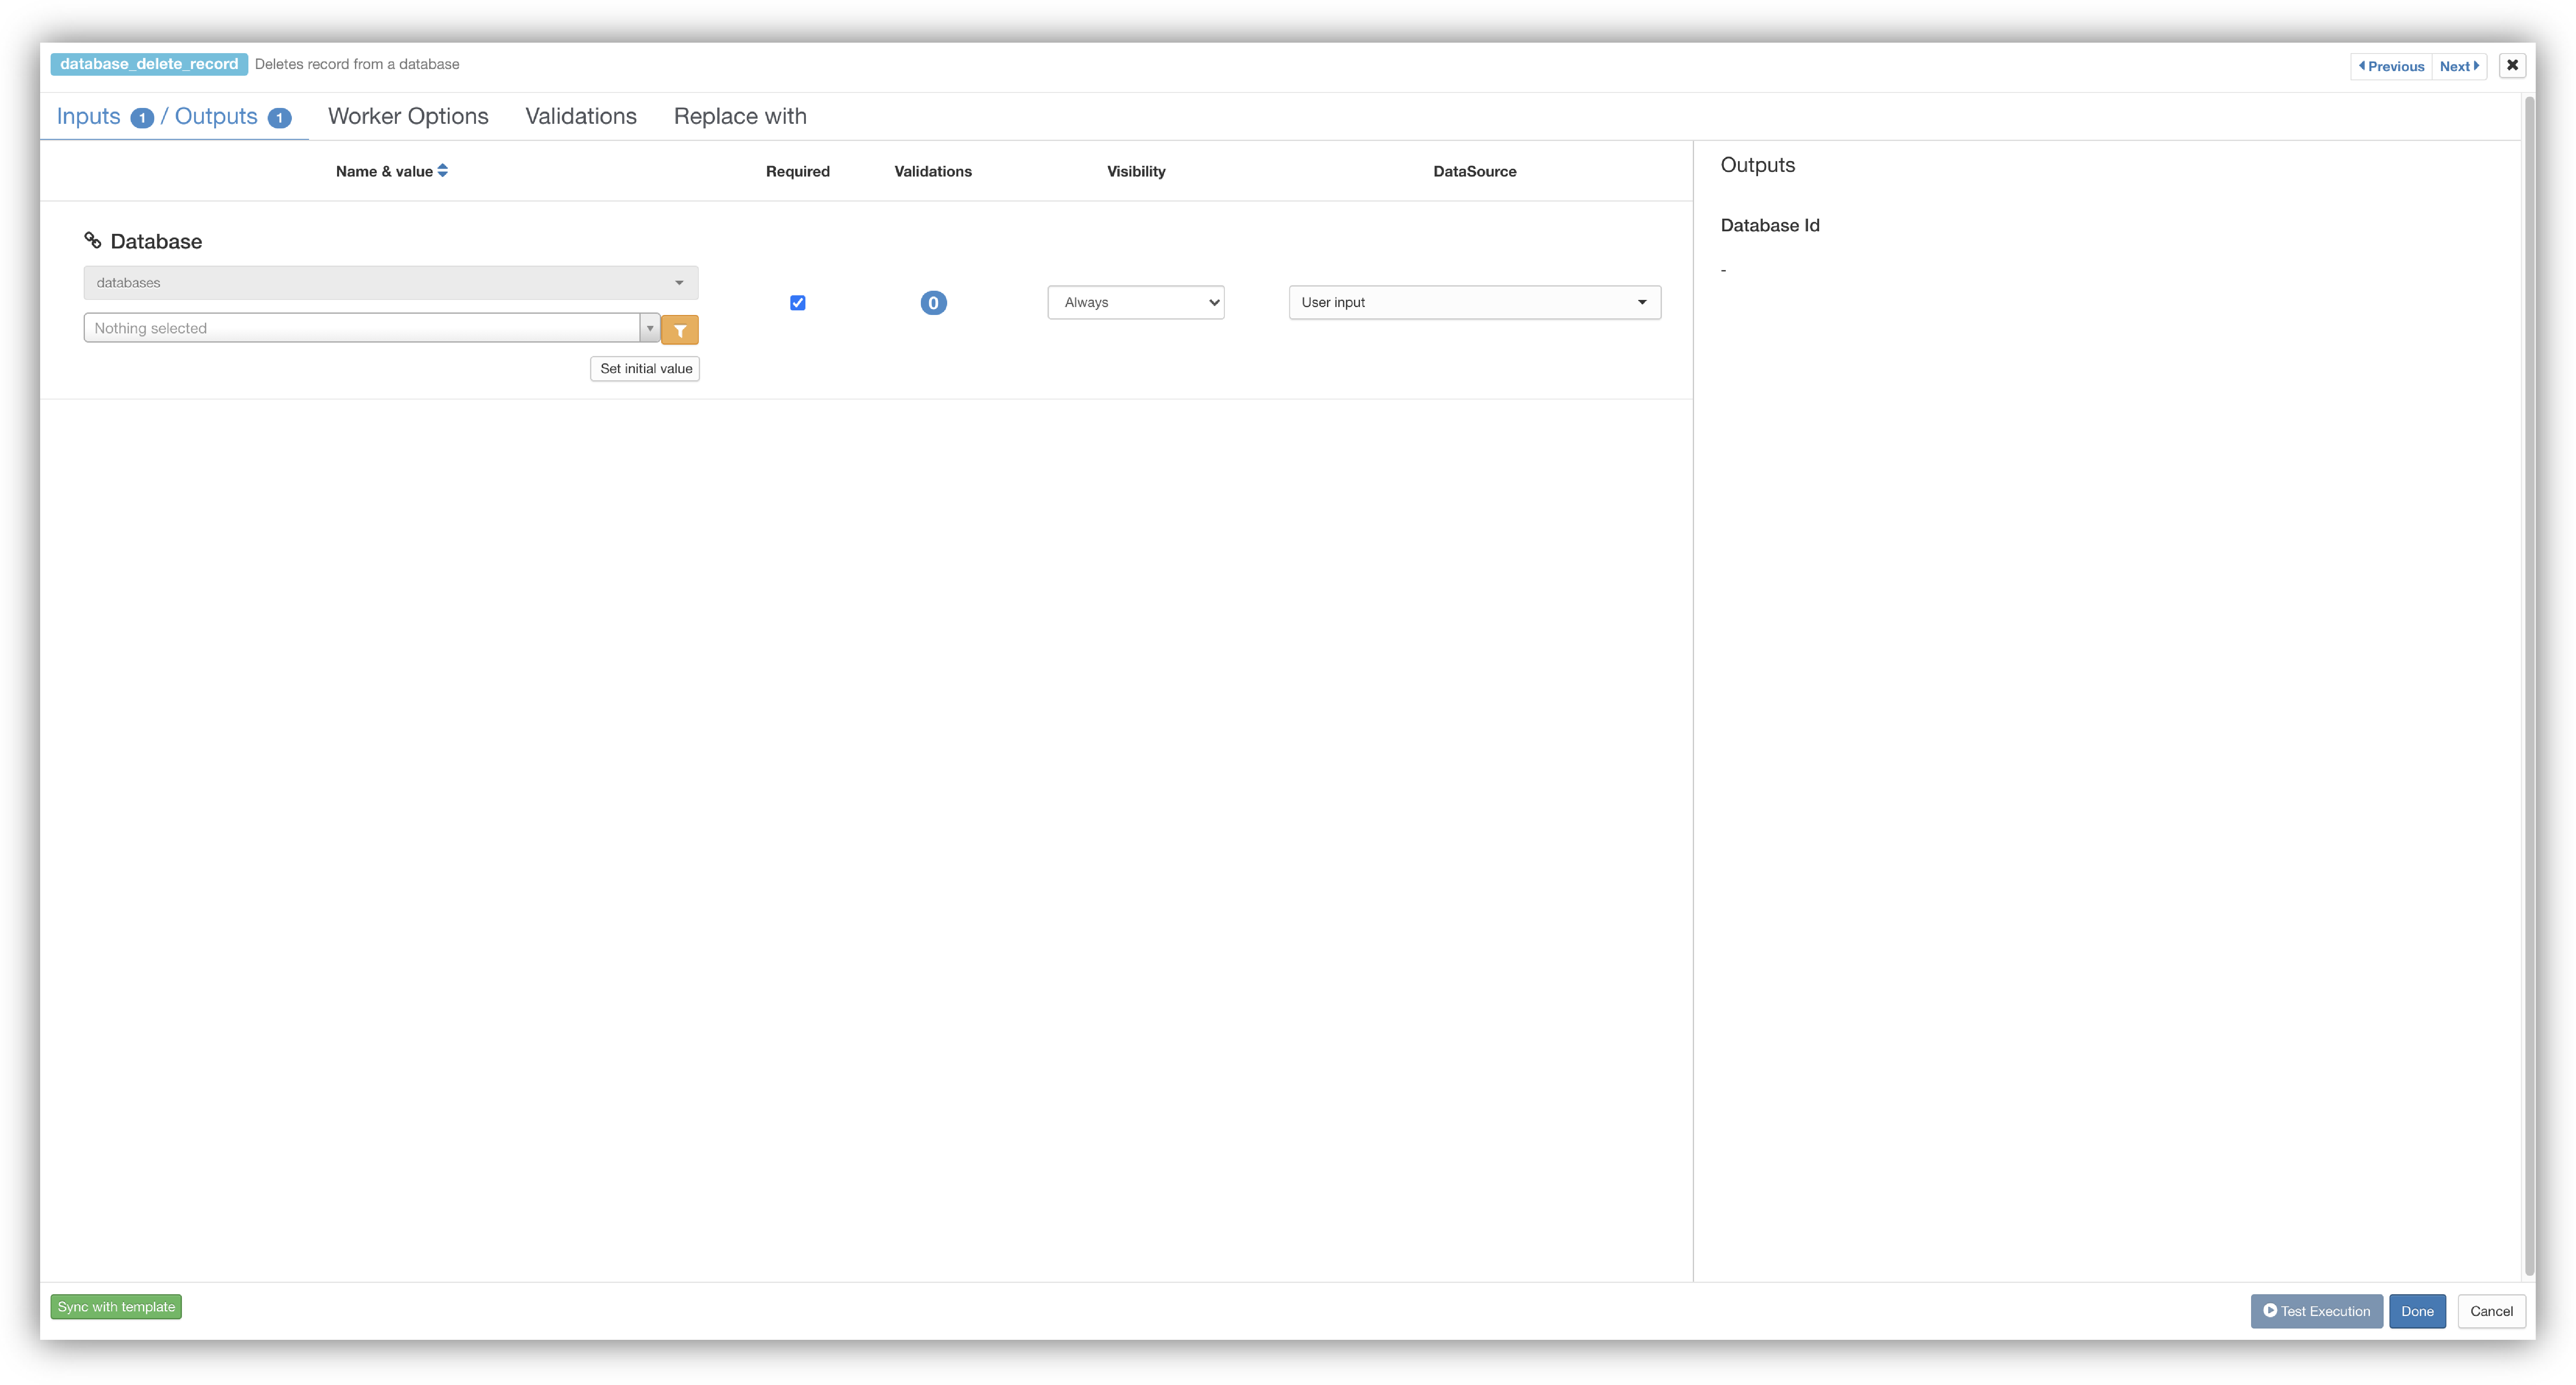
Database Delete Record
Deletes a record from a Database
5.2. Managing a Database
The application structures and organizes the Database for easy viewing, editing and updating with records, filters, columns and groups.
Navigating the Home Page and Viewing Records
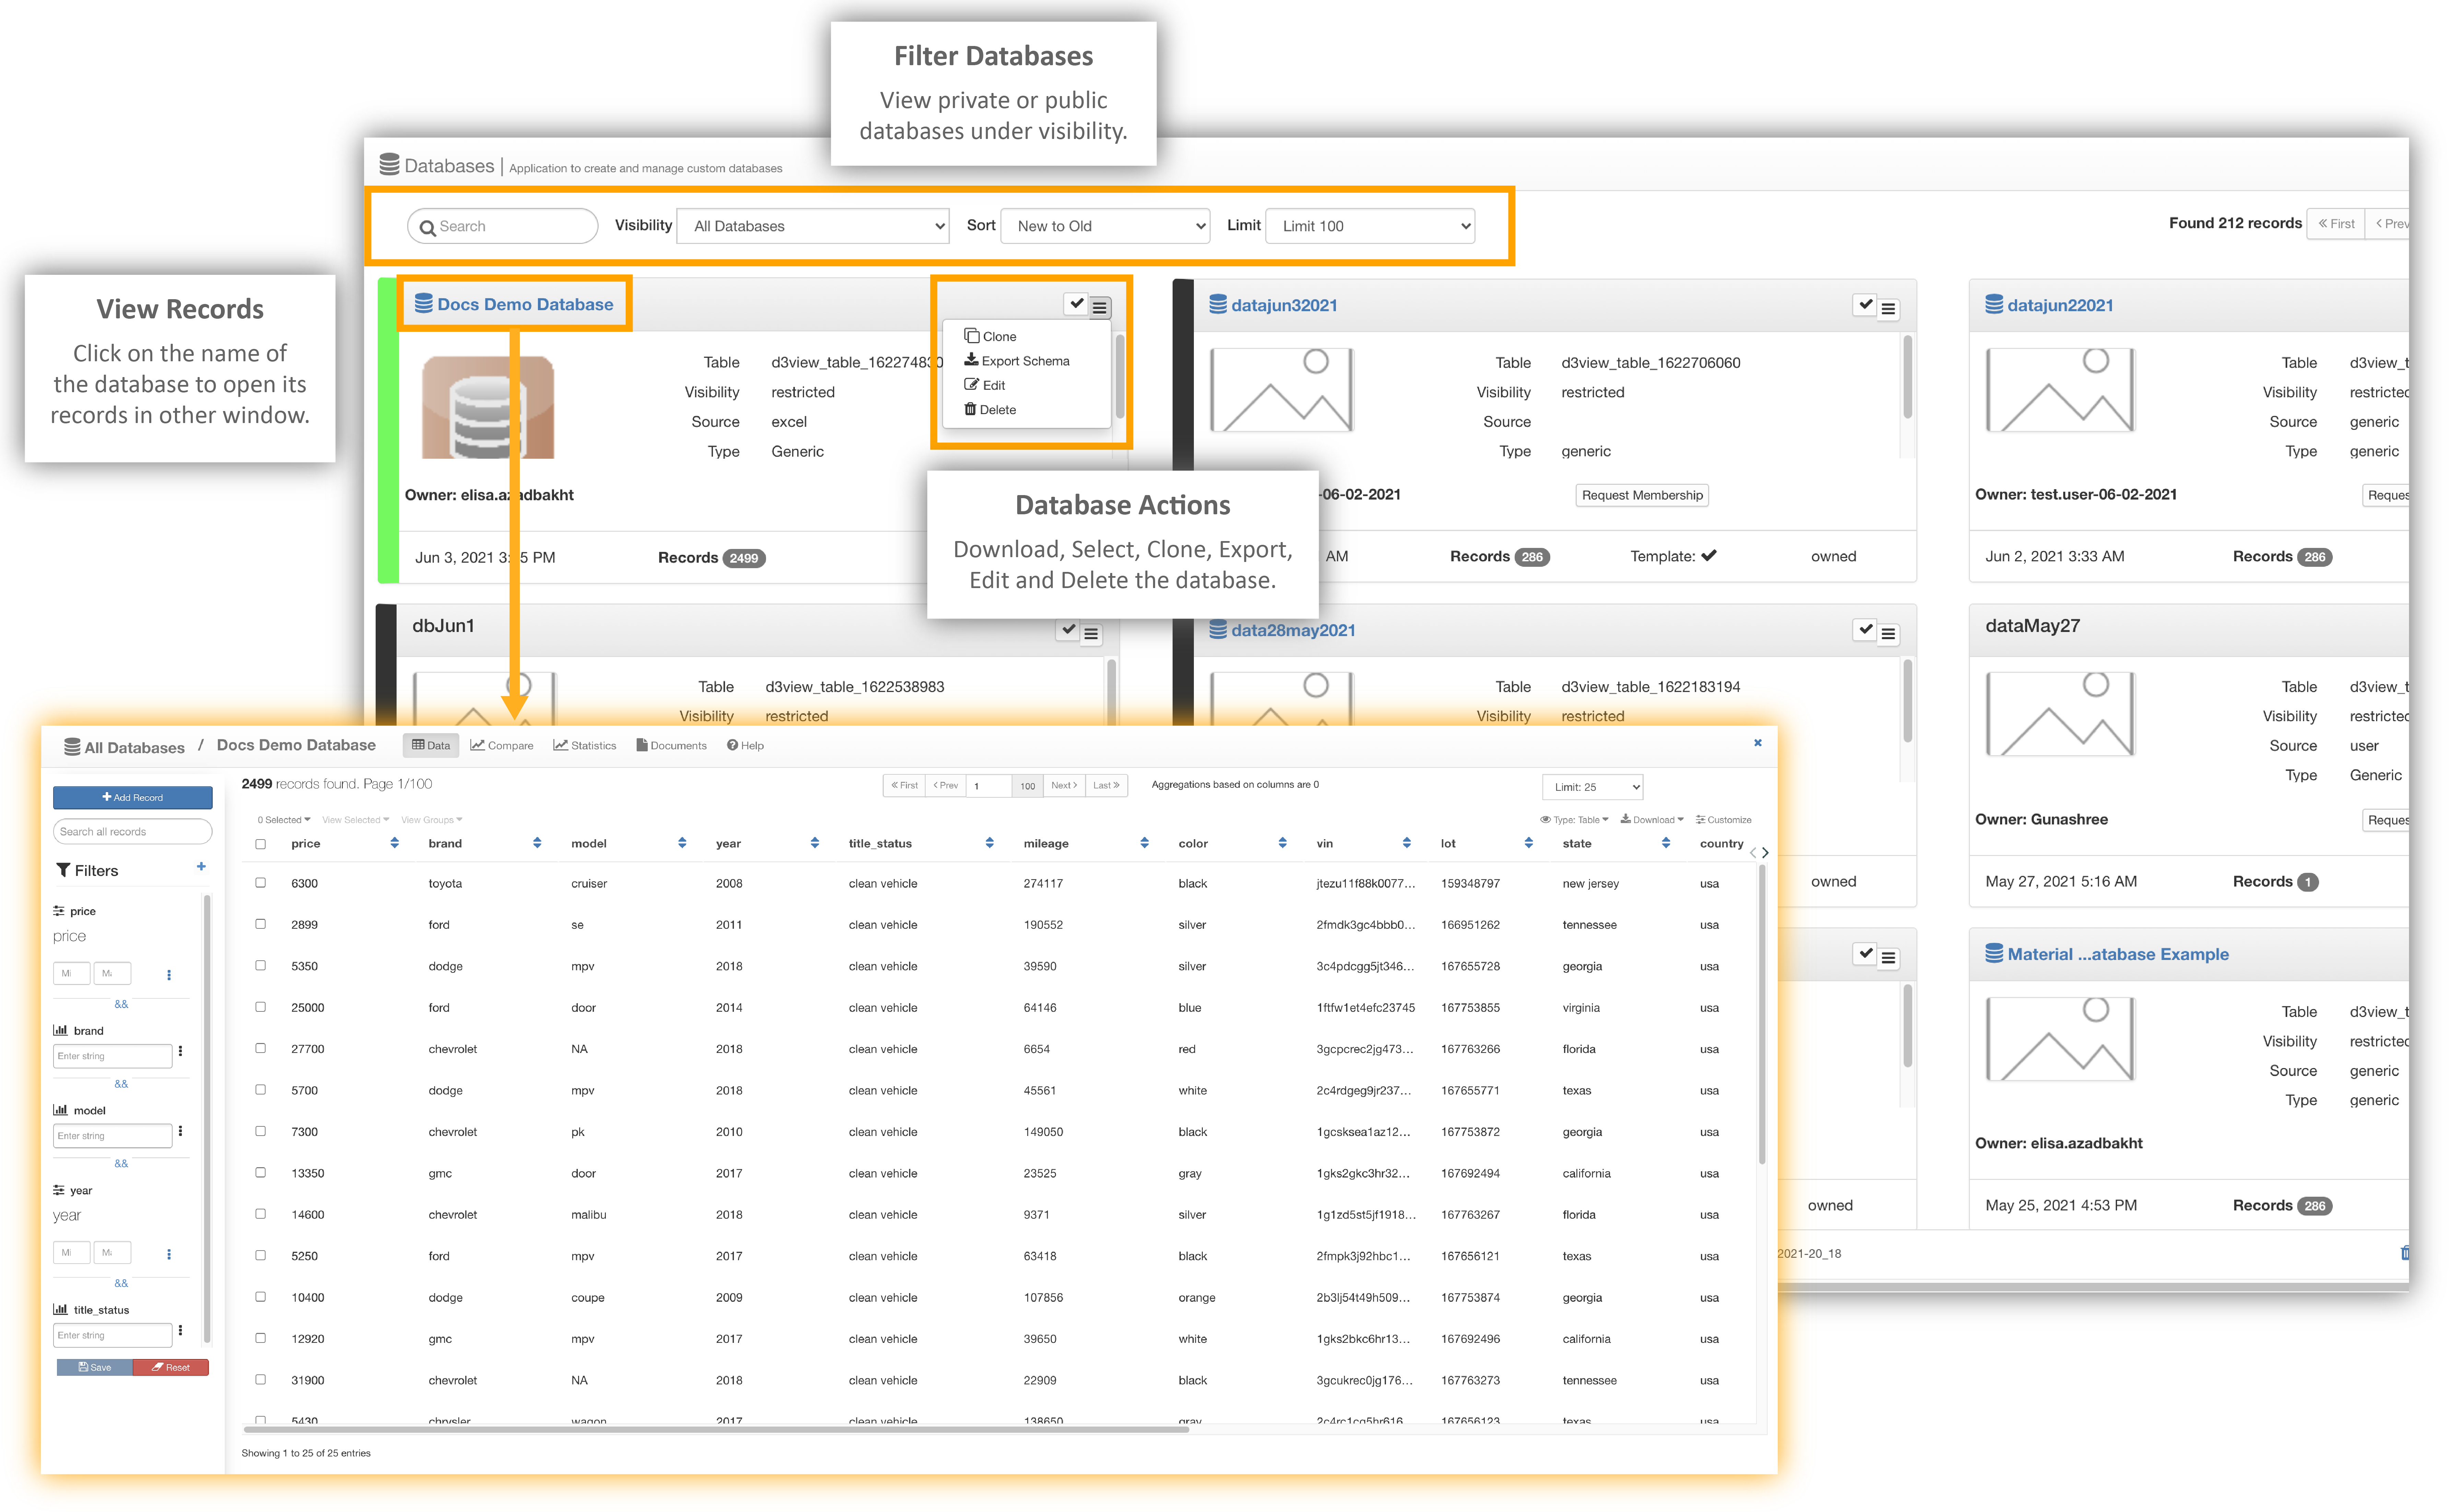
On the Databases home page, you can view and sift through all Databases you have access to, including public ones. Download, select, share, export, edit or delete a Database by using the menu in its top-right corner. You can view records from a Database by clicking on it. Records are individual pieces of data that make up the Database. Records help structure the Database so it’s easy to find and review data.
Databases Home Page and Viewing Records
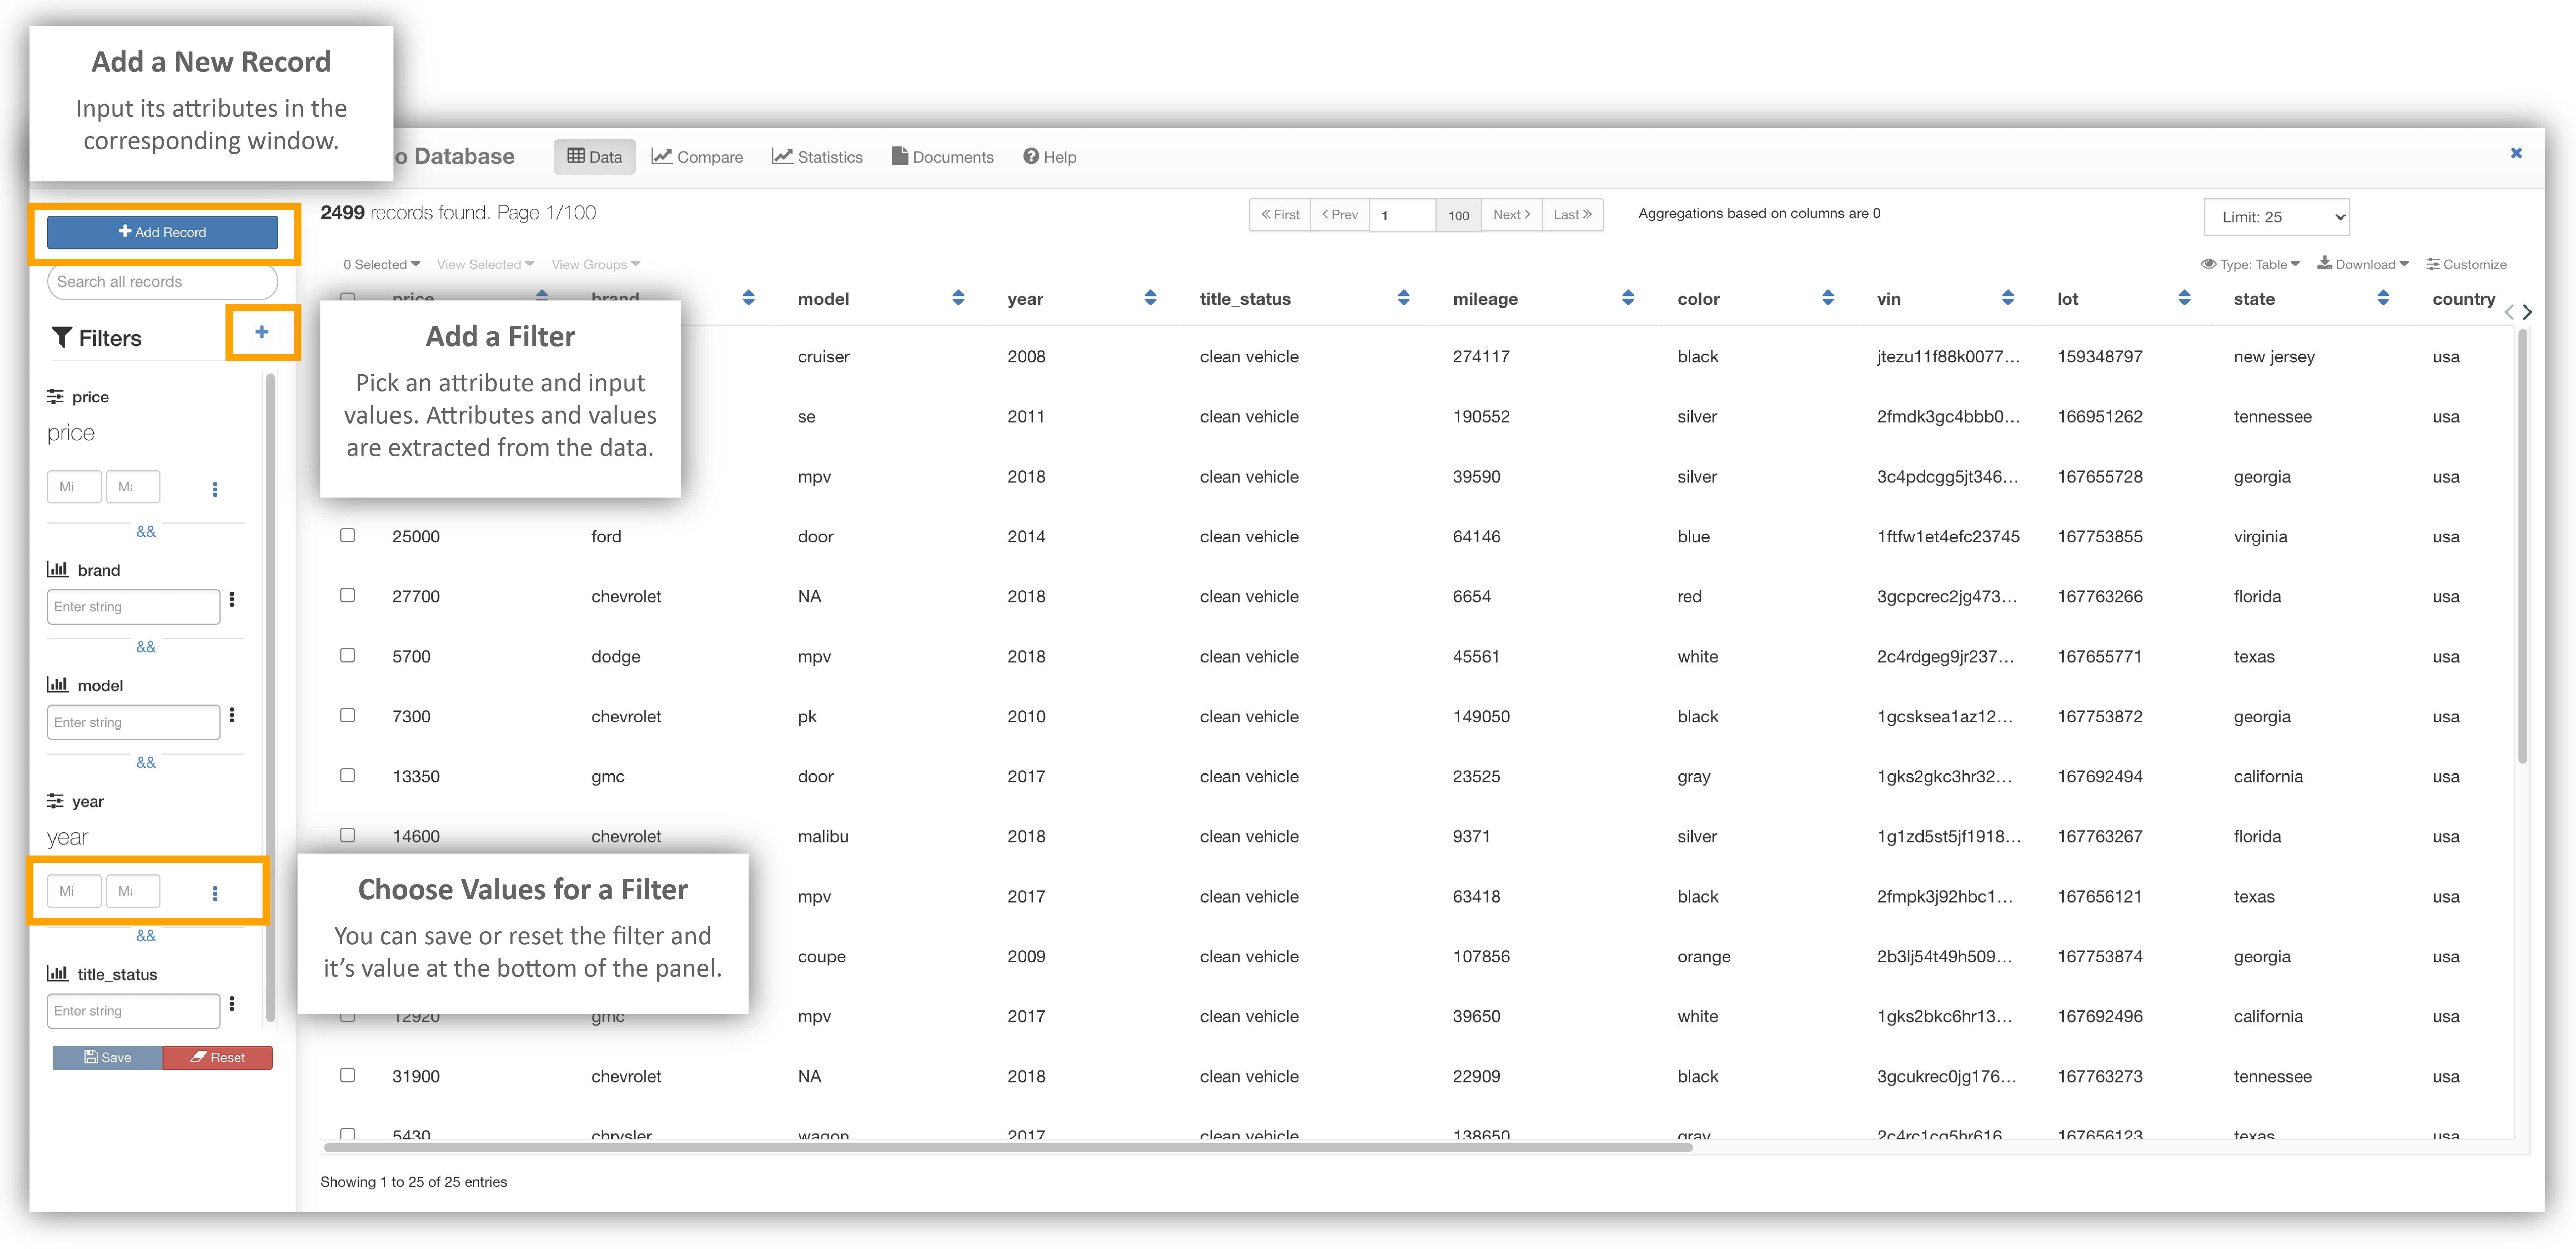
Filtering
Sift through your records easily with the application’s filtering options. On the left side panel, you can input fields for the given default filters or add your own at the top. You can save and reset filters at the bottom of the panel. When adding new filters, the application eases the process by providing values based on the data.
Using Filters to Sift through Records
NEW as of February 19, 2022, Flexible filters allow you to switch from three filtering types: tree-view, flat-view, and horizontal view. Watch the following video to see them in action:
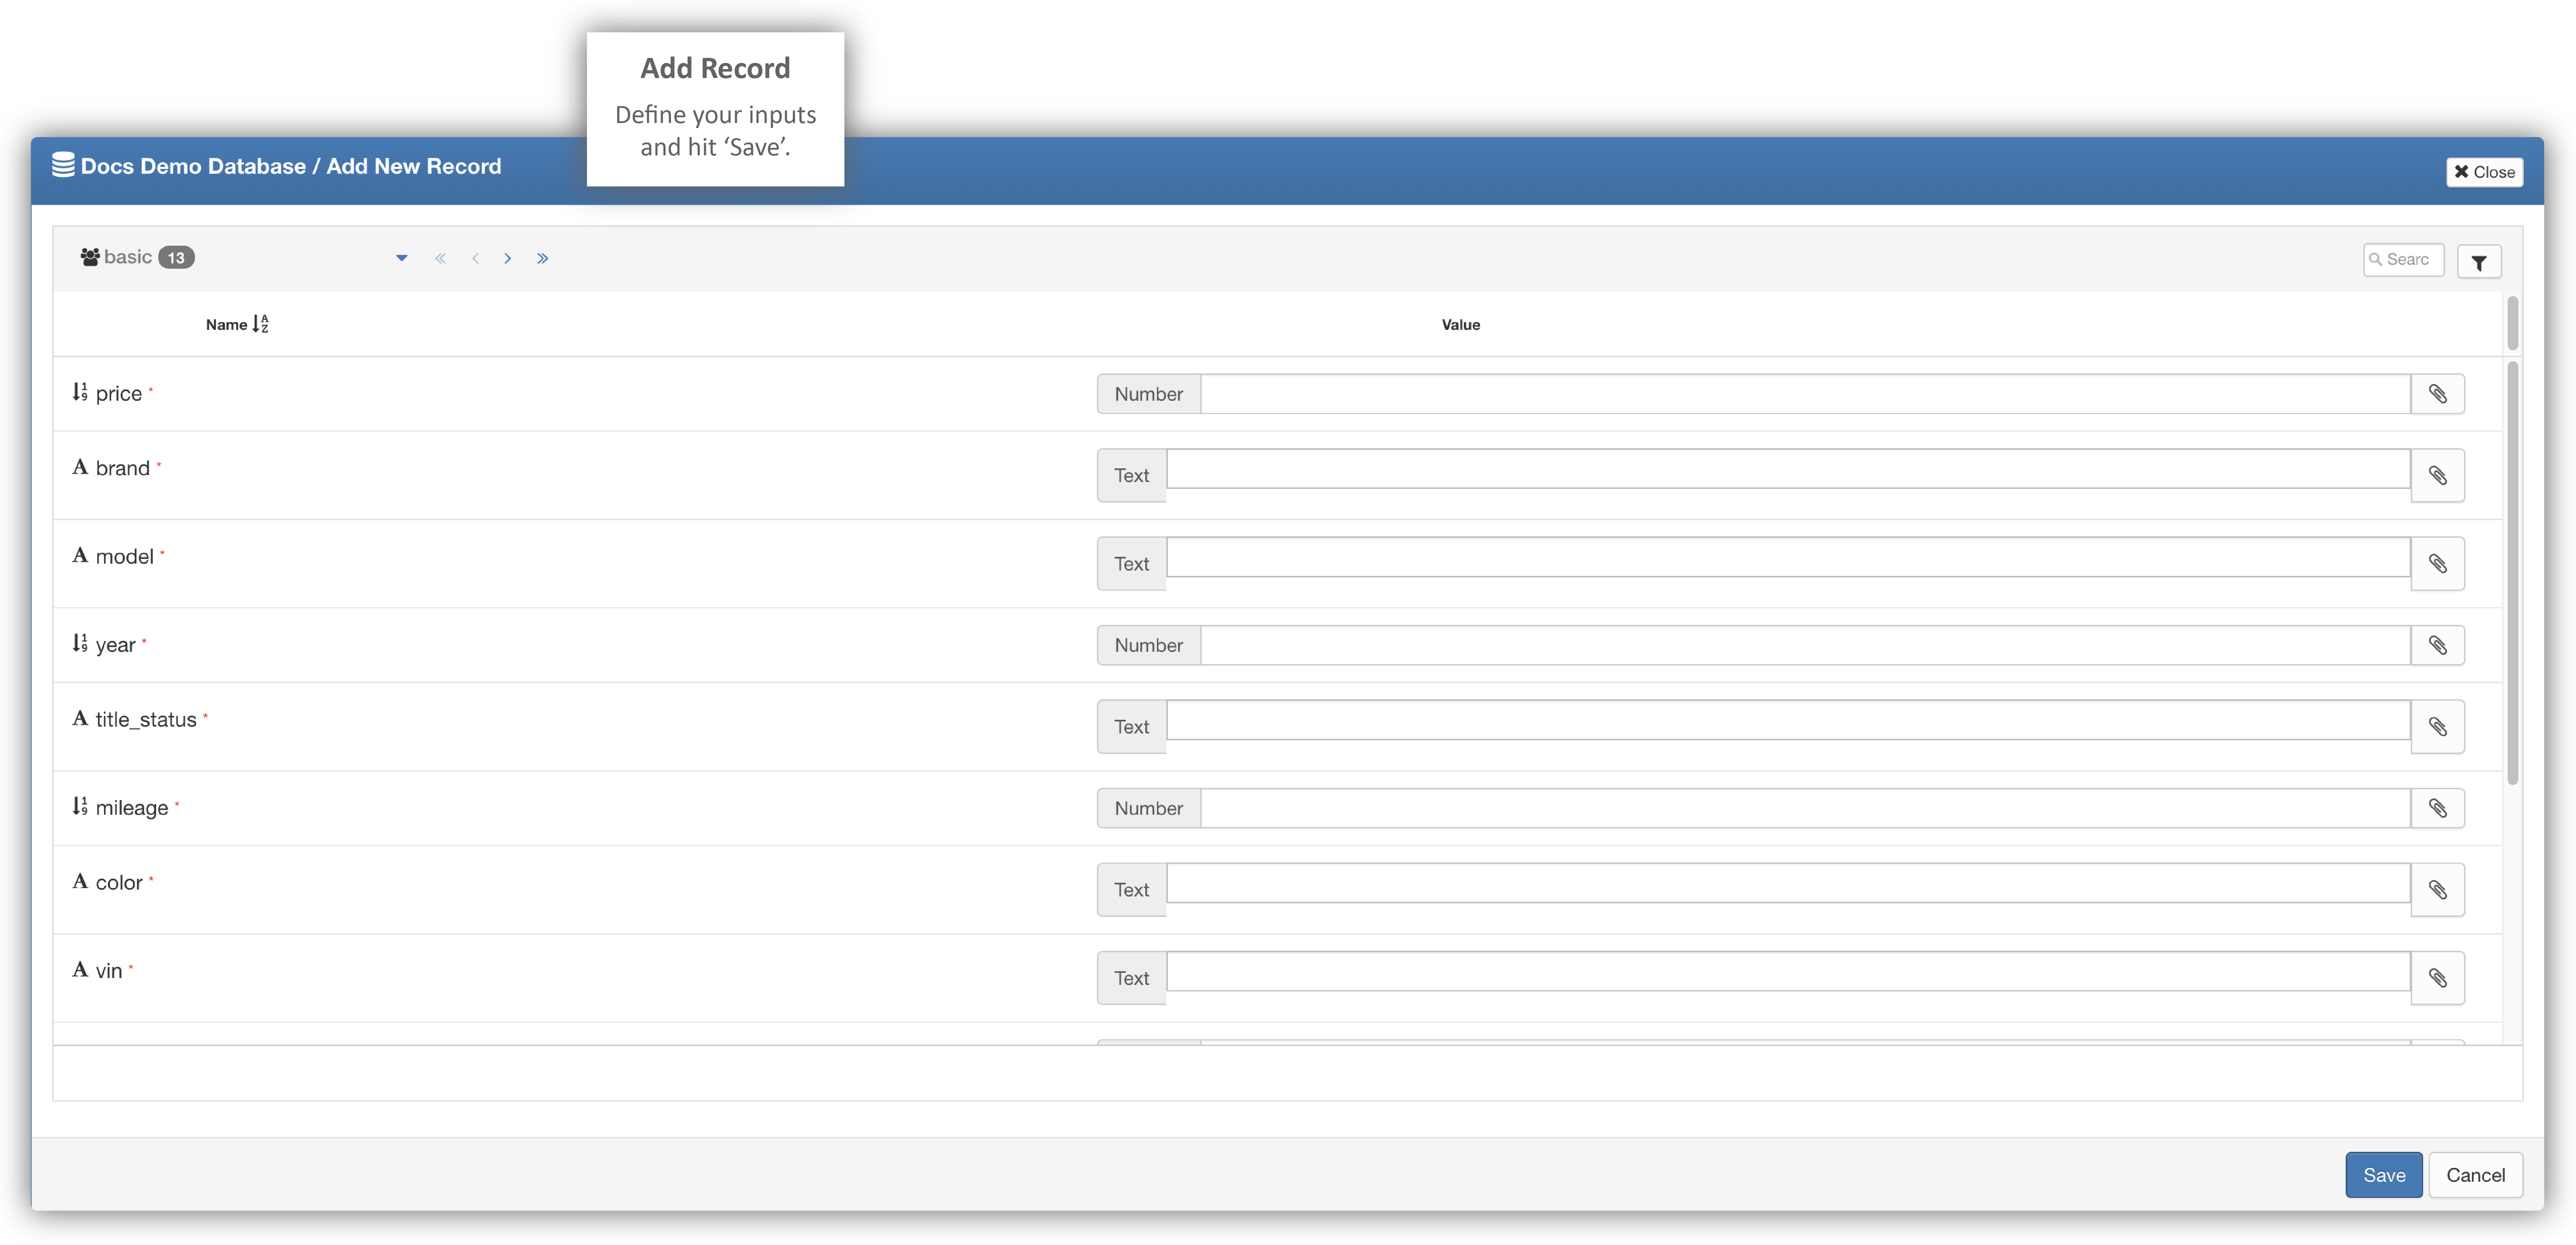
Adding Records
Add records to your Database by clicking the button at the top-right corner.
Adding a Record
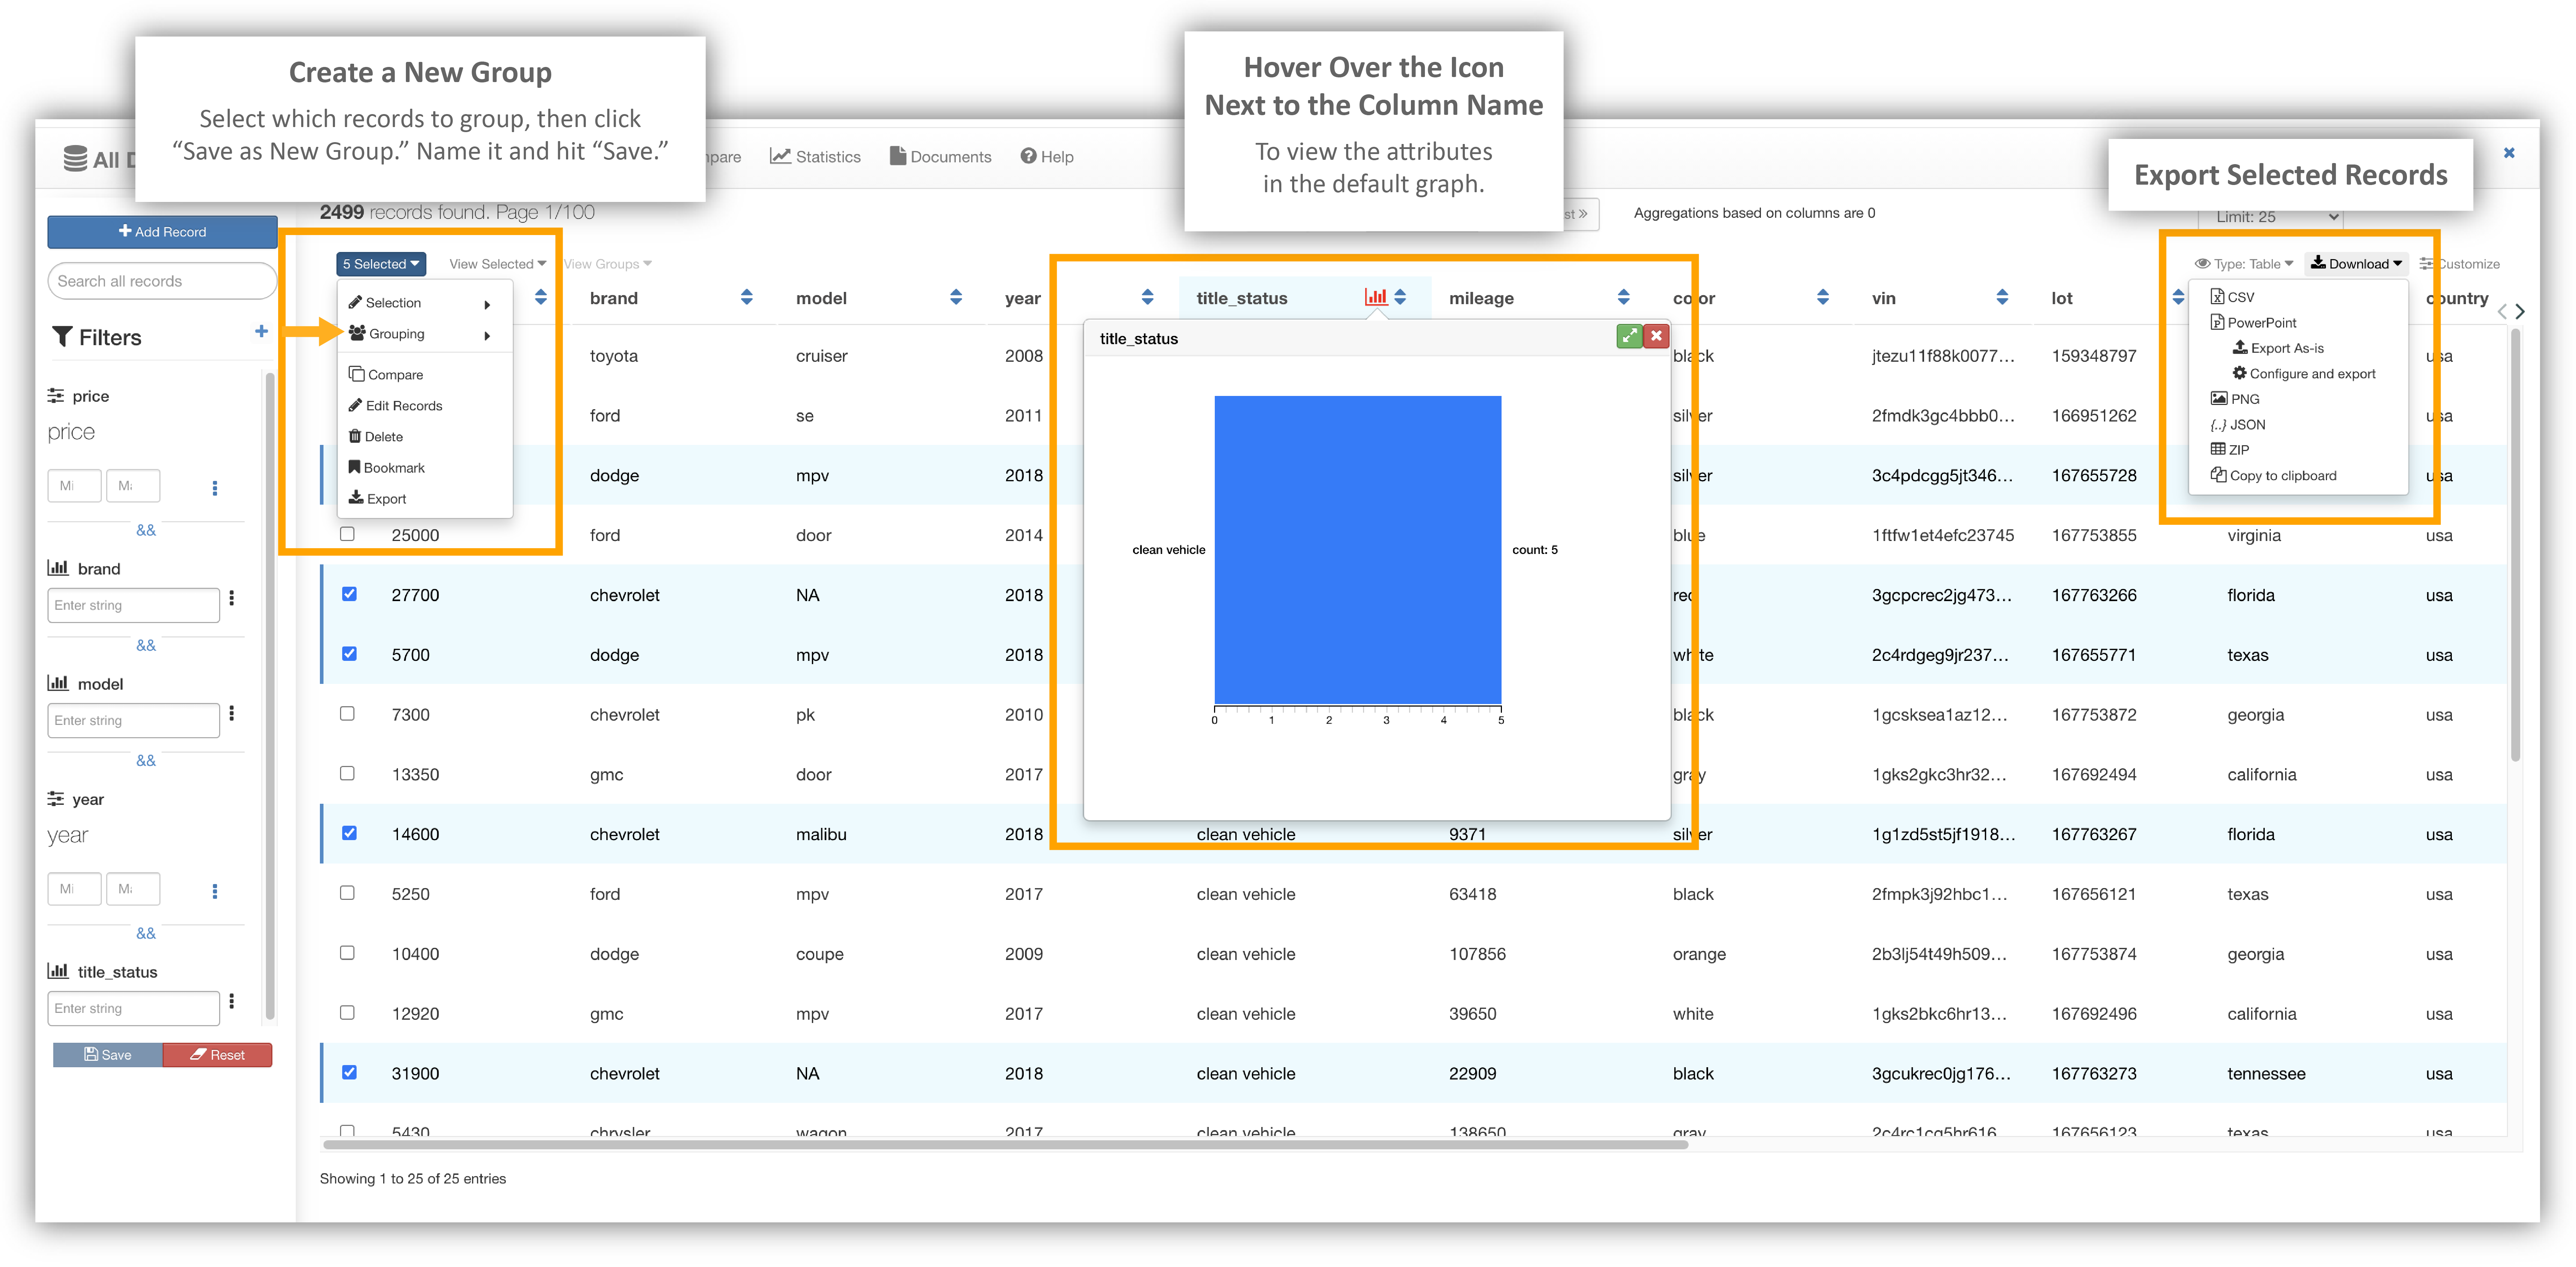
Groups and Columns
Each record is organized in columns and can also be organized into groups. Grouping your records is a great tool for visualizing your database, which we will cover in the next section. Check the individual records you would like to group together. Under the “Selected” button at the top-left, click “Save as Group” and enter a name for it. You can also visualize each record column by clicking on the graph symbol next to its specified name.
Saving a Group and Viewing Columns
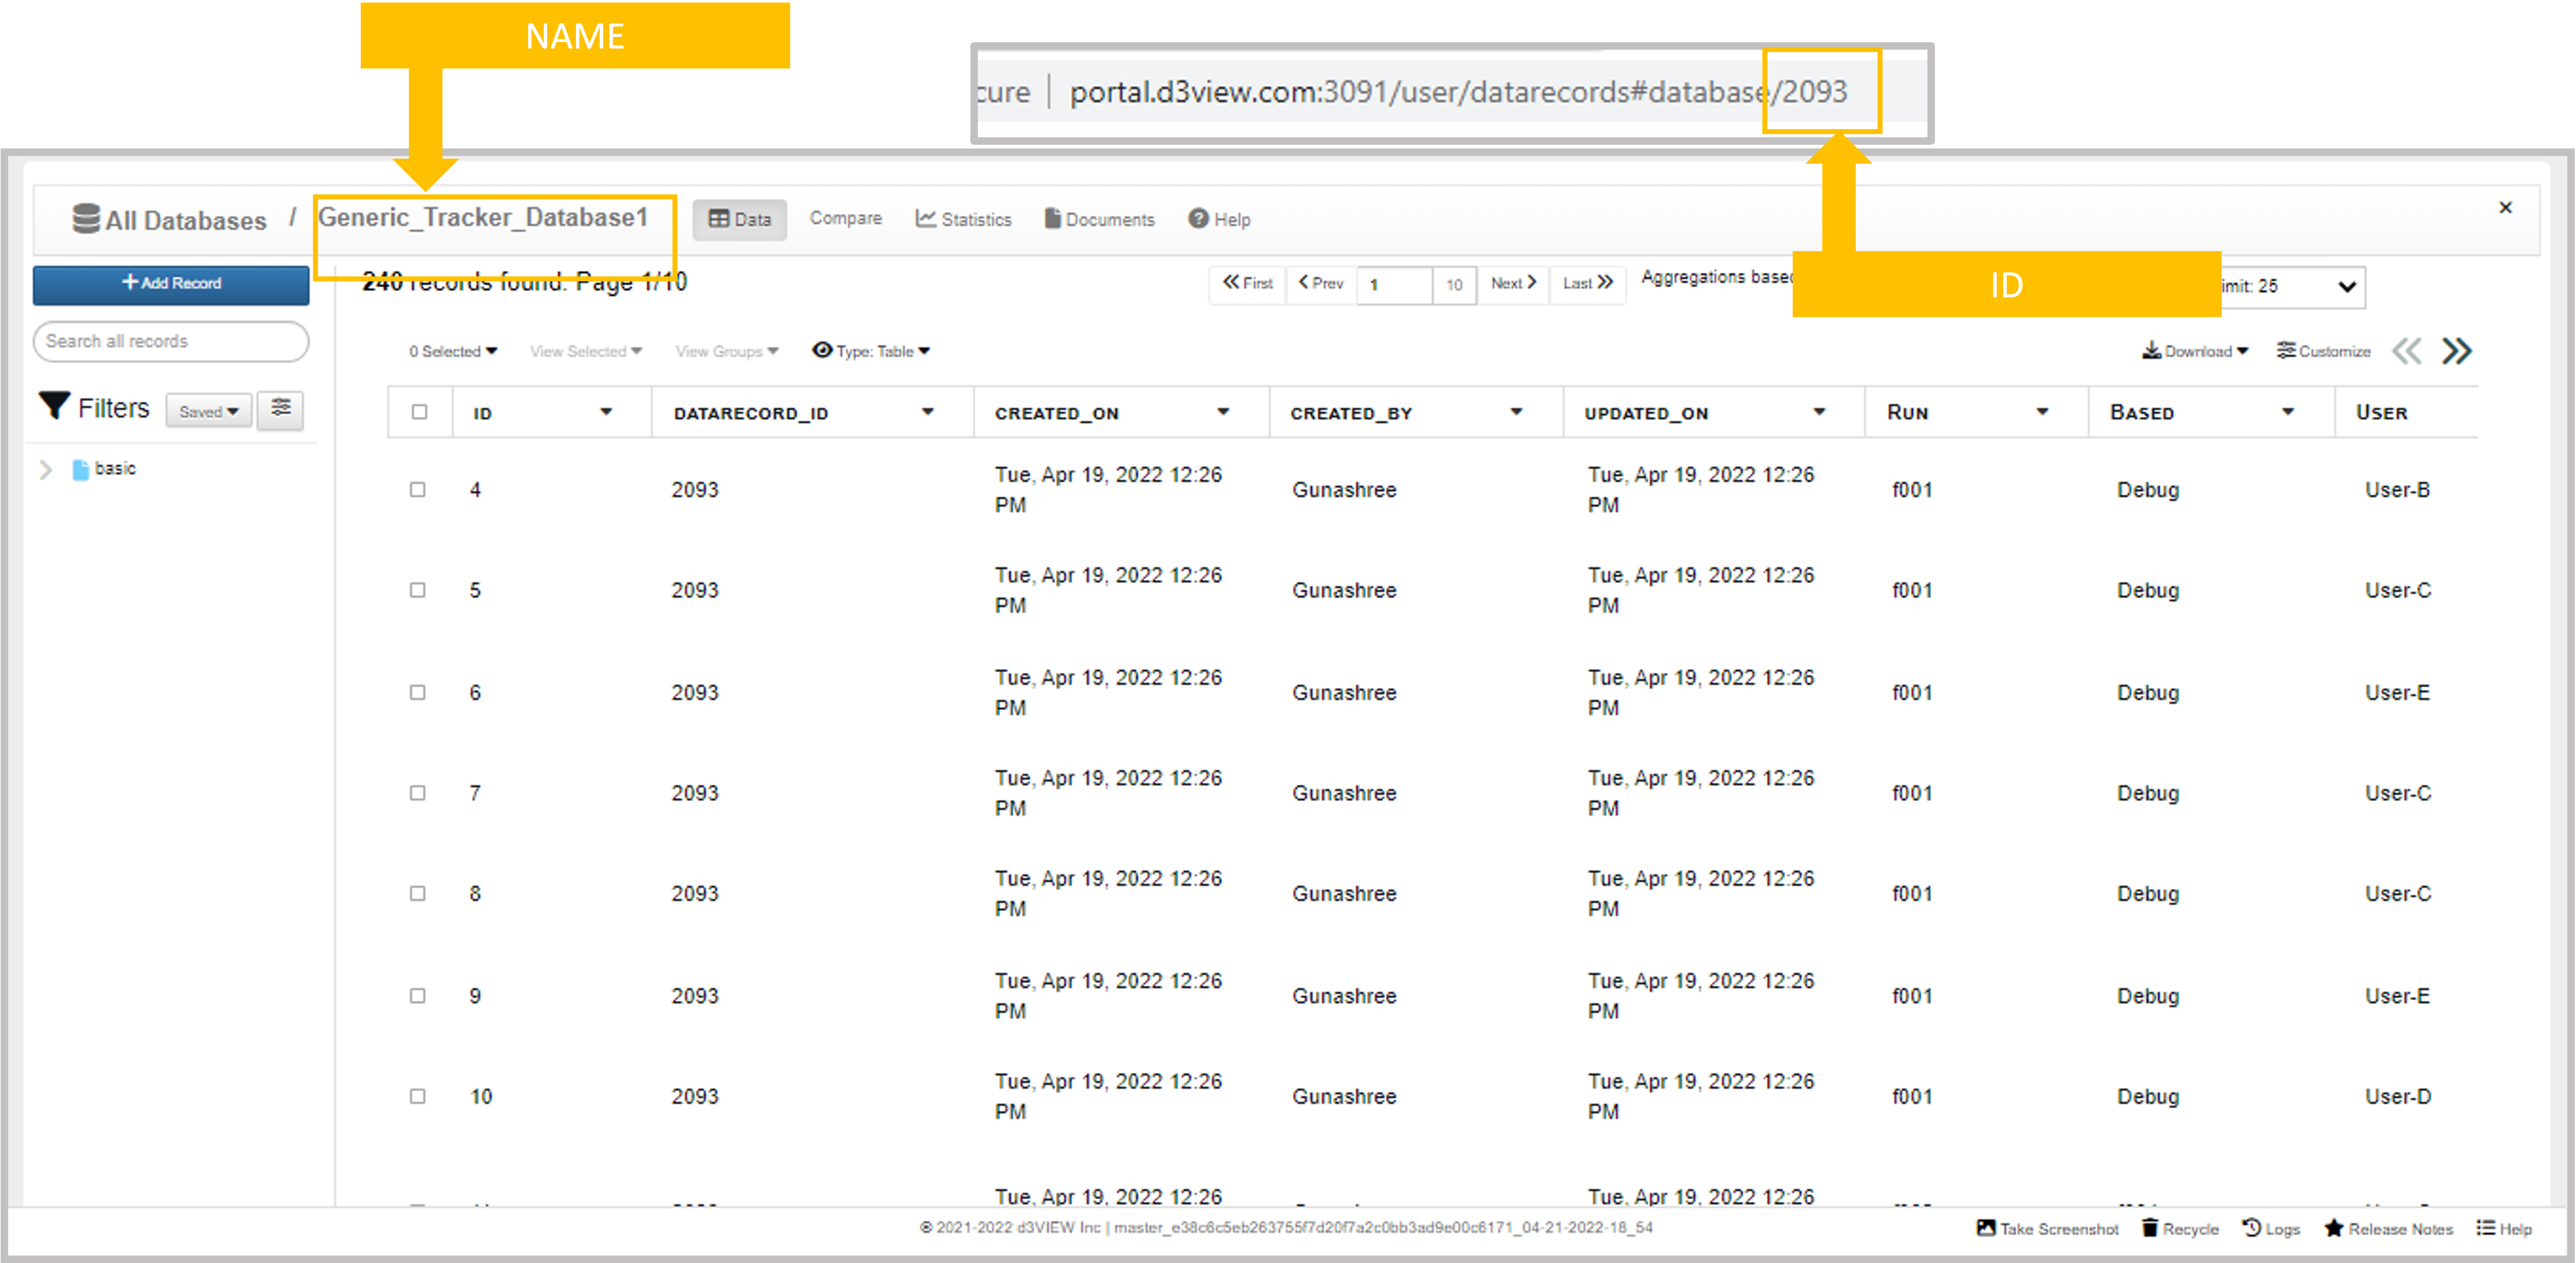
Direct Access
You can skip sifting through all your databases directly access individual ones by using http://datarecord/view/ID/NAME. Here is an example:
Directly Access Databases
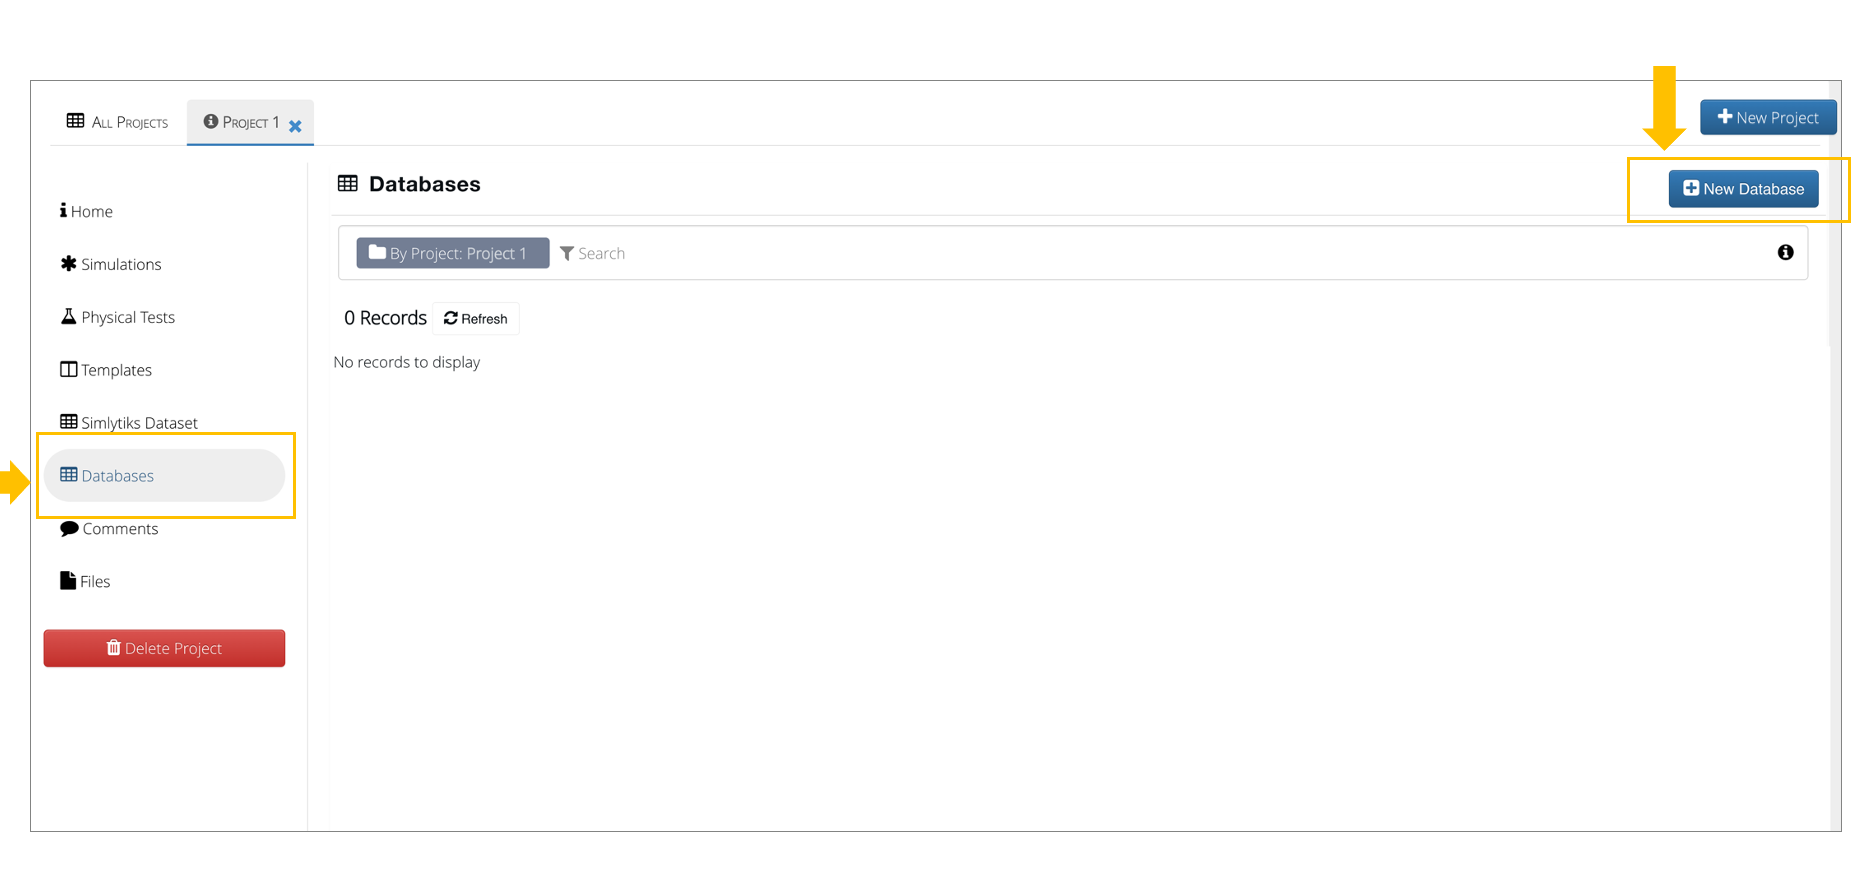
Associate with Project
You can associate a database with a Project id and find it under Project/Databases:
Associate with Project
5.3. Visualizing a Database
Because your data is now structured, you can visualize it by using Statistics and Comparisons, making it easier to understand and comprehend. The Databases application works in accordance with the Simlytiks application to make this happen seamlessly for you. Please review the “Simlytiks” section if you need help navigating that application.
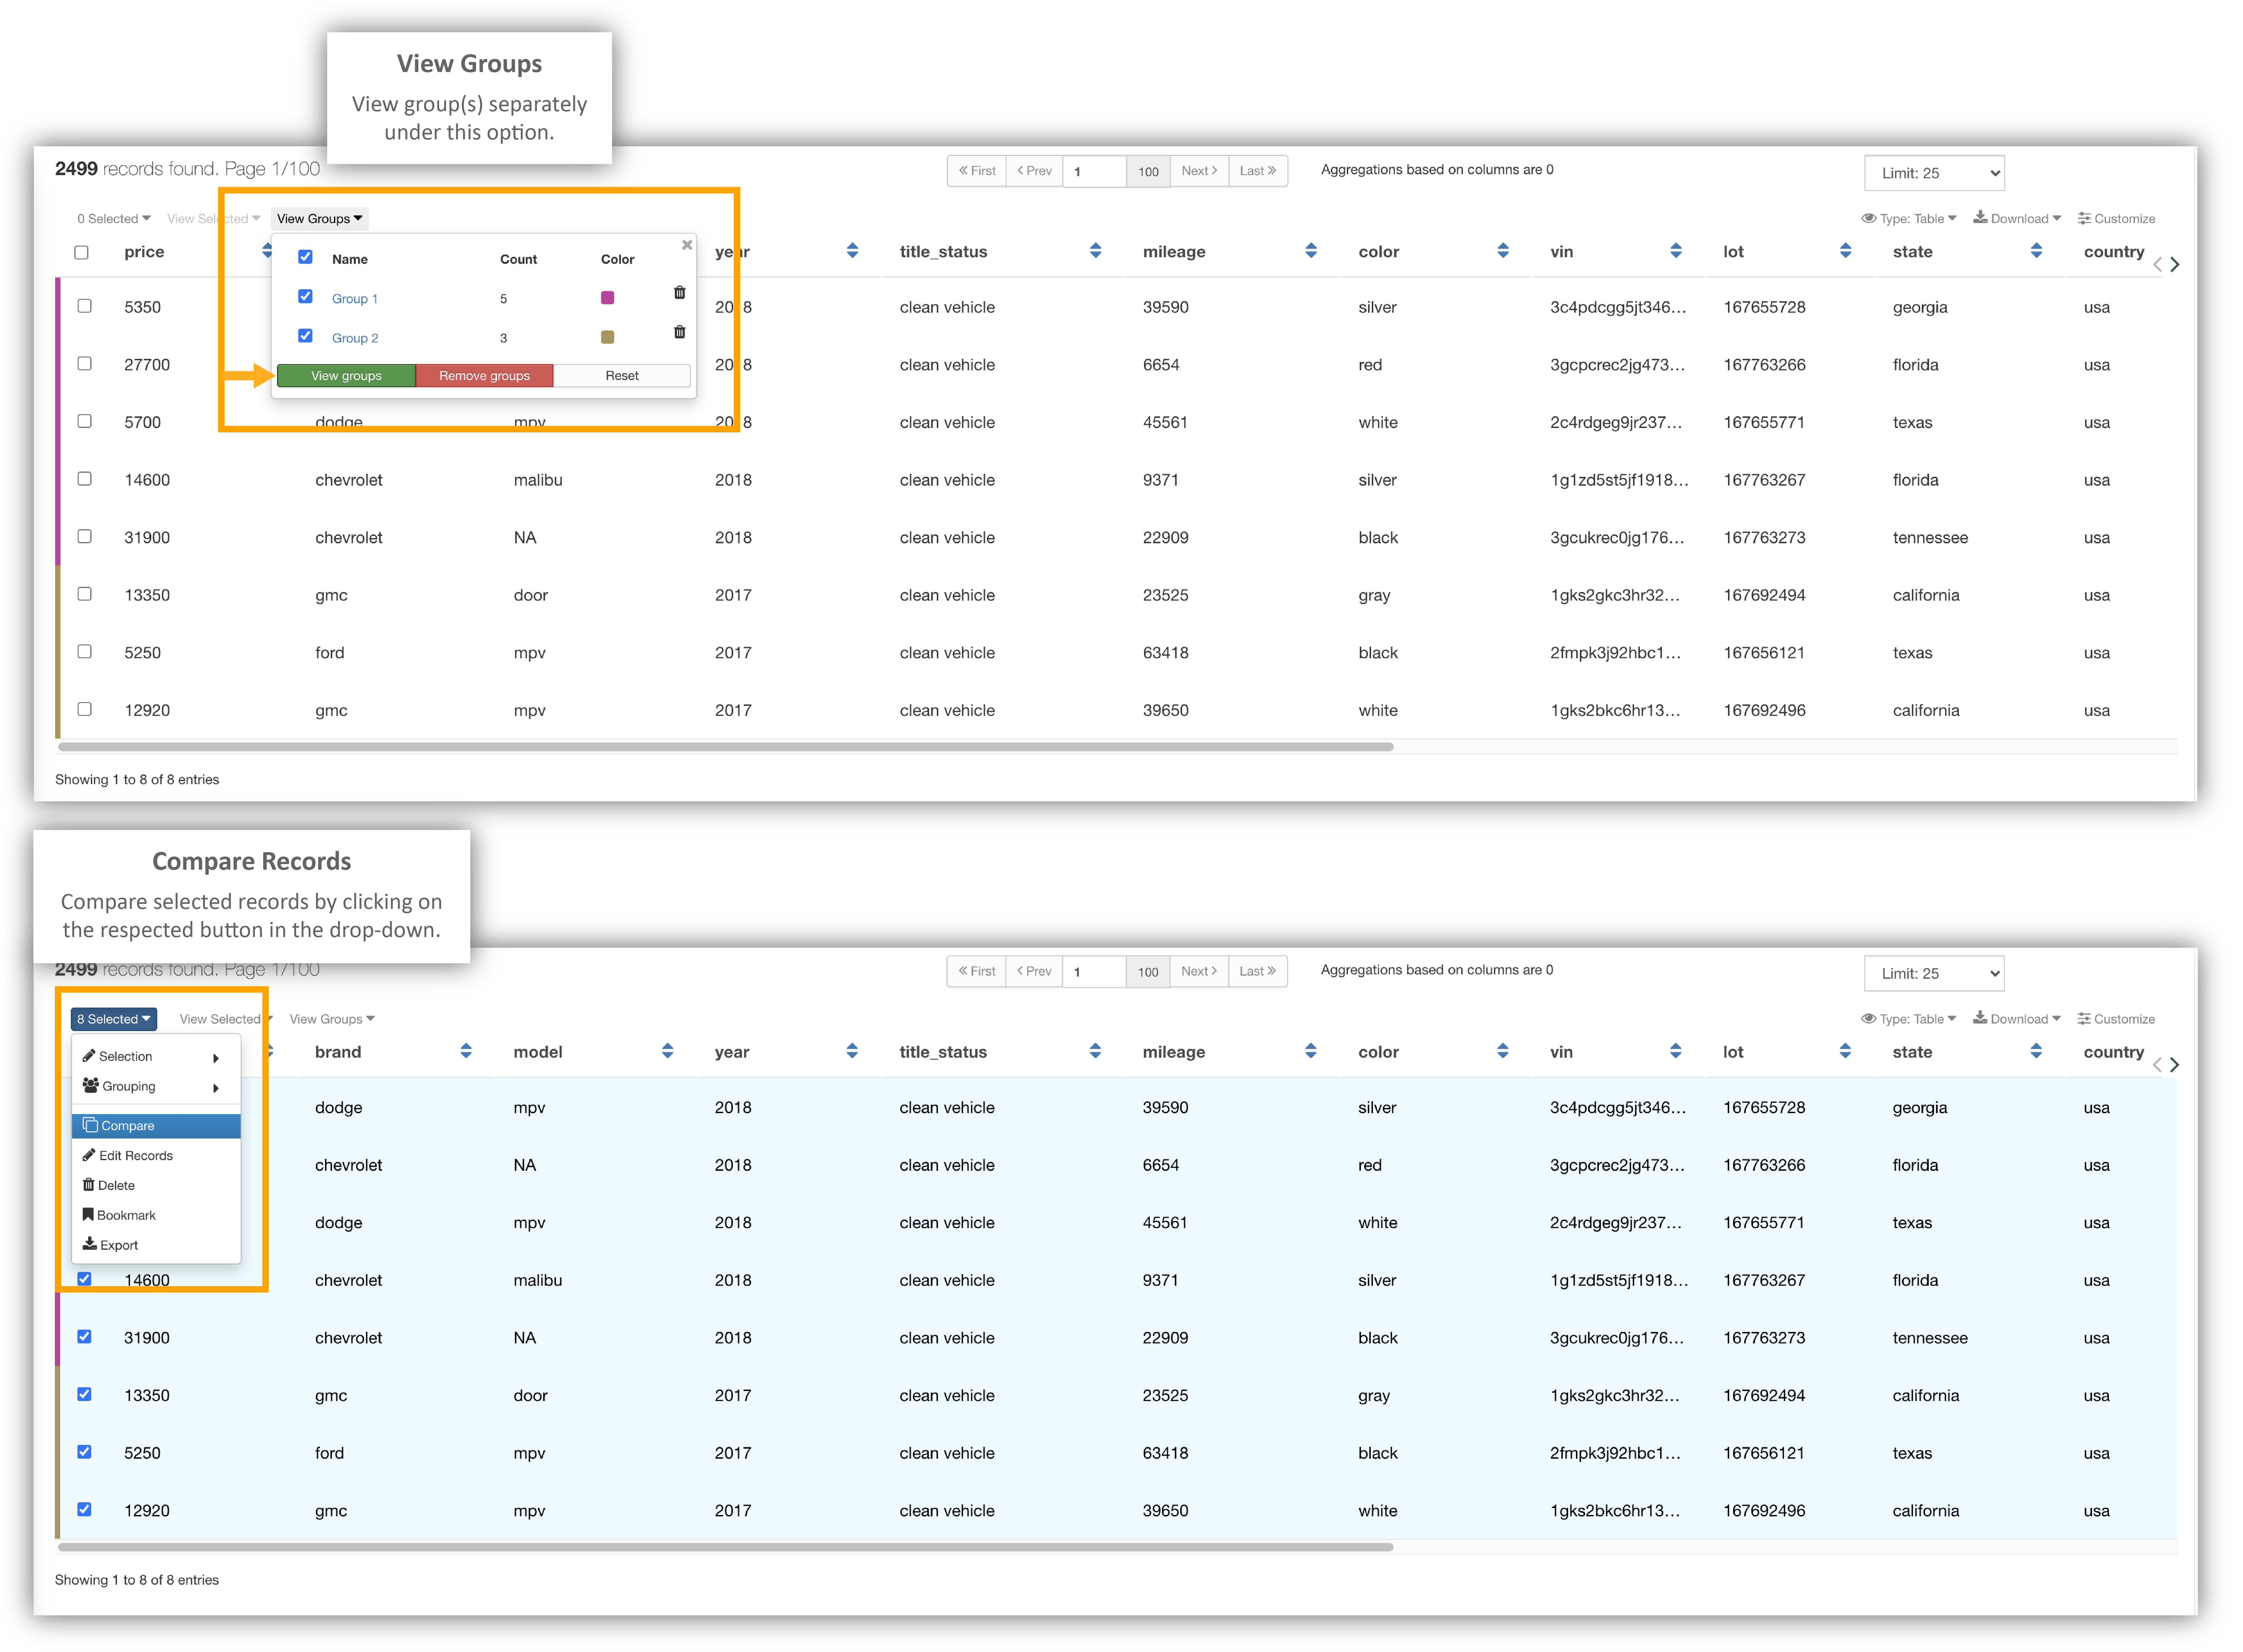
Comparisons
You can compare individual records by visualizing them. Select which records you would like to compare and click ‘Compare’ under the ‘Selected’ drop-down menu at the top-left. You can also choose a group you created earlier to compare under the ‘Groups’ drown-drop menu.
Picking Records to Compare
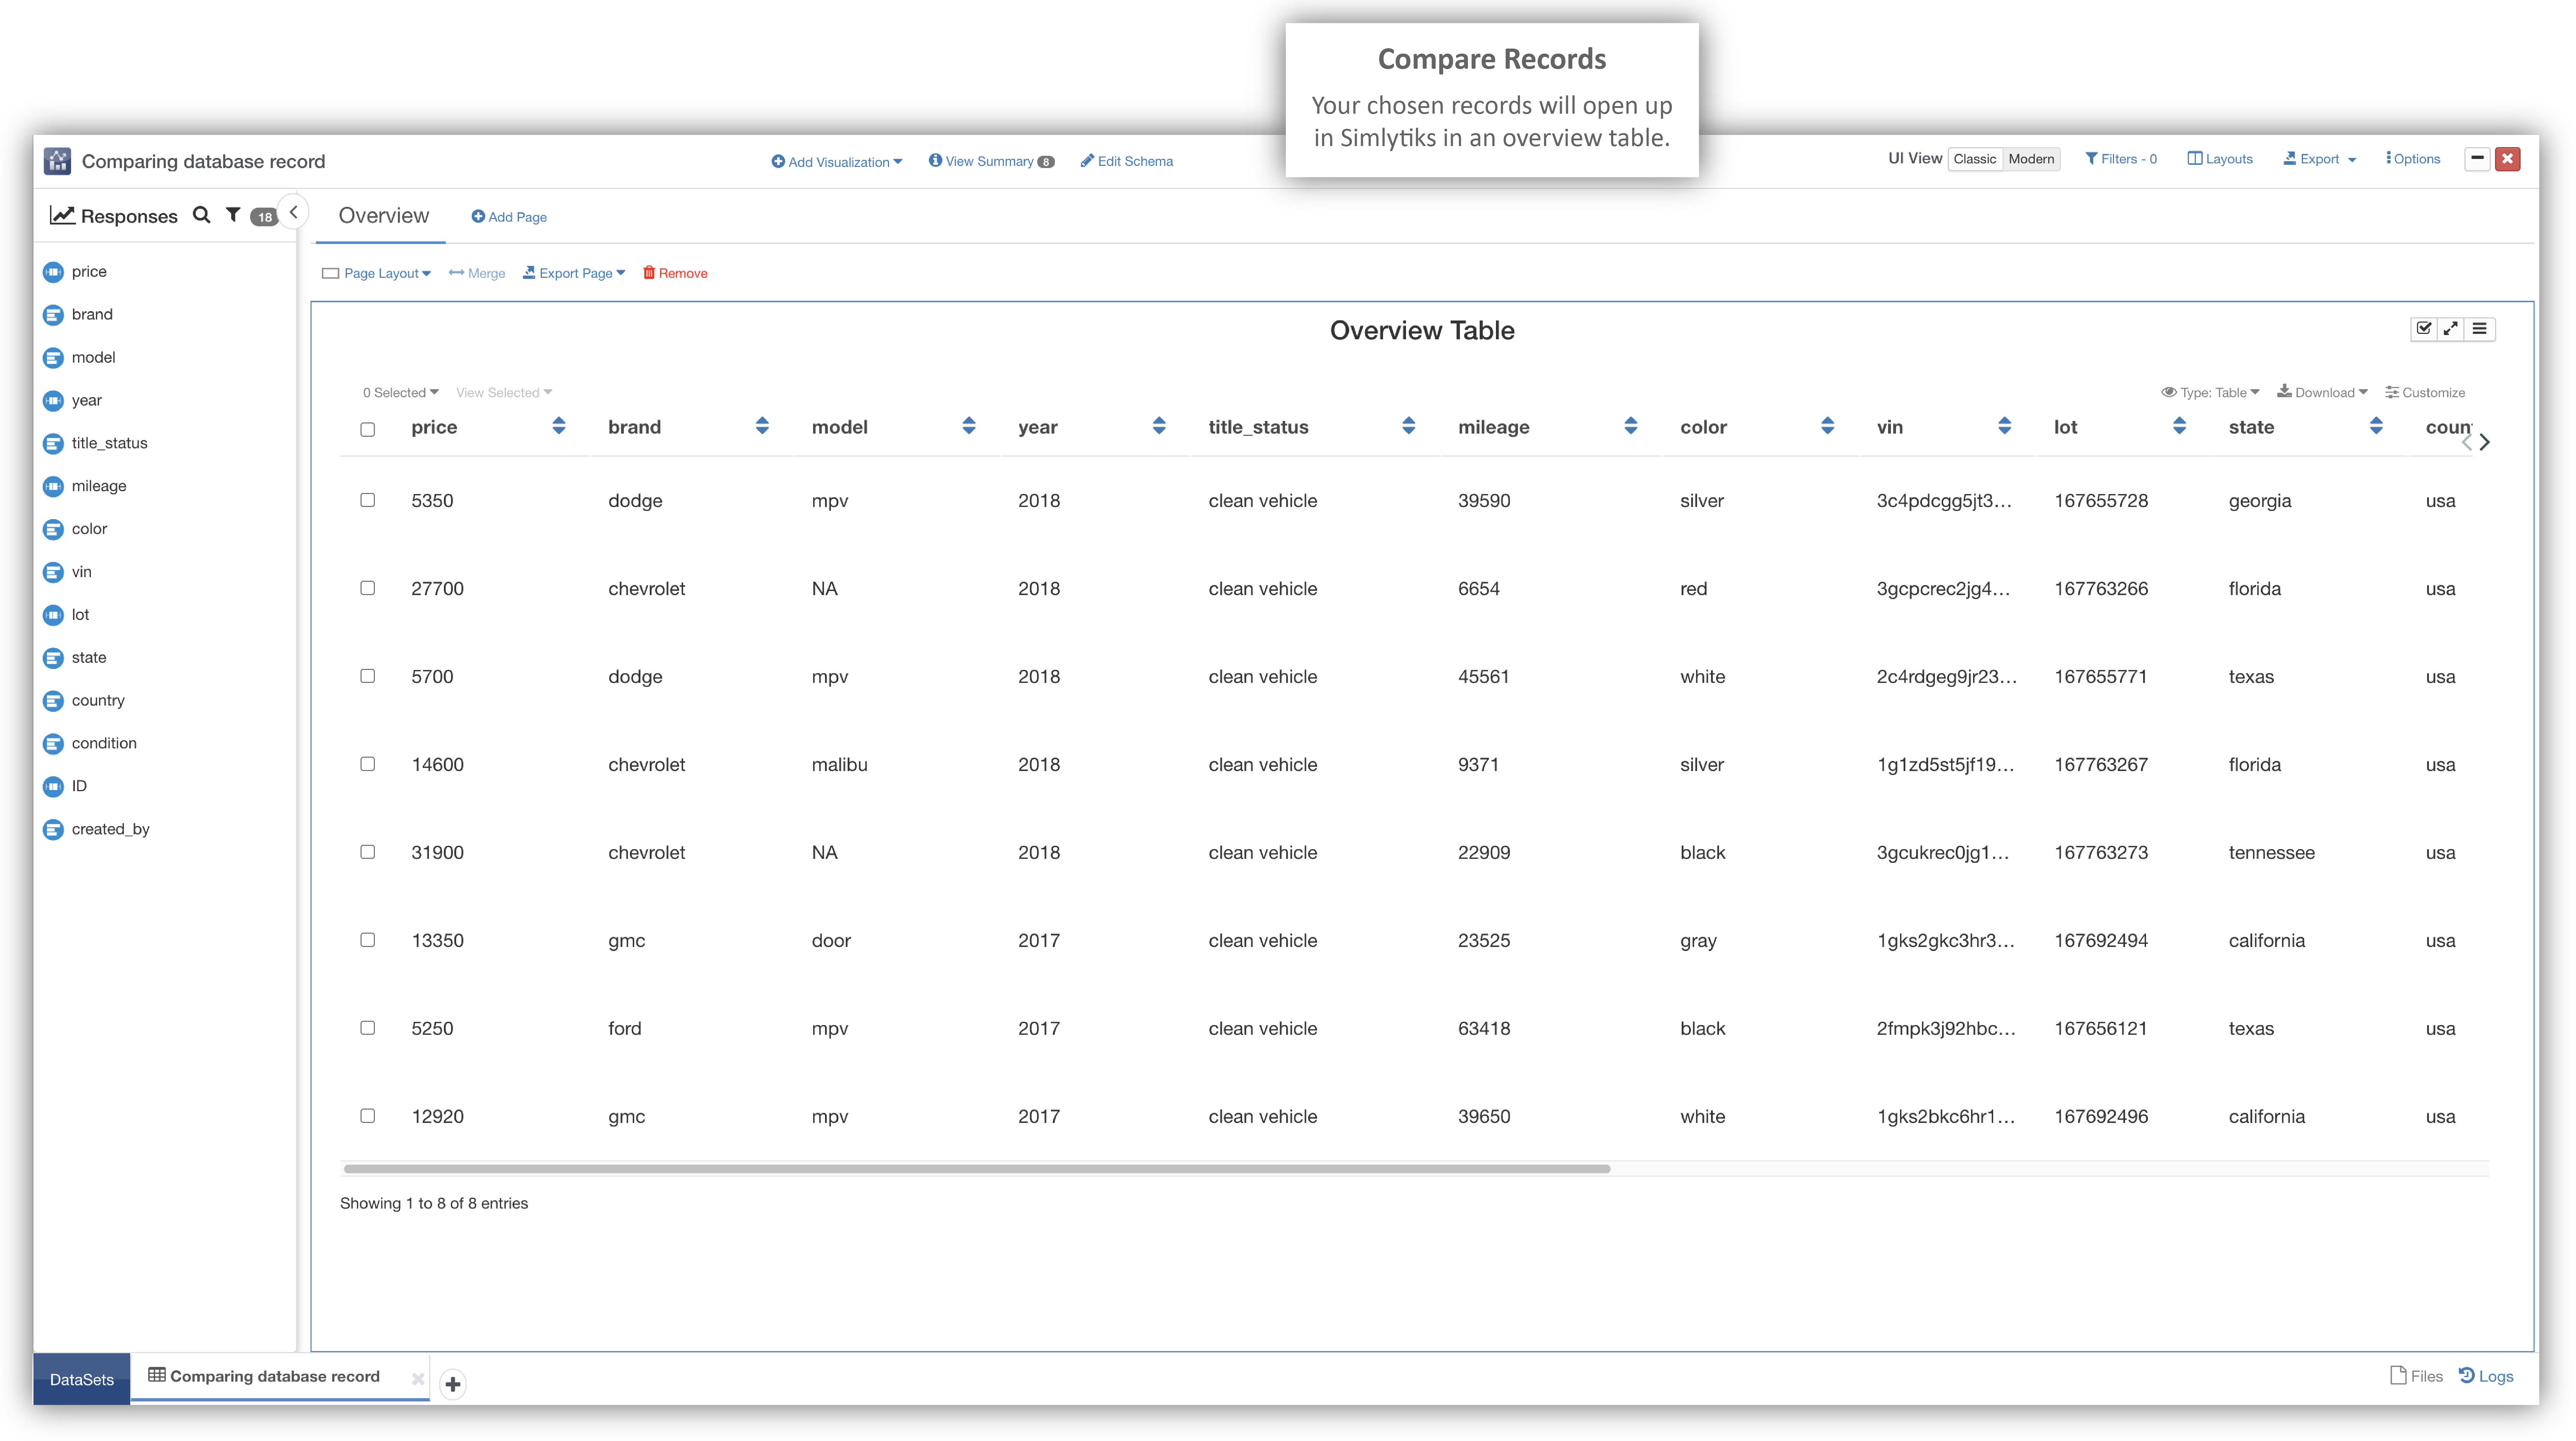
The selected records will open up in a new window to compare in the Simlytiks application.
Compare in Simlytiks Window
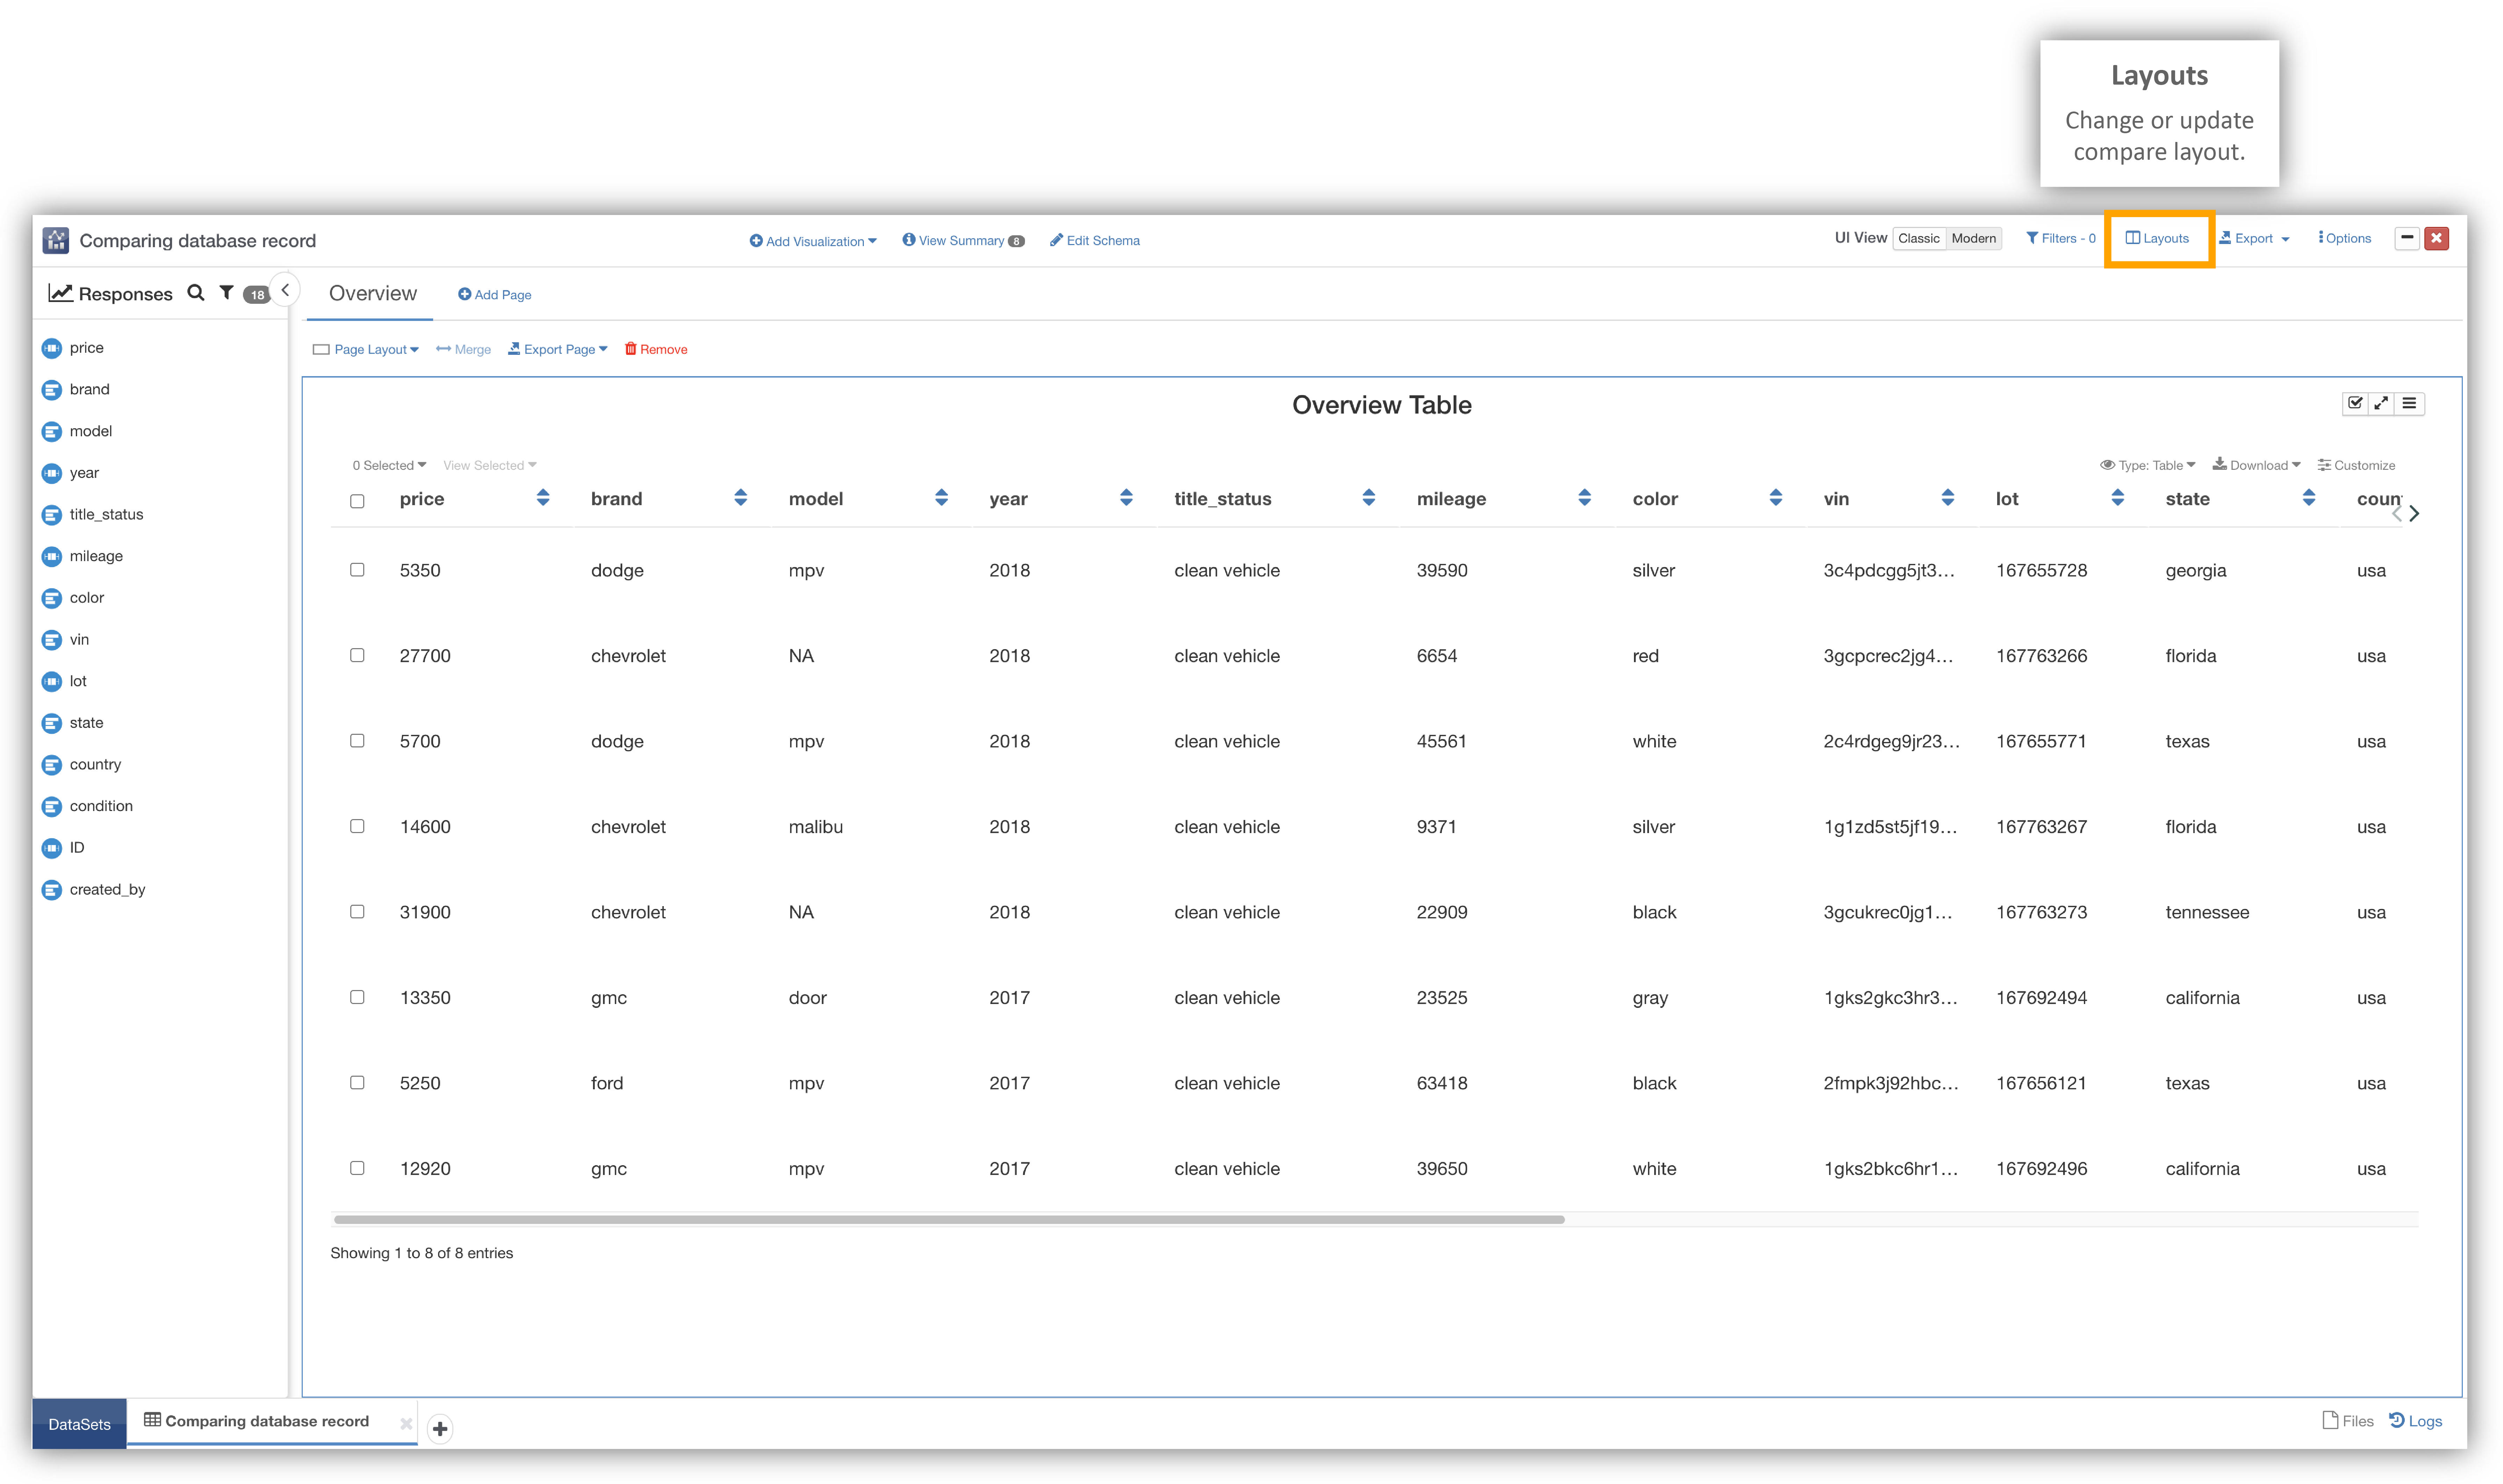
Saving and Applying a Layout
Layouts make it easy for you to be consistent with visualizing your data in a particular Dataset. After you visualize a comparison, you can save, change or upload layout under the ‘Layout’ button at the top.
Viewing Layouts
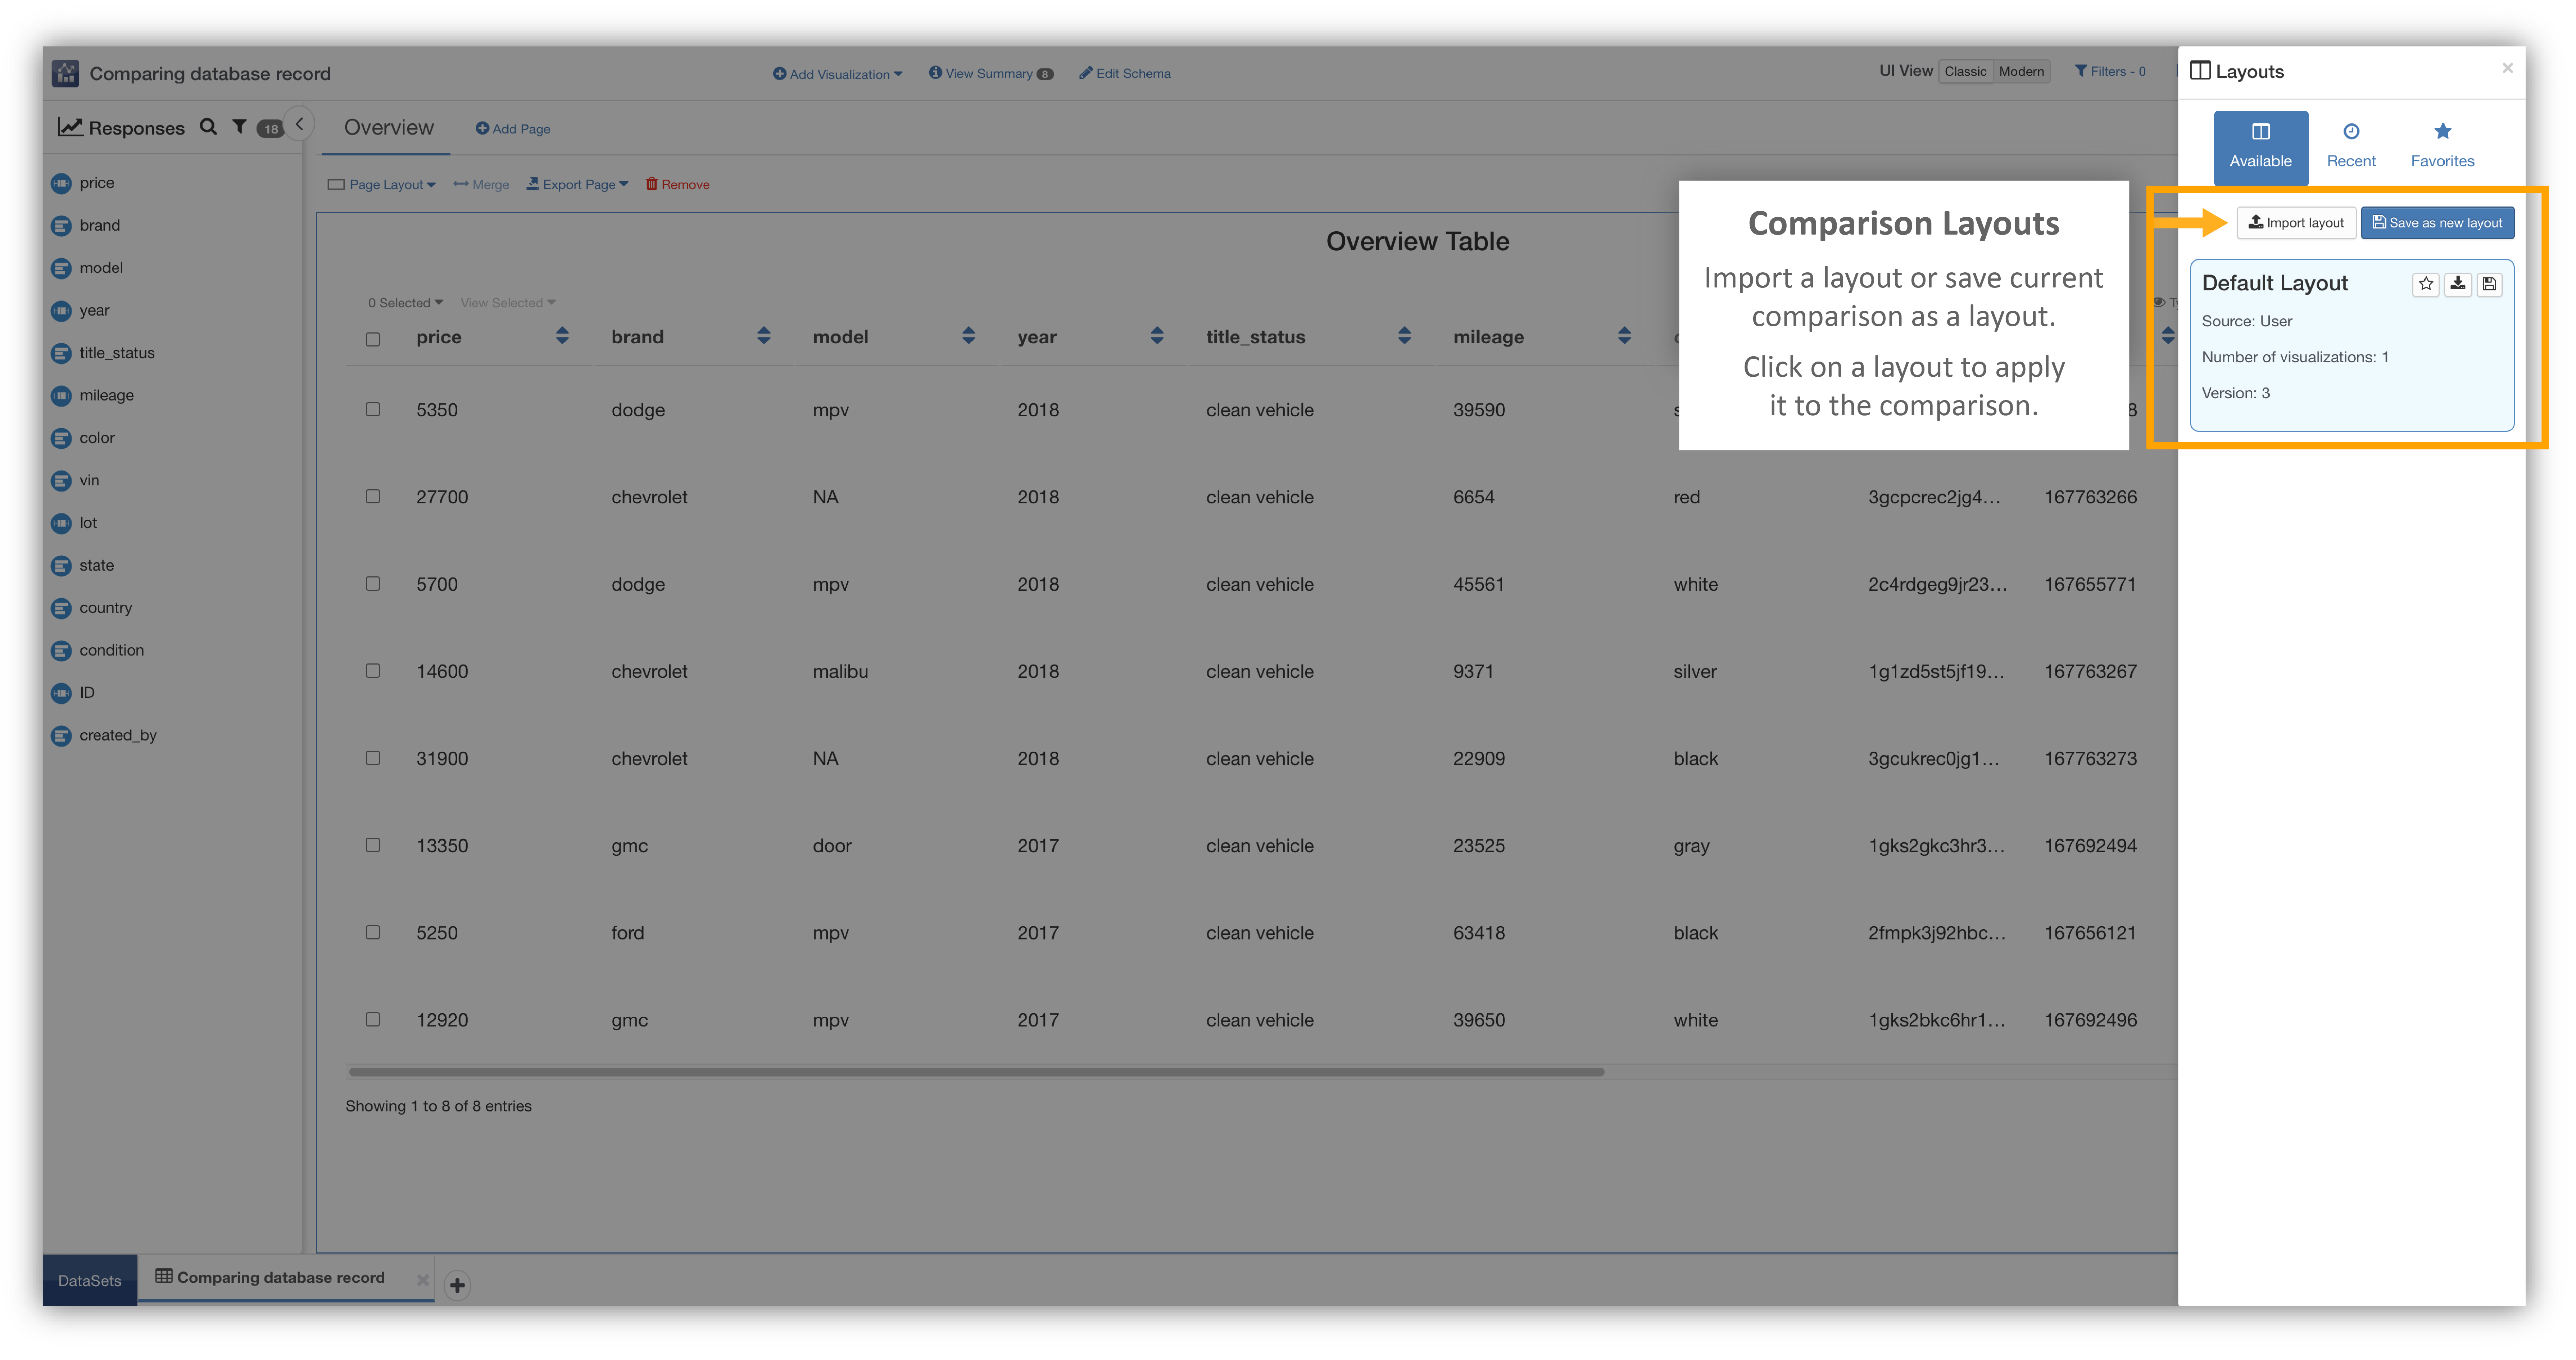
Here, upload a layout or save the current comparison as a new layout. Or, sift through ones you already have saved. There will always be a default layout for comparisons.
Changing Layouts
Statistics
The Statistics tab is another tool for visualizing your Database. This feature organizes your data and provides visualization summarizations based on its particular fields. You can sort each visualization by value or name.
For additional questions about how to navigate the d3VIEW platform, please feel free to email our team at: support@d3view.com.