
11.  Curve Digitization
Workflows has the ability to digitize and create usable curve plot from an image of a curve. The following demonstrates how it is done.
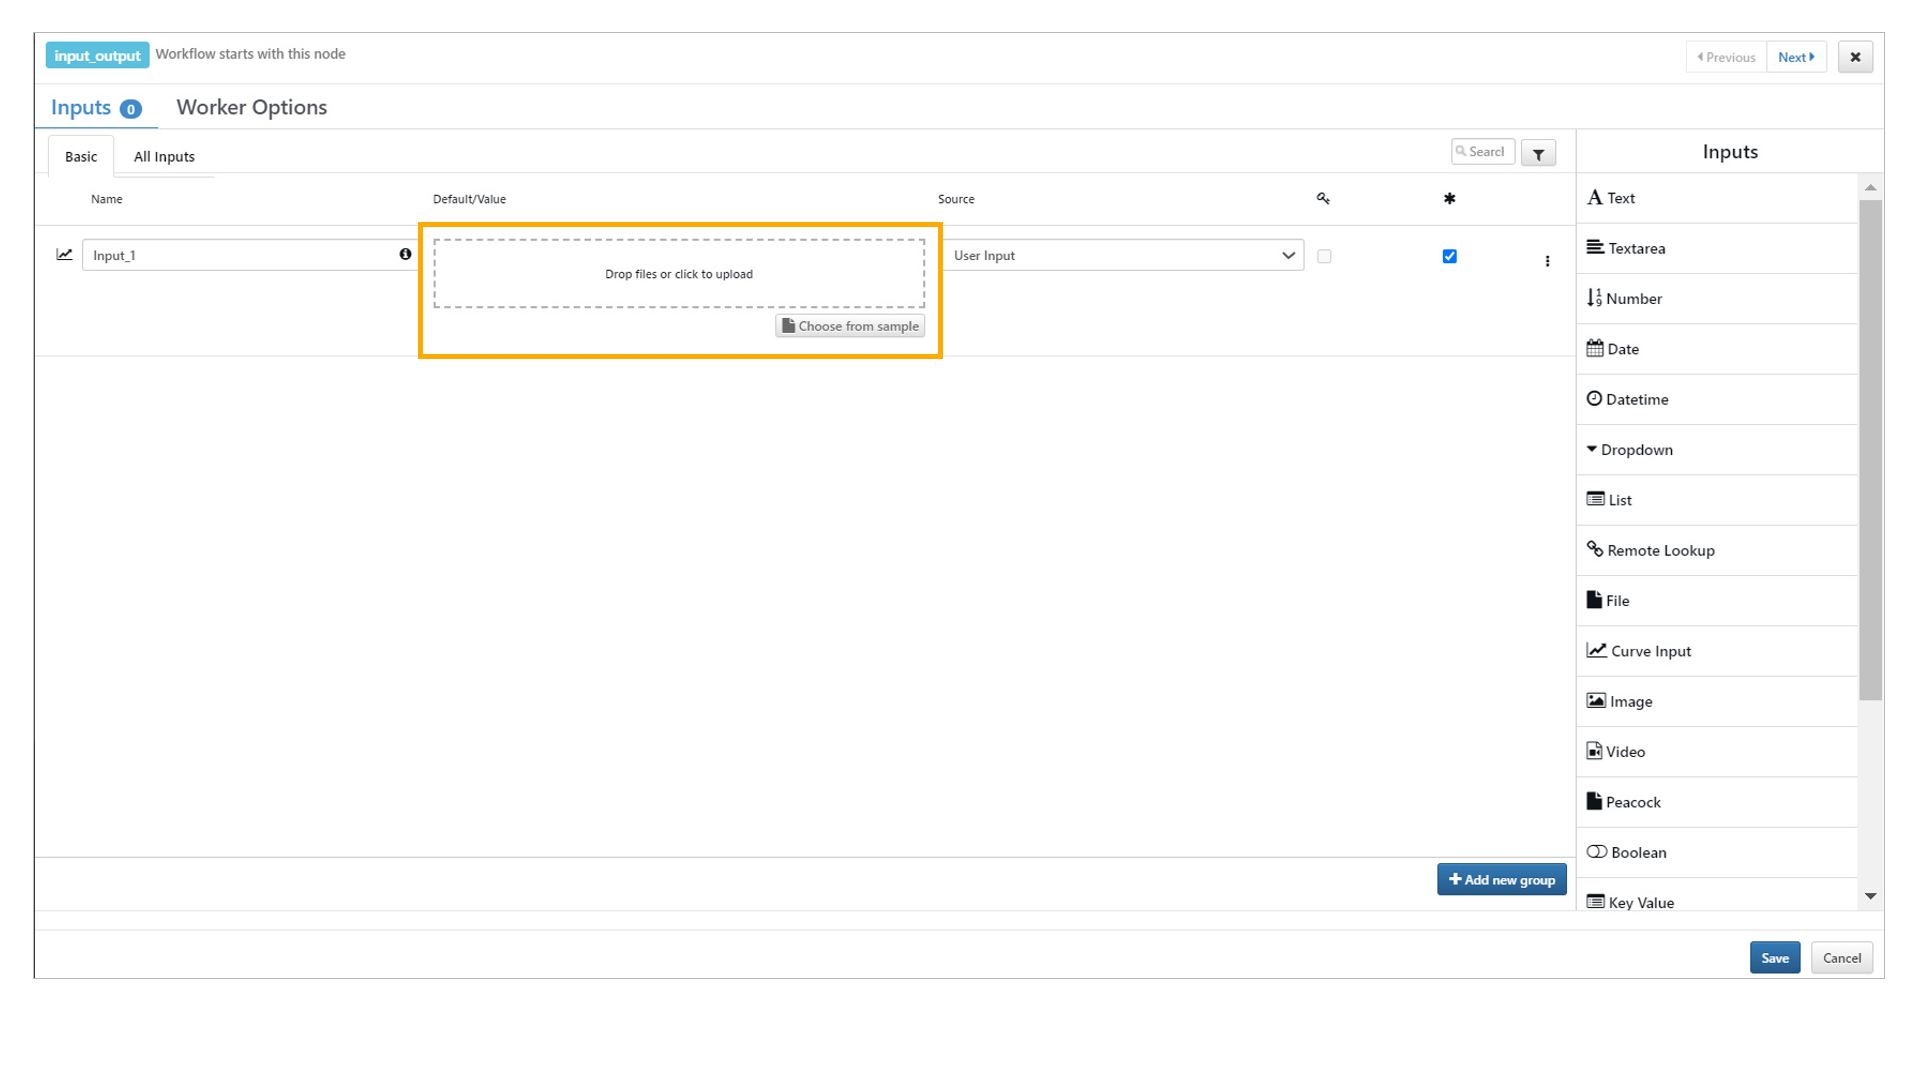
Step 1: Upload image in curve input field.
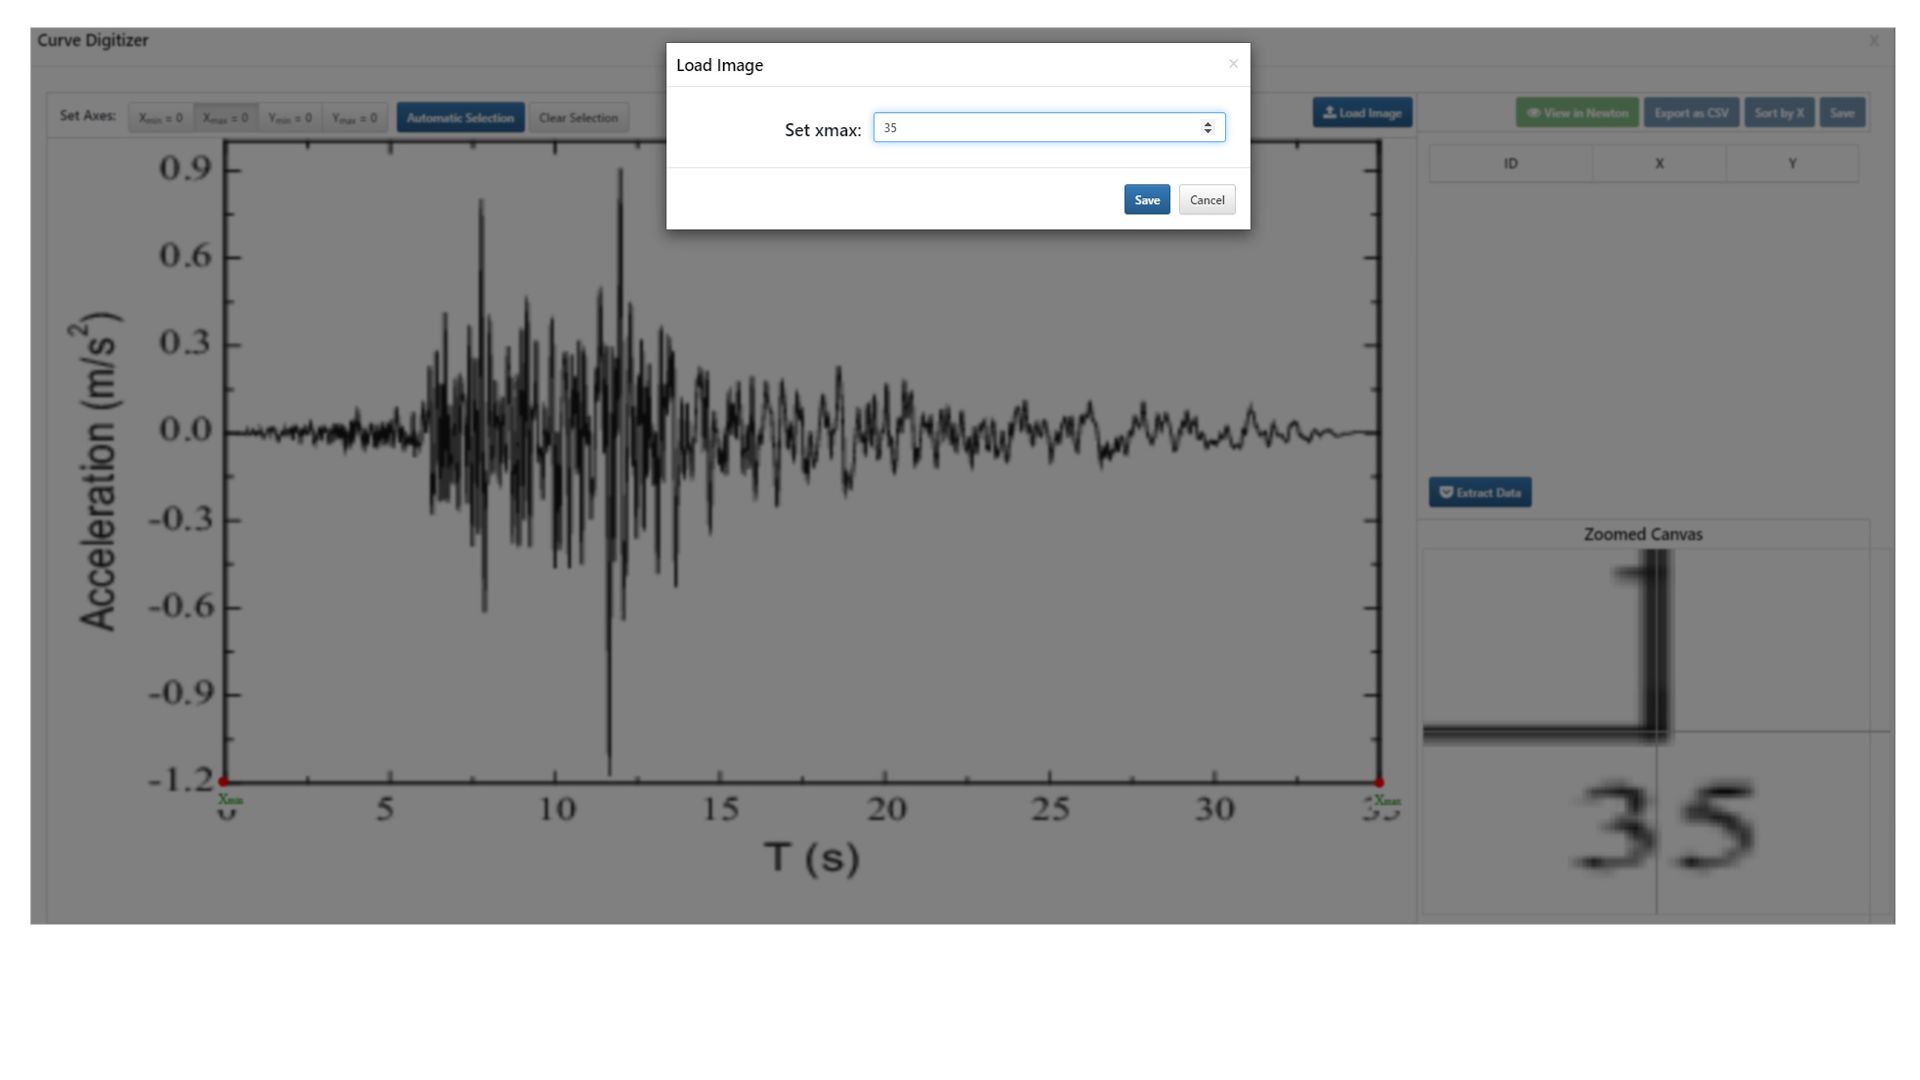
Step 2: Click on X min (1), pick the X min point on the curve (2) and enter the X min value (3).
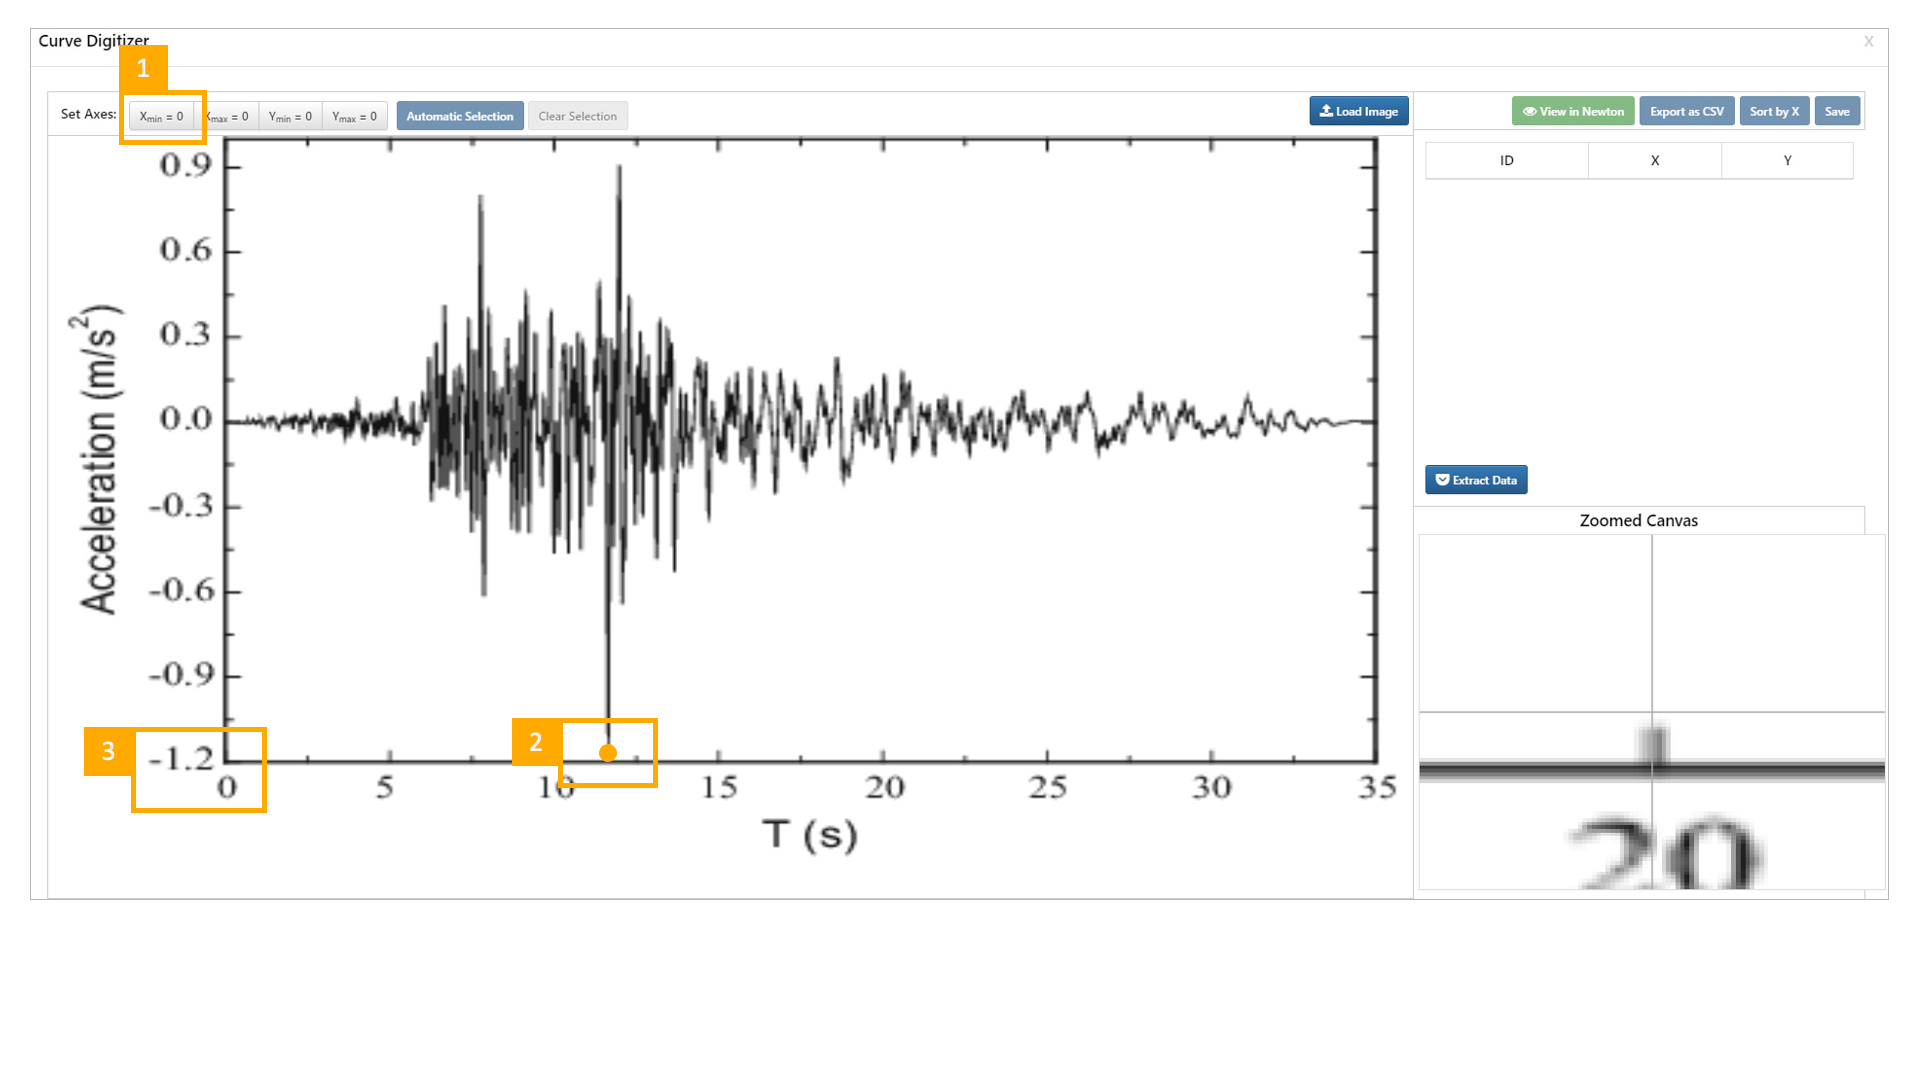
Step 3: Workflows will auto switch through X max, Y min and Y max.
Select points for each to assign values.
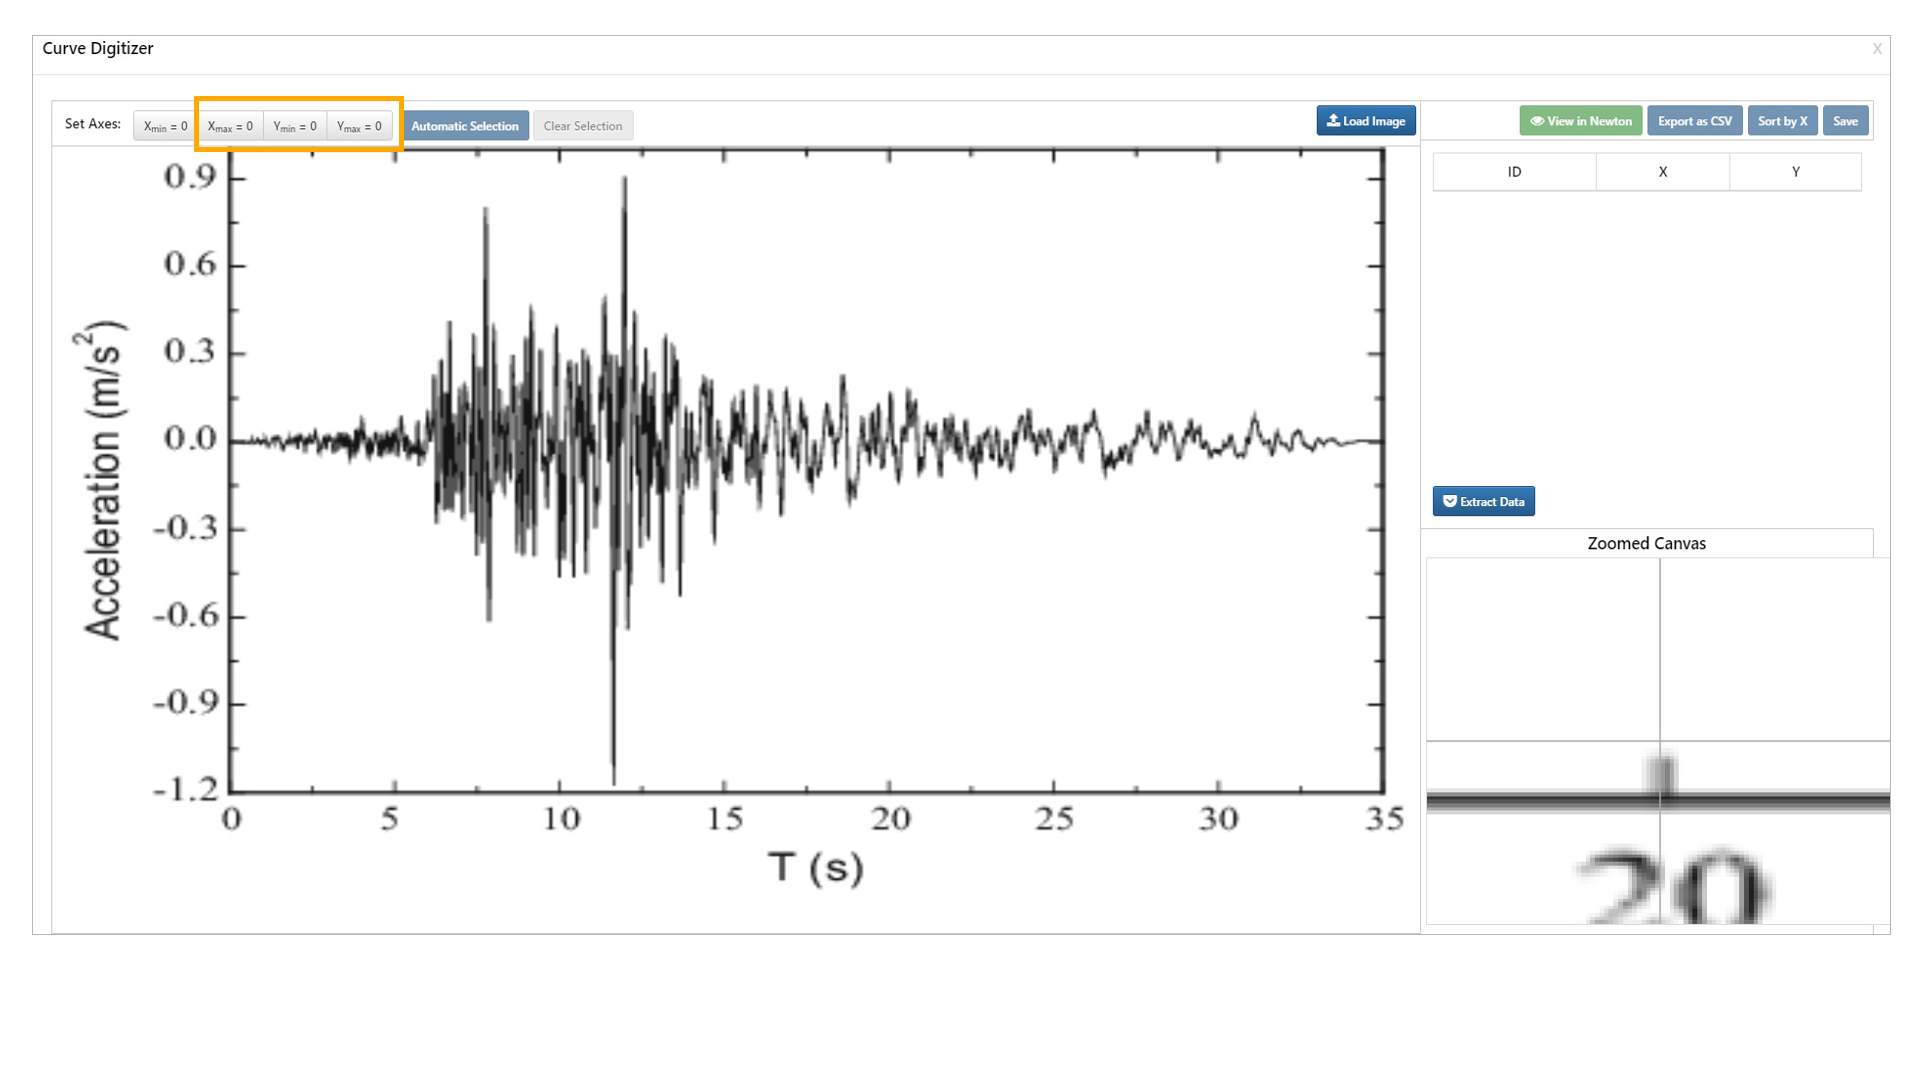
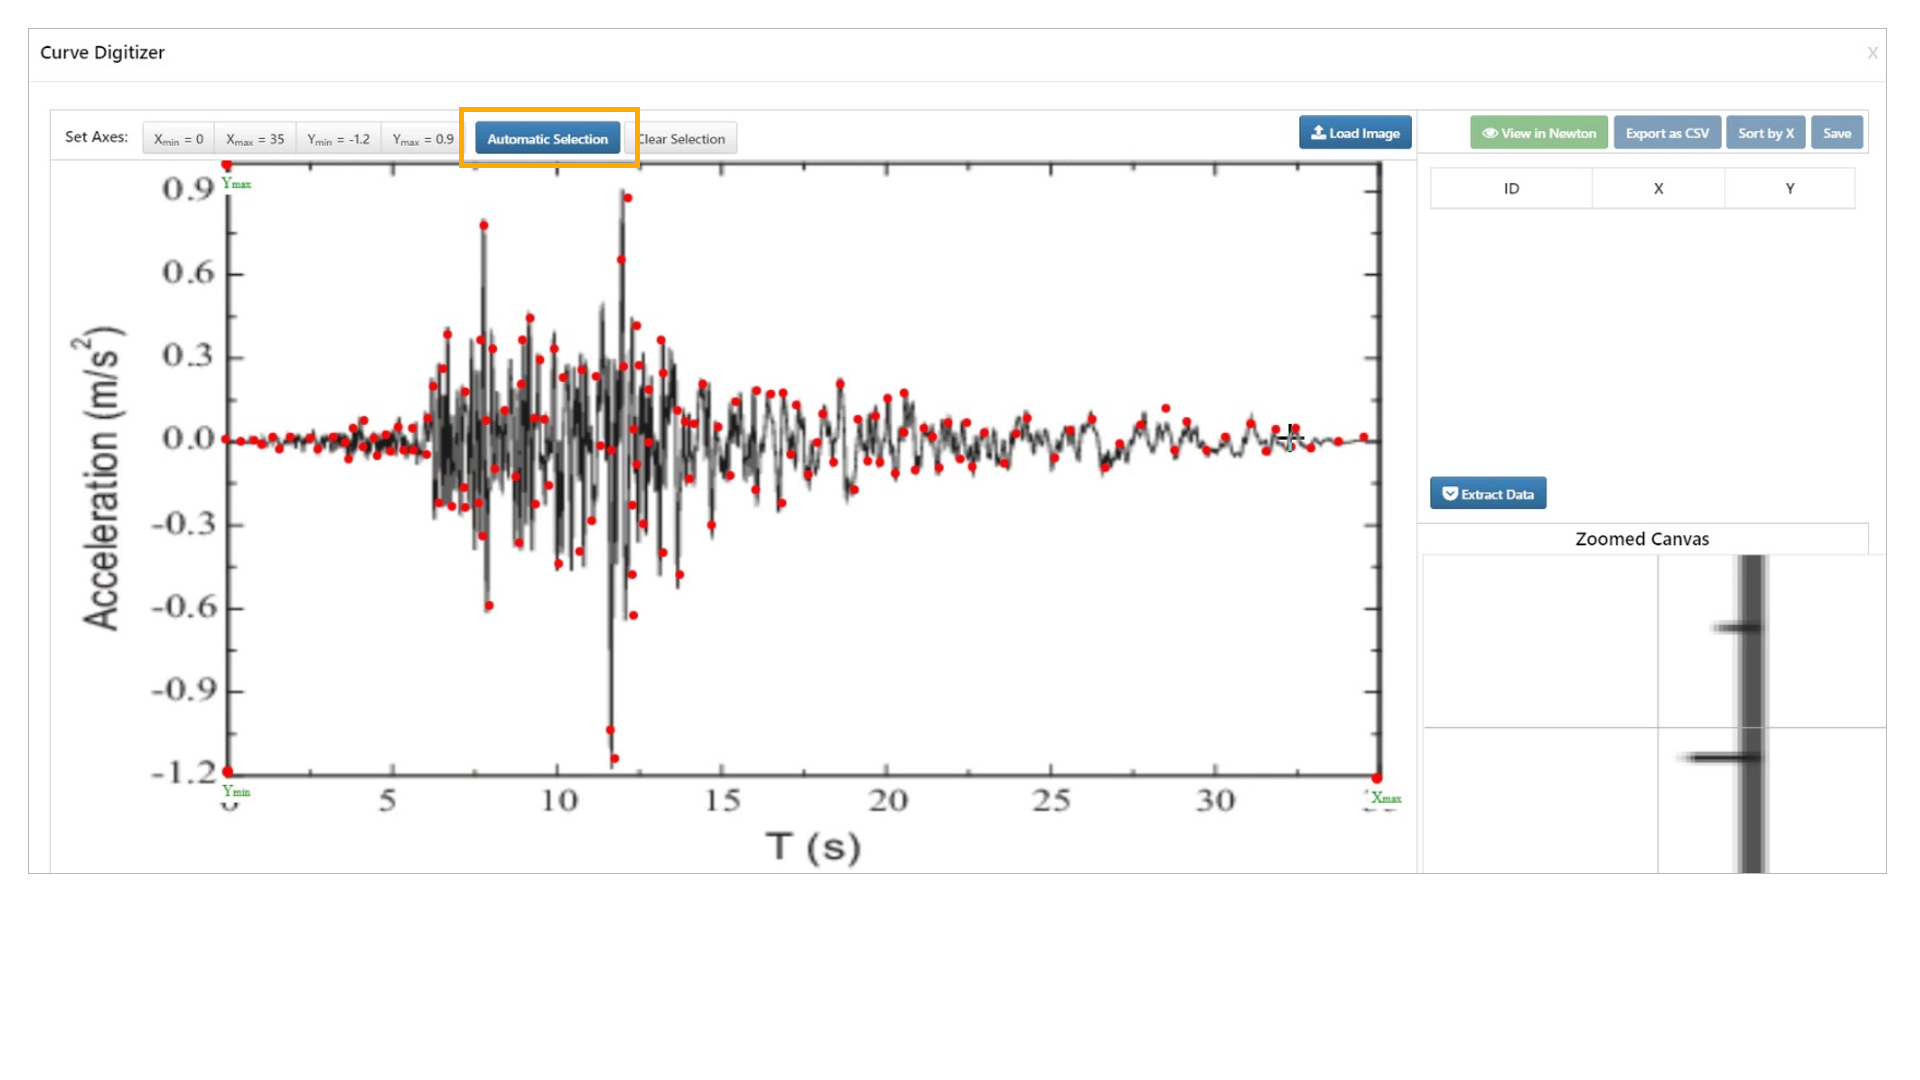
Step 4: Hit automatic selection or manual to select more points.
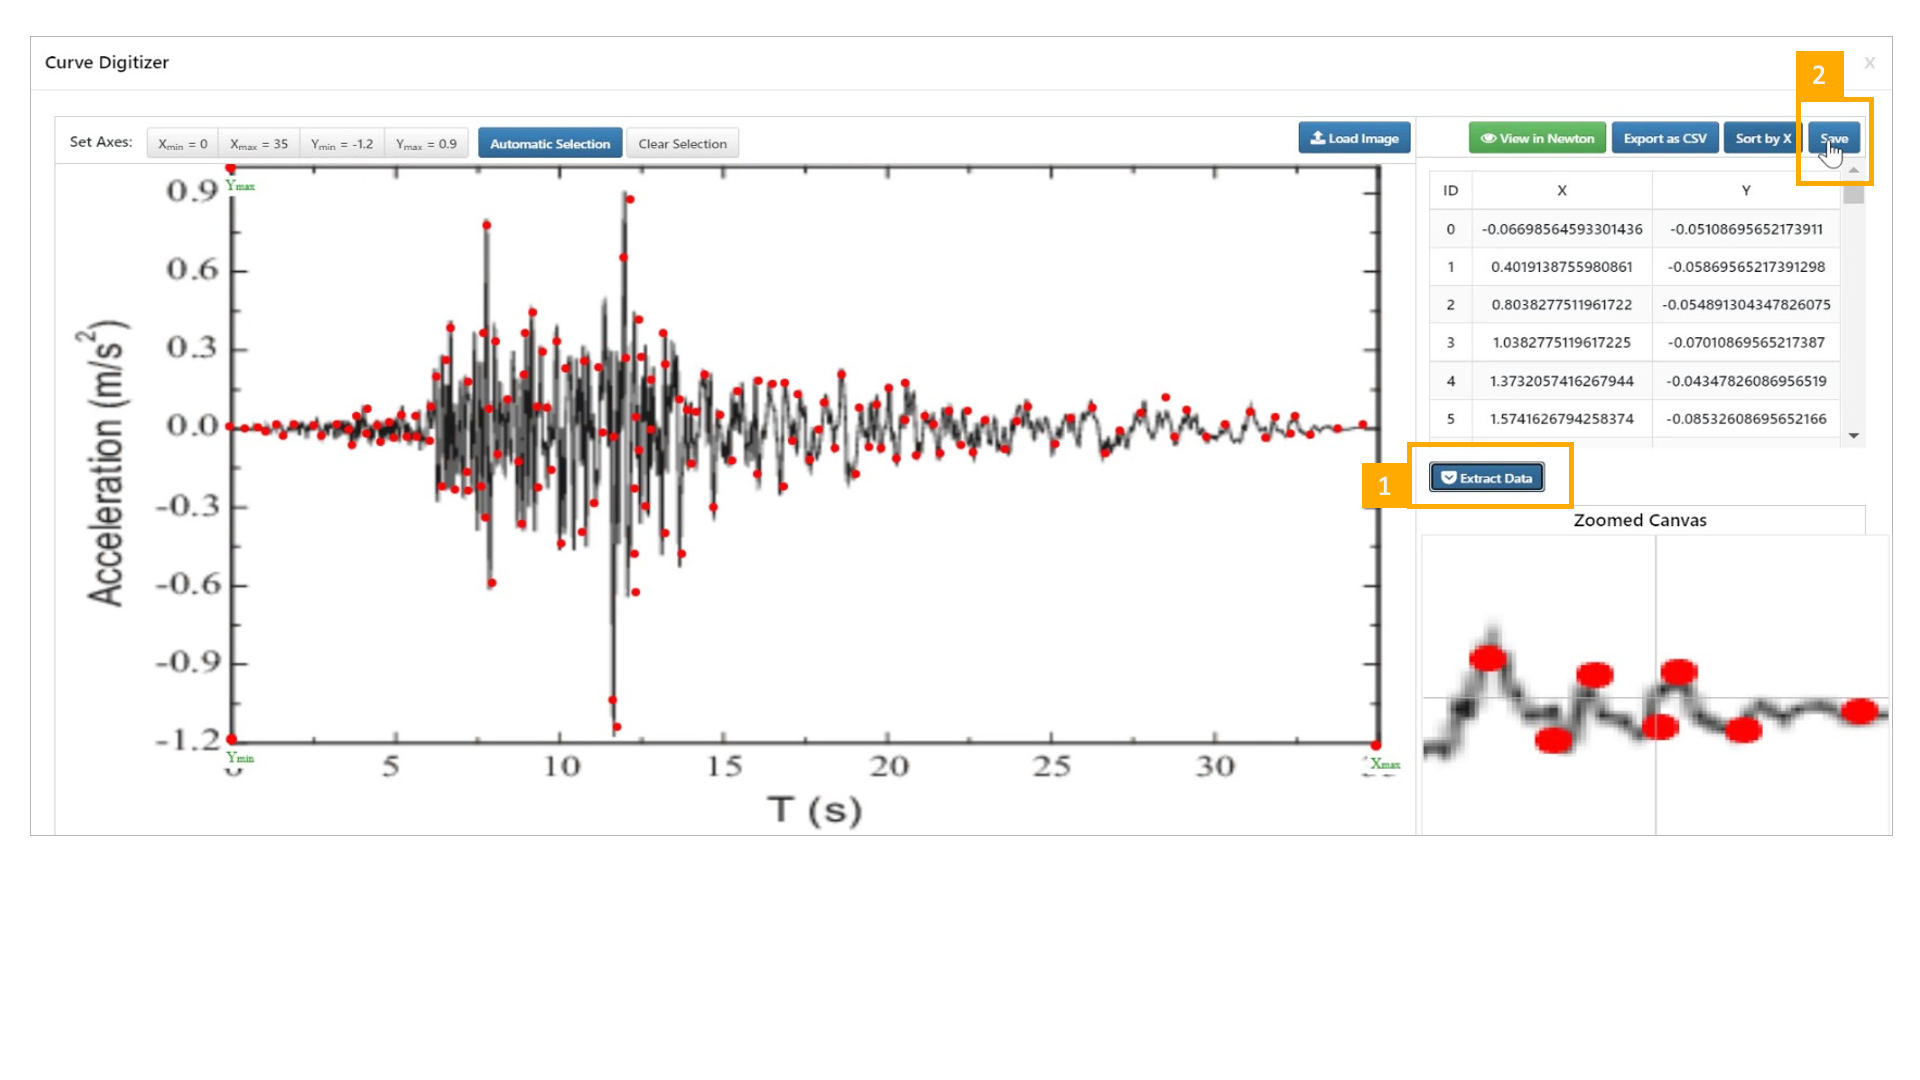
Step 5: Click on Extract Data (1) and Save (2).
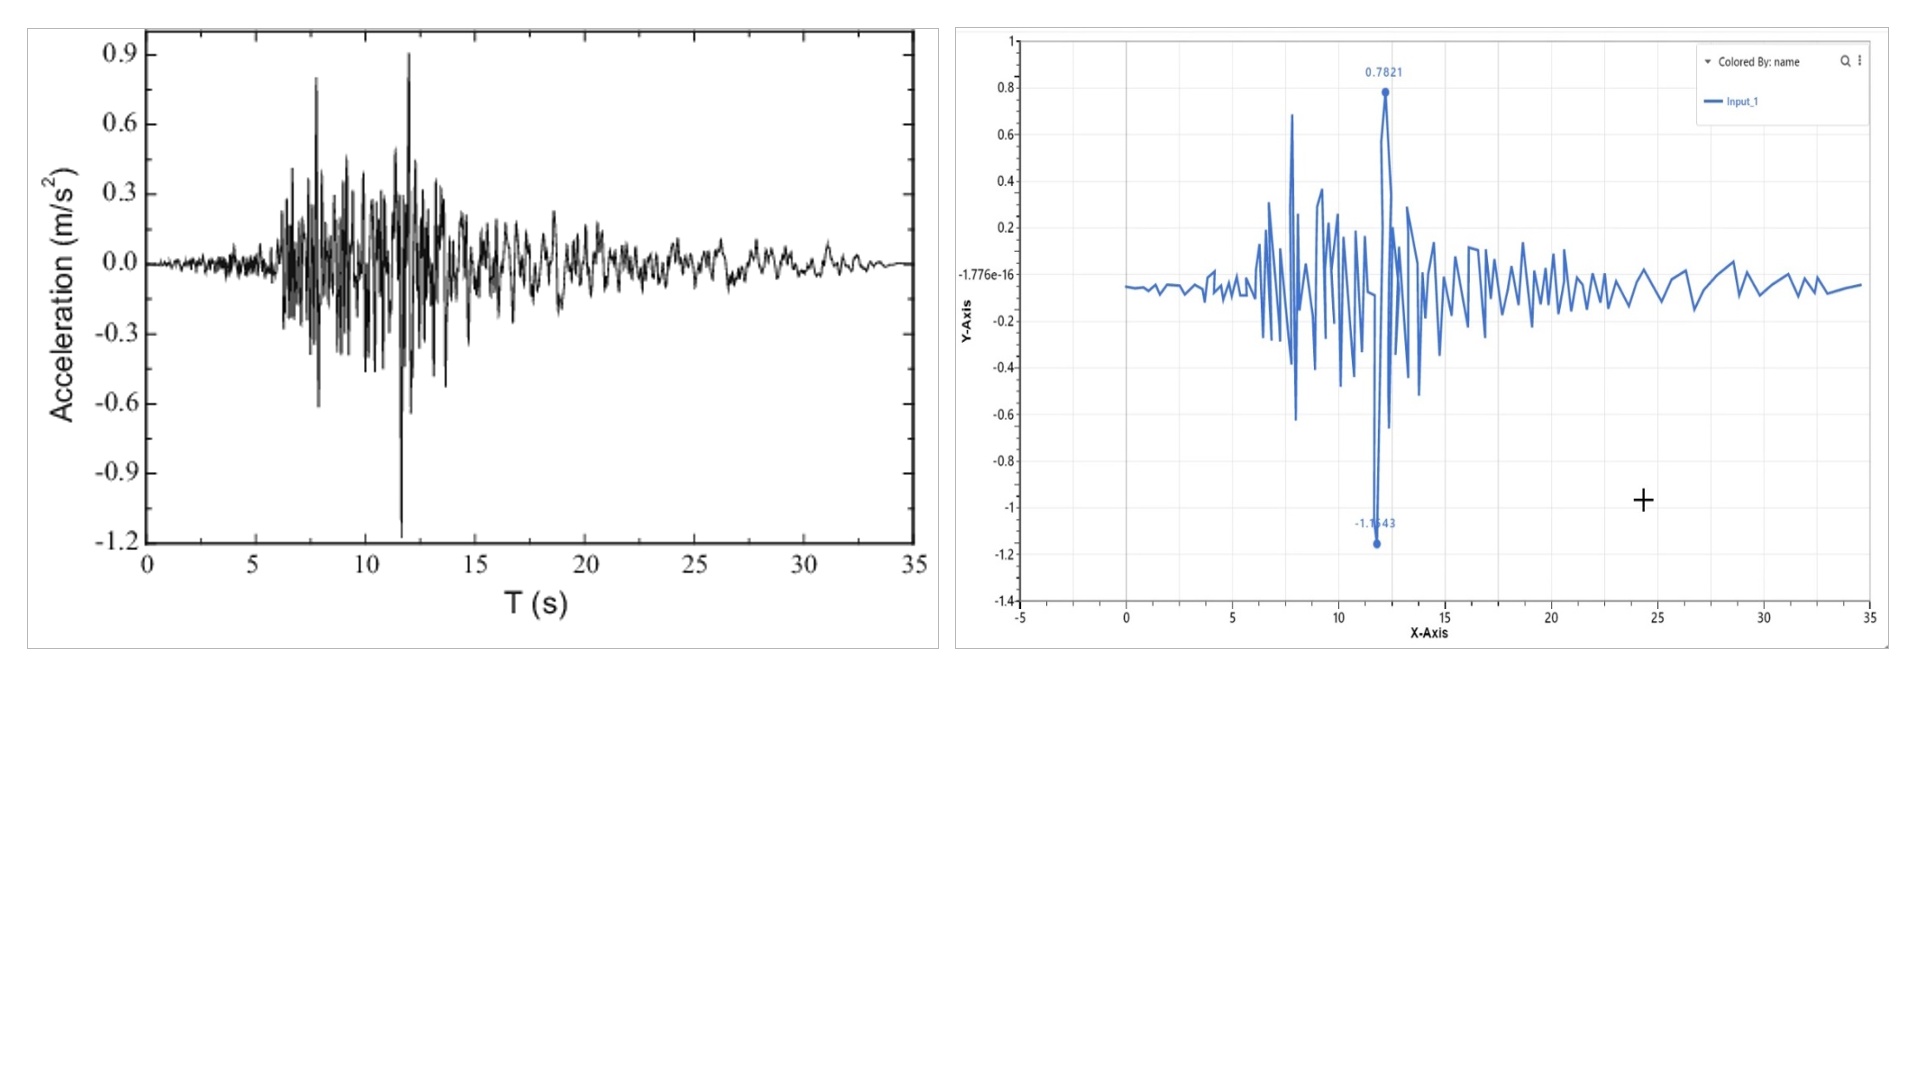
The following image shows the before and after digitization of the curve.
The following video shows the full process of digitizing the curve.