7.  Viewing Data
In this section, we’ll go over the ways we can view results and data after execution of our workflow.
7.1. Worker Results
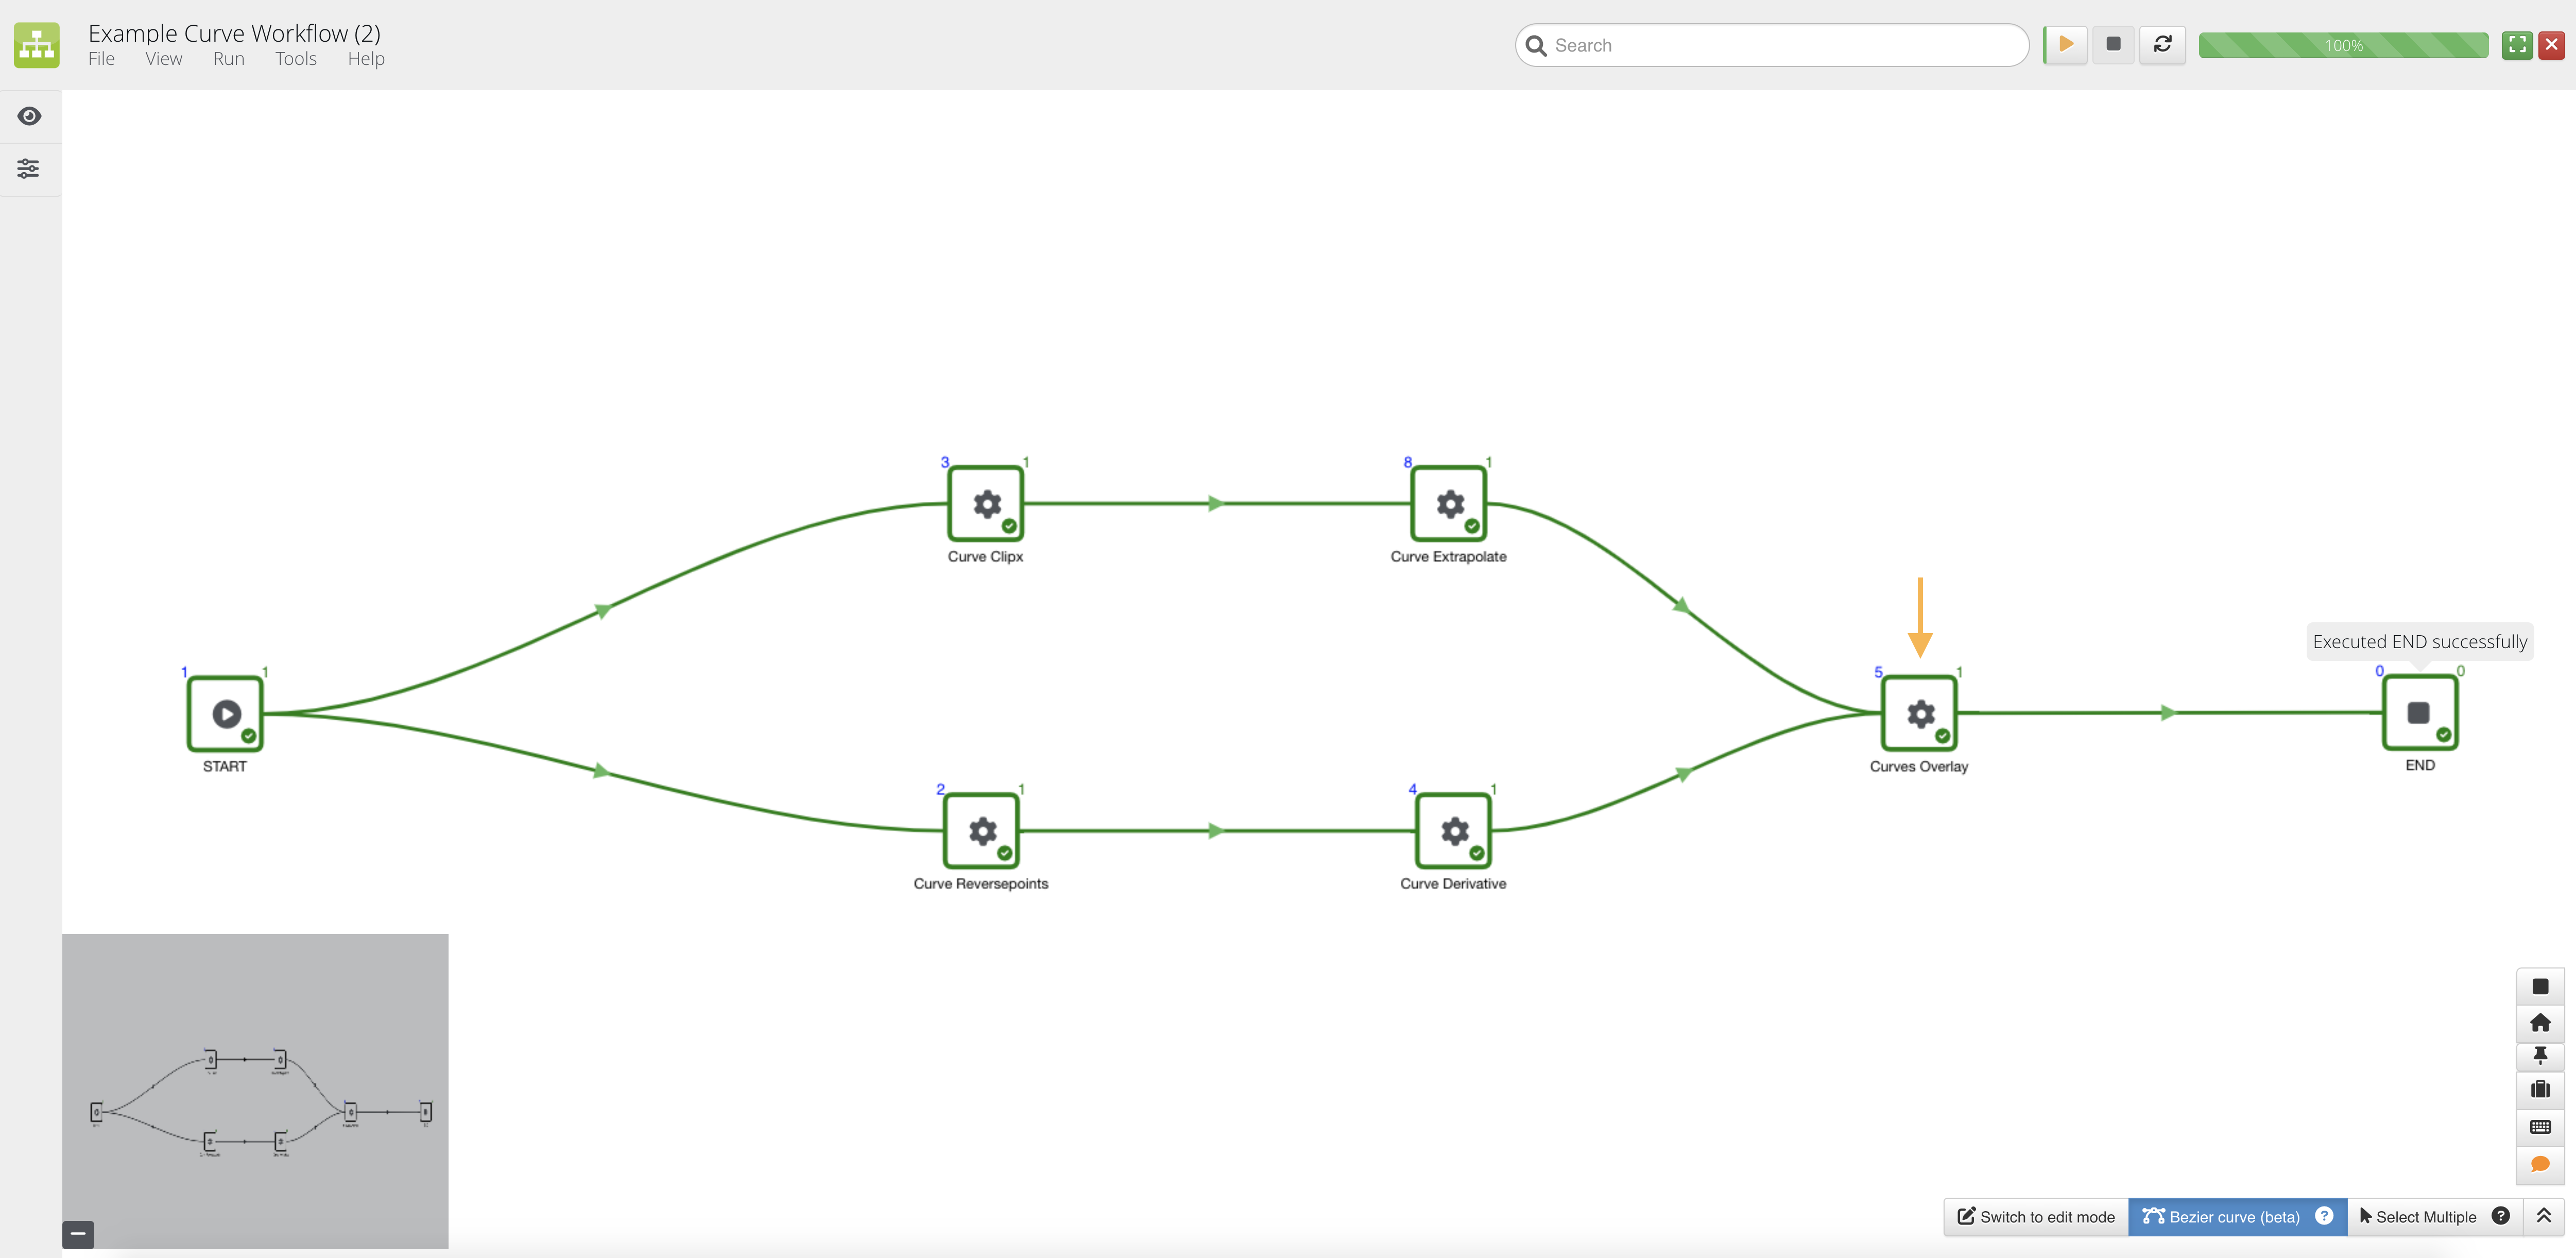
We can view results for individual workers by clicking on them in run mode.
Click on Worker
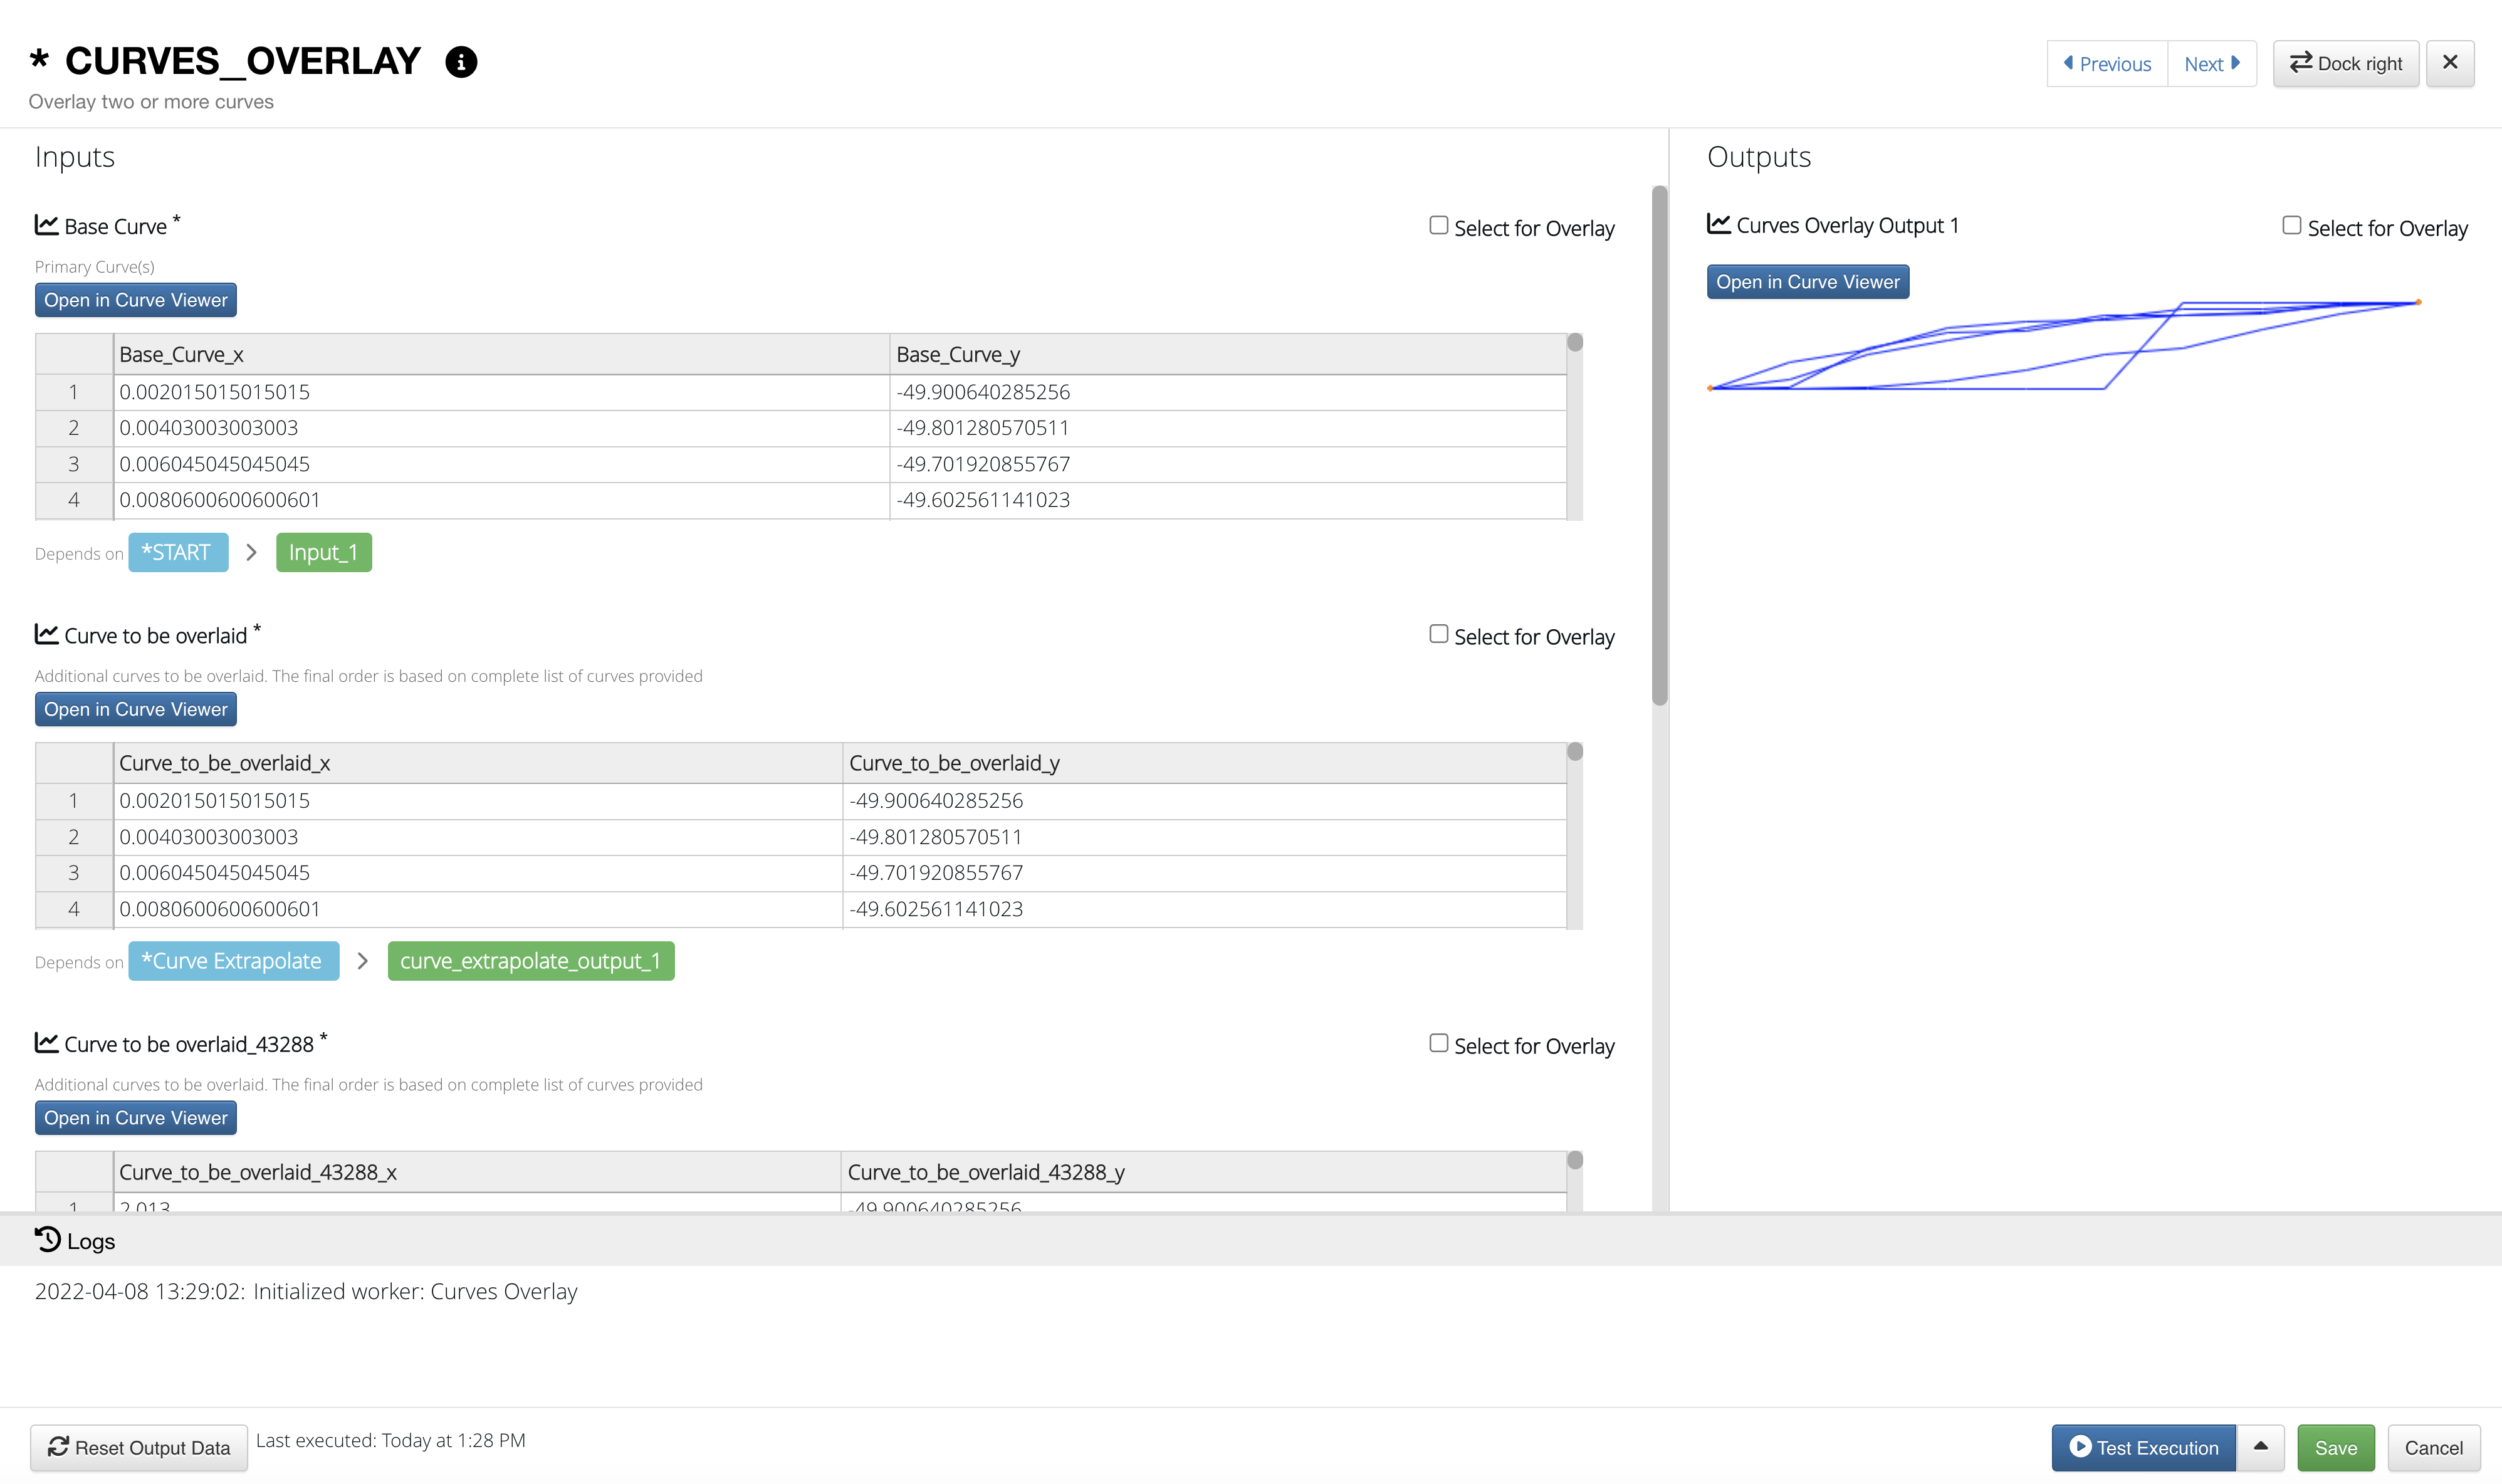
Here, we are reviewing the Curves Overlay worker inputs and outputs from the execution. Click on any of the View Buttons to see the data results.
Curves Overlay Execution Overview
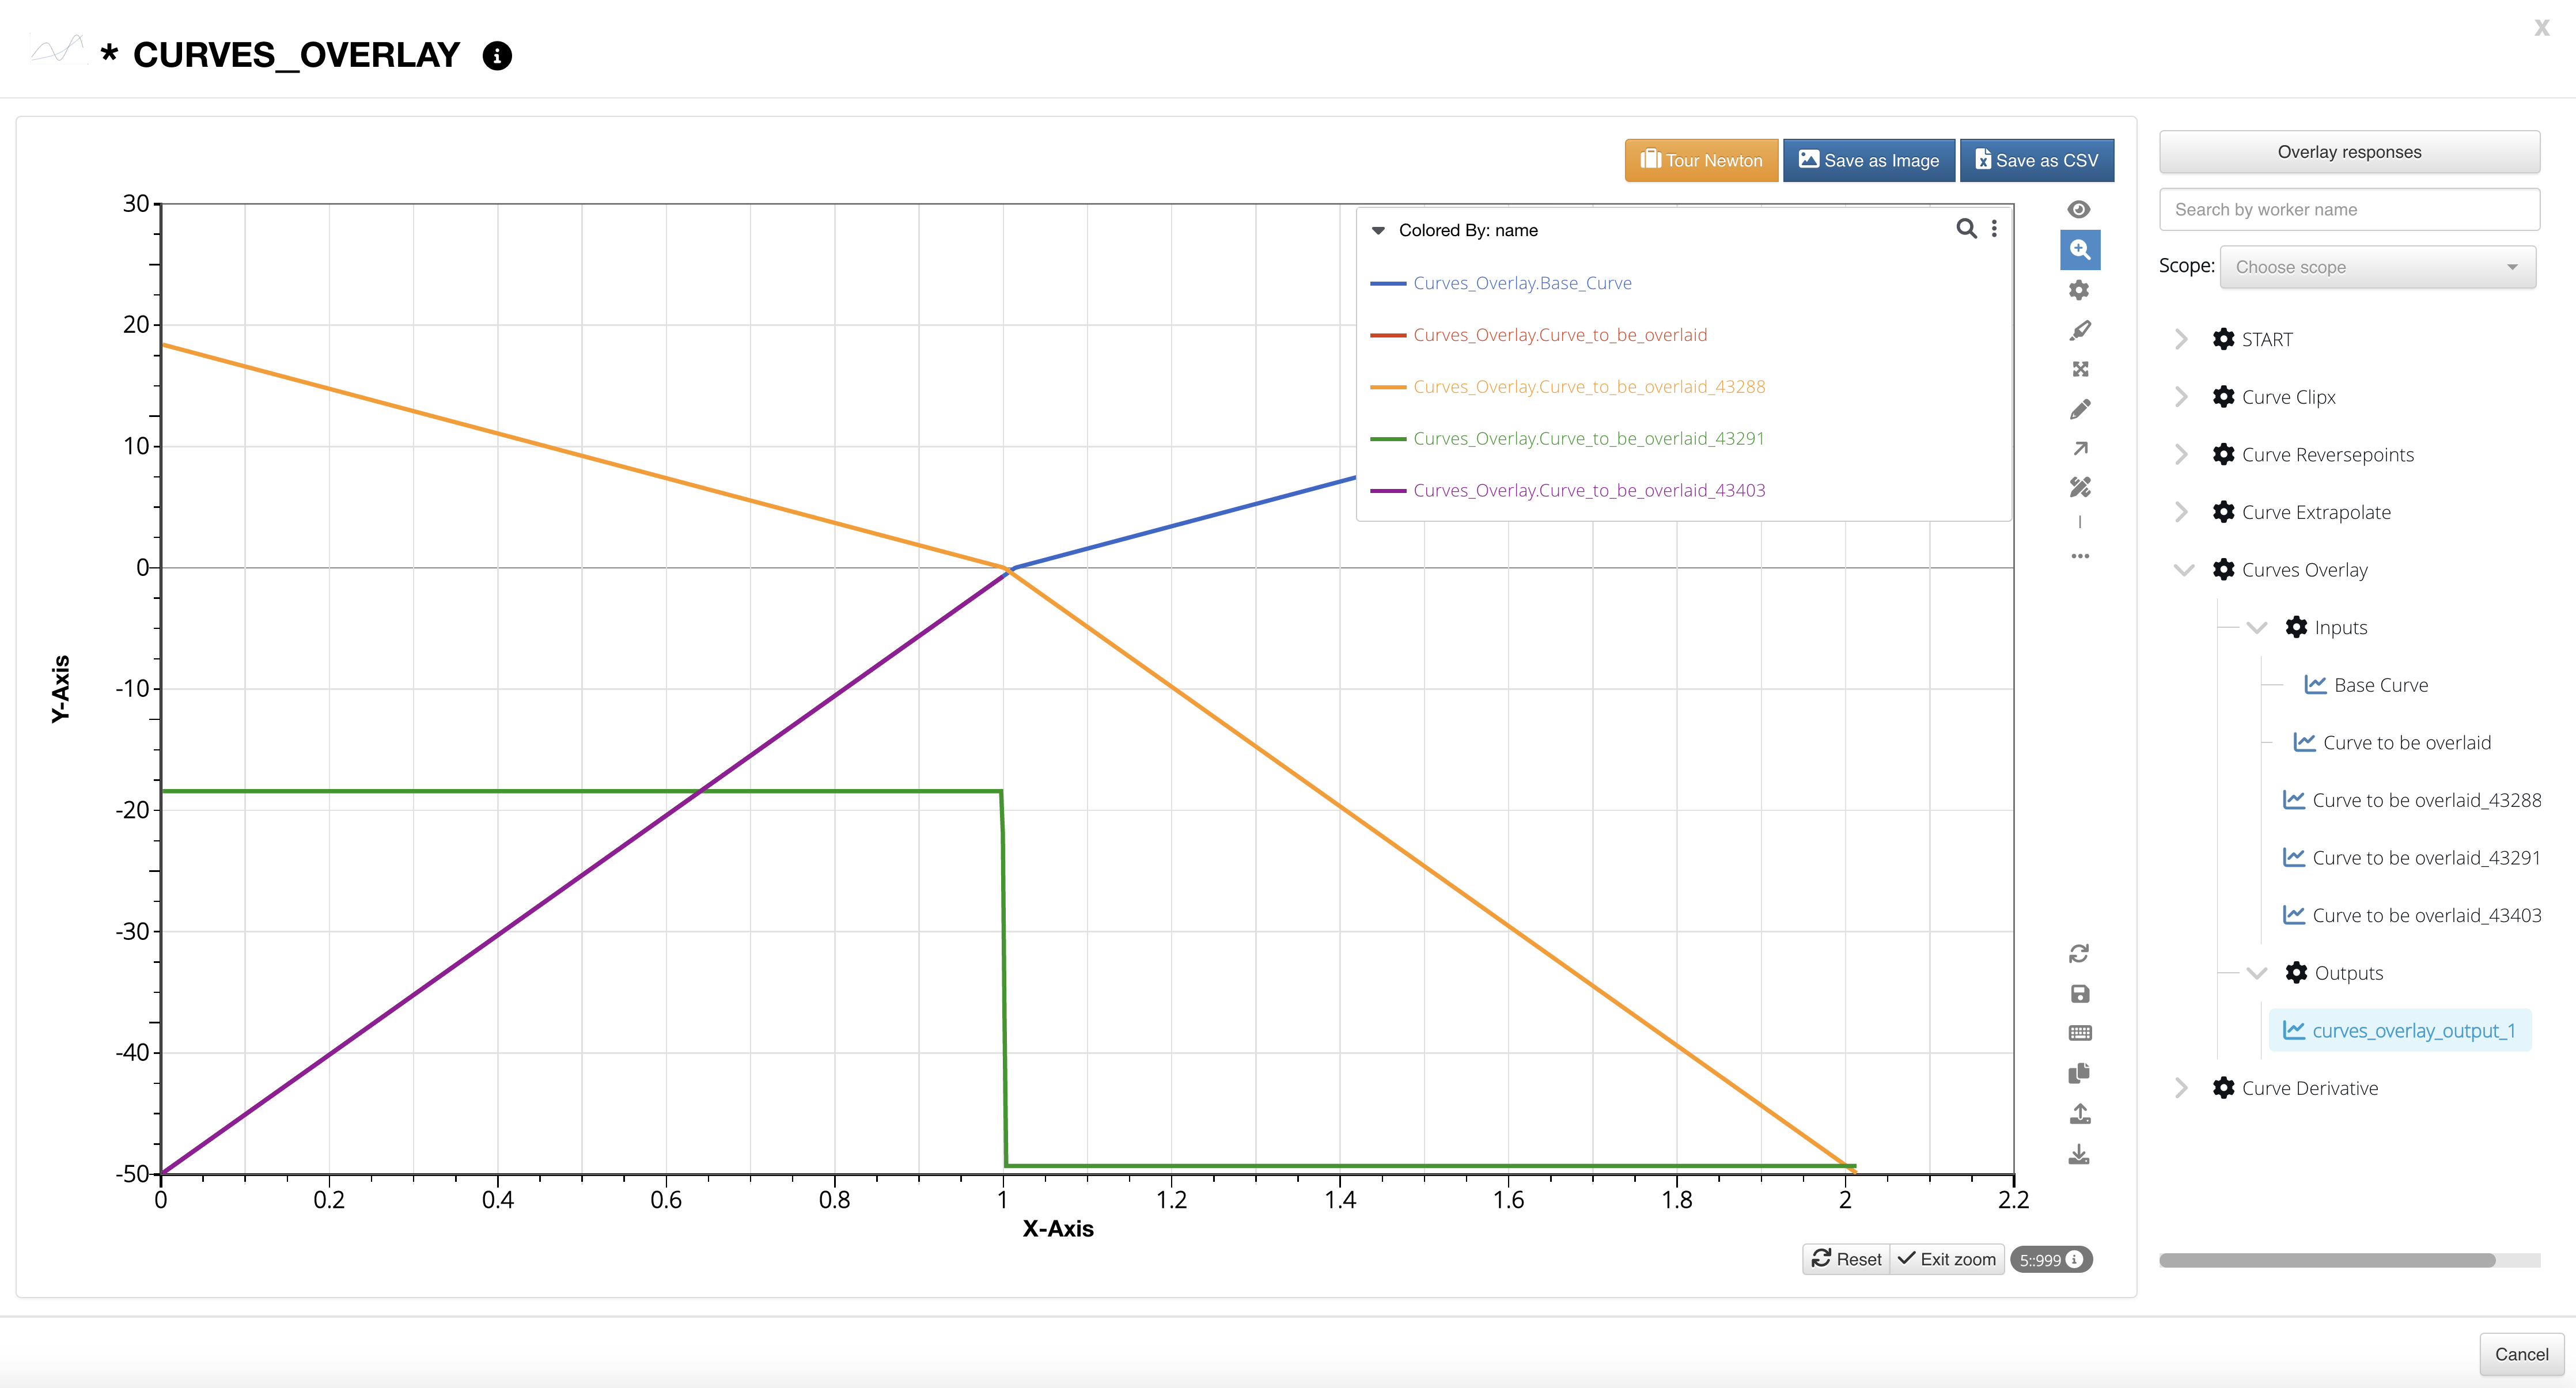
We’re looking at Curves Overlay output in the Curve Results Viewer.
Curves Overlay Output Results
7.2. Viewer Results
Under the eye icon in the left-side menu, we can view all data inputed and extracted from our execution. For example, we can view all curves which includes all input and output curves.
Viewers: View All Curves
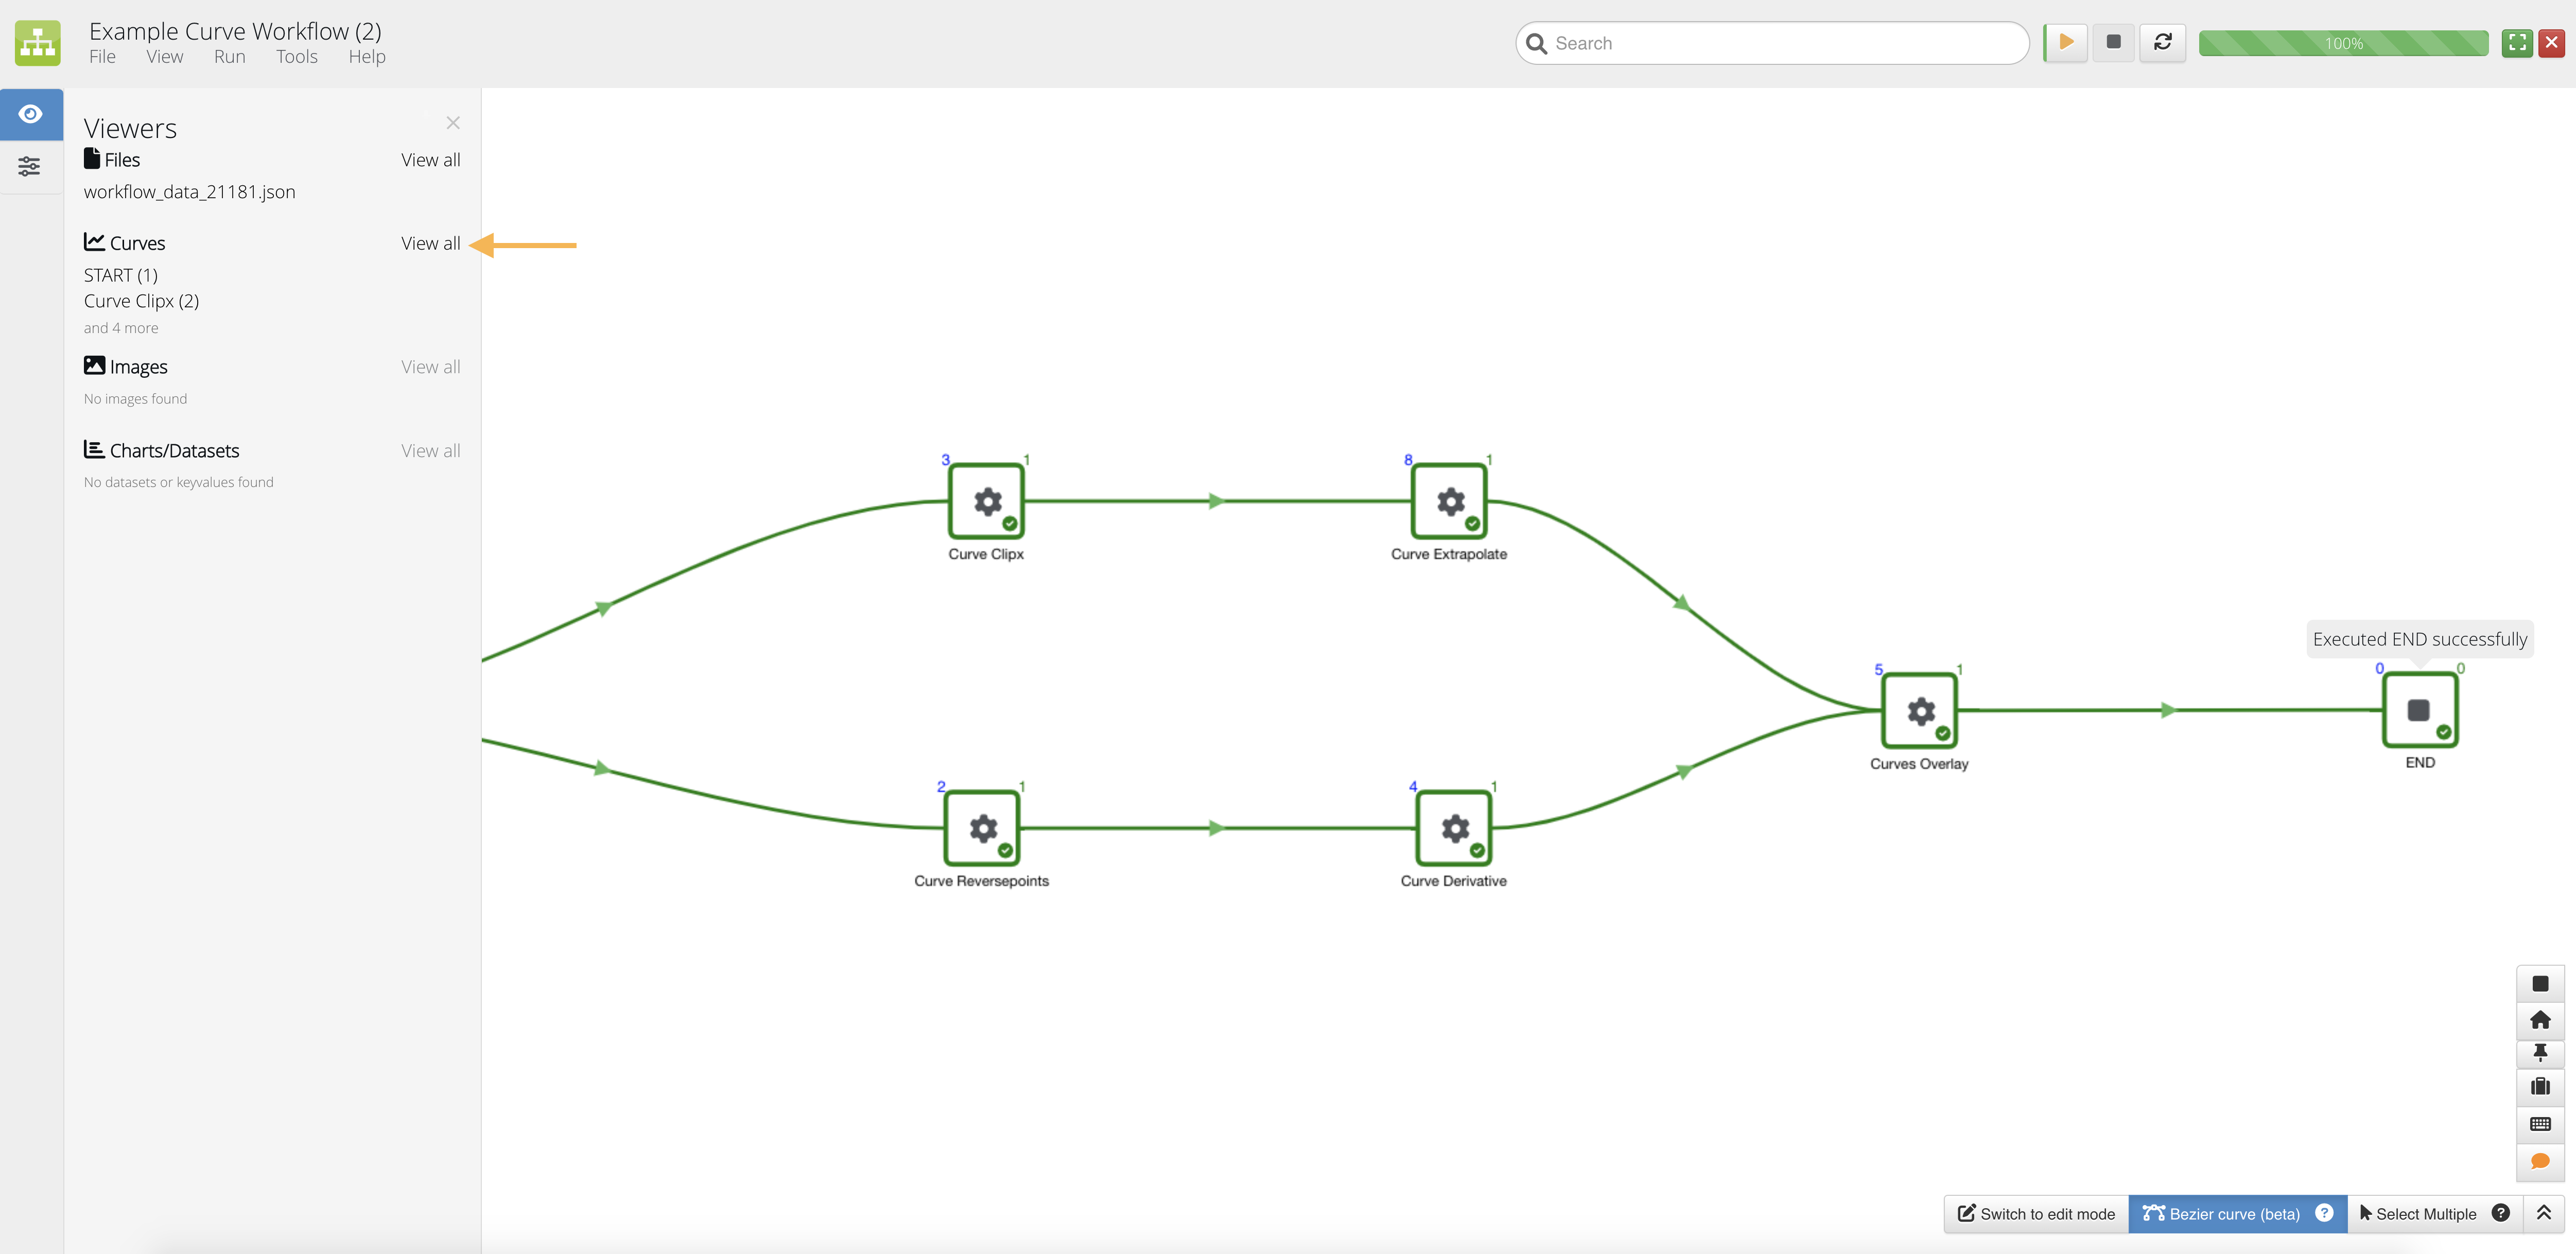
Here, we can use the right side-panel to navigated through all the curves in our workflow.
View All Curves
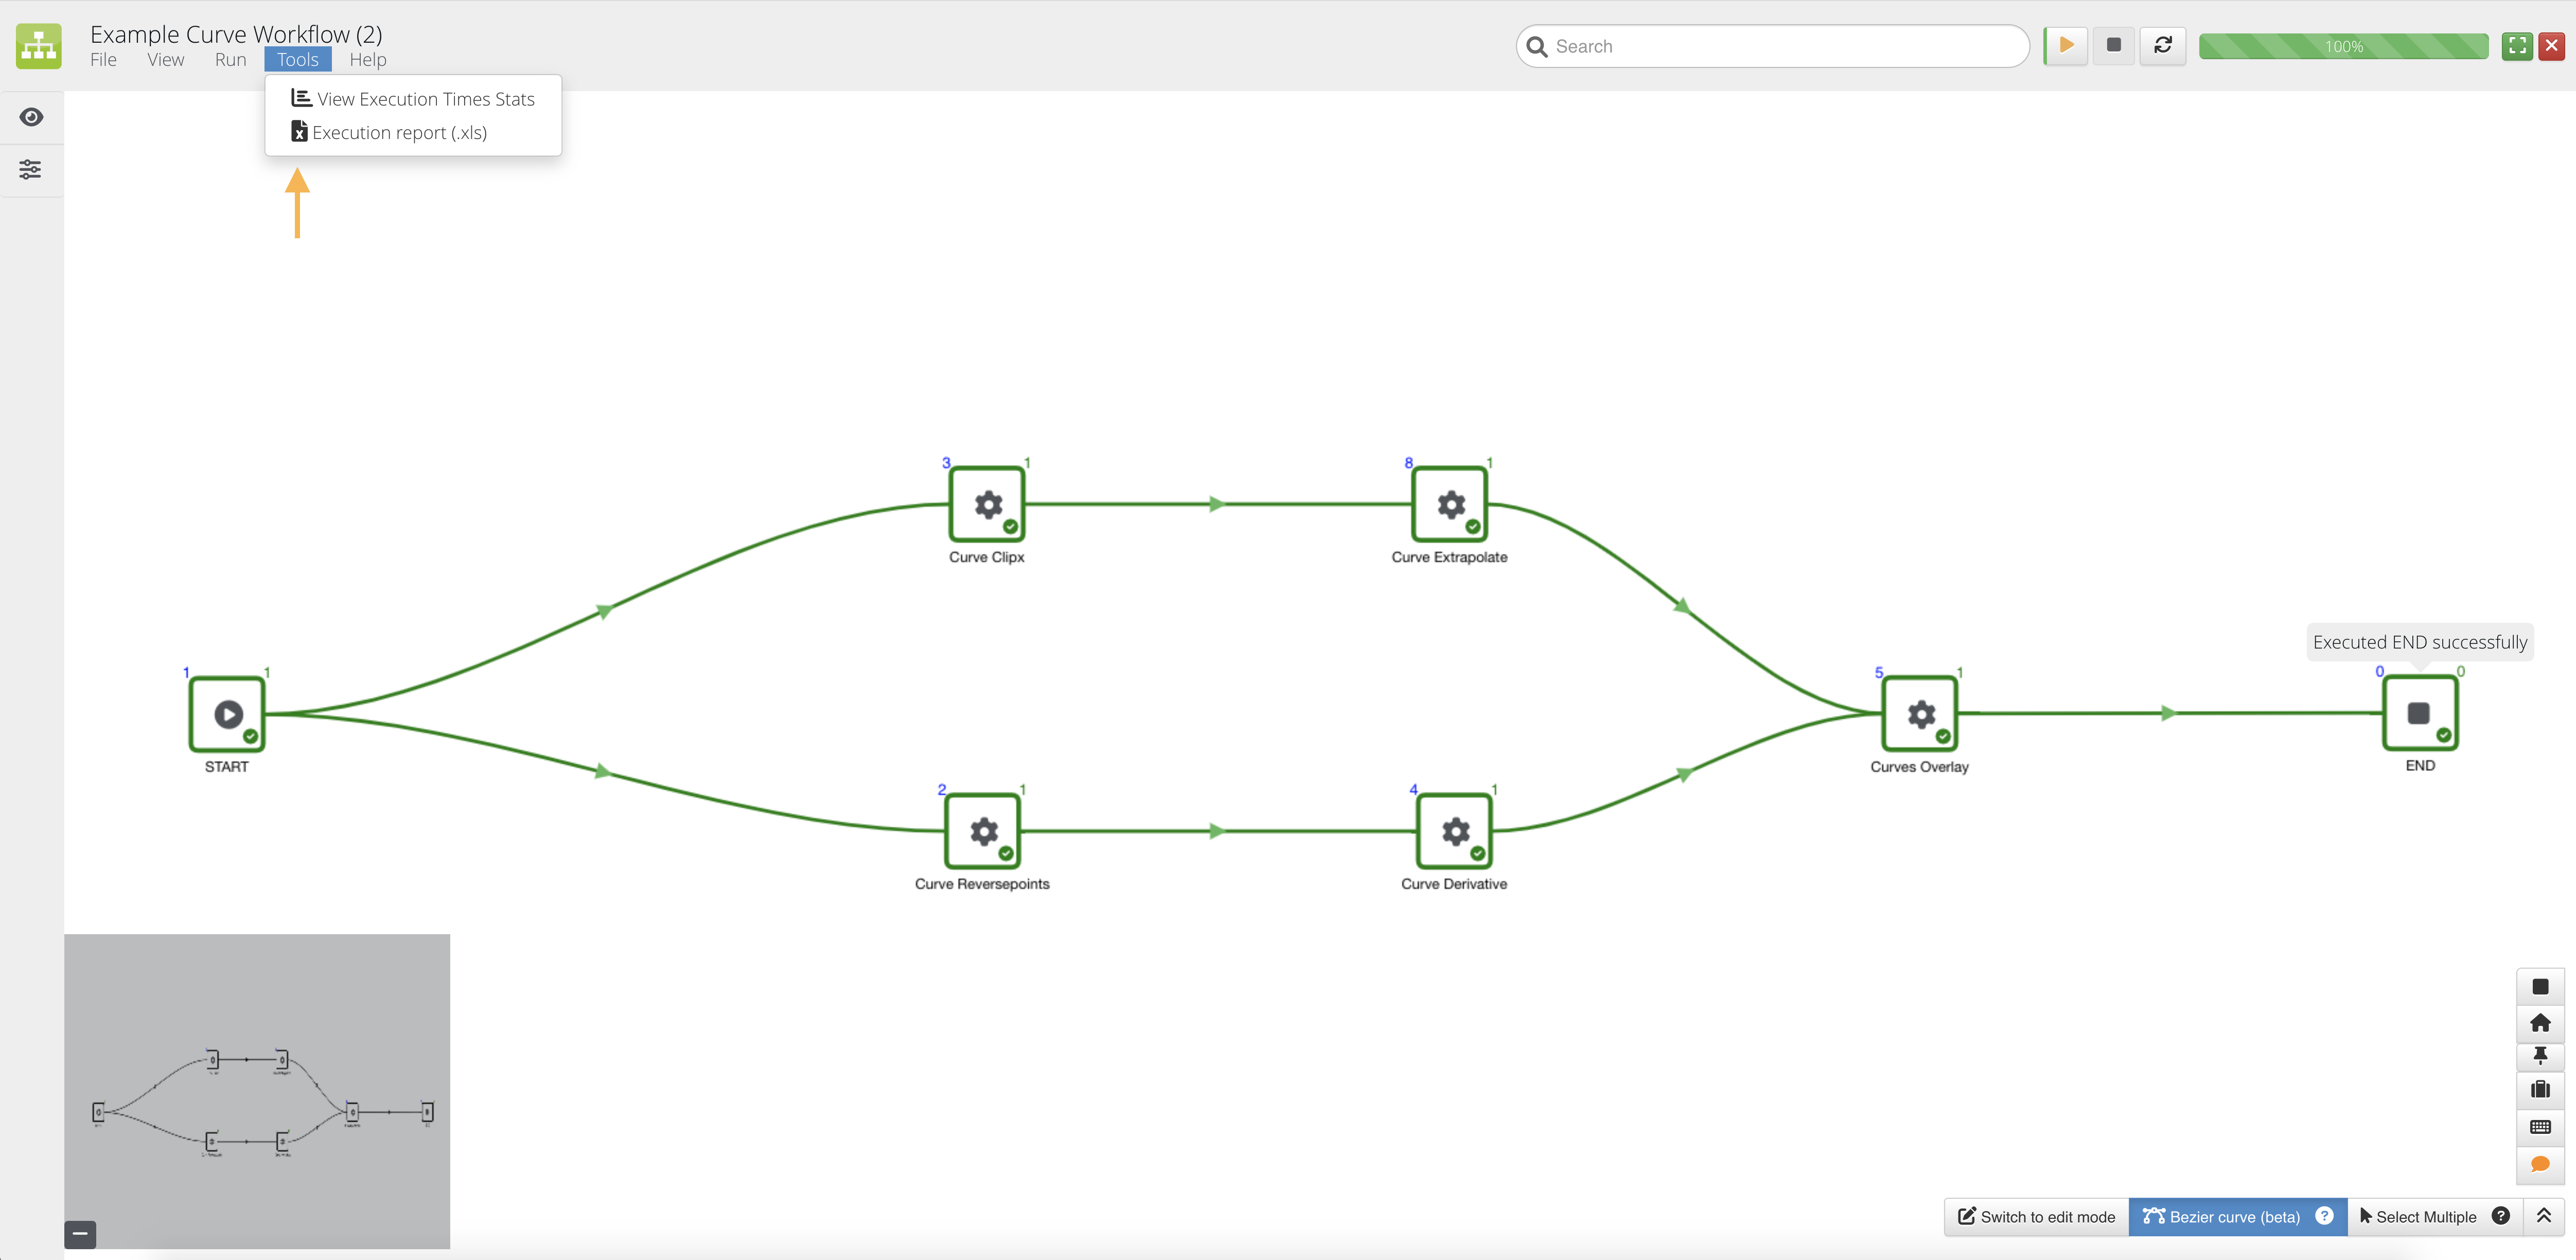
7.3. Execution Tools
Under the tools menu, we can view the execution time statistics and download the report.
Execution Tools
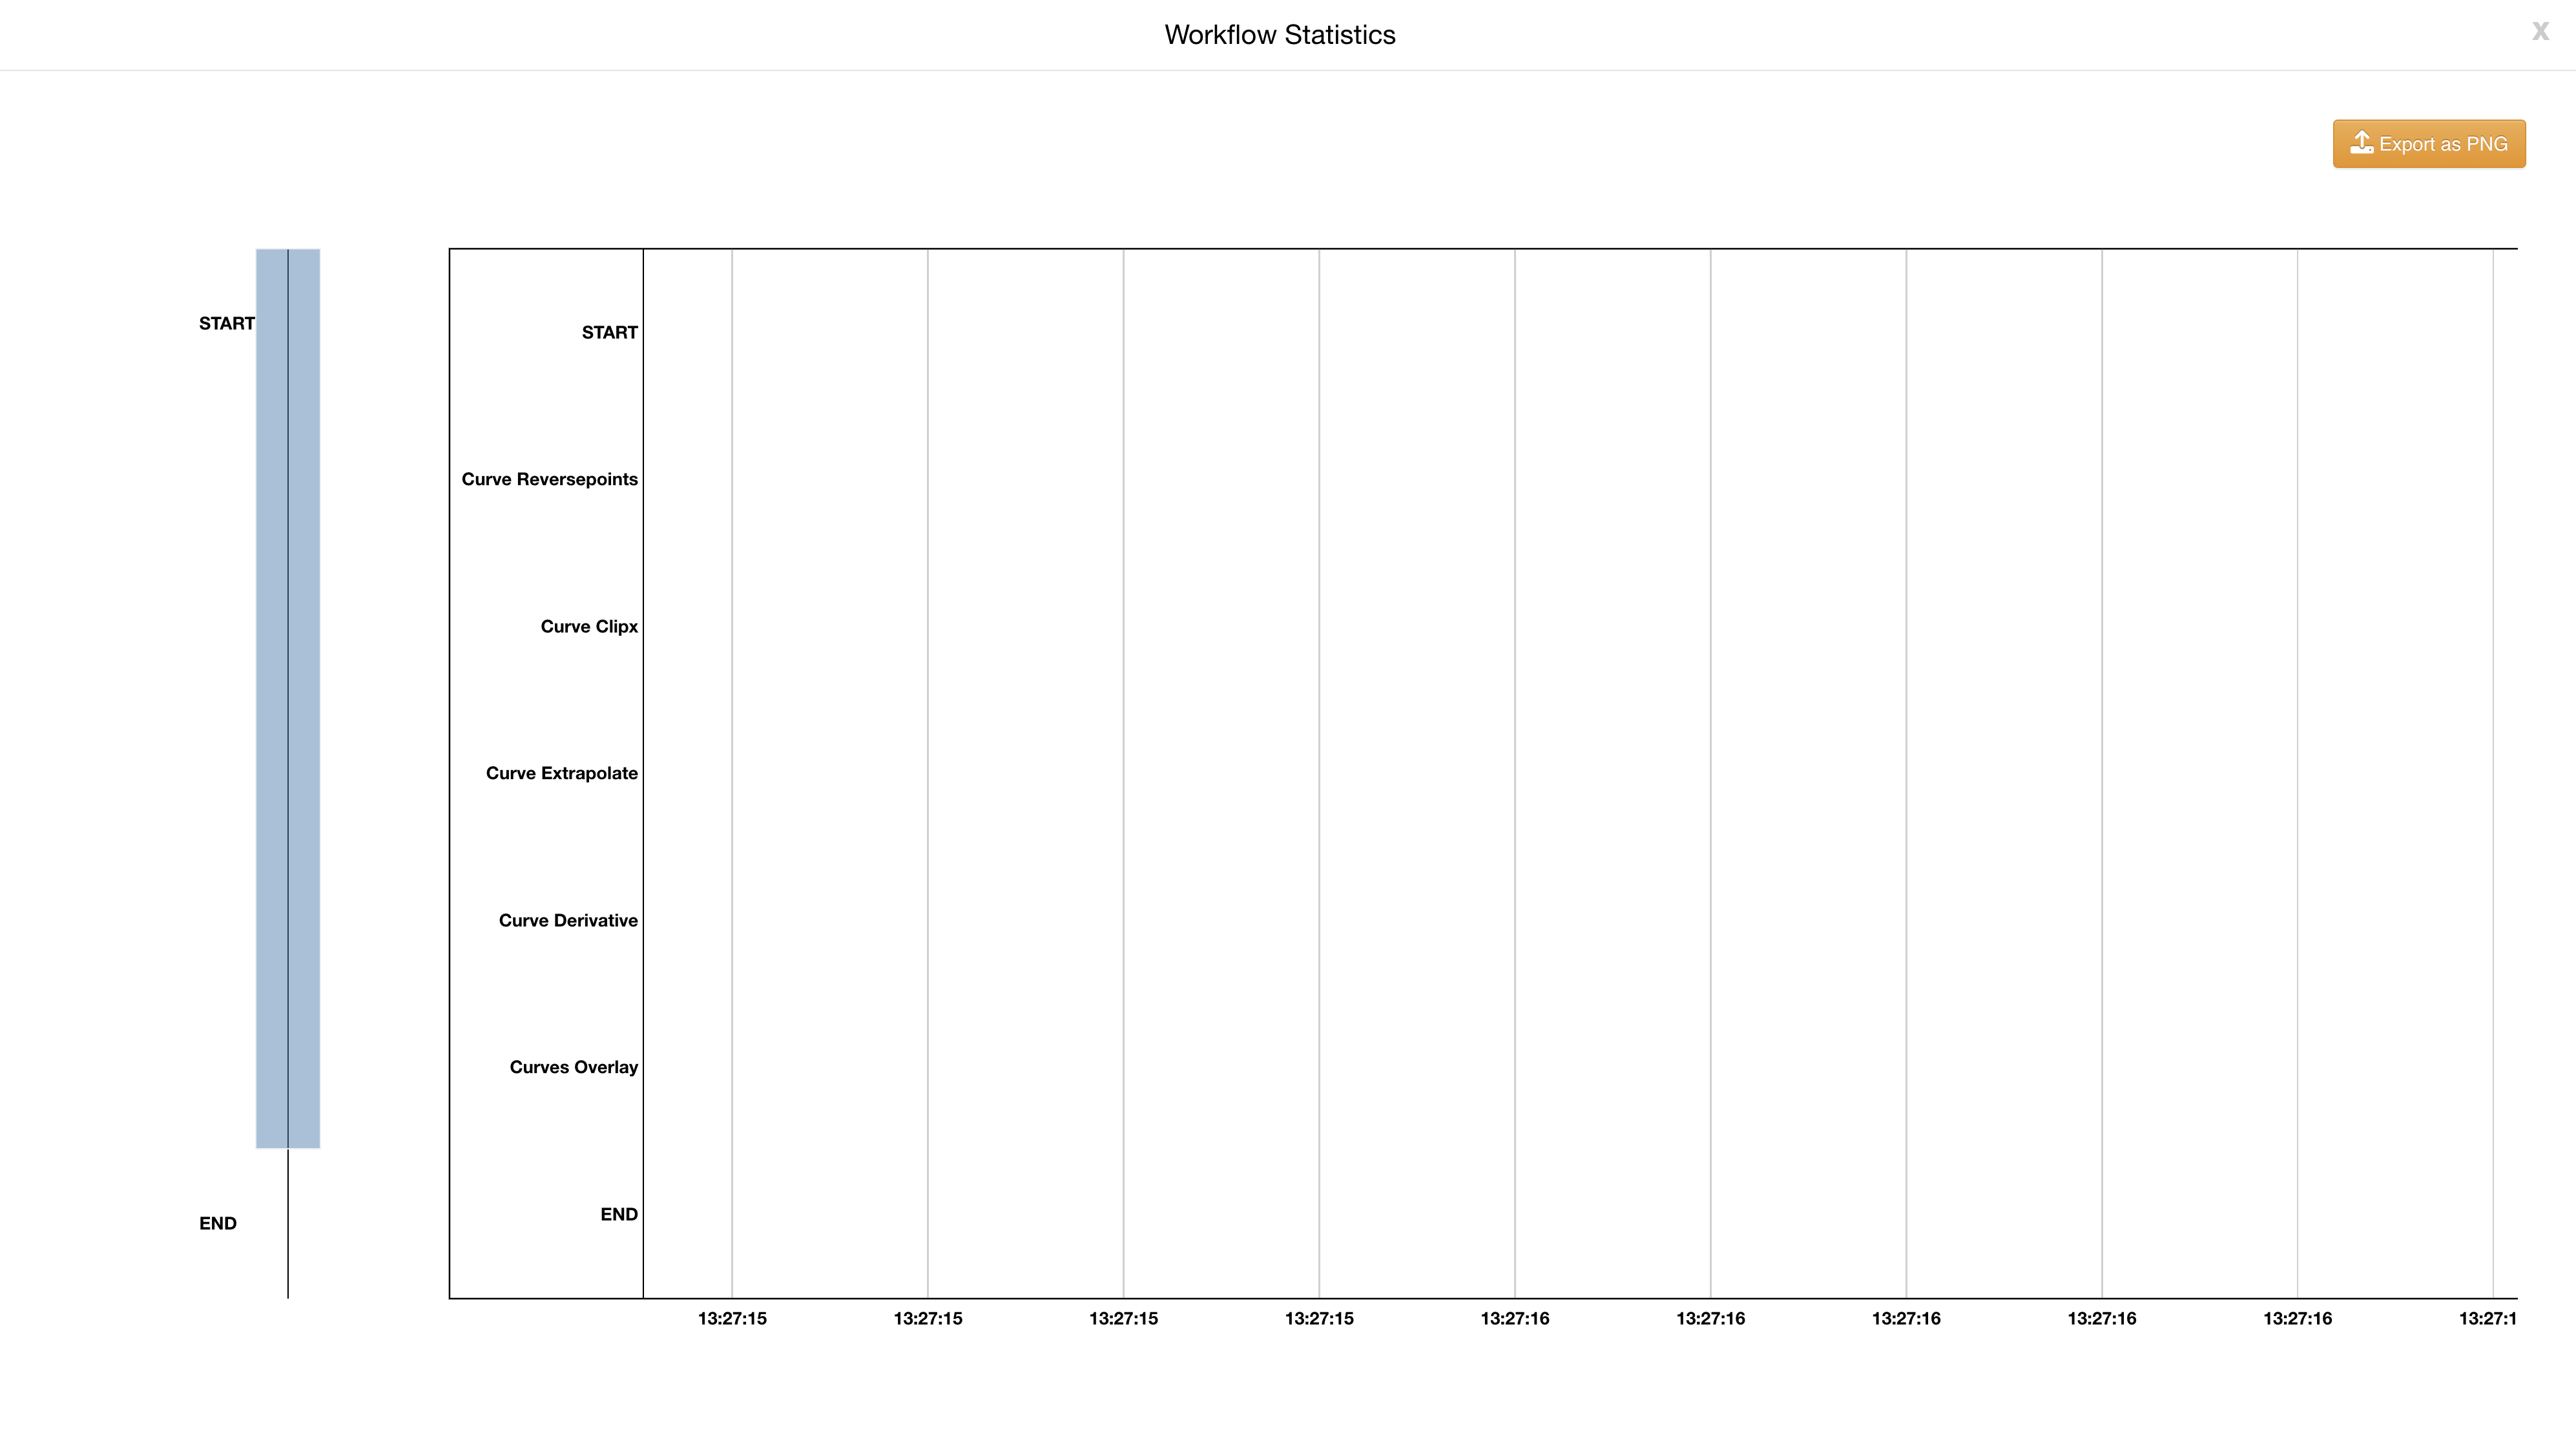
Execution Time Stats gives us a summary of time allotted to each work during the execution.
Execution Time Stats
7.4. Curve Viewer
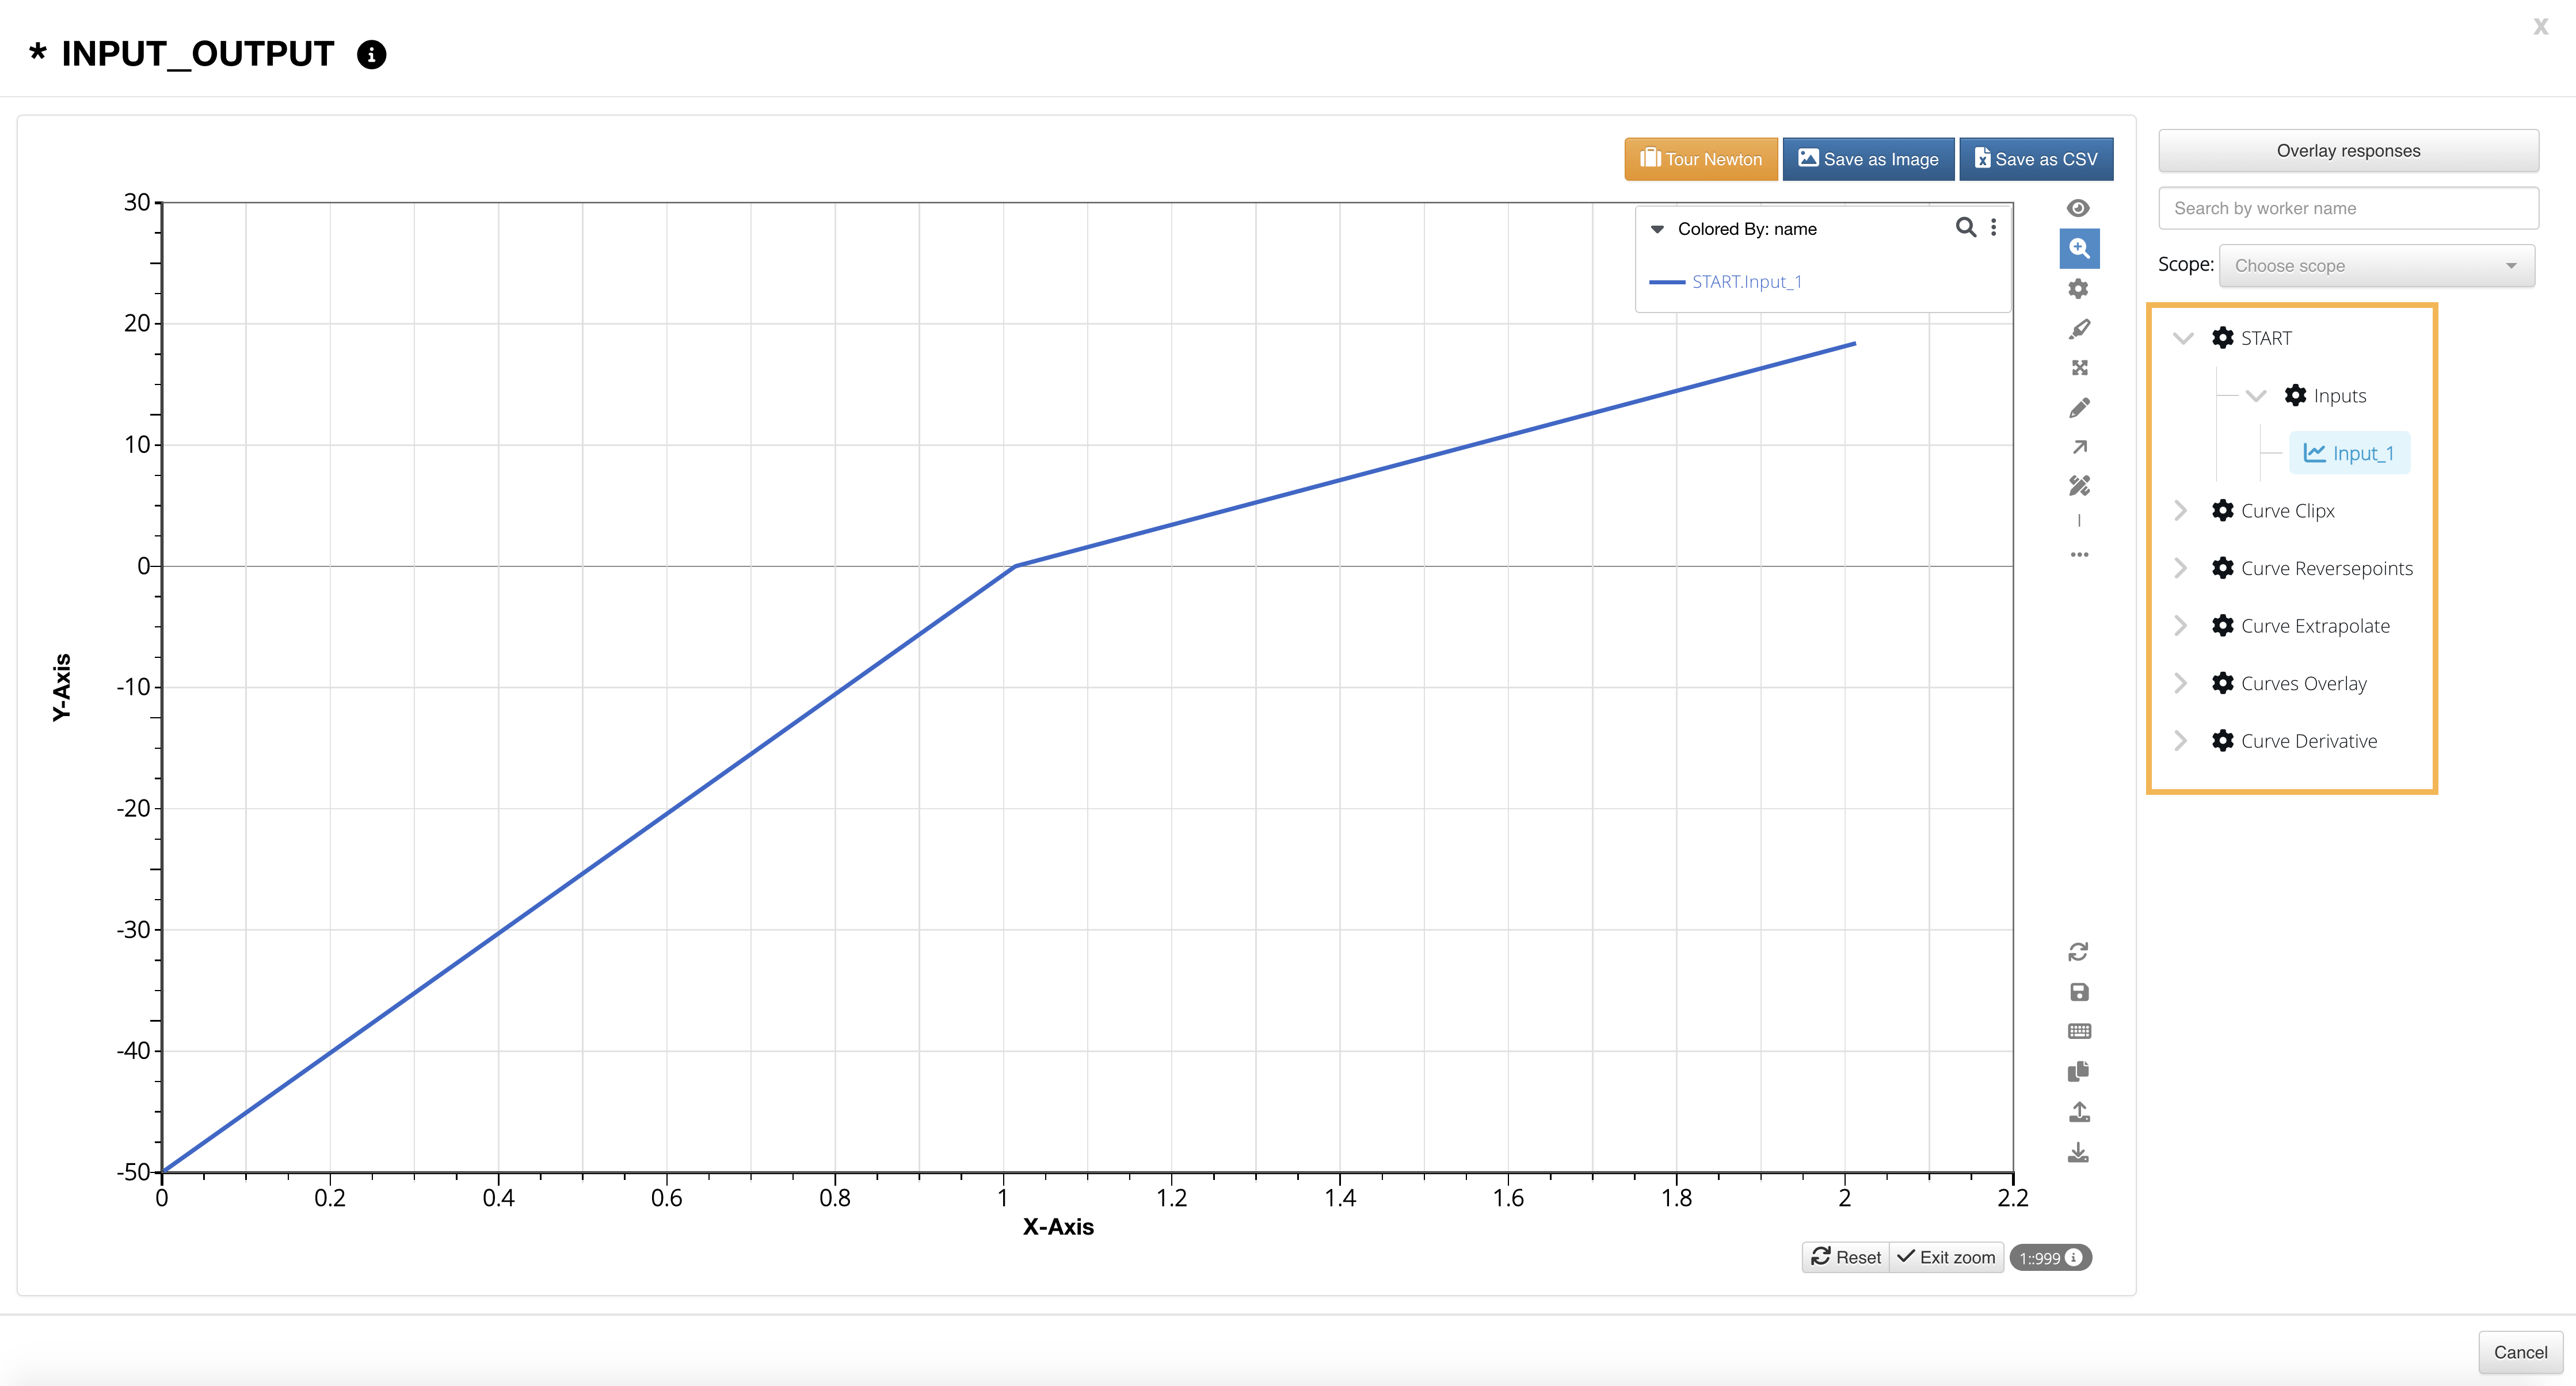
Visualize your workflow through our curve viewer located in the Data Viewer section of the navigation menu. The following image maps out the curve viewer features listed below.
Curve Viewer
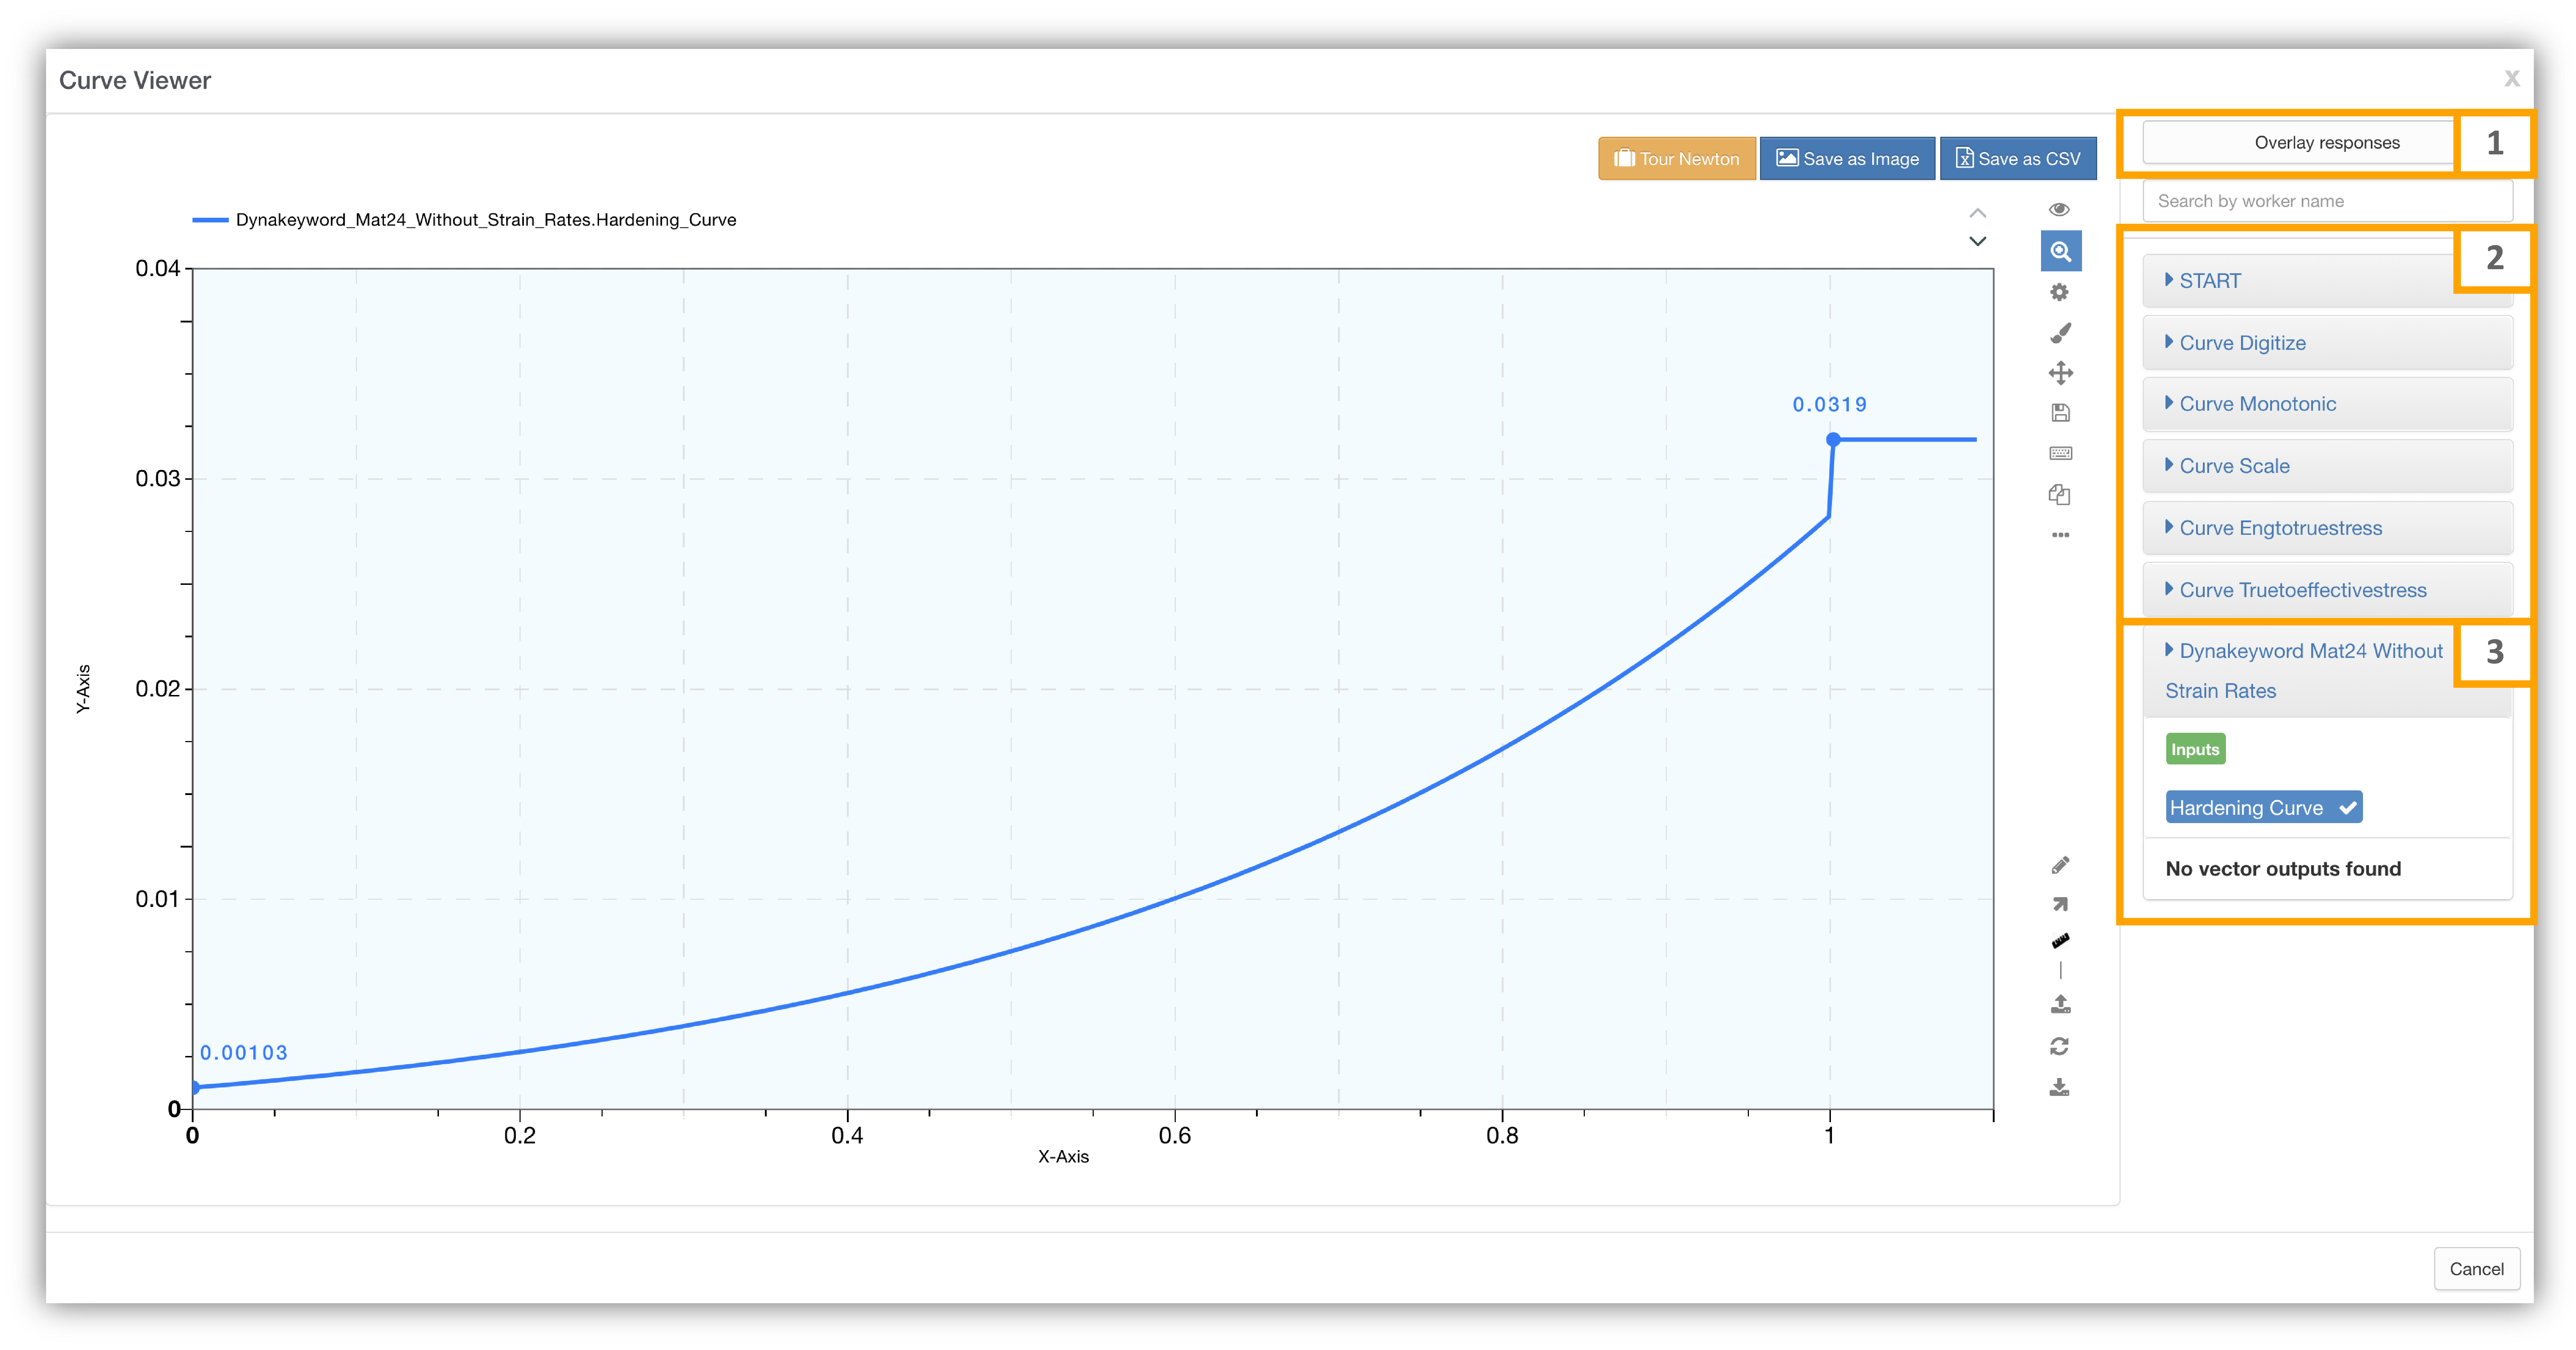
- Overlay Responses: Overlay all the curve inputs and outputs available in the workflow to compare and study
- List of all the workers with input and output
- Input and output: Inputs and outputs of every worker available for comparison and debugging
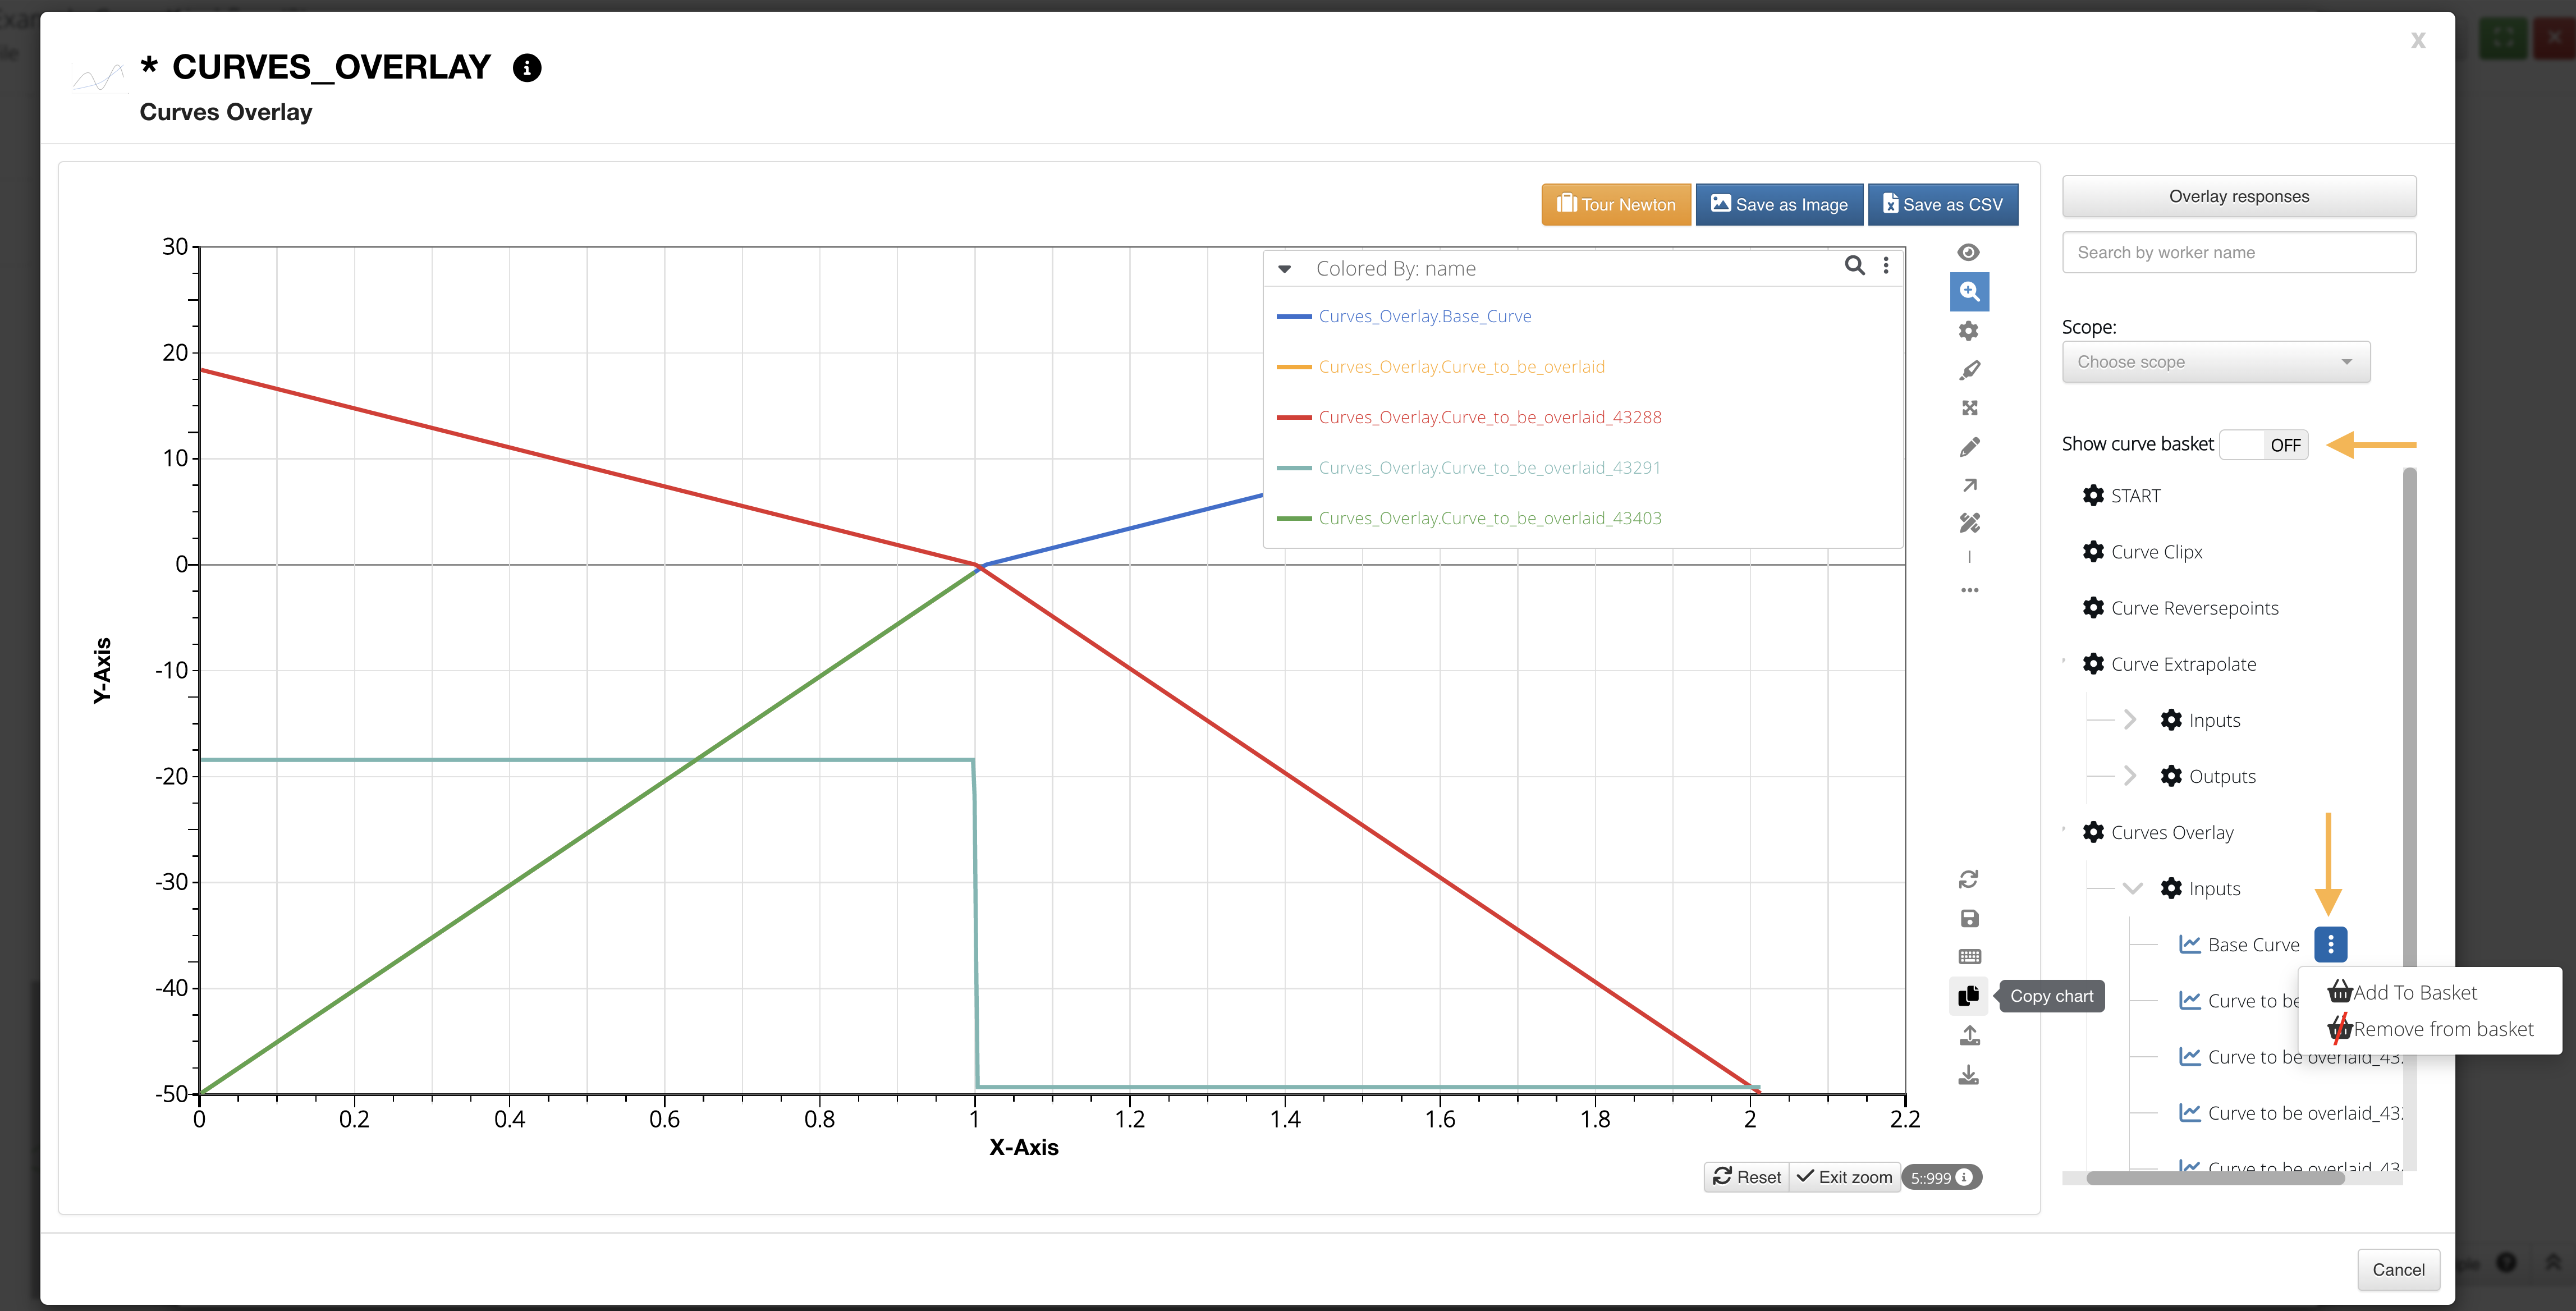
Add Curves to Basket
Click on the 3 dots next to an input or output curve in the viewer to collect them to be viewed separately. Switch on the “Show Curve Basket” button to view that curves added.
Add Curves to Basket
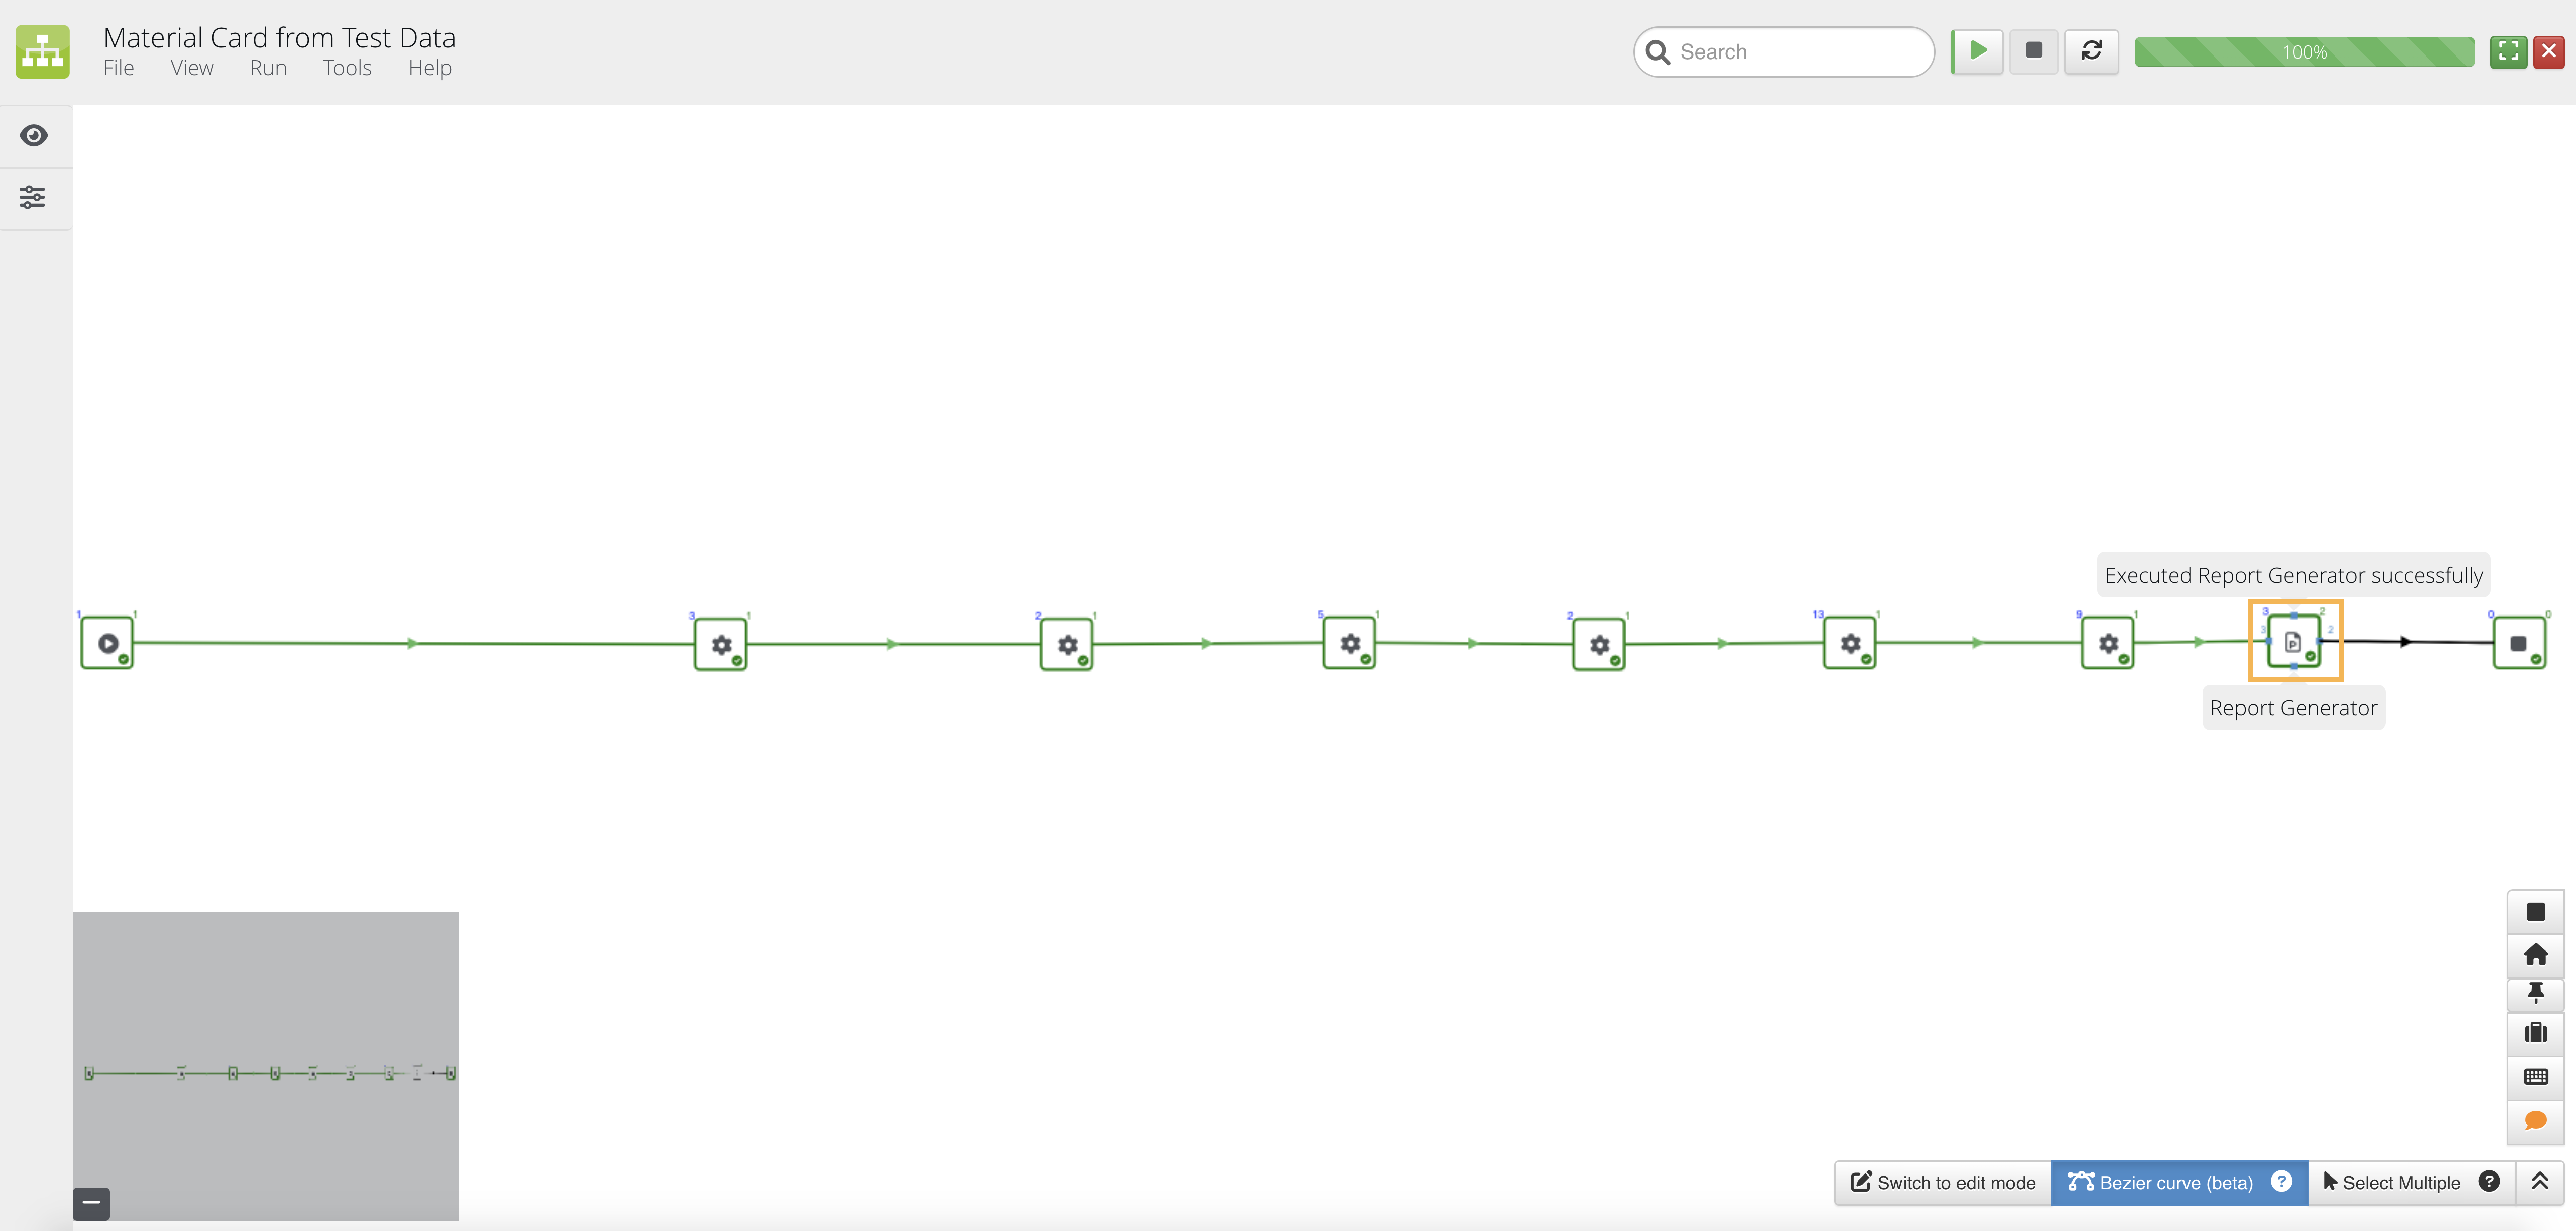
7.5. View Generated Report
Once our workflow has been executed, we can view our report we configured via the Report Generator Worker by clicking on this worker.
Click on Report Generator Worker
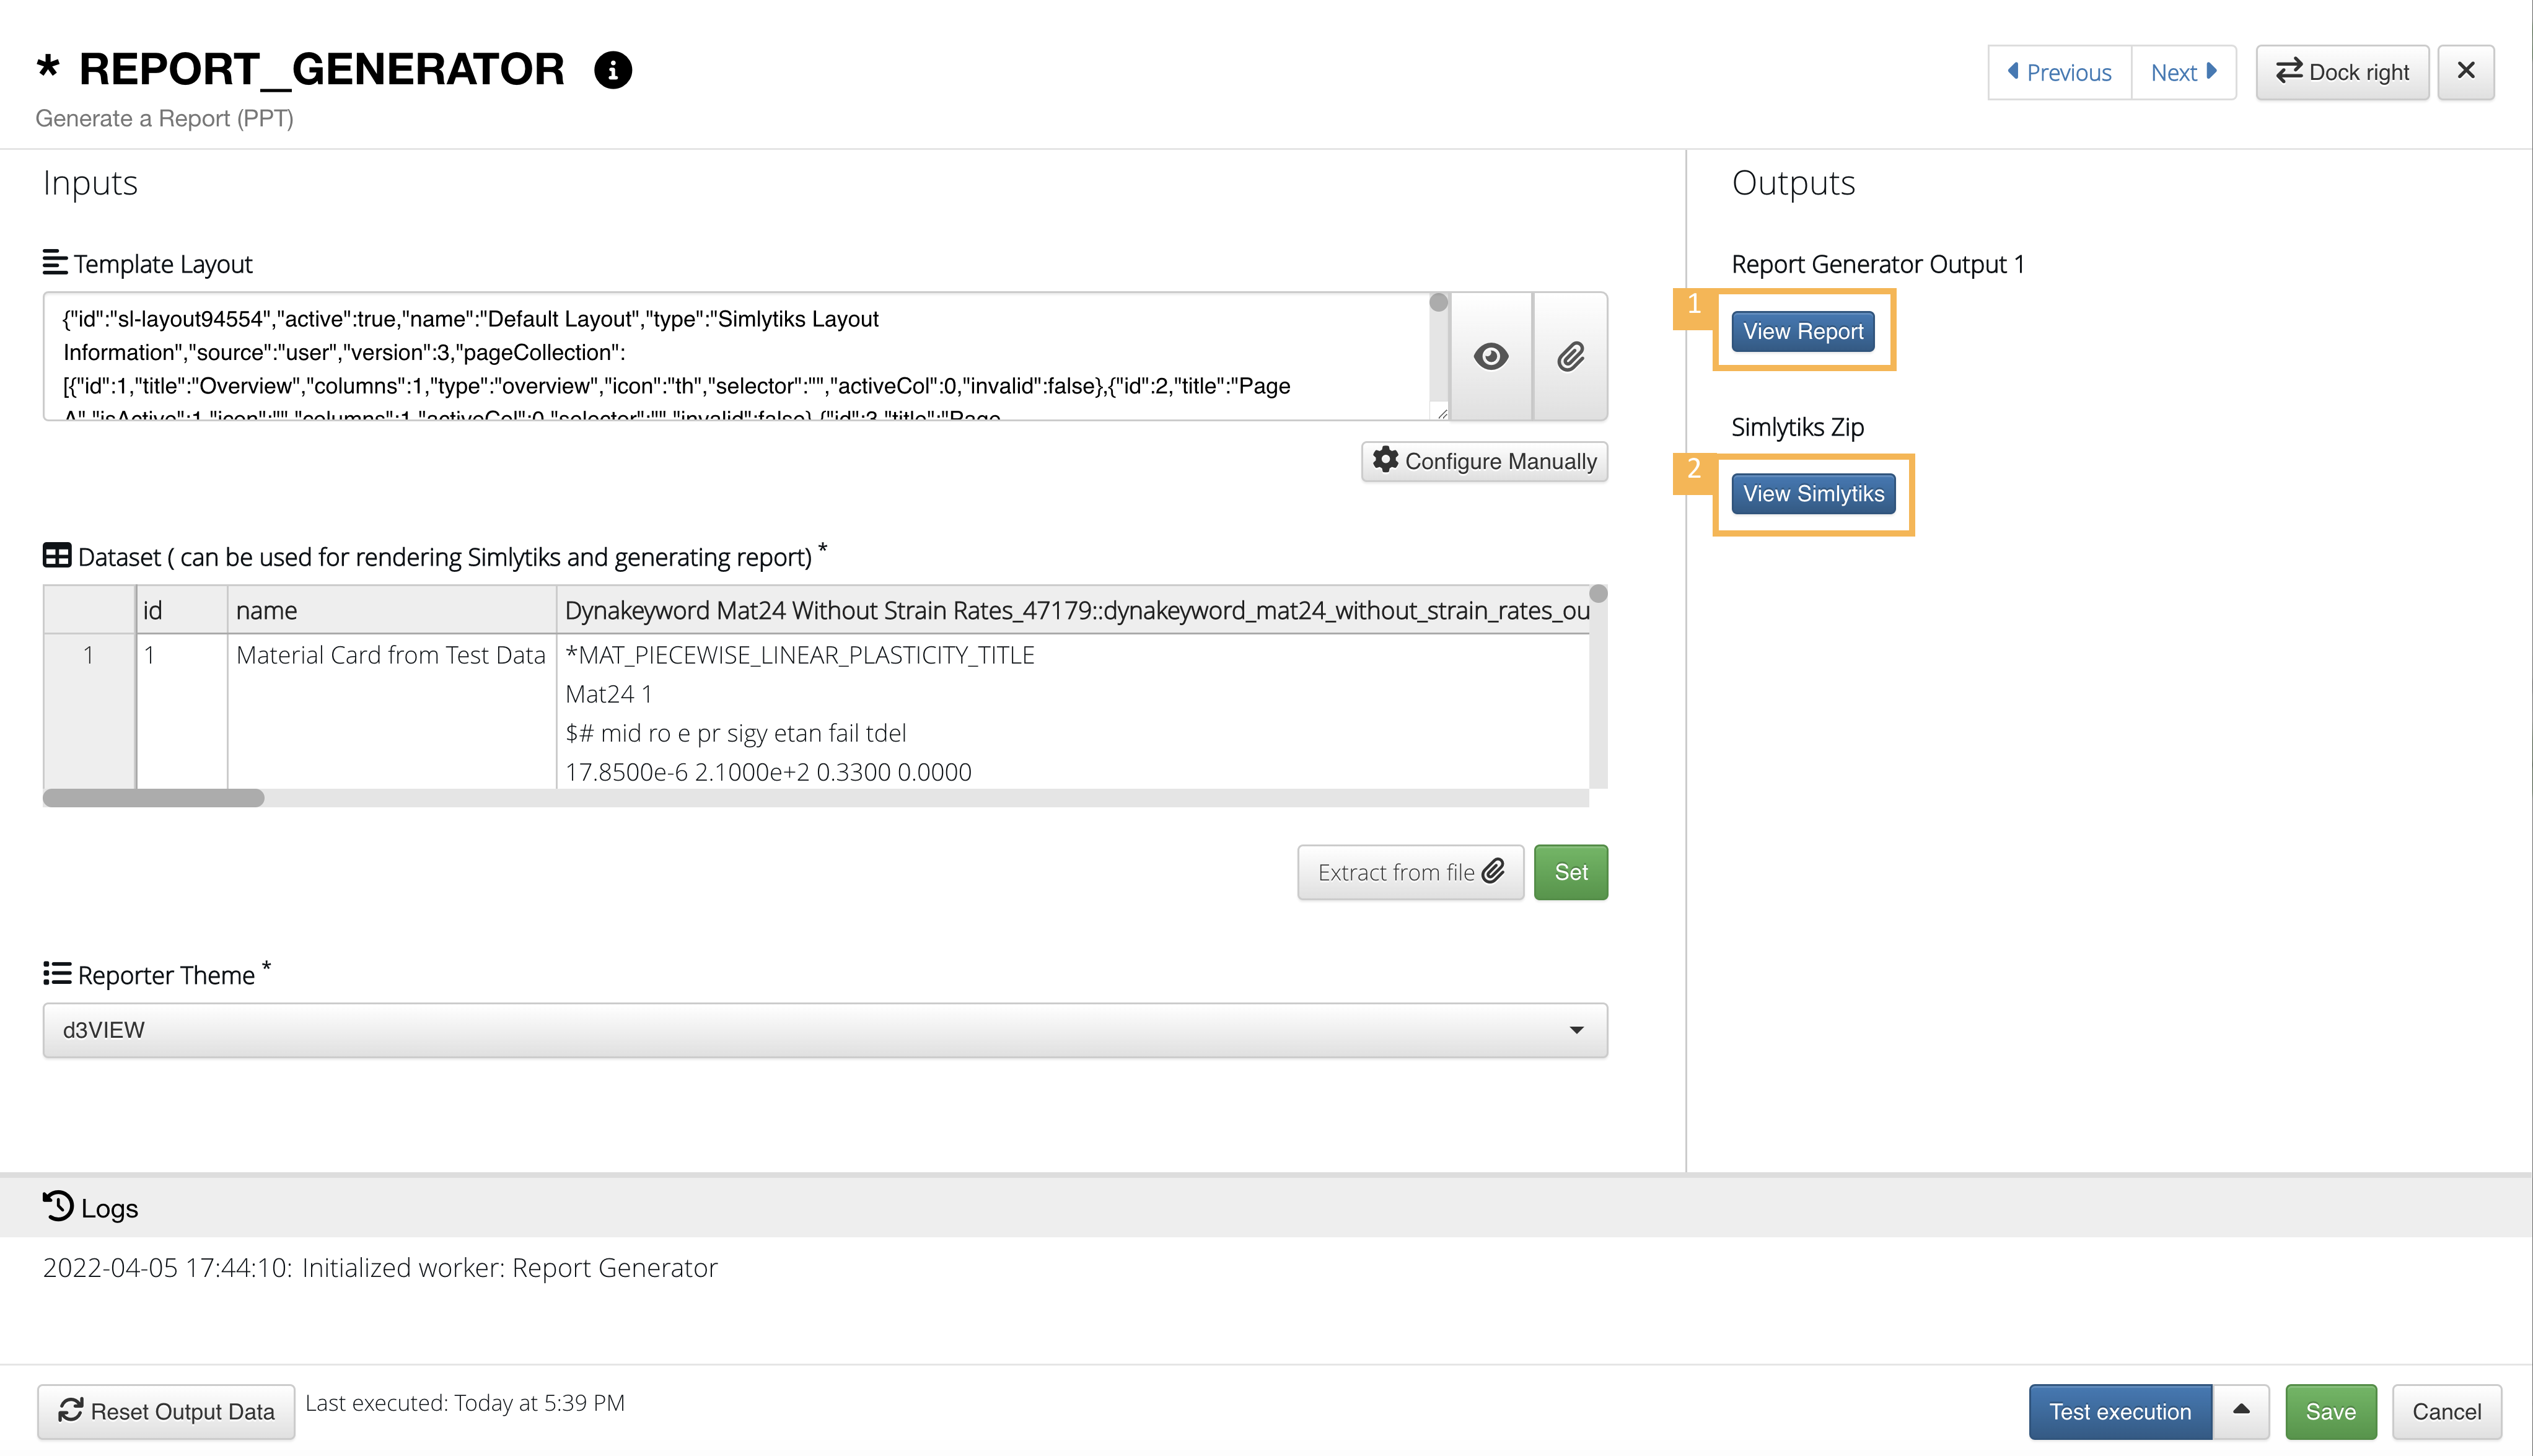
Click on “View Report” (1) to see an overview of the report via the PowerPoint Builder that can be downloaded as a PPT or PDF. Or, click on “View Simlytiks” (2) to study and interact with the report via the Simlytiks Application.
View Report and View Simlytiks
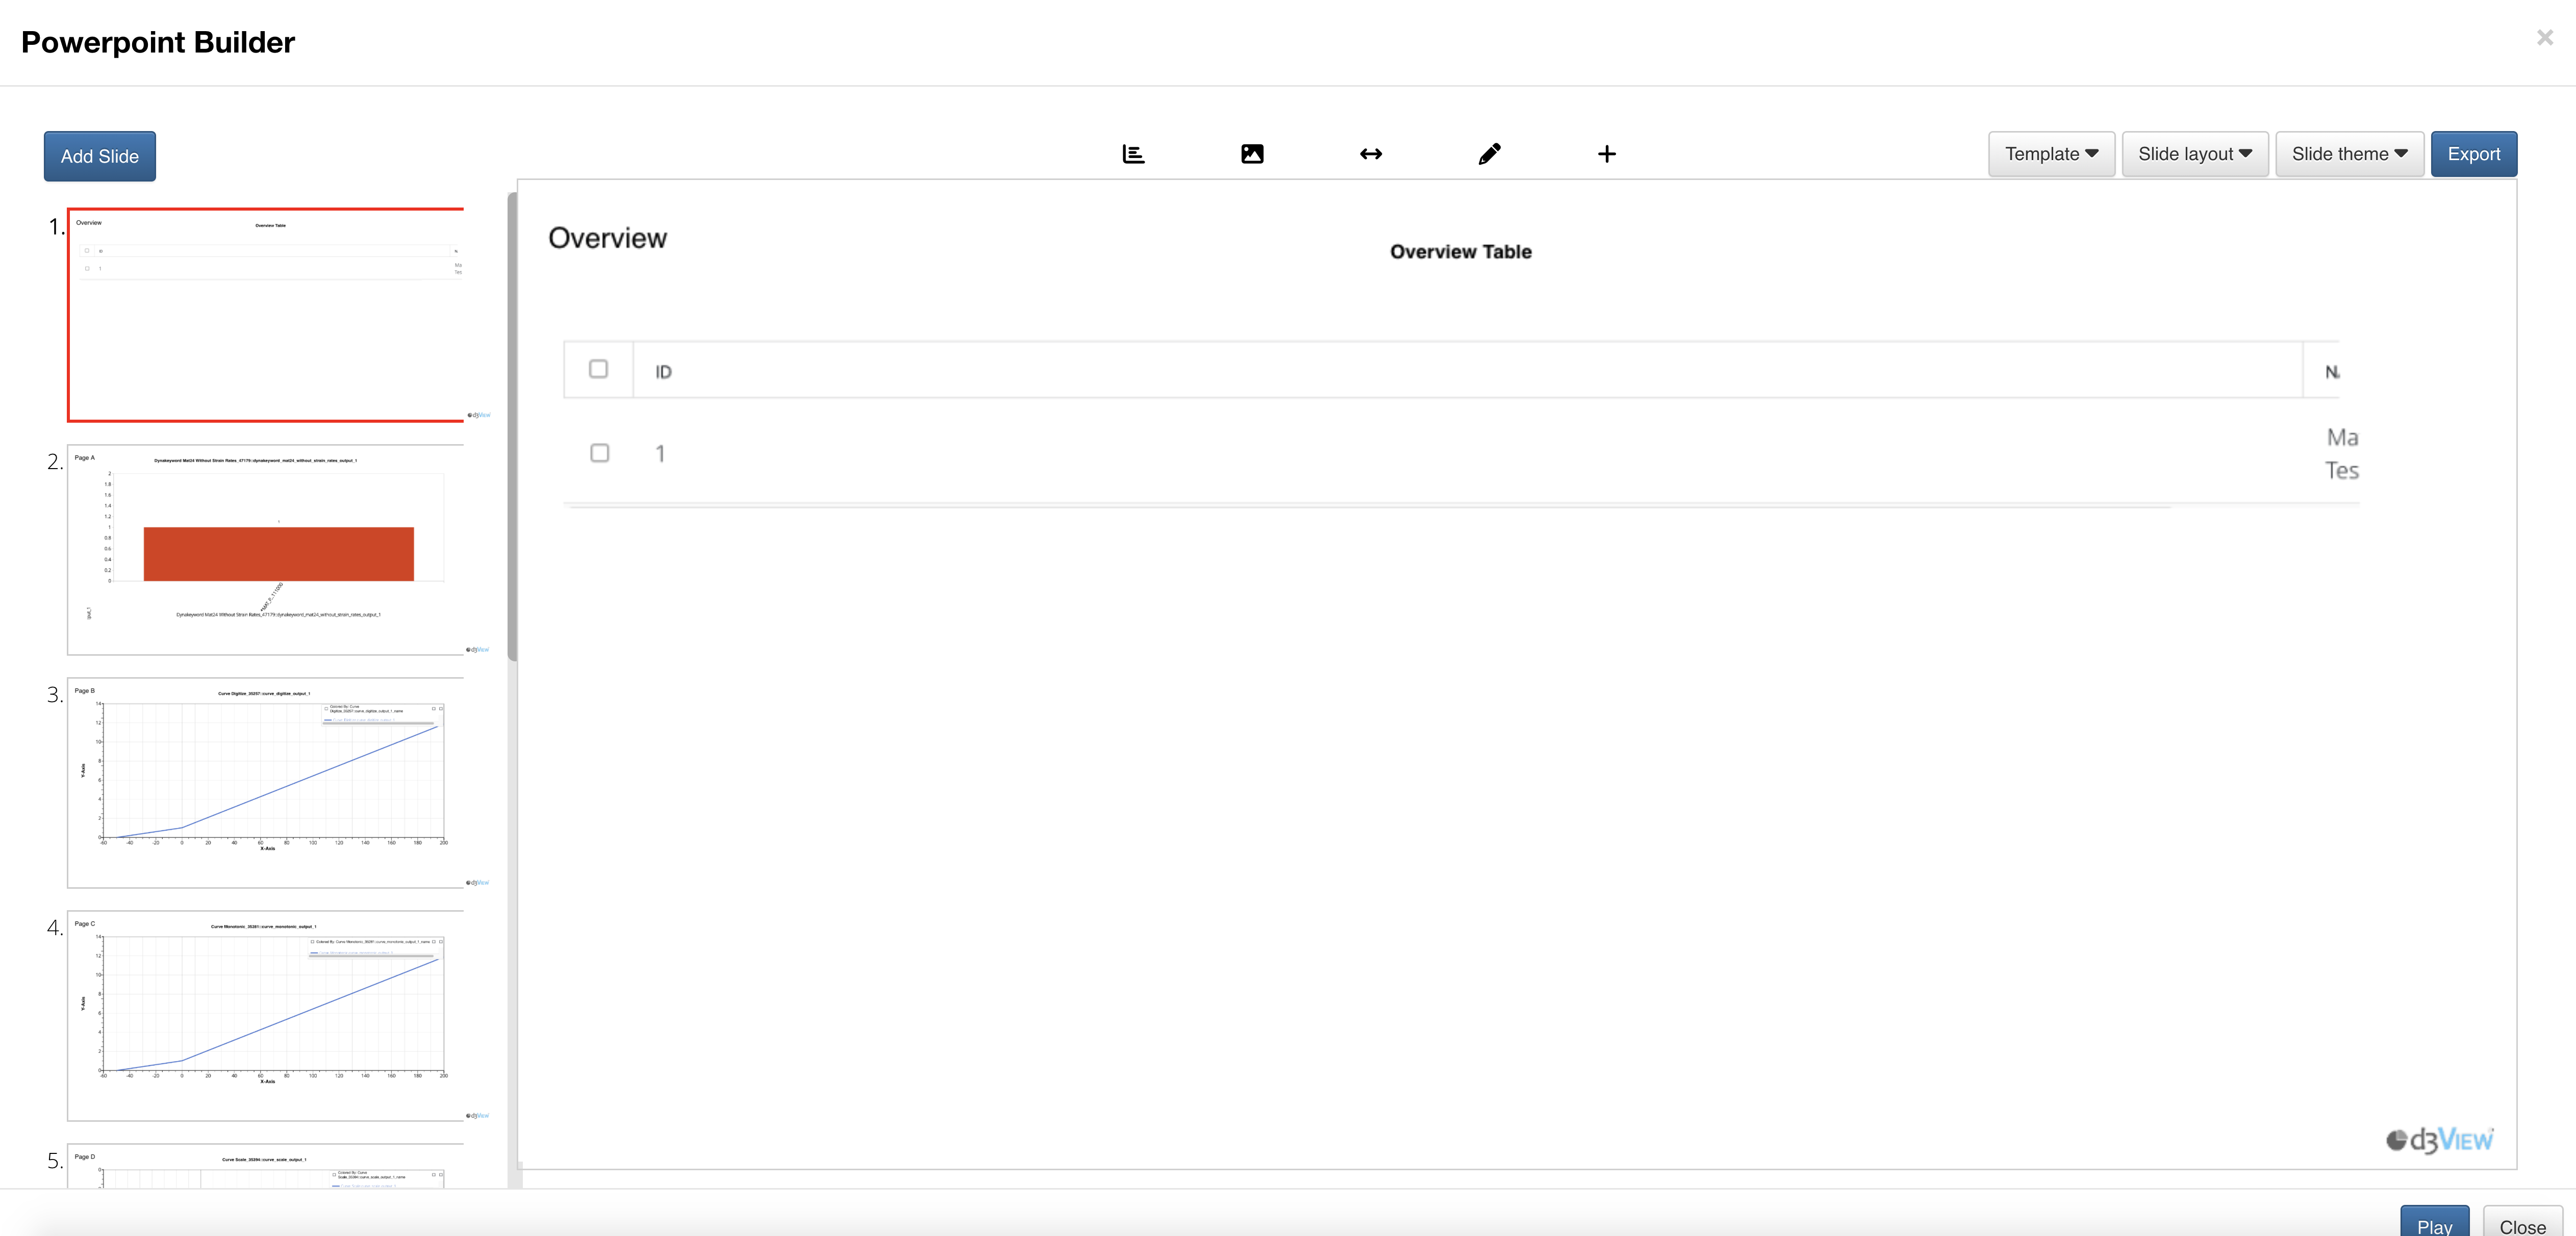
Here is how the PowerPoint Builder presents the report.
View Report
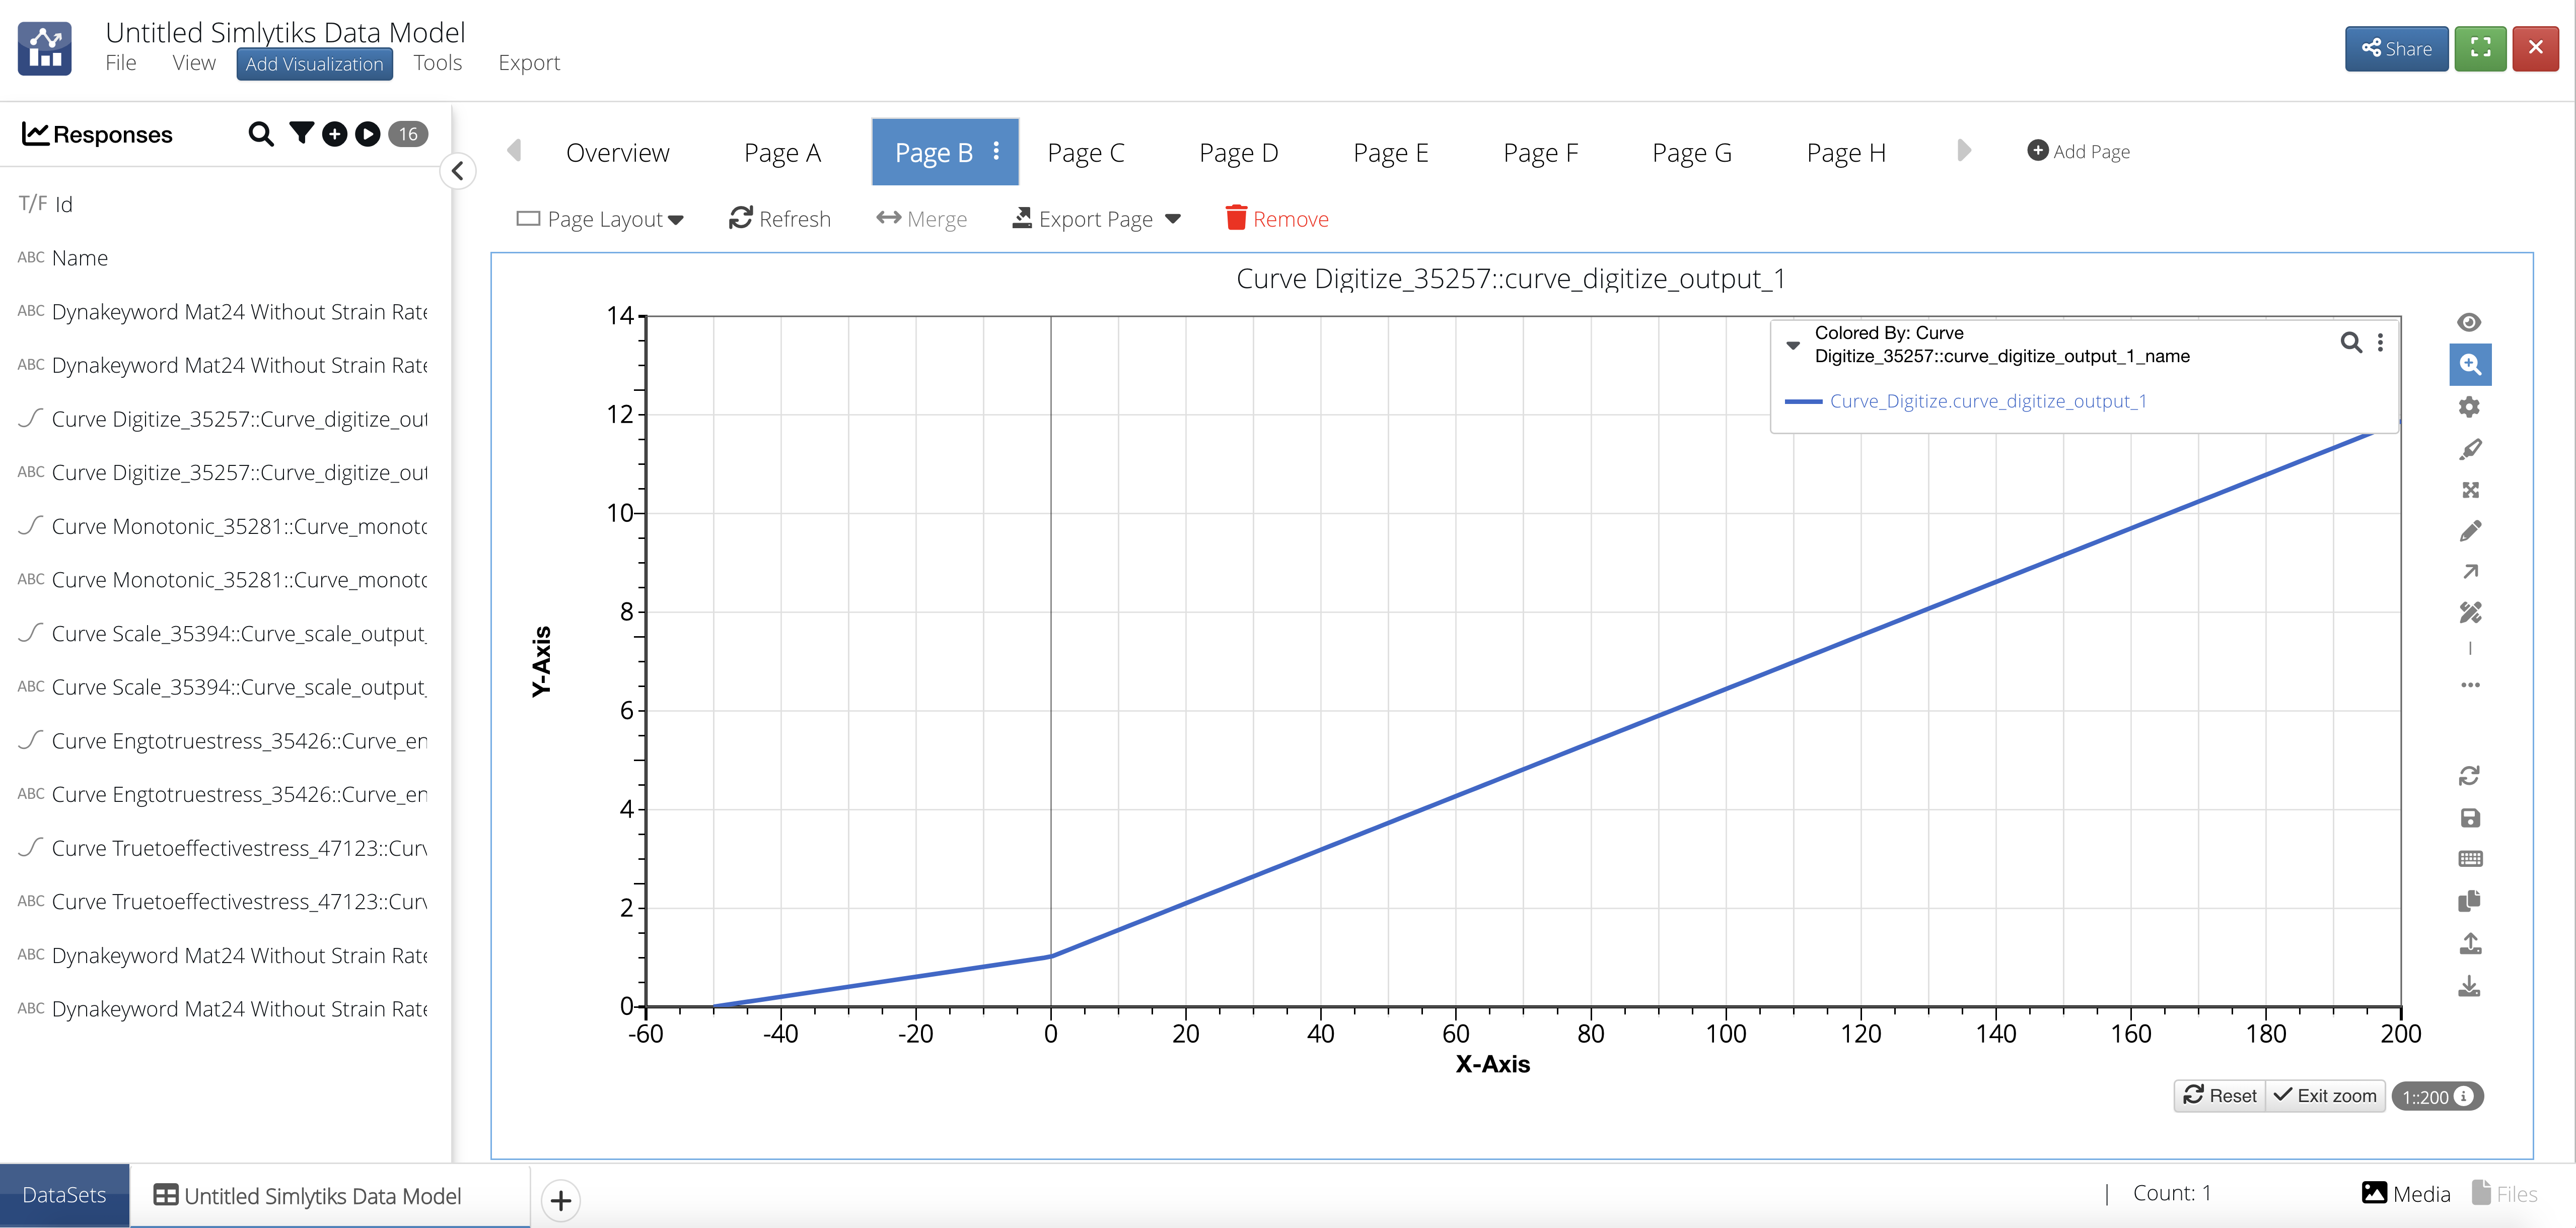
Here is how Simlytiks presents the report.
View Simlytiks