28. ML Models
28.1. Saved ML Models
New application ‘Saved ML models’ is available and this page shows all saved ML Models created by *MATHMODEL_SAVE worker in Workflows.
The saved ML Models page has summary tab which will show the overview page and schema of the model.
ML Info tab in the saved ML Models will show the ‘Raw vs prediction’ , ‘Scores’ and ‘Residuals’ page for the Models.
Predict tab is now available in the saved ML Model where we can predict the targets using inputs and compute inputs using targets.
Curve datasets can be used to create saved ML Models in the page. ML saved models will show curves in the overview page and in the prediction tab.
Two saved ML Models can be compared and information is viewed using right context menu options.
3D scatter plot in saved ML models prediction tab now allows adding of Raw Data to the plot as colored bubbles.
Add Custom charts option is now available in the residual tab when two saved ML Models are compared using context menu option.
Filters are now supported for saved ML Models and the filters added are reflected in the ML records.
In ML Saved Model Predict tab carousel UI indicators are showing the correct names of the rows and also has a label at the top which is a caption showing the current row name
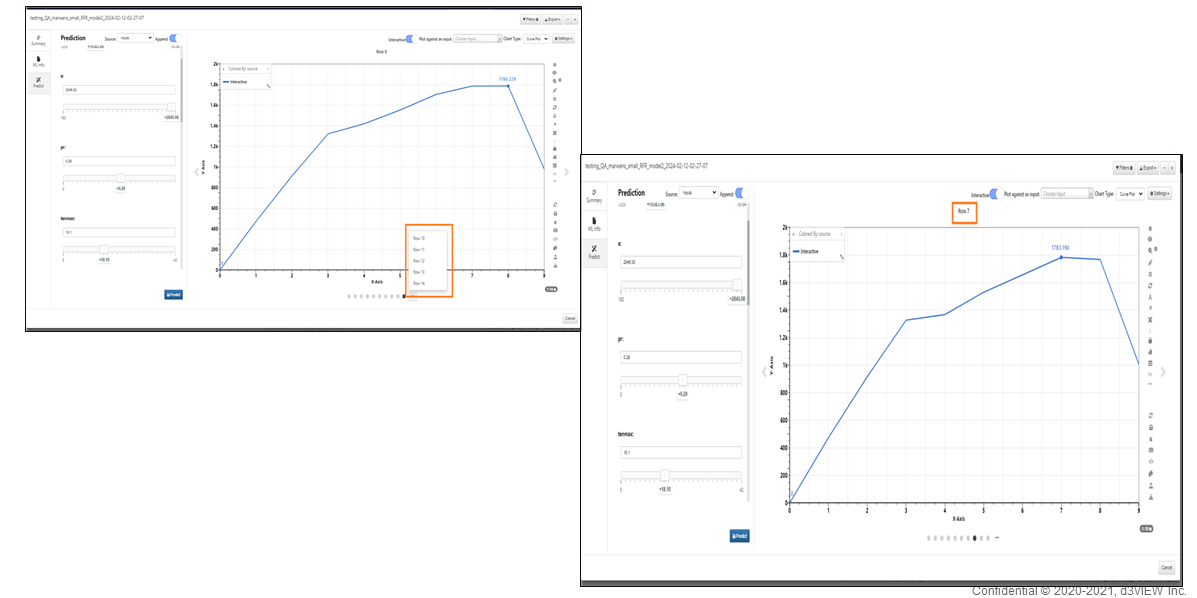
Carousel view
In the side-by-side view if the ‘Color predicted curves by difference with references’ option is enabled in the settings then both curve plots on left & right in this new side-by-side view will be colored by the Euclidean distance
Support for files to be opened on the ML Model page.
In ML Model the changes made in the curves in curve plot (colors for example) will be retained throughout the predict view.
SourceType column in Predict tab where it shows Targets -> inputs and vice versa
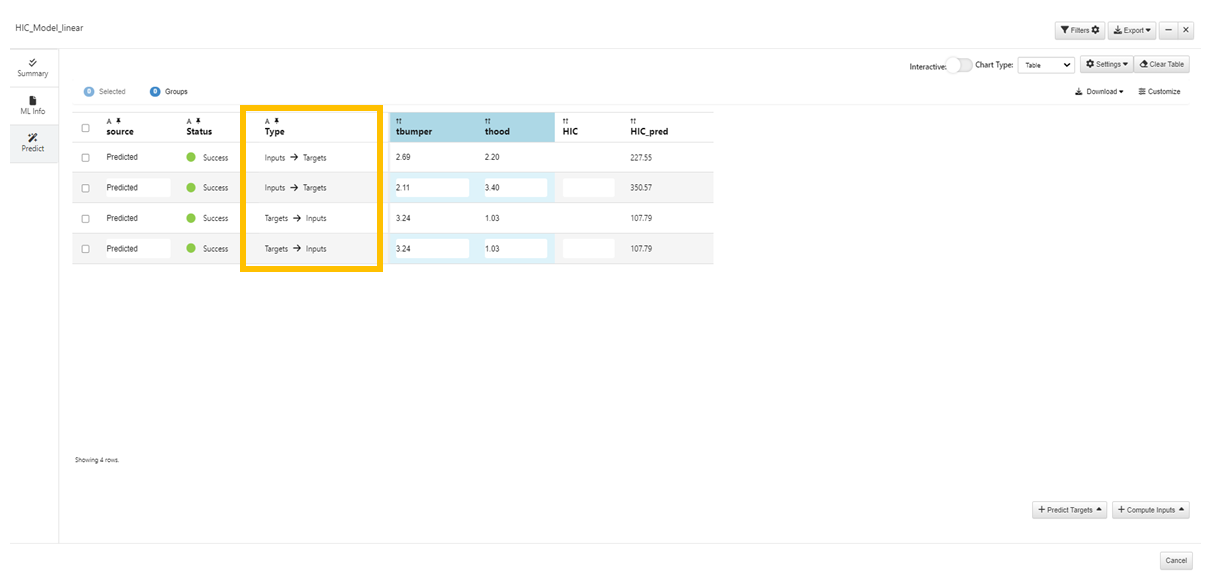
Targets -> inputs
ML Models | Predictions made in the Predict tab are now automatically saved to the model
ML Models | Export → ZIP will now export the model JSON and the mfile.pkl into a zip. This ZIP can be uploaded on the AI Models page to re-open the model
The Export option is available in the saved ML Models. The exported file can be uploaded in the AI Models page to reopen the model.
The predicted Inputs and Targets are correctly labeled in saved ML Models.
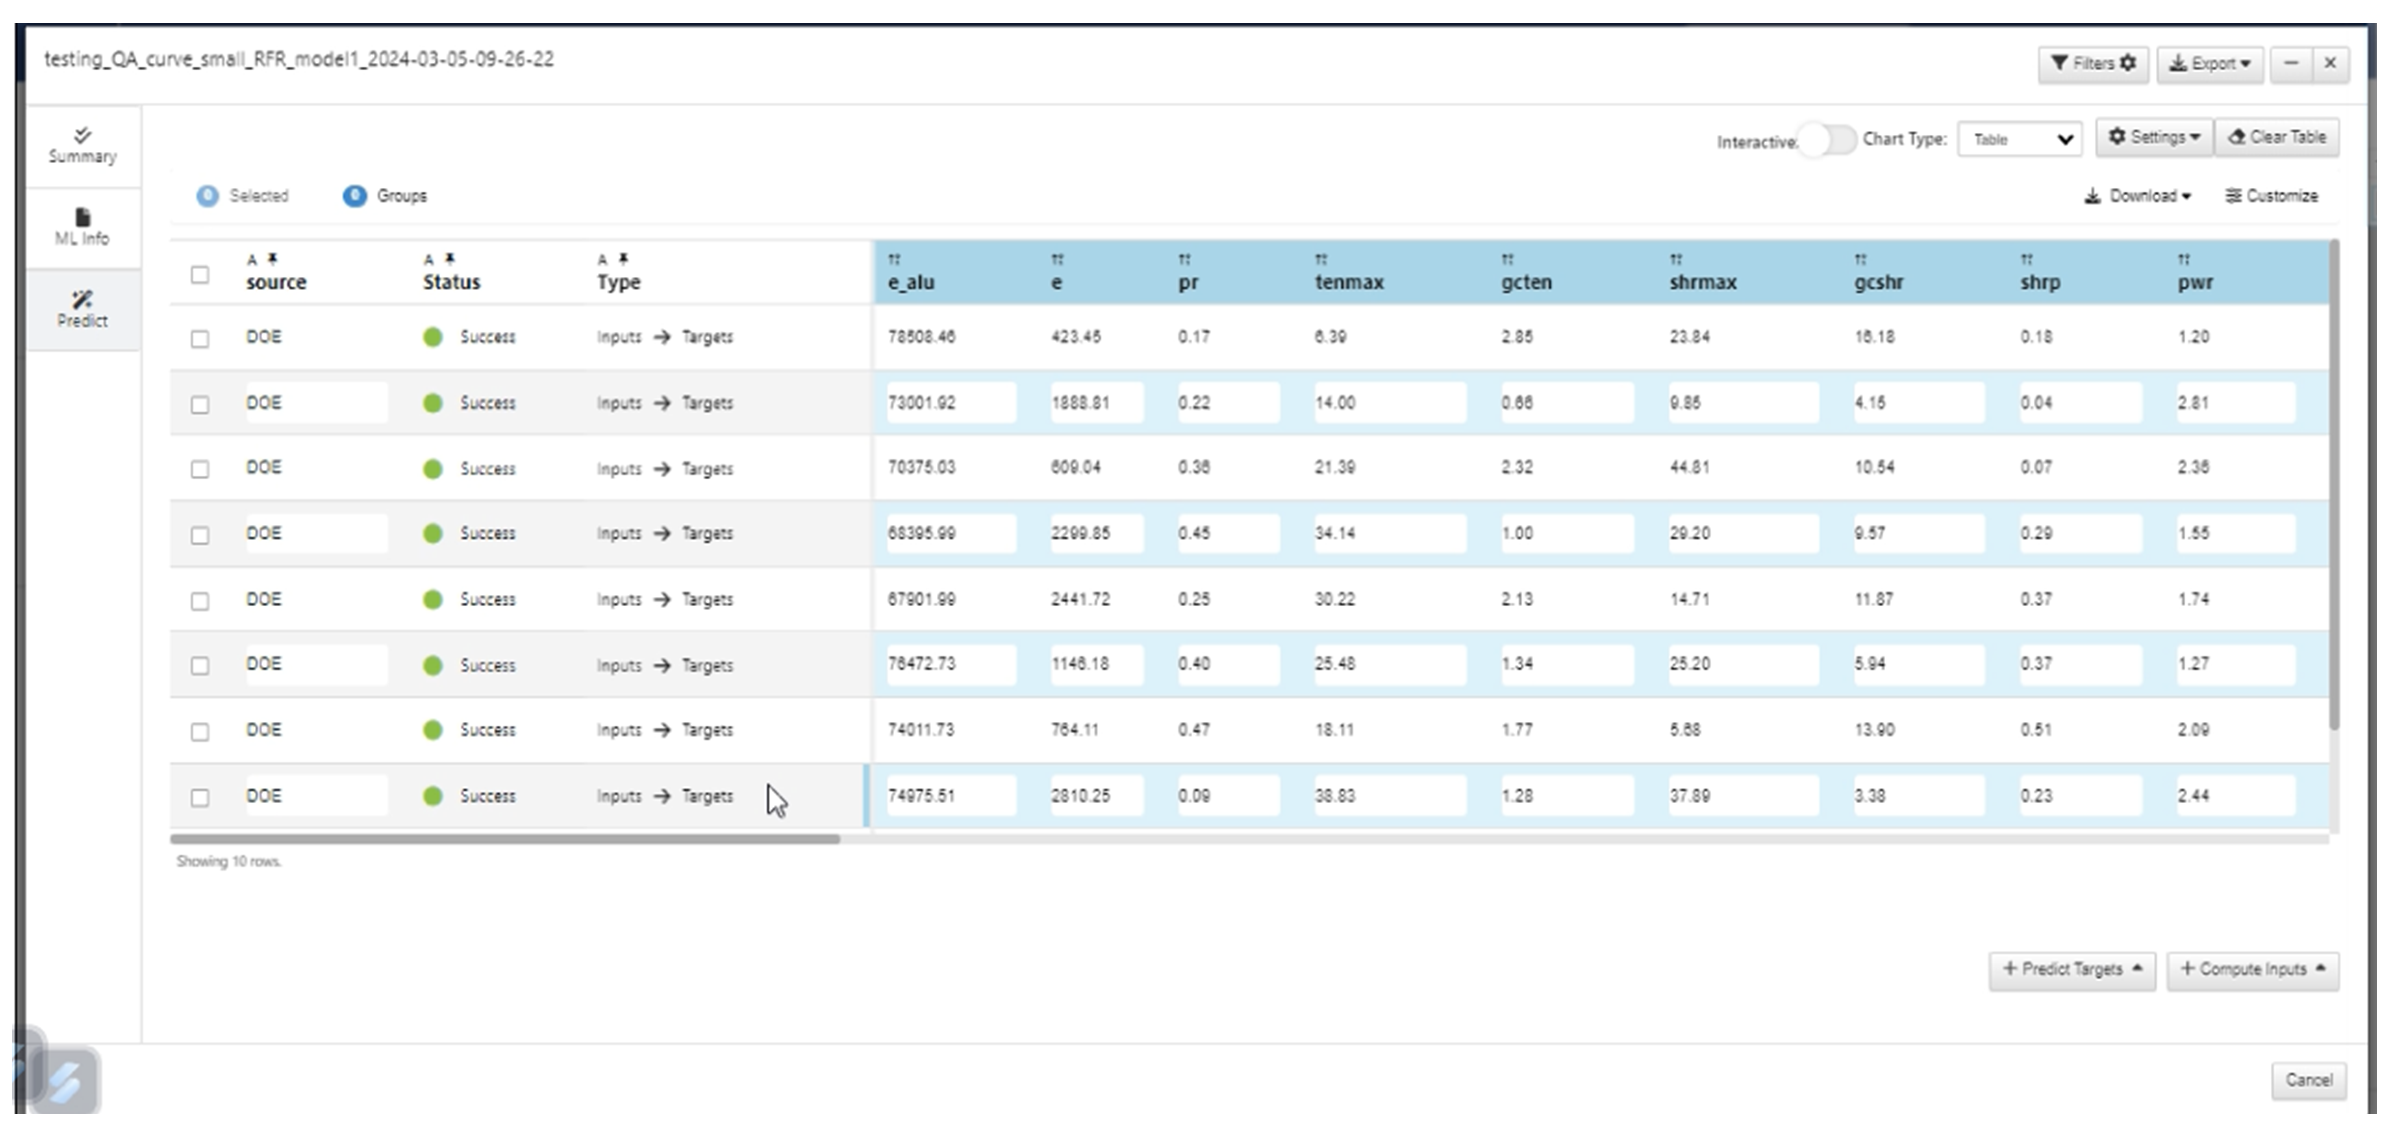
Targets -> inputs labels
In ML Saved Model - Predict has a new header option called ‘Interactive’, along with other options to append a row and to select the source - Targets or Inputs, for choosing the slider value inputs
In ML Models, Compute Inputs is now disabled for Classifier ML as it is applicable only for regression workers.
In ML Models, the invalid rows message is now correctly displayed and UI is updated when we upload invalid dataset to ML Model.
In ML saved models, the prediction curves and the Raw/Reference curves can be viewed side by side when the Reference input dataset is available in the worker
In ML saved models, raw data curves can now be colored based on columns.
28.2. Independents and Targets
Independents and Targets in overview summary page under saved ML models now show as list of items with icons and distribution chart is available when we click on them.
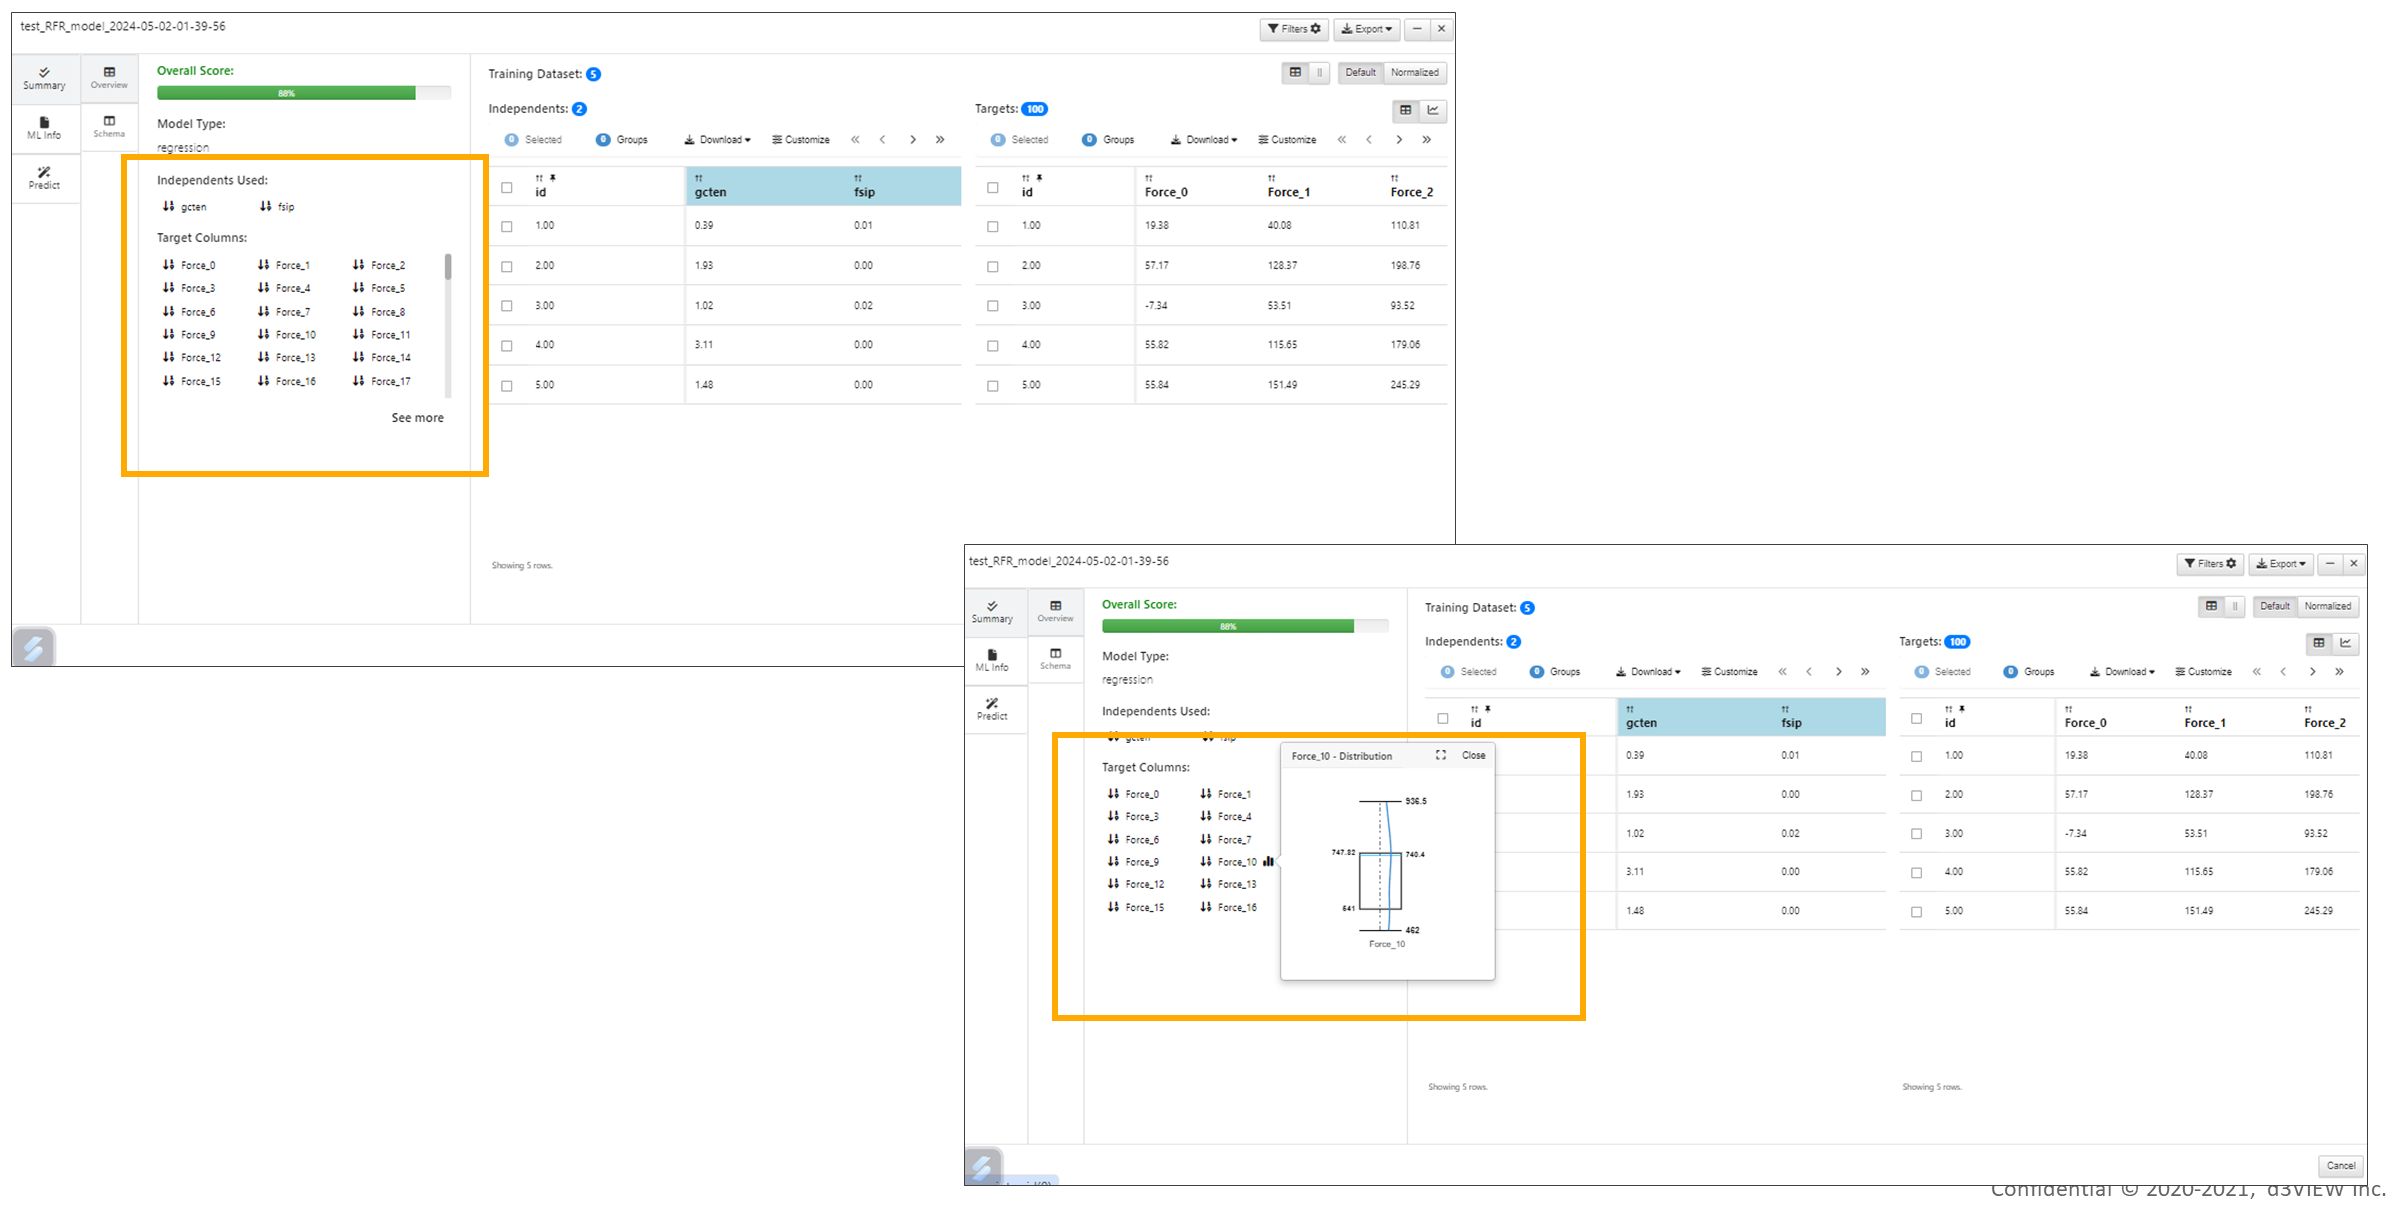
Targets and Independents
Math Model Overview View Options
Overview
The Math Model Overview page now allows users to view Independents and Targets in multiple formats, making it easier to analyze and compare model data.
Users can switch between Table, Heatmap, and Curve views. The new Heatmap view displays all actual values on a single page, enabling faster visual comparison across variables.
Key Features
- Added Table, Heatmap, and Curve view options for Independents and Targets
- Introduced a Heatmap view that displays actual values on a single page
- Allows users to quickly switch between different visualization modes
- Improves comparison of model variables and response values
- Enhances data exploration and analysis
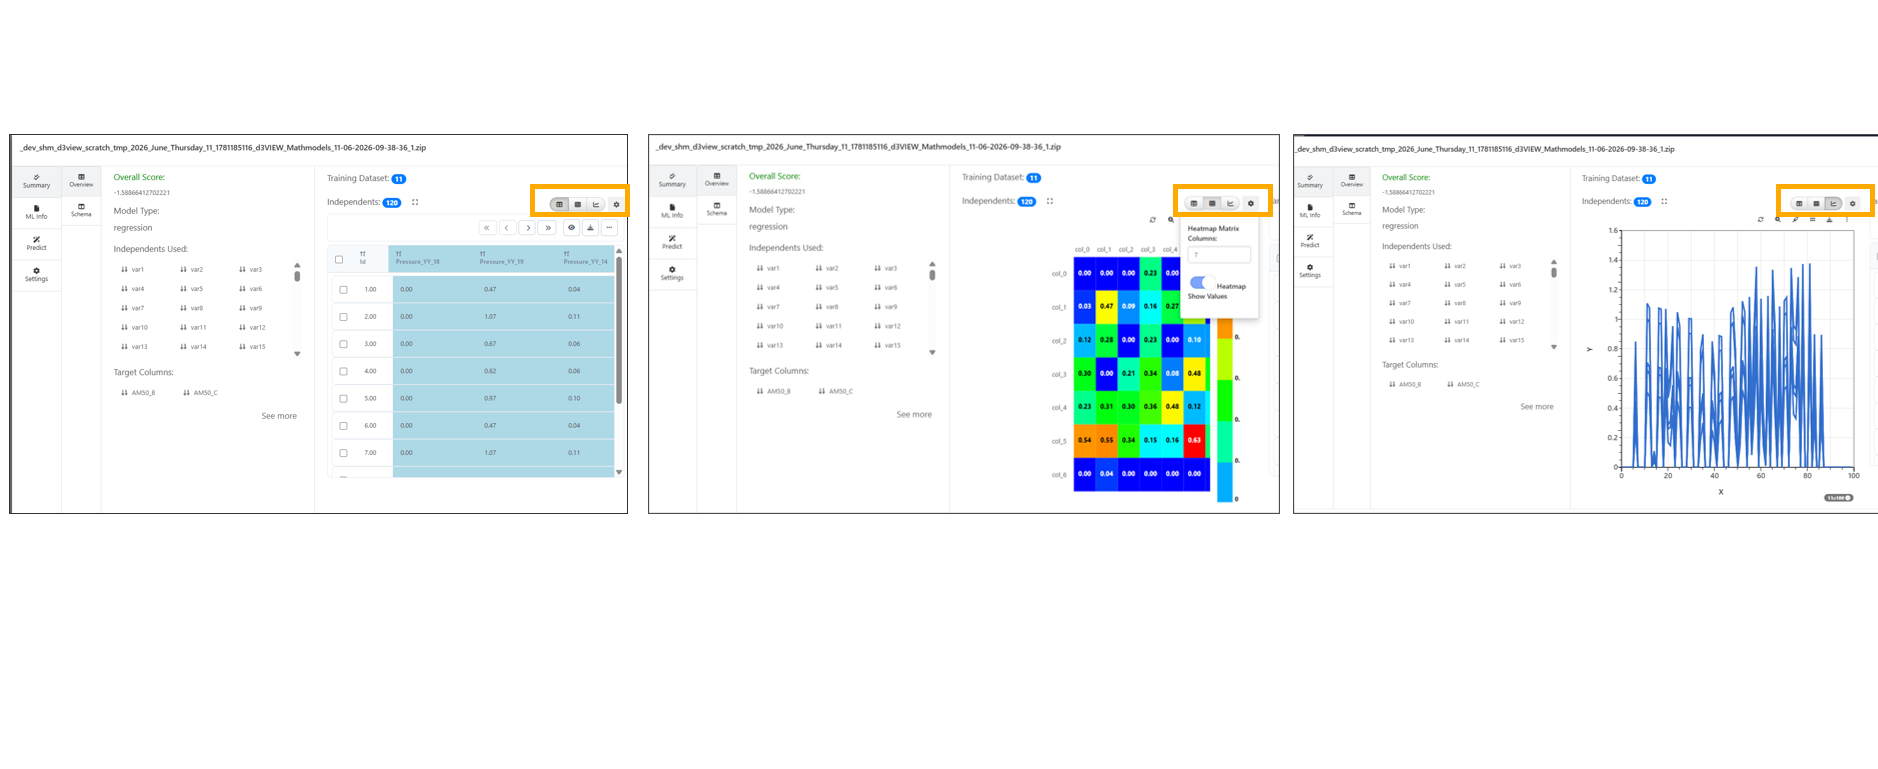
Targets and Independents Views
View Math Model Dataset in Simlytiks
Overview
The Math Model page now includes a View in Simlytiks option, allowing users to open the associated dataset directly in Simlytiks for further exploration and analysis.
This enhancement provides seamless navigation between Math Models and Simlytiks, making it easier to inspect, visualize, and work with the underlying dataset.
Key Features
- Added a View in Simlytiks option to the Math Model page
- Opens the associated dataset directly in Simlytiks
- Provides seamless navigation between Math Models and Simlytiks
- Simplifies access to the underlying model dataset
- Enhances data exploration and analysis workflows
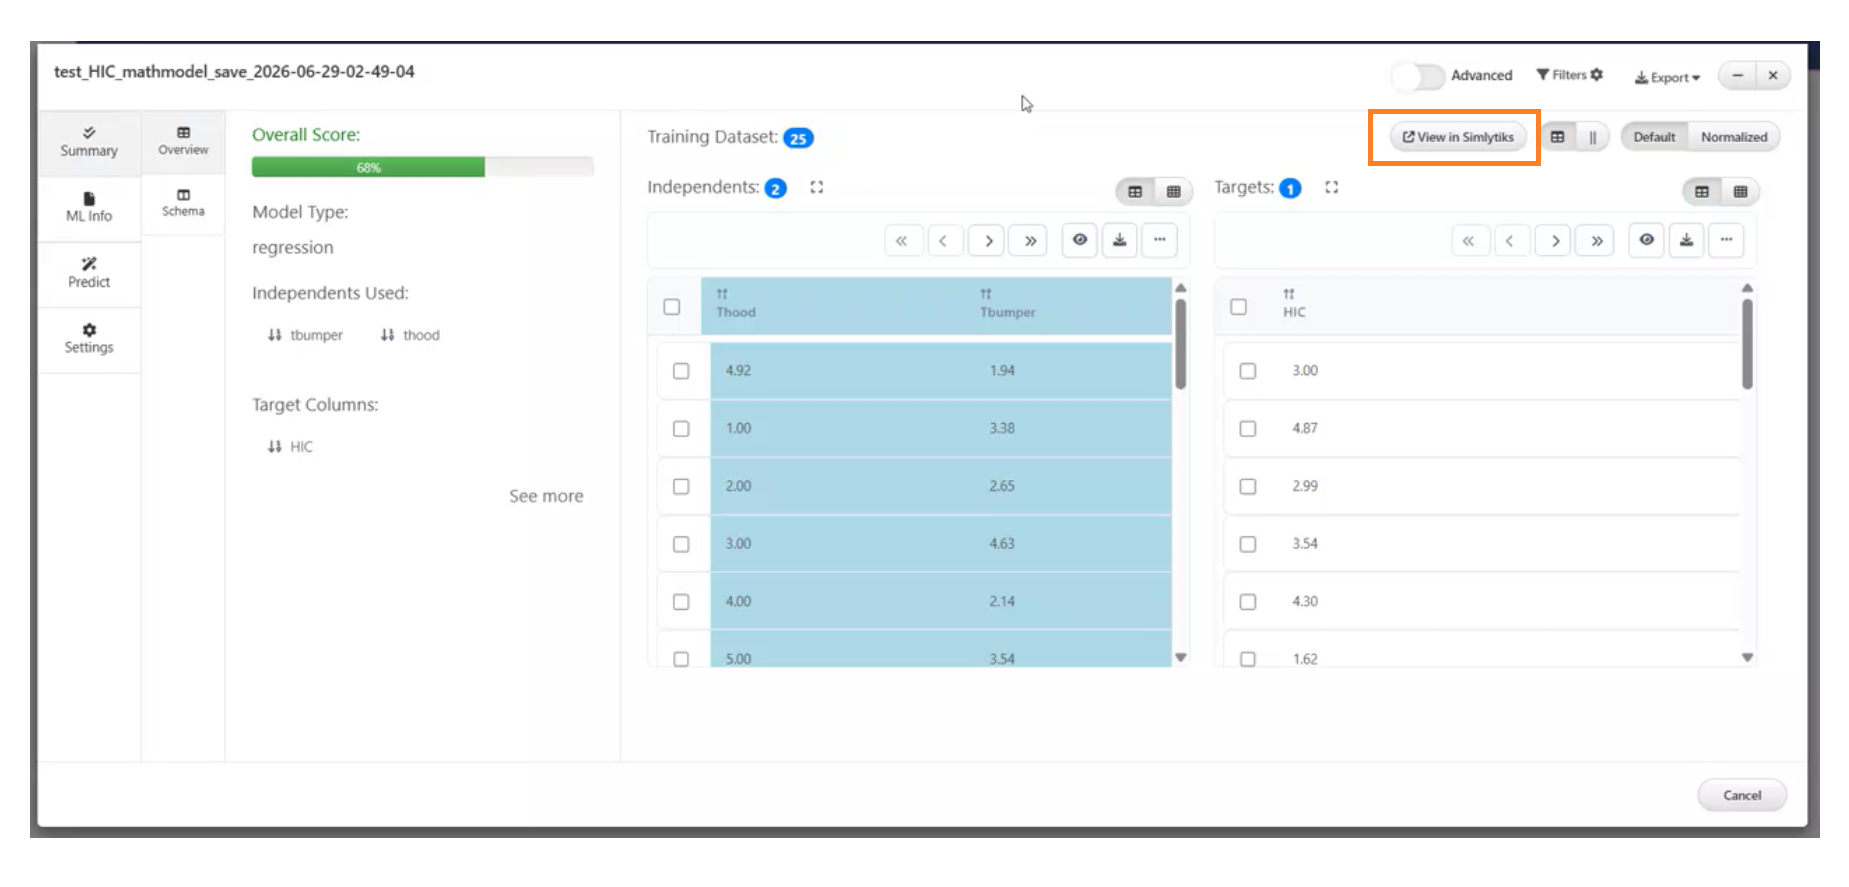
Math Model Dataset in Simlytiks
UI Ml models
New view is available to compare multiple ML Models with different features: 1. Summary with all the important attributes 2. ML Info, which has Raw vs Predictions data & Residuals and 3. Prediction tab which will predict for each of the model and generate a predicted data
On comparing multiple ML models, we can see the chosen datasets and its charts getting grouped and colored by the MODEL NAME attribute.
The Overview of Summary tab has 2 new buttons Default and Normalized to switch between the datasets.
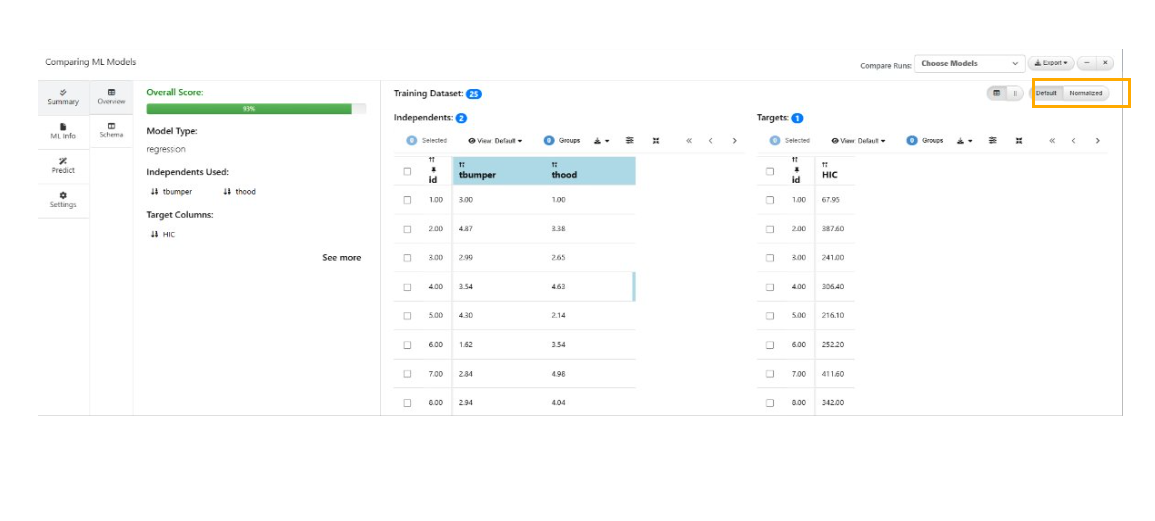
Default and Normalized
The Residuals tab in the ML Info tab will now show 3 new charts in the summary category where the Residuals chart (For curve columns) will show a Bar chart while Cross-plot of Independents vs Targets and Targets vs Predictions will now show a Scatter Matrix.
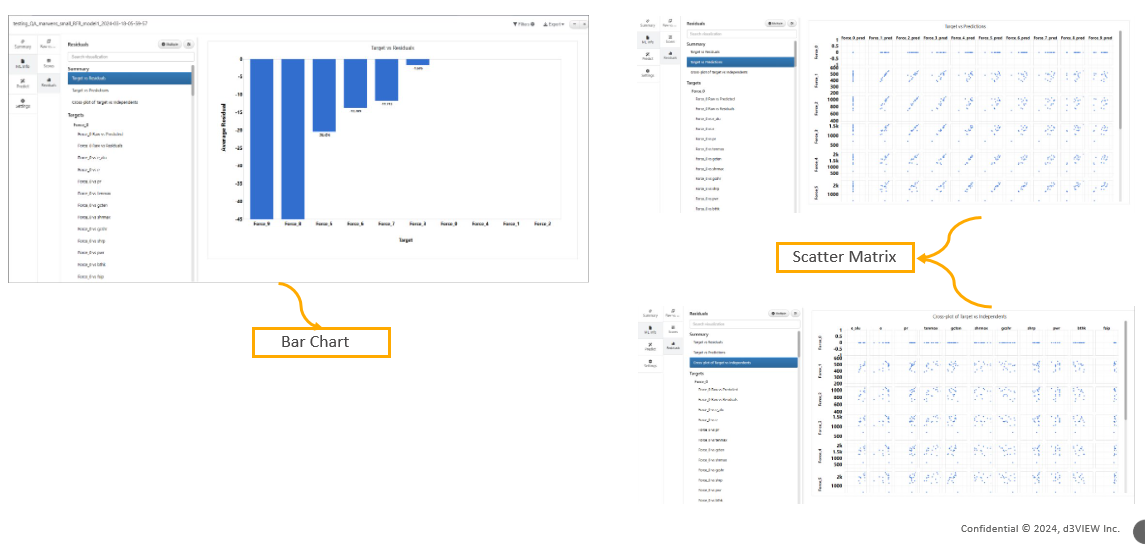
Residuals tab
The header is colored for all independent columns throughout the plugin.
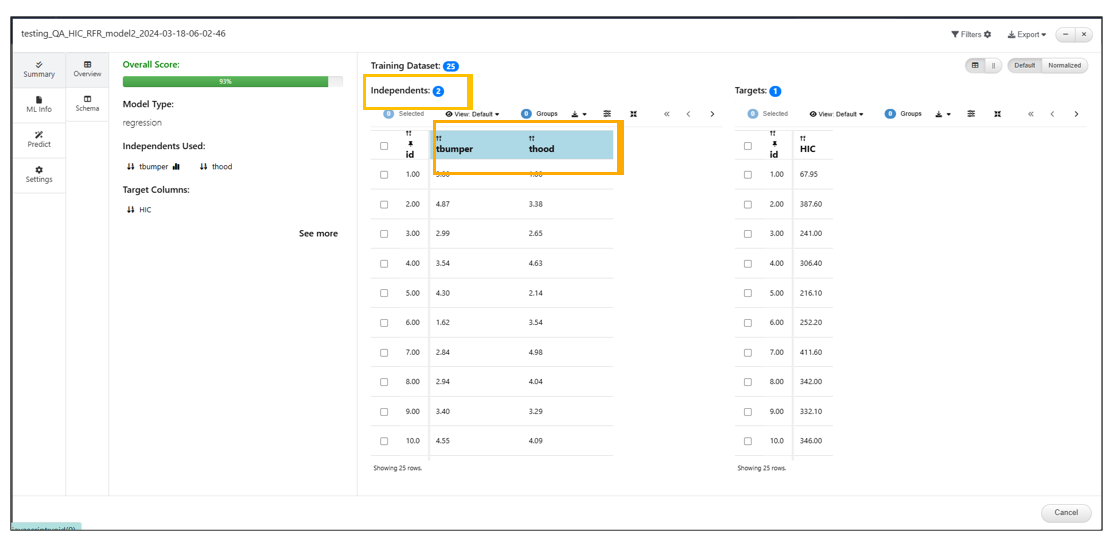
Header
The scatter matrix plots for the cross plot and Targets vs Predictions will now show a Transition button to animate from Scatter matrix to Heatmap. Also, transition buttons for every other chart (bubblechart) is available.
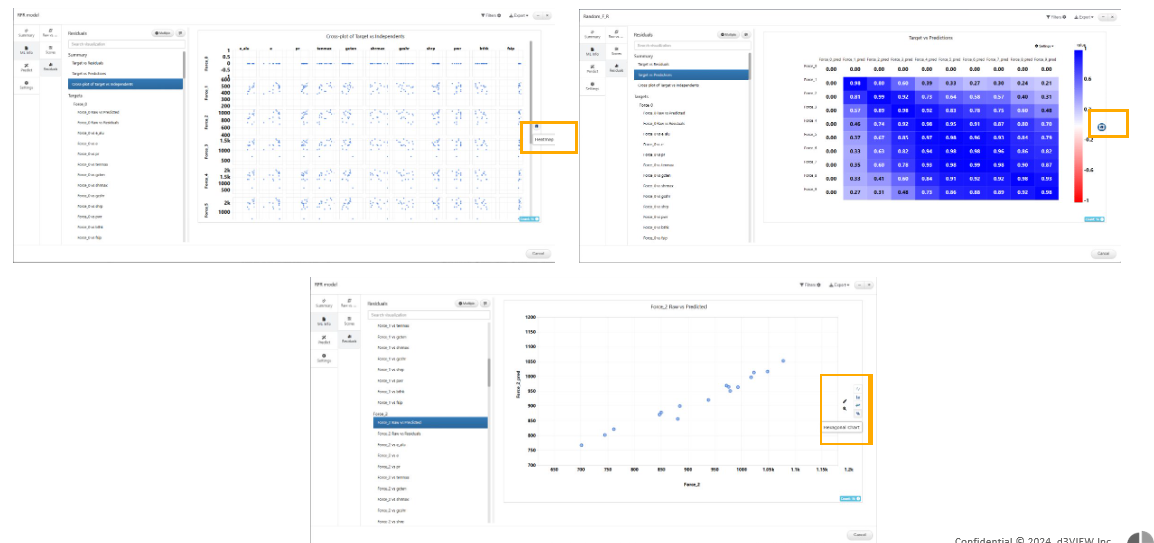
The scatter matrix plots for the cross plot
In the comparison window of ML Models, Nested table header (with row span and column span) is available to define Raw vs predictions in ML Info tab.
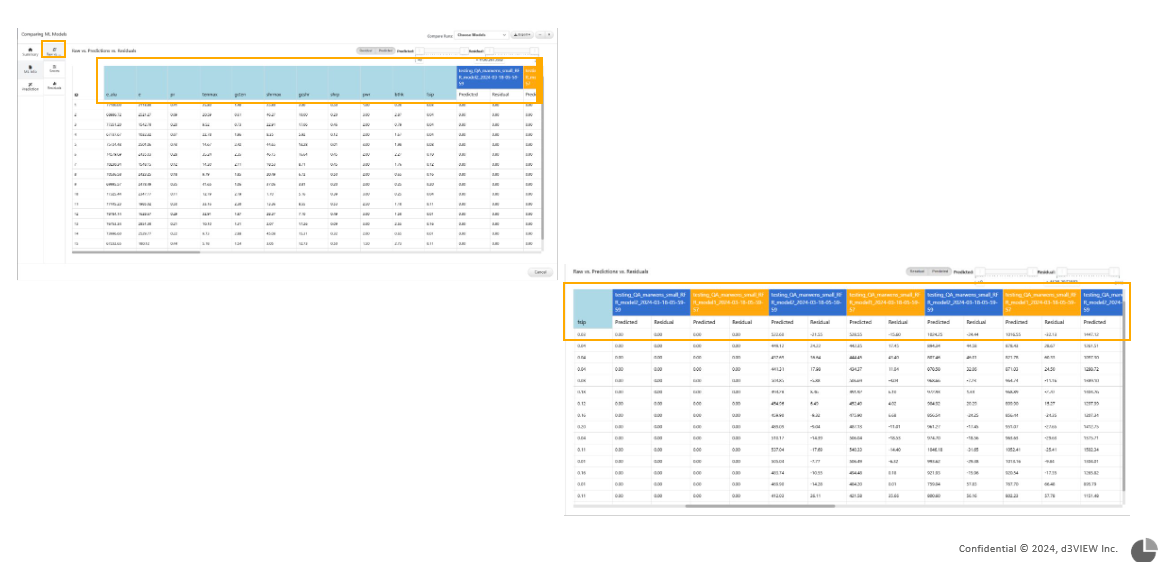
Nested table header
In the comparison window of ML Models, Independents and Targets category of Summary tab has new Search input option at the top. .. thumbnail:: /_images/Images/mlmodelssummarytabsummary.png
title: Header
Header
In the comparison window of ML Models, Scores tab in ML Info shows the nested table of Prediction scores and can also show based on the selected score type for each. .. video:: _static/movies/mlmodelsscorestabs.mp4
width: 100%
In the comparison window of ML Models, the Hybrid tab shows a Parallel chart of the Inputs on the left and on the right side we can toggle between either a curve or table, of the Targets. In this view, brushing on the left (Inputs)will update the chart on the right (Targets).
In the comparison window of ML Models, In the 3D category of Summary tab we can add multiple 3D scatter plot by giving different inputs for xBy, yBy and ZBy.
Summary tab charts in ML Single model viewer now interact with each other i.e. brushing in inputs chart will highlight target table rows OR target curves (if Targets is switched to curve view) and vice versa.
Option to pin IDs within the ID column is now available for all the tables across the ML model viewer
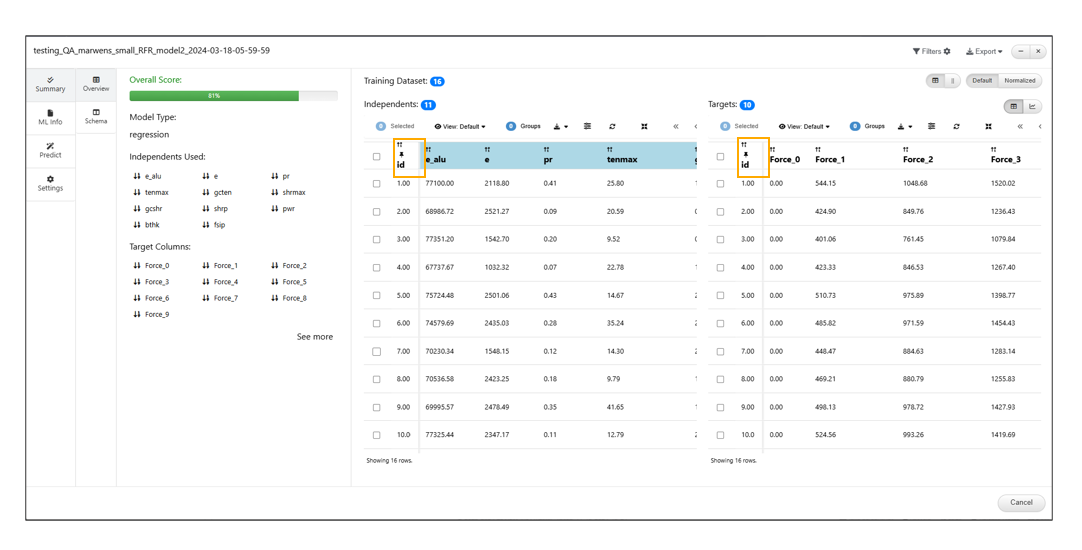
ID column
In the comparison window of ML Models, Custom charts can be added in the Residuals category of ML Info tab.
28.3. Saved Math model
A new Math model Polymer strain rate is now available in AI models page. Below screen shots shows us the steps to access and predict values in this Math model.

Polymer Strain rate saved Math model
Predict values.

Predict values
Running Predictions in the saved Model
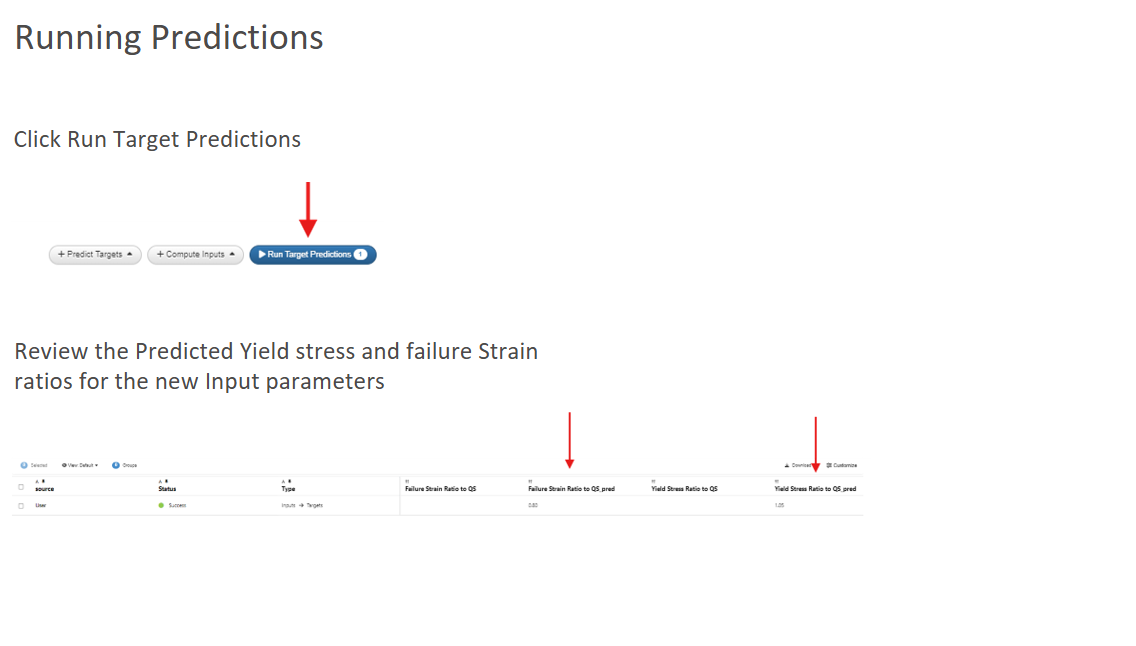
Running Predictions
ML Models Prediction table will now have a new column called ‘IsValid?’ which will show Valid or Invalid flag for a row based on whether the inputs are valid or duplicate value.
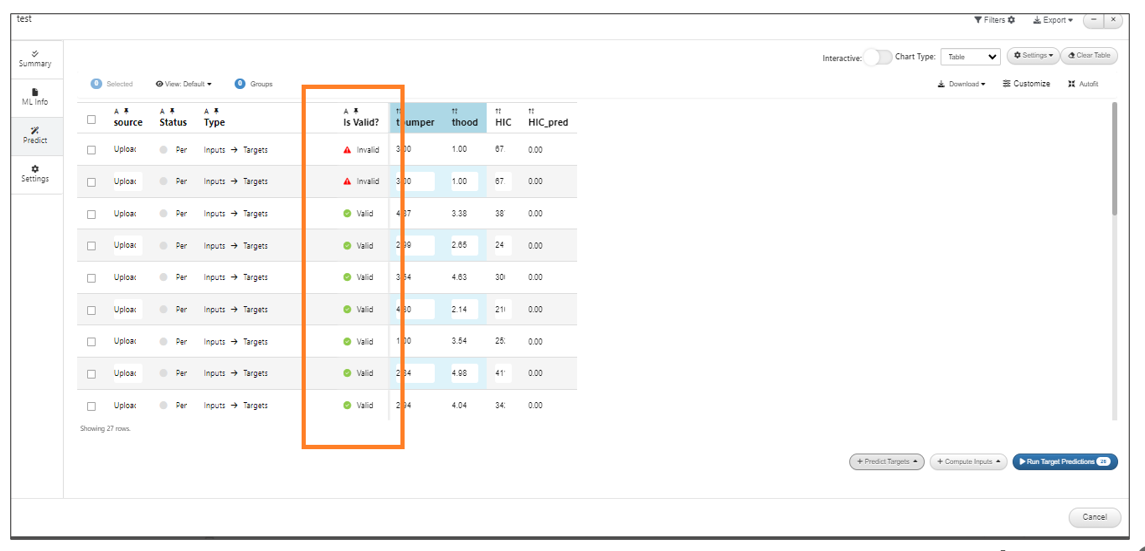
new column called IsValid?
ML Models will now support dropping of a CSV onto the interactive sliders container and predict data from them.
New Name column is added to the prediction tab of ML Models which will show as a legend in the predicted curves in the same color as that of the Curve.
In ML Models, new option is available in the context menu to remove the old predictions from the table.
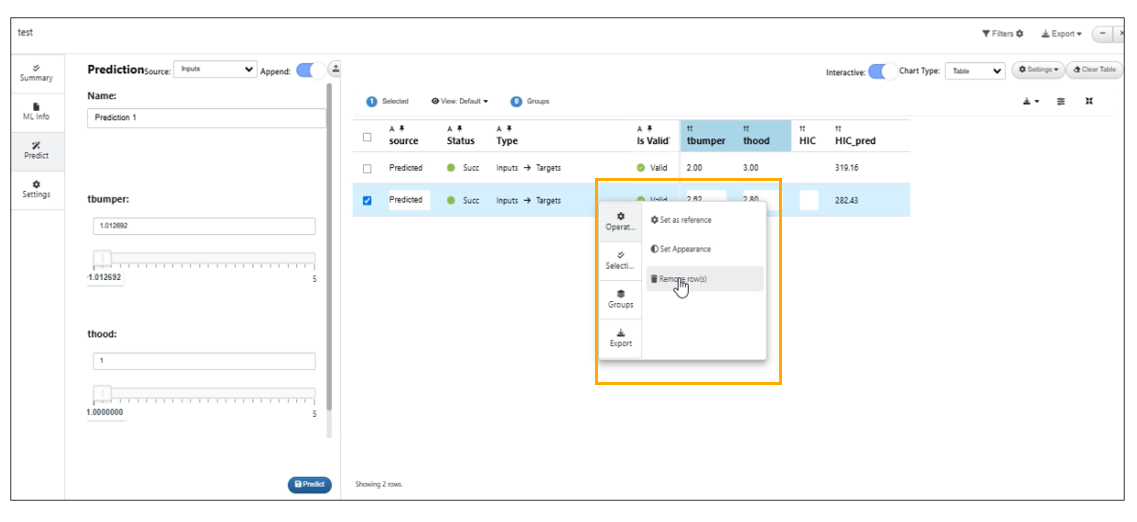
Context menu to remove the old predictions
Training/Target datasets have an enlarge button to render the tables in full screen for ML models.
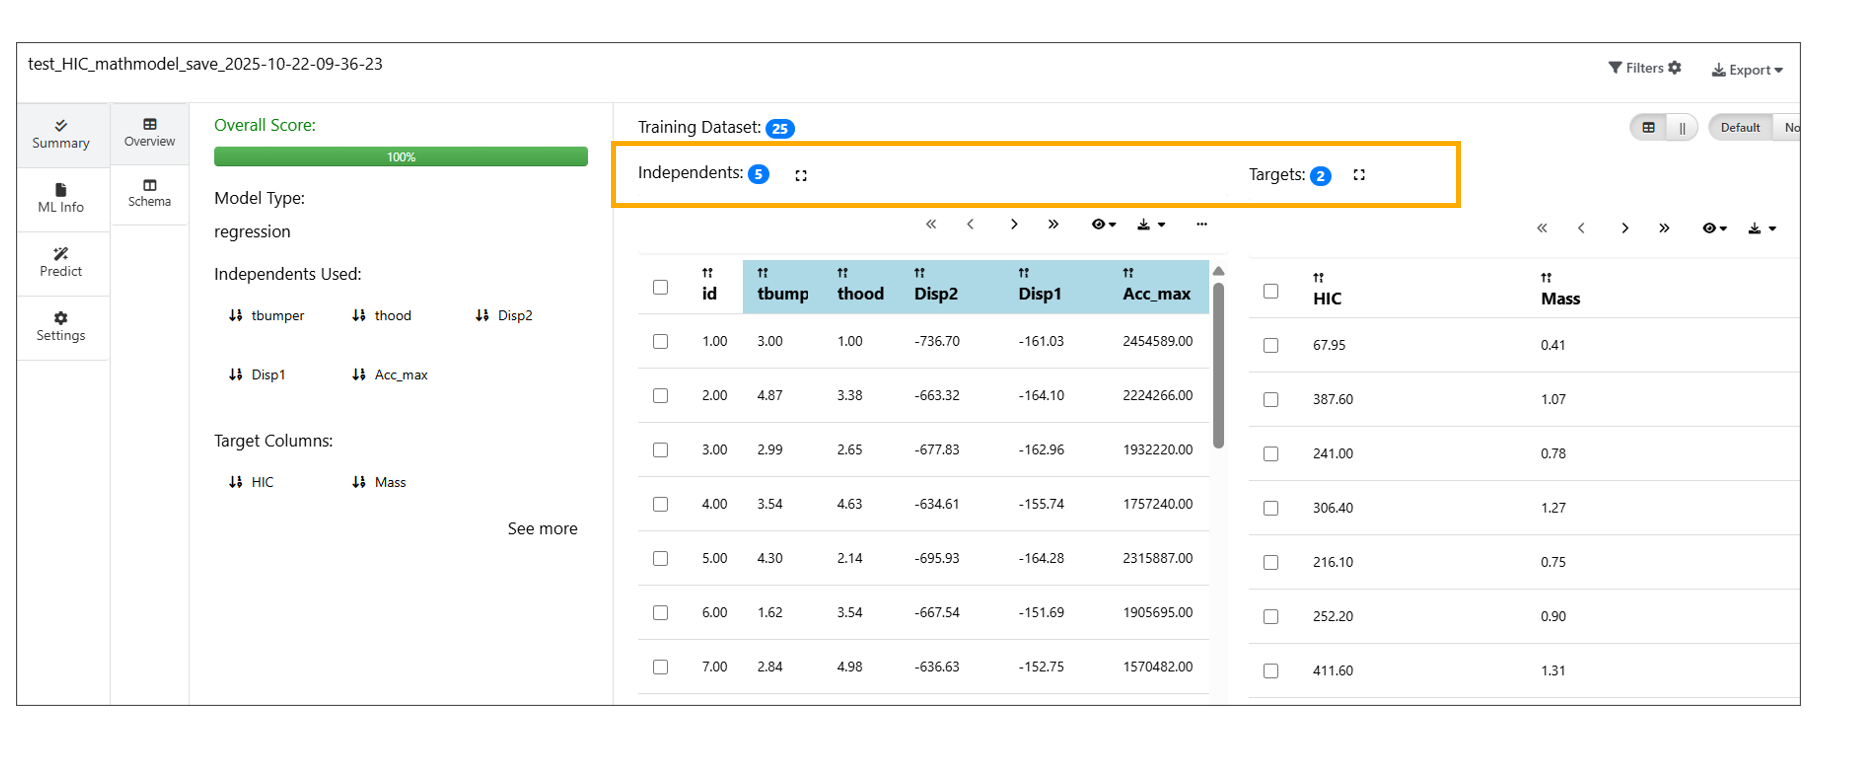
Enlarge button
Prediction Curves for Curve Inputs
Prediction curves are now generated for ML models that include curve inputs (i.e., inputs prefixed with YY_), even if the models do not have curve targets.
This enhancement improves model interpretability by providing deeper insights into how curve-based input features influence prediction.
Predictions table
In ML Prediction table, rows added for verification using context menu options will now display a star icon.
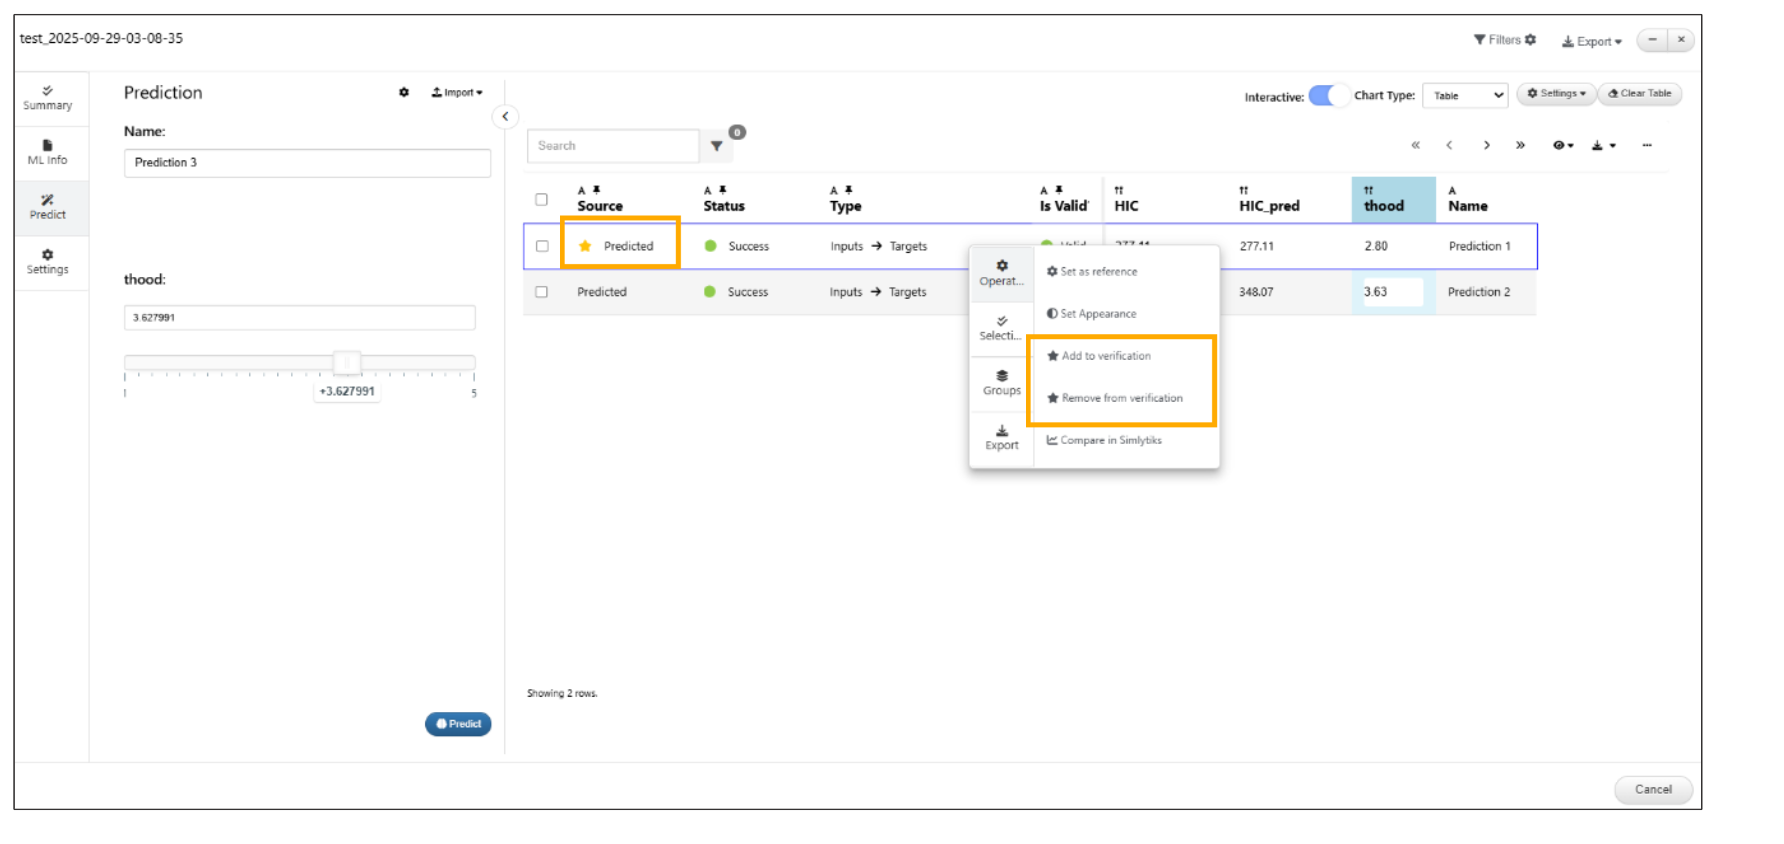
Mlmodel verification
Column resizing is now smoother for ML Model View / Prediction Table.
Enlarge option is available in Prediction table for ML models
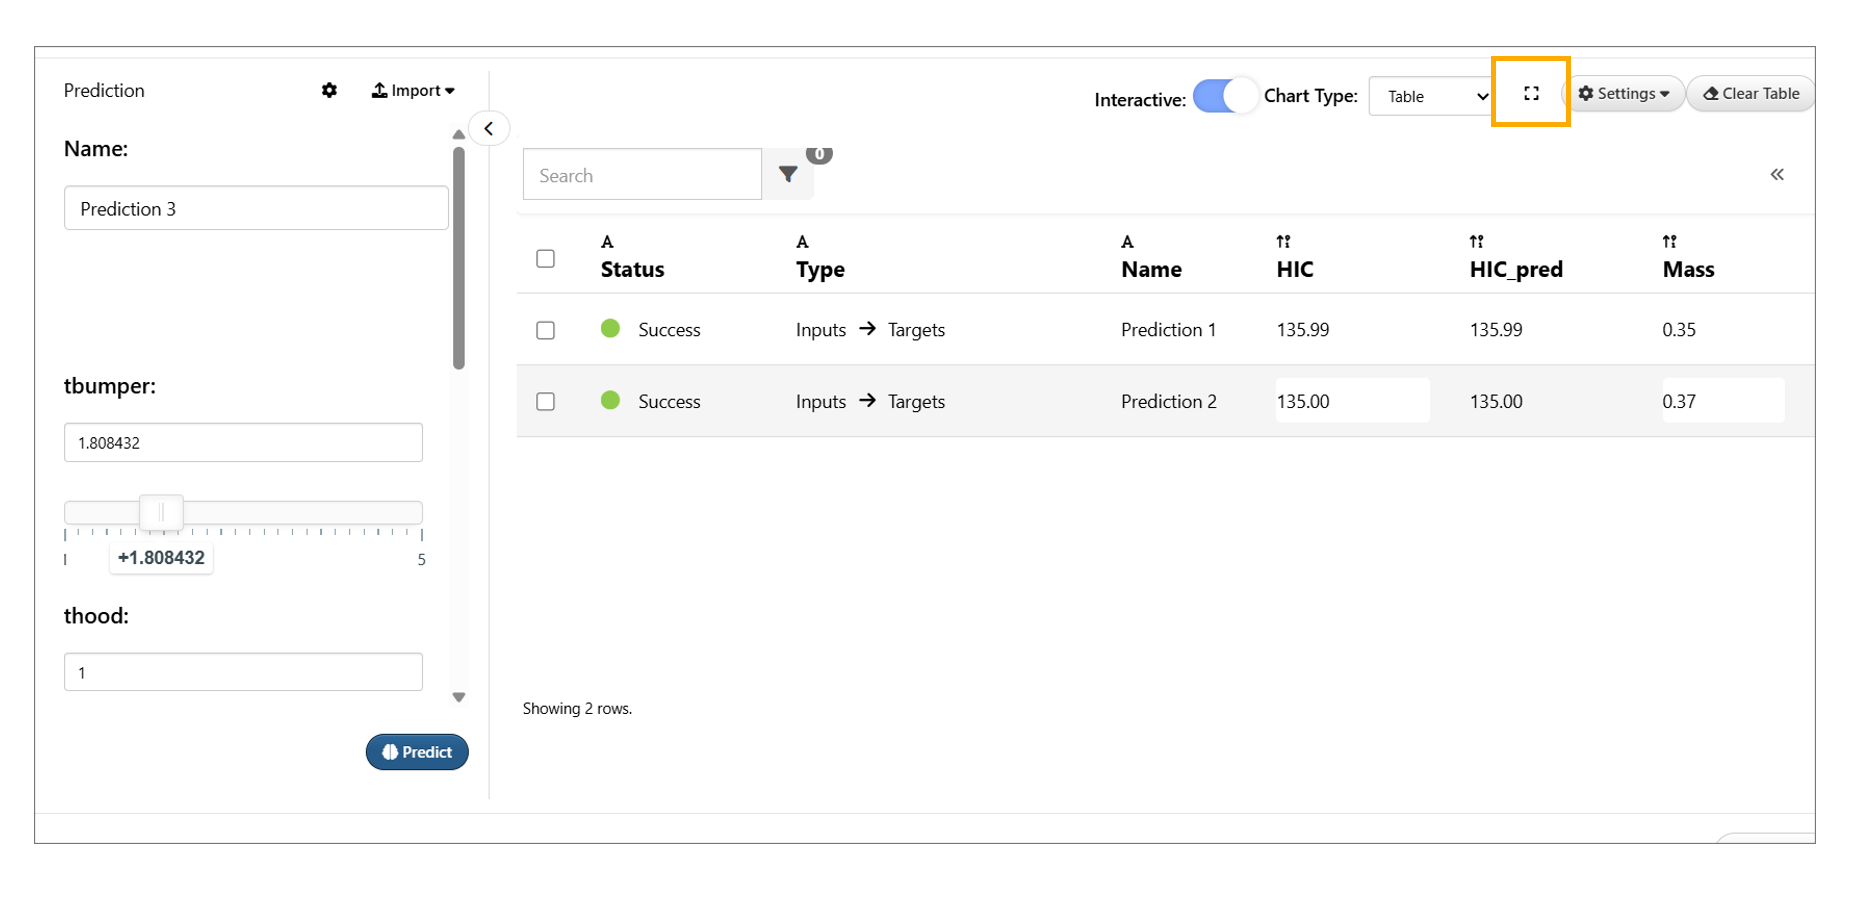
Enlarge Option
Import Curve option is now available for all math models in the Predictions tab.
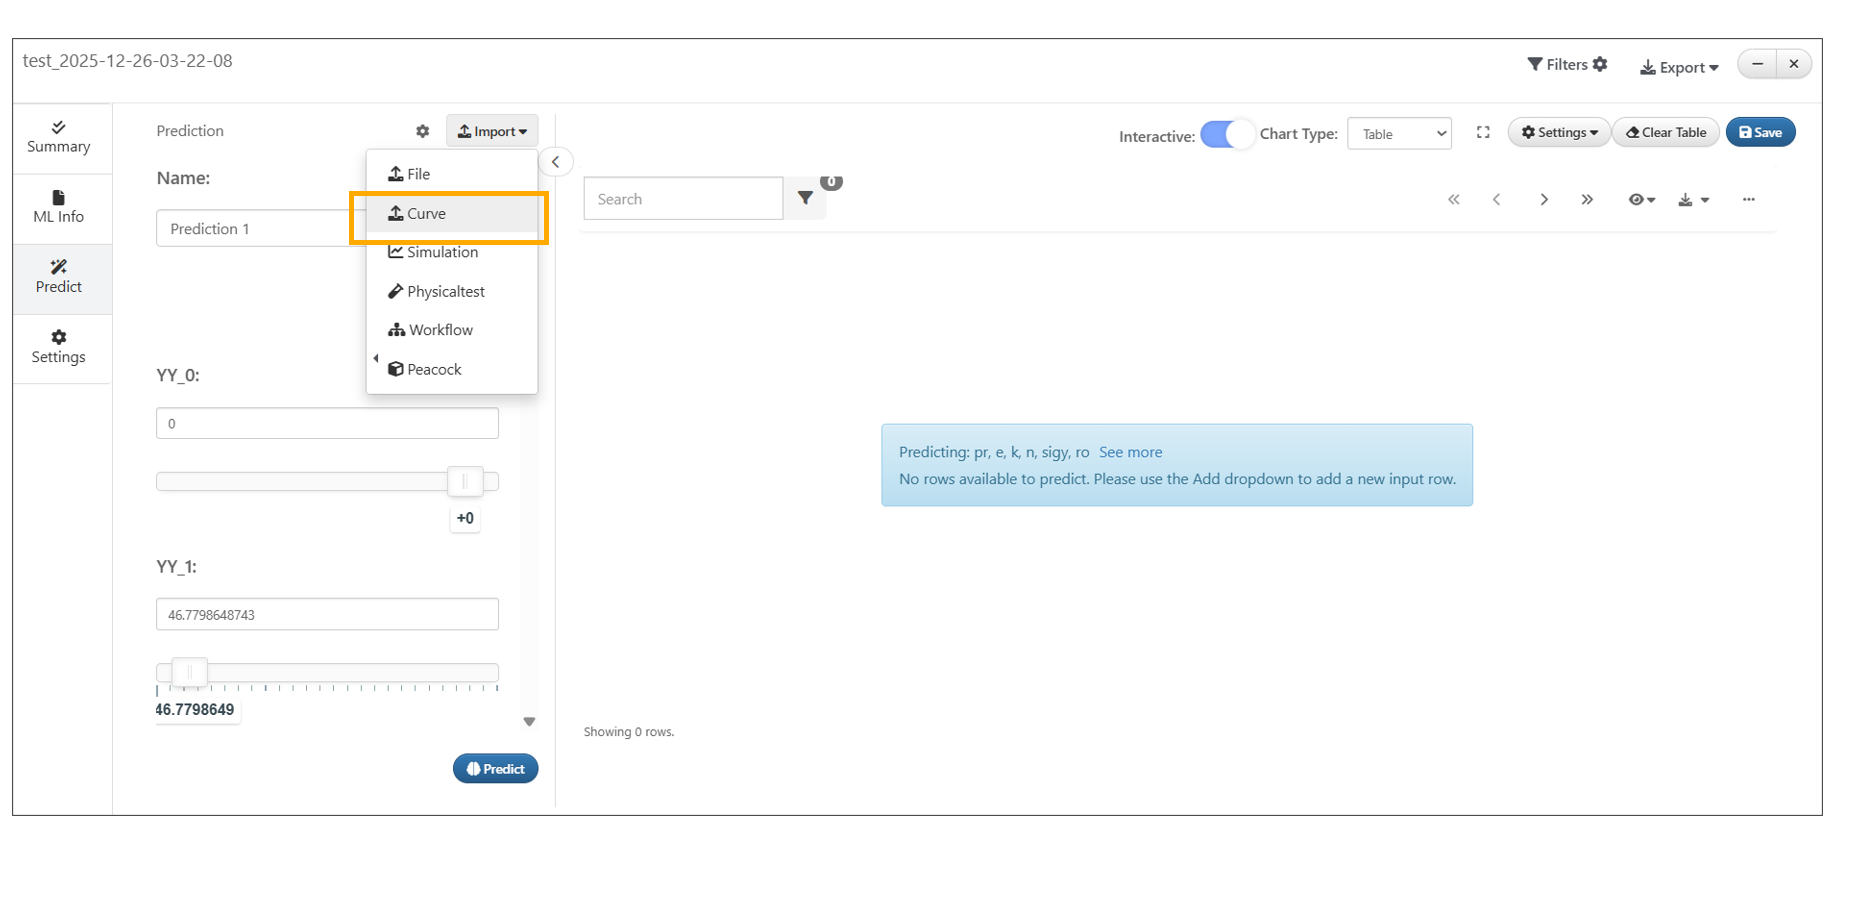
Import Curve option
28.4. Settings
ML saved Model has new Settings where the view type can be changed to either Simple or Advanced or Configurable where a permissions table will be shown to select different views to be toggled.
ML Models settings tab has a new setting to decide the X_PREFIX that will be used for input curves and prediction curves.

X_PREFIX
Added support to ML models for categorical independents (inputs) to be selected in Predict Targets list.
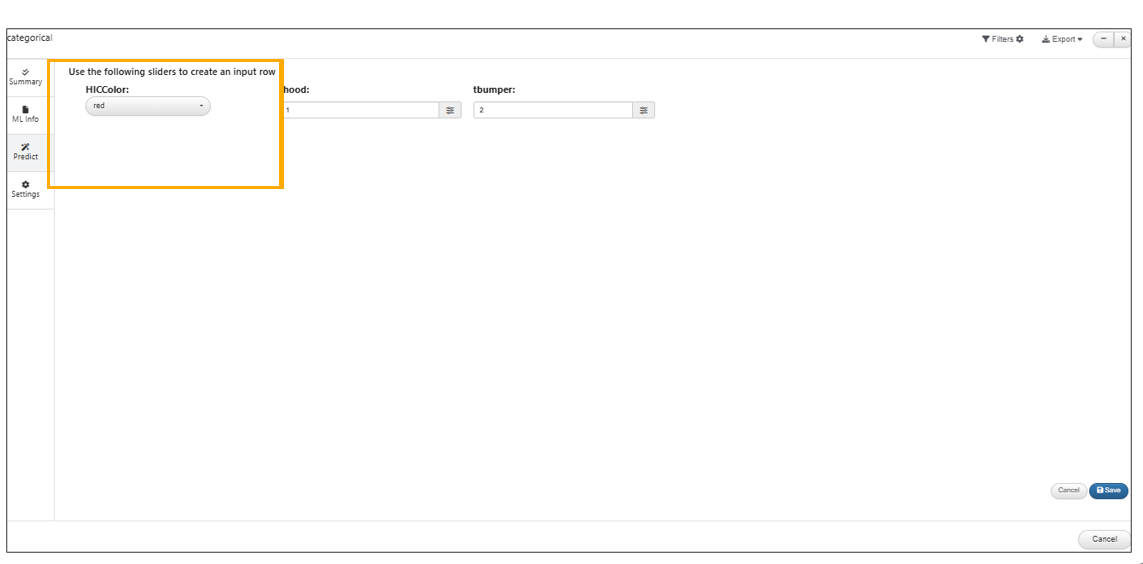
ML models for categorical independents
Added support in ML Models for multi-curve targets which can now be specified within Settings tab as <Column_YY> which will render the curves in a grid view.
New options in Predict tab -> Settings dropdown to show items in carousel, add/remove input curves, add/remove reference curves, color the curves based on difference with reference curves, etc. is available.
ML saved models now auto detect the targets/prefixes and show them in the settings tab in the model.
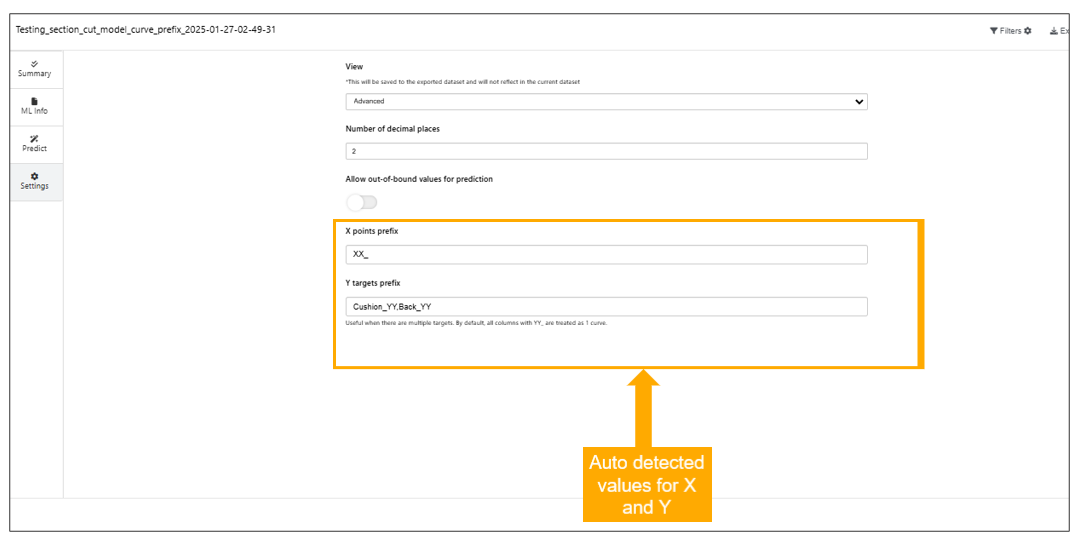
Targets/prefixes
In ML Models, the settings option is displayed after we change the chart type to other types.
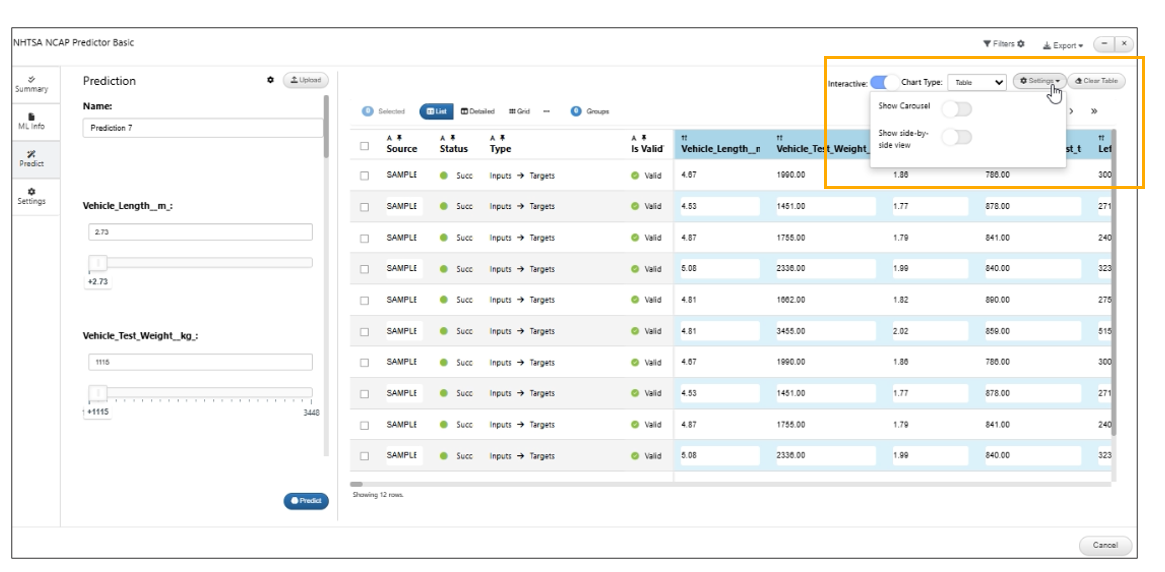
Settings option
Matrix columns
In ML Models, new option called Matrix Columns is added to settings which will be used in Heatmap of the Curveplot.
28.5. Export Bulk
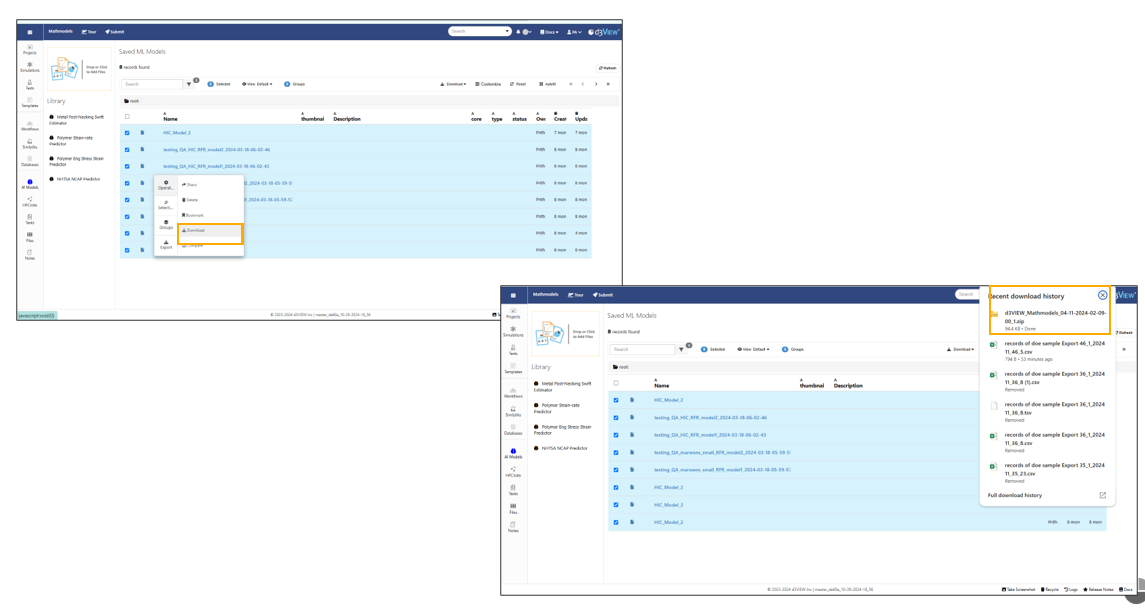
Bulk Export
Single or multiple ML models can be exported as desired.
Export as PPT and Export as Word are available for ML models.
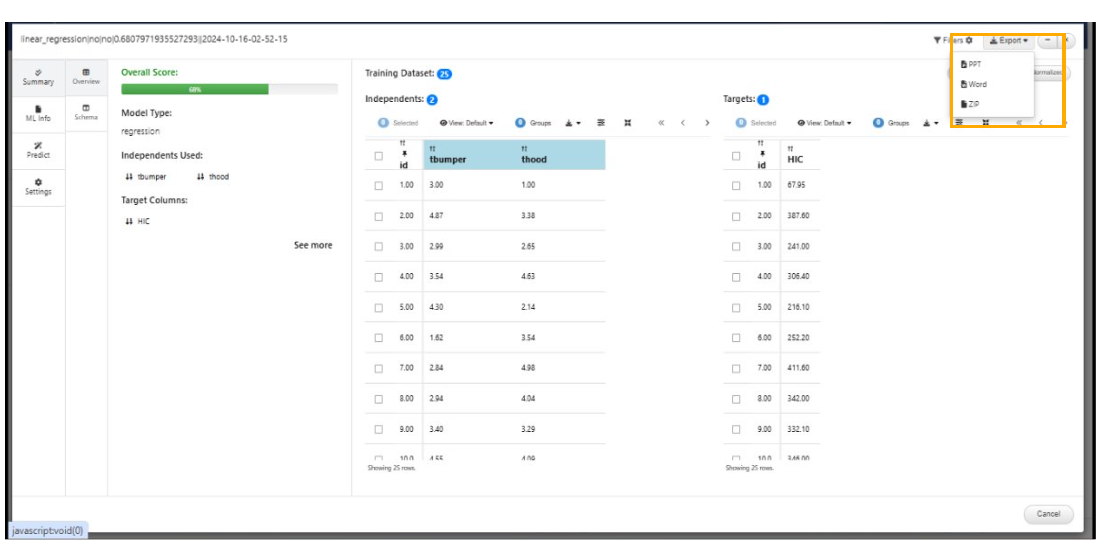
Export as PPT/word
28.6. Ml Model chart options
For ML Math Model without Curve dataset, Prediction of Target columns along with options for viewing of different chart types is available in the Prediction tab.
For a non-curve model (say scalar predictions: HIC dataset), the Coefficients tab within the ML Info tab, will now show the coefficients table.
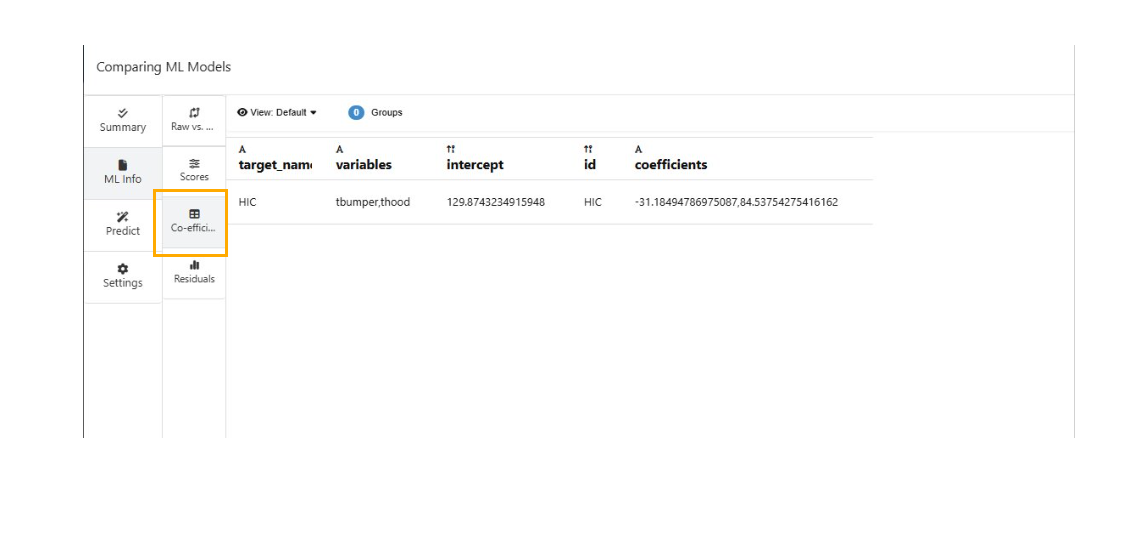
Coefficients tab within the ML Info
In ML Models with curve dataset, Predict tab -> Table view has context menu options 1. Set as a reference and 2. Set as appearance (colors ) settings for the curves.
In the comparison window of ML Models, Summary Tab has new chart types for Independents, Targets and other options in the header.
In the comparison window of ML Models, Targets category of Summary tab has options to Switch to Curves and to show Box plots as Merged or Segregated.
In the comparison window of ML Models, In the prediction tab, there is a new option shown at the top ‘Select a reference to show difference’. If chosen, the table reformats to show the difference in the prediction values of other models w.r.t the reference and corresponding directed arrows.
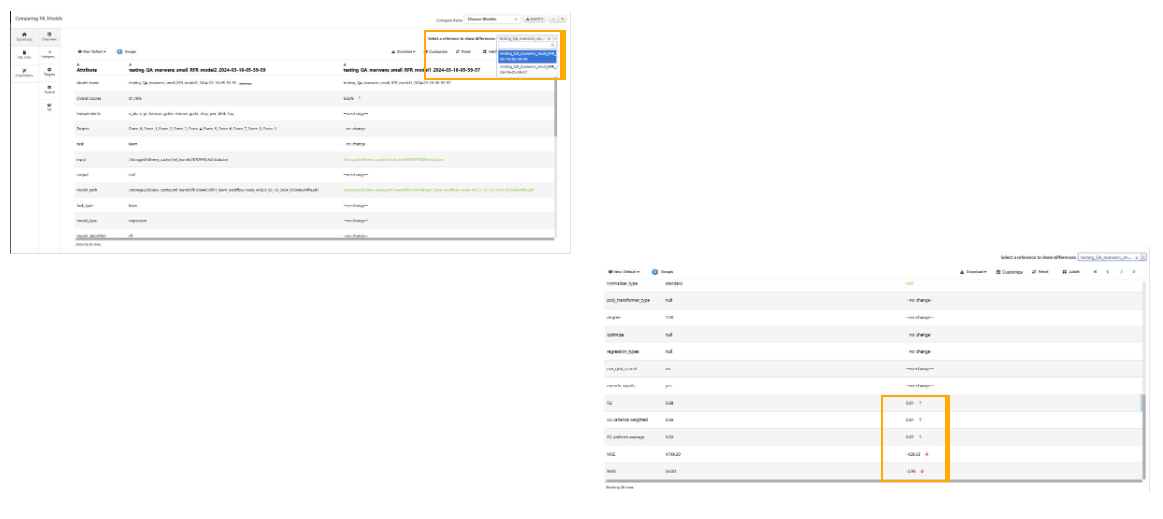
Select a reference to show difference
If ML Model Viewer with a reference dataset is executed and viewed, the Prediction tab will now show the reference data automatically. Once manual data (for prediction) is added to the table, In 3D scatter, we can see the difference between the points present from reference data, the predicted data and the raw data (added from Settings dropdown) colored by the corresponding source.
Changes made within the ML Model Curve Viewer (i.e. colors or axis changes) are now saved as settings which will be carried over to either Side-by-side view OR Carousel view.
Filters
ML Models header now has a button called Filters which will open the Simlytiks Filters sidebar view allowing adding/removing filters. Any changes made in this view, will re-render the tables in Summary tab, Raw vs Predictions and Charts in Residual tab.
Curves
In the predict tab of a ML Model, we can see the predicted curve will show context information about the inputs used on right click as in the case of Curve plot .
28.7. Library
Polymer strain-rate Predictor is now added to the ML Models library.
Added Polymer Eng Stress Strain Predictor as one of the AI models in the library.
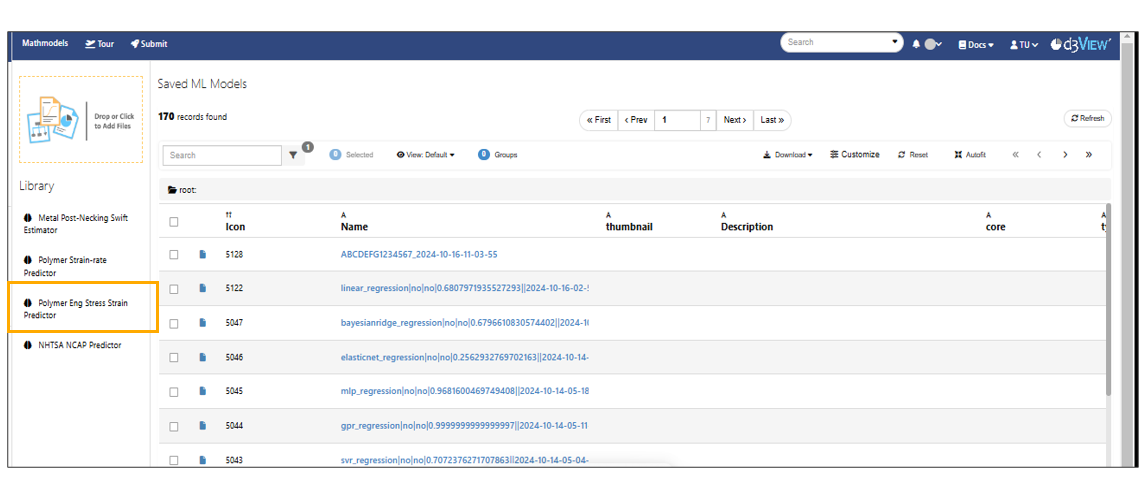
Eng Stress Strain Predictor
New AI model NHTSA NCAP is available in saved ML models page Library.
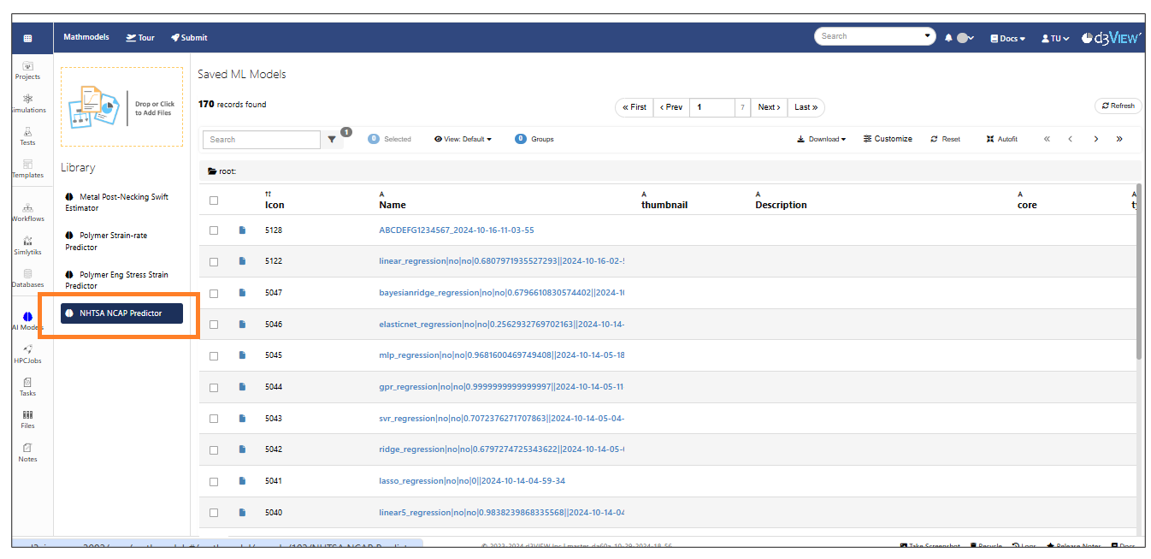
NHTSA NCAP
New saved model NHTSA ADVANCED is added to the Library of AI models.
New AI model called Polymer Classifier is added to the library of ML models page.
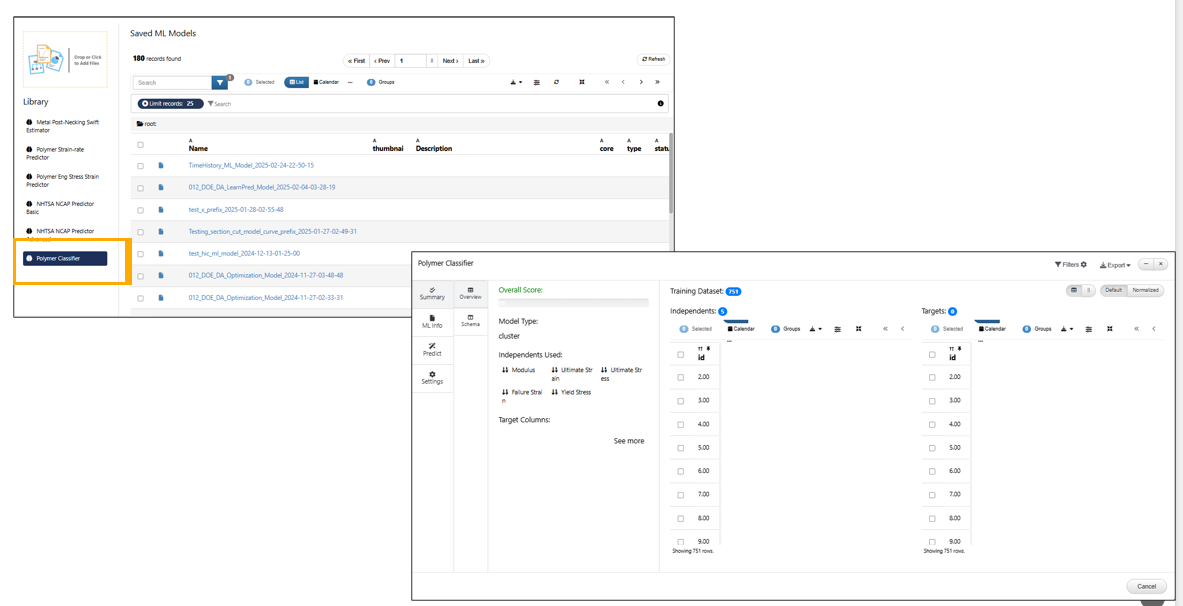
Polymer Classifier
‘NHTSA NCAP Predictor Barrier Force’ model is added to AI Models Library
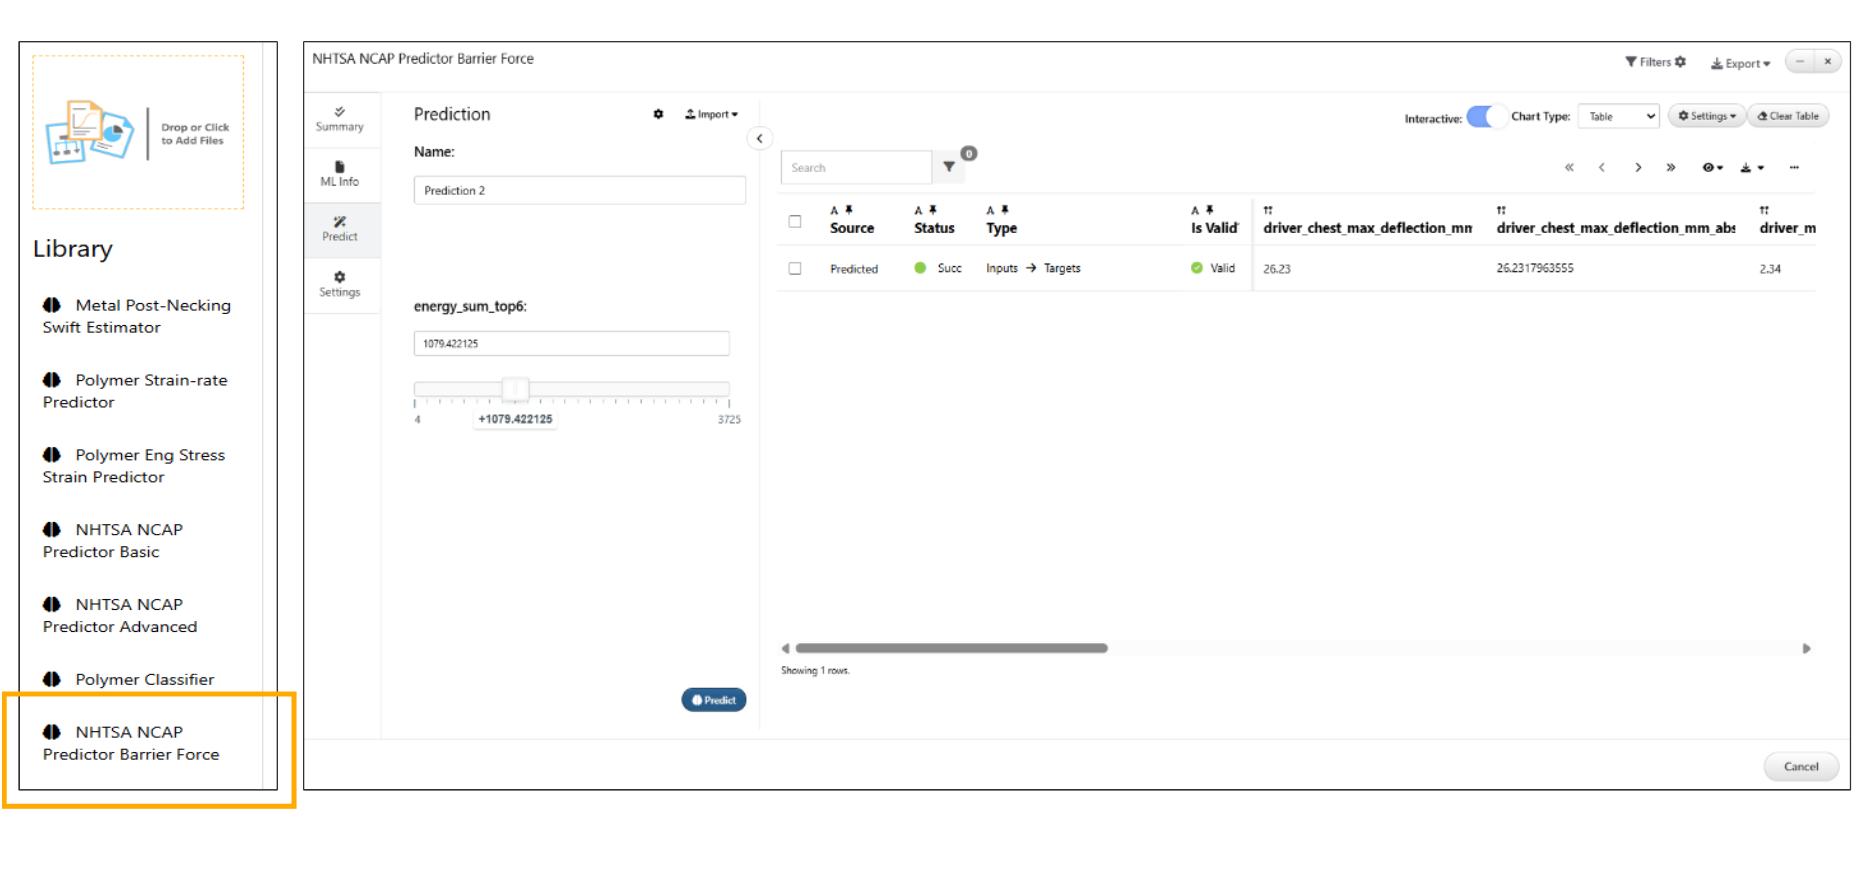
Barrier force predictor
New AI model 107 is added to the library for predicting spot weld failures in saved ML Models page.
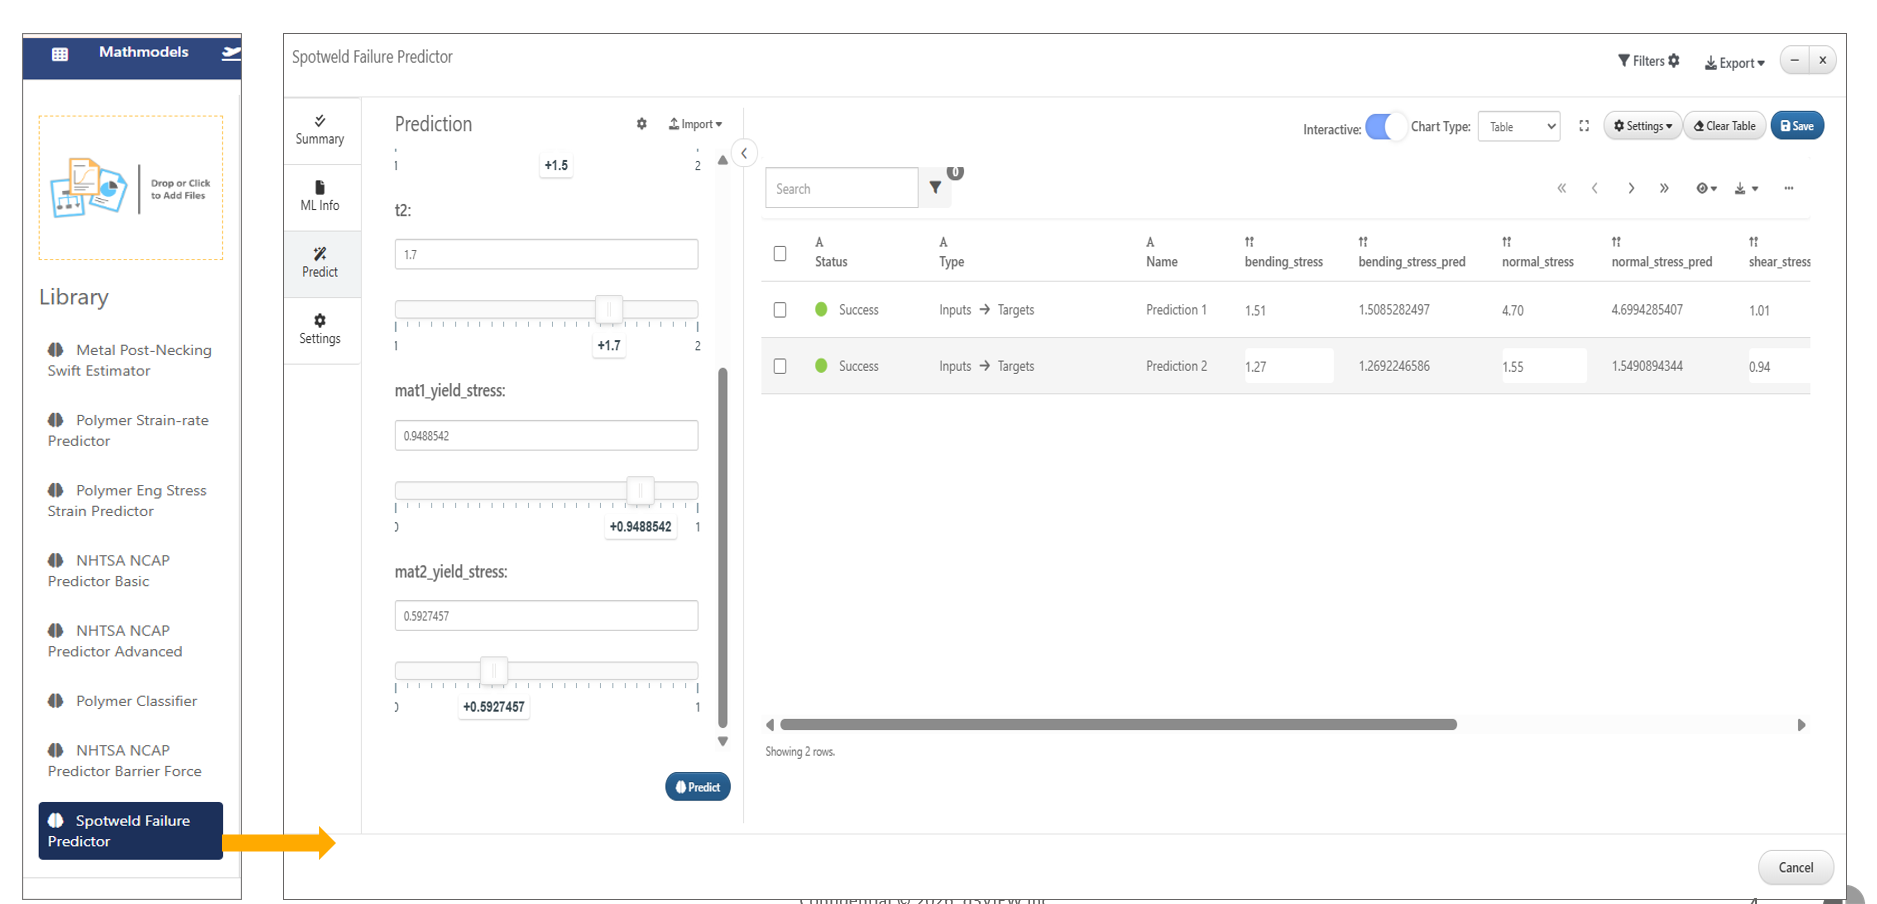
Spot weld failures
Interactive
The interactive mode which is default in saved ML models will now show the sample predict curves when opened.
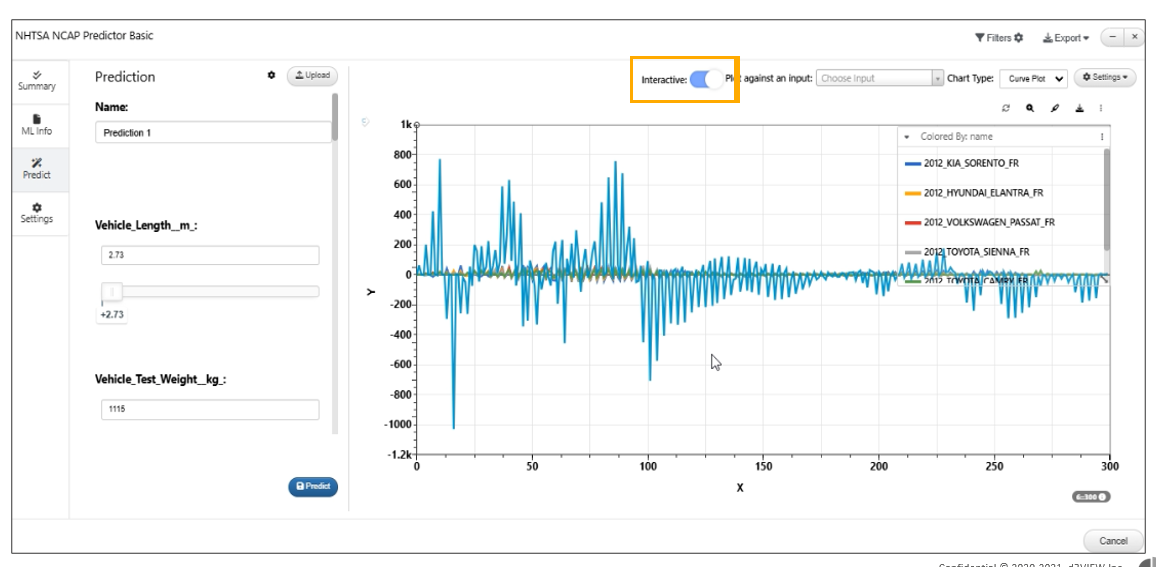
interactive mode
In ML models interactive mode, Predict button will disable the inputs and turn into stop button when clicked where we can stop the prediction and update the changes.
28.8. ML_LEARN_AUTO
In ML_LEARN_AUTO worker → A new input option “Skip including training data in model input” is available.
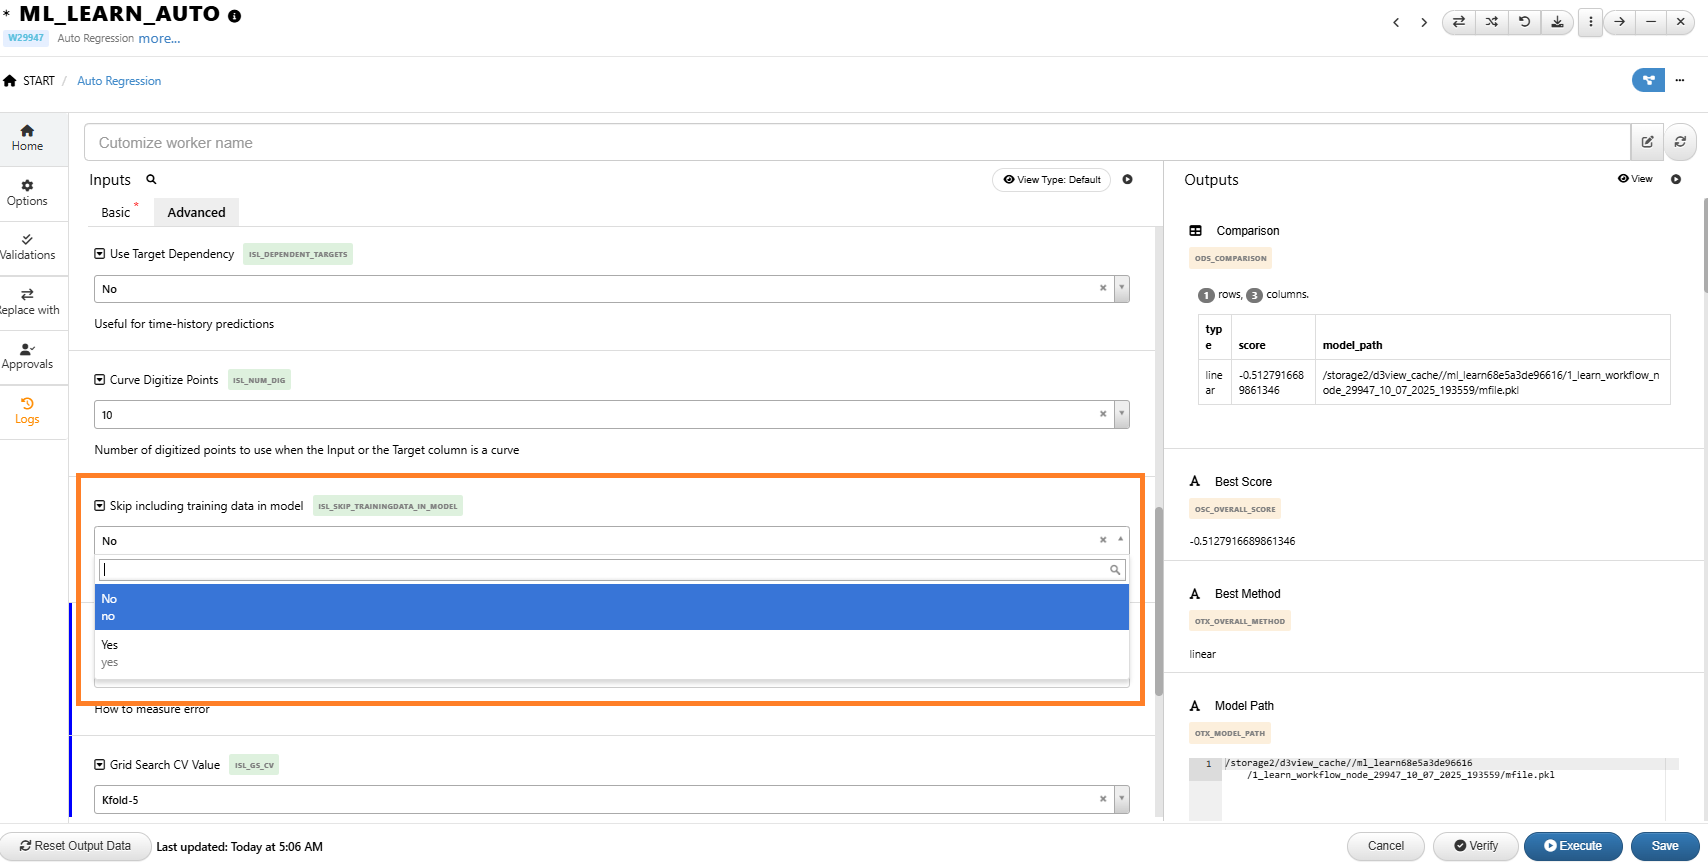
:sup:`Skip including training data in model `
When this input is set to No, the saved ML model will include the training data, and the Predicted Table output will display the corresponding results when used from the ML_LEARN_AUTO worker.
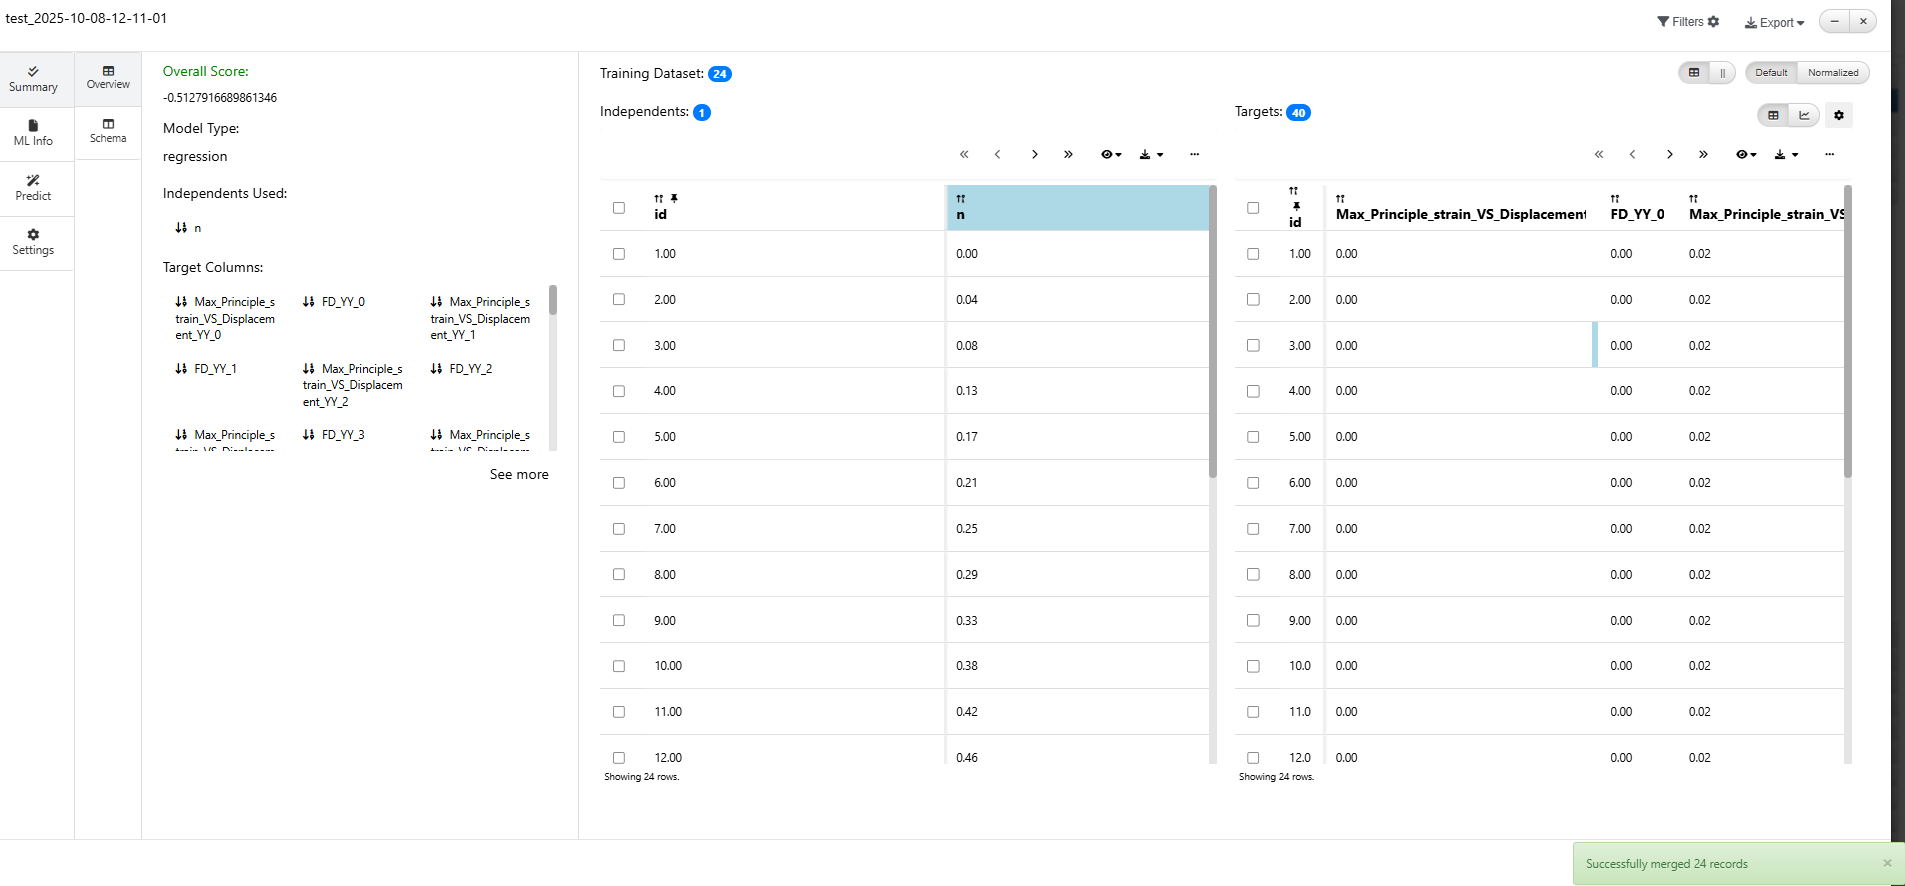
:sup:`Skip including training data in model `
When this input is set to Yes, the training data will be excluded from the saved model, and the Predicted Table output will not display any data.
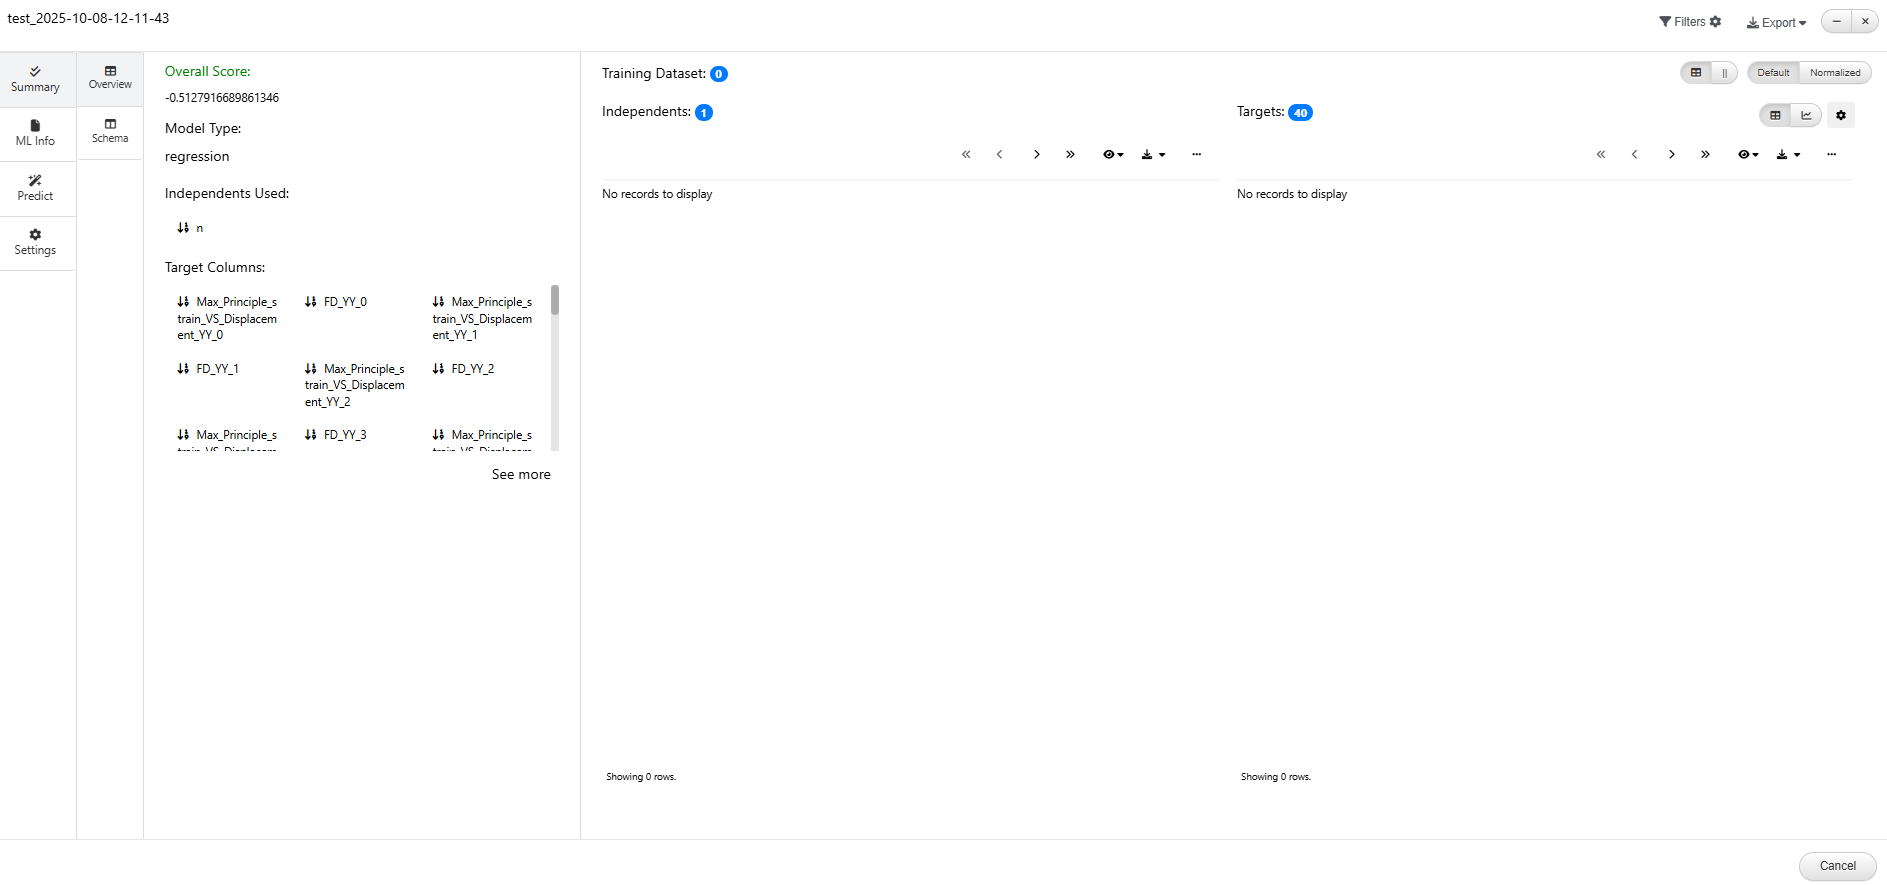
:sup:`Skip including training data in model `
28.9. New ML Model Investigation
New Landing View Added for ML Investigation Models
Overview
A new landing view has been introduced for ML Investigation Models, providing a consistent starting point whenever an ML model is opened.
By default, the landing view displays five tabs, with the first tab, Model Summary, presenting an overview of the model, including its independent variables (inputs) and target variables (outputs).
Key Features
- Added a new landing view for ML Investigation Models
- Displays five tabs by default when an ML model is opened
- Introduces a Model Summary tab as the default view
- Shows the model’s independent variables (inputs)
- Displays the model’s target variables (outputs)
Raw & Predicted Values and Model Precision Tabs Added to ML Investigation
Overview
The ML Investigation Model landing view now includes dedicated tabs for Raw & Predicted Values and Model Precision, providing deeper insight into model performance.
The Raw & Predicted Values tab enables users to compare actual and predicted values, while the Model Precision tab presents model performance metrics, making it easier to evaluate prediction accuracy and overall model quality.
Key Features
- Added a Raw & Predicted Values tab to the ML Investigation landing view
- Added a Model Precision tab for model performance evaluation
- Displays actual and predicted values for comparison
- Presents model precision metrics in a dedicated view
- Simplifies assessment of model prediction accuracy
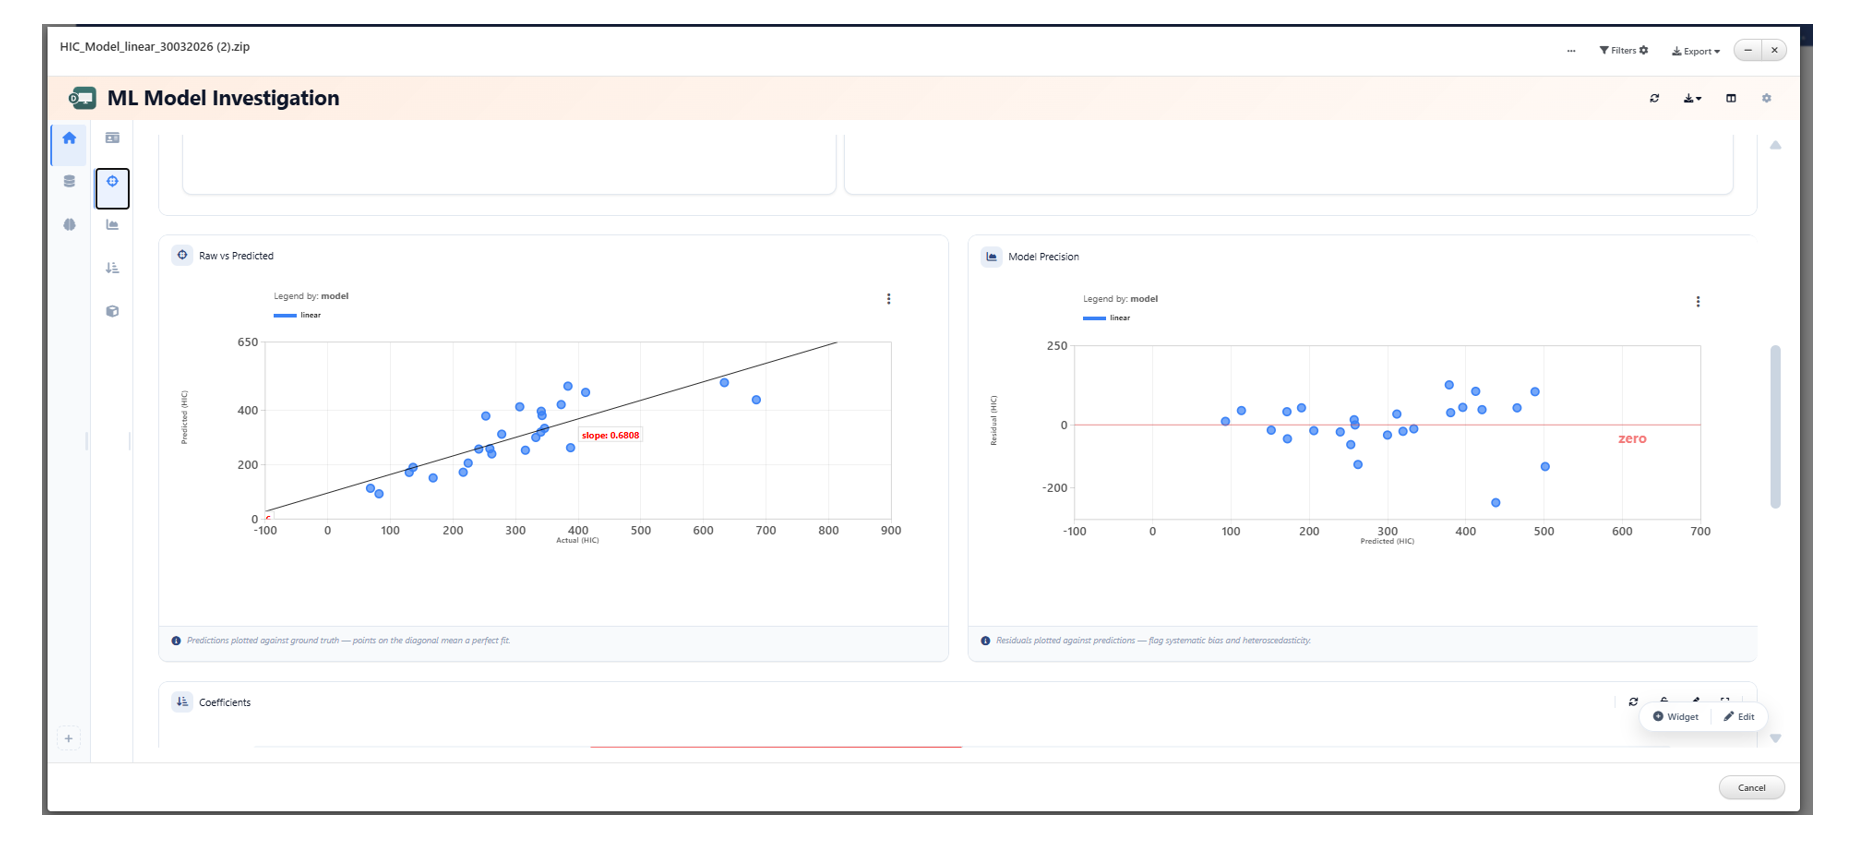
Raw & Predicted Values and Model Precision
Coefficients Tab Added to ML Investigation Models
Overview
The ML Investigation Model landing view now includes a Coefficients tab, providing a visual representation of the model’s coefficients.
The tab displays the coefficients as a bar chart, making it easy to understand the relative contribution of each input variable to the model and identify the most influential features.
Key Features
- Added a Coefficients tab to the ML Investigation landing view
- Displays model coefficients as a bar chart
- Visualizes the contribution of each input variable
- Enables quick identification of influential model features
- Improves interpretability of machine learning models
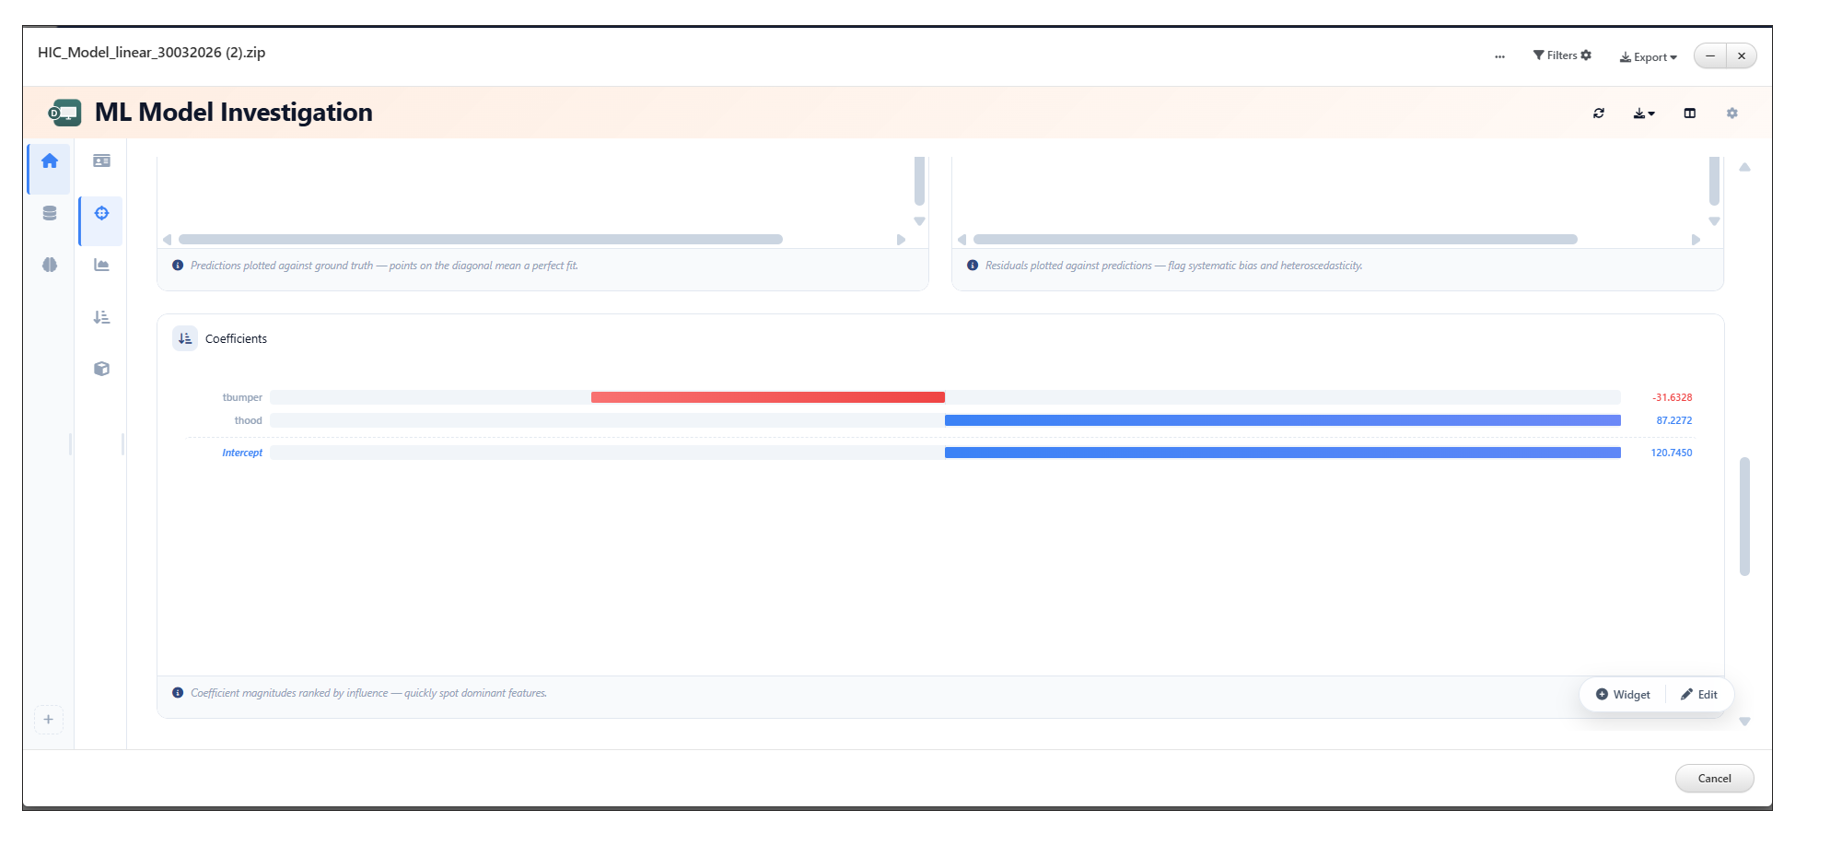
Coefficients
Predicted Surface Tab Added to ML Investigation Models
Overview
The ML Investigation Model landing view now includes a Predicted Surface tab, providing an interactive visualization of the model’s predicted response.
The tab displays a 3D scatter plot with the model’s predicted surface overlaid on the raw data, allowing users to easily compare predictions against the original dataset and better understand model behavior.
Key Features
- Added a Predicted Surface tab to the ML Investigation landing view
- Displays an interactive 3D scatter plot
- Overlays the predicted surface on the raw data
- Enables comparison of predicted and original data
- Provides interactive exploration of model behavior
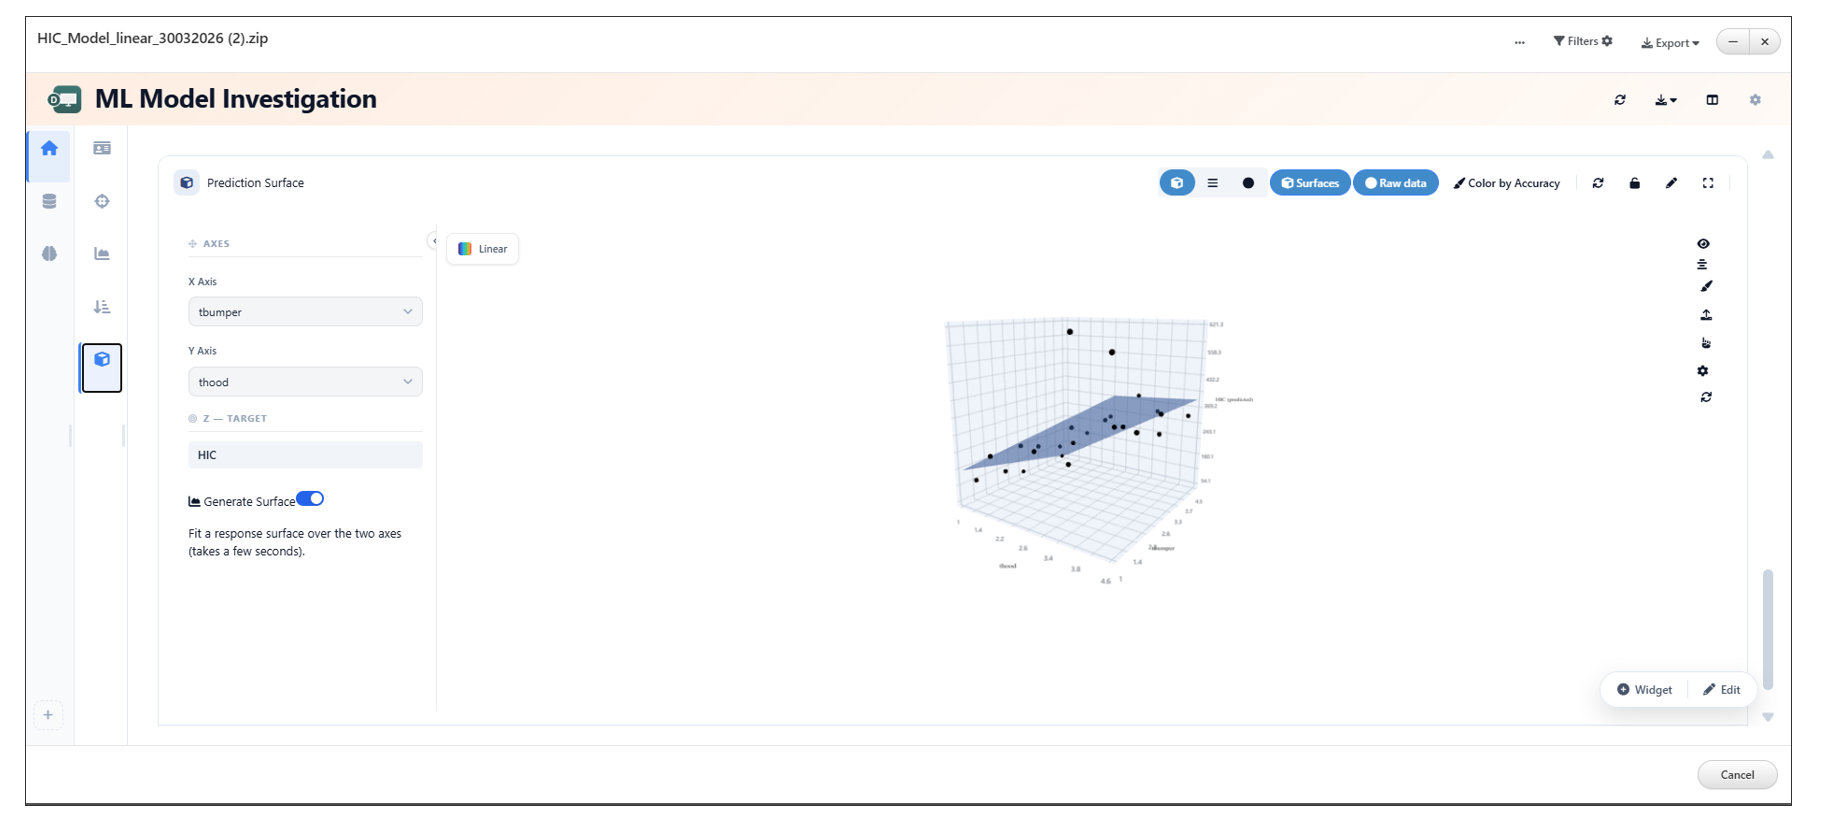
Predicted Surface
Prediction Support Added to ML Model Investigation
Overview
ML Model Investigation now supports Predictions, enabling users to generate predictions directly within the investigation view and explore the results through a rich set of interactive visualizations.
This enhancement streamlines the prediction workflow by combining prediction generation and result analysis in a single interface, making it easier to evaluate model behavior and prediction accuracy.
Key Features
- Added prediction support to ML Model Investigation
- Generates predictions directly within the investigation view
- Provides multiple interactive visualizations for prediction analysis
- Enables comparison of prediction results with model insights
- Simplifies model evaluation through an integrated workflow
Color by Accuracy Option Added to ML Investigation Prediction Settings
Overview
The Prediction Settings in ML Investigation now include a Color by Accuracy option for the 3D Scatter Plot.
When enabled, the scatter plot colors prediction points based on their prediction accuracy, making it easier to identify regions where the model performs well or where prediction errors are higher.
Key Features
- Added a Color by Accuracy option to Prediction Settings
- Available for the 3D Scatter Plot visualization
- Colors prediction points based on prediction accuracy
- Highlights areas of high and low model performance
- Improves visual interpretation of prediction quality
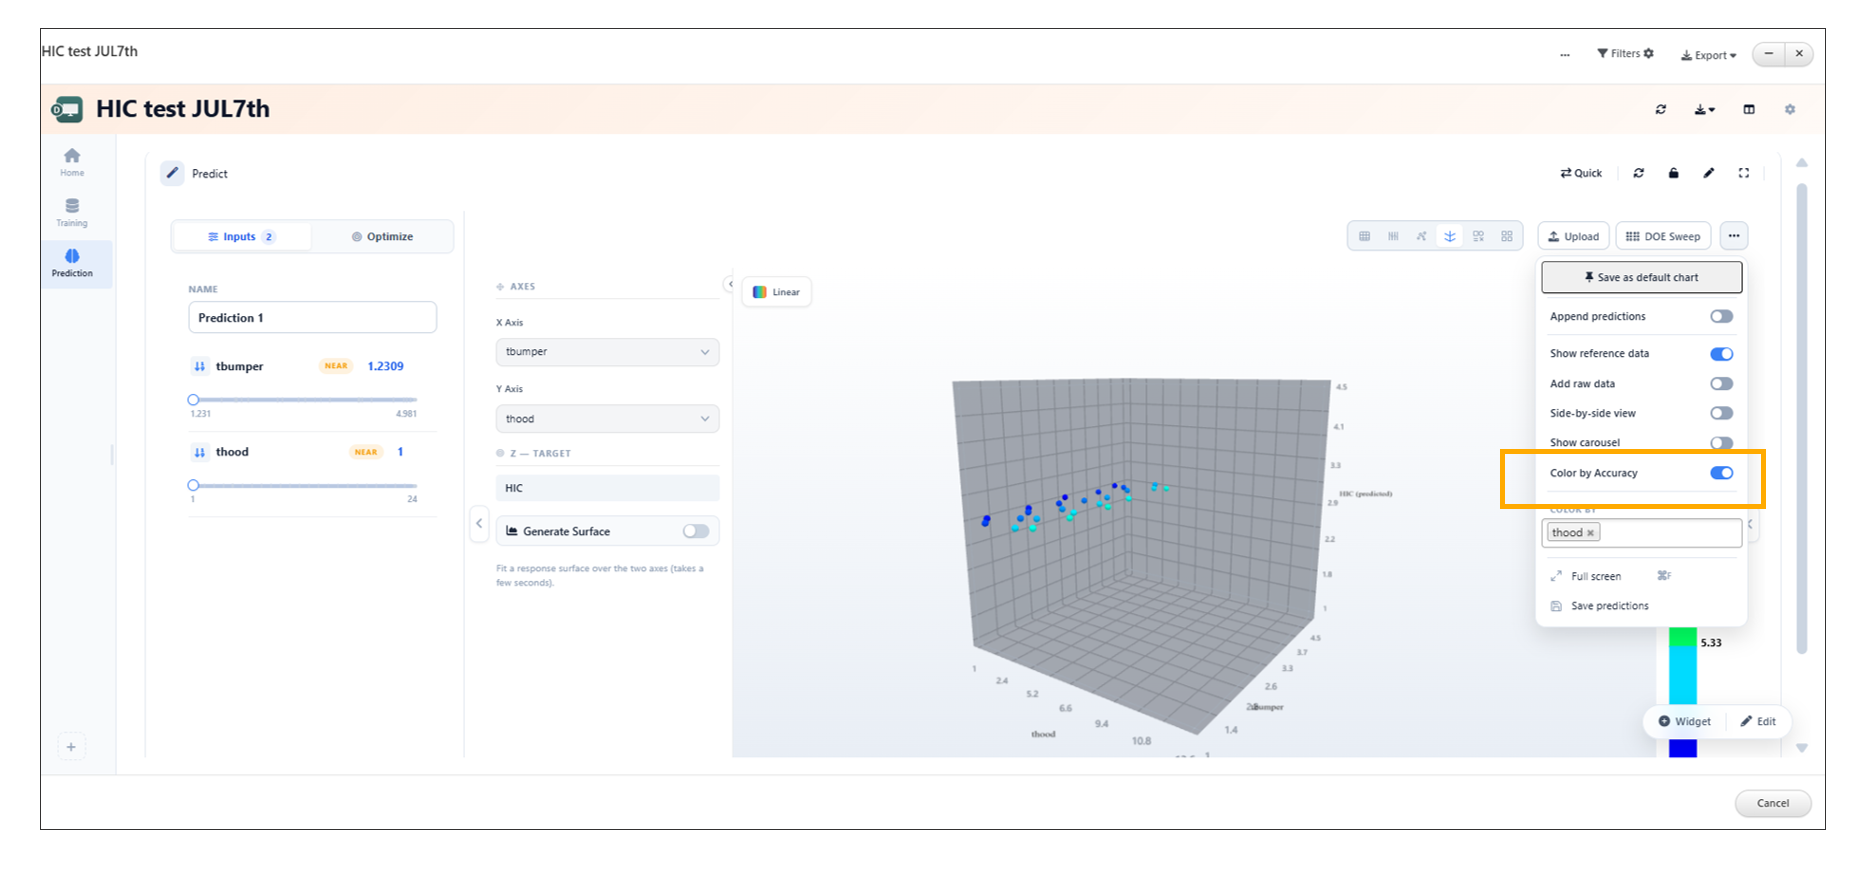
Color by Accuracy
Lock/Unlock Support Added for Prediction Inputs in ML Investigation
Overview
The Prediction inputs in ML Investigation now support lock/unlock functionality, giving users greater flexibility when configuring prediction scenarios.
Users can unlock individual prediction inputs and manually edit their values directly in the input text box, enabling quick experimentation with different input combinations.
Key Features
- Added lock/unlock functionality for prediction inputs
- Allows individual inputs to be unlocked independently
- Supports direct manual editing of unlocked input values
- Enables rapid experimentation with prediction scenarios
- Improves flexibility when configuring prediction inputs
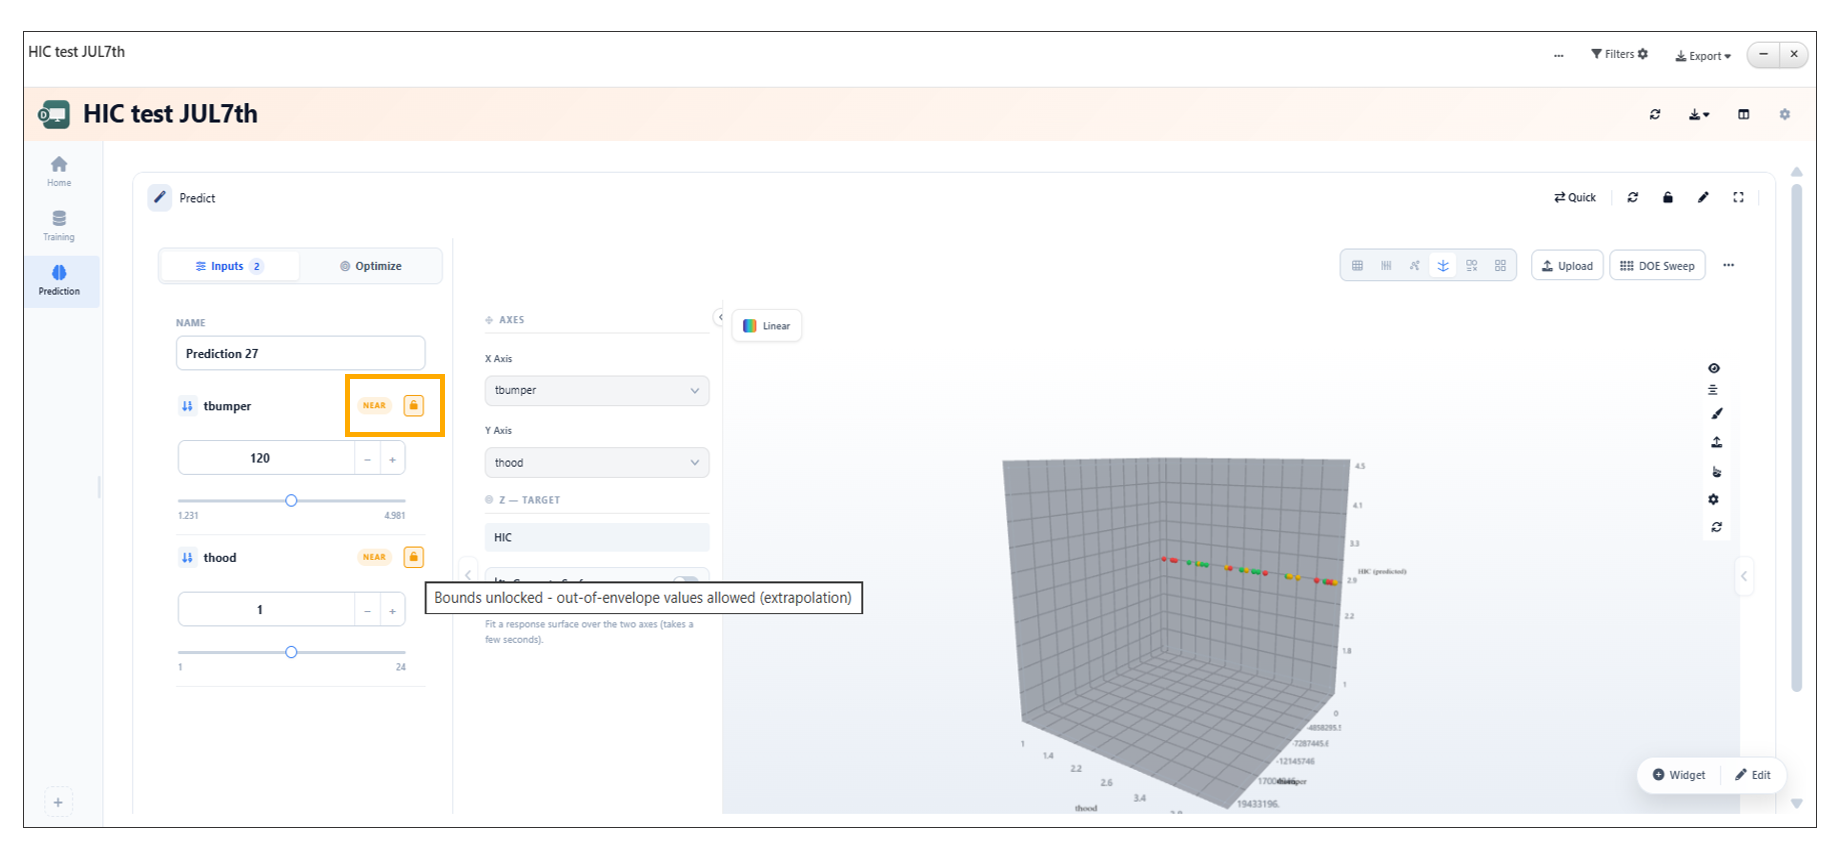
Lock/Unlock Support
Right-Side Rail Added to ML Investigation Prediction View
Overview
The Prediction view in ML Investigation now features a dedicated right-side rail that provides quick access to Model Outputs, History, and Analysis tabs.
This enhancement centralizes prediction results, execution history, and analysis tools in a single location, making it easier to review outputs and navigate between different aspects of the prediction workflow.
Key Features
- Added a dedicated right-side rail to the Prediction view
- Includes Model Outputs, History, and Analysis tabs
- Provides quick access to prediction results and related information
- Organizes prediction workflow details in a single panel
- Improves navigation and usability during model investigation
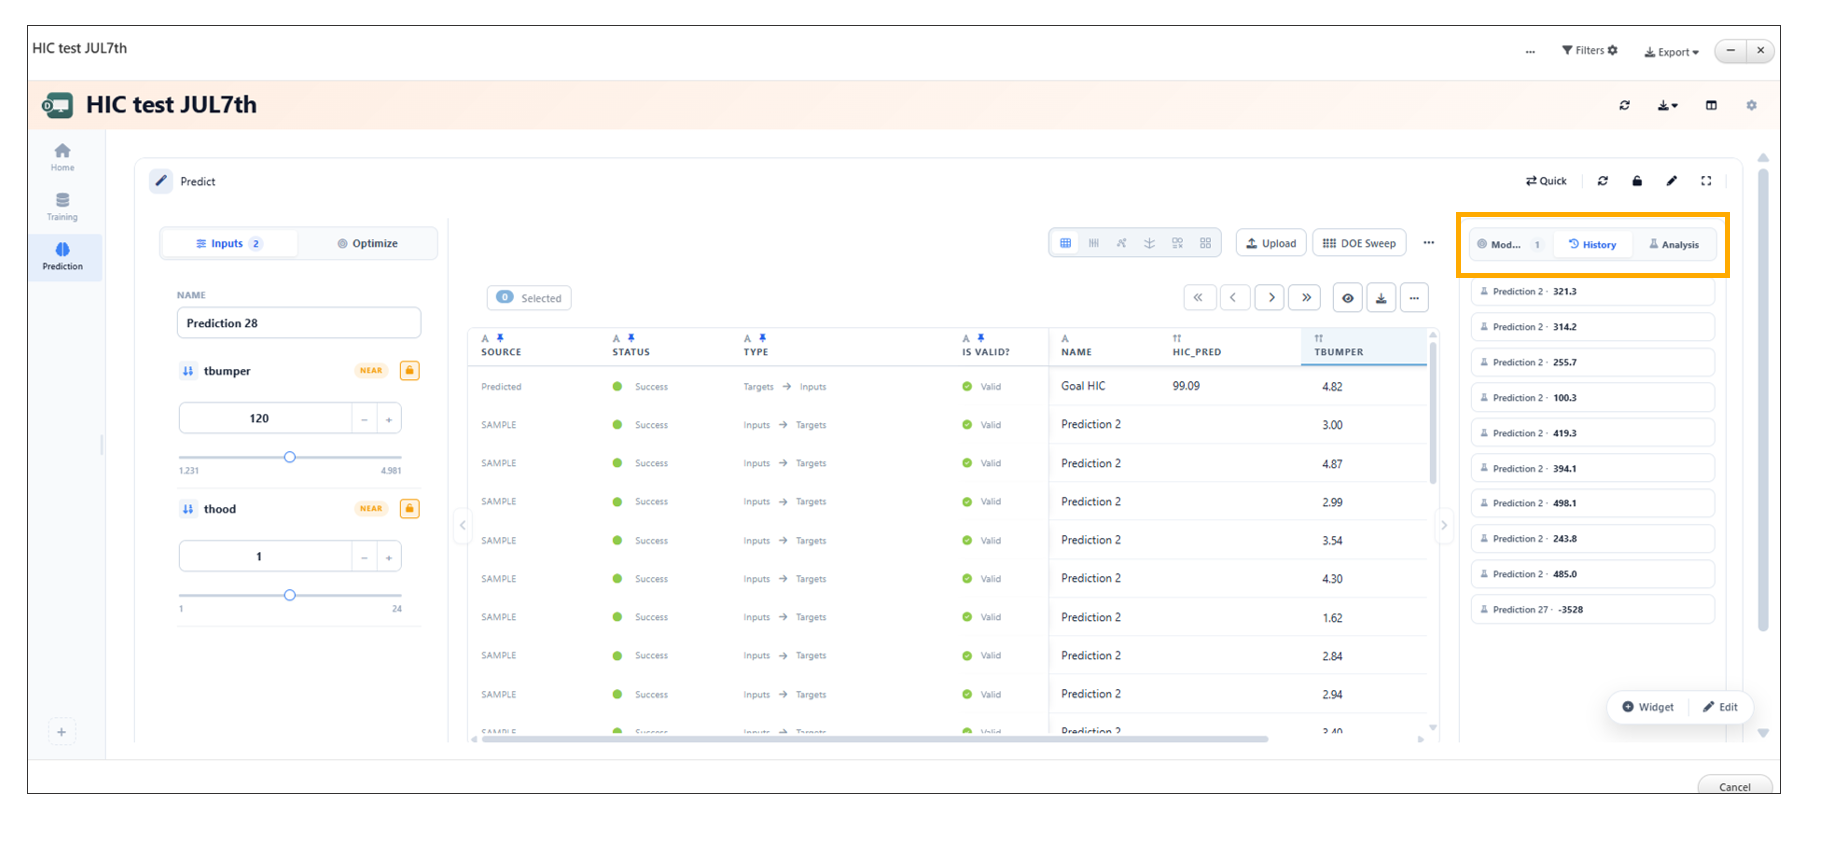
Right-Side Rail
Unified Header Added to ML Model Investigation Viewer
Overview
The ML Model Investigation Viewer now features a unified modal header that consolidates model selection, refresh, and export actions into a single streamlined interface.
This enhancement simplifies navigation by bringing commonly used controls together, providing a cleaner layout and improving the overall user experience while investigating machine learning models.
Key Features
- Added a unified header to the ML Model Investigation Viewer
- Consolidates model selection, refresh, and export actions
- Provides a cleaner and more streamlined interface
- Reduces navigation effort by grouping frequently used controls
- Improves usability during model investigation
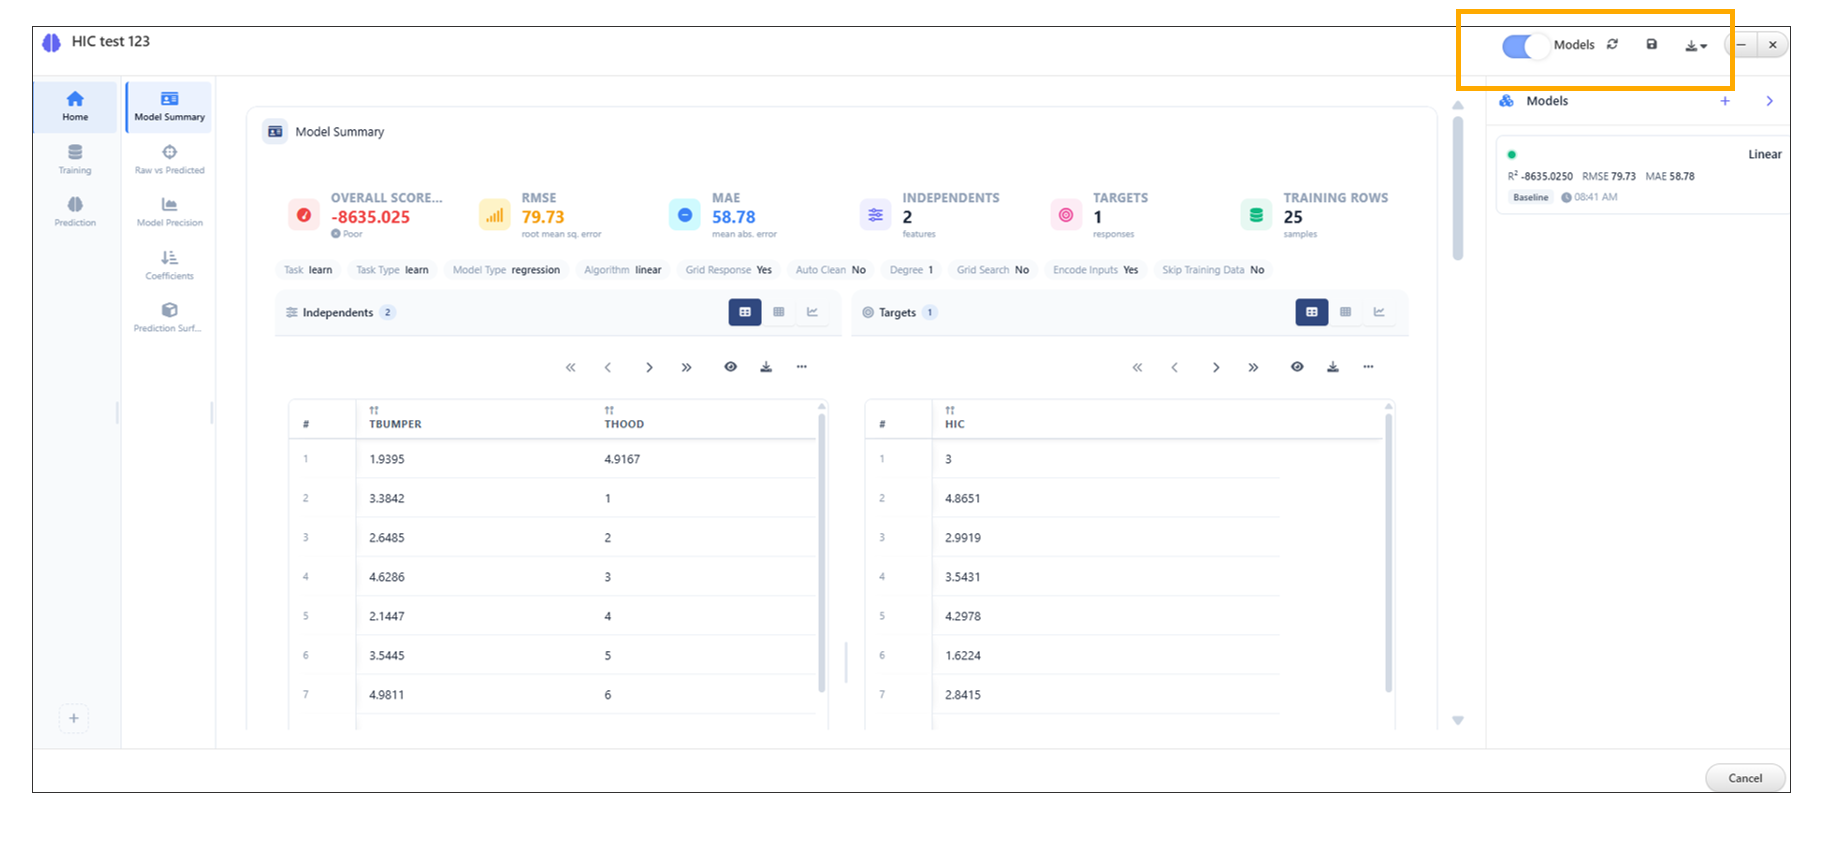
Unified Header
Show Sample Raw vs. Pred Rows Toggle Added to ML Model Investigation Viewer
Overview
The ML Model Investigation Viewer now includes a Show Sample Raw vs. Pred Rows toggle in the Prediction three-dot menu.
This option allows users to show or hide the sample Raw vs. Pred rows that are automatically seeded from the model’s predictions, providing greater control over the displayed prediction data.
Key Features
- Added a Show Sample Raw vs. Pred Rows toggle to the Prediction three-dot menu
- Allows users to show or hide sample Raw vs. Pred rows
- Sample rows are automatically seeded from the model’s predictions
- Provides greater control over the Prediction view
- Simplifies review of prediction data by reducing visual clutter when desired
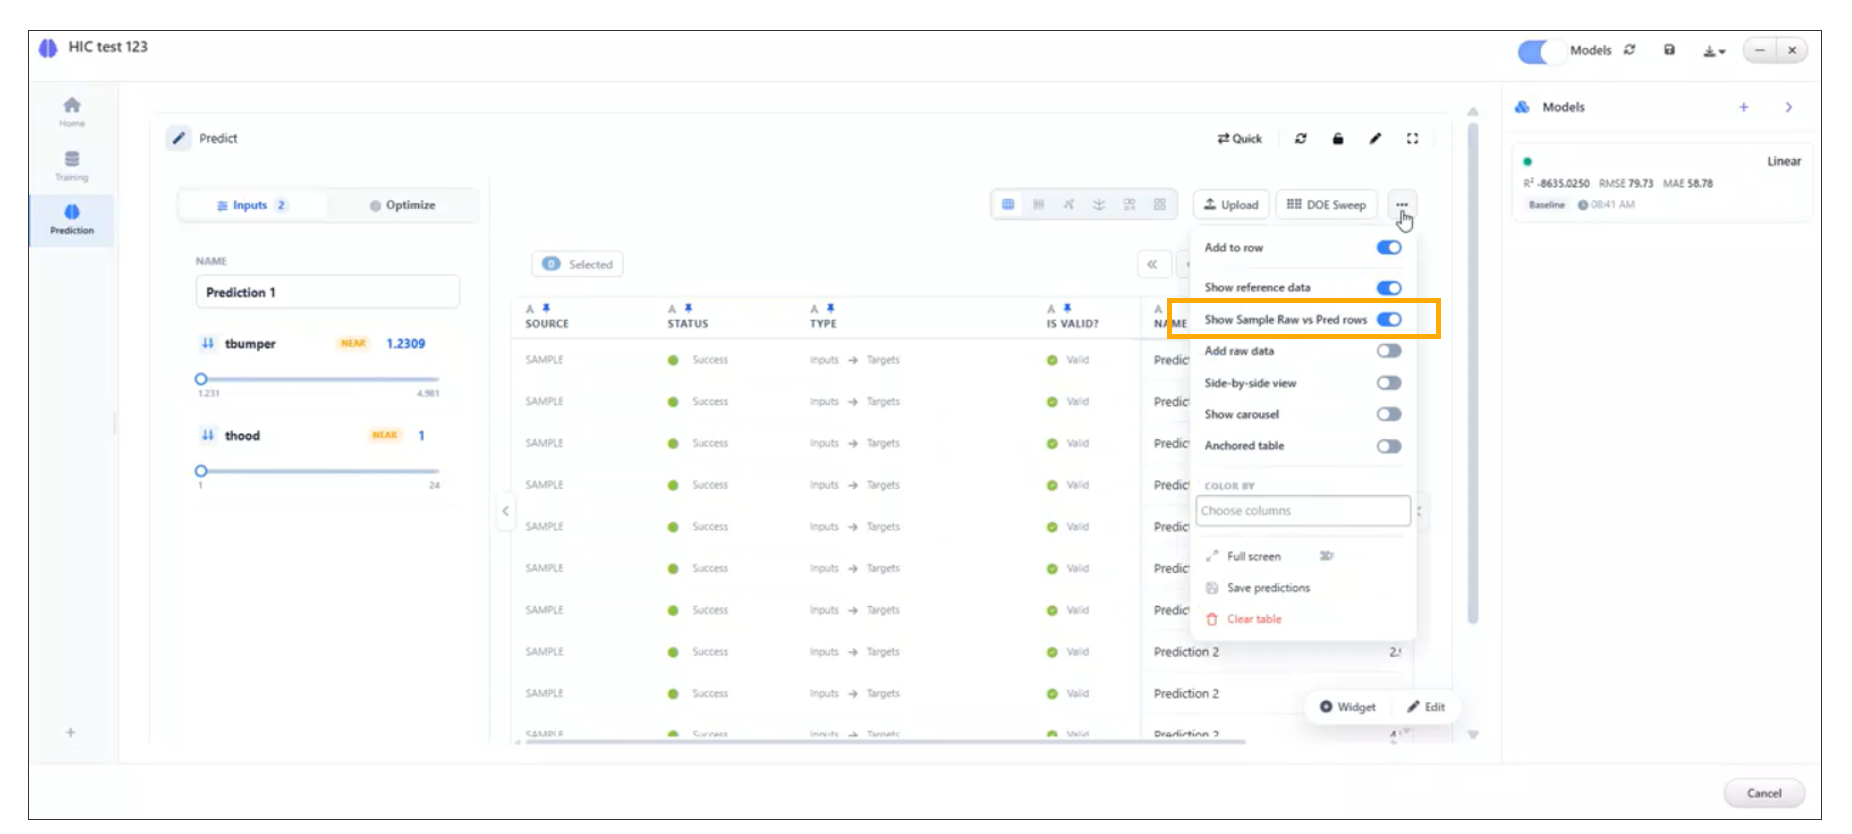
Show Sample Raw vs. Pred Rows
Explicit Update Button Added to ML Model Investigation Viewer
Overview
The ML Model Investigation Viewer now replaces automatic saving of dashboard settings with an explicit Update button in the header.
This enhancement gives users greater control over when dashboard configuration changes are applied and saved, preventing unintended updates while allowing multiple changes to be reviewed before committing them.
Key Features
- Replaced automatic saving of dashboard settings
- Added an explicit Update button to the viewer header
- Allows users to control when configuration changes are applied
- Supports reviewing multiple changes before saving
- Reduces unintended dashboard updates
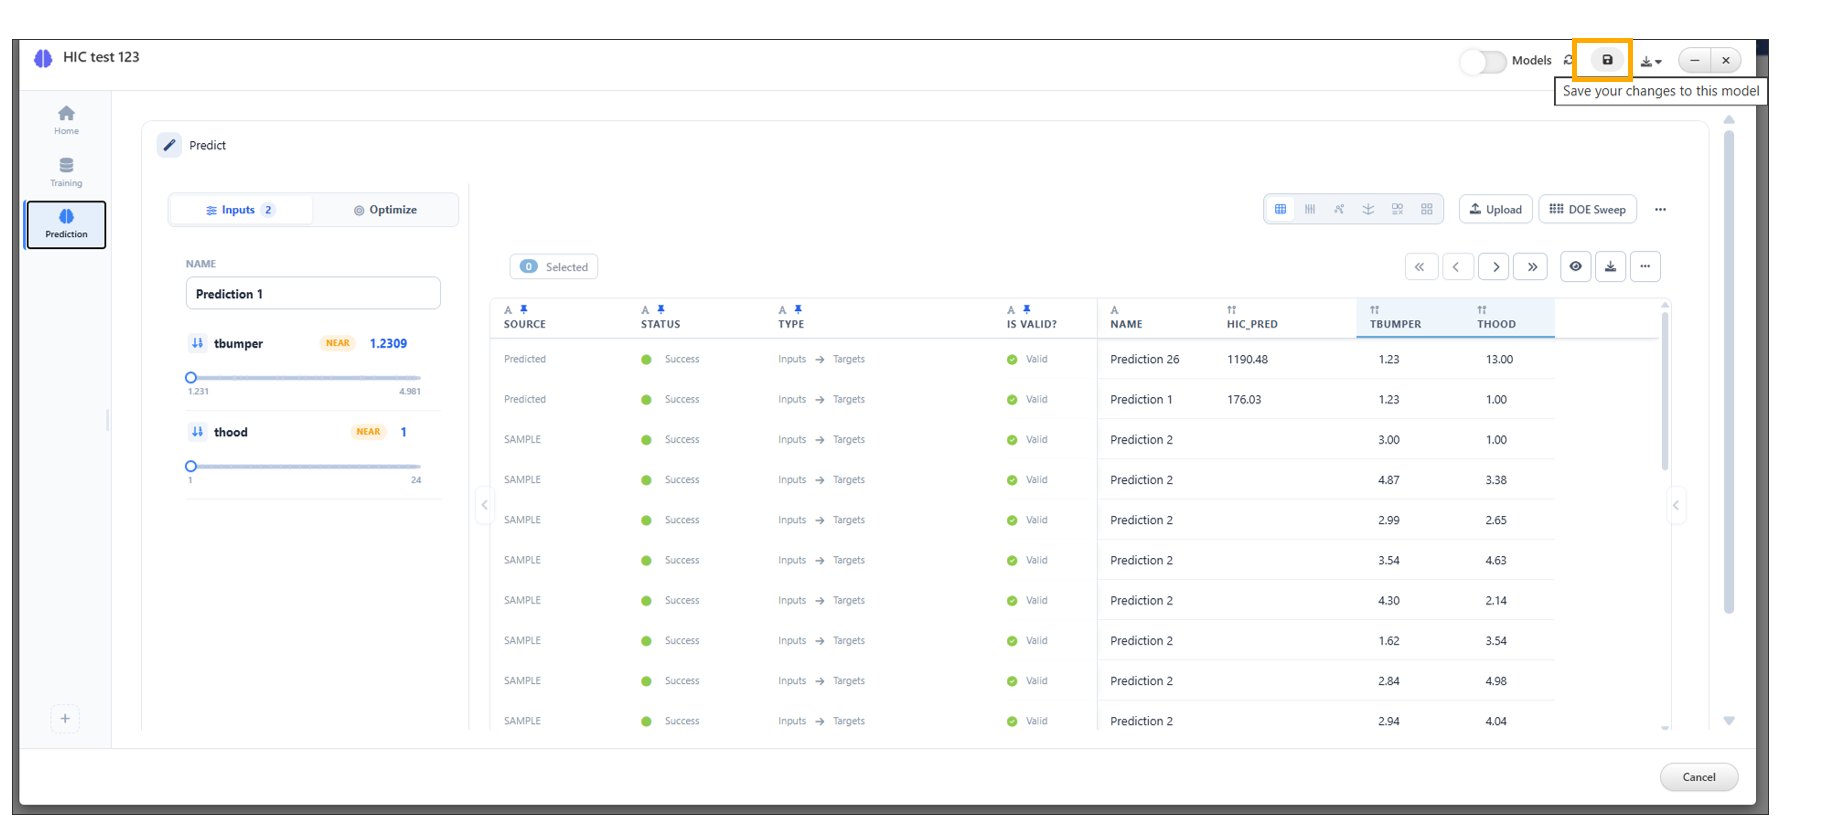
Explicit Update
DOE Sweep Sidebar Enhanced in ML Model Investigation Viewer
Overview
The ML Model Investigation Viewer now features a larger default DOE Sweep sidebar along with a new Maximize option.
These enhancements provide additional workspace for configuring DOE sweep parameters and reviewing settings, making it easier to work with complex design of experiments configurations.
Key Features
- Increased the default width of the DOE Sweep sidebar
- Added a Maximize option for the sidebar
- Provides more space for configuring DOE sweep settings
- Improves visibility of DOE sweep parameters
- Enhances usability for complex DOE configurations
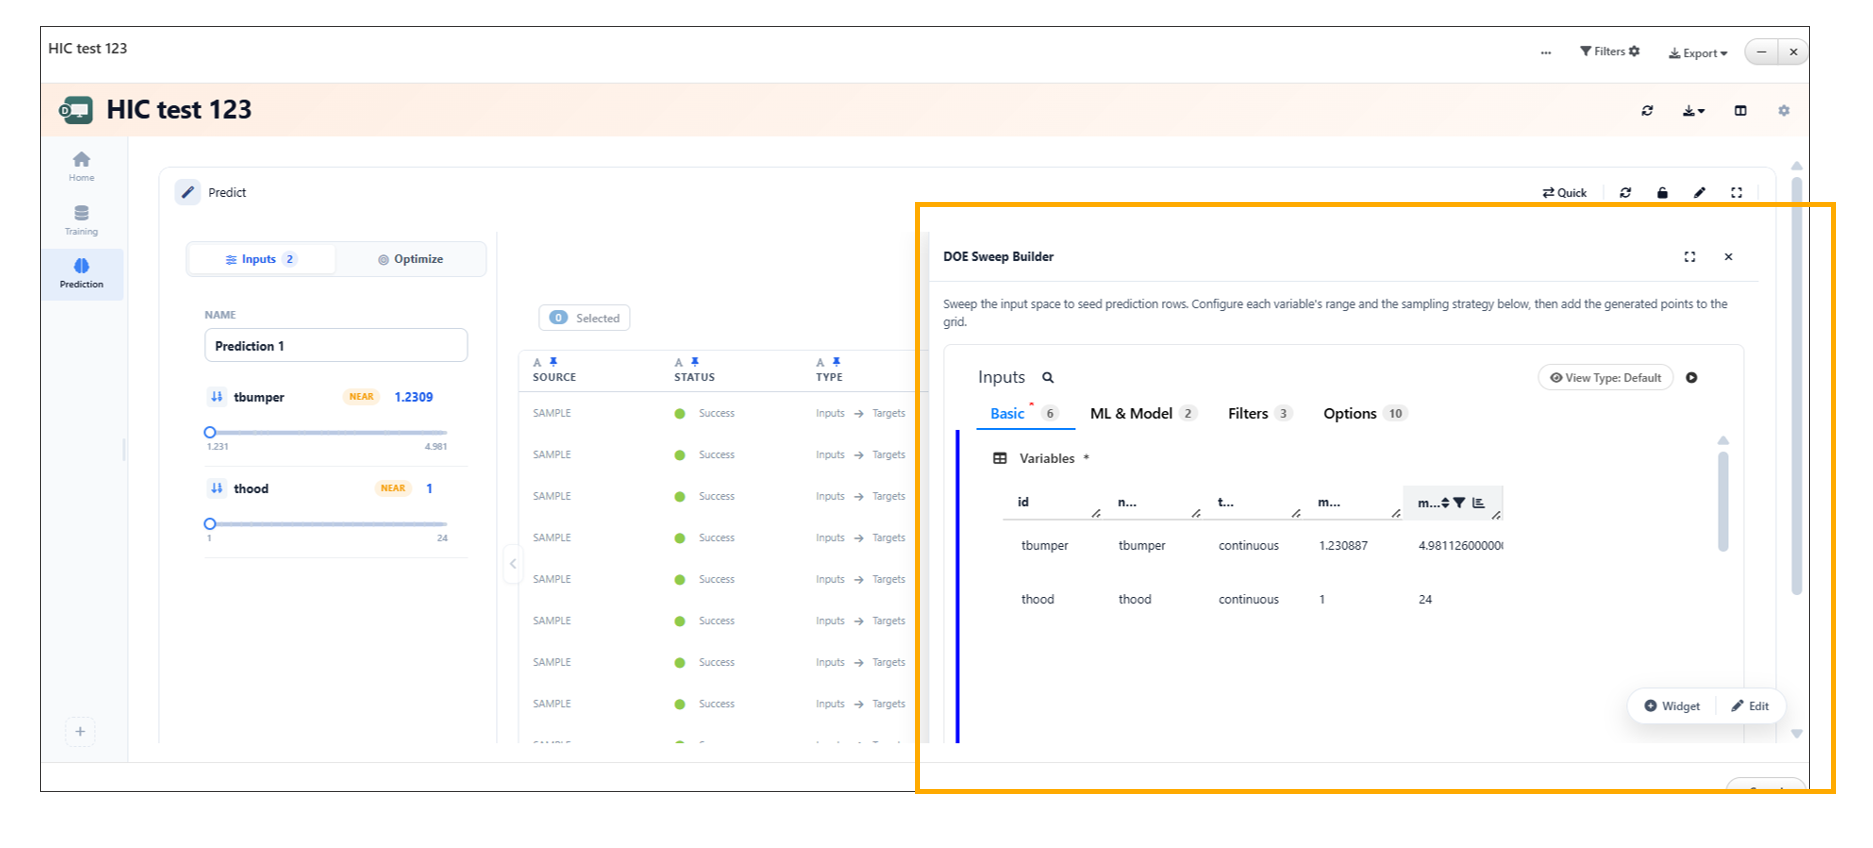
DOE Sweep Sidebar
Interactive Legend Support Added to ML Model Investigation 3D Surface Plot
Overview
The ML Model Investigation Viewer now supports interactive legend controls in the 3D Surface plot.
Users can click legend entries to show or hide individual model surfaces, making it easier to compare specific prediction surfaces, reduce visual clutter, and focus on the models of interest.
Key Features
- Added interactive legend support to the 3D Surface plot
- Click legend entries to show or hide individual model surfaces
- Enables selective comparison of prediction surfaces
- Reduces visual clutter in multi-surface visualizations
- Improves exploration of model behavior
Optimize Option Added to ML Model Investigation Prediction Inputs
Overview
The ML Model Investigation Viewer now includes an Optimize option next to each prediction input, allowing users to quickly configure optimization directly from the prediction interface.
This enhancement streamlines optimization workflows by enabling users to define optimization objectives and constraints without leaving the prediction view.
Key Features
- Added an Optimize option next to prediction inputs
- Enables optimization setup directly from the Prediction interface
- Reduces the need to navigate to separate optimization tools
- Simplifies configuration of optimization scenarios
- Integrates prediction and optimization workflows
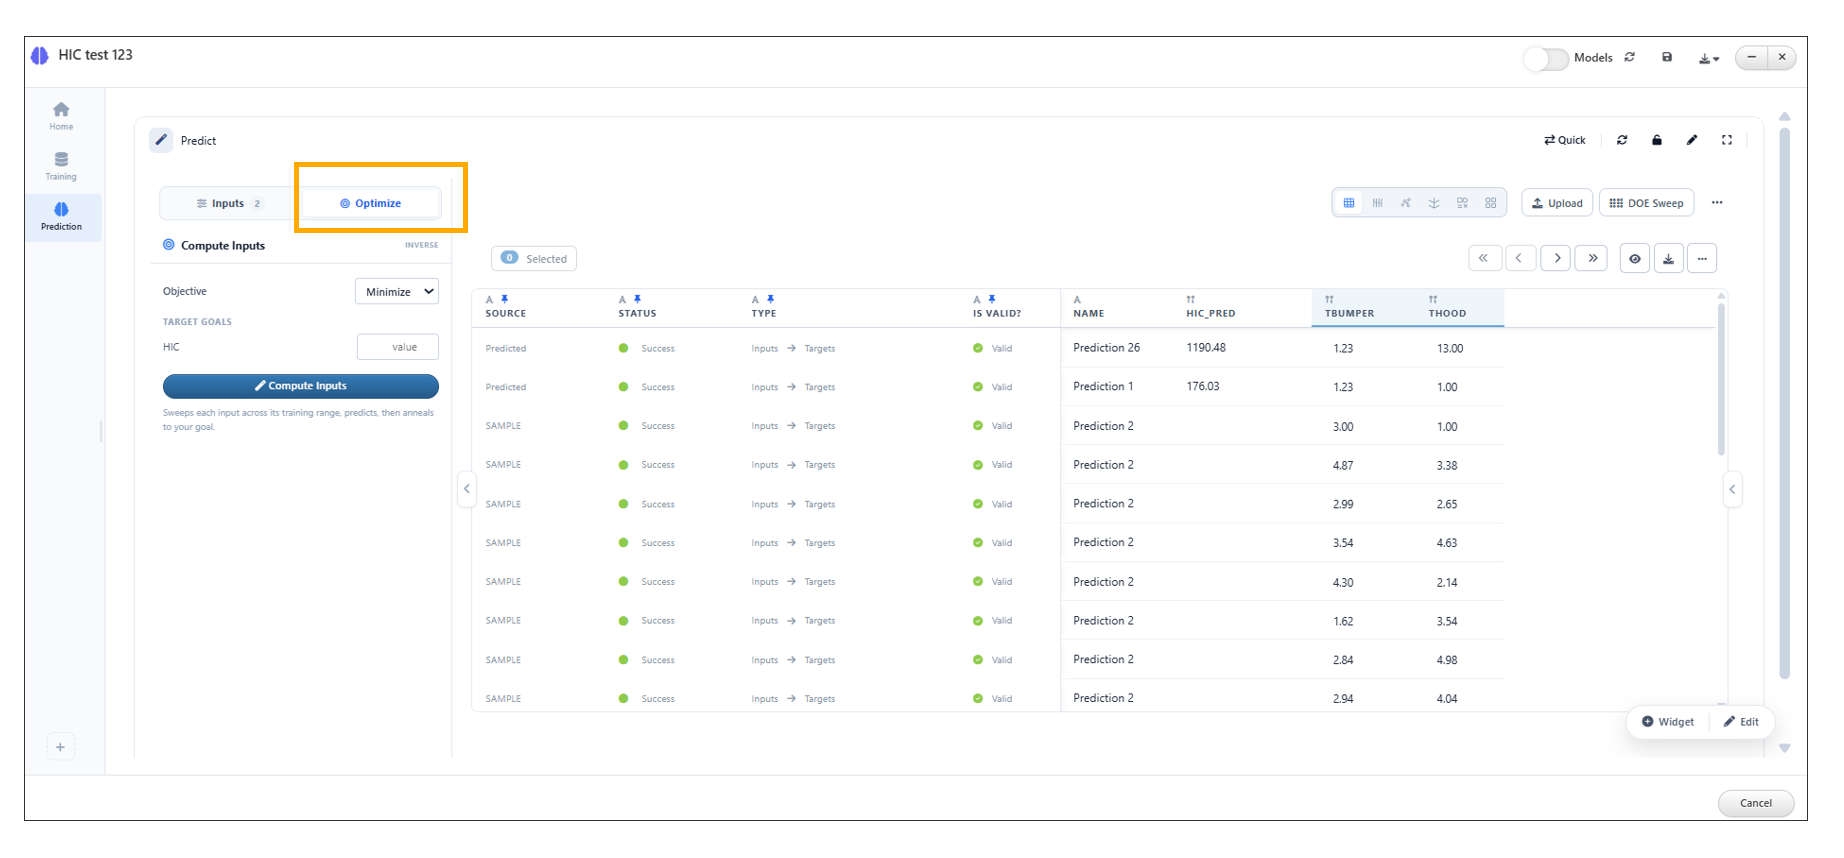
Optimize
ML Model Prediction Adds Streamlined Keyword Upload Workflow
Overview
The ML Model Prediction tab now includes a streamlined keyword upload workflow within the dedicated left-side panel, simplifying the process of generating predictions from solver keyword decks.
Uploaded keyword files are automatically processed using the PEDPRO_MEASURE_METRICS worker and then displayed in Peacock for interactive review. Users can subsequently use the Review Rows tab to select one or more generated rows and produce predicted values directly from the Prediction interface.
Key Features
- Added a streamlined keyword upload workflow to the left-side panel
- Automatically processes uploaded keyword files using
PEDPRO_MEASURE_METRICS - Displays processed results in Peacock for interactive review
- Introduced a Review Rows tab for selecting generated prediction rows
- Enables prediction generation directly from reviewed rows
- Streamlines the end-to-end workflow from keyword upload to prediction.
Import Prediction Rows from Keyword Deck in ML Model Investigation
Overview
The ML Model Investigation Viewer now supports importing prediction rows directly from a solver keyword deck through the new Import from Keyword option available in the Prediction upload panel.
For models with a configured worker, this feature automatically extracts prediction input values from the selected keyword deck, eliminating manual data entry and simplifying prediction setup.
Key Features
- Added an Import from Keyword option to the Prediction upload panel
- Supports importing prediction rows directly from a solver keyword deck
- Available for models with a configured worker
- Automatically extracts prediction input values from the keyword deck
- Simplifies prediction setup and reduces manual data entry
ML Investigation Prediction Supports Peacock in Keyword Deck Import
Overview
The ML Investigation Model Prediction tab has been enhanced with View in Peacock overlay and Keyword Deck Import support.
These additions allow users to visualize prediction results directly in Peacock and populate prediction inputs from solver keyword decks, creating a seamless workflow between machine learning predictions and simulation model visualization.
Key Features
- Added View in Peacock overlay to the Prediction tab
- Added Keyword Deck Import support in the Prediction upload panel
- Enables visualization of prediction results directly in Peacock
- Imports prediction inputs from supported solver keyword decks
- Streamlines prediction setup and model validation workflows
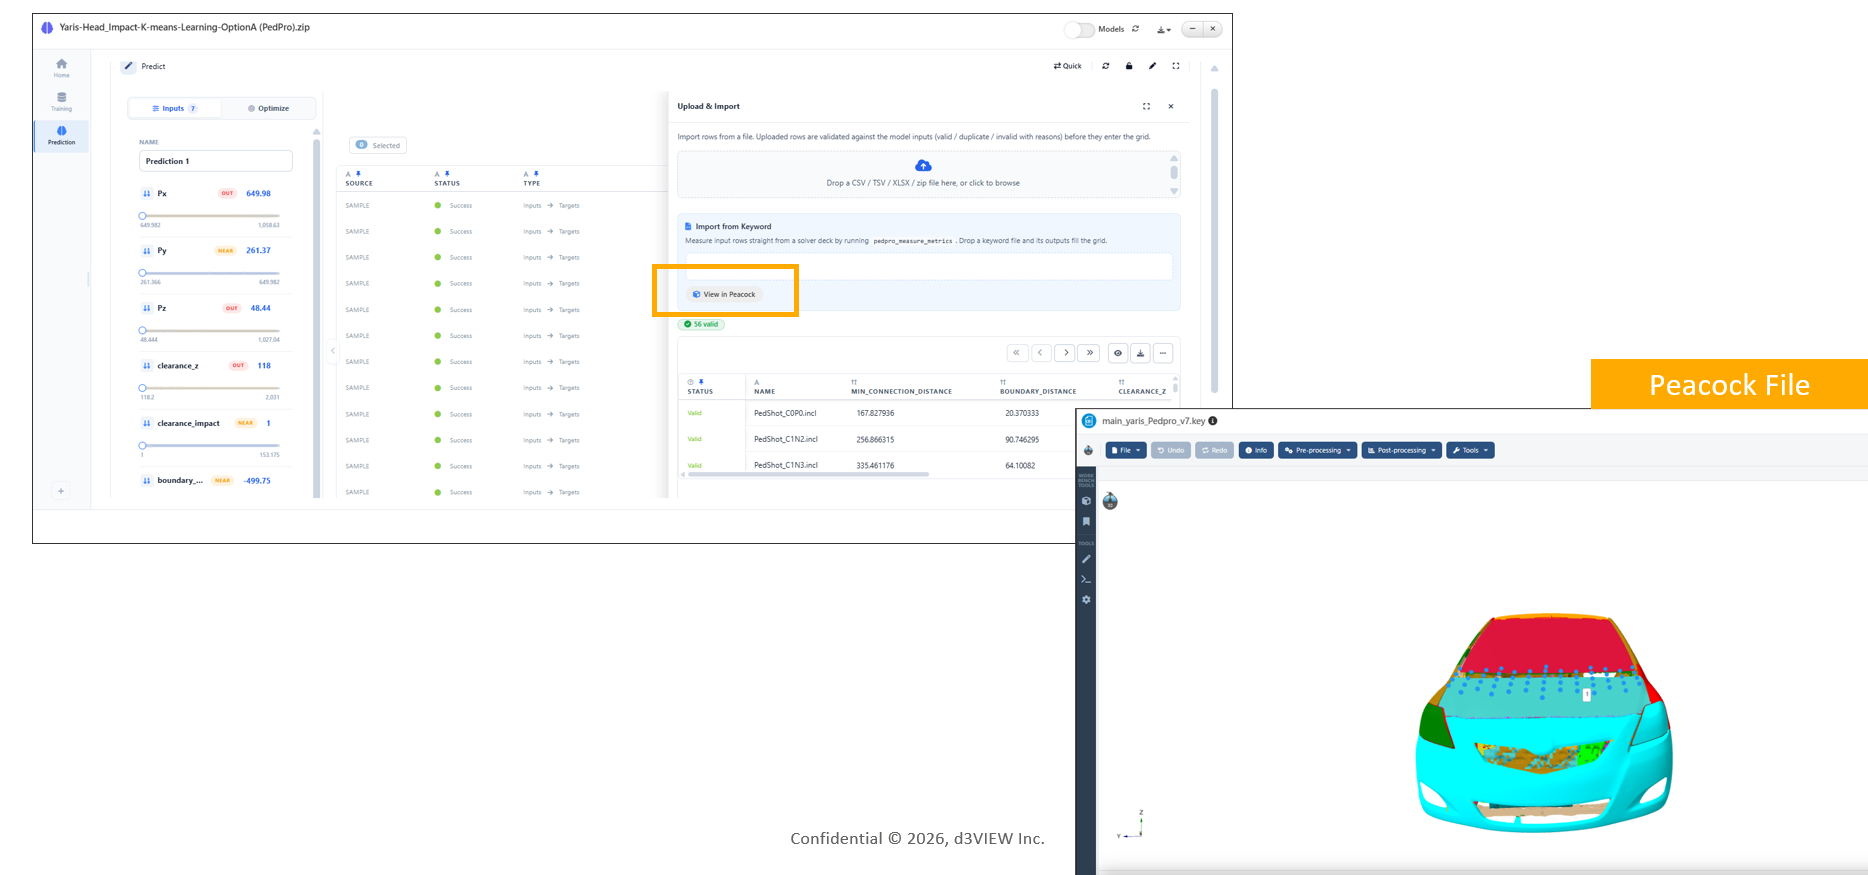
Keyword Deck Import
ML Investigation Prediction View Enhanced with Scorecard
Overview
The ML Investigation Model Prediction view now includes a new Scorecard option, together with a redesigned right pane that allows users to seamlessly switch between Opportunity and Per-Point views.
This enhancement provides a more intuitive interface for analyzing prediction results by offering multiple scorecard perspectives within a single workspace, making it easier to review overall opportunities or inspect detailed per-point prediction metrics.
Key Features
- Added a Scorecard option to the Prediction view
- Redesigned the right pane for improved usability
- Added toggle support between Opportunity and Per-Point views
- Enables both summary and detailed analysis of prediction results
- Provides a more streamlined prediction analysis experience
ML Model Prediction Renders Scorecard Inline
Overview
The ML Model Prediction tab has been enhanced to render the Scorecard inline, allowing users to review prediction insights directly within the Prediction interface.
By embedding the Scorecard into the Prediction tab, users can evaluate prediction quality and related metrics without navigating to a separate view, resulting in a more streamlined analysis workflow.
Key Features
- Renders the Scorecard inline within the Prediction tab
- Displays prediction insights alongside prediction results
- Eliminates the need to switch to a separate Scorecard view
- Streamlines prediction analysis within a single interface
- Improves accessibility of prediction metrics
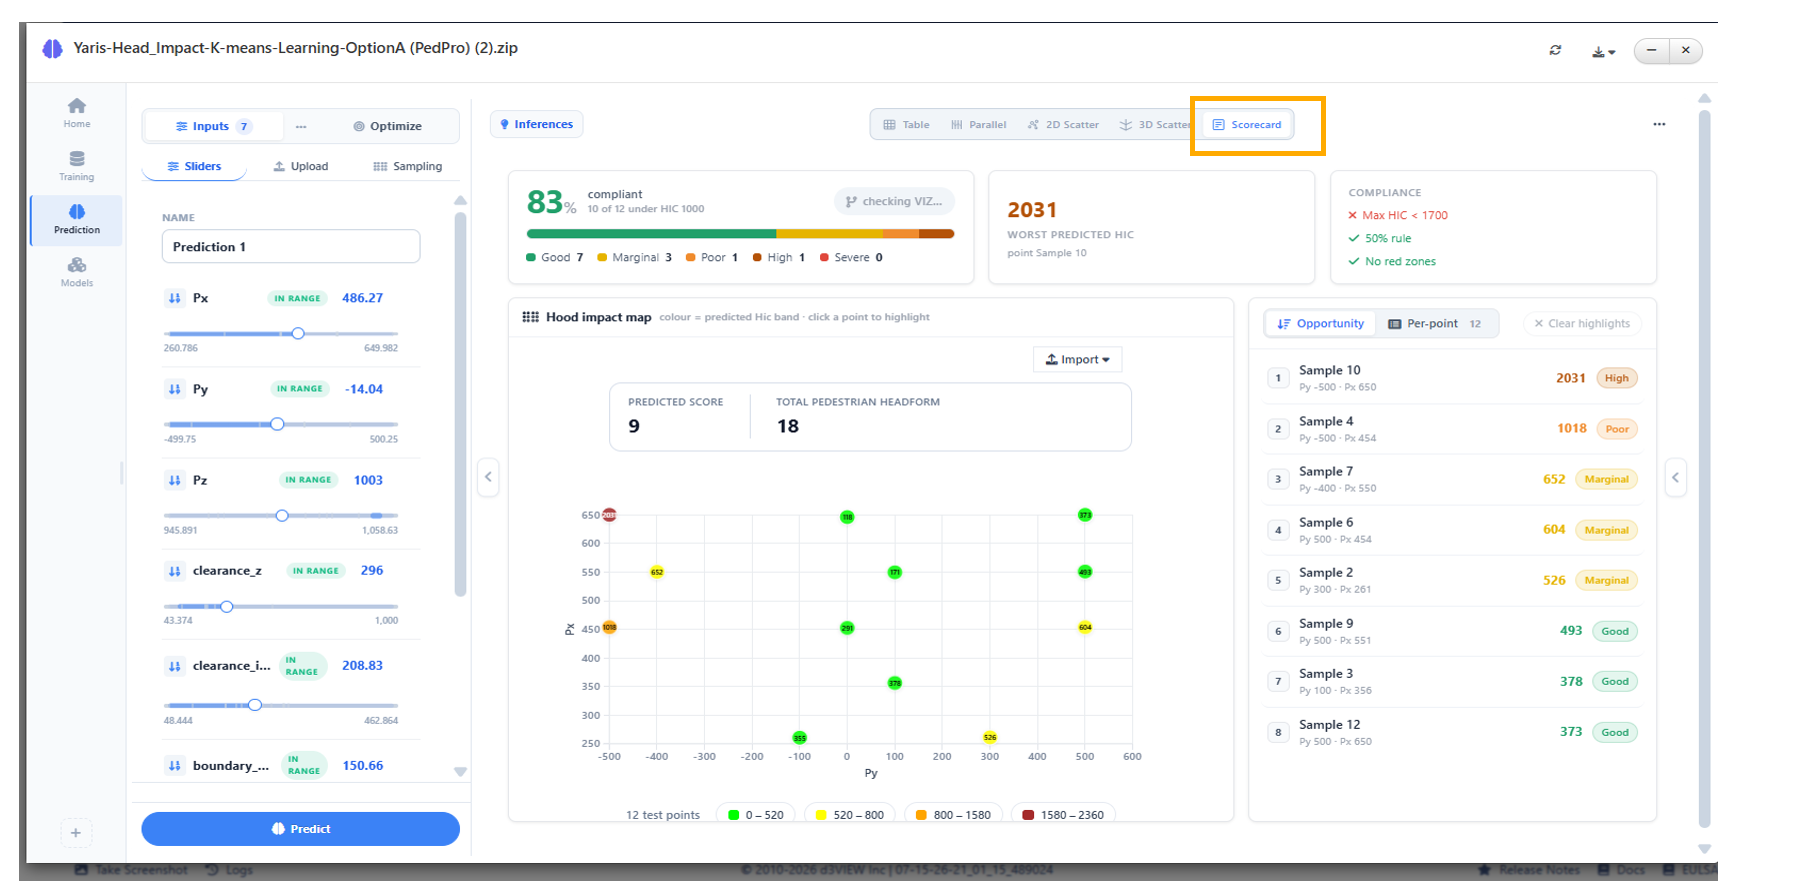
Scorecard Inline
ML Model Summary Displays Per-Model Prediction Columns
Overview
The ML Model Model Summary page has been enhanced to display dedicated per-model prediction columns when comparing multiple machine learning models.
This enhancement provides a clearer side-by-side comparison by presenting prediction values for each selected model in separate columns, making it easier to evaluate model performance and identify differences across prediction results.
Key Features
- Added dedicated per-model prediction columns to the Model Summary page
- Available when comparing multiple ML models
- Displays prediction results for each model in separate columns
- Improves side-by-side comparison of model outputs
- Simplifies evaluation of prediction differences across models
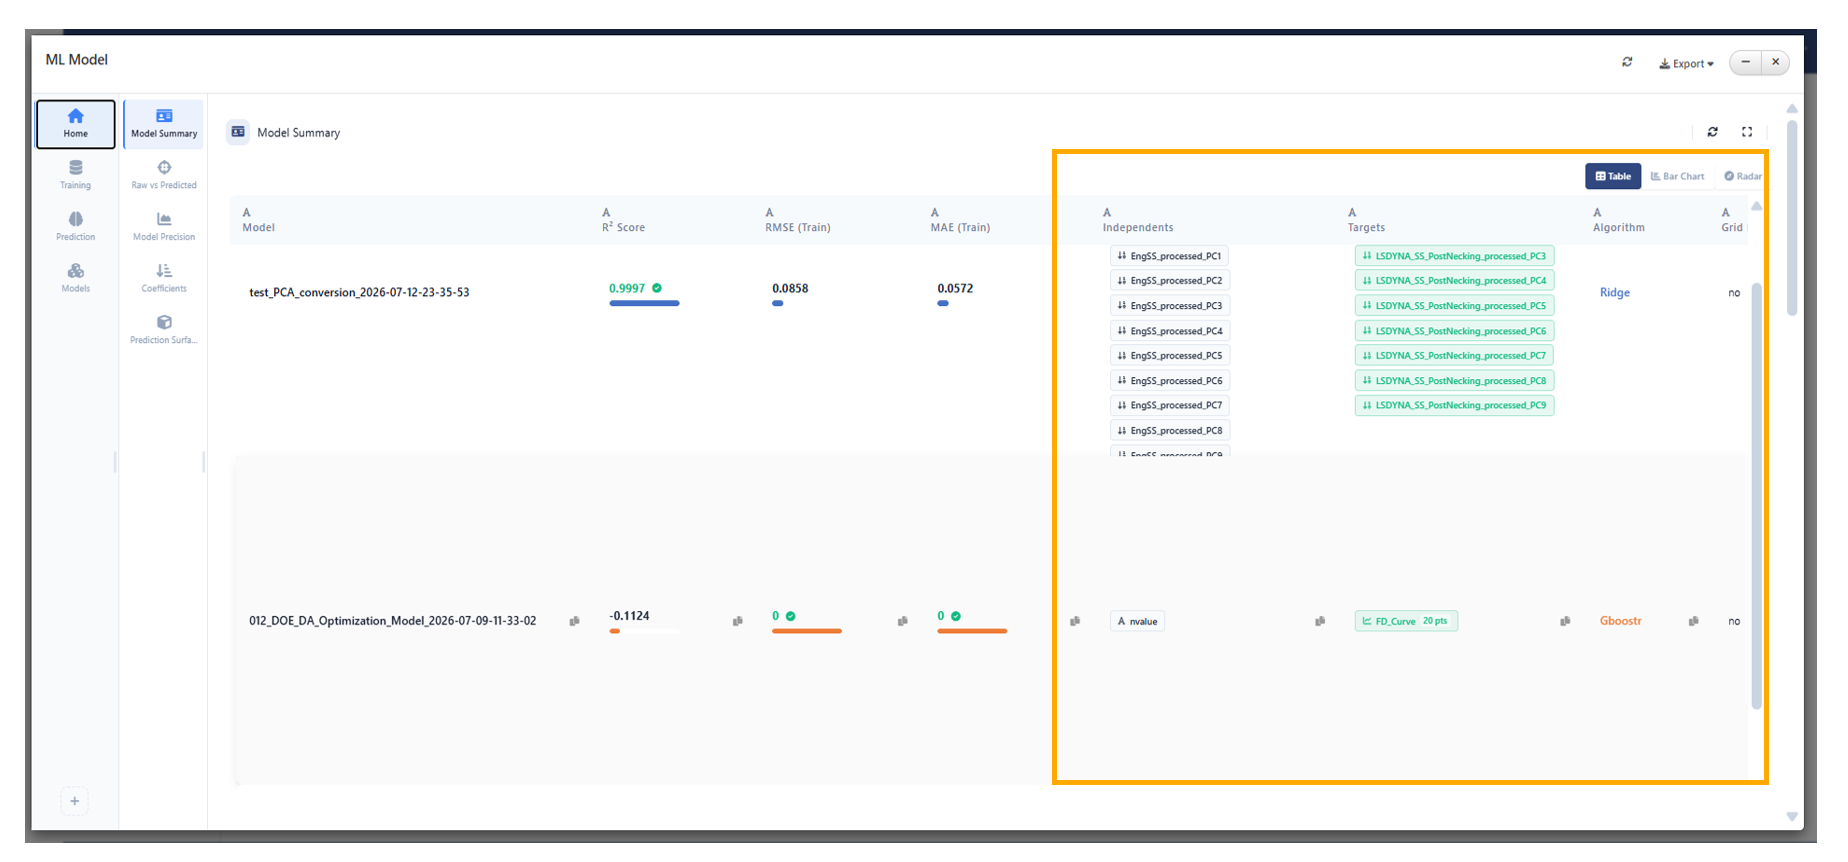
ML Model Summary
ML Model Prediction Includes Independent 2D Scatter Plot
Overview
The ML Model Prediction tab has been enhanced with an independent 2D Scatter Plot that includes its own dedicated control panel.
This enhancement allows users to customize the scatter plot independently of other visualizations, edit chart settings, and save personalized configurations for future use, providing greater flexibility when analyzing prediction results.
Key Features
- Added an independent 2D Scatter Plot to the Prediction tab
- Introduced a dedicated control panel for the scatter plot
- Supports independent chart customization
- Allows users to edit visualization settings without affecting other charts
- Enables saving and reusing customized chart configurations
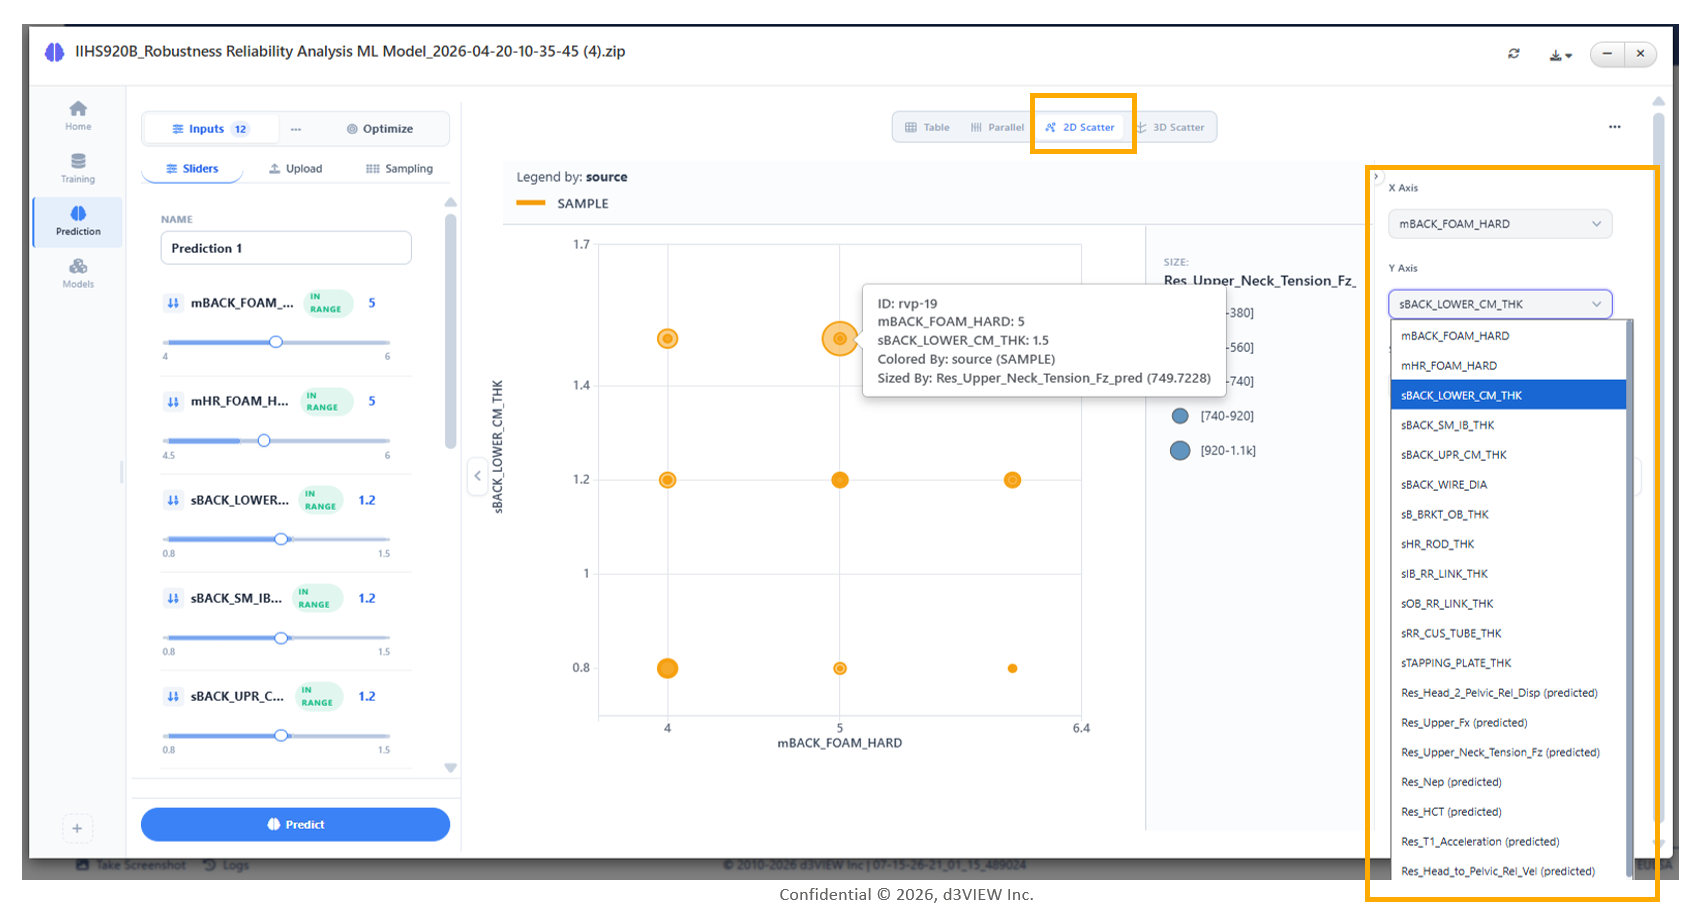
2D Scatter Plot
ML Model Prediction Table View Enables Anchored Tables by Default
Overview
The ML Model Prediction tab Table View now enables Anchored Tables by default, providing a more stable and consistent table viewing experience.
While Anchored Tables are enabled automatically for new Prediction Table views, users can continue to configure this behavior through the Settings panel to suit their preferred workflow.
Key Features
- Enabled Anchored Tables by default in the Prediction tab Table View
- Retains full configuration through the Settings panel
- Provides a more stable and consistent table viewing experience
- Simplifies initial table navigation for prediction results
- Preserves user flexibility through configurable settings
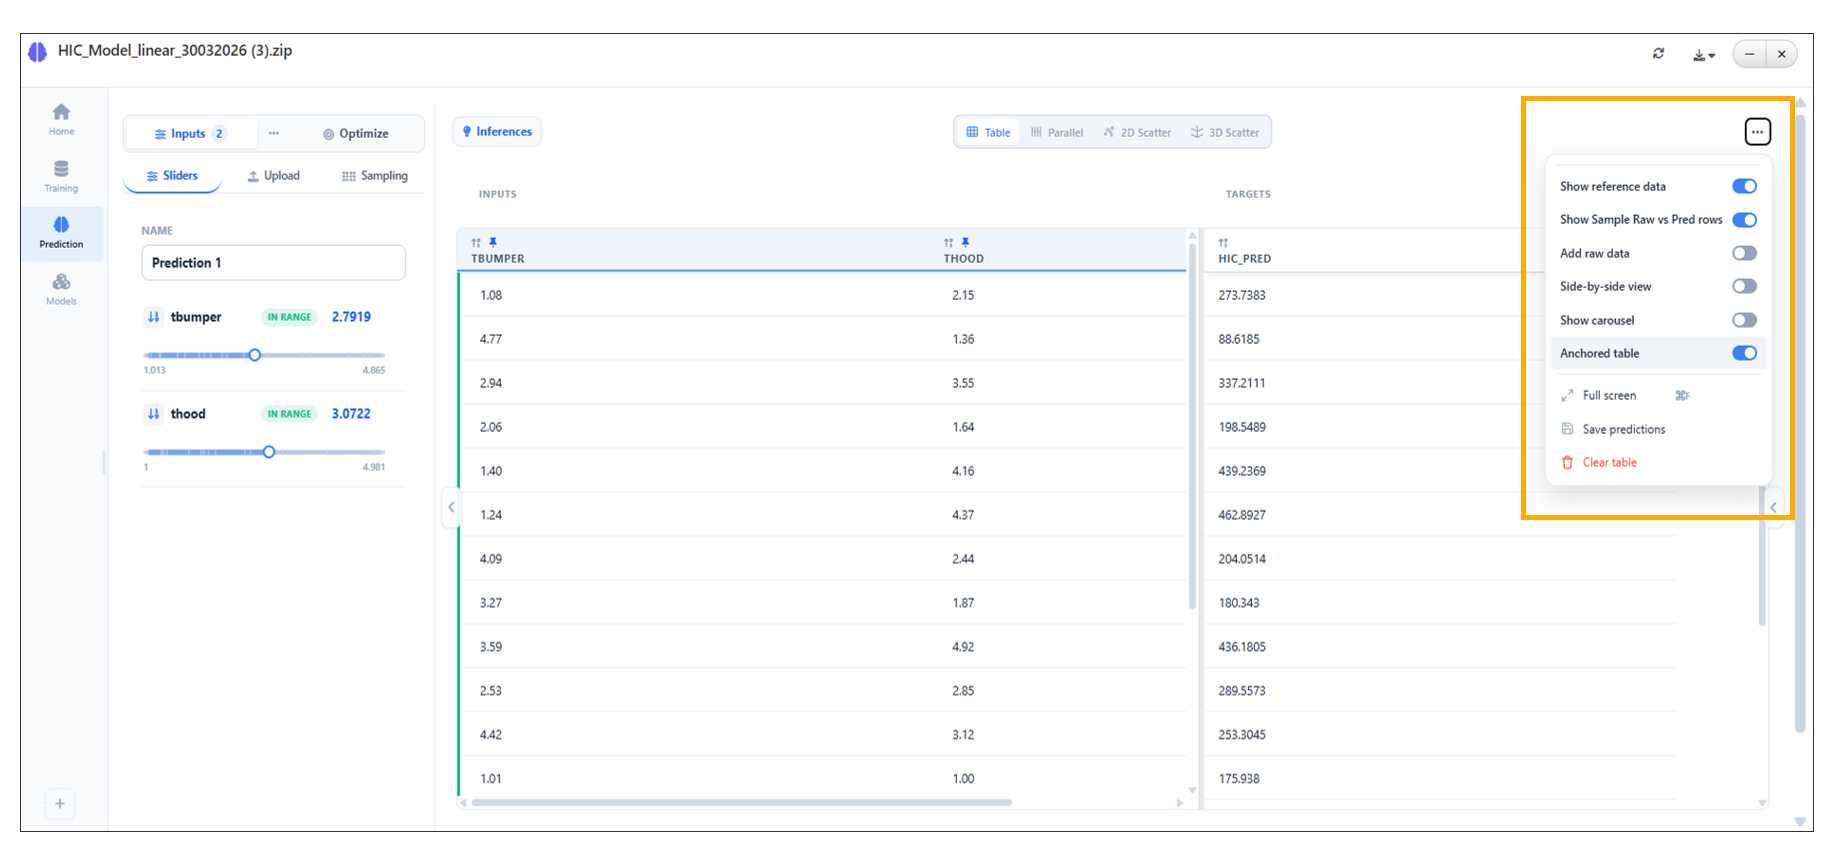
Anchored Table
ML Model Prediction Table Displays Predicted Values for Sample Rows
Overview
The ML Model Prediction table has been enhanced to display predicted values for Sample rows instead of leaving the prediction columns empty.
This enhancement provides a more complete view of prediction results by automatically populating prediction values for sample data, making it easier to compare inputs and outputs without requiring additional actions.
Key Features
- Displays predicted values for Sample rows
- Eliminates empty prediction columns for sample data
- Provides a more complete prediction table
- Improves comparison of sample inputs and predicted outputs
- Enhances usability of the Prediction tab
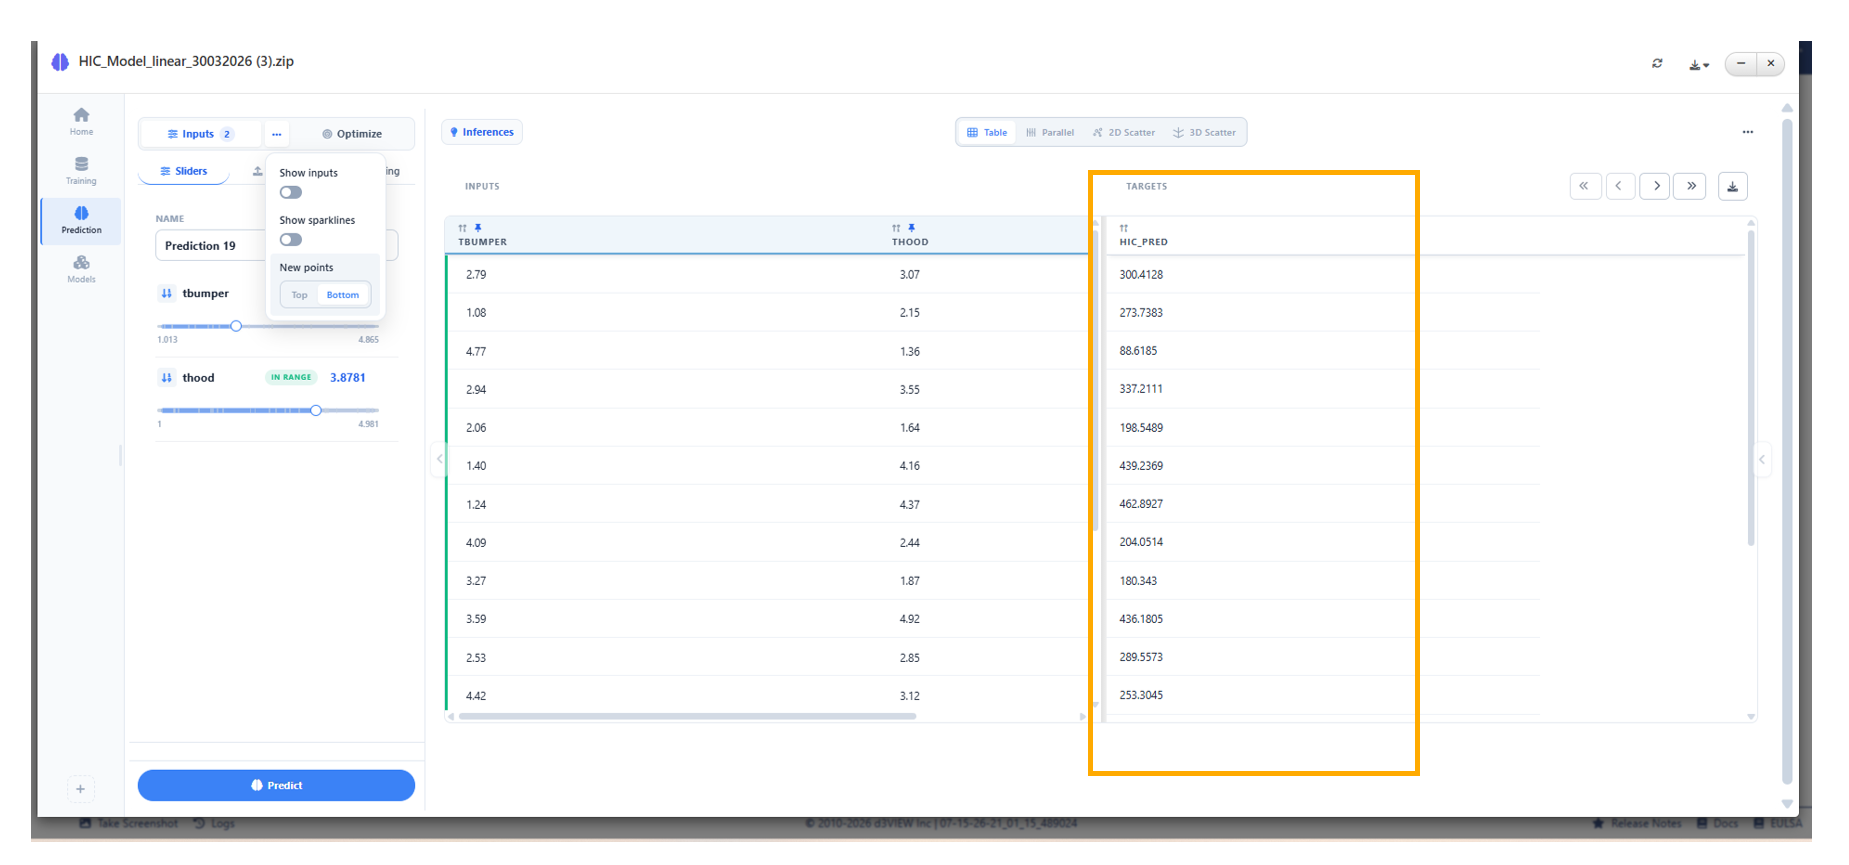
Predicted Values for Sample Rows
ML Model Prediction Adds Dedicated Left-Side Panel
Overview
The ML Model Prediction tab now includes a dedicated left-side panel that consolidates all prediction setup options into a single location.
The panel provides Inputs, Upload, and Sampling sections, enabling users to configure prediction inputs, import prediction data, and generate sample prediction rows more efficiently before running predictions.
Key Features
- Added a dedicated left-side panel to the Prediction tab
- Includes Inputs, Upload, and Sampling sections
- Centralizes prediction setup and configuration
- Simplifies importing and preparing prediction data
- Improves the overall prediction workflow
ML Model Prediction Parallel Coordinates Displays Default Input Variables
Overview
The ML Model Prediction tab Parallel Coordinates chart has been enhanced to display the first five input variables by default.
Users can interactively enable or disable additional input variables and update the visualization, providing greater flexibility when exploring high-dimensional prediction data without overwhelming the chart.
Key Features
- Displays the first five input variables by default
- Allows additional input variables to be enabled or disabled
- Supports interactive chart updates
- Simplifies visualization of high-dimensional prediction data
- Improves readability while preserving access to all model inputs