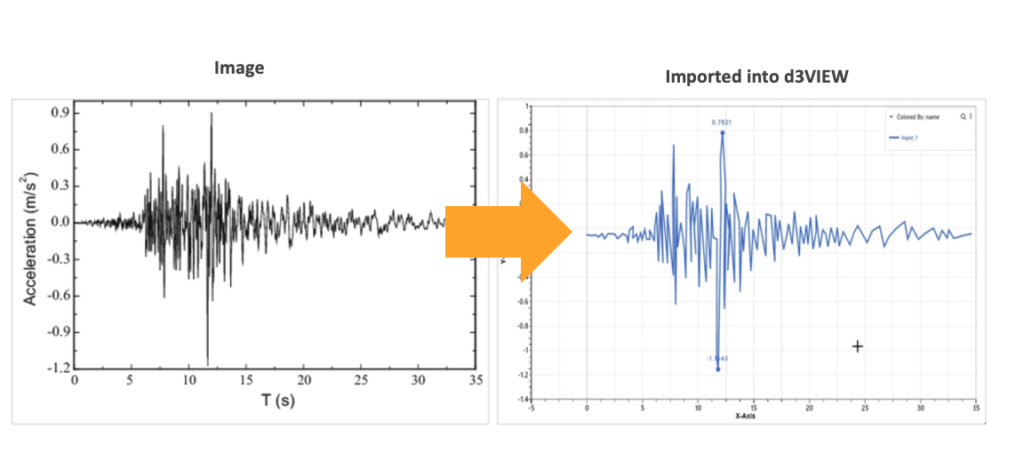
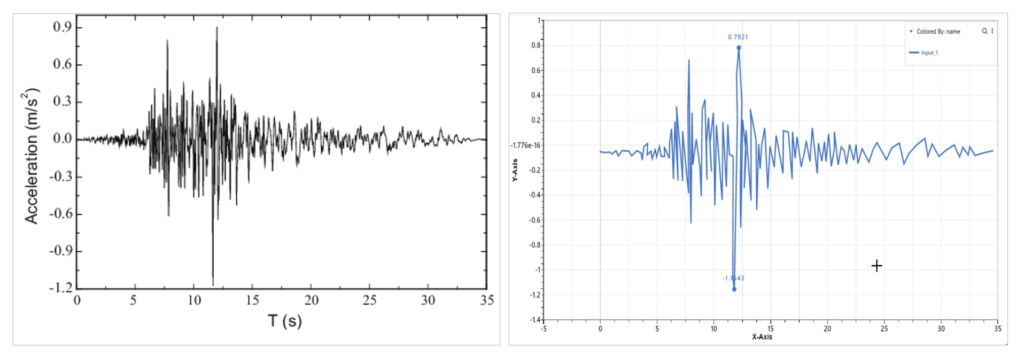
In several instances, time-history curves may need to be imported from either an Image (PNG/JPEG,.) or PDF files for use in comparison with simulations or for material calibration. d3VIEW Workflows now has the ability to digitize these images into a usable data curve.
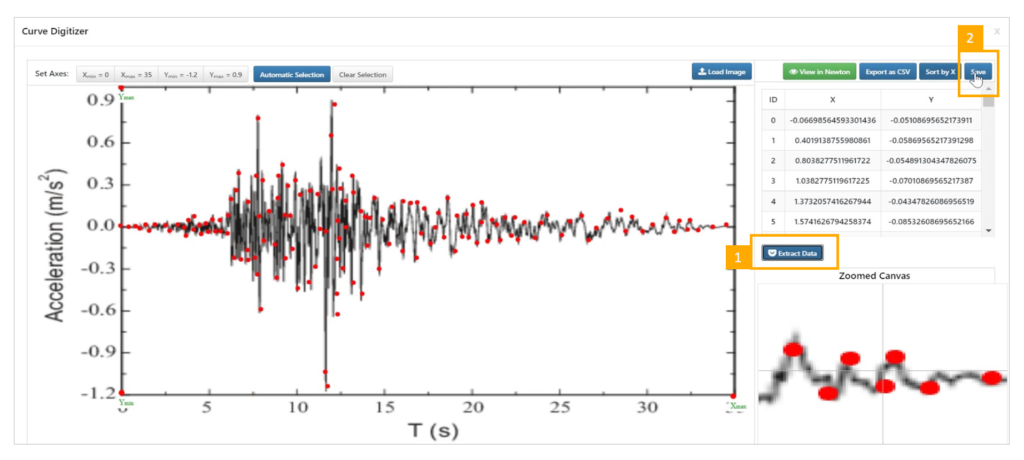
This post reviews the 5-step process in digitizing the image from a given image as shown below:
Step 1: Upload image in curve input field.
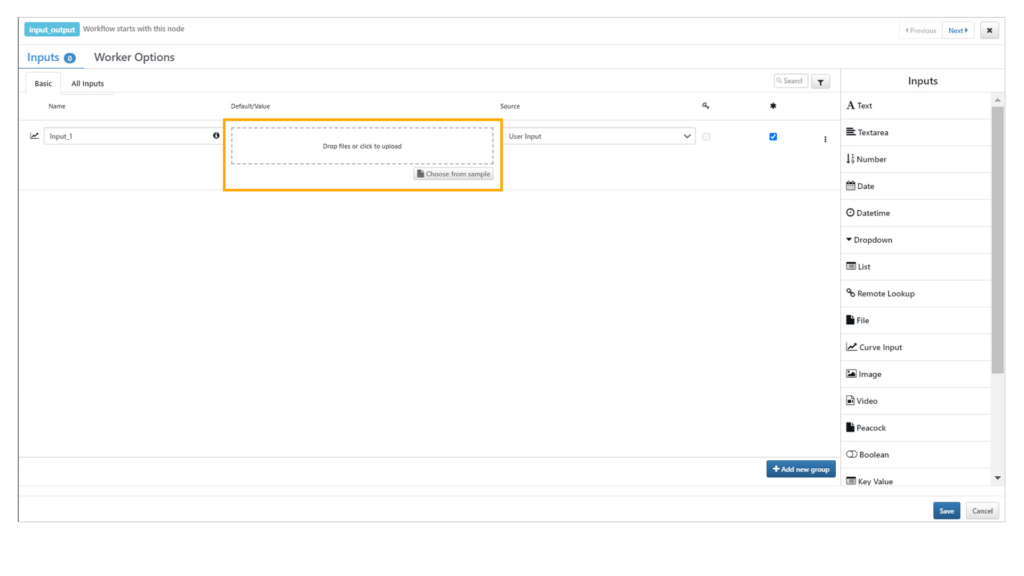
Step 2: Click on x min and pick a point.
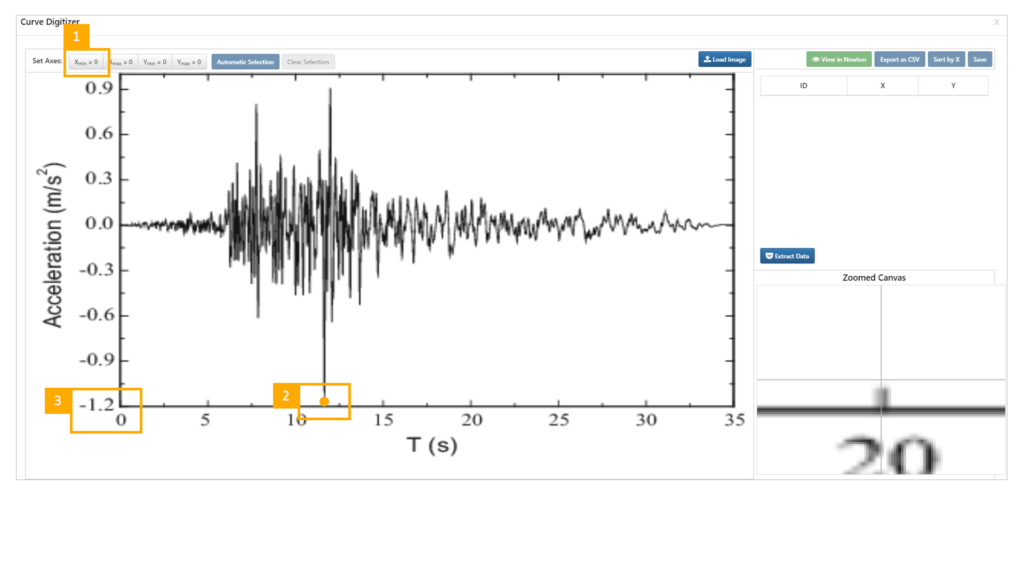
Step 3: Select points for x max, y min and y max.
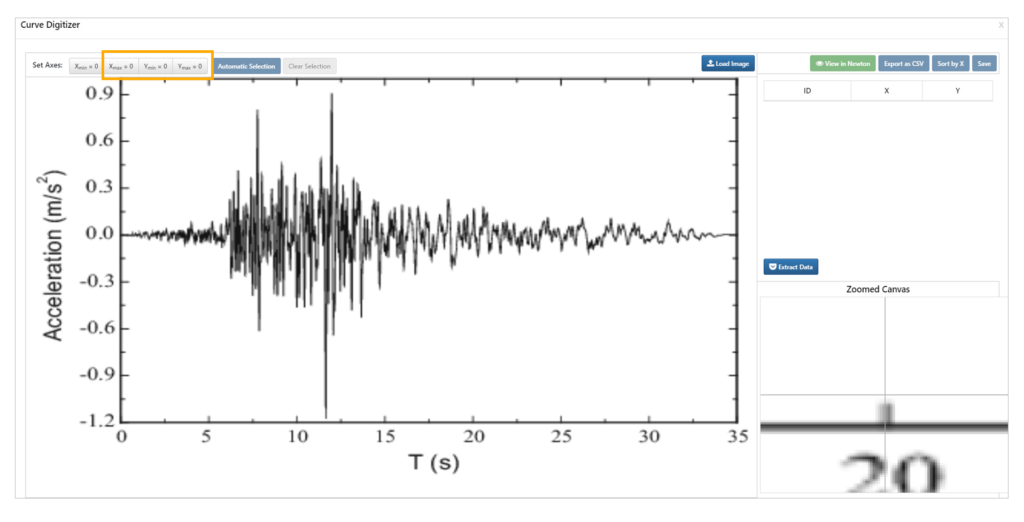
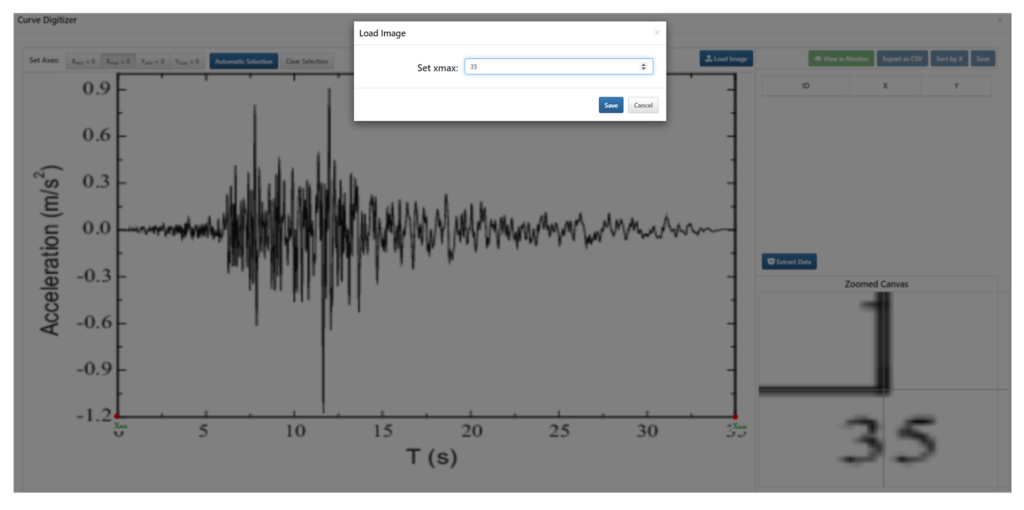
Step 3: Assign values for x max, y min and y max.
Step 4: Choose automatic selection or manual to select more points.
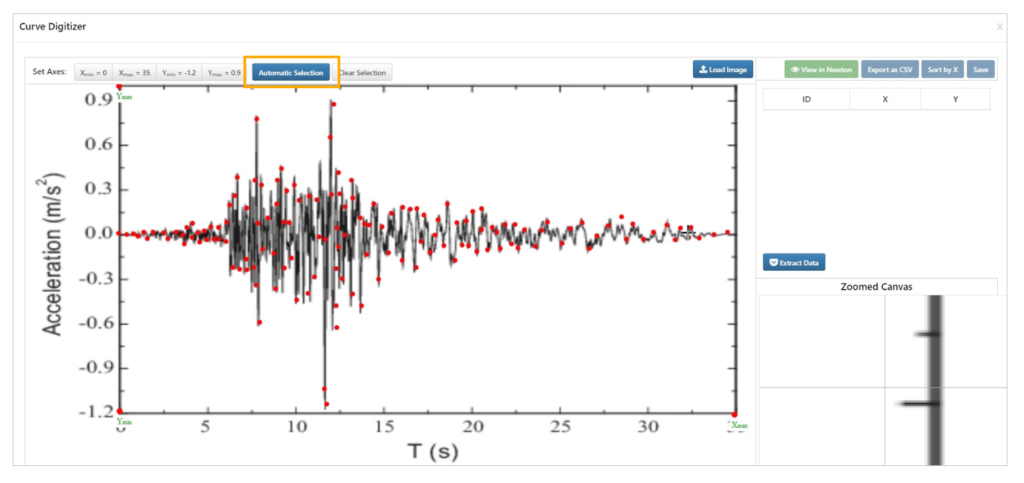
Step 5: Click on Extract Data and save.
Before and After
To learn more about d3VIEW Workflows, please check out this page.