Machine Learning

Learn and Predict Data to Make Better and Faster Decisions

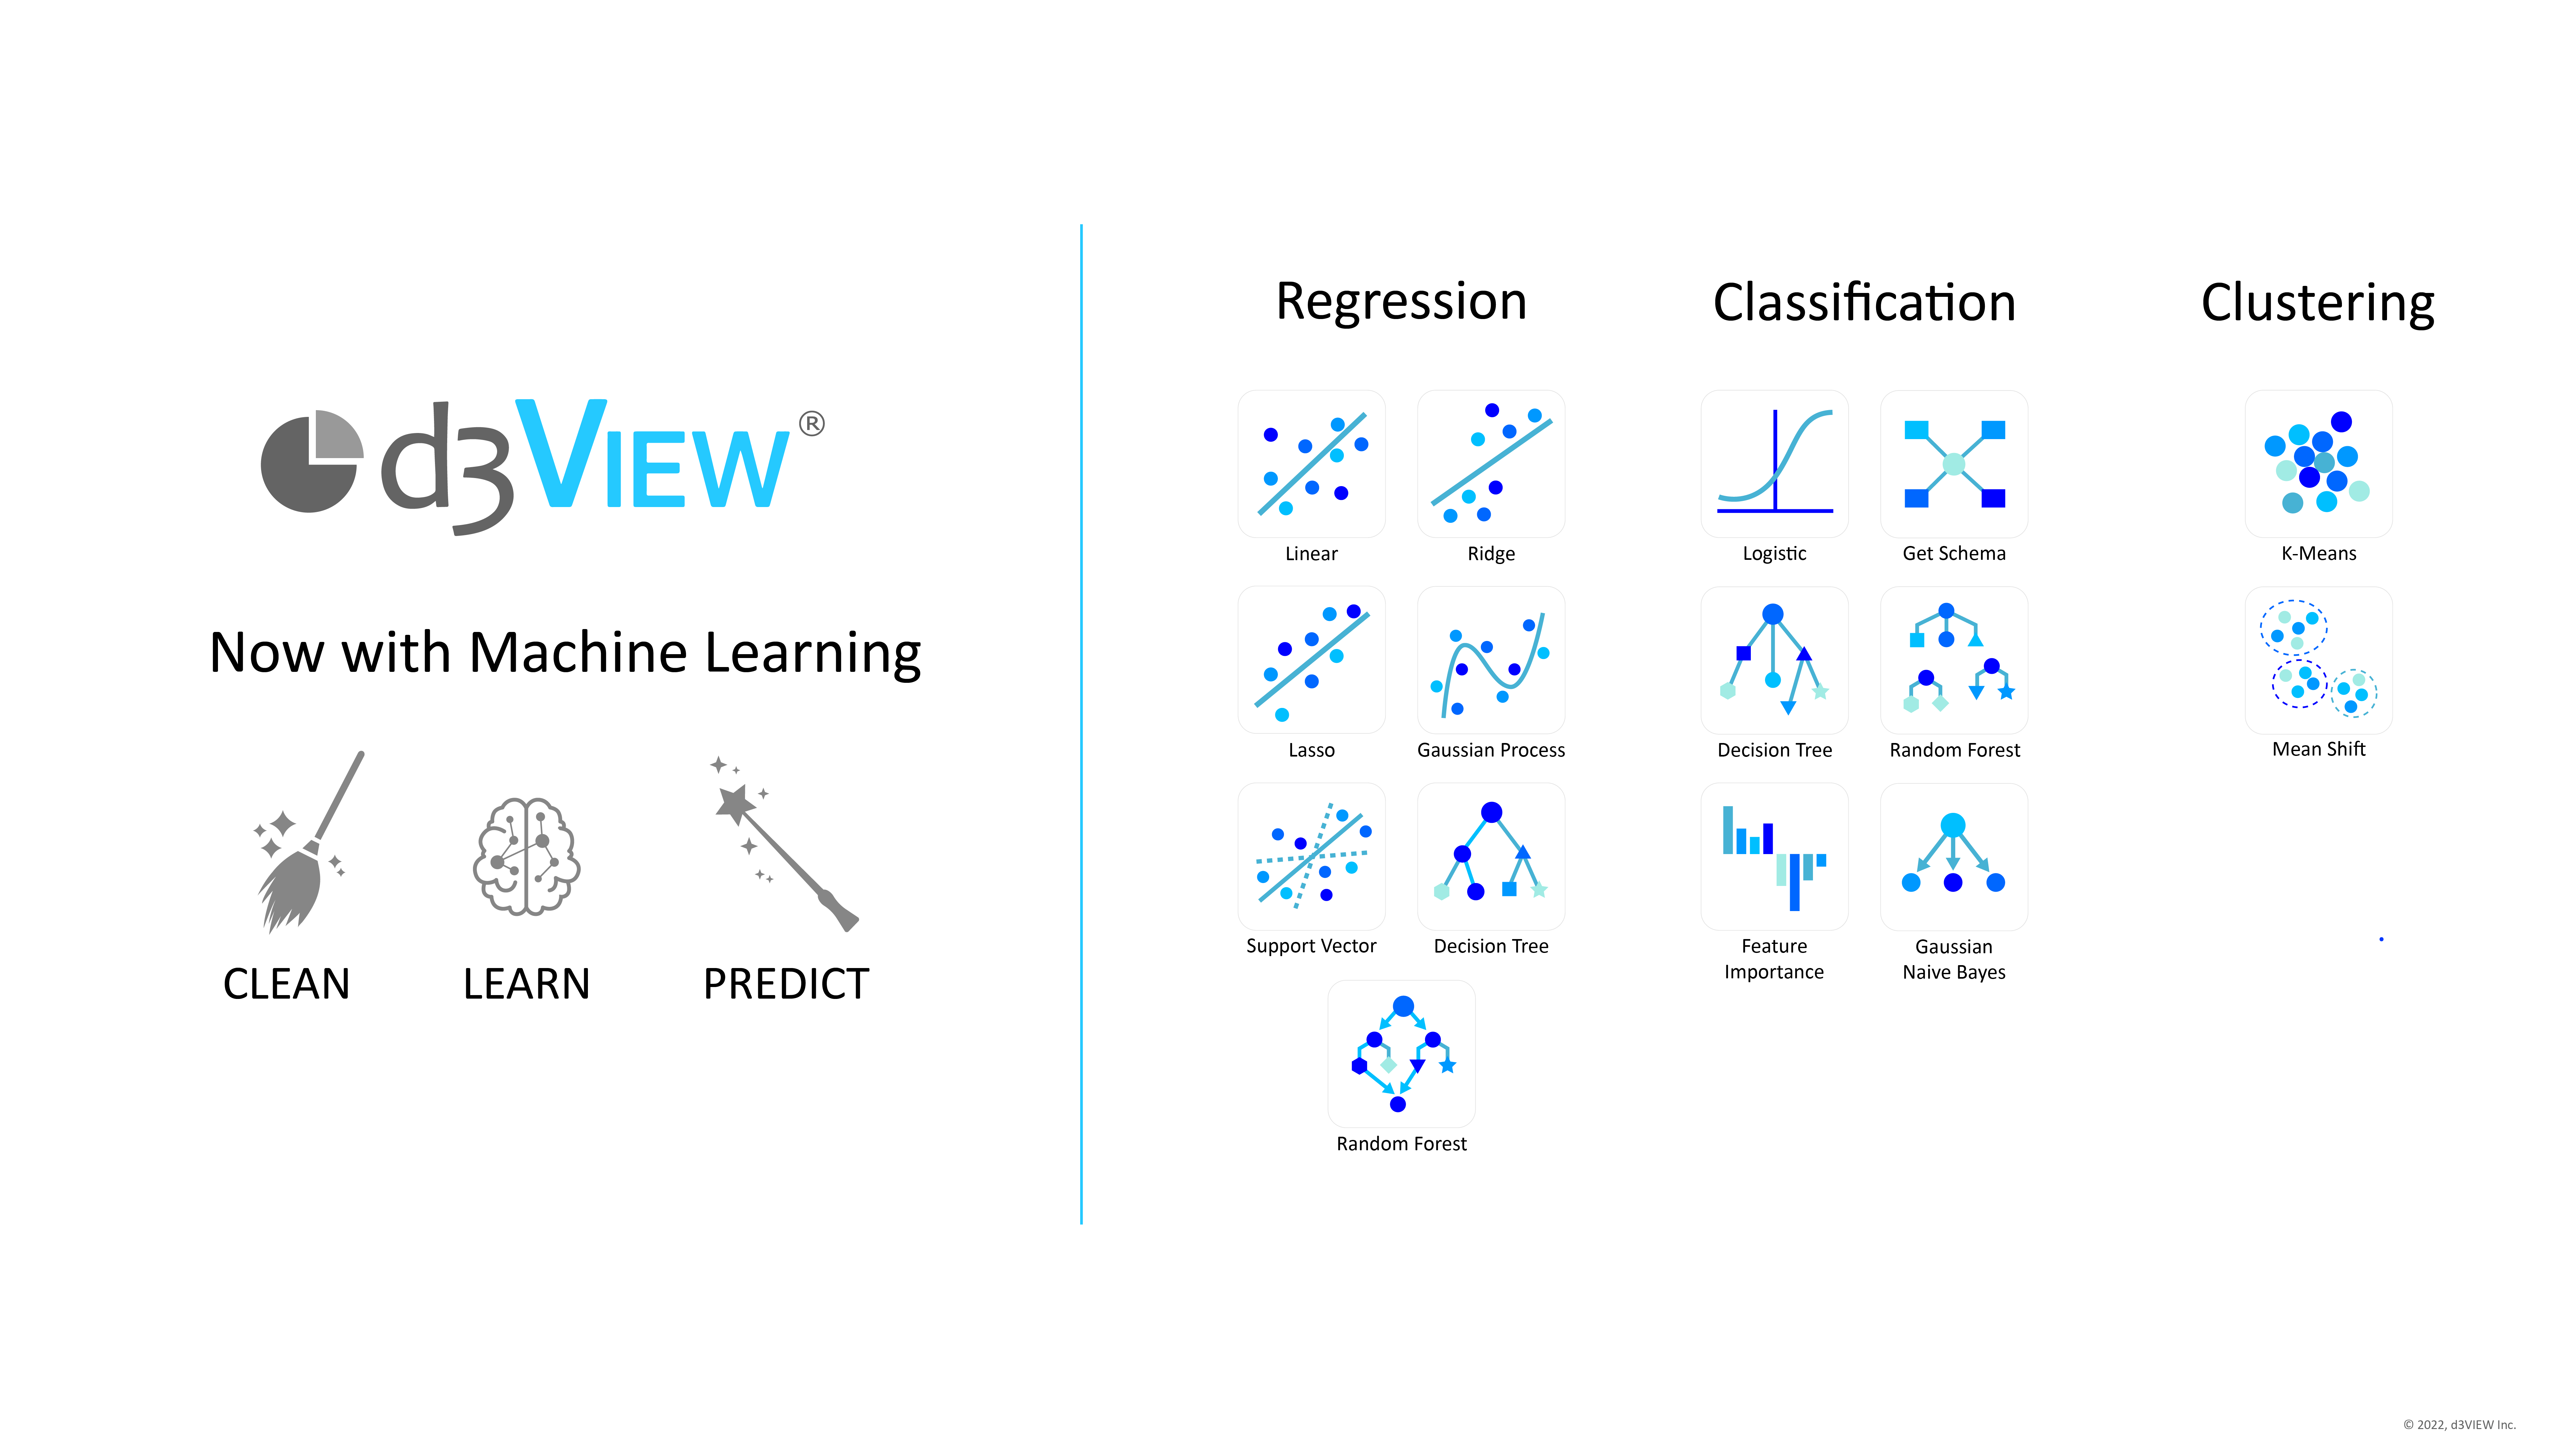
Machine learning model types with a clean, learn, and predict workflow

Data Exploration

We must dig deep to find insights in our data that reveal patterns and relational variables.

Advanced extraction, organization and visualizers play a major role in these discoveries.

Raw engineering points become distributions and correlations before a selected variable relationship is isolated

Machine Learning Models

d3VIEW currently has 16 machine learning models to utilize with even more to come.

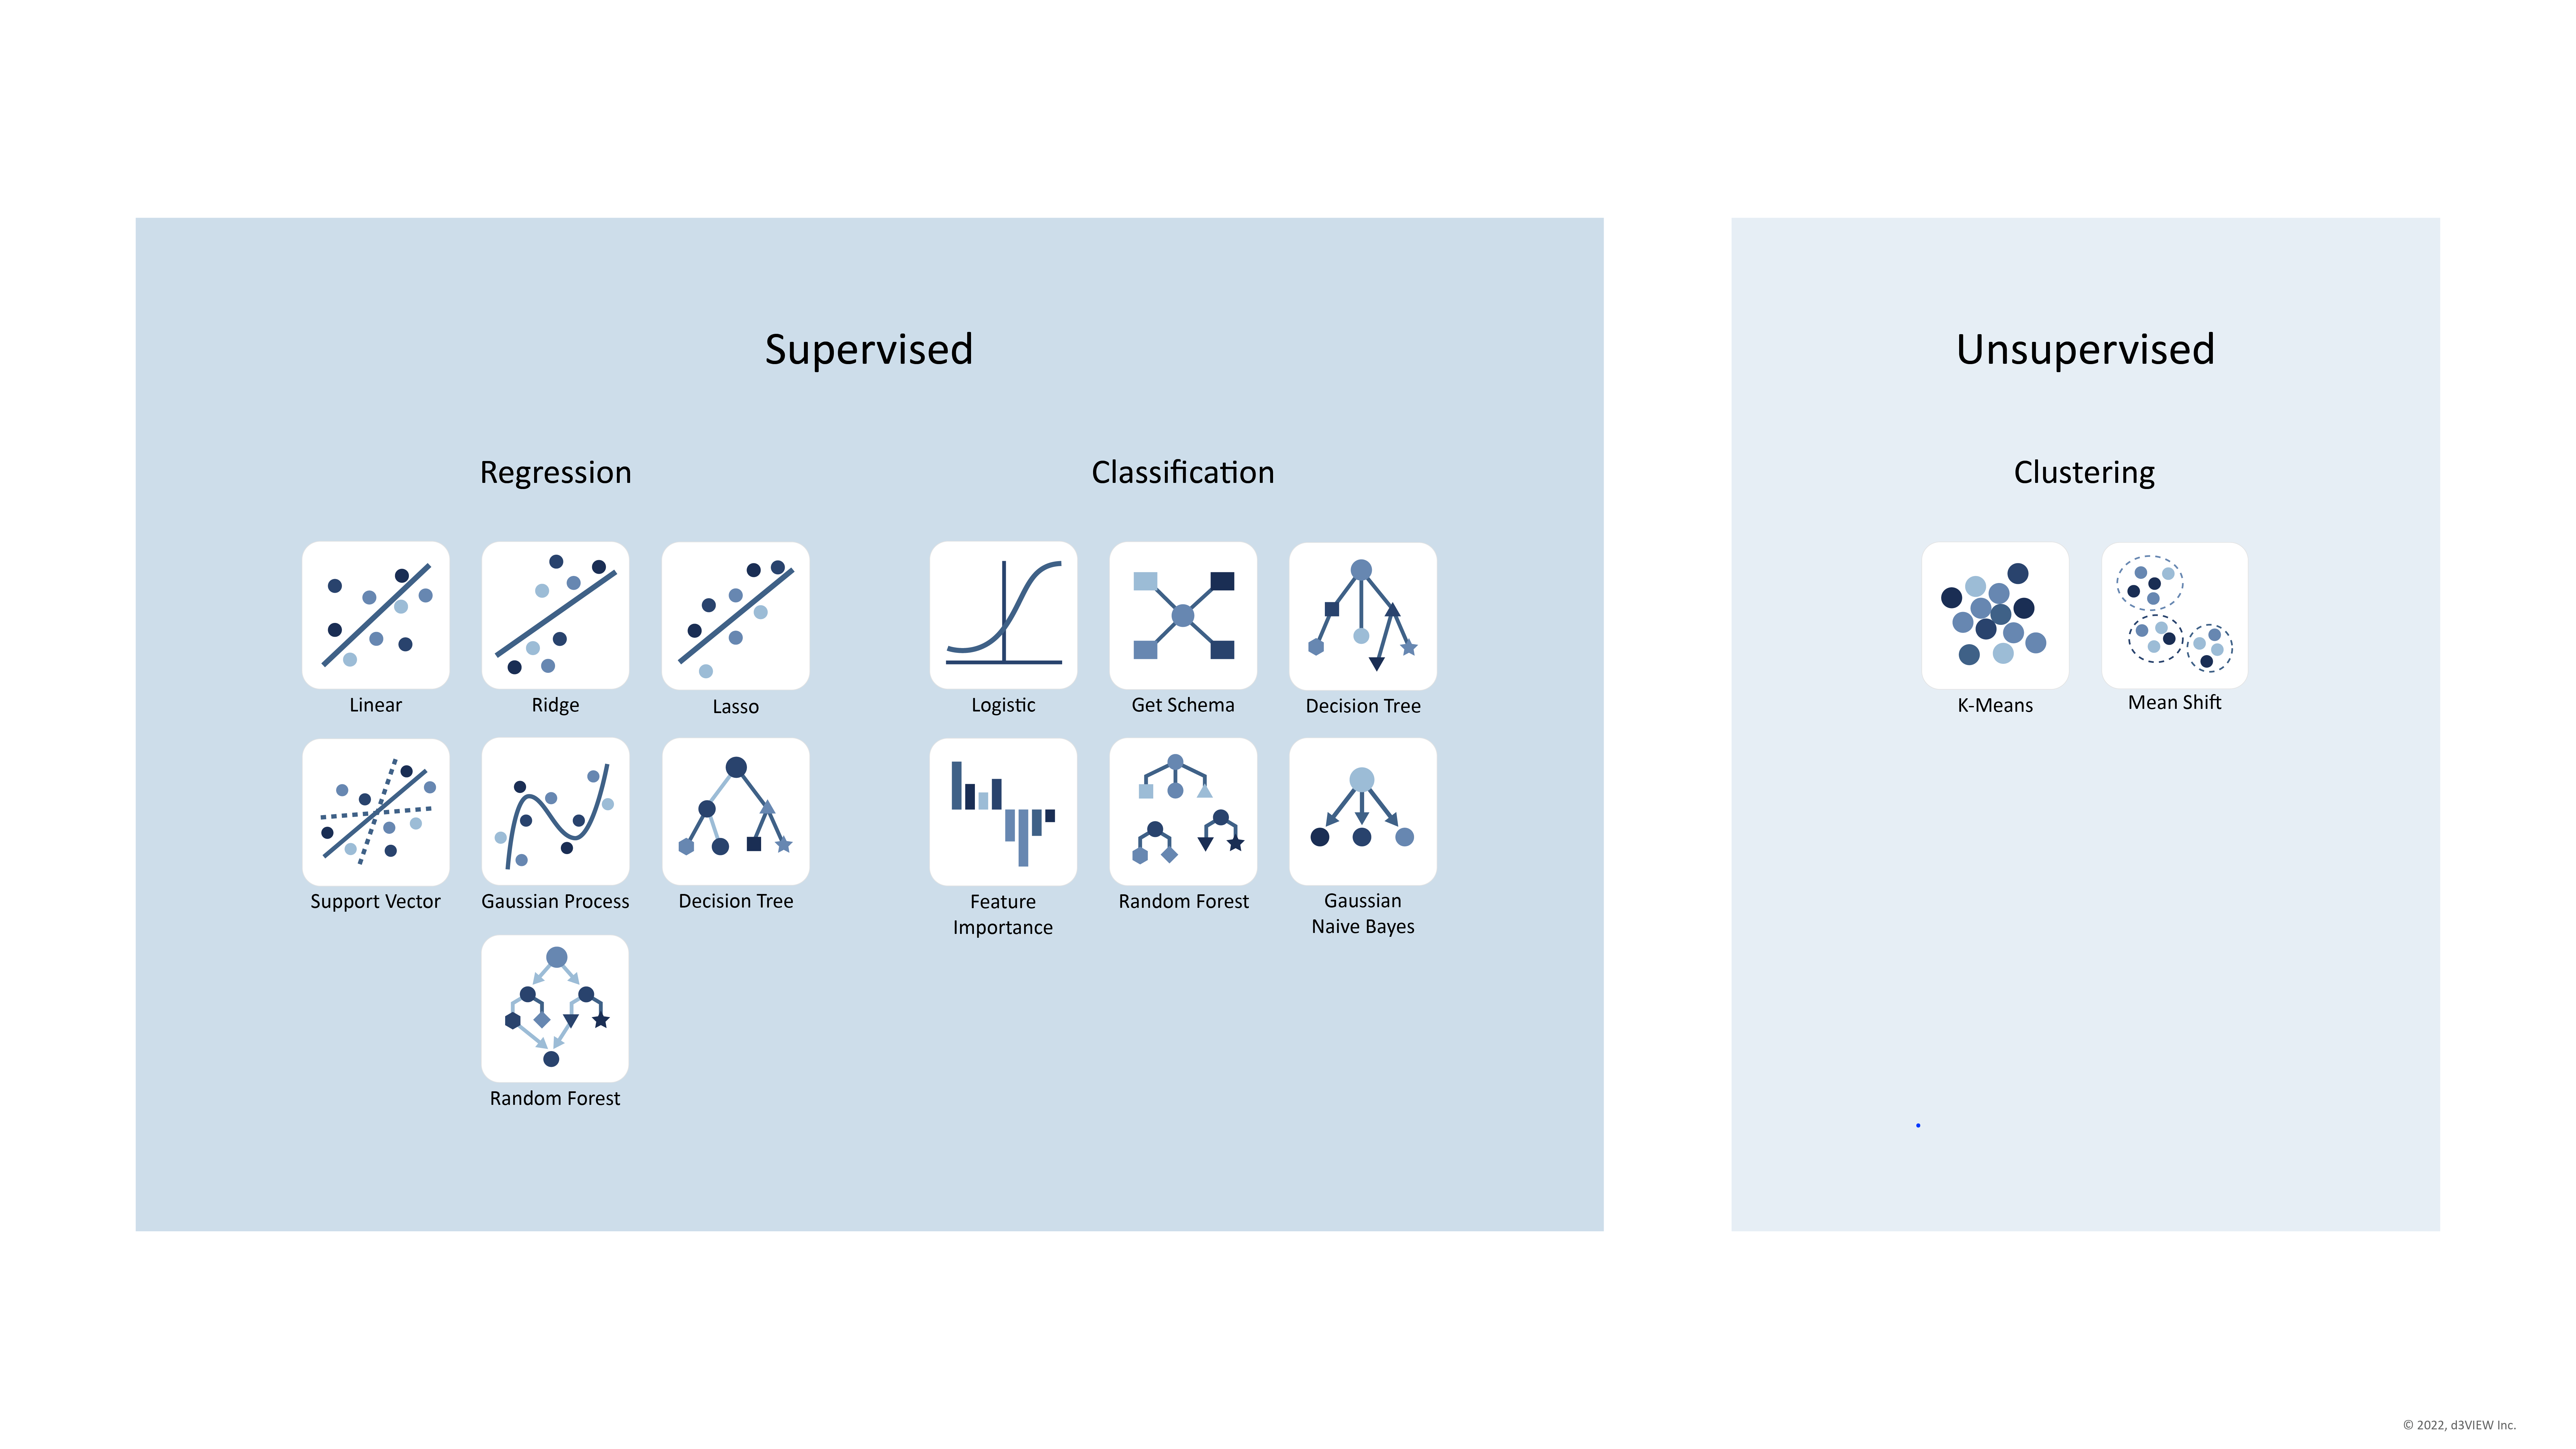
Choose from the two supervised learning types, regression which predicts numerical values, and classification which predicts categorical values.

Or, choose the unsupervised learning type, clustering, which groups data points into clusters for a more generalized understanding of patterns in data.

  • RegressionPredicts numerical values.
  • ClassificationPredicts categorical values.
  • ClusteringGroups data points into clusters.
Supervised regression and classification models alongside unsupervised clustering models

Prediction and Visualization

Use machine learning models to predict numerical values, categorical values, and groups, then visualize the results.

Predicting Head Injury Criteria from Pedestrian Impact Simulations

This example shows the use of linear, lasso and ridge regression ML models to predict HIC values based on hood and bumper thickness.

These regression predictions illustrate their models as 3D scatter/surface plots.
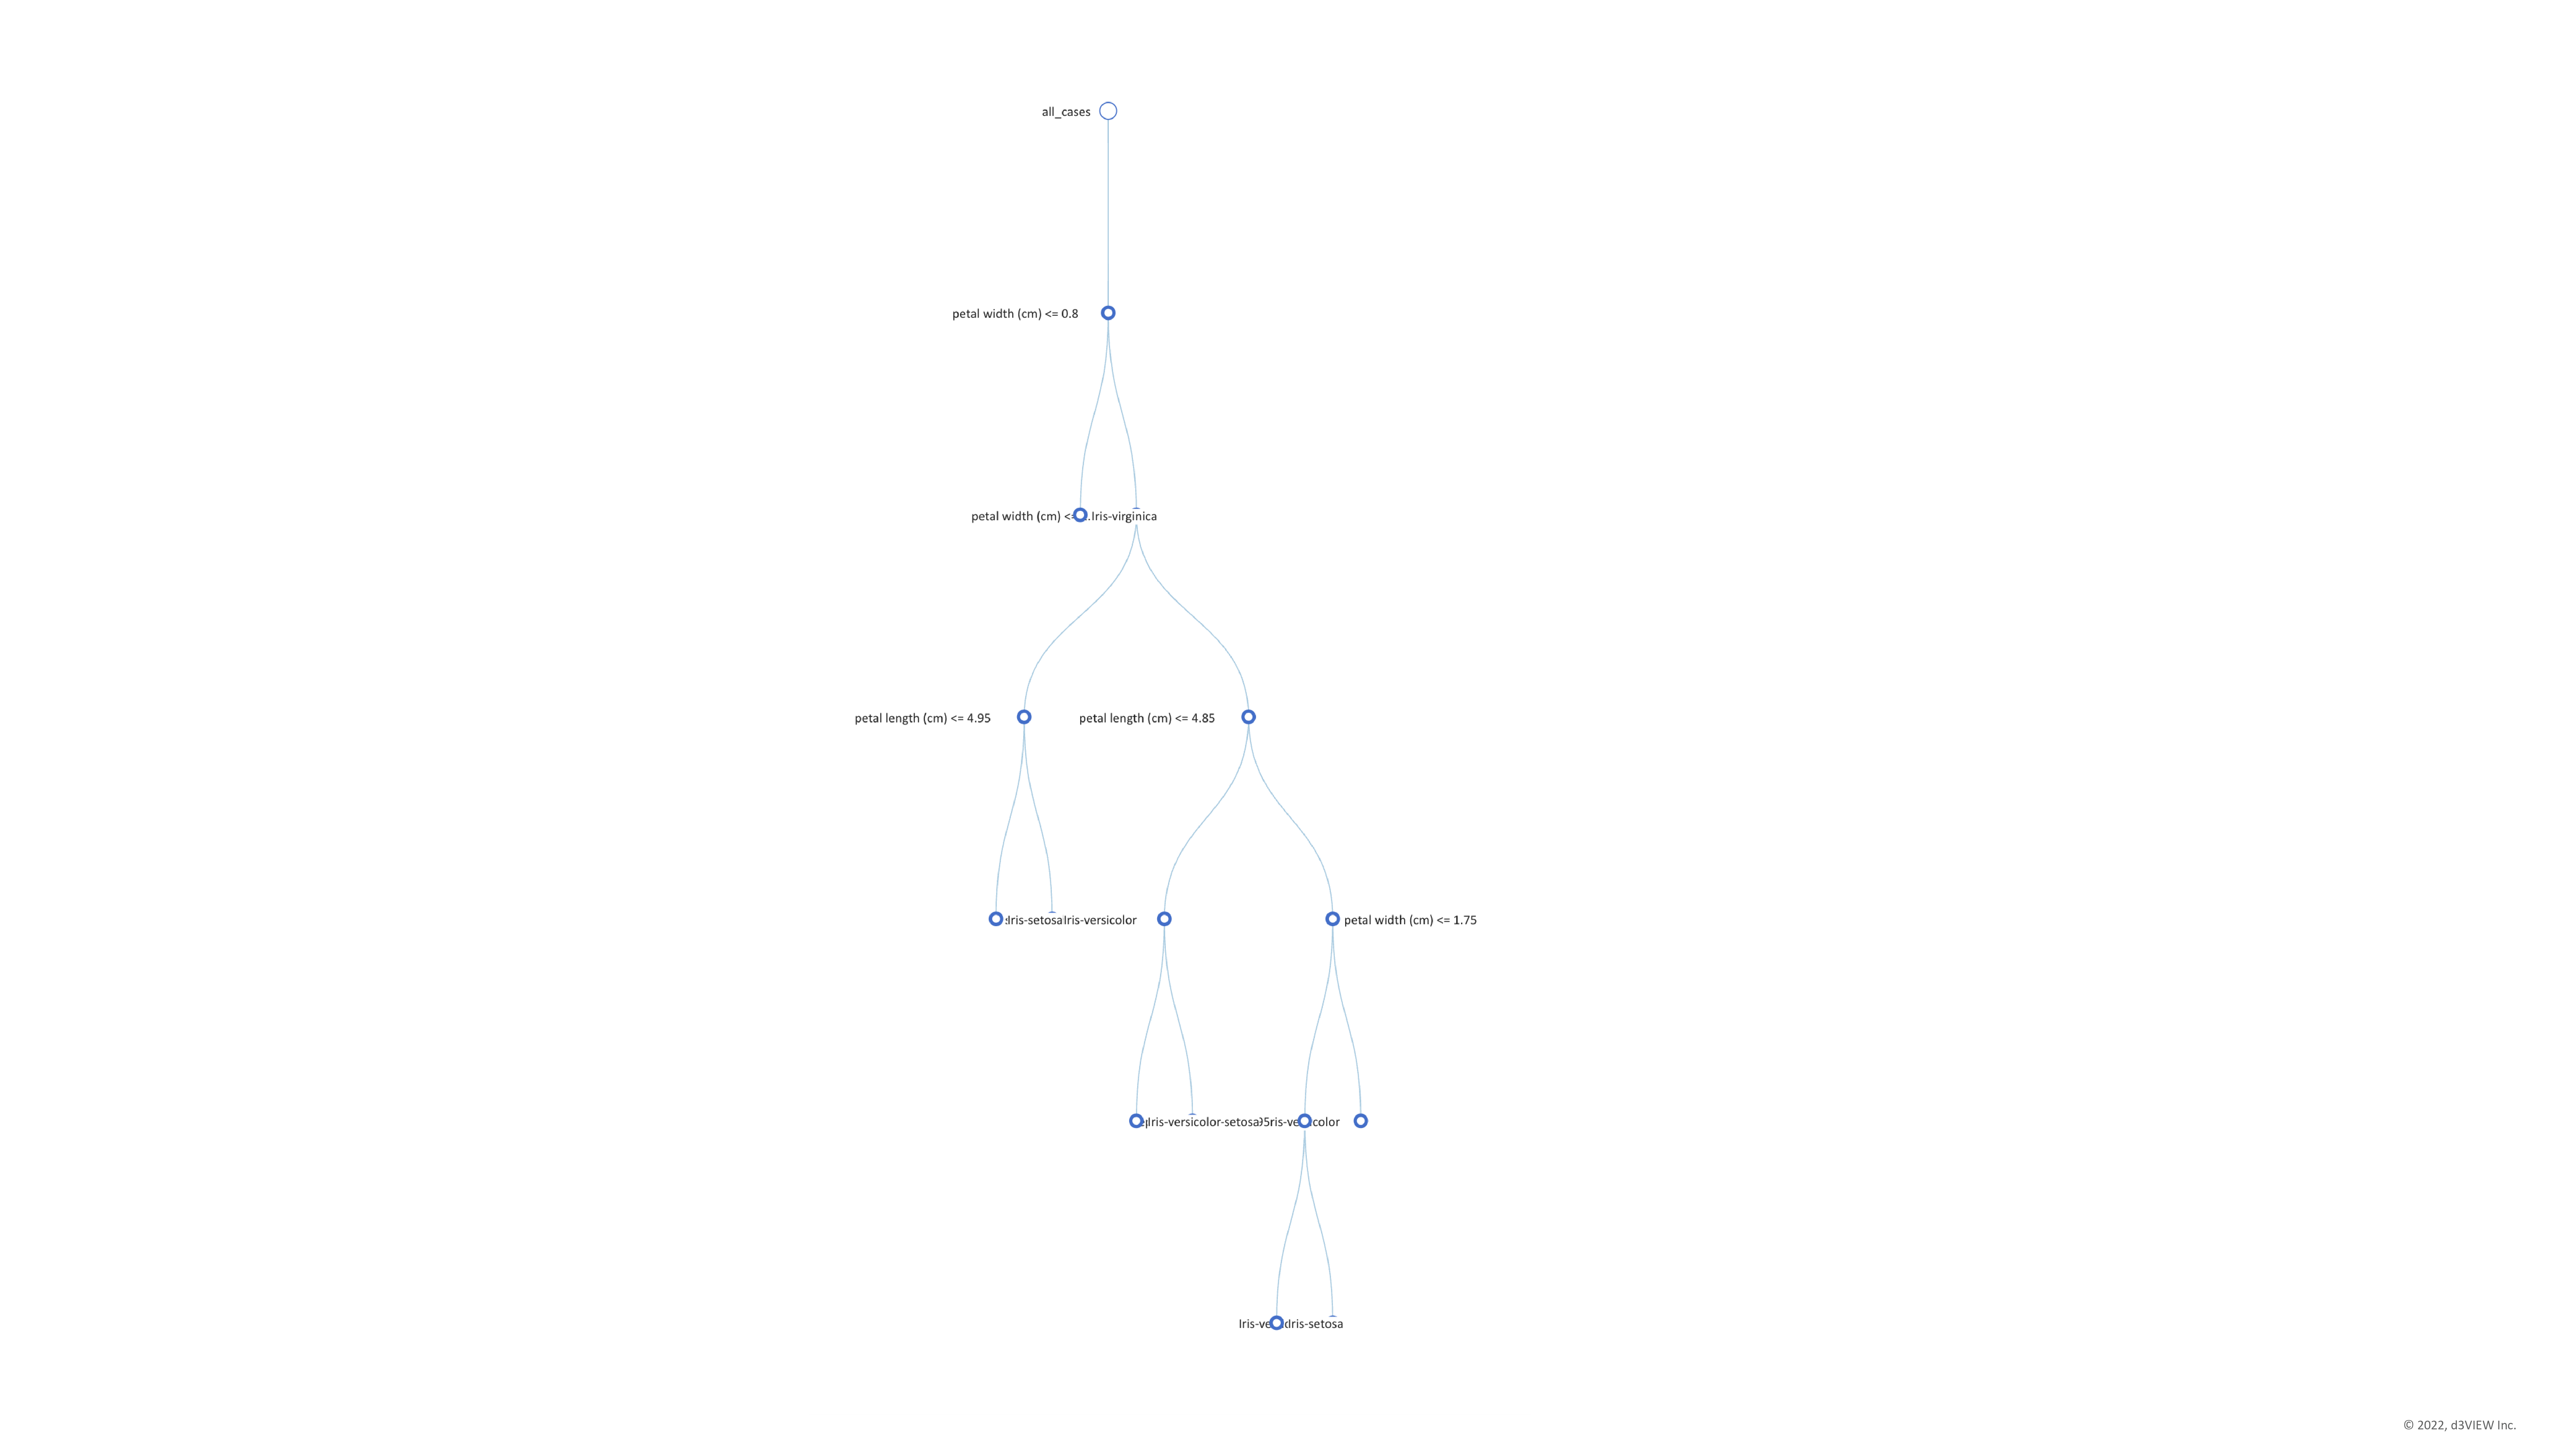
Decision tree visualization for Iris flower classification

Predicting Iris Flower Species

This example shows the use of decision tree, random forest and feature importance classification ML models to predict flower class based on petal and sepal width and length.

These classification predictions illustrate their models as hierarchical data trees and horizontal bar charts.

Predicting Groups for Auto MPG and Weight

This example shows the use of k-means and mean shift clustering ML models to predict groups based on automobile miles per gallon and weight.

These clustering predictions illustrate their models as scatter plots, with k-means using an indicated cluster amount and mean shift using an indicated cluster bandwidth for grouping.

Using Prediction Models

Use the generated model to predict new points, as shown using the HIC example from above.

Manually input single points or upload a CSV of multiple points to predict data based on the ML model.

  • Manually input single points
  • Upload a CSV of multiple points
A single design point and a CSV batch enter a trained model and produce an HIC response with a confidence range

ML App Integration

Currently, the main d3VIEW applications that can tap into these Machine Learning capabilities include HPC jobs, Simulations, Physical Tests, Databases, Workflows and Simlytiks®.

Measured scatter data enters feature preparation and a layered model, producing a prediction curve with a confidence band that connects to an HPC rack, physical test specimen, and simulation mesh workflow
  • HPC jobs
  • Simulations
  • Physical Tests
  • Databases
  • Workflows
  • Simlytiks®

More Machine Learning Possibilities

d3VIEW plans on incorporating more ML features to come which include but are not limited to:

  • Learn and predict curves
  • Time-series forecasting
  • Reinforcement learning
  • Image classifications
Two example curves for learning and prediction

To Learn More, Contact Us for a Live Demo!

Request a demo