10.  Animating
Simlytiks supports animating for some basic charts which include bubble chart, vertical bar chart, parallel coordinates, line and heat map.
Fruits Bubble Chart Animation
10.1. Adding Animations
Animation options for charts can be added by editing the visualizer. Click on Edit Viz in the right corner chart menu, and select the play icon to the left of the chart area. Here, we’ll choose a data column to animate.
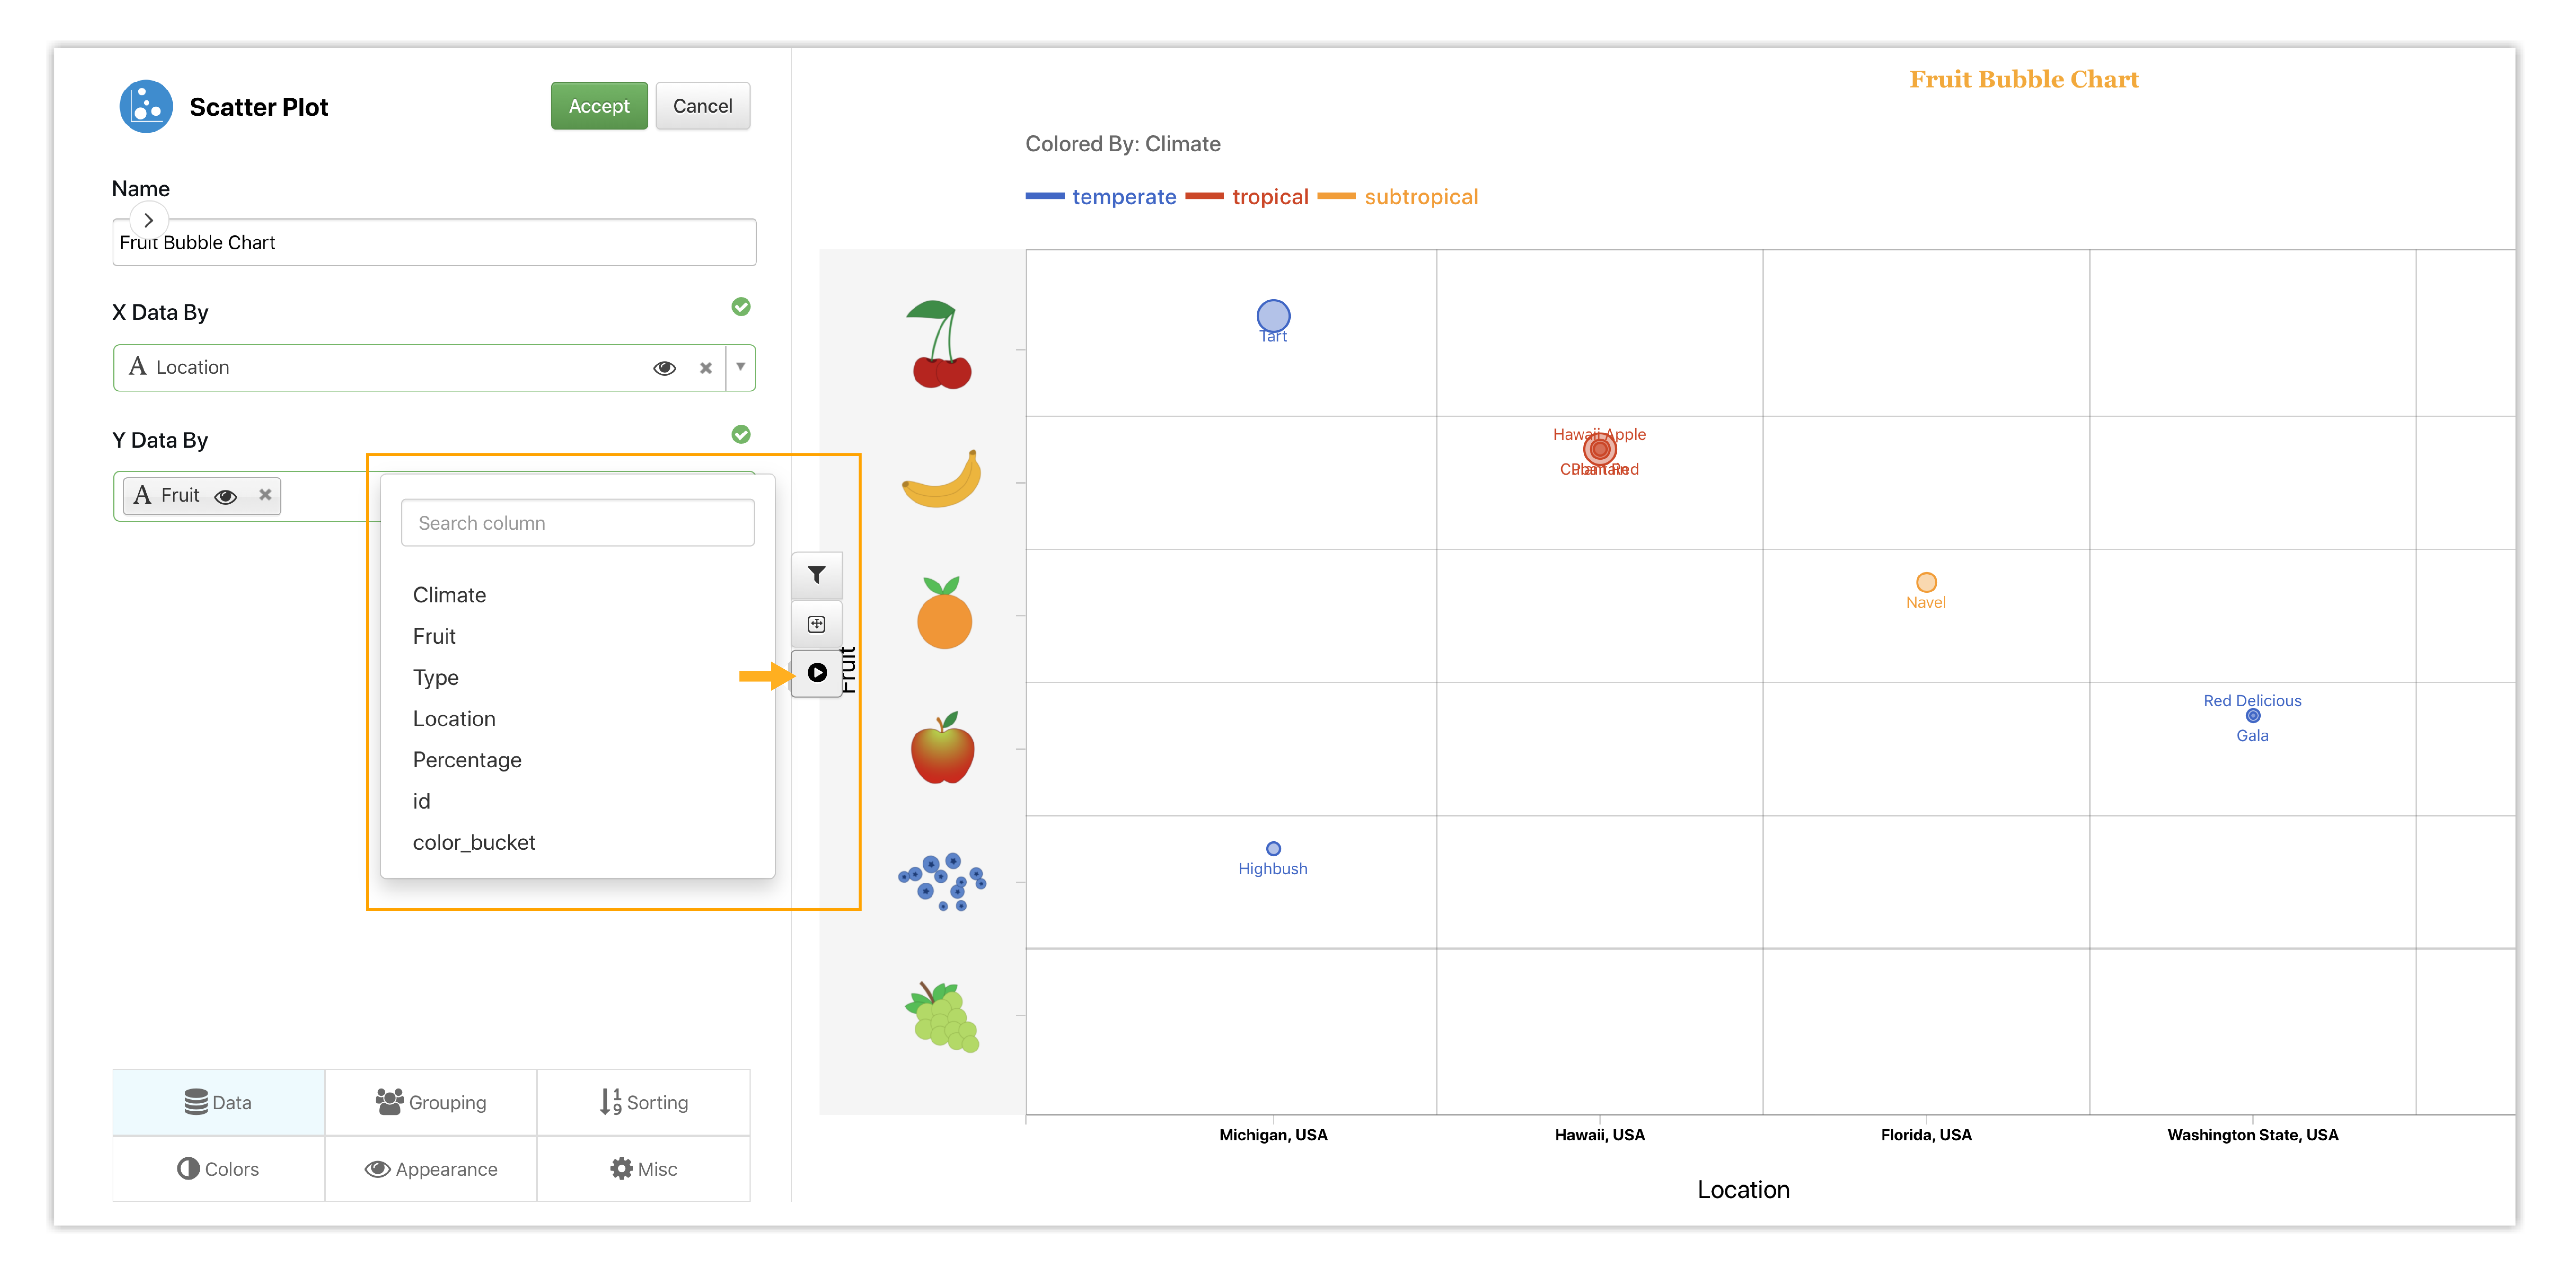
Chart Animation
Animation is automatically accumulative, adding a new bucket (specific data) as the animation progresses, but this can be turned off, which will present each bucket separately. The following video shows the process of adding animations to the bubble chart.
10.2. Animation Examples
The following are animation examples of a couple different charts using datasets from the Chart Examples section.
UFO Sightings
This videos shows animating bubble chart with the UFO dataset based on state (location).
Breakfast Cereals
This videos shows animating vertical bar chart with the Breakfast Cereals dataset based on calories.
Michigan Museums
This videos shows animating parallel coordinates with the Michigan Museums dataset based on museum type.
Average Weather
This videos shows animating line chart with the Average Weather dataset based on European country.