12.  Filters and Highlighters
Highlighting and filtering data allows us to study and compare specific areas more effectively.
Fruits Bubble Chart Highlighted Filter
We use highlighters to select dataset rows and use filters to exclude or include rows.
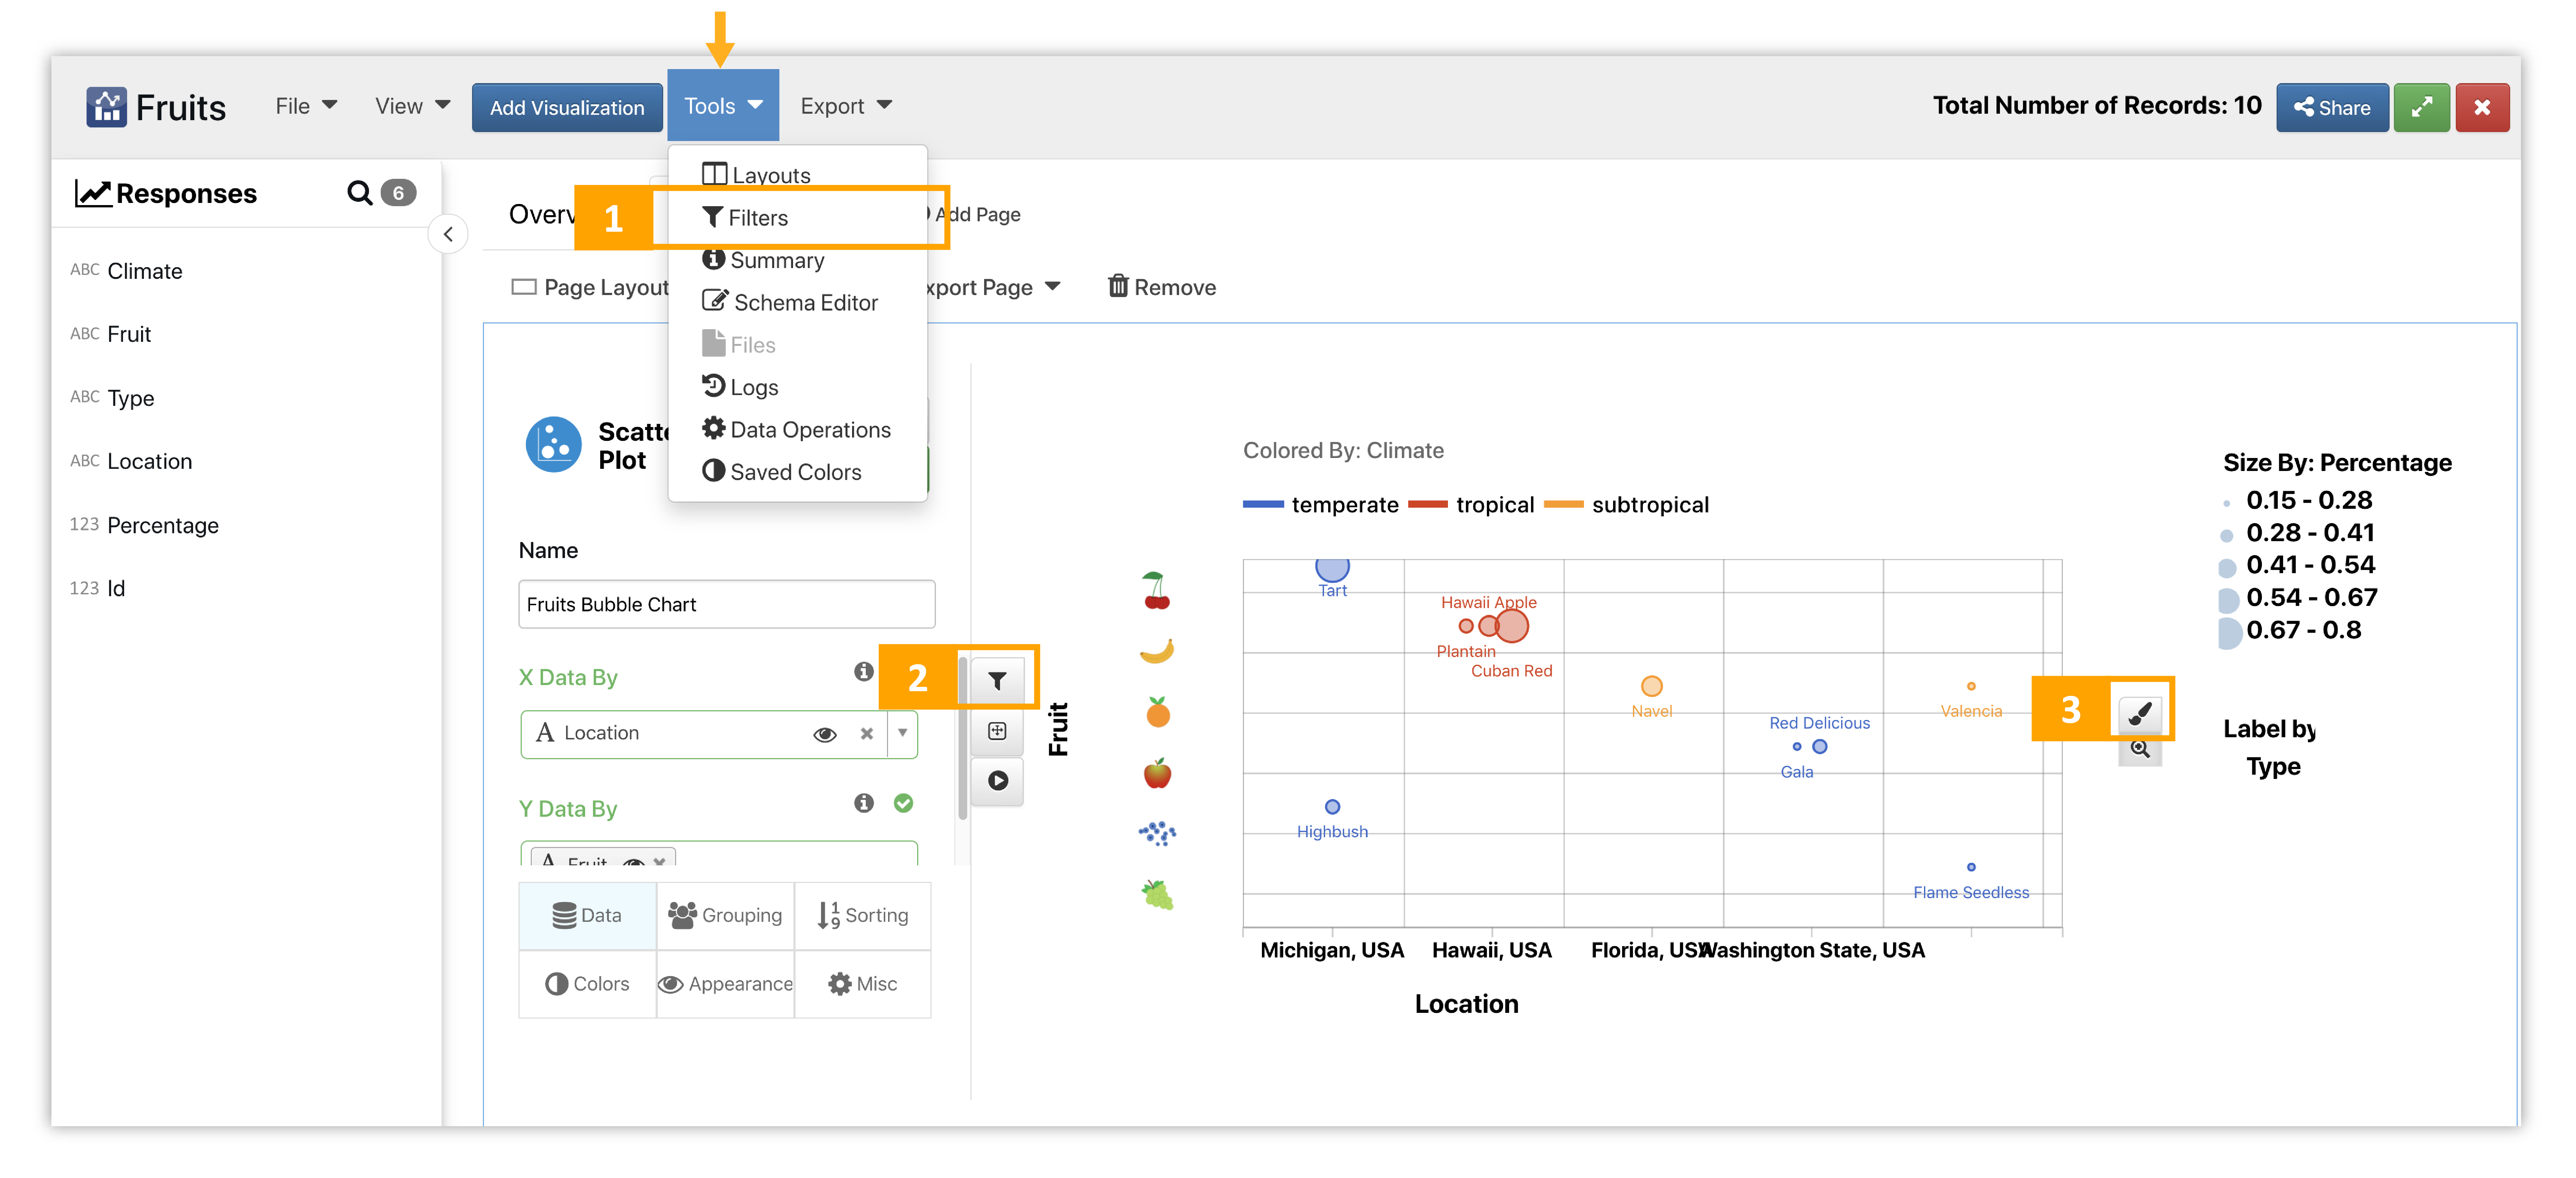
Figure 1: Filtering Options
- Global Filters
- Local Chart Filters
- Highlighted Filters
Read on to learn more about each filtering option.
12.1. Highlighted Filters
To highlight data rows on an individual chart, click on the marker icon to the right of the visualization. Then, drag-select areas of the chart to be filtered. Once we have a selection, a filter icon will appear at the top right corner of the chart box. Click on this icon and choose to exclude (hide) or include (isolate) the selected data. We can clear all filters anytime by clicking on the filter icon again.
Here is an example of highlighting and filter a bubble chart.
12.2. Inter-chart Communication
Adding highlighted filters to one chart implements these filters throughout the Simlytiks Dashboard. So when we explore our other charts or add new ones, the data shown in these charts will automatically be filtered to match the originally filtered chart. When we clear all filters from this original chart, all other chart filters will be cleared as well.
See how this works in the following example:
12.3. Local Chart Filters
Individual chart filters are available under Edit Viz in the top right corner chart menu. Click on the filter icon that appears on to the left side of the chart area. These basic filters are based on data columns. Click on a data column to add filters to and use the smart menu to choose which specific data to filter.
12.4. Global Manual Filters
We can add manual filters to our dataset under the Tools menu. This option allows us to get specific with filtering. Click on the Tools Menu and choose Filters. In the next window, click on Add Filter. Here, we’ll add specifications and choose our conditions for the filter.
Specifications include:
- Scope: Choose to make this filter global or local. For local, we can specify the visualization in the drop-down that appears when selecting this option.
- Mode: Choose to keep (isolate) or exclude (hide) filtered IDs.
- State: Choose to keep this filter enabled (on) or disabled (off).
Watch the following video to see how to successfully add a global filter: