15.  Crash Safety Charts
Simlytiks supports crashworthiness visualization with specific charts dedicated for Ped Pro, IIHS and Survival Space. The curve plot and table visualizations also support aPLI and FPLI templates.
Examples of Crash Safety Charts
15.1. Ped Pro
After simulating Pedestrian Protection impact points by submitting a job to the server through the d3VIEW platform, we can bring the data into Simlytiks to be visualized using the Ped Pro visualizer and the Ped Pro table.
Ped Pro Visualizer

The Ped Pro visualizer presents all important data consolidated into one chart. Make sure to fill out all necessary information which includes T1, T2, HIC and acceleration.
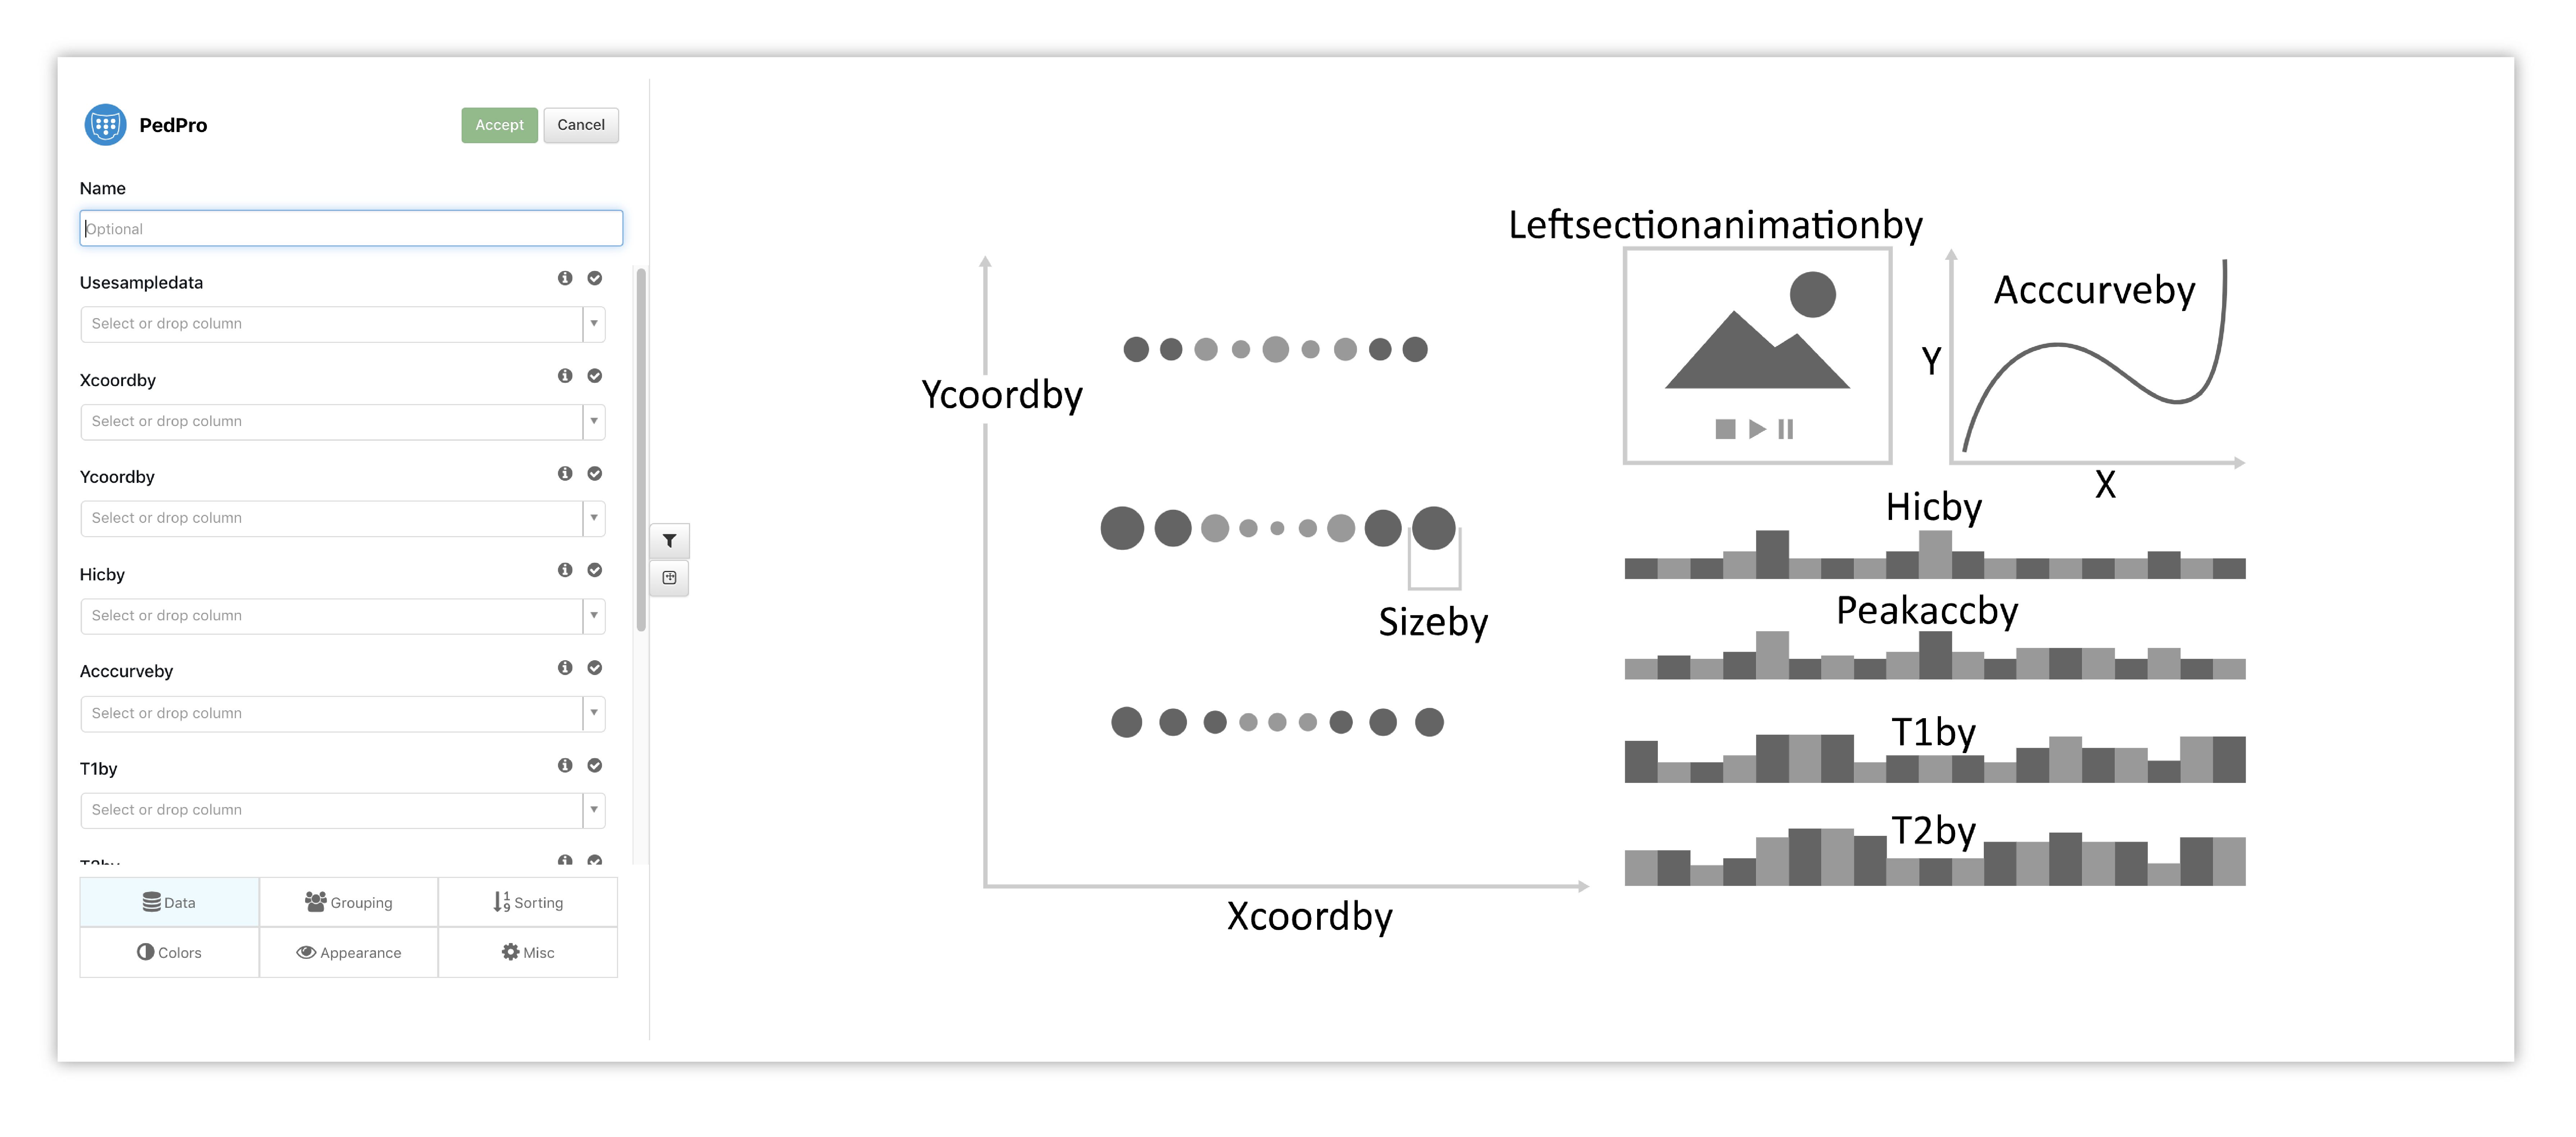
Figure 1: Ped Pro Options & Placeholder
This visualization shows a distribution of values for states T1 and T2 in the lower right along with the distribution of HIC values, peak accelerations and left section animation.
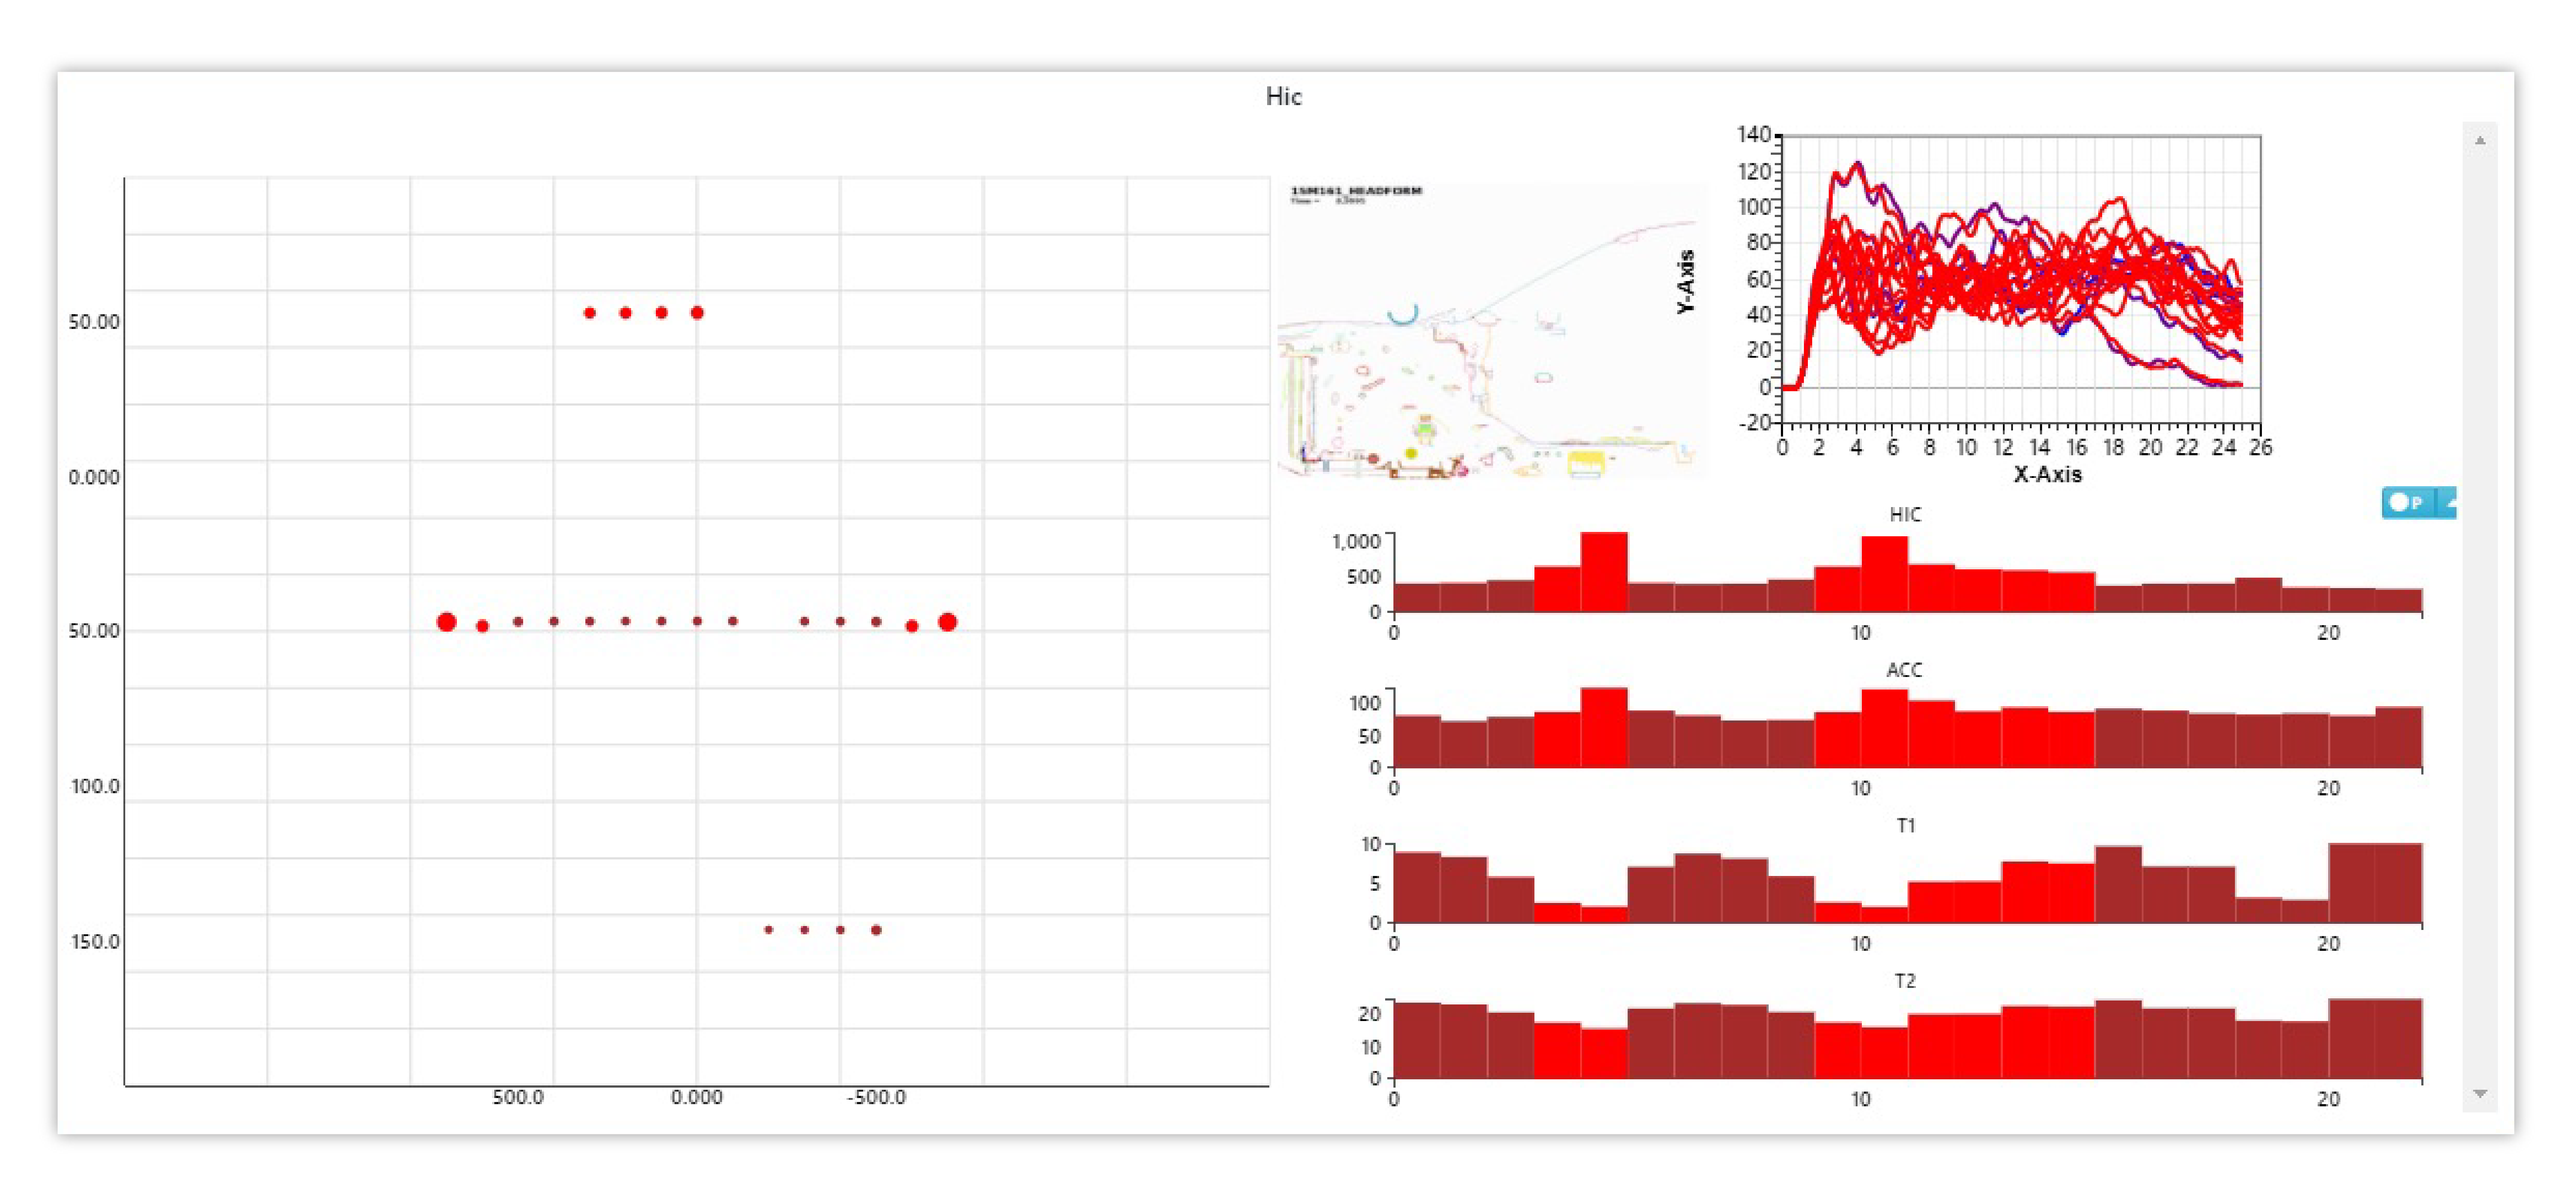
Figure 2: Ped Pro
Ped Pro Table

Ped Pro Table maps out the impact points into bins to help visualize the points on the hood. We’ll add our X data, Y data and HIC values to create this visualization.
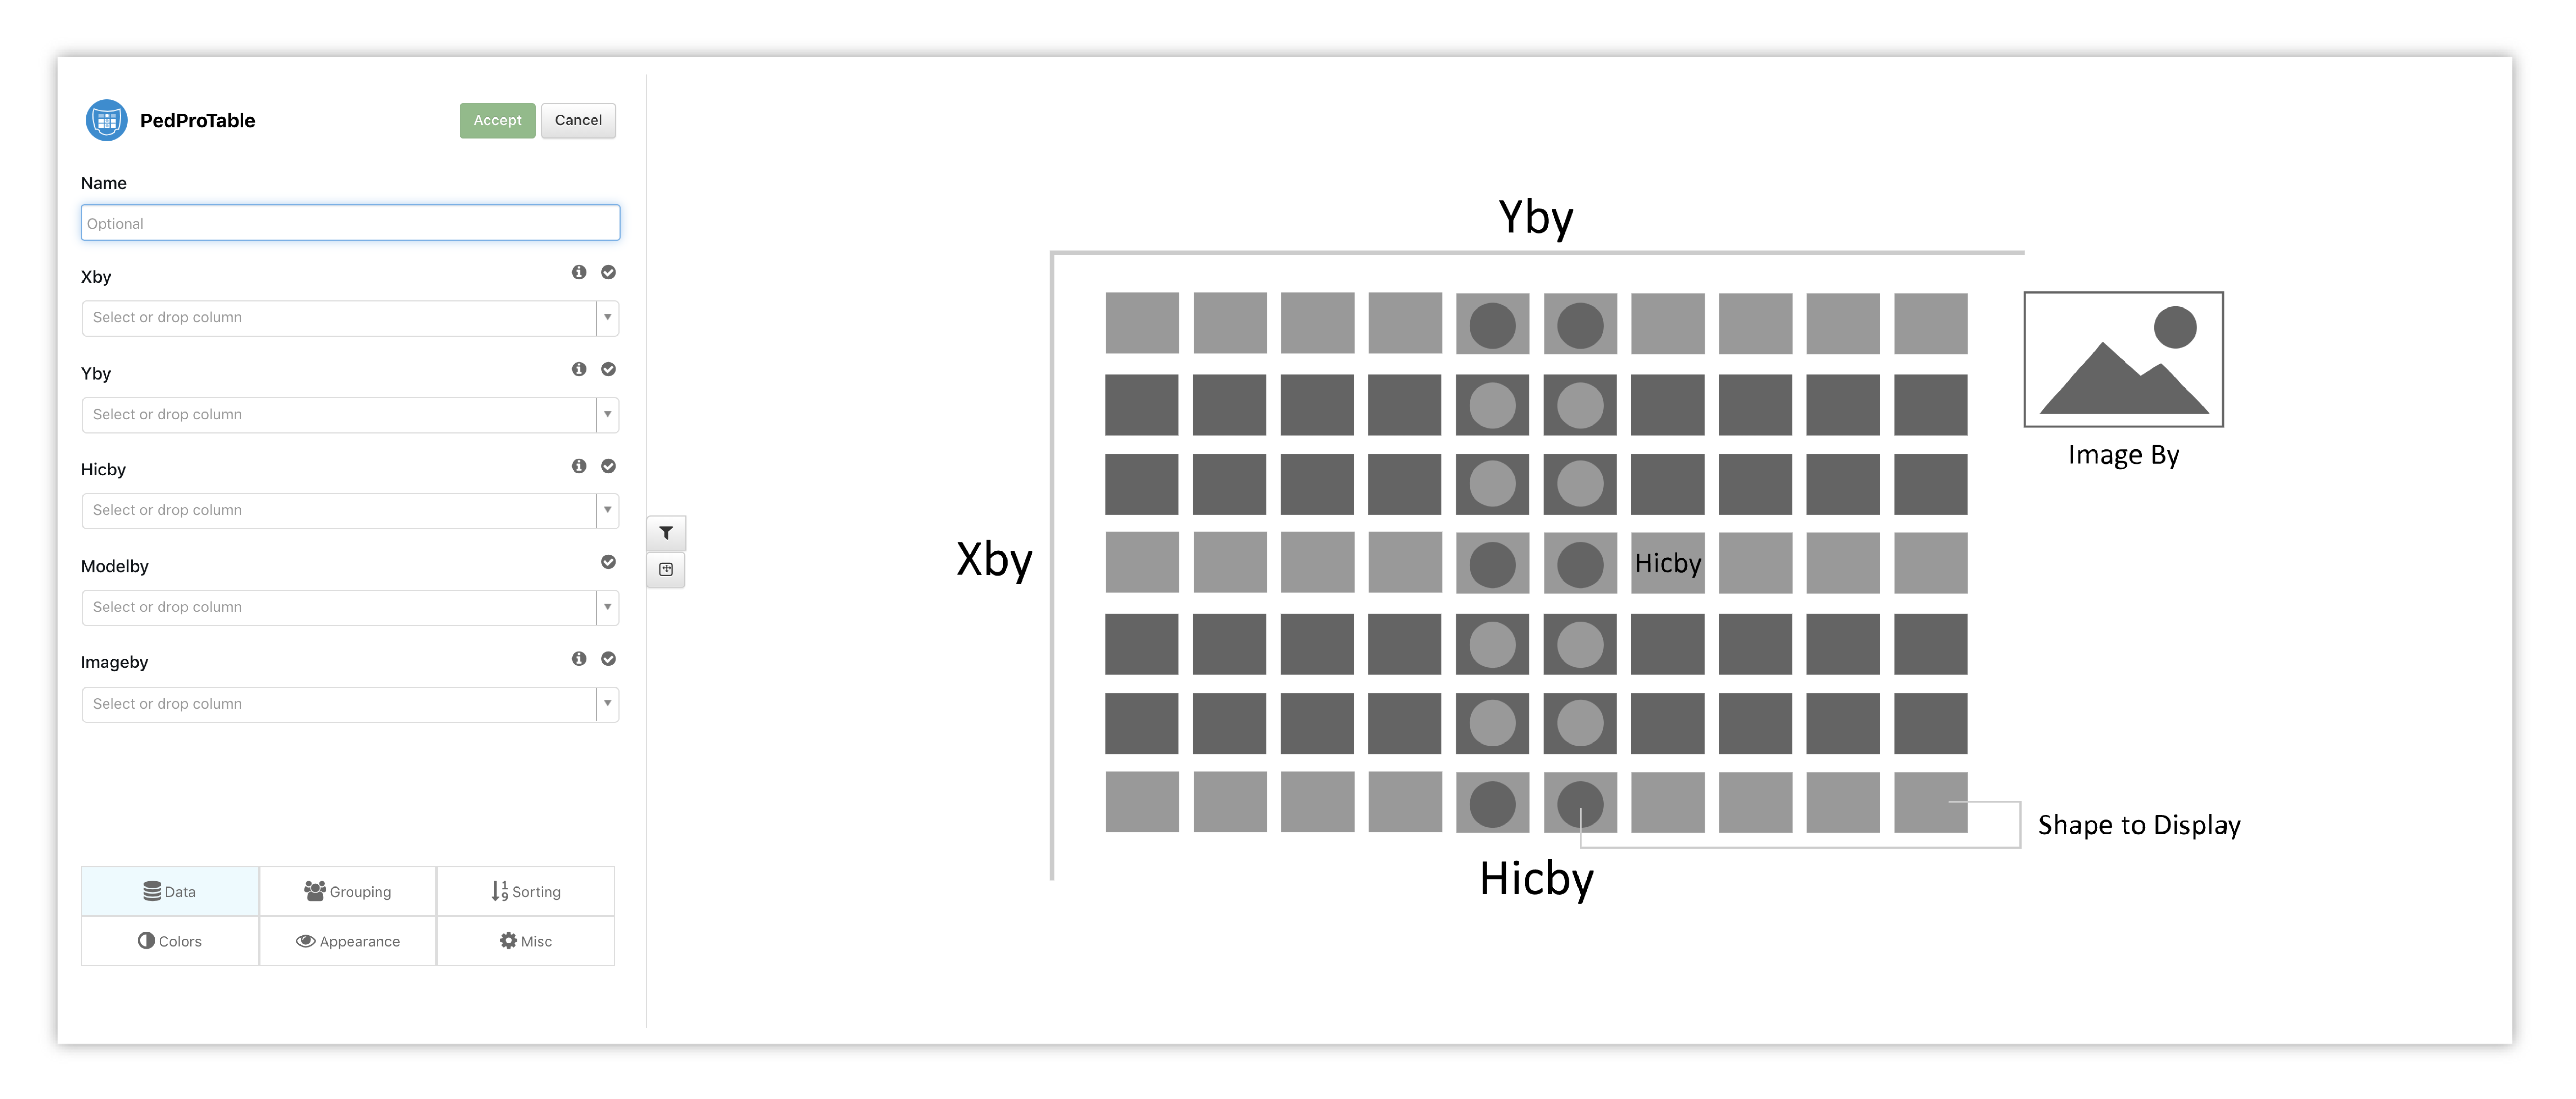
Figure 3: Ped Pro Table Options & Placeholder
The table presents each point as a colored bin which are based on the HIC value legend at the bottom.
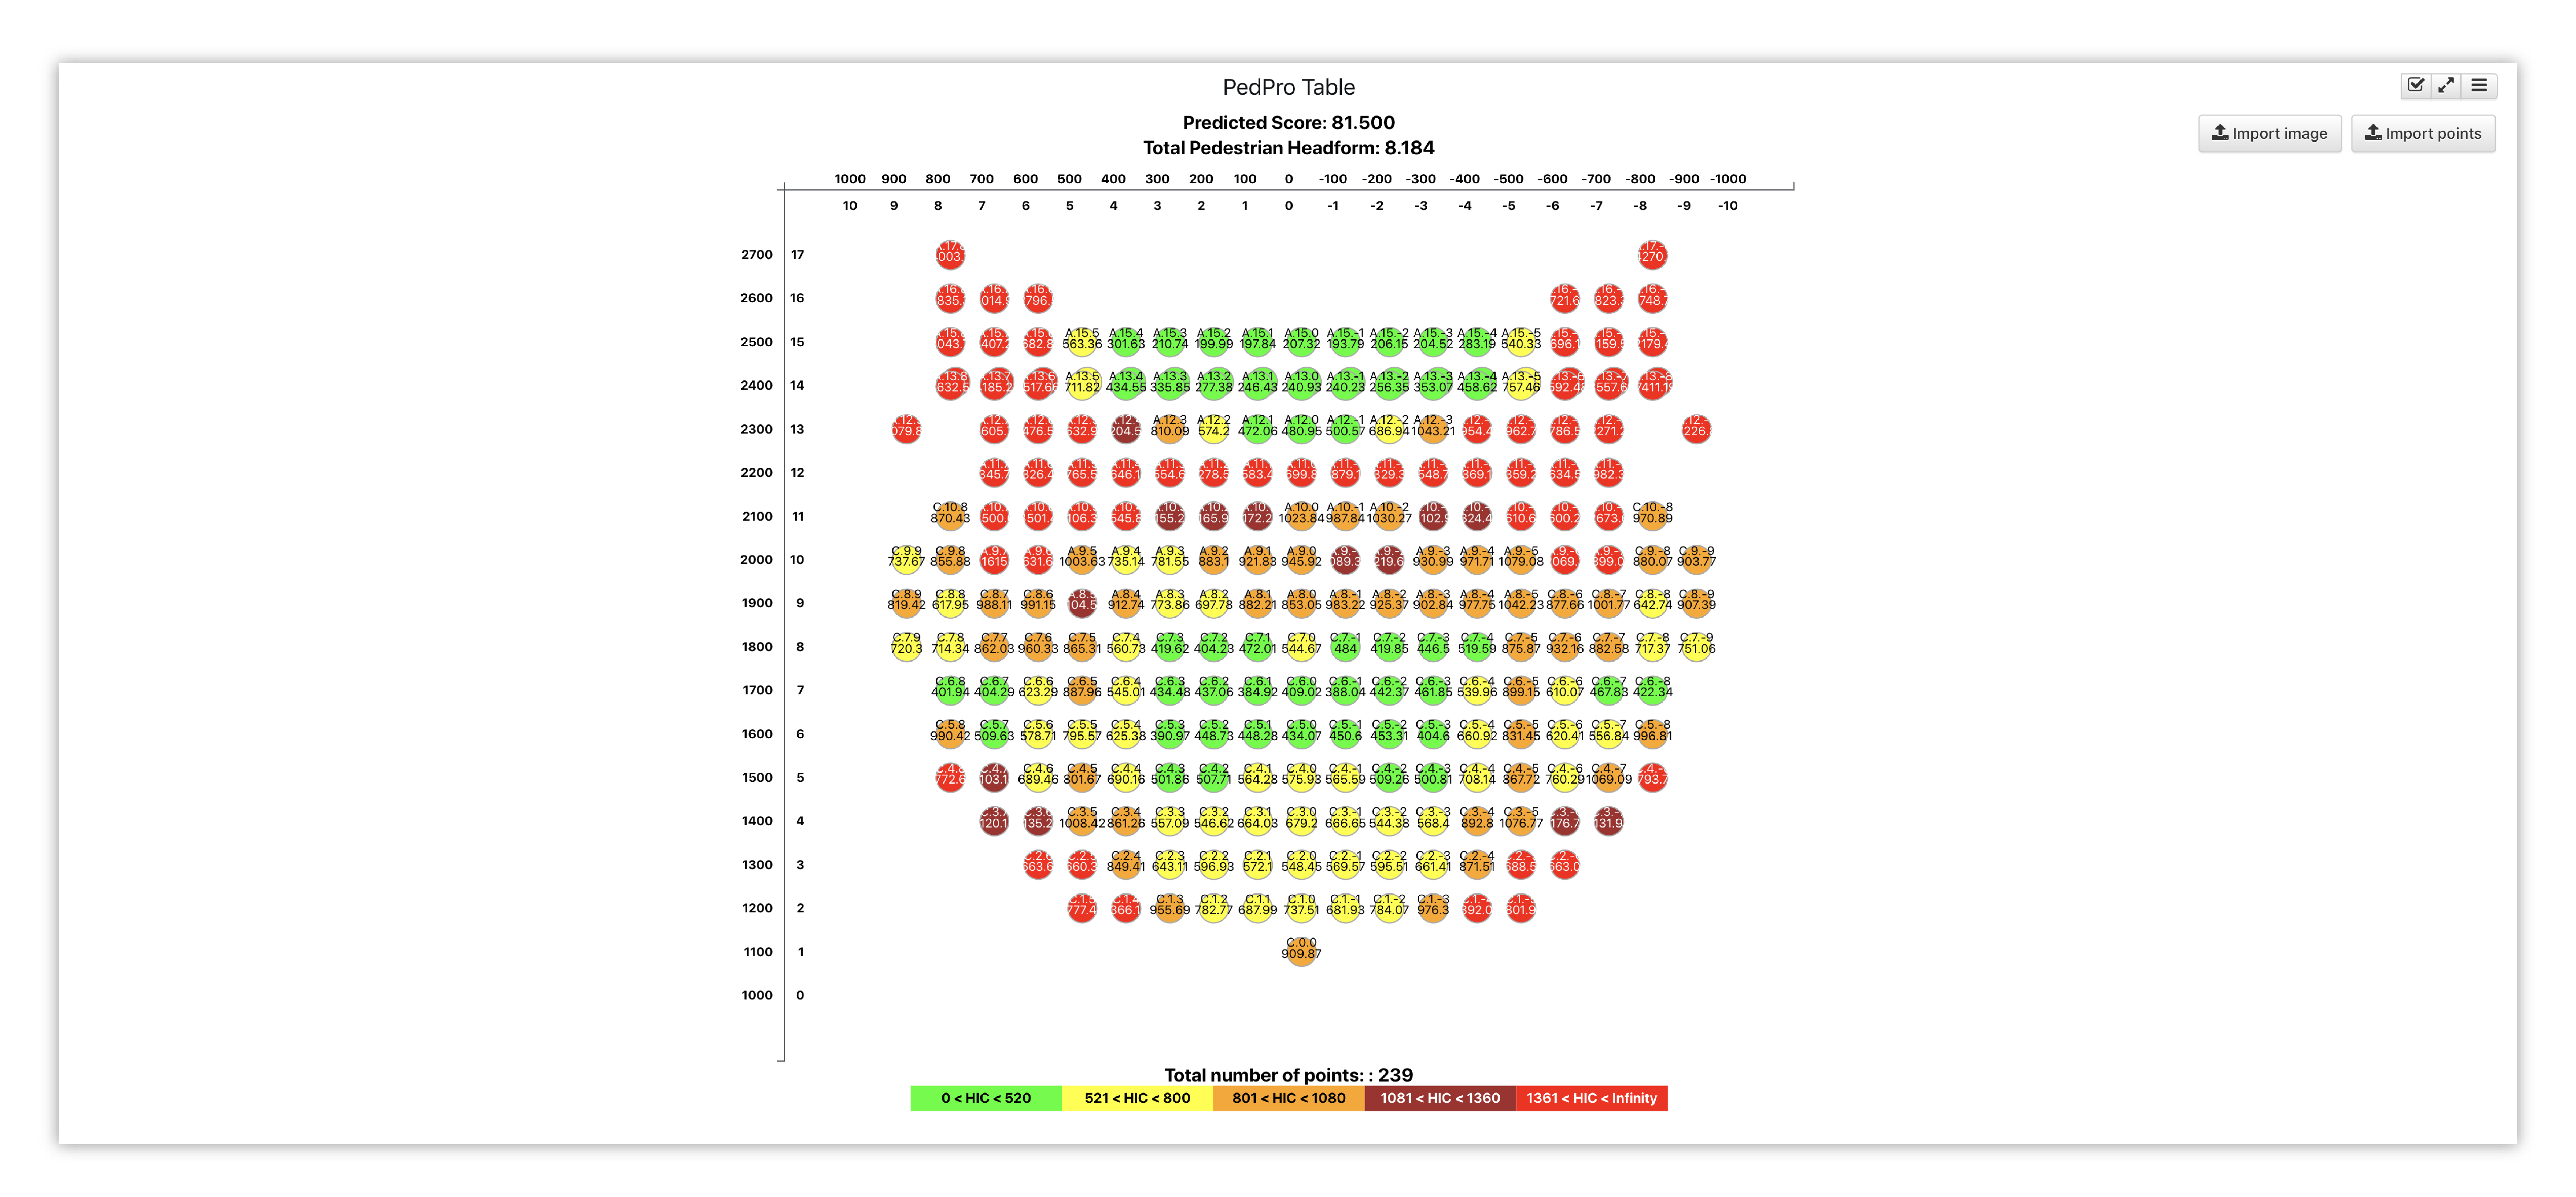
Figure 4: Ped Pro
15.2. IIHS

The IIHS Parallel Coordinates Chart helps with determining vehicle ratings. Our columns will be the measured sensor points. We’ll also make sure to indicate colors and values of our rating thresholds.
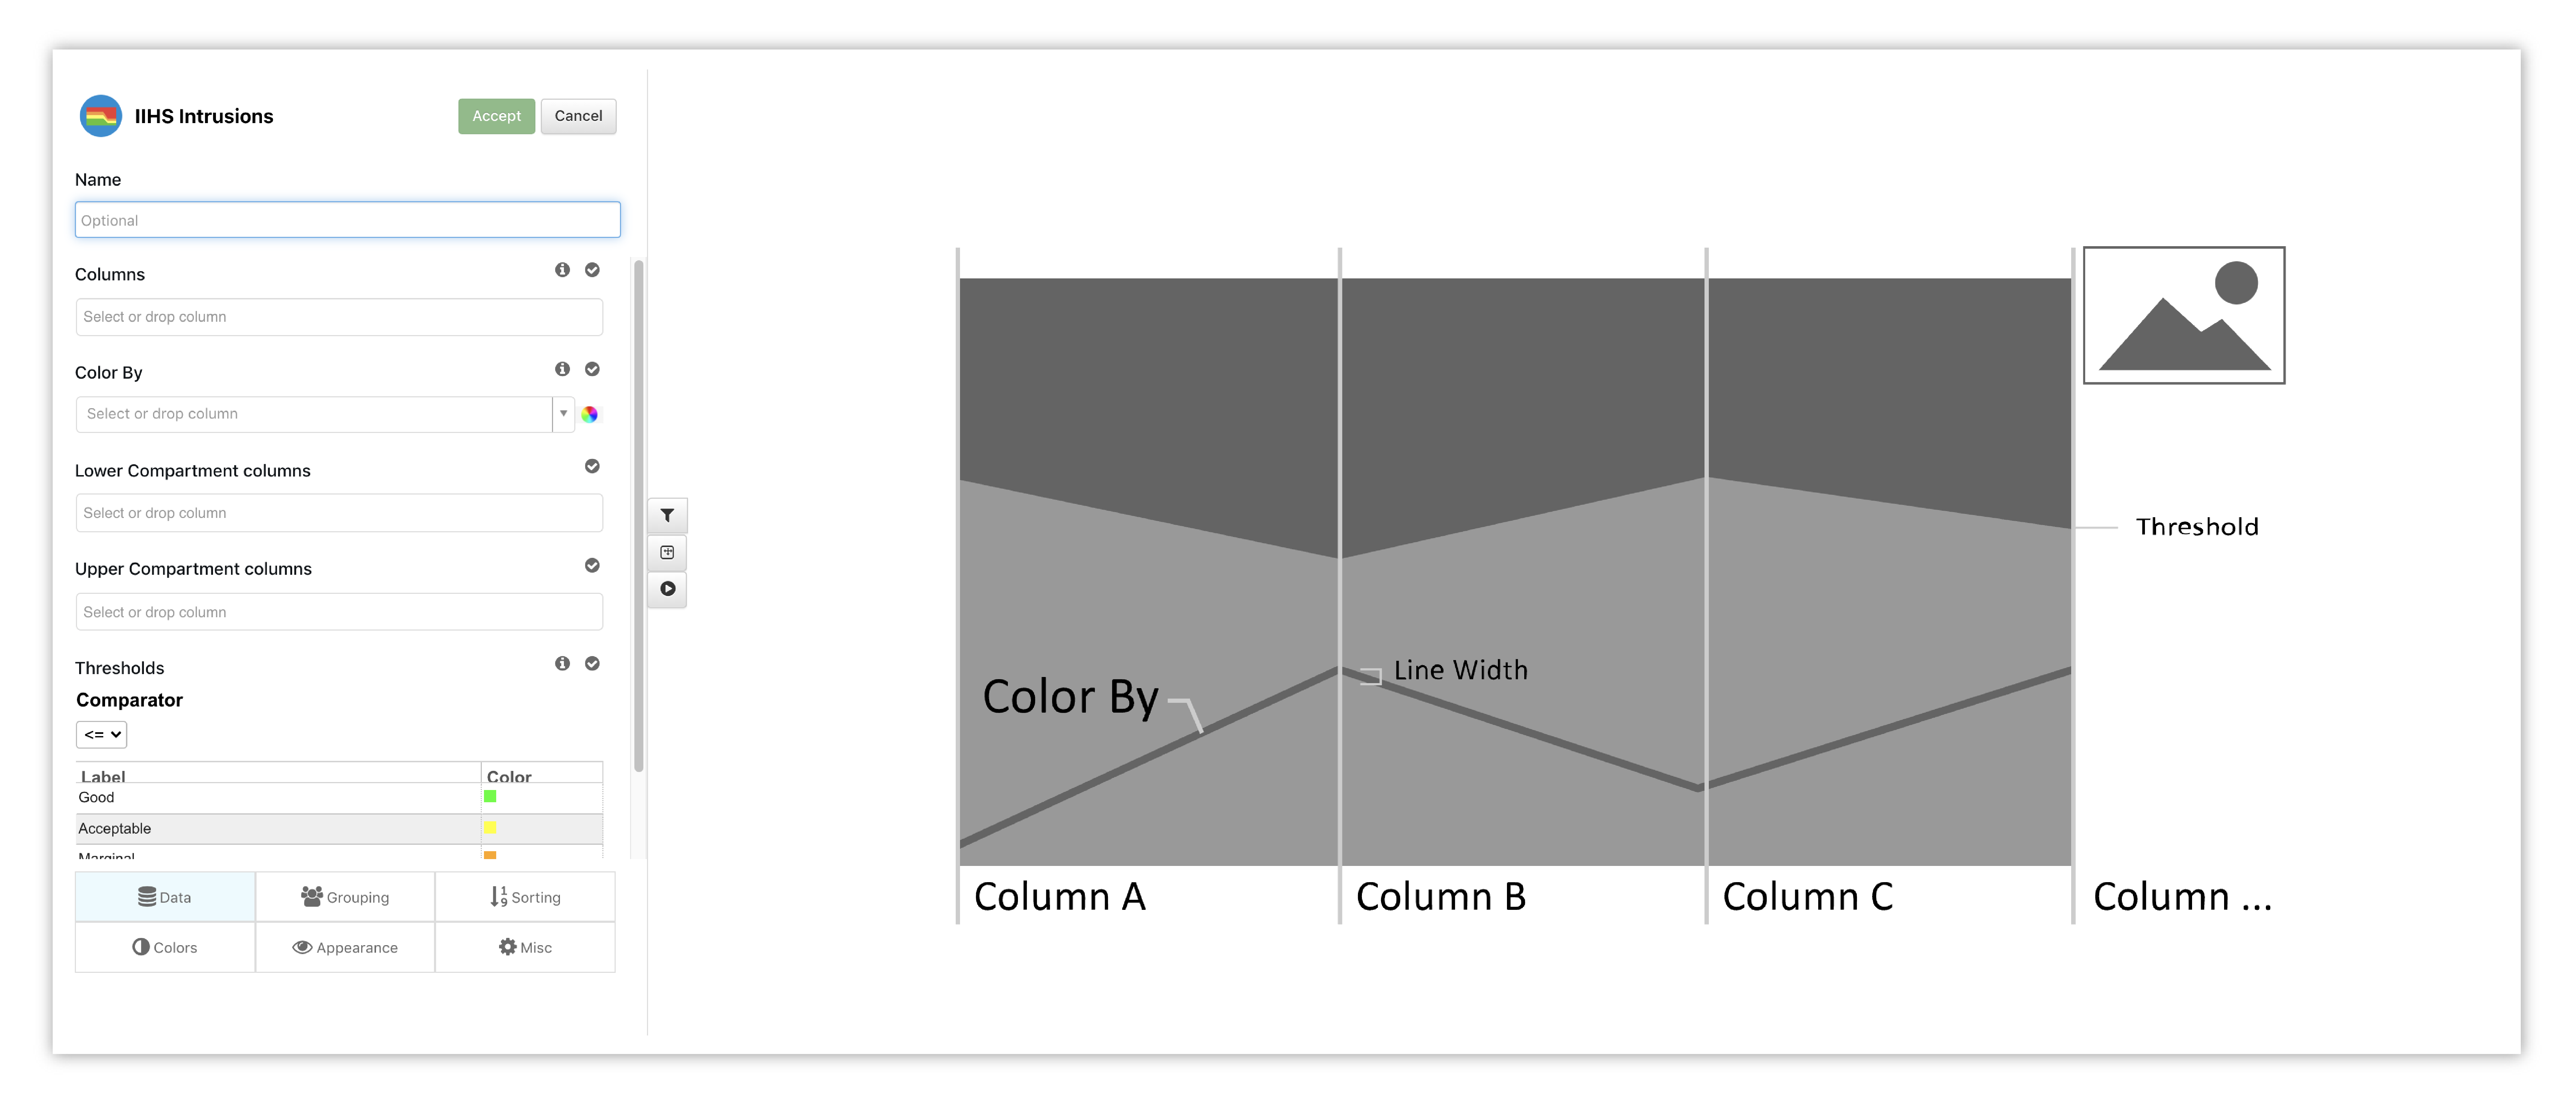
Figure 5: IIHS Options & Placeholder
This visualization maps the points in a parallel coordinate plane to see if they land within the margins.
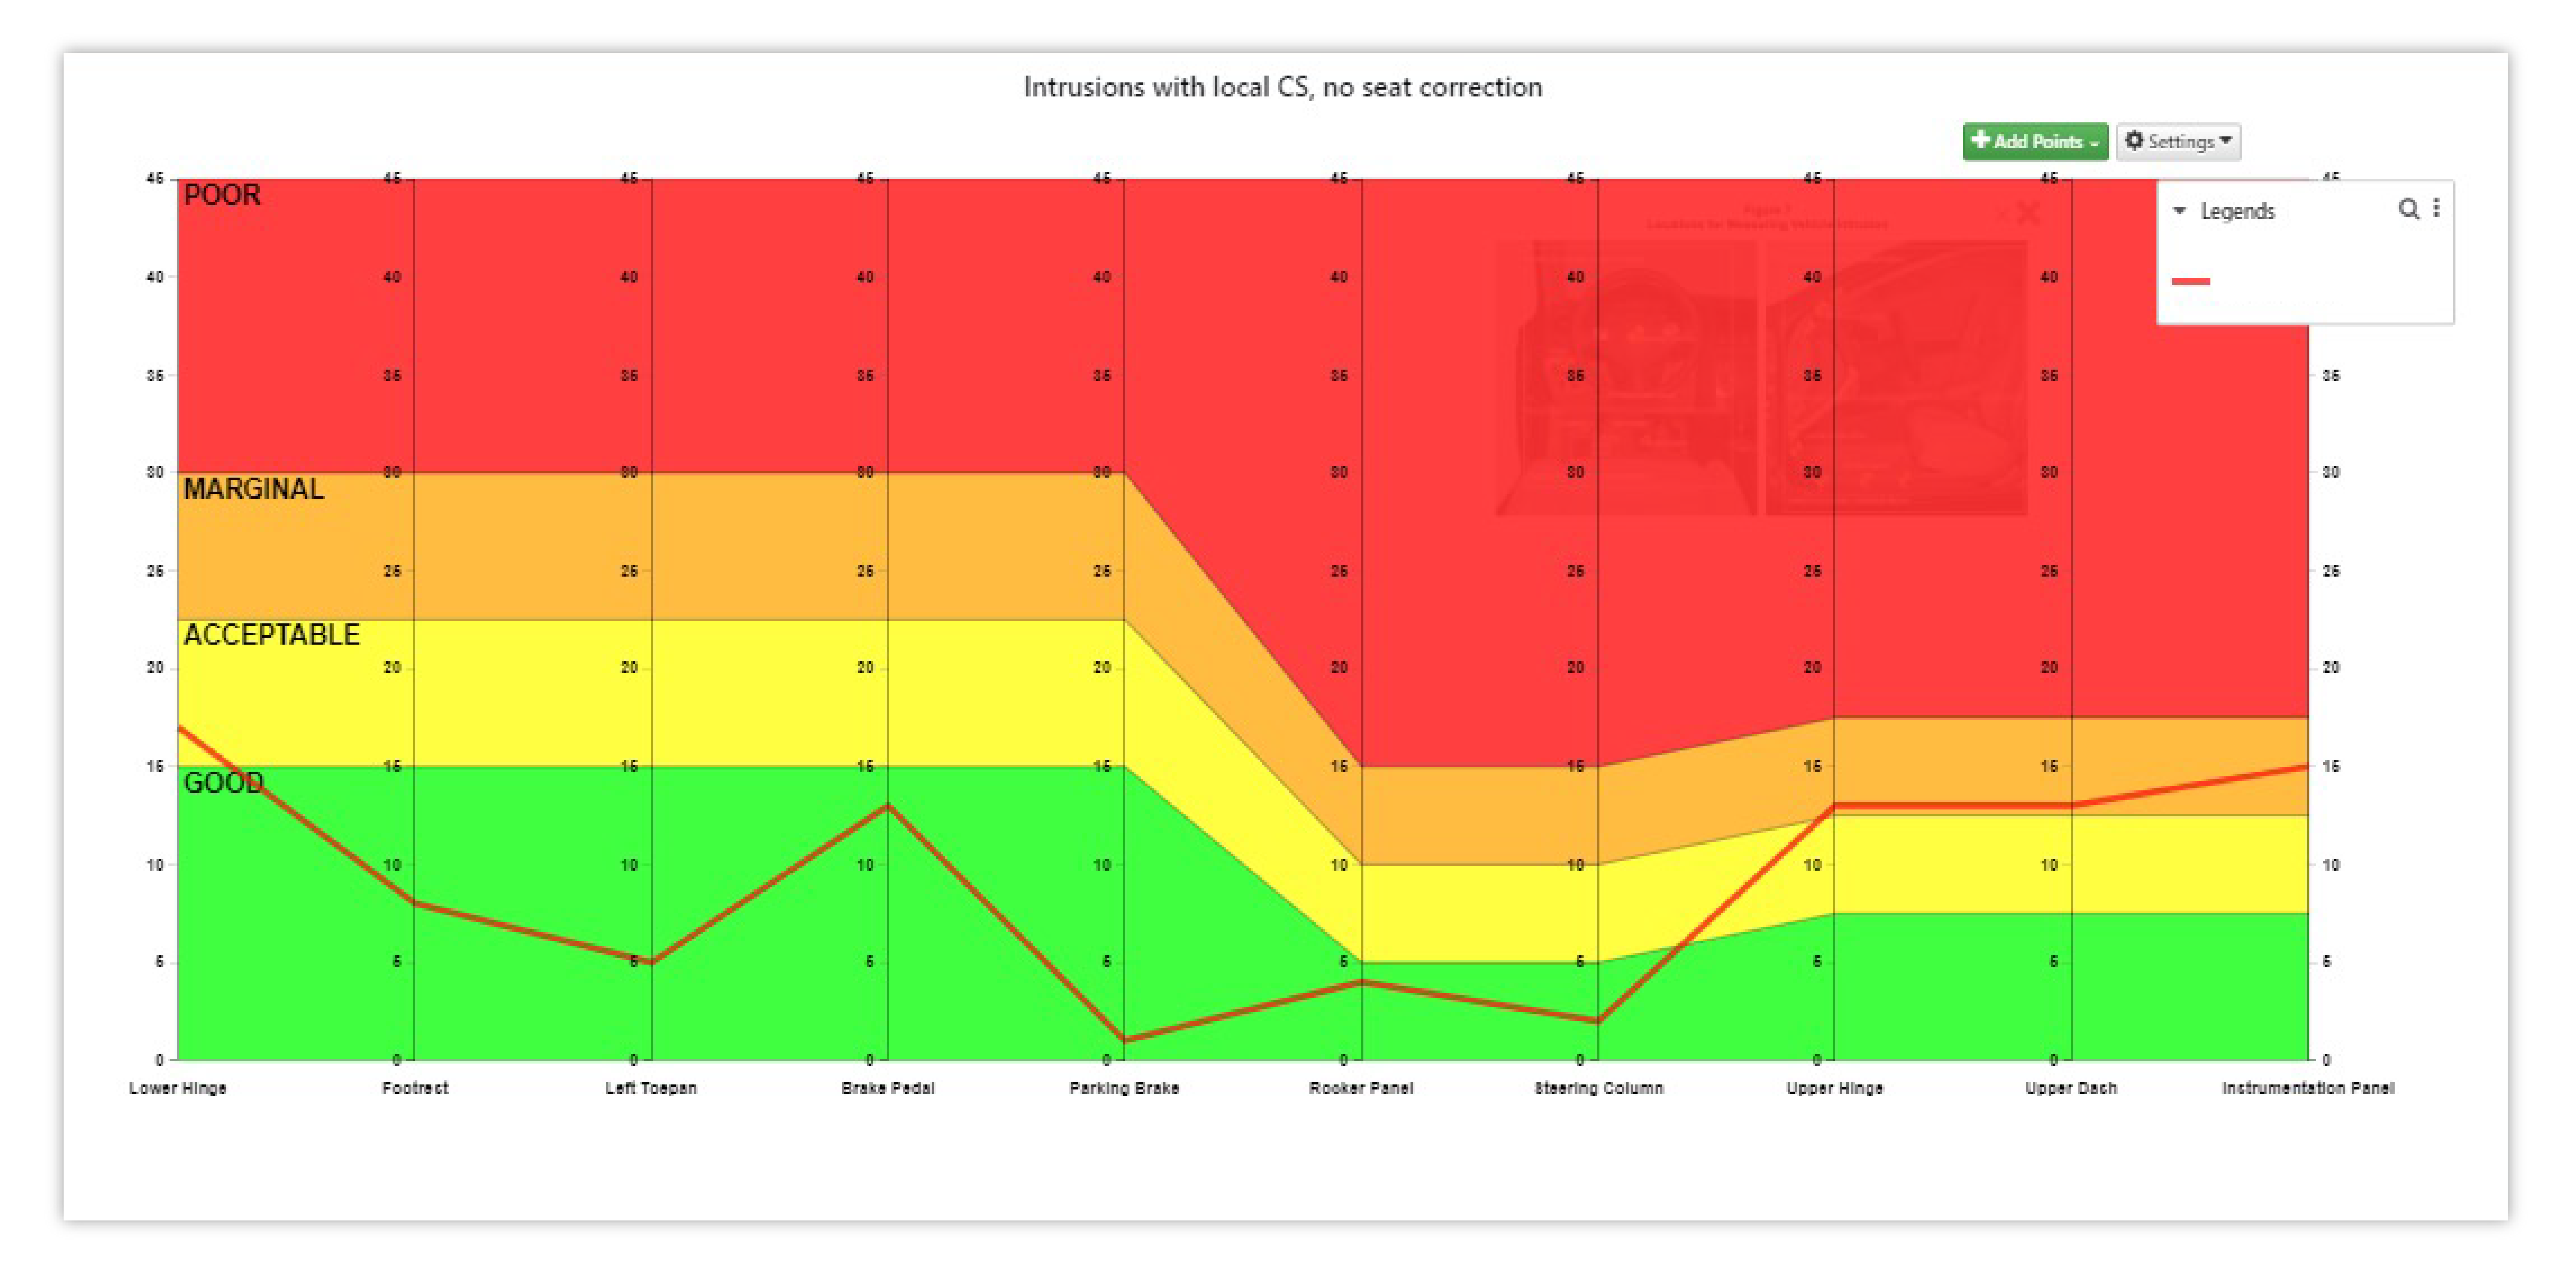
Figure 6: IIHS
15.3. Survival Space

Survival Space is specifically designed for plotting pre and post crash curves. We’ll choose which states to visualize for our Pre and Post Crash coordinates to create the plot.
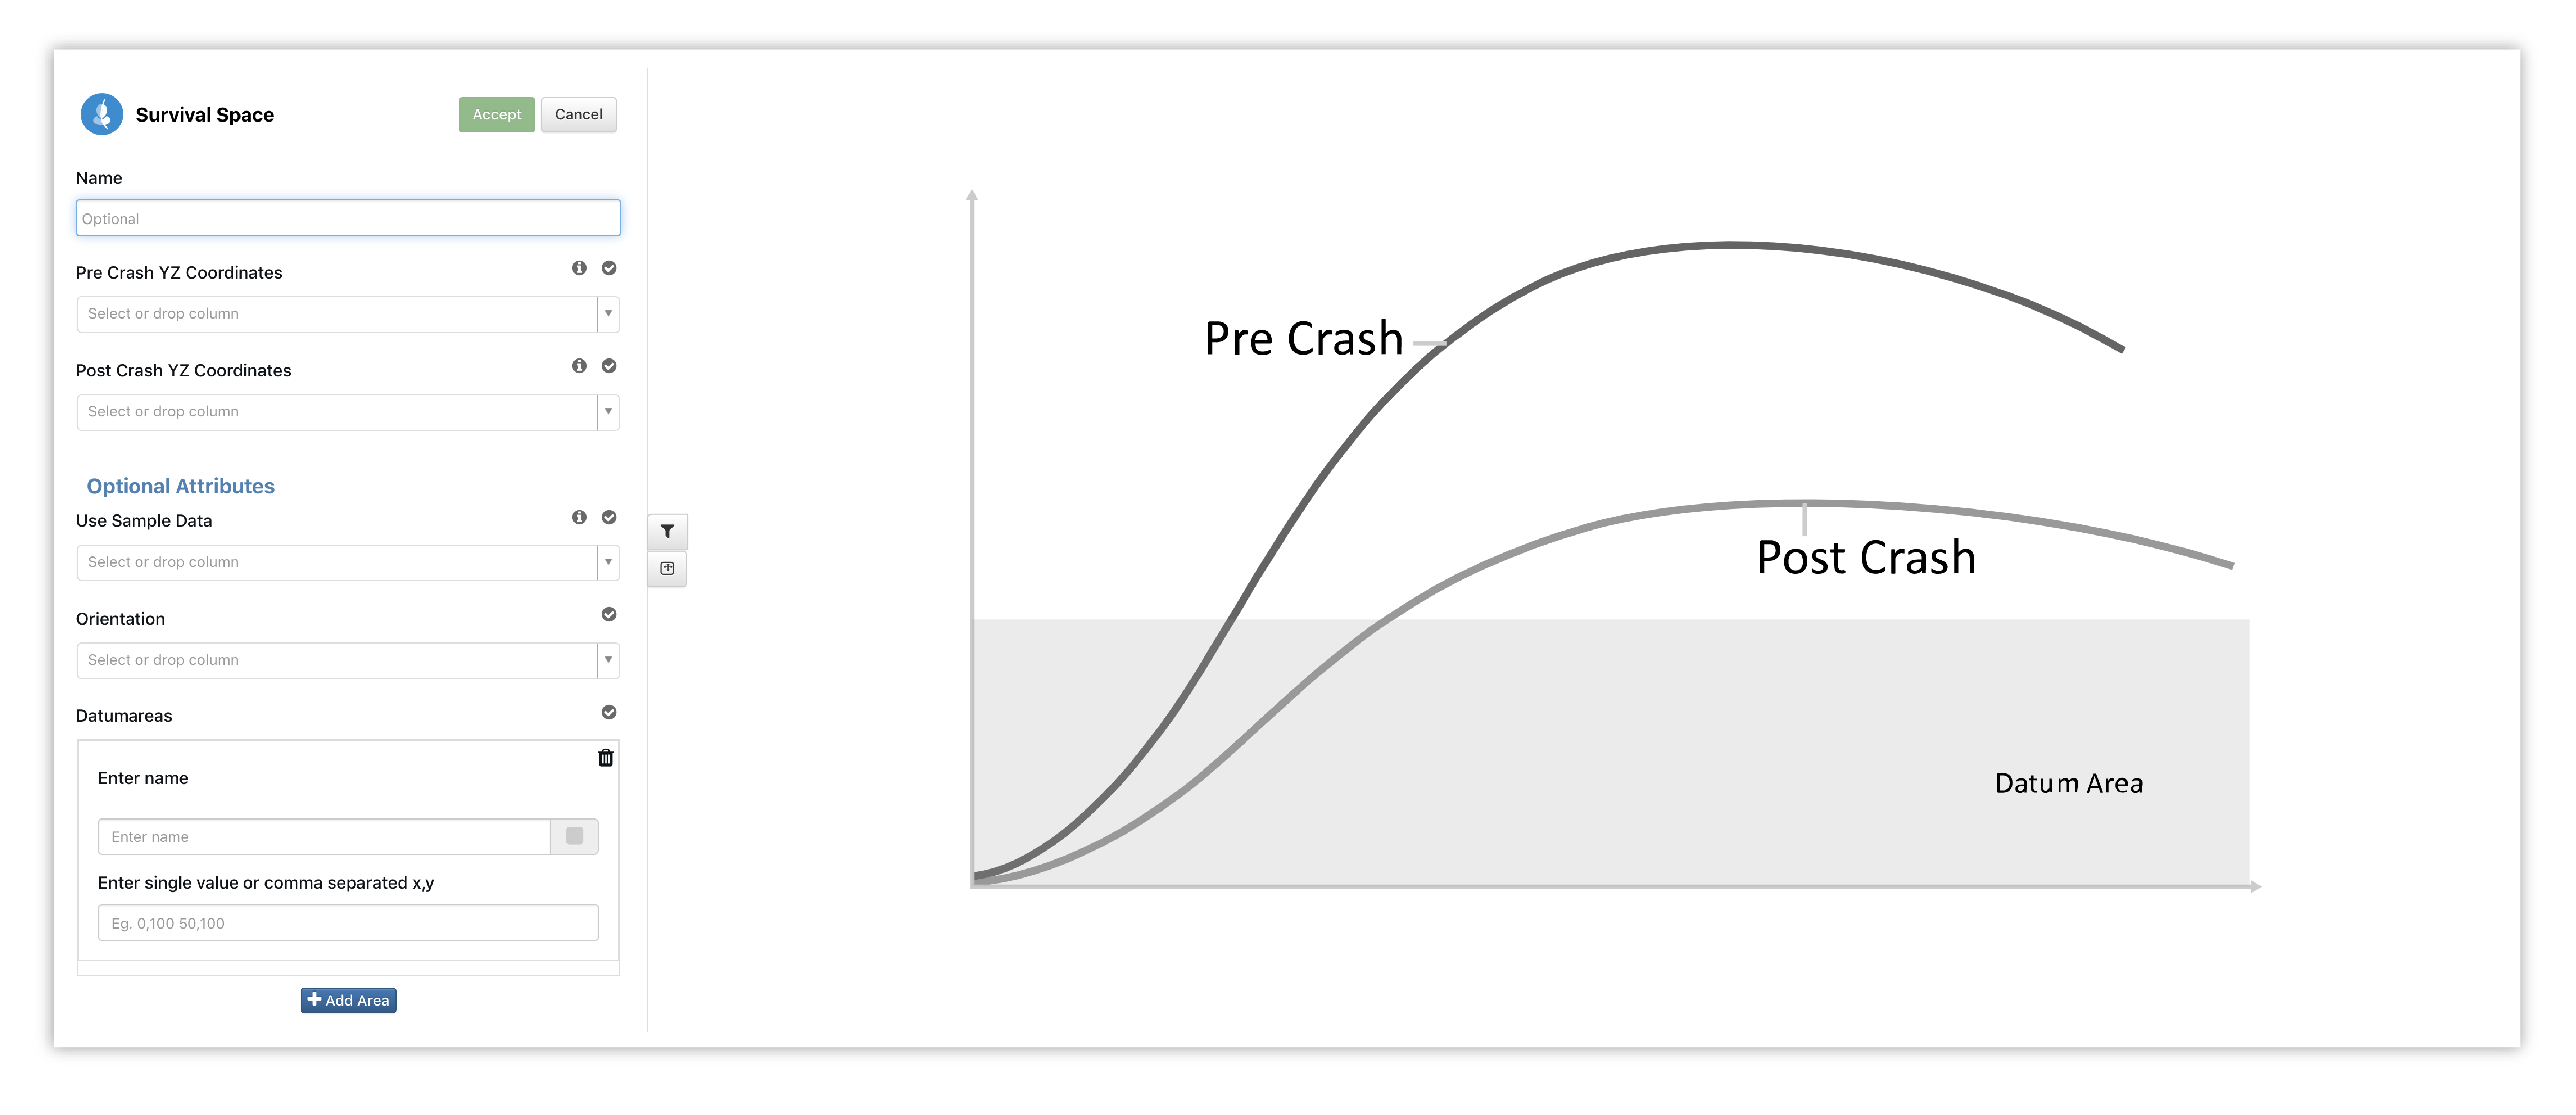
Figure 7: Survival Space Options & Placeholder
This visualization makes comparing the two states much easier and smoother.
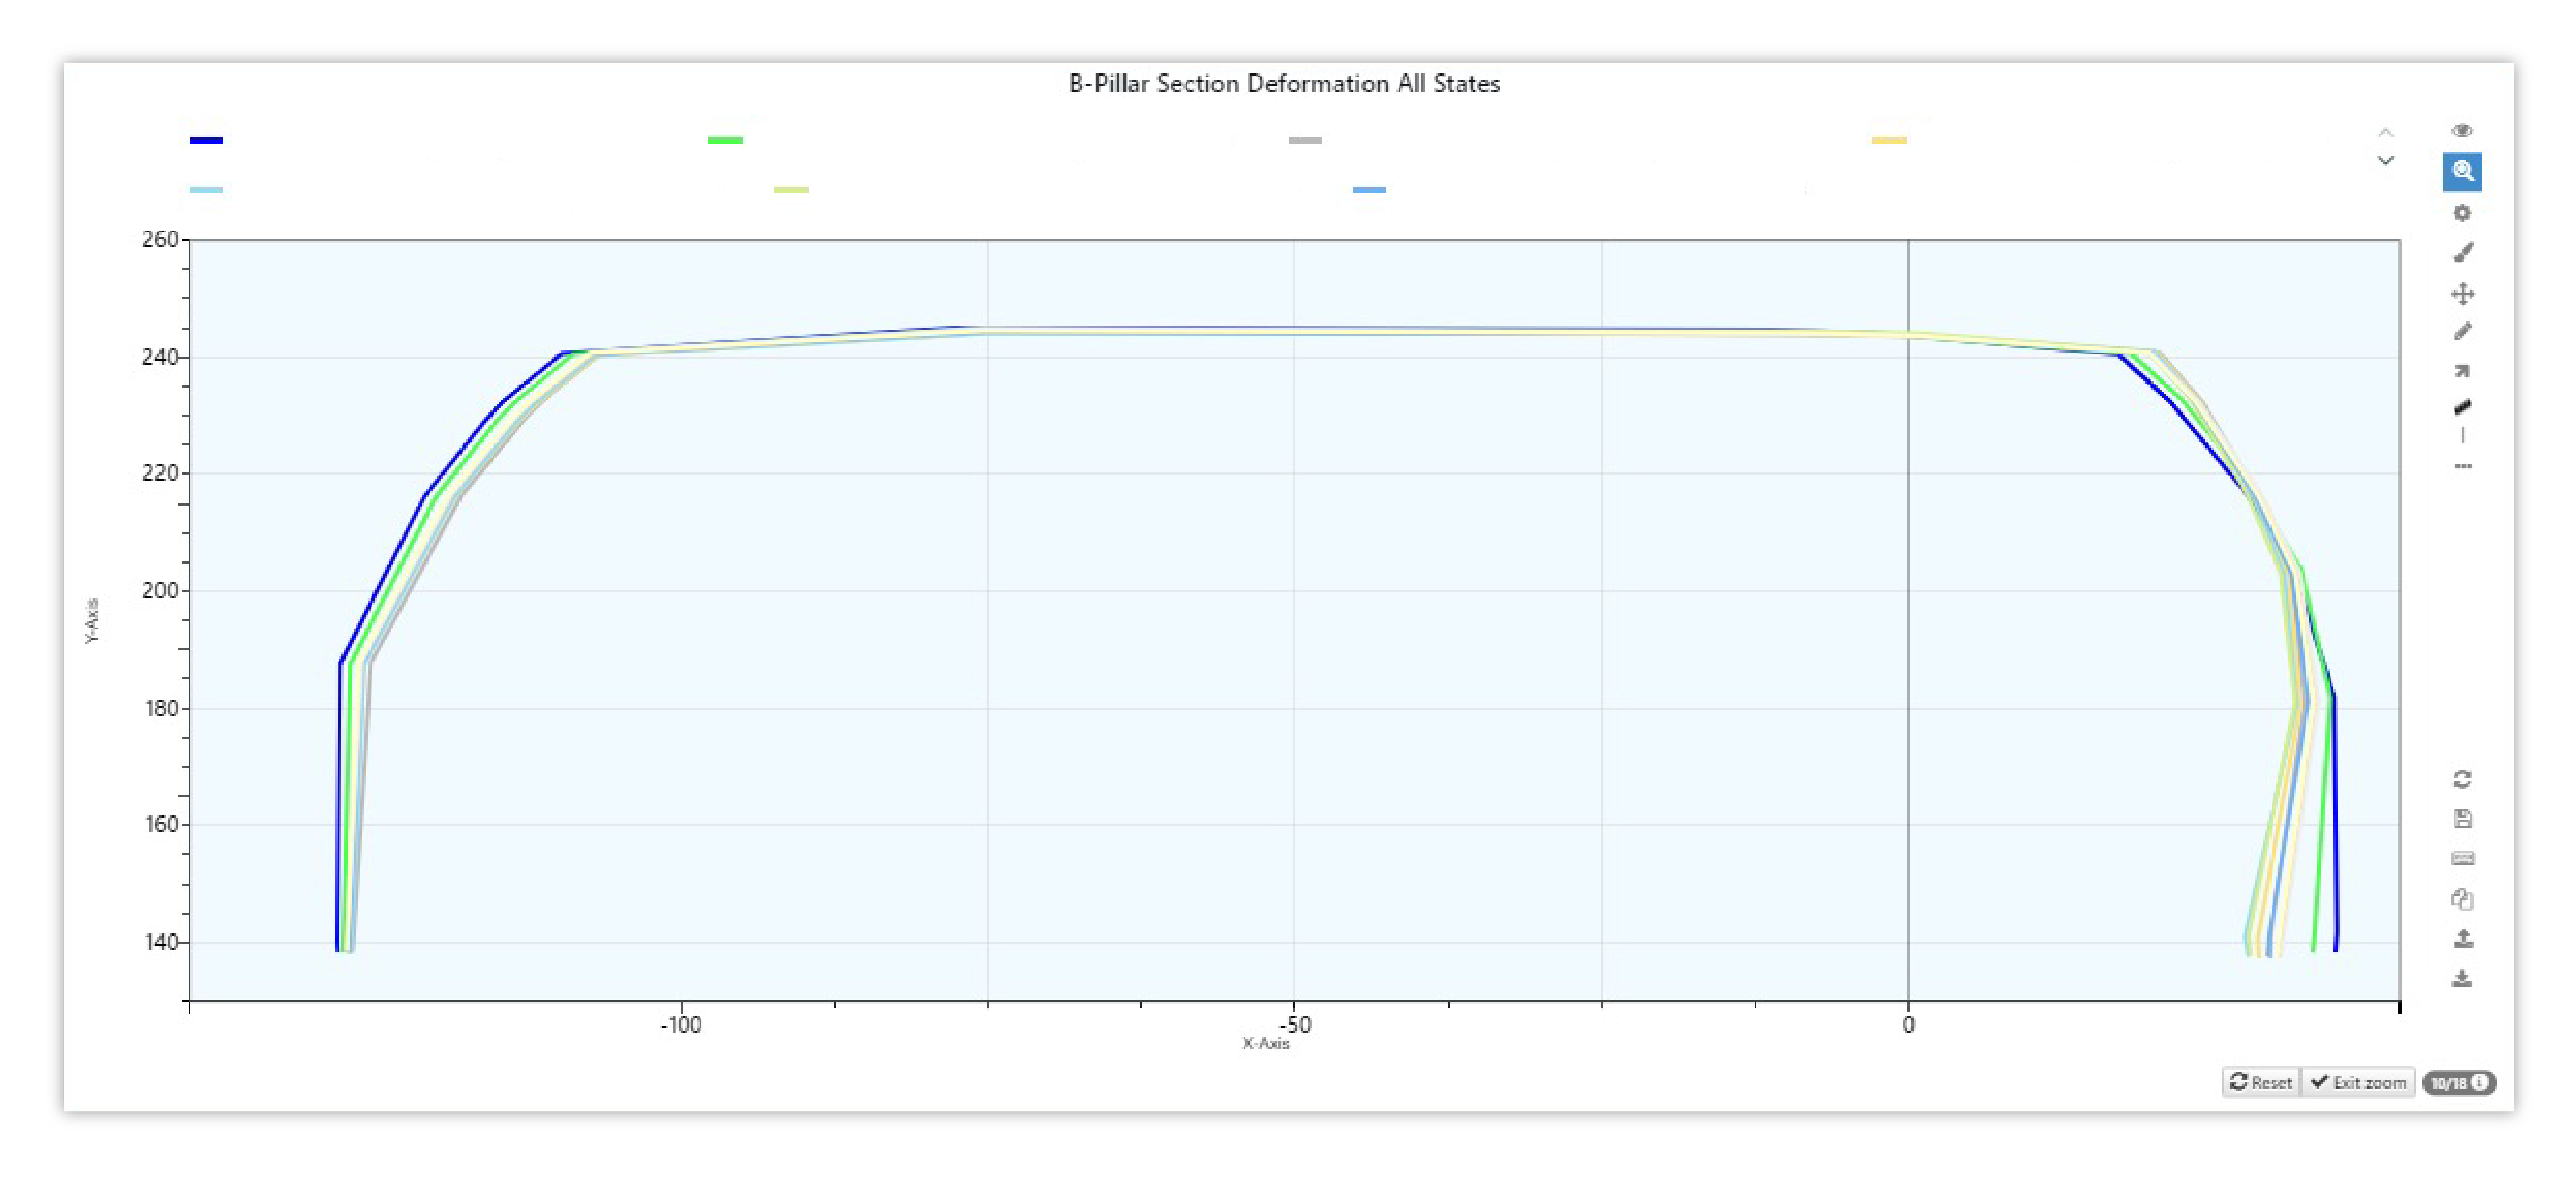
Figure 8: Survival Space
15.4. ALPI
Simlytiks’ Advanced Pedestrian Legform Impactor Template uses two main visualizers, curve plot and table, to show simulation data.
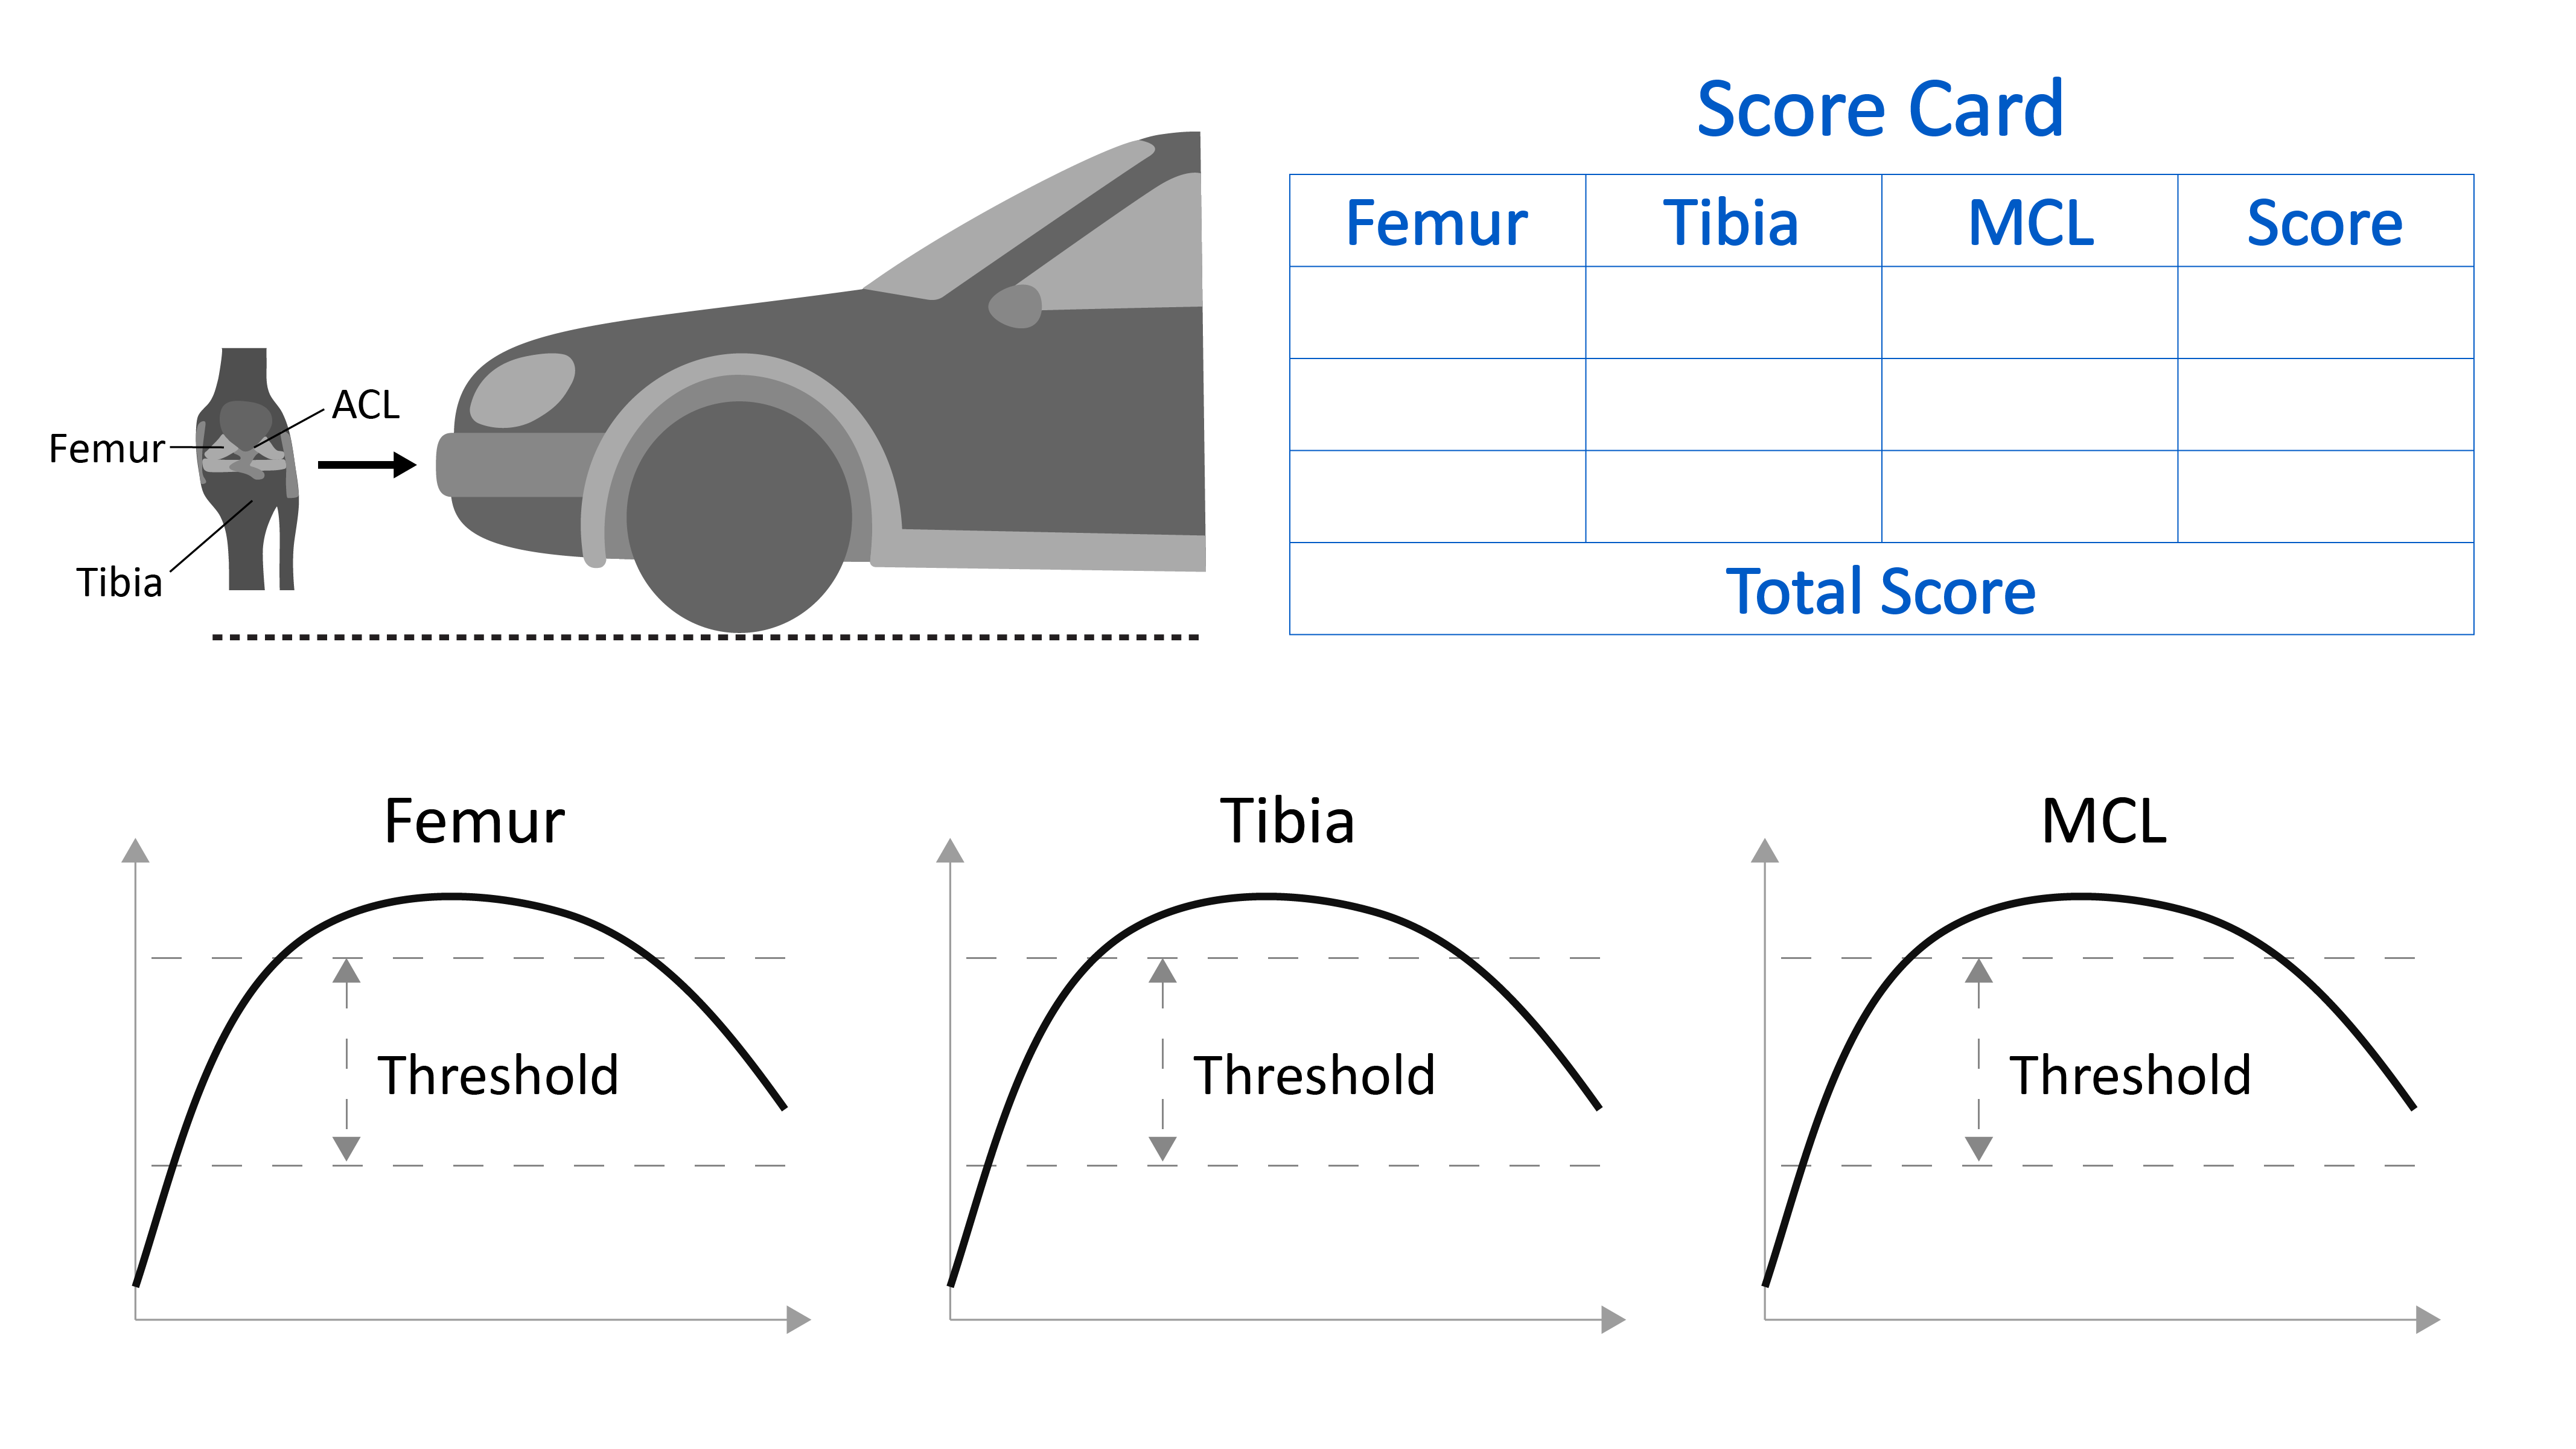
Figure 9: aPLI Calculation
Curve

Curve Plot is used to visualize the force impact on the femur, tibia and MCL. Setting up these visualizations is not needed, as the template creates them for us. But, sometimes we may want to explore more. Check out the following examples for setting up these curves.
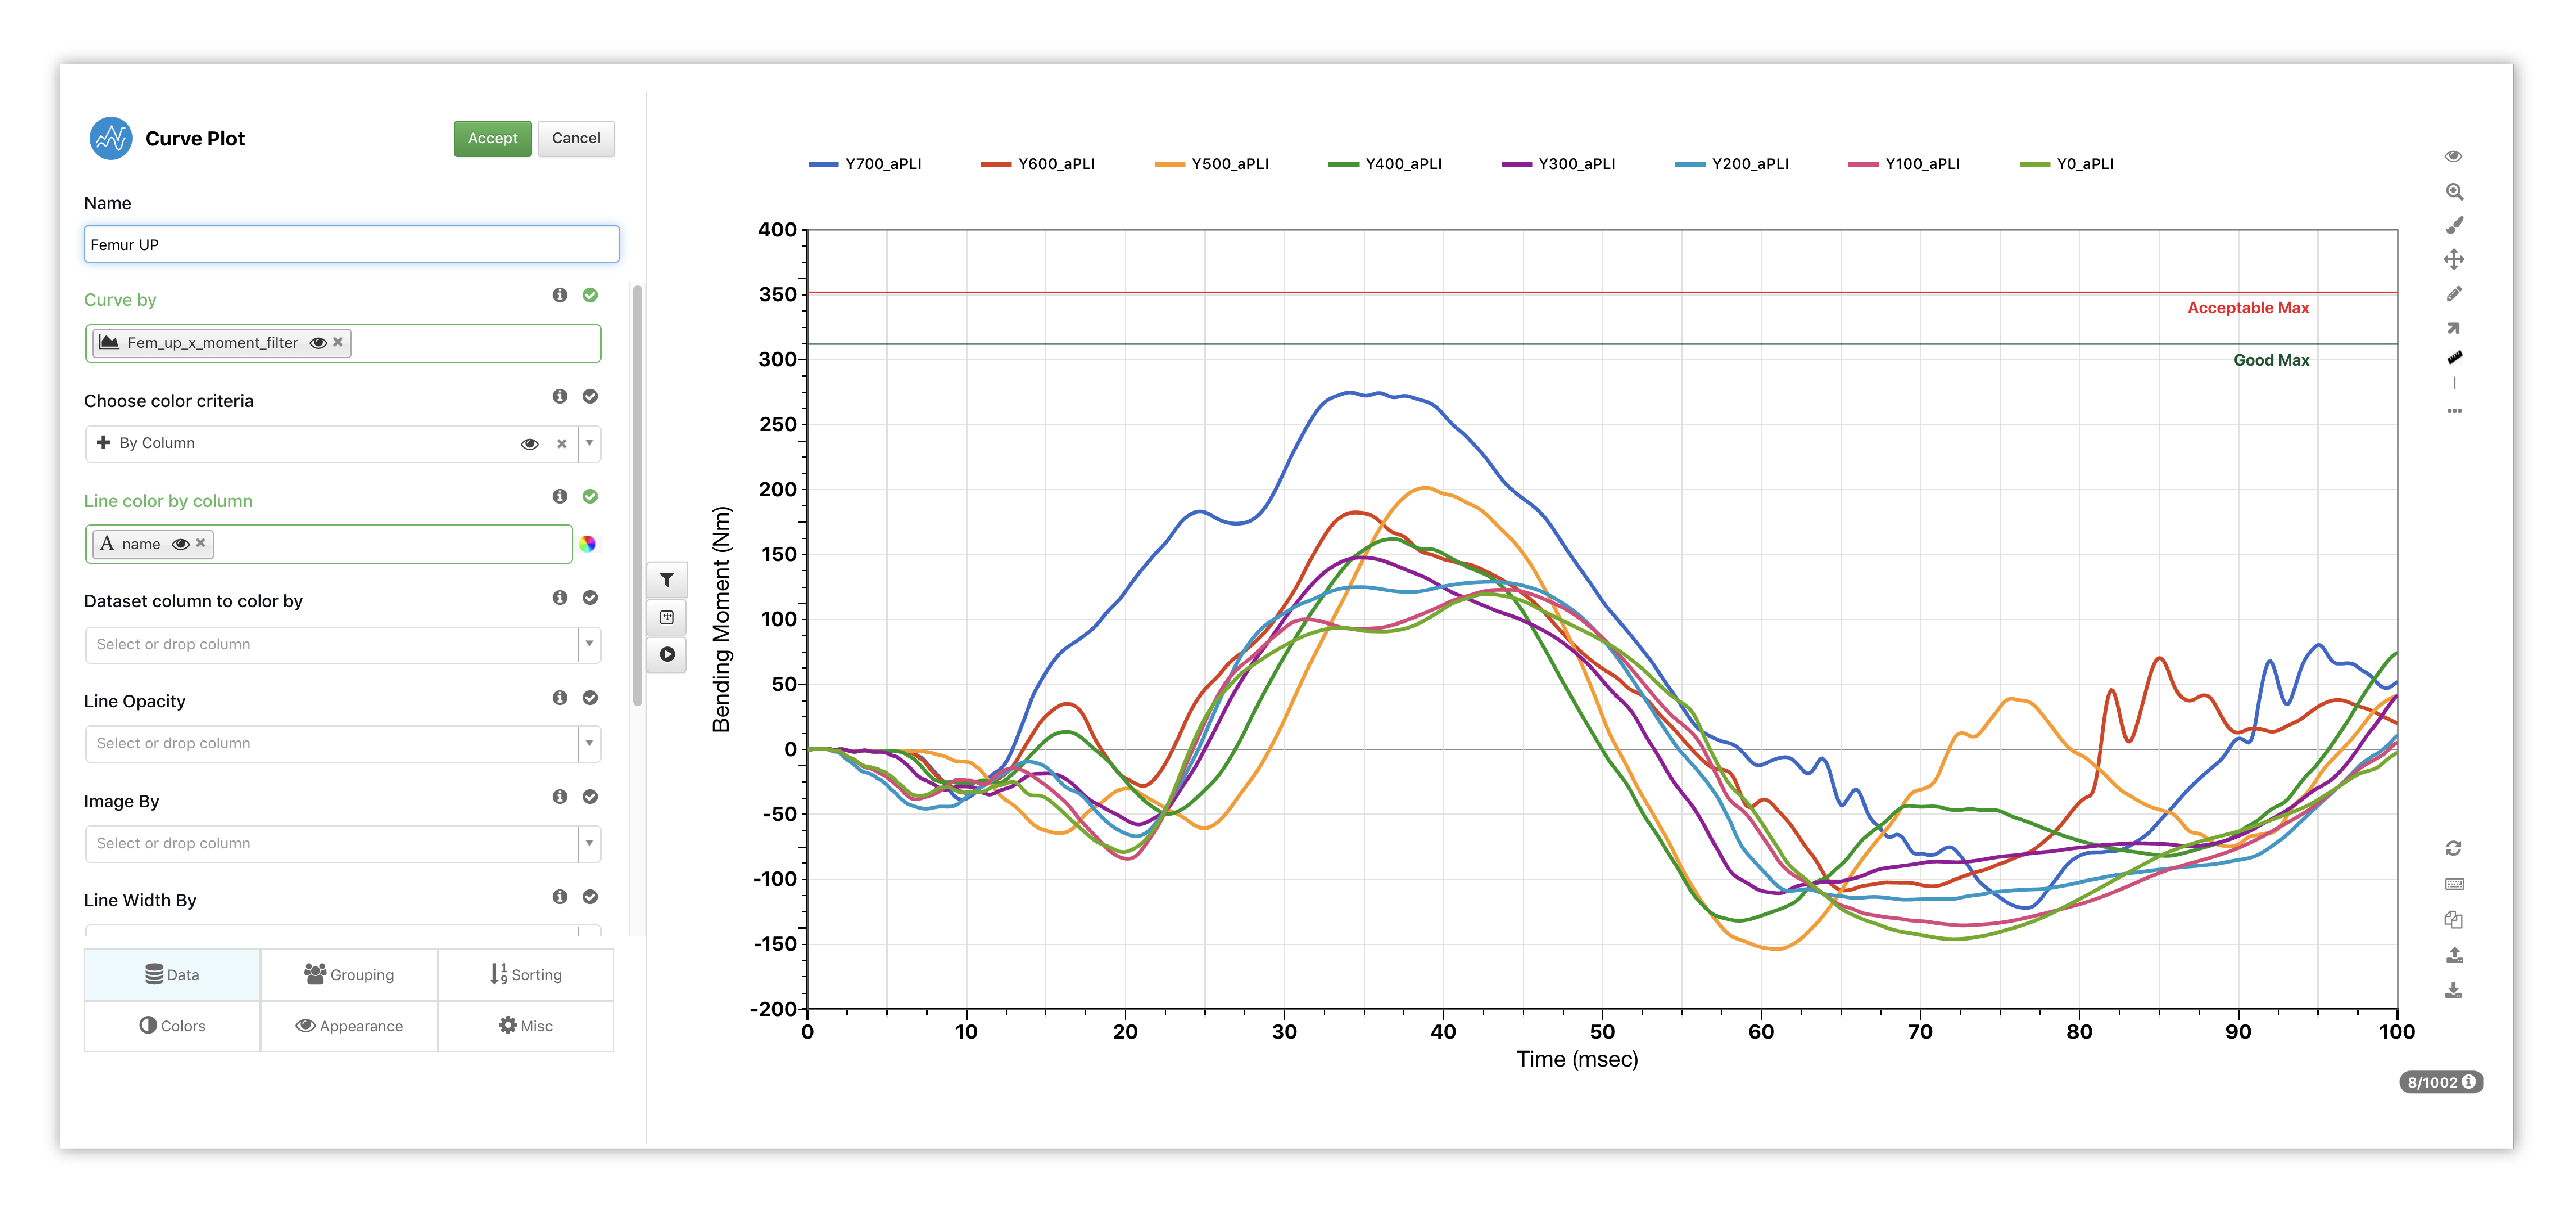
Figure 10: Femur Curve Options
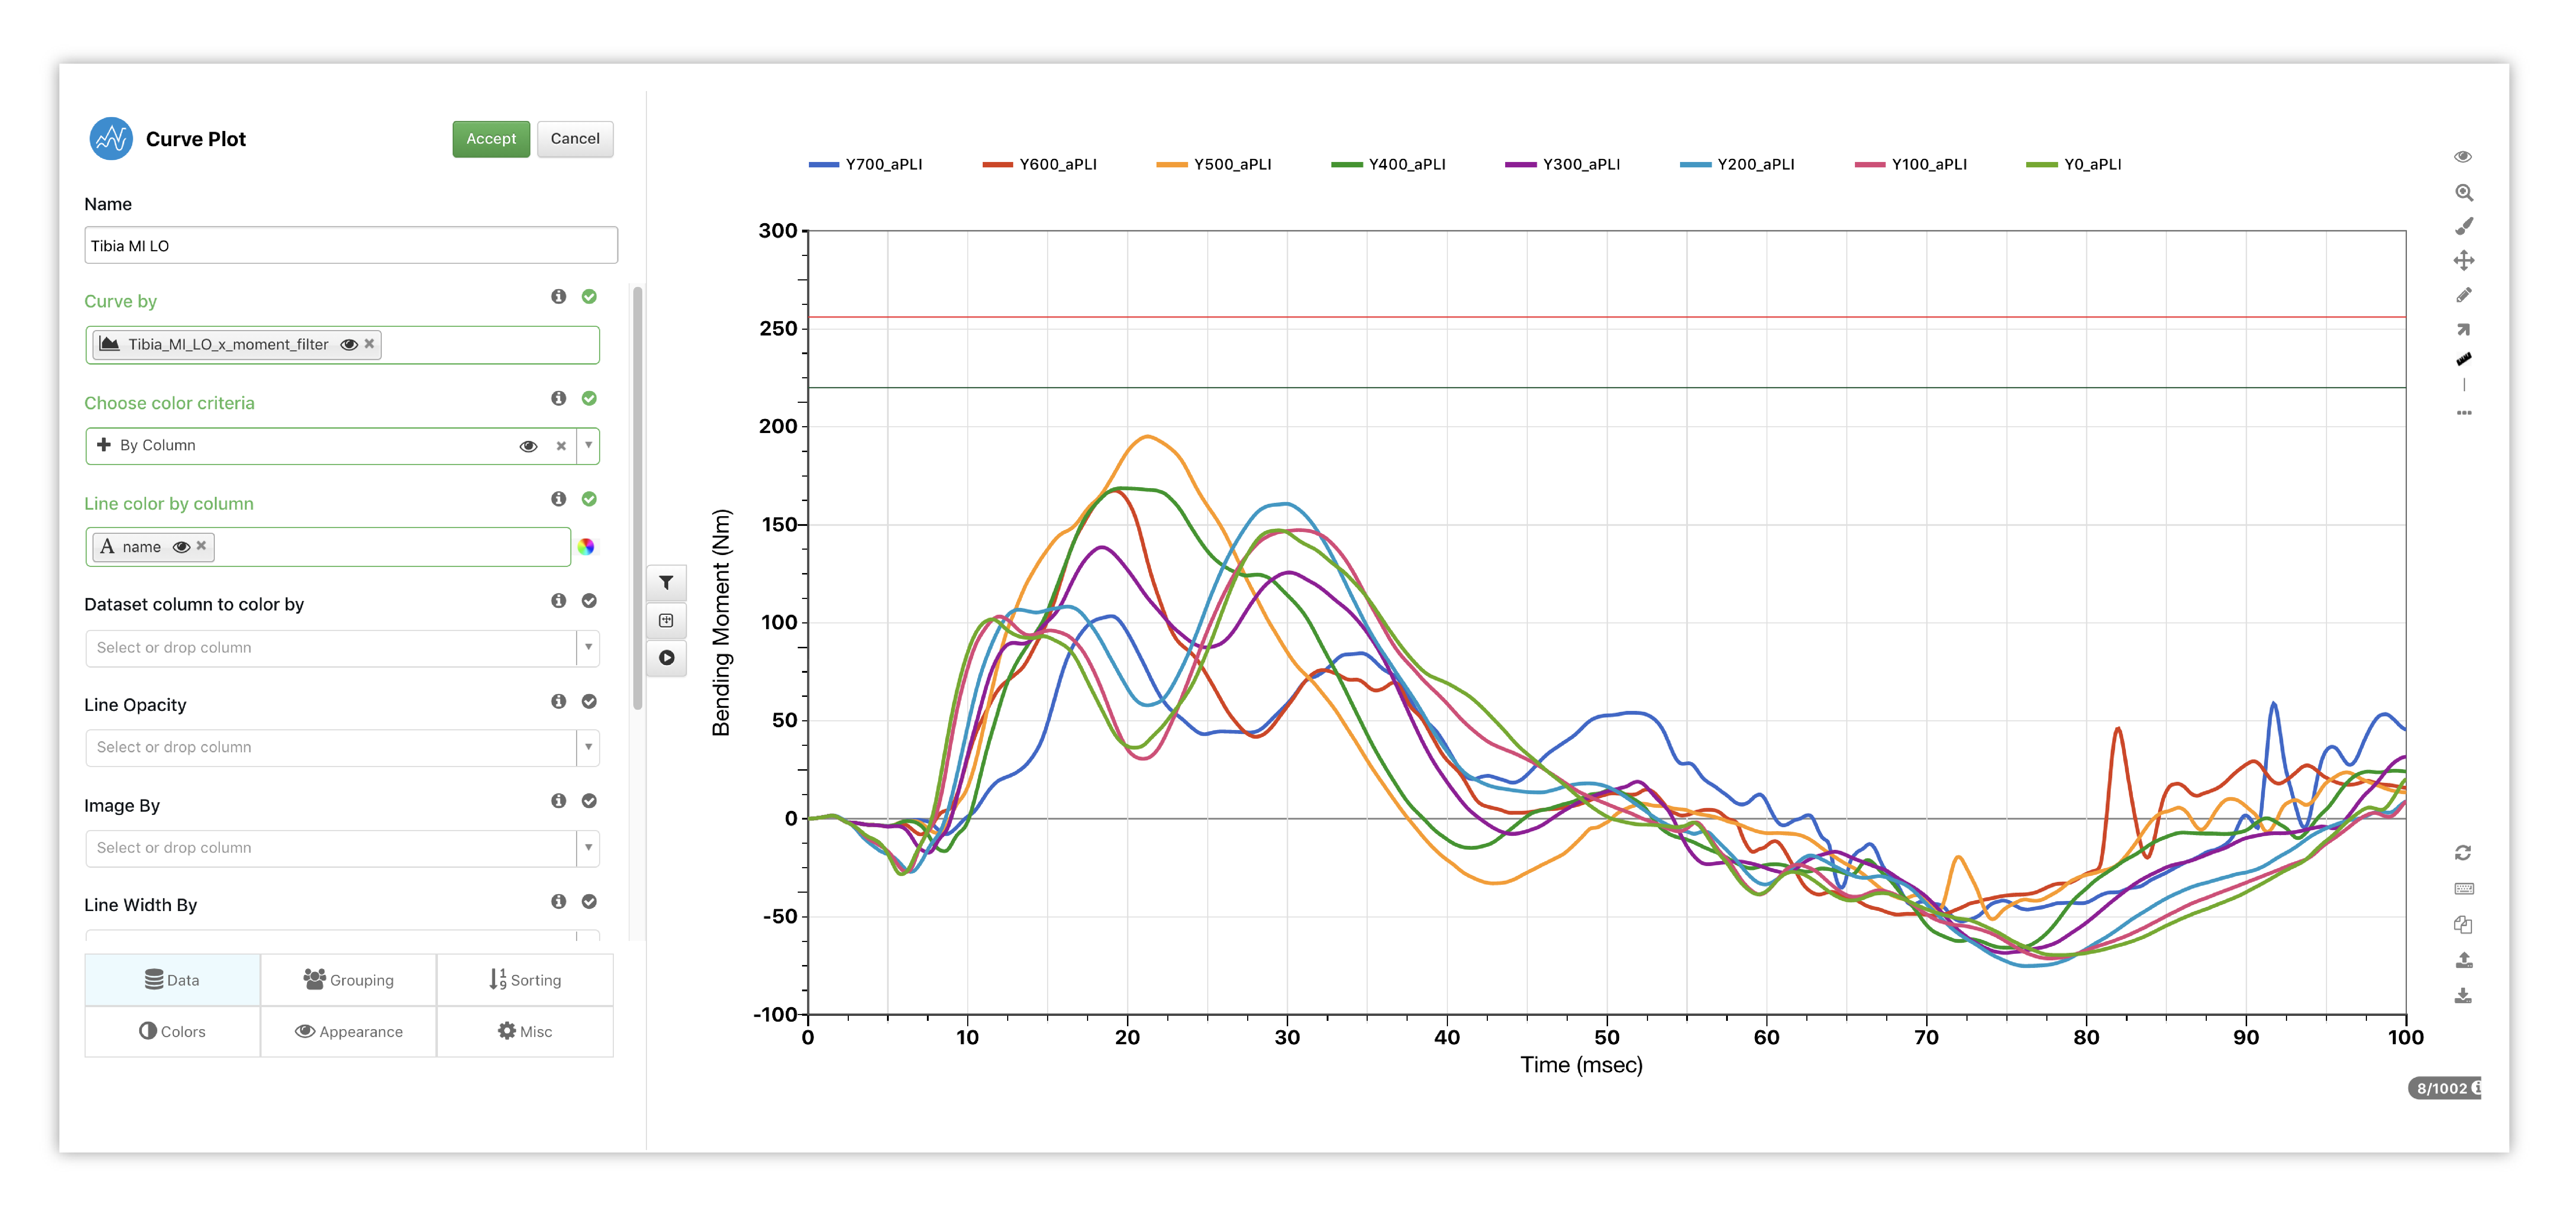
Figure 11: Tibia Curve Options
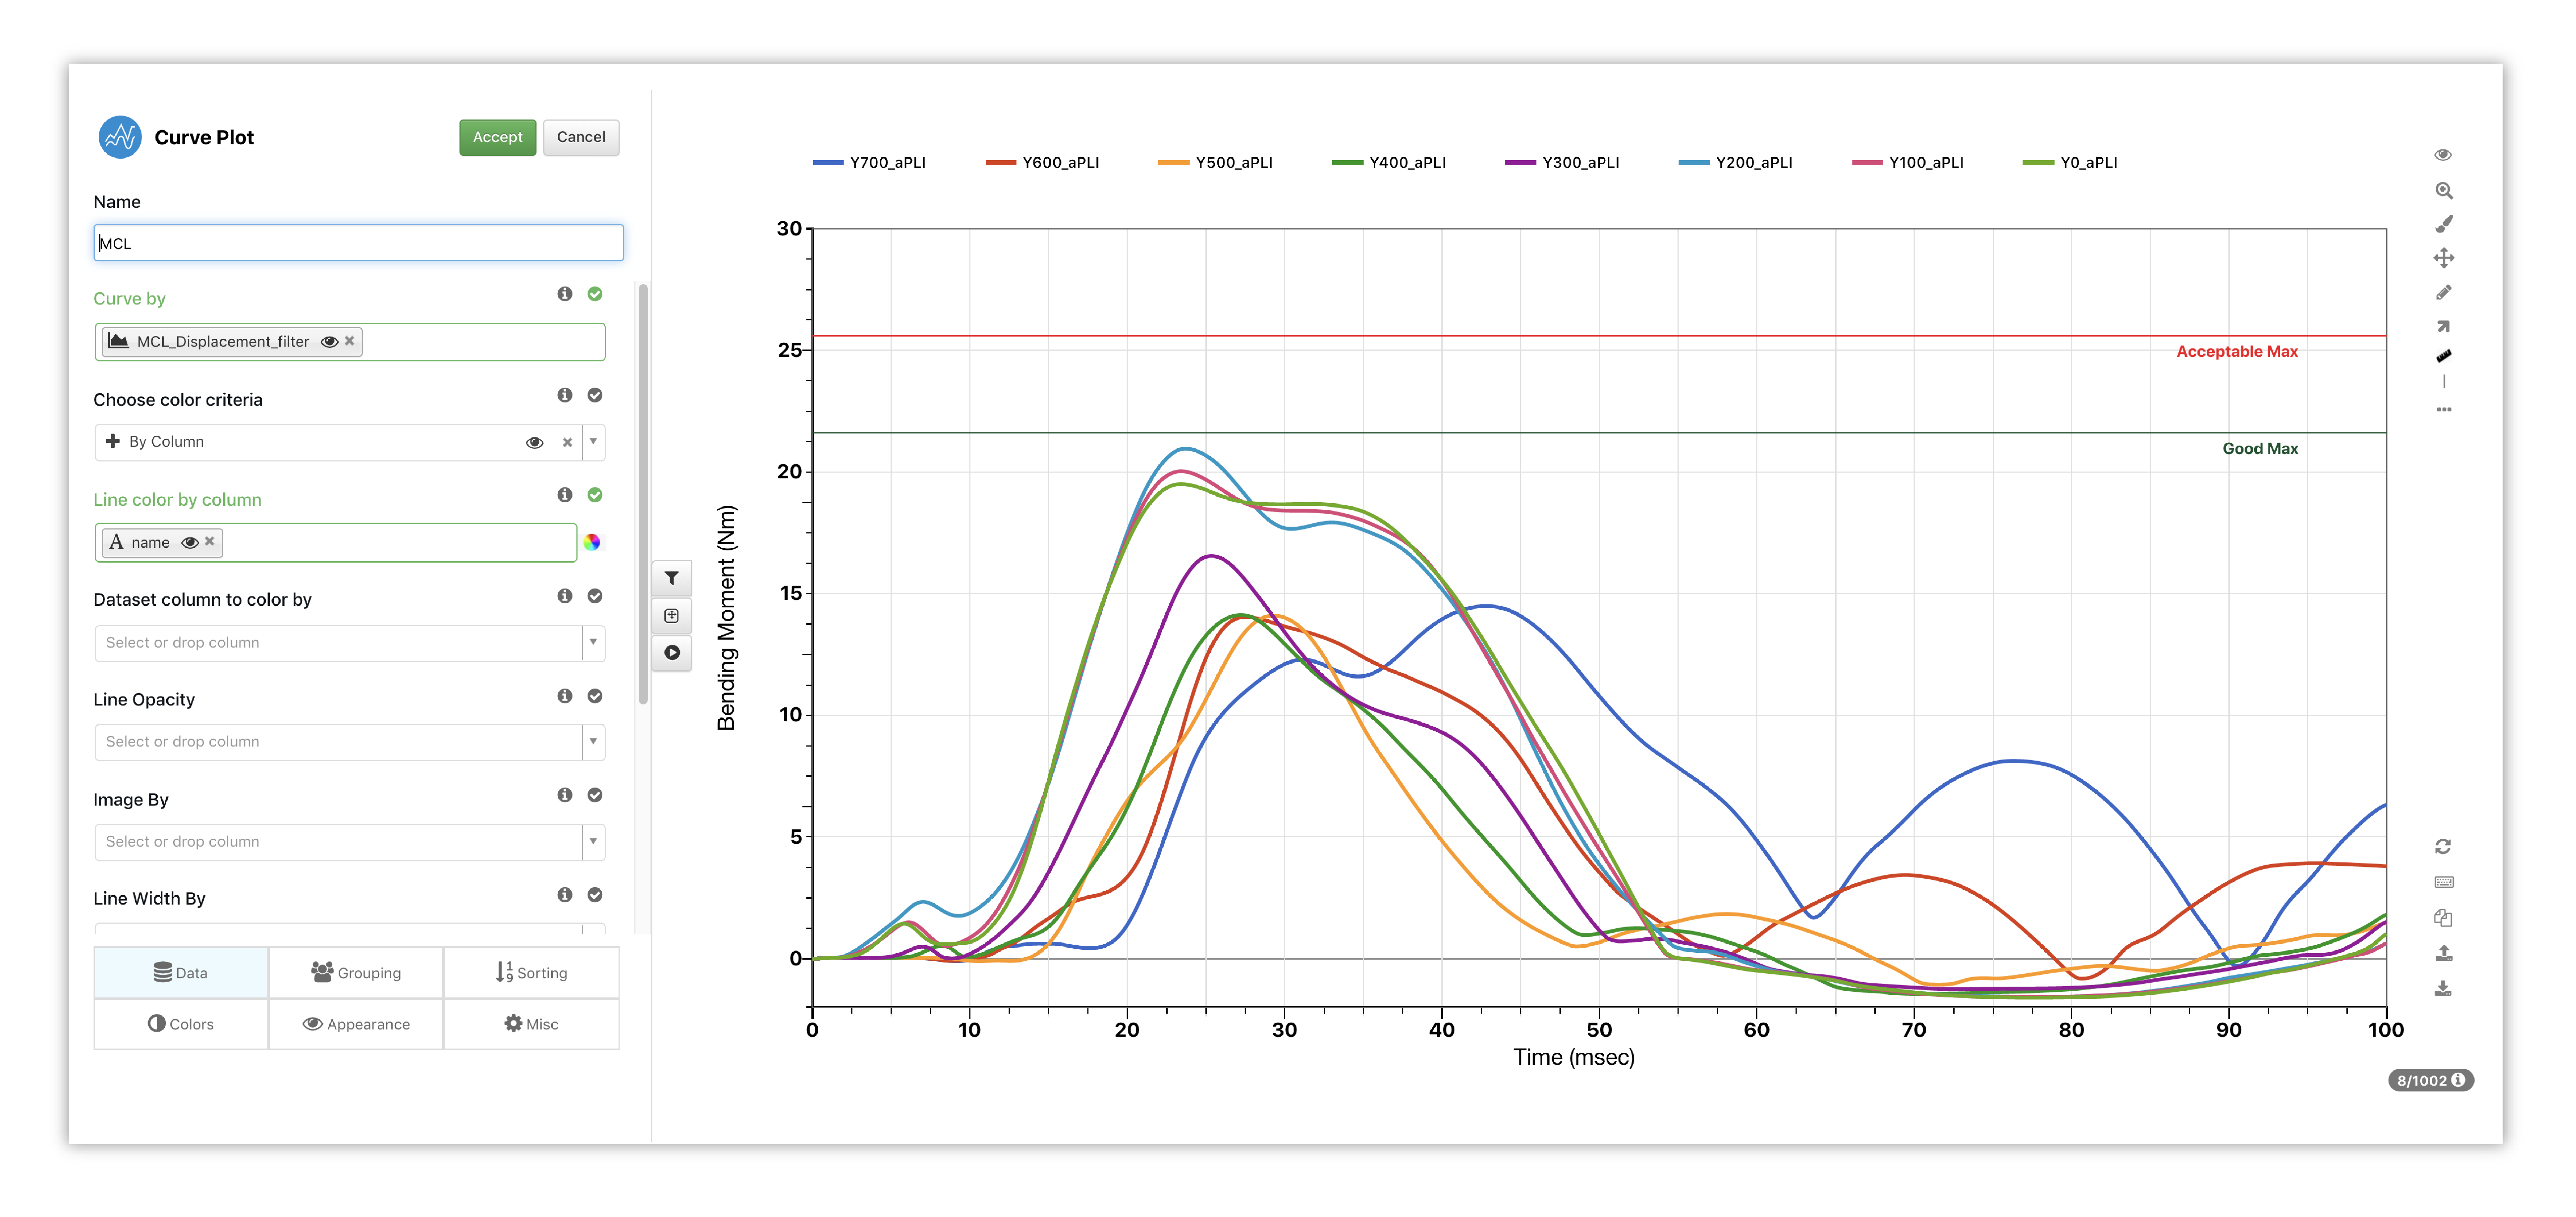
Figure 12: MCL Curve Options
Here is how these curves are presented in Simlytiks via the template.
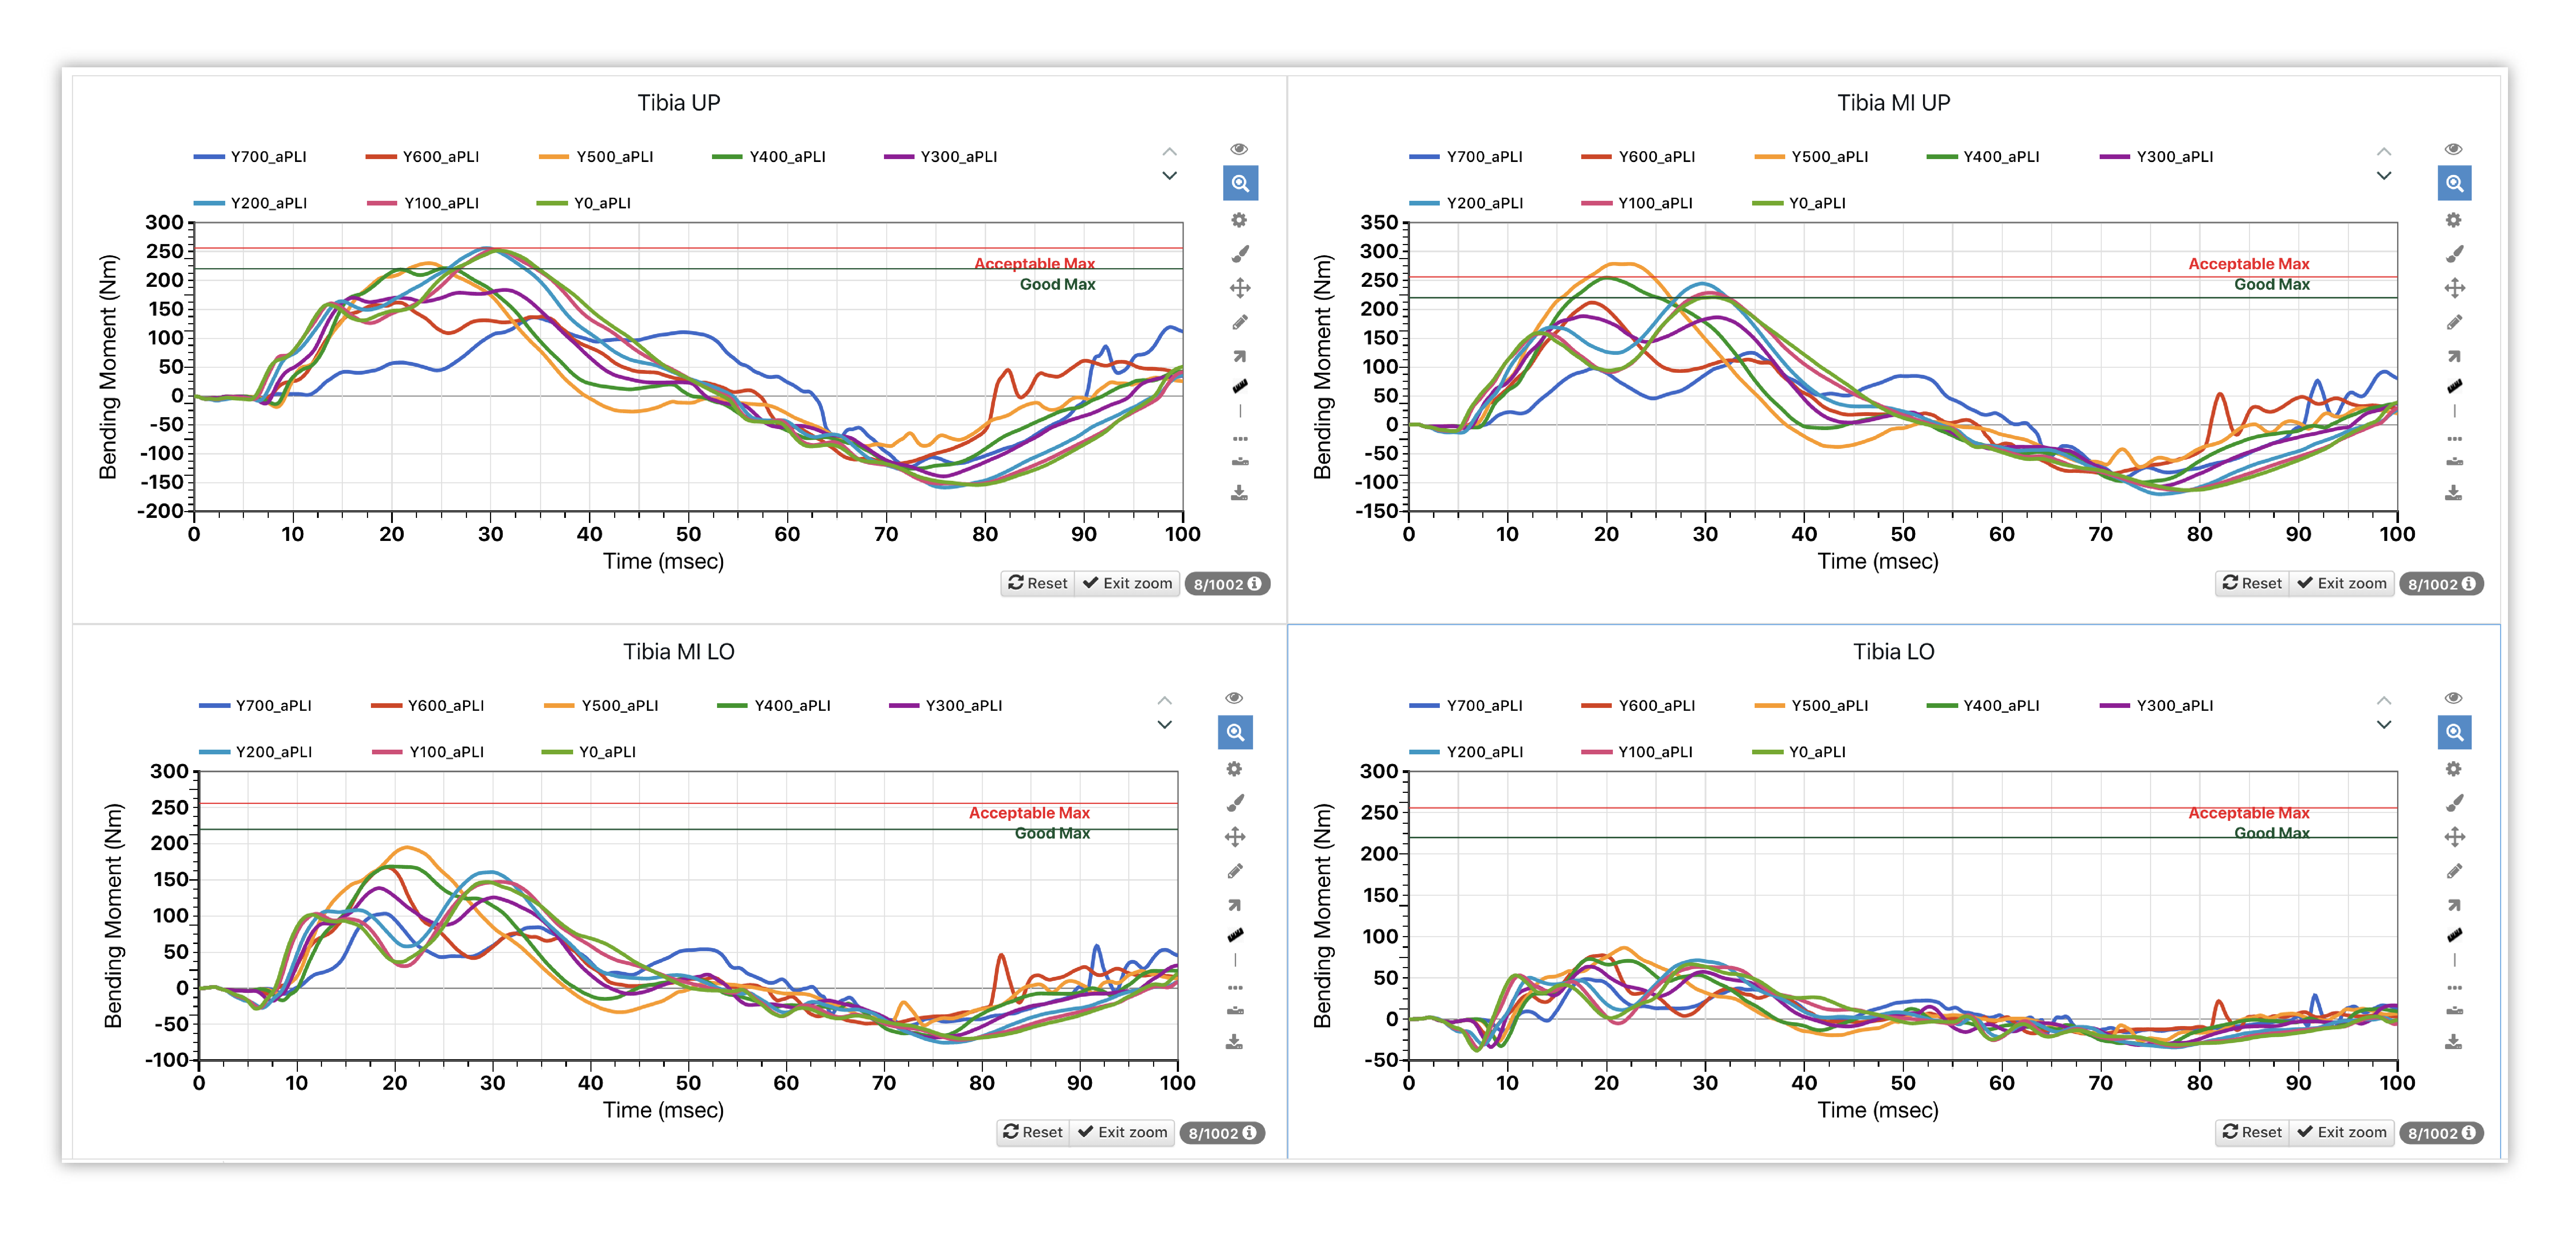
Figure 13: Tibia Curves
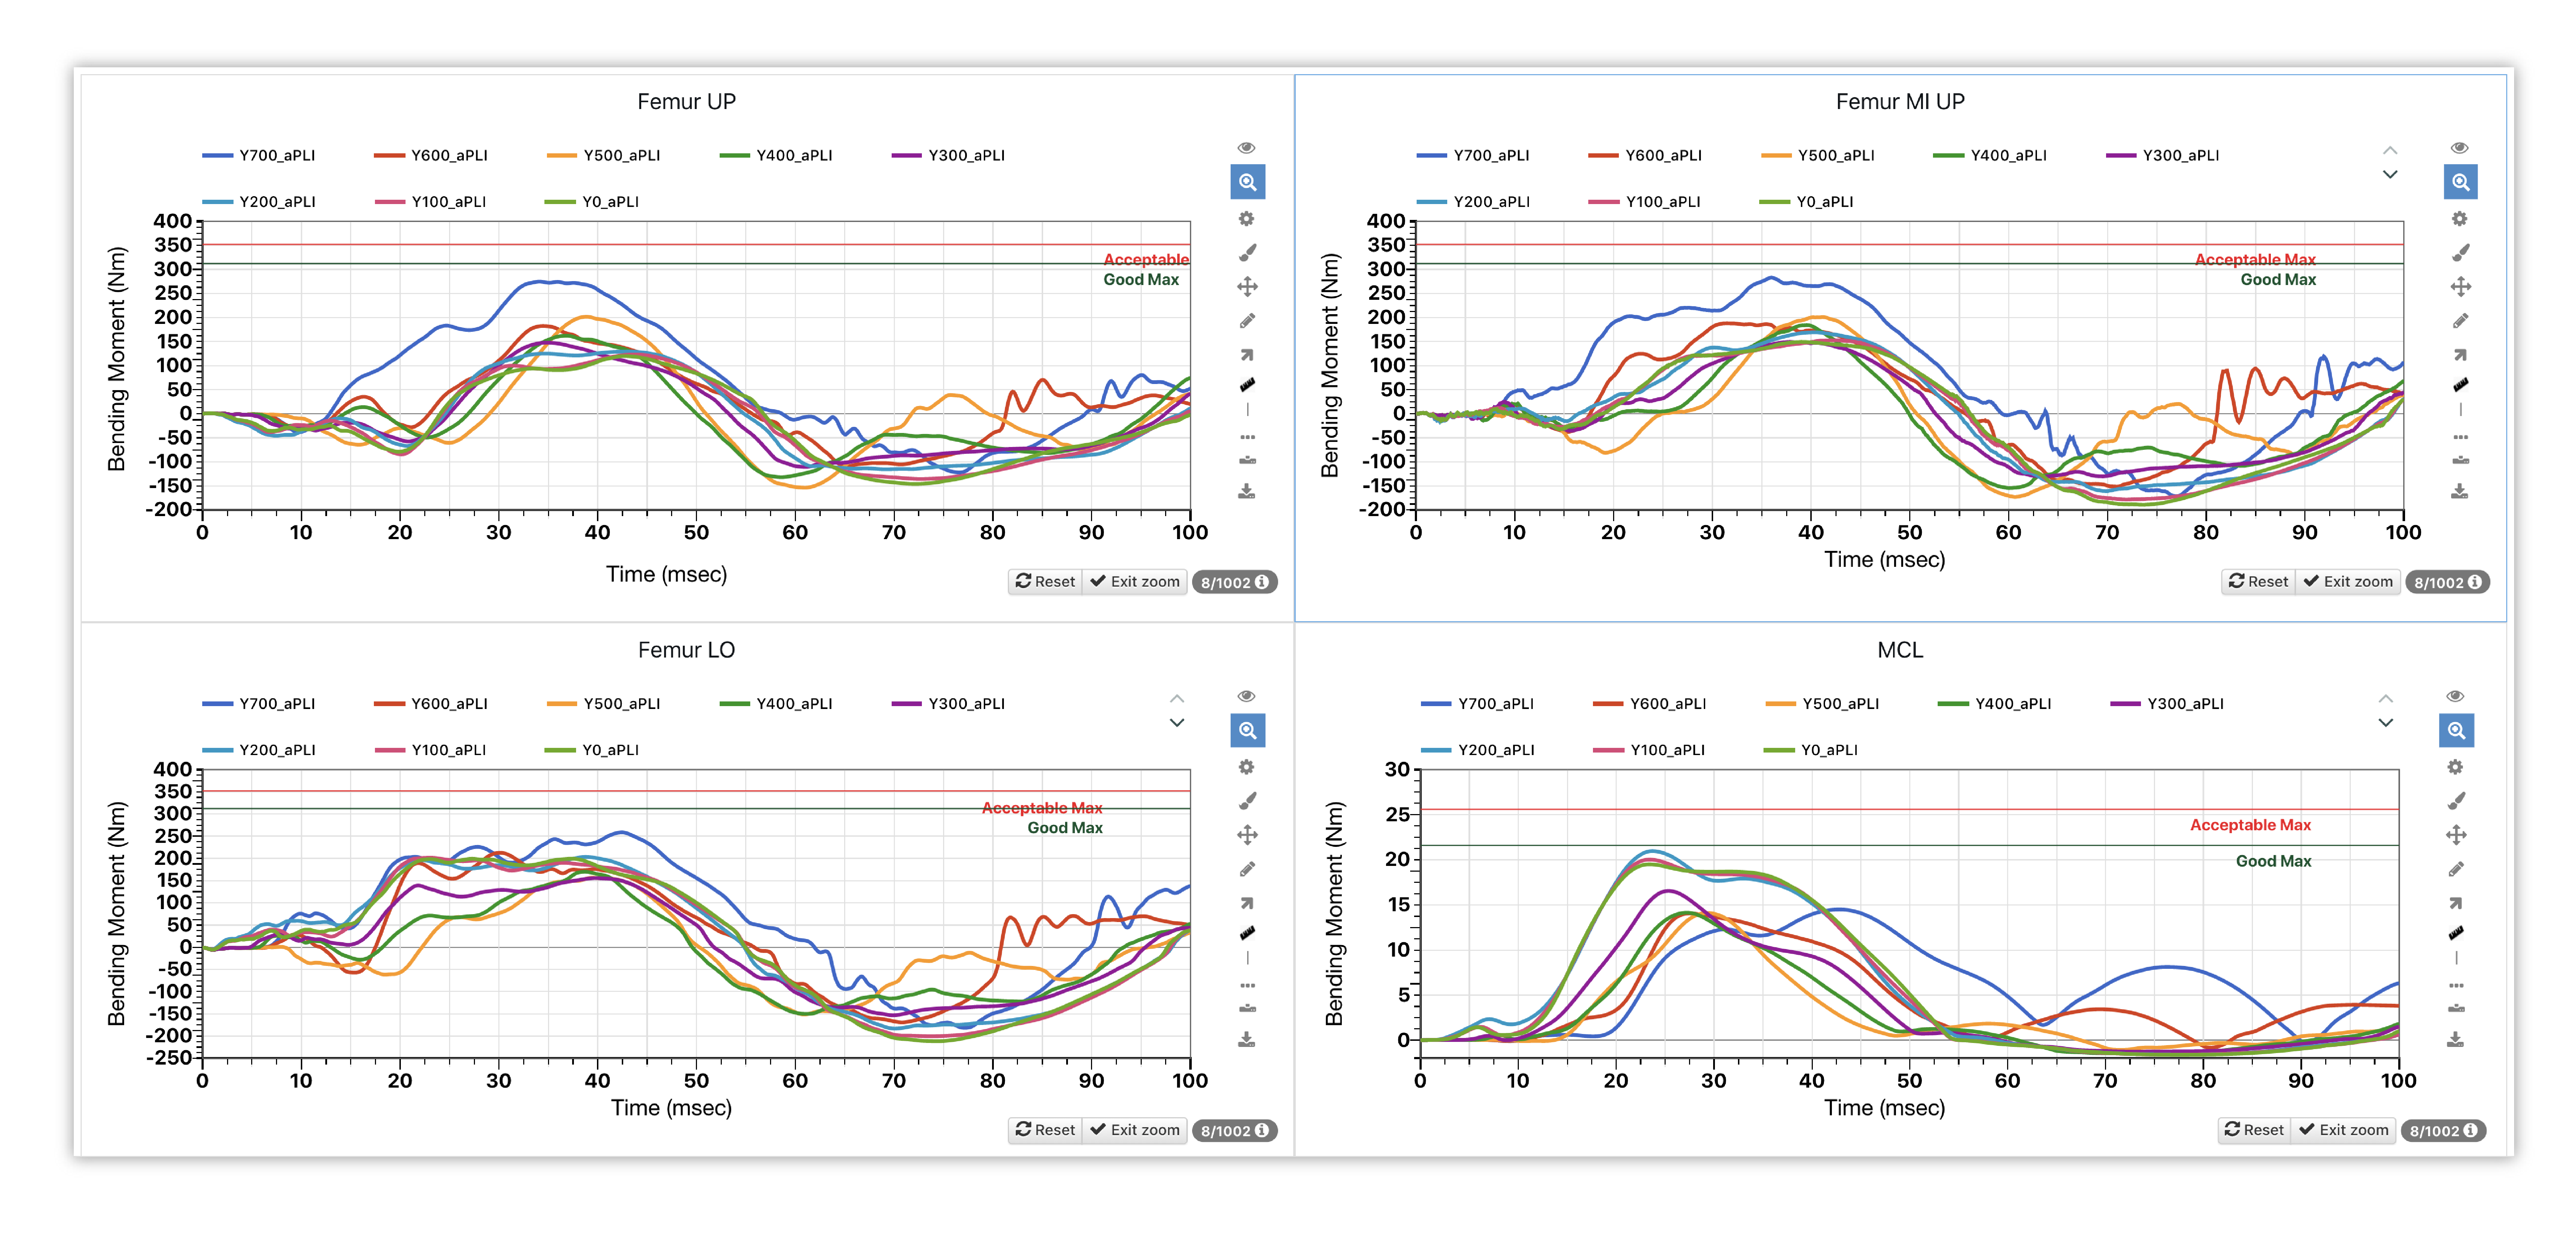
Figure 14: Femur Curves
Table

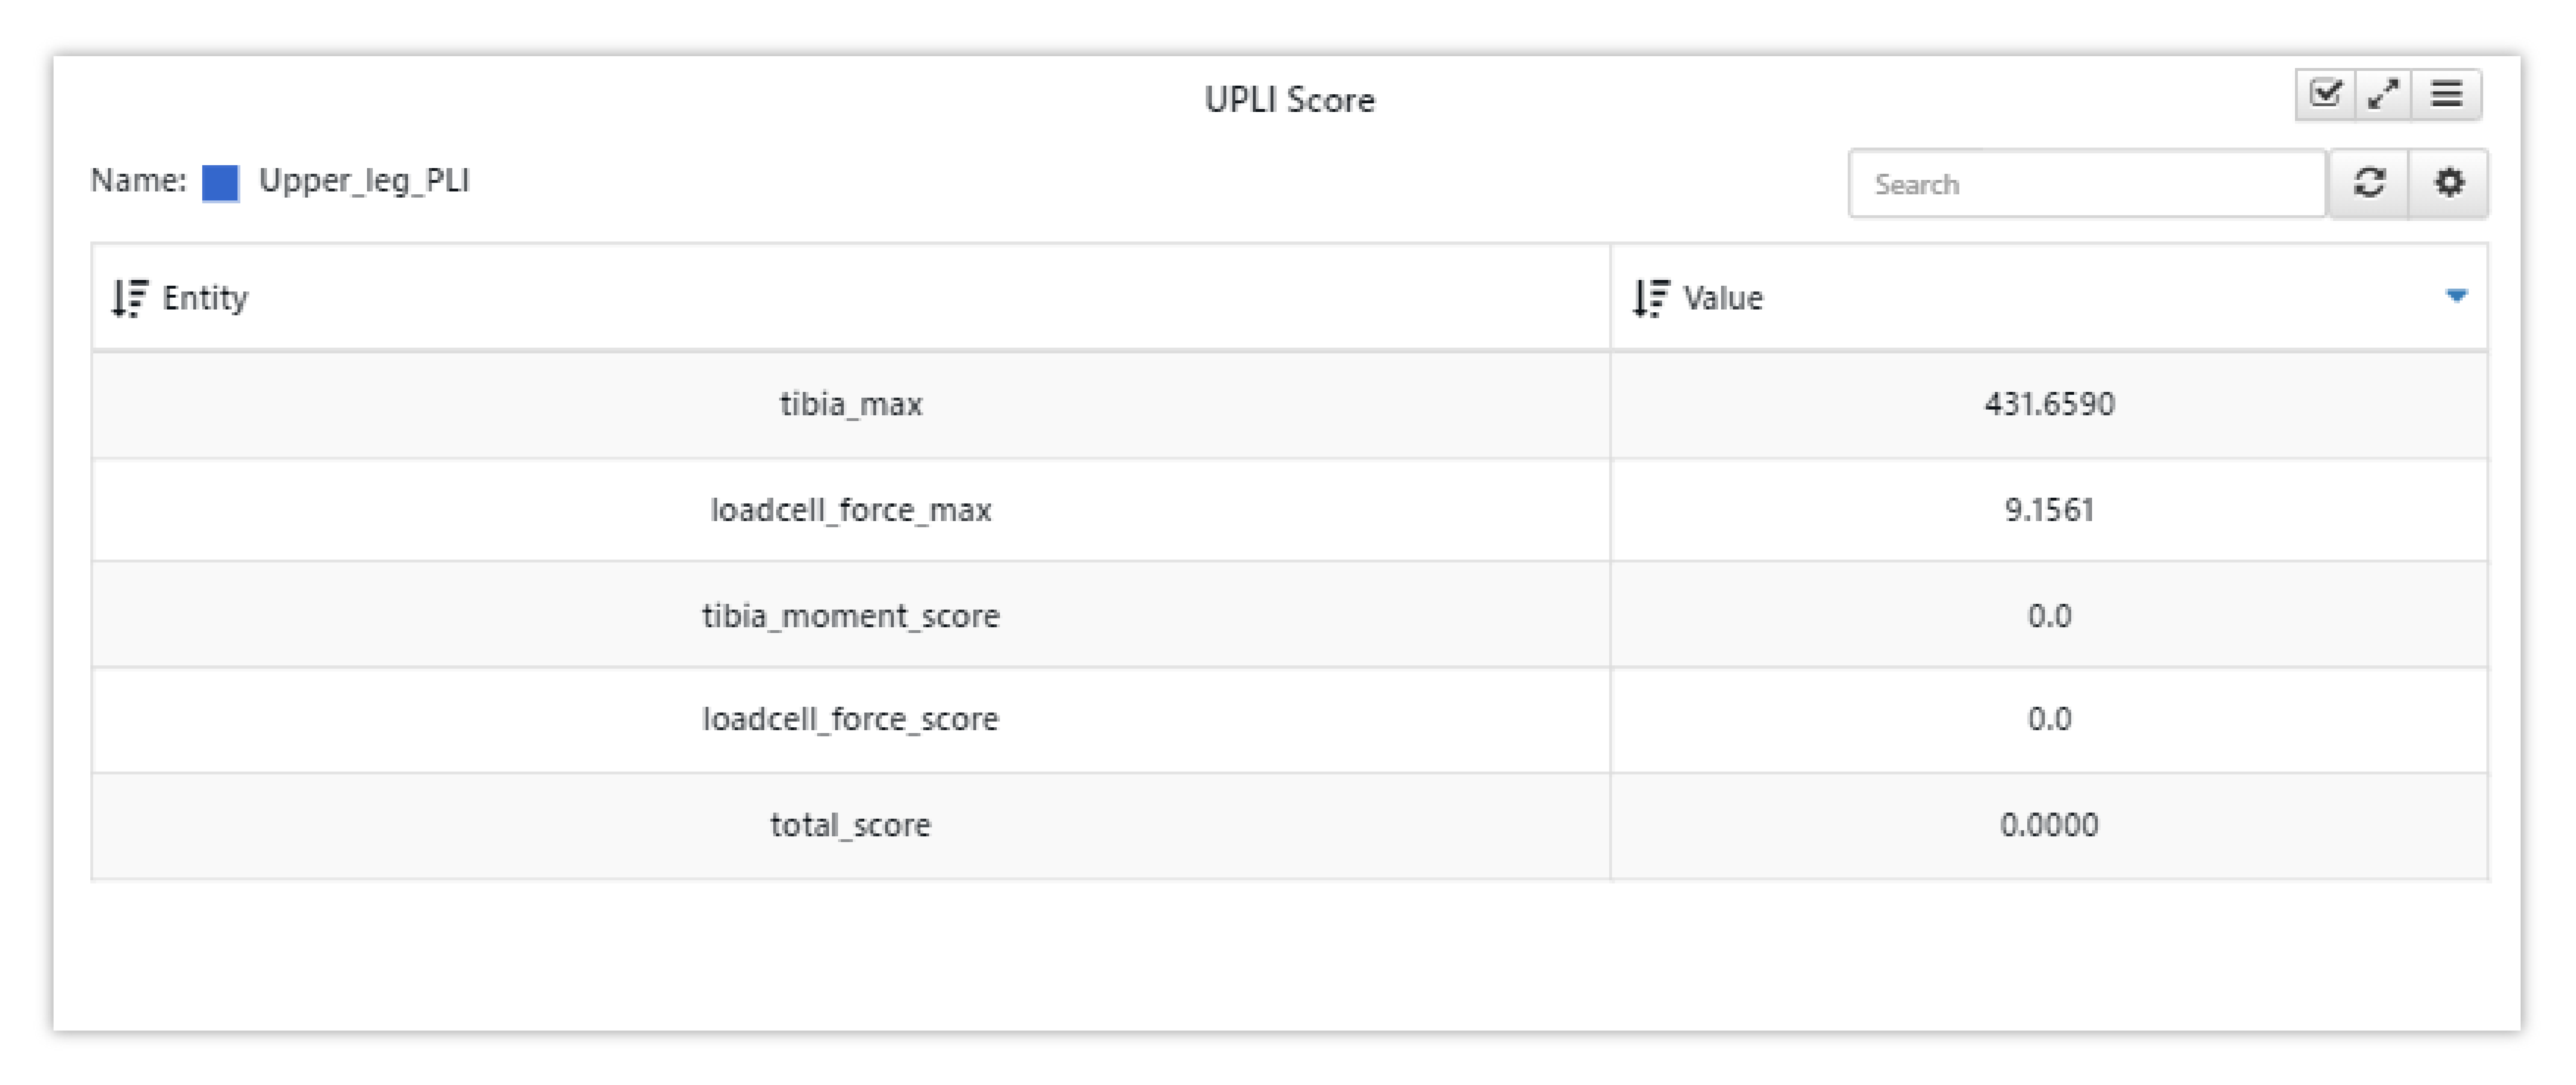
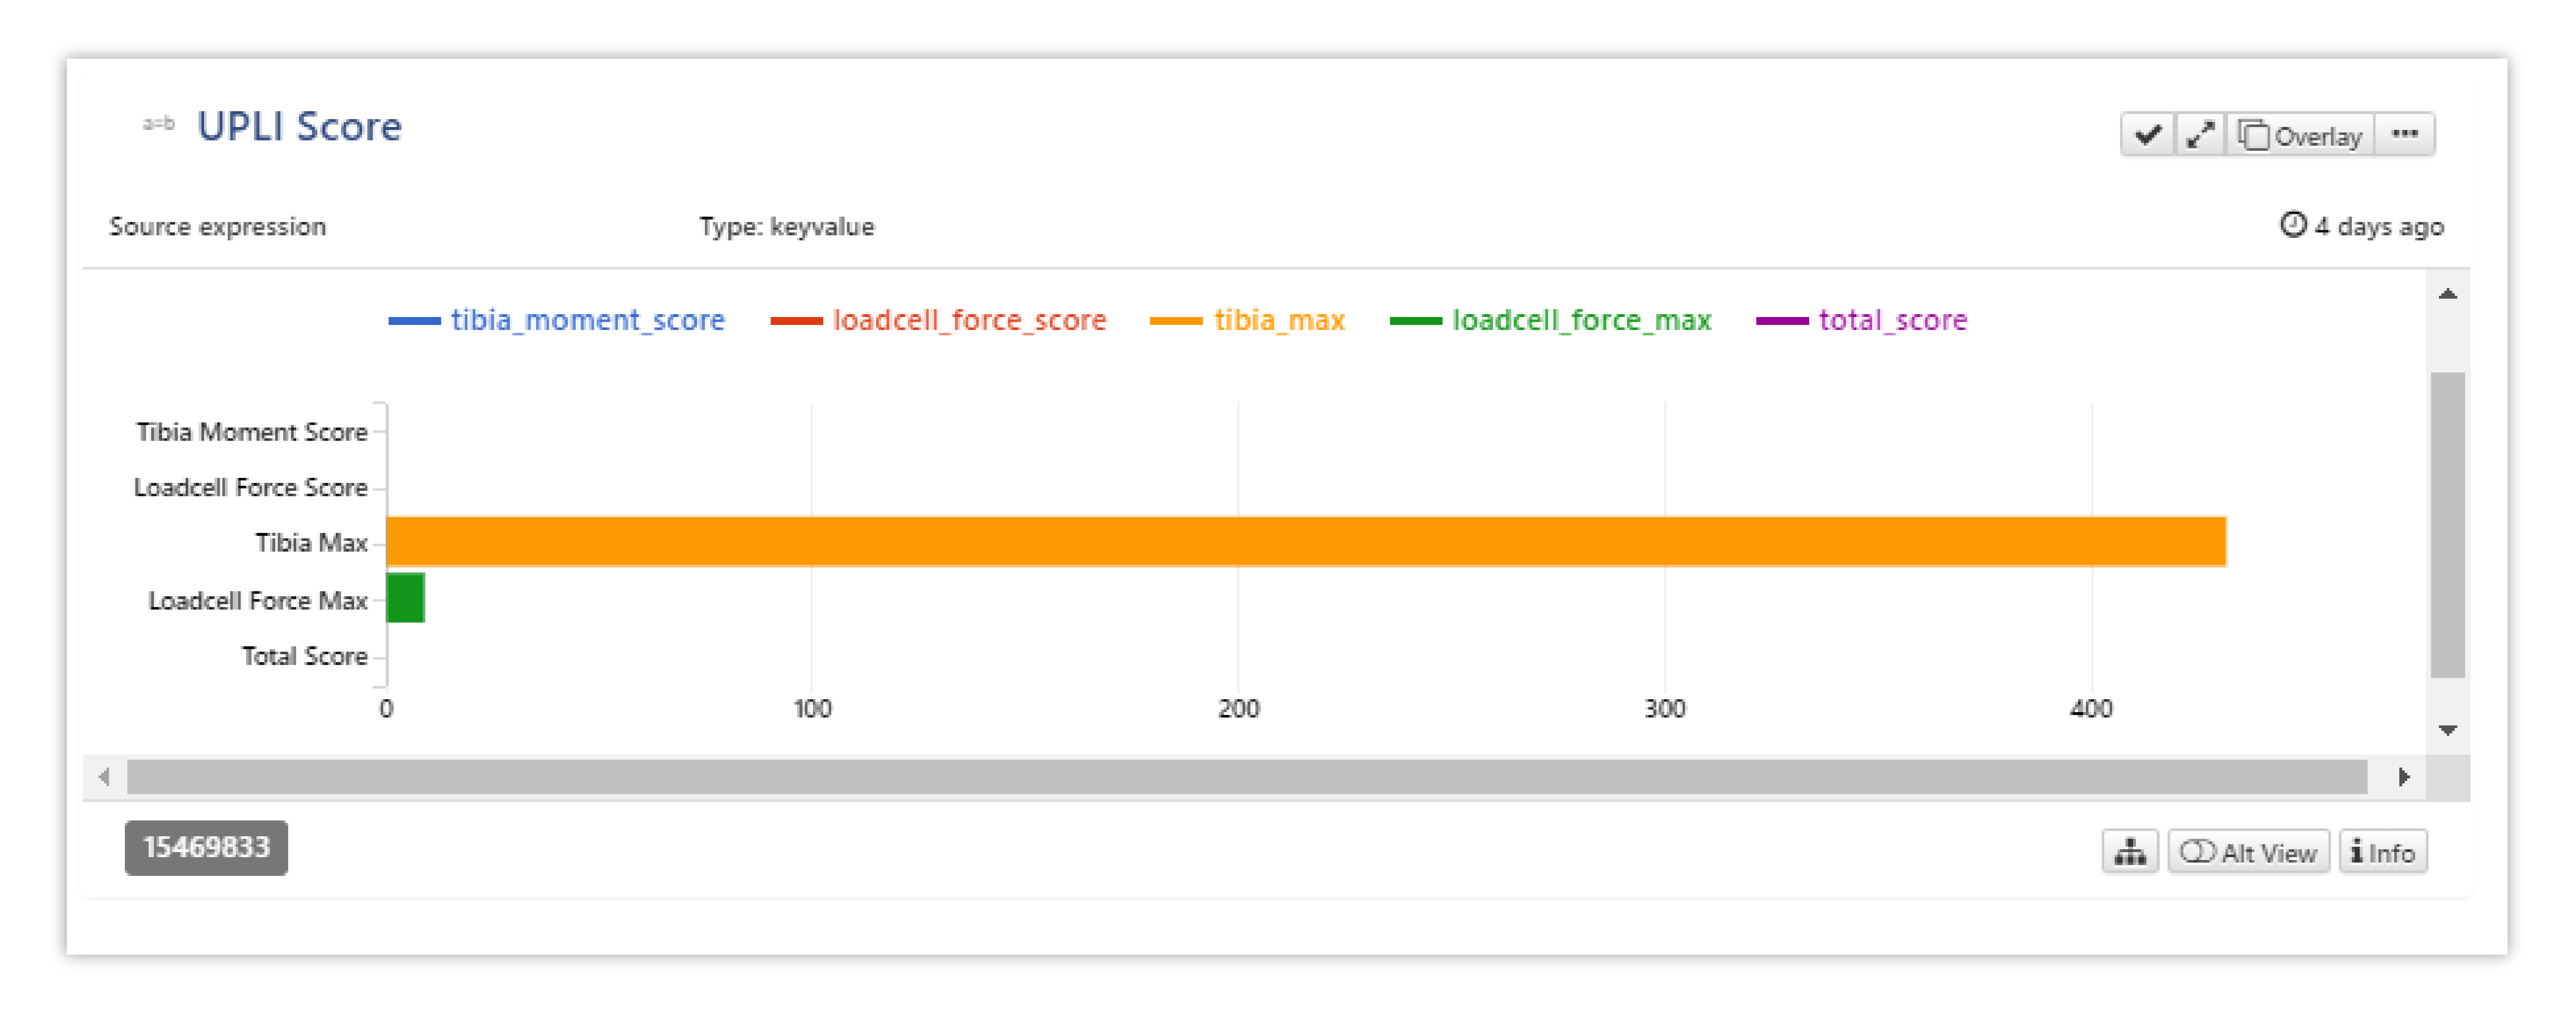
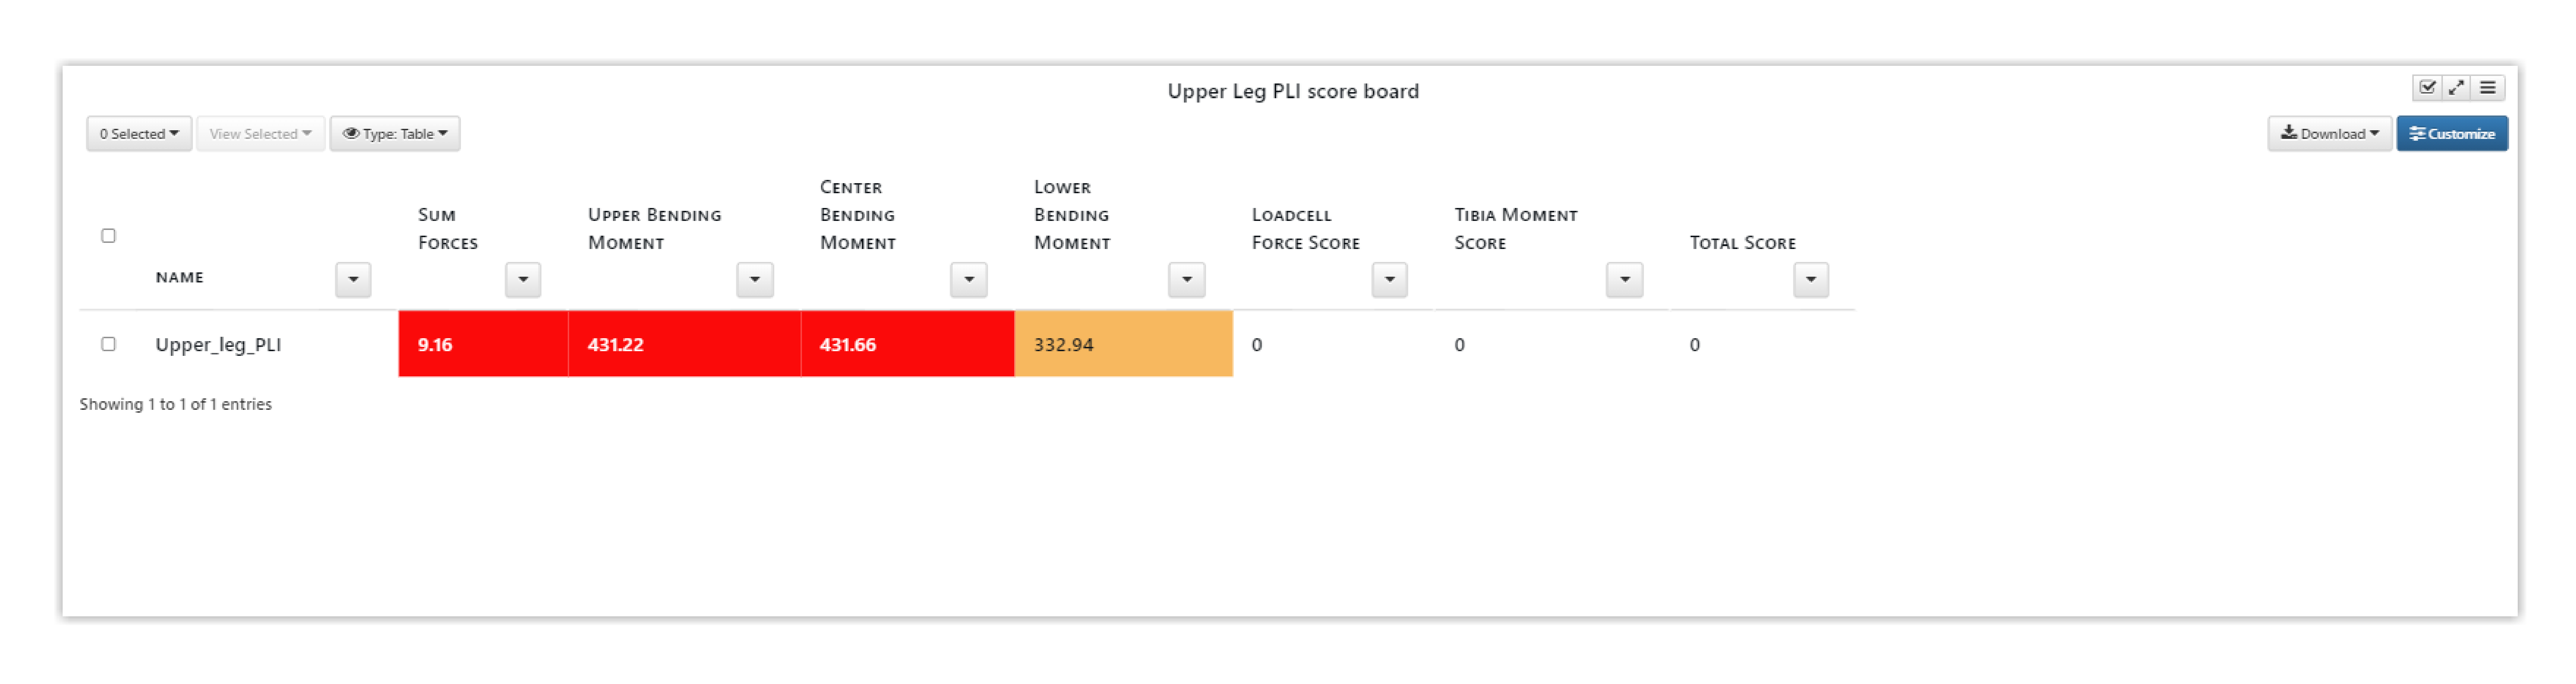
Table visualizer is used to create the aPLI score cards, which include the corporate scoresheet and CNCAP score calculator. Again, these tables will be created for us via the template, but here is how the set up looks for reference.
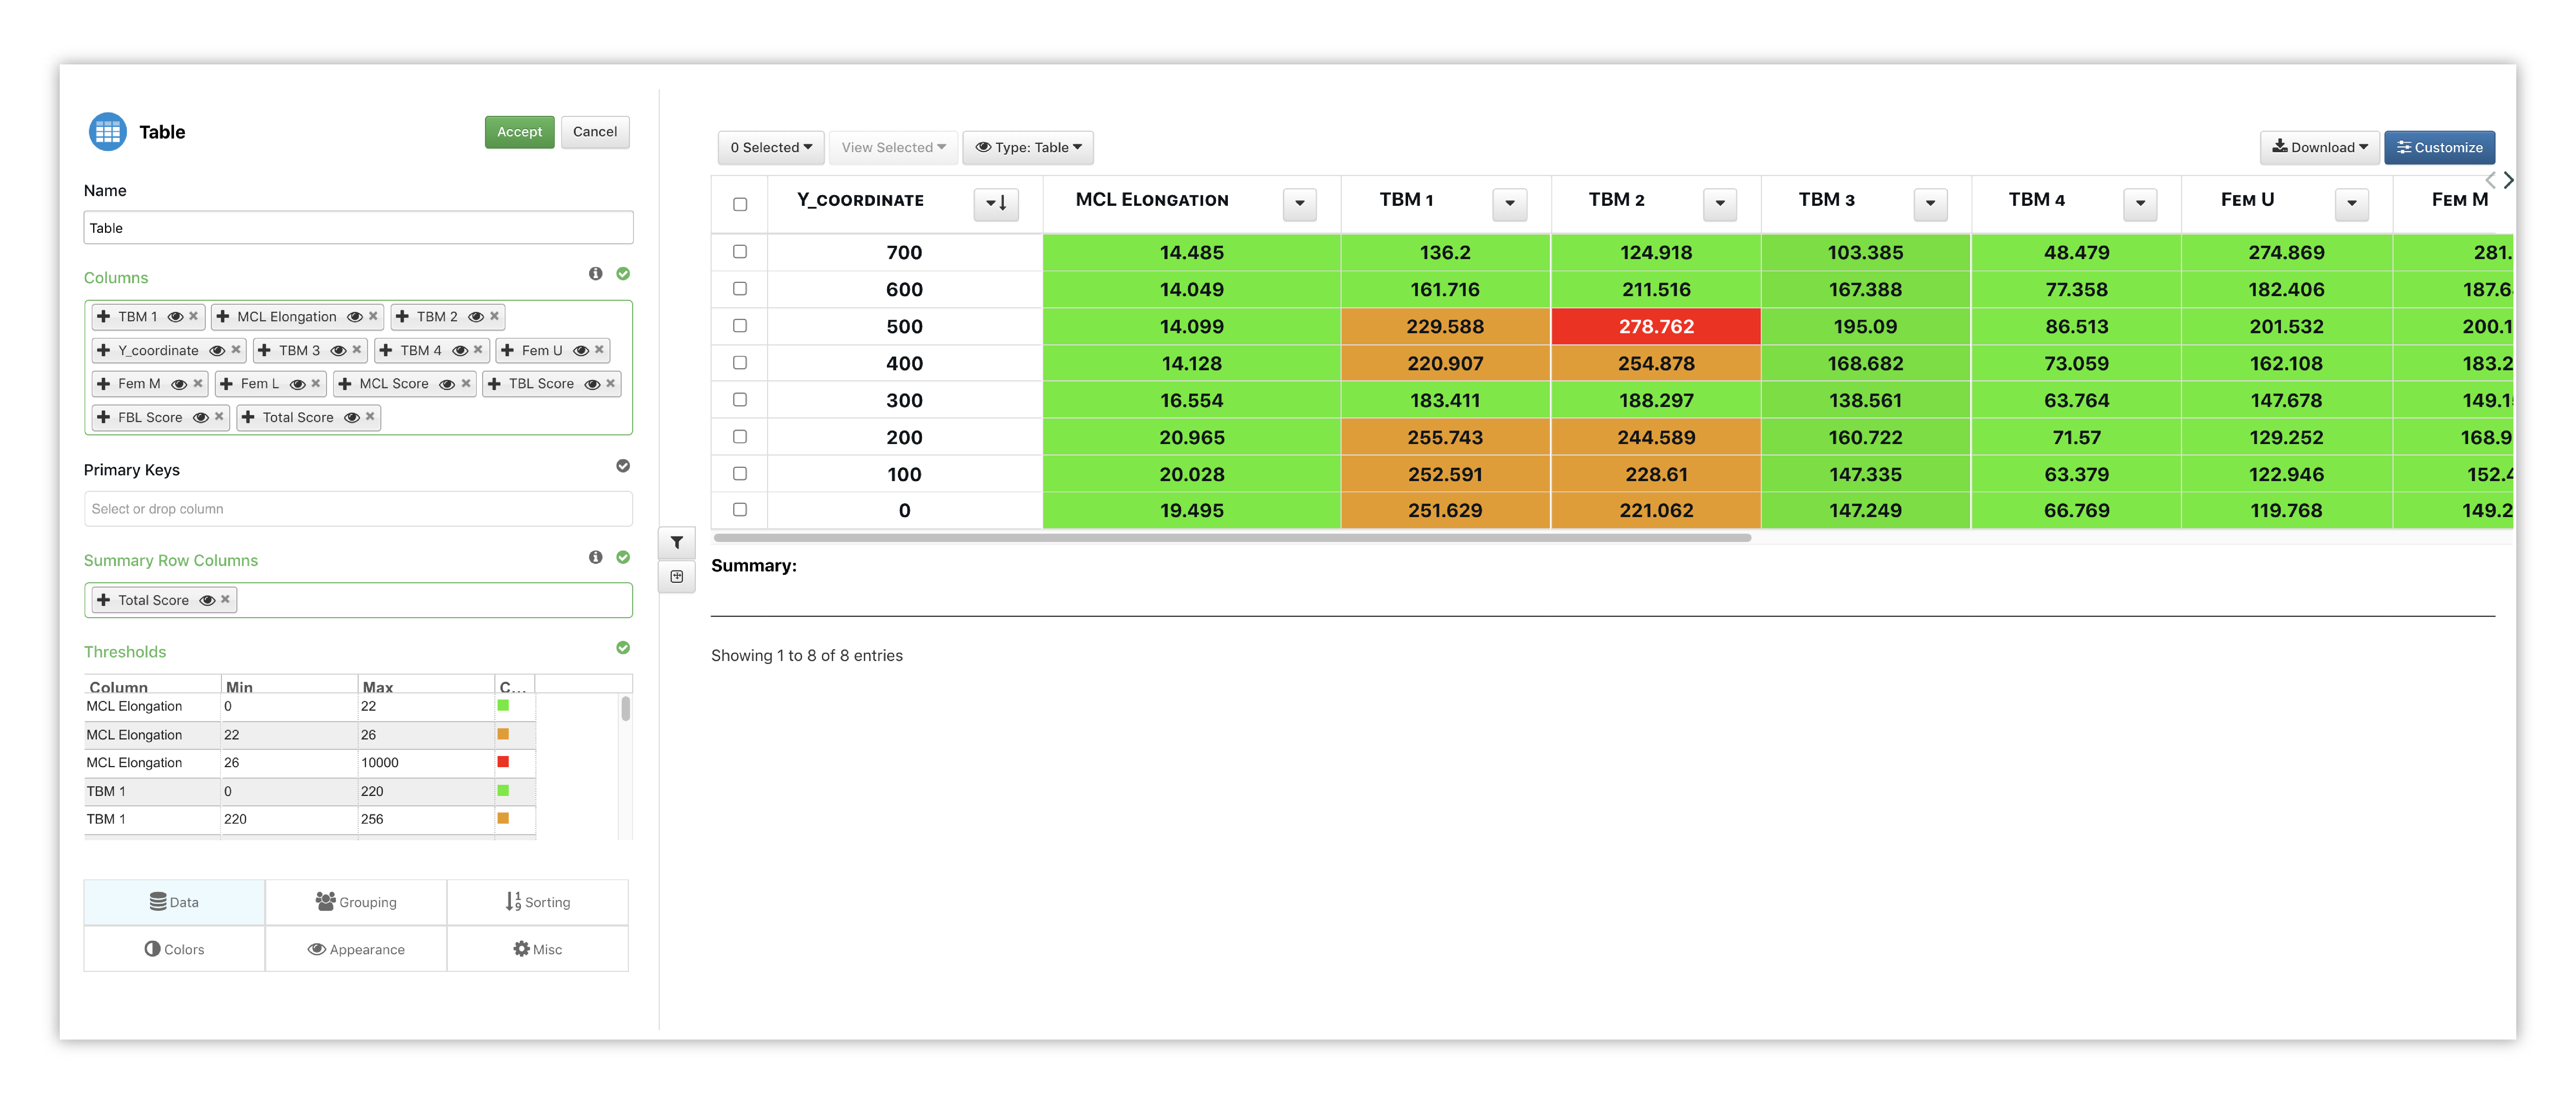
Figure 15: Score Card Options
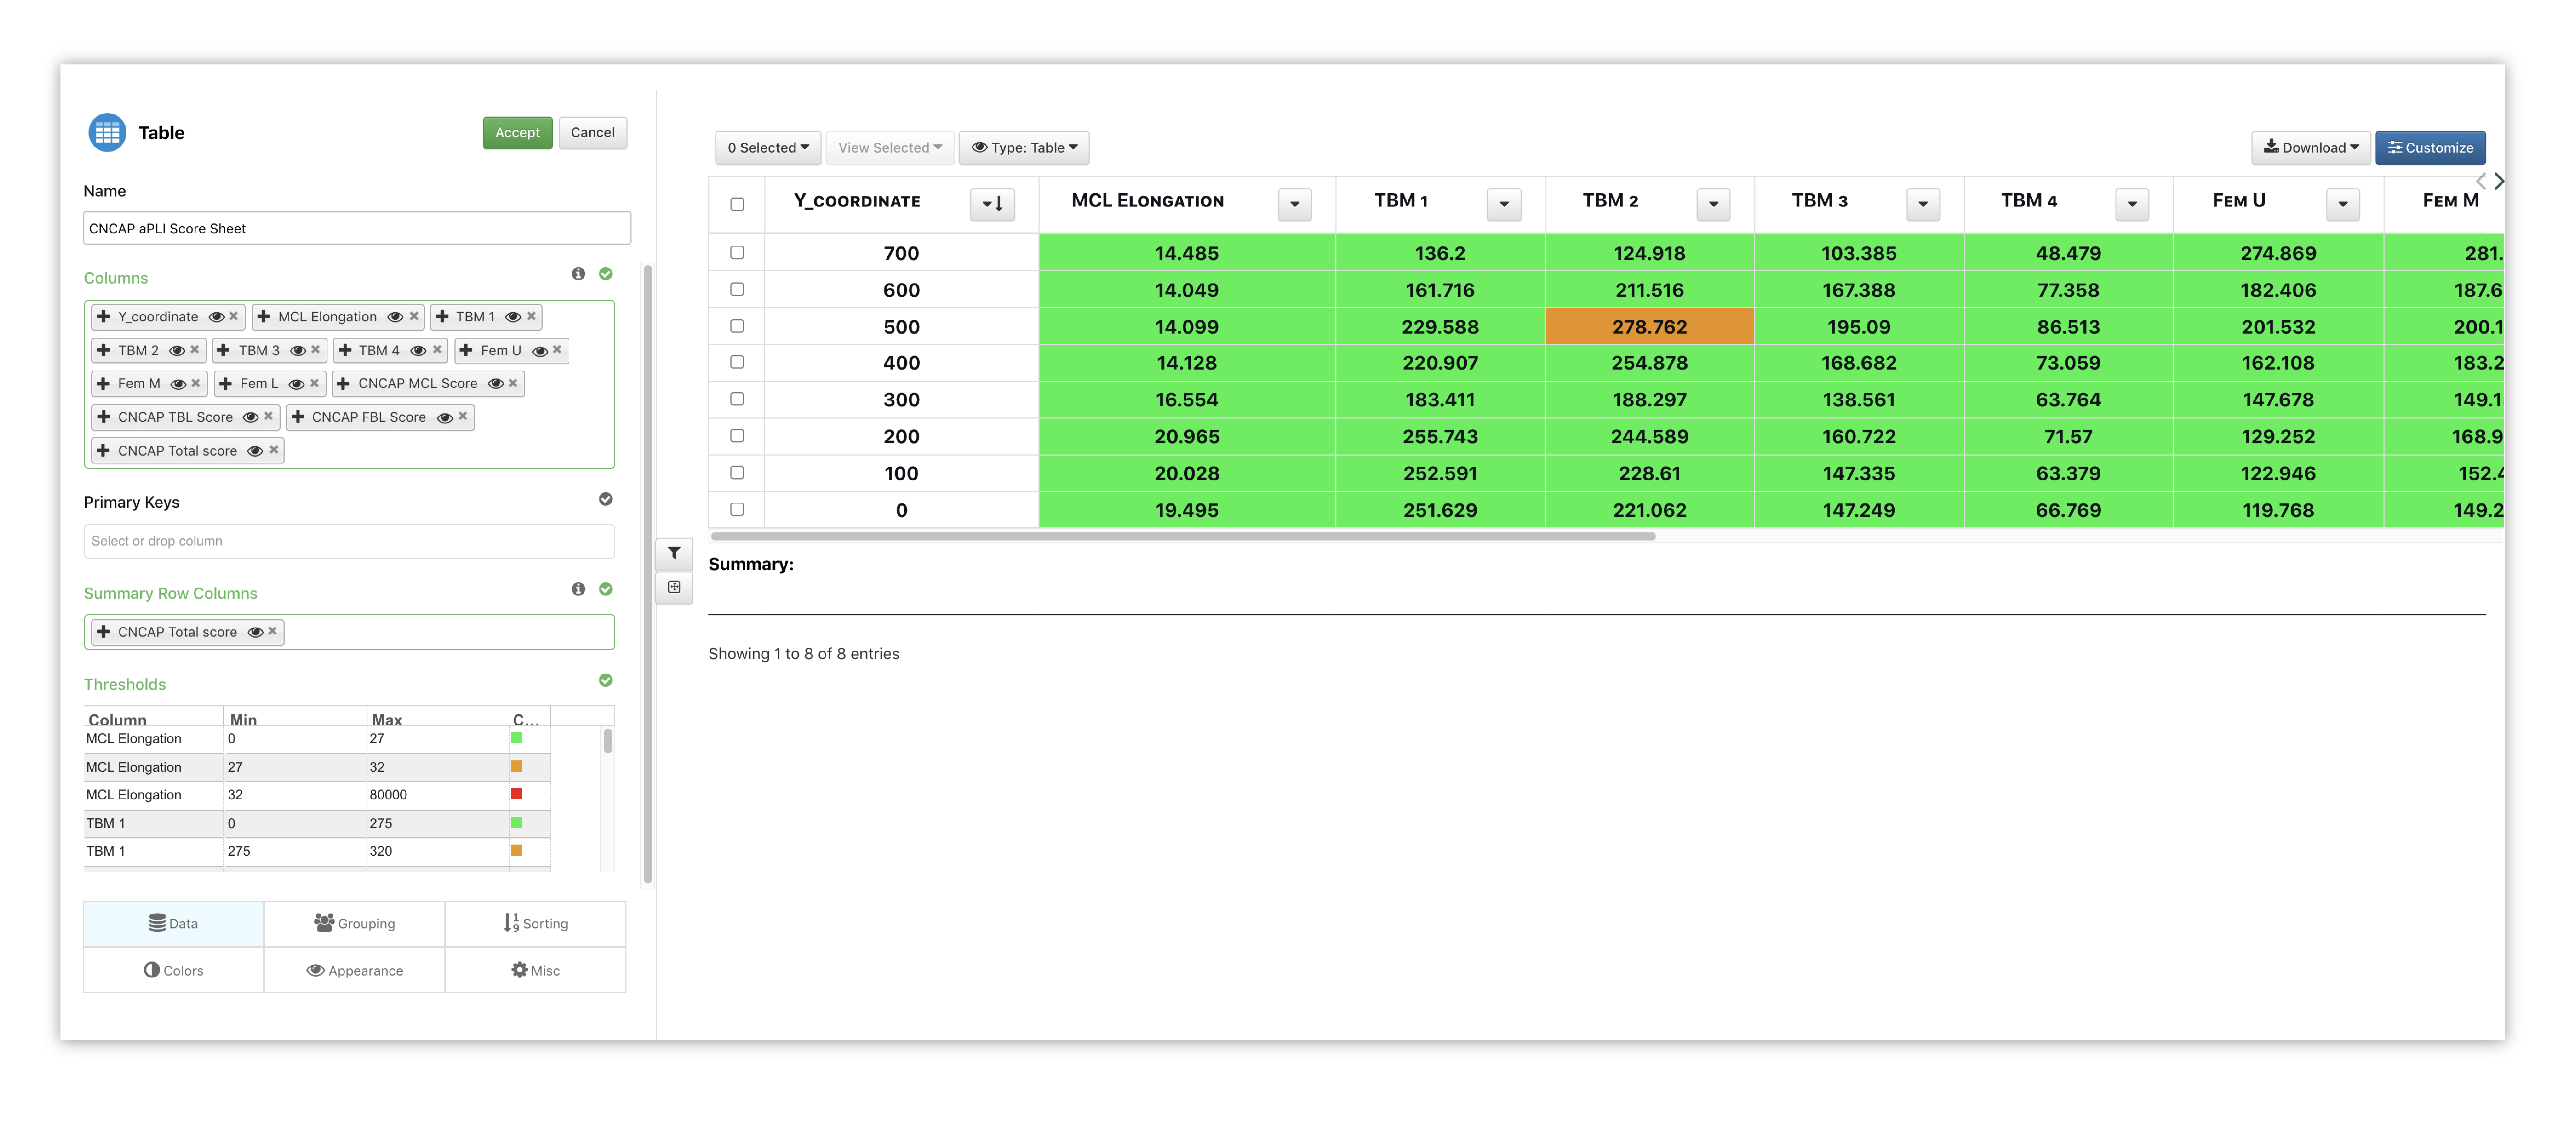
Figure 16: Score Card Options
Here is how the score cards are shown with the aPLI template.
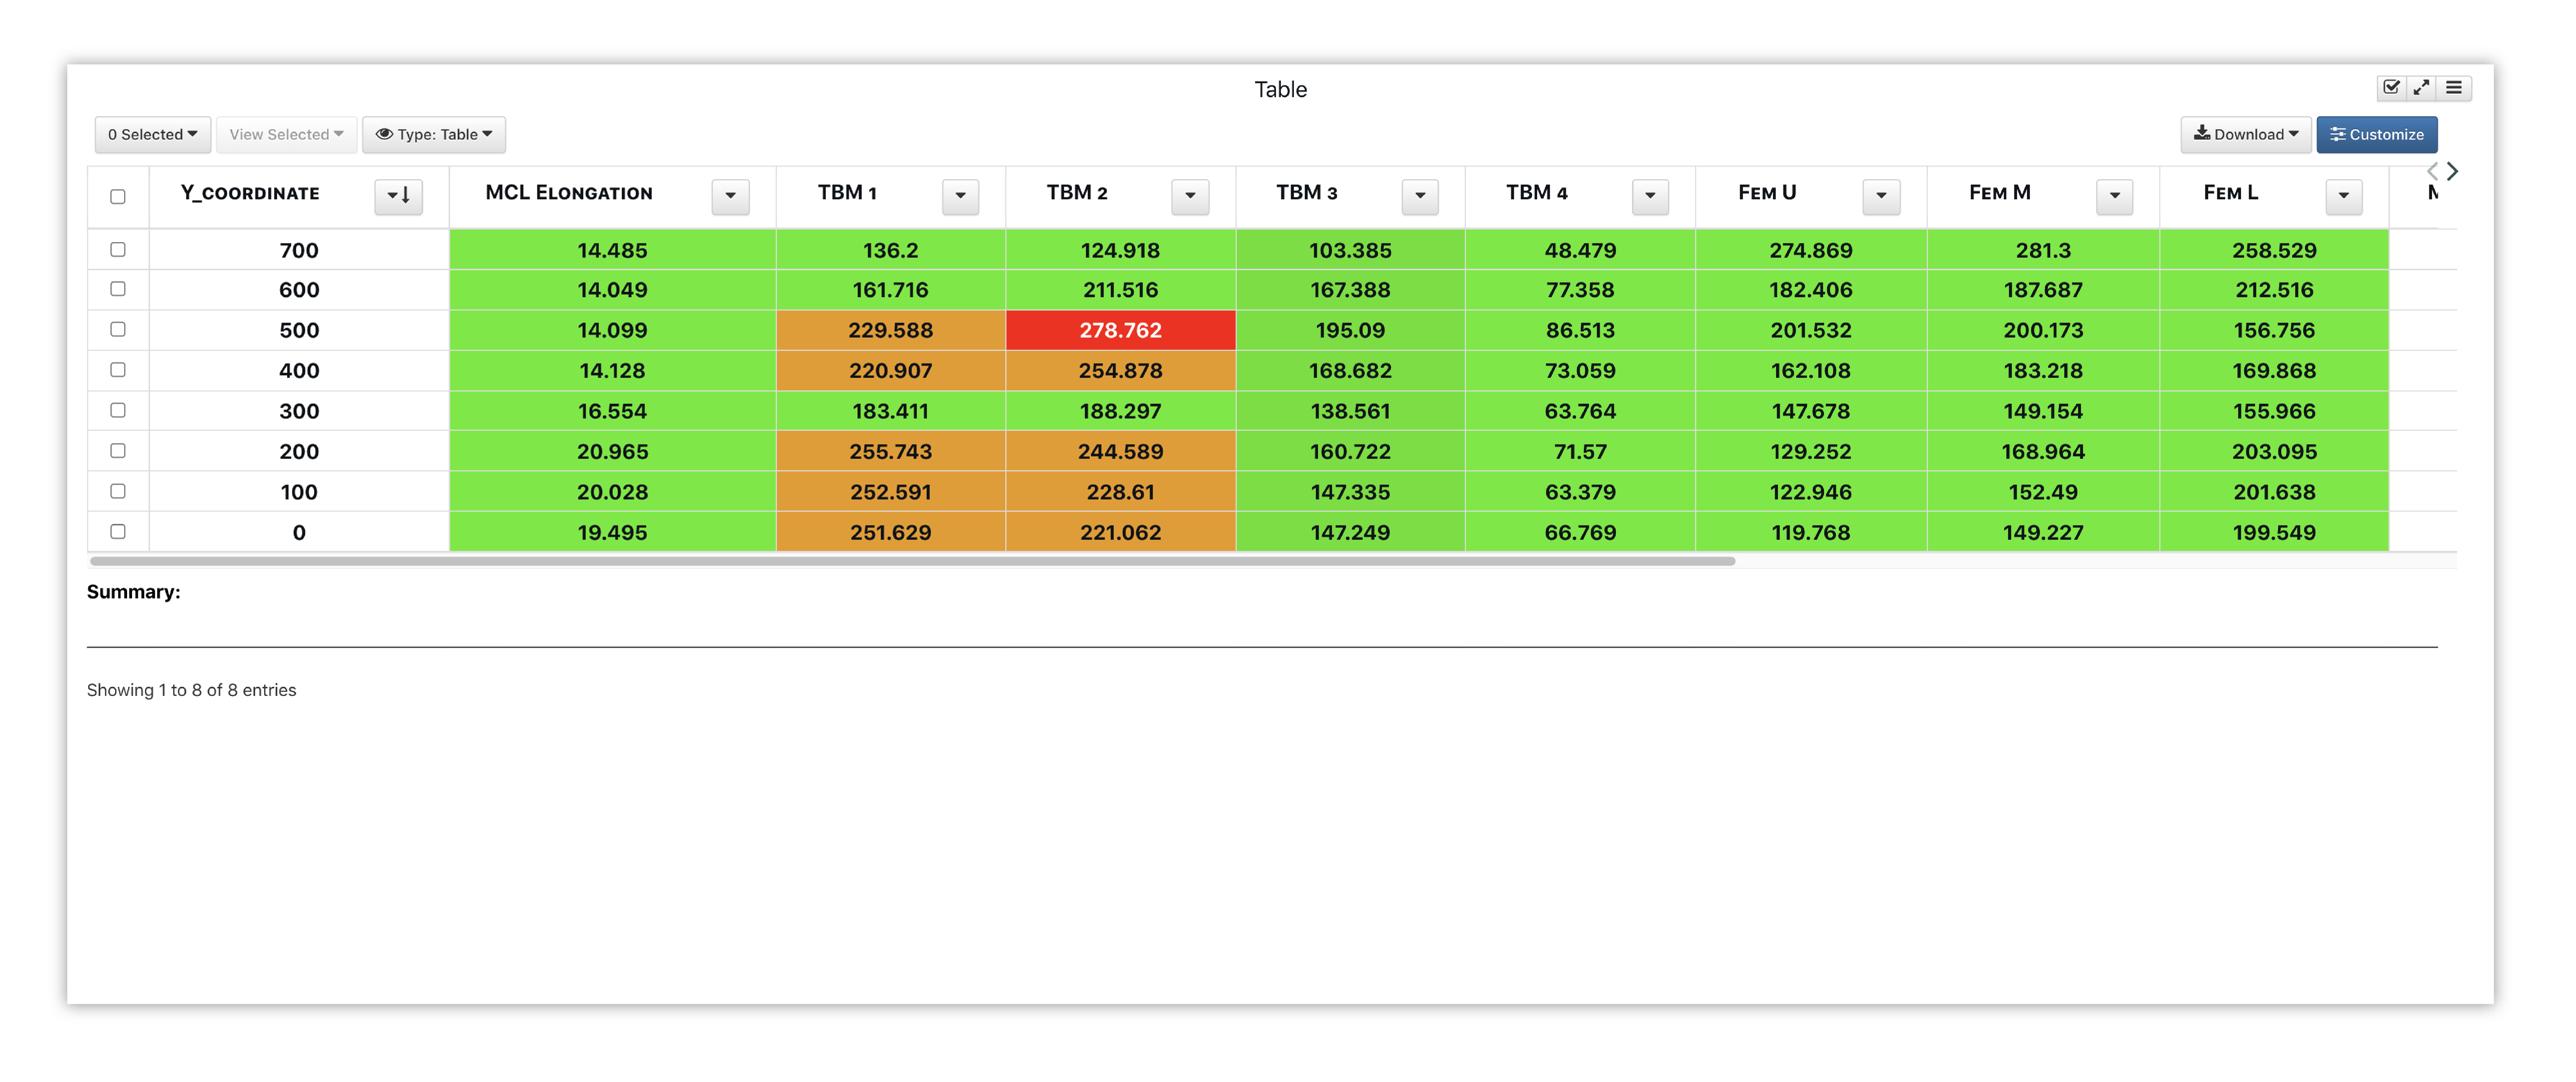
Figure 17: Score Card
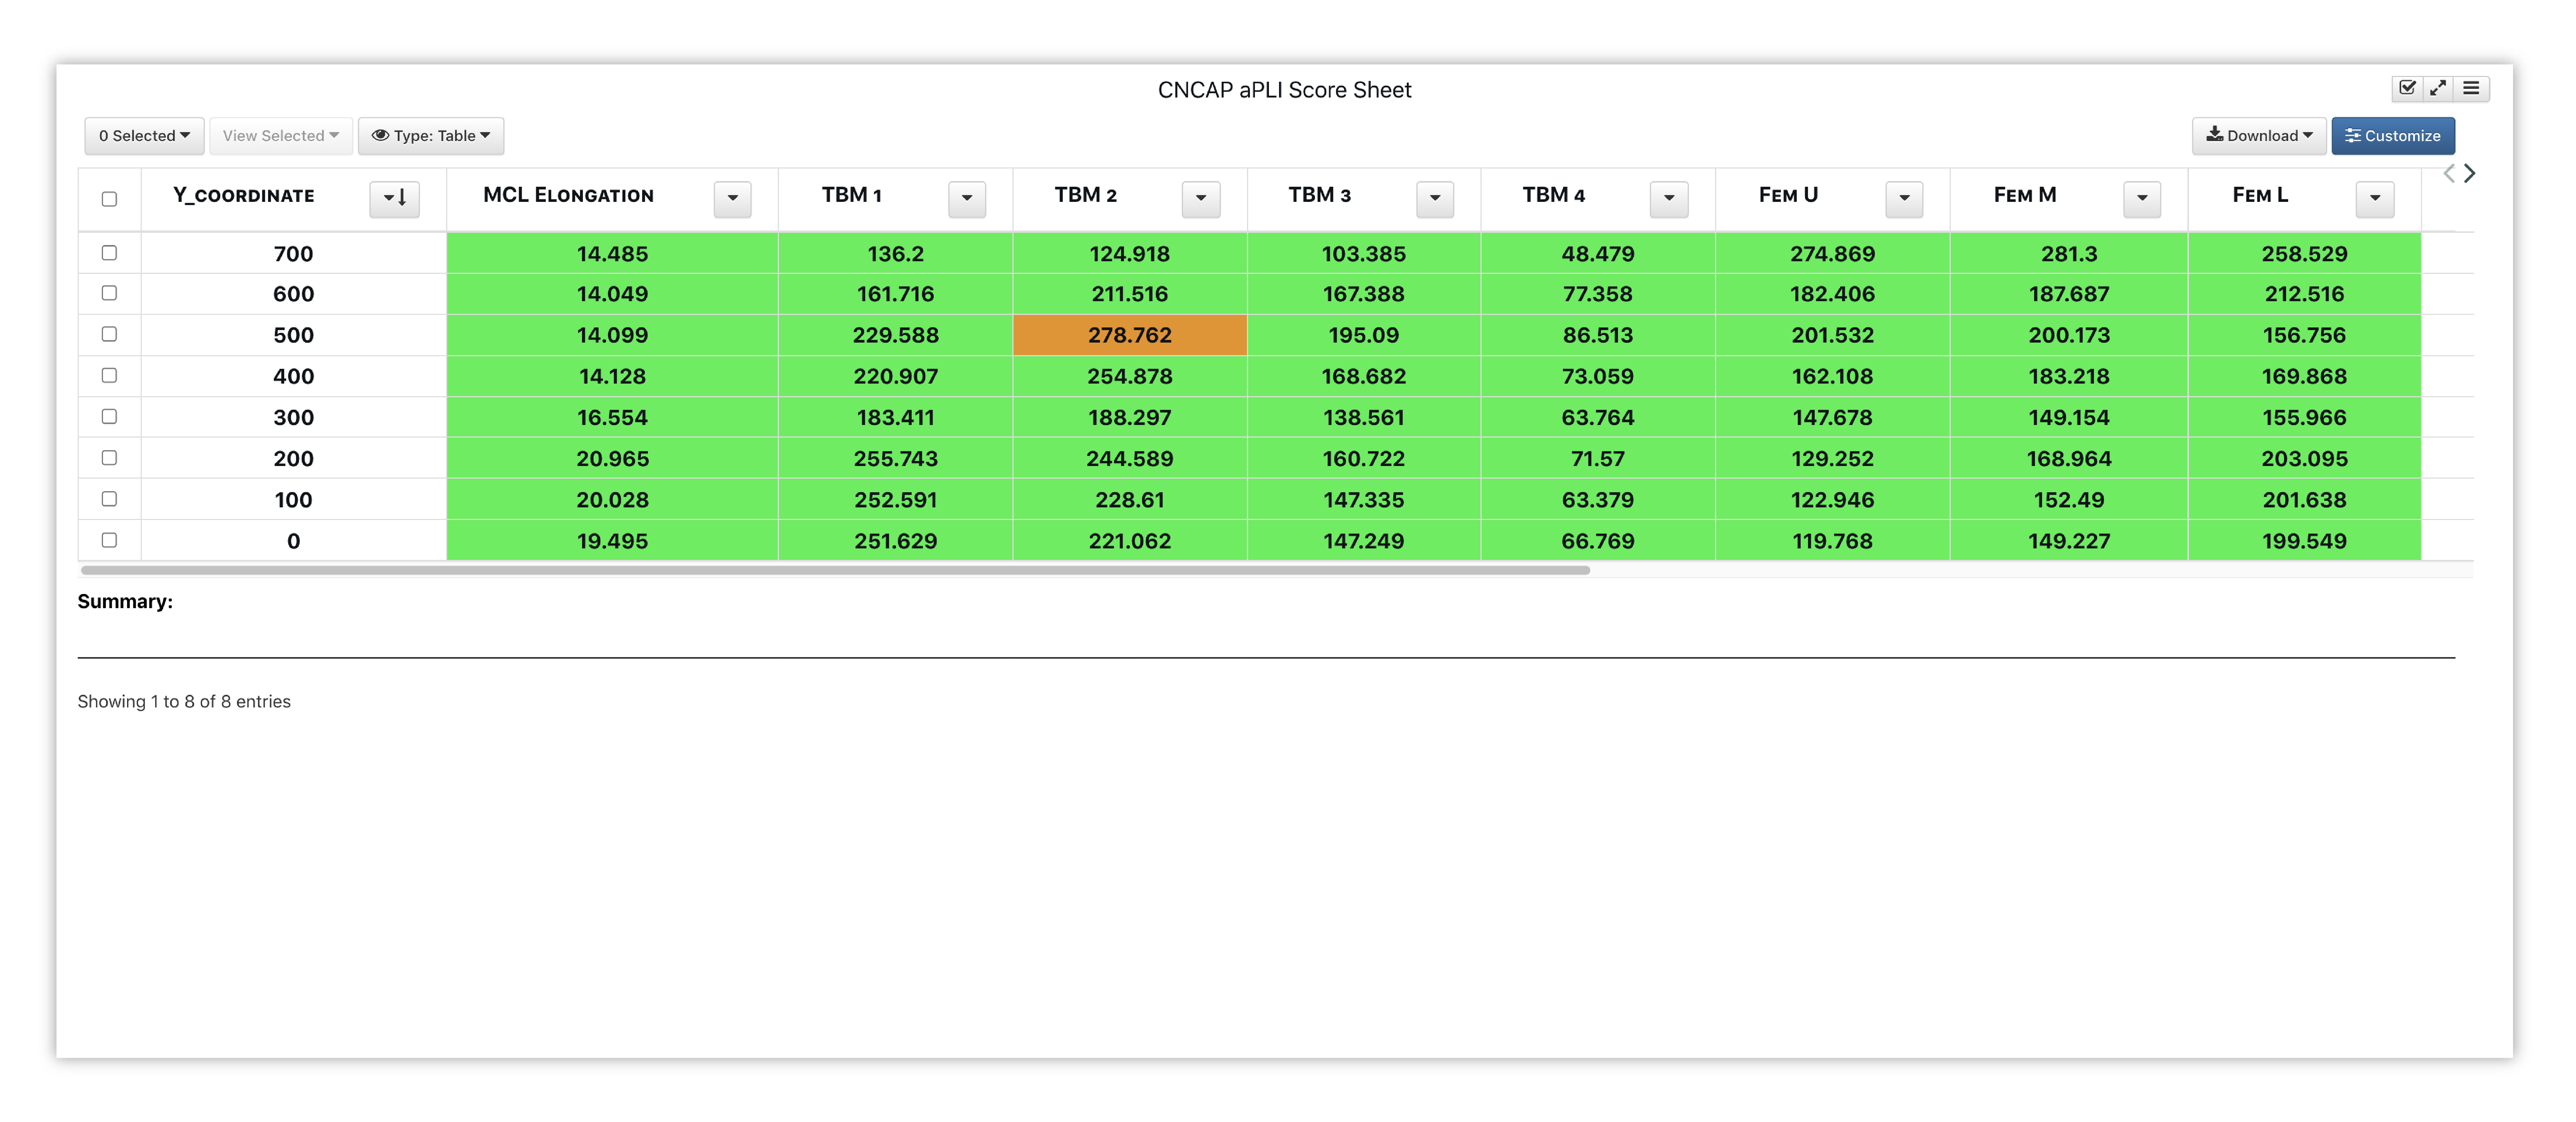
Figure 18: Score Card
15.5. FALPI
Similar to aPLI, Simlytiks’ Flex Pedestrian Legform Impactor Template uses two main visualizers, curve plot and table, to show simulation data.

Figure 19: FPLI Calculation
Curve
Curve Plot is used to visualize the force impact on tibia, MCL, PCL and ACL. Setting up these visualizations is not needed, as the template creates them for us. But, sometimes we may want to explore more. Check out the following example for setting up these curves.
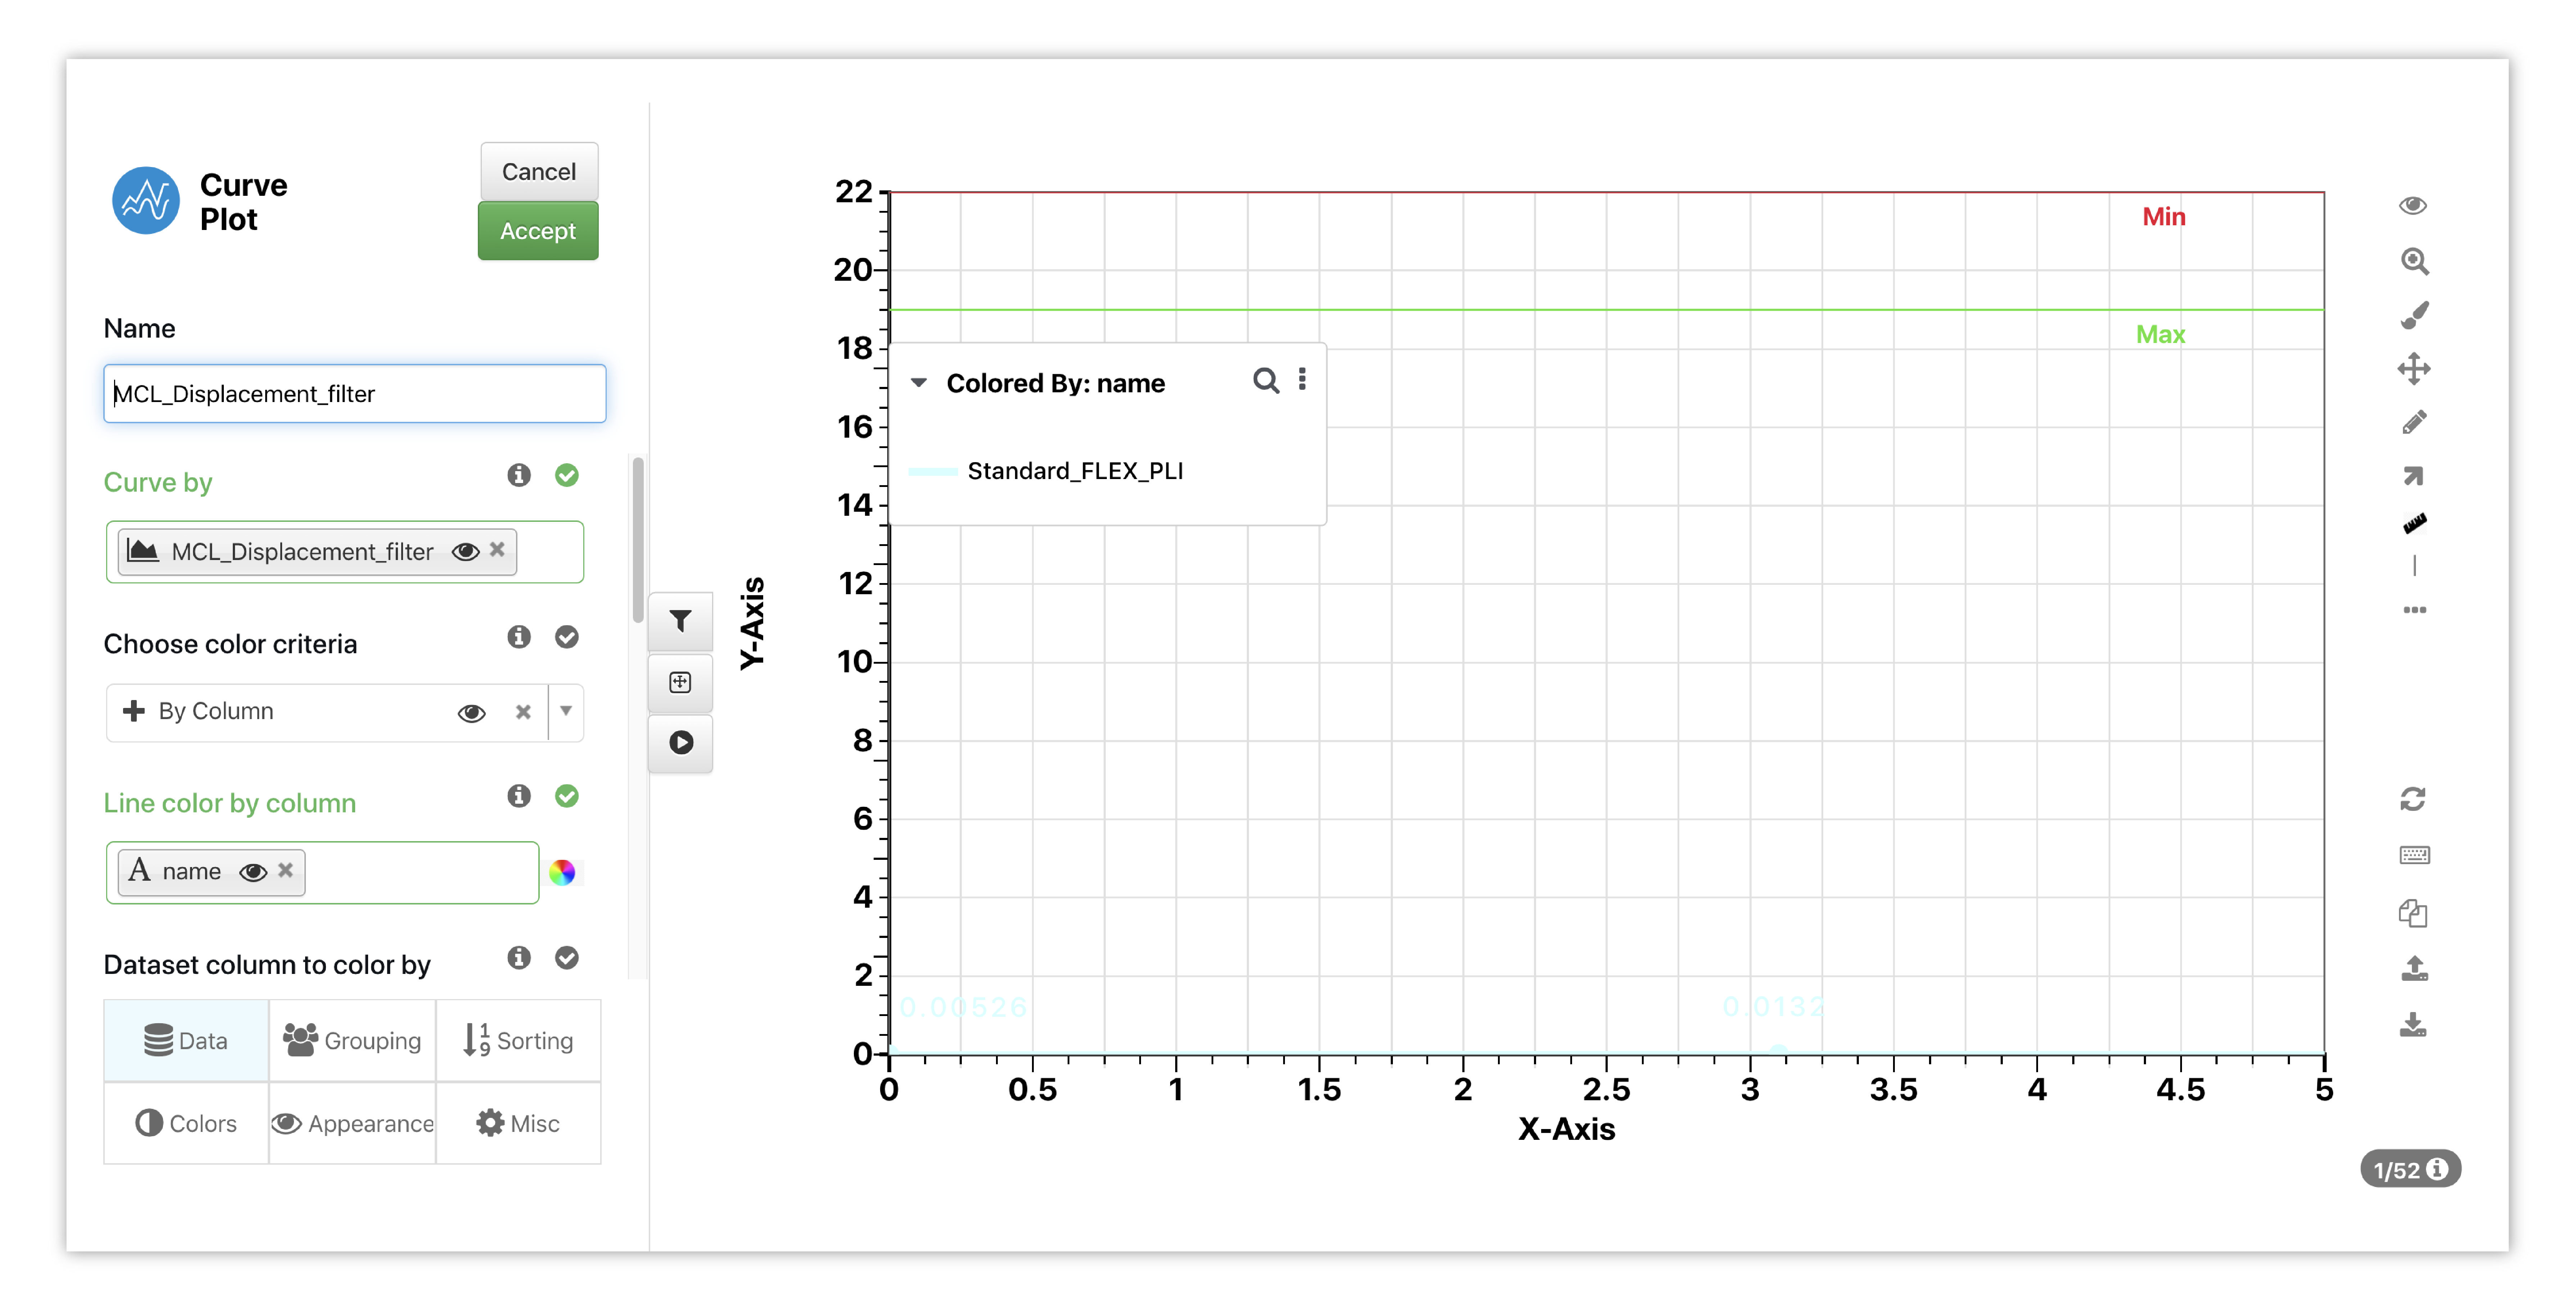
Figure 20: MCL Curve Options
Here is how these curves are presented in Simlytiks via the template.
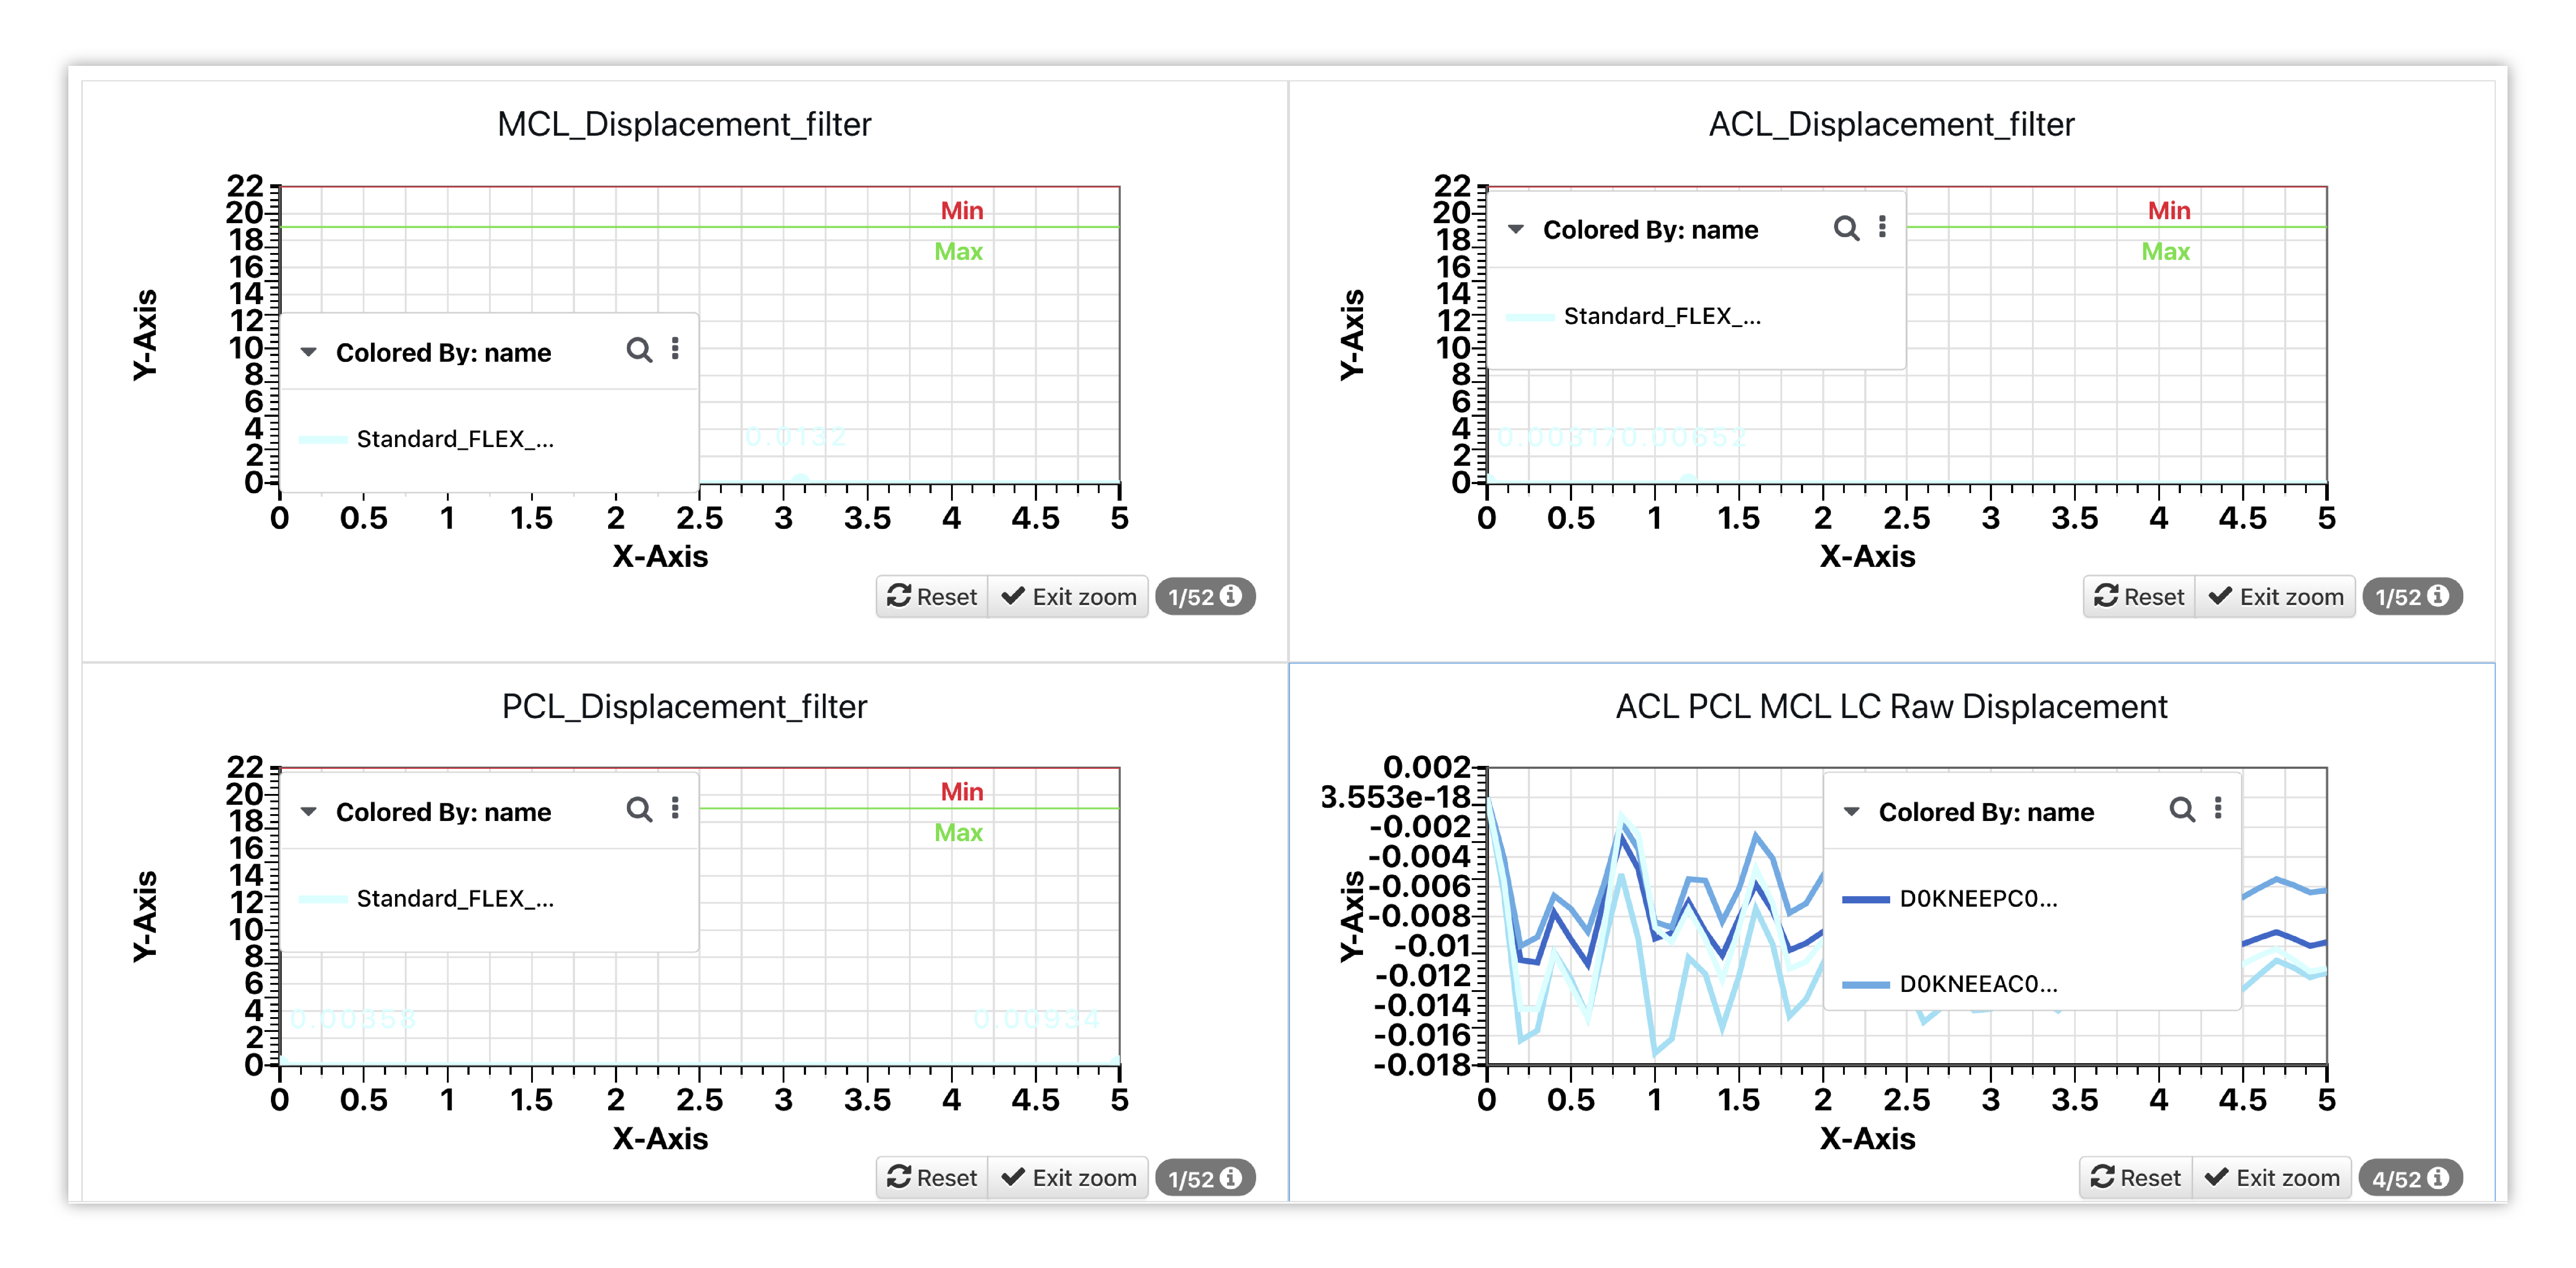
Figure 21: MCL, ACL & PCL Curves
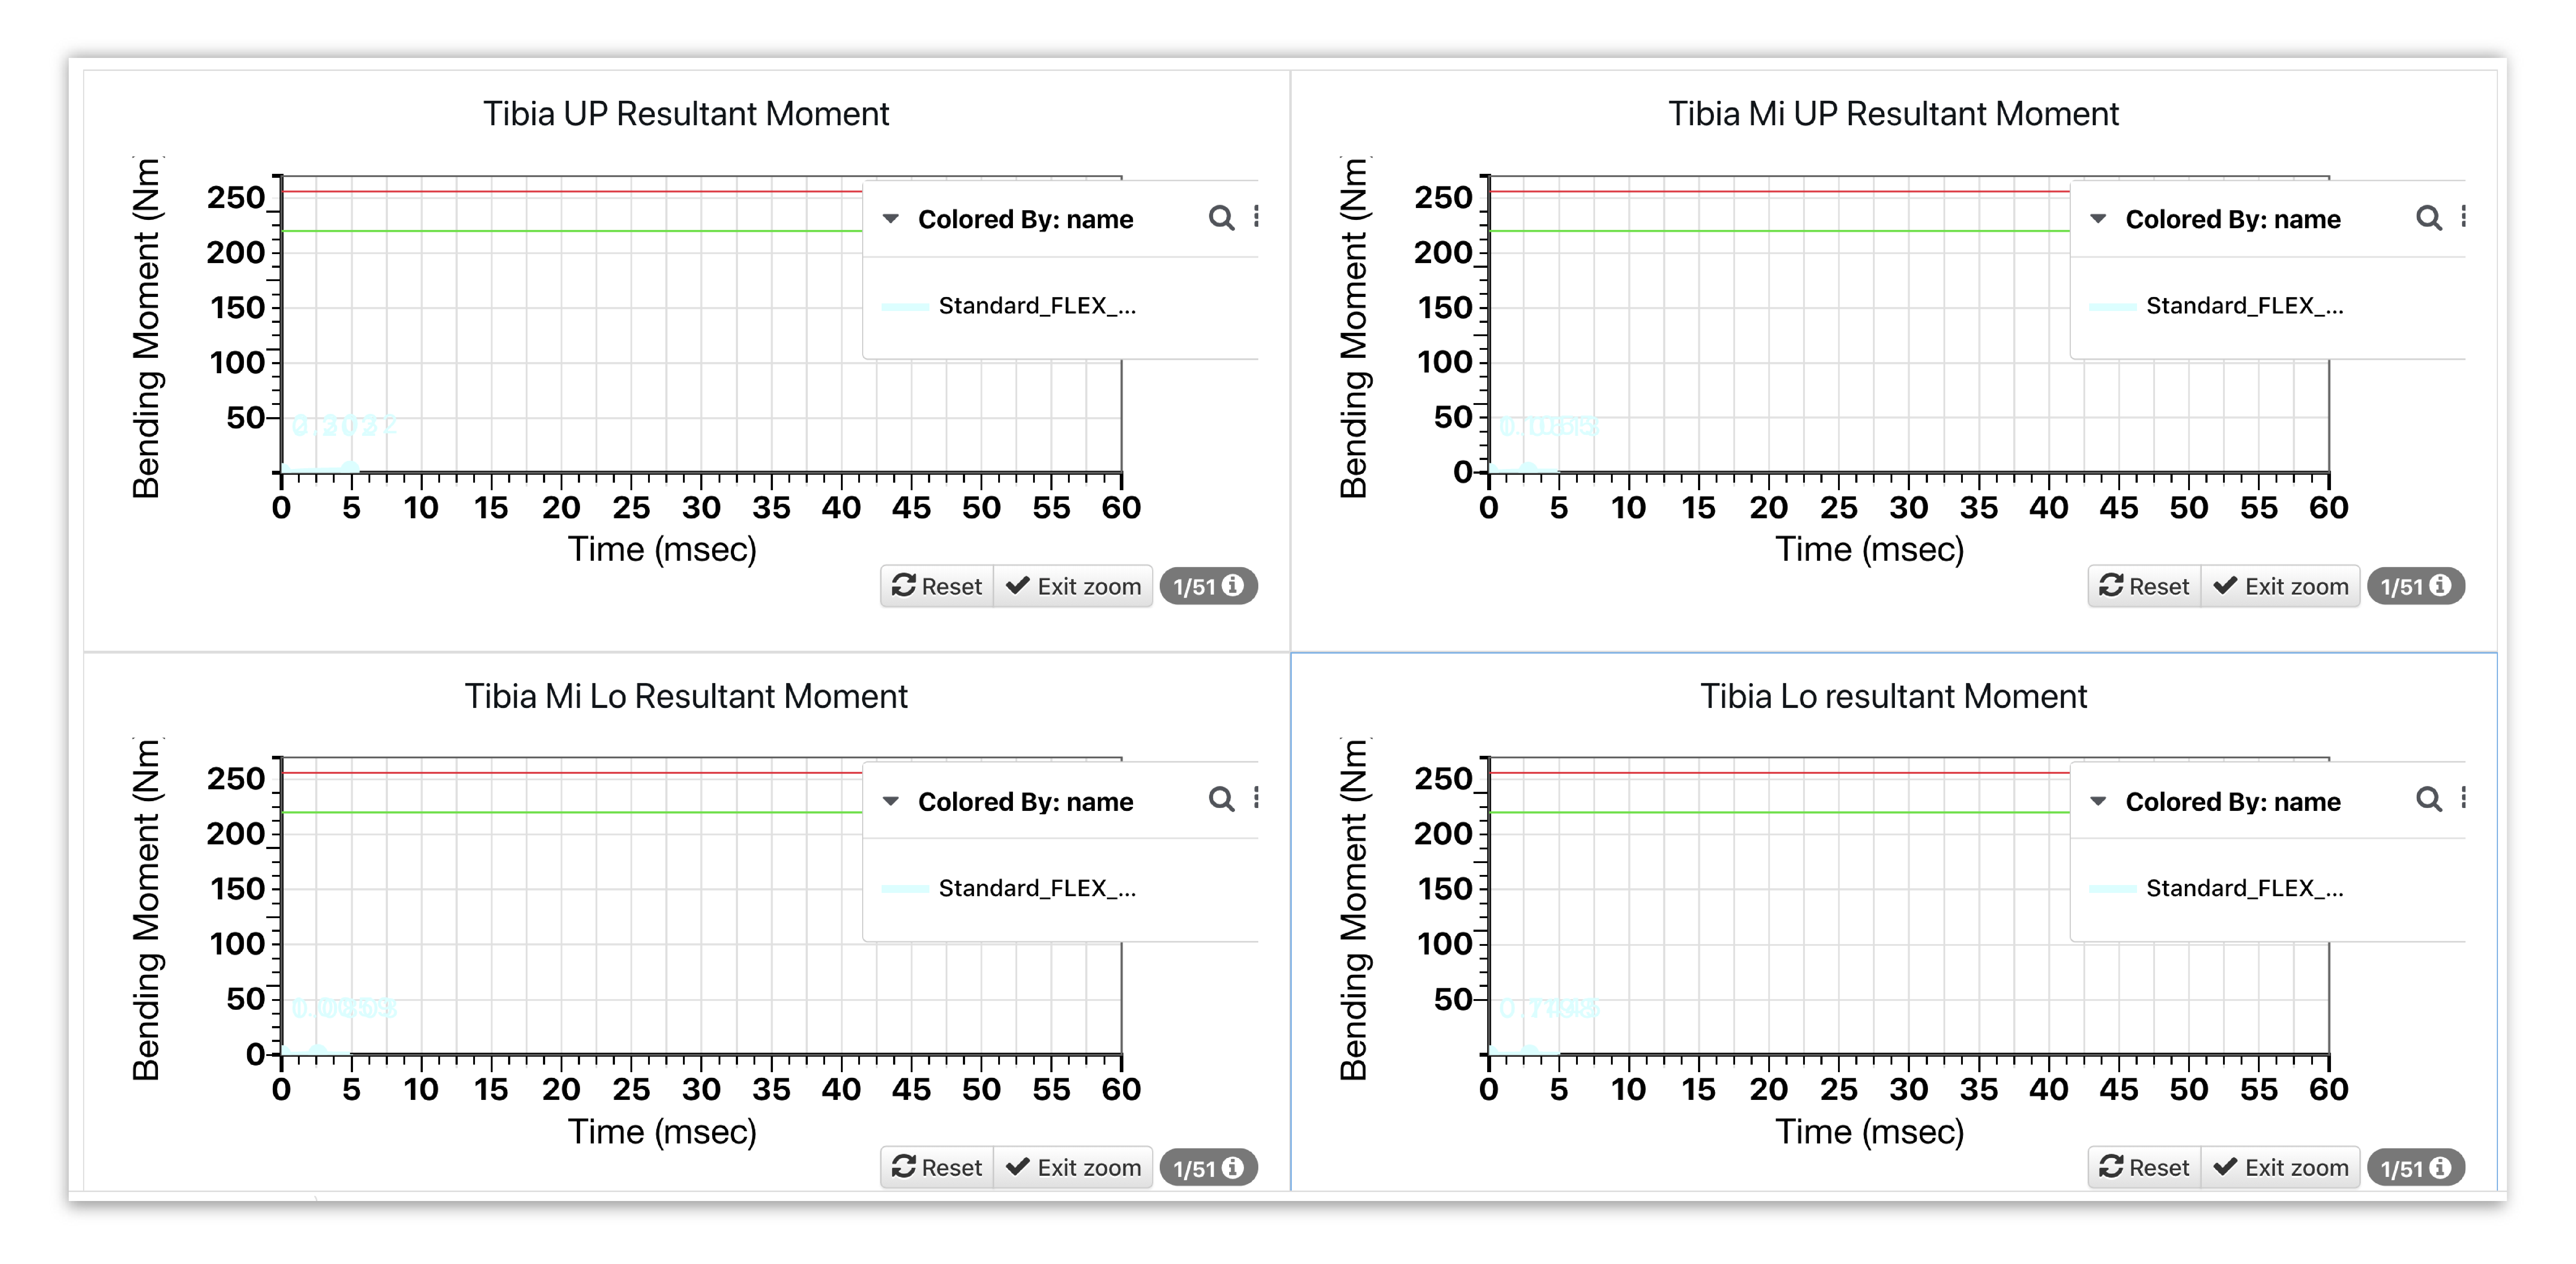
Figure 22: Tibia Curves
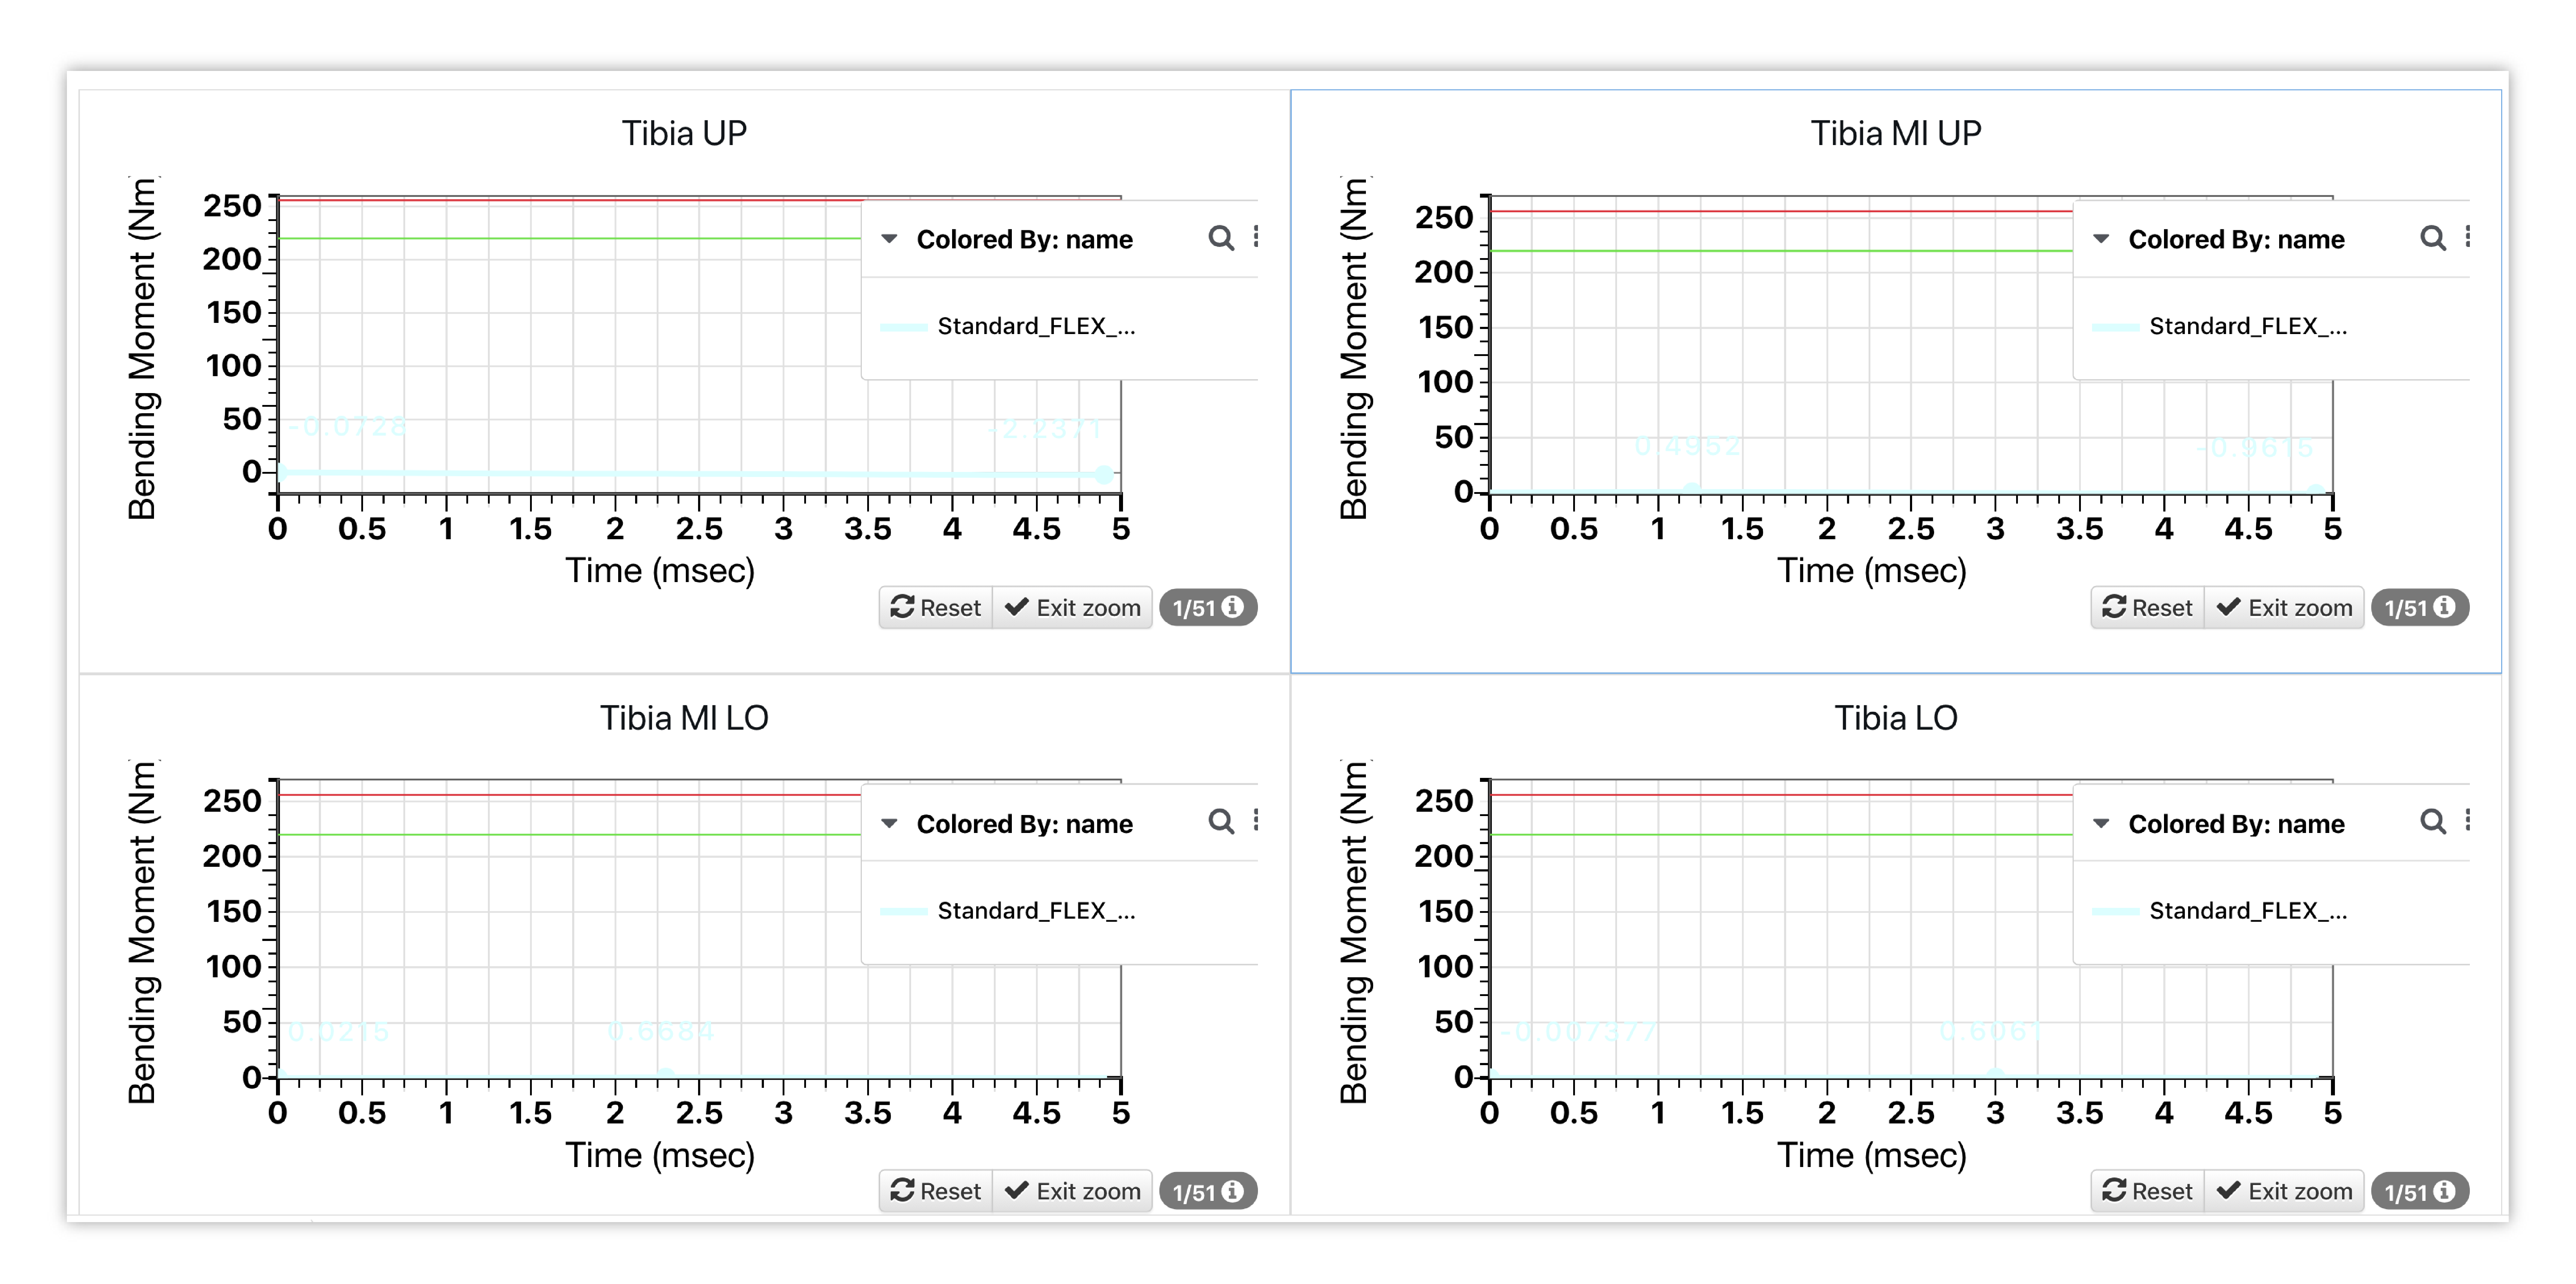
Figure 23: Tibia Curves
Table
Table visualizer is used to create the FPLI score cards, which will also be created for us via the template. These following examples show the set up for these tables along with how they are shown within the FPLI template. The table is flipped for the options examples so we can see all the columns included in the score card; though, the template will present the tables the standard way as shown beneath the option examples.
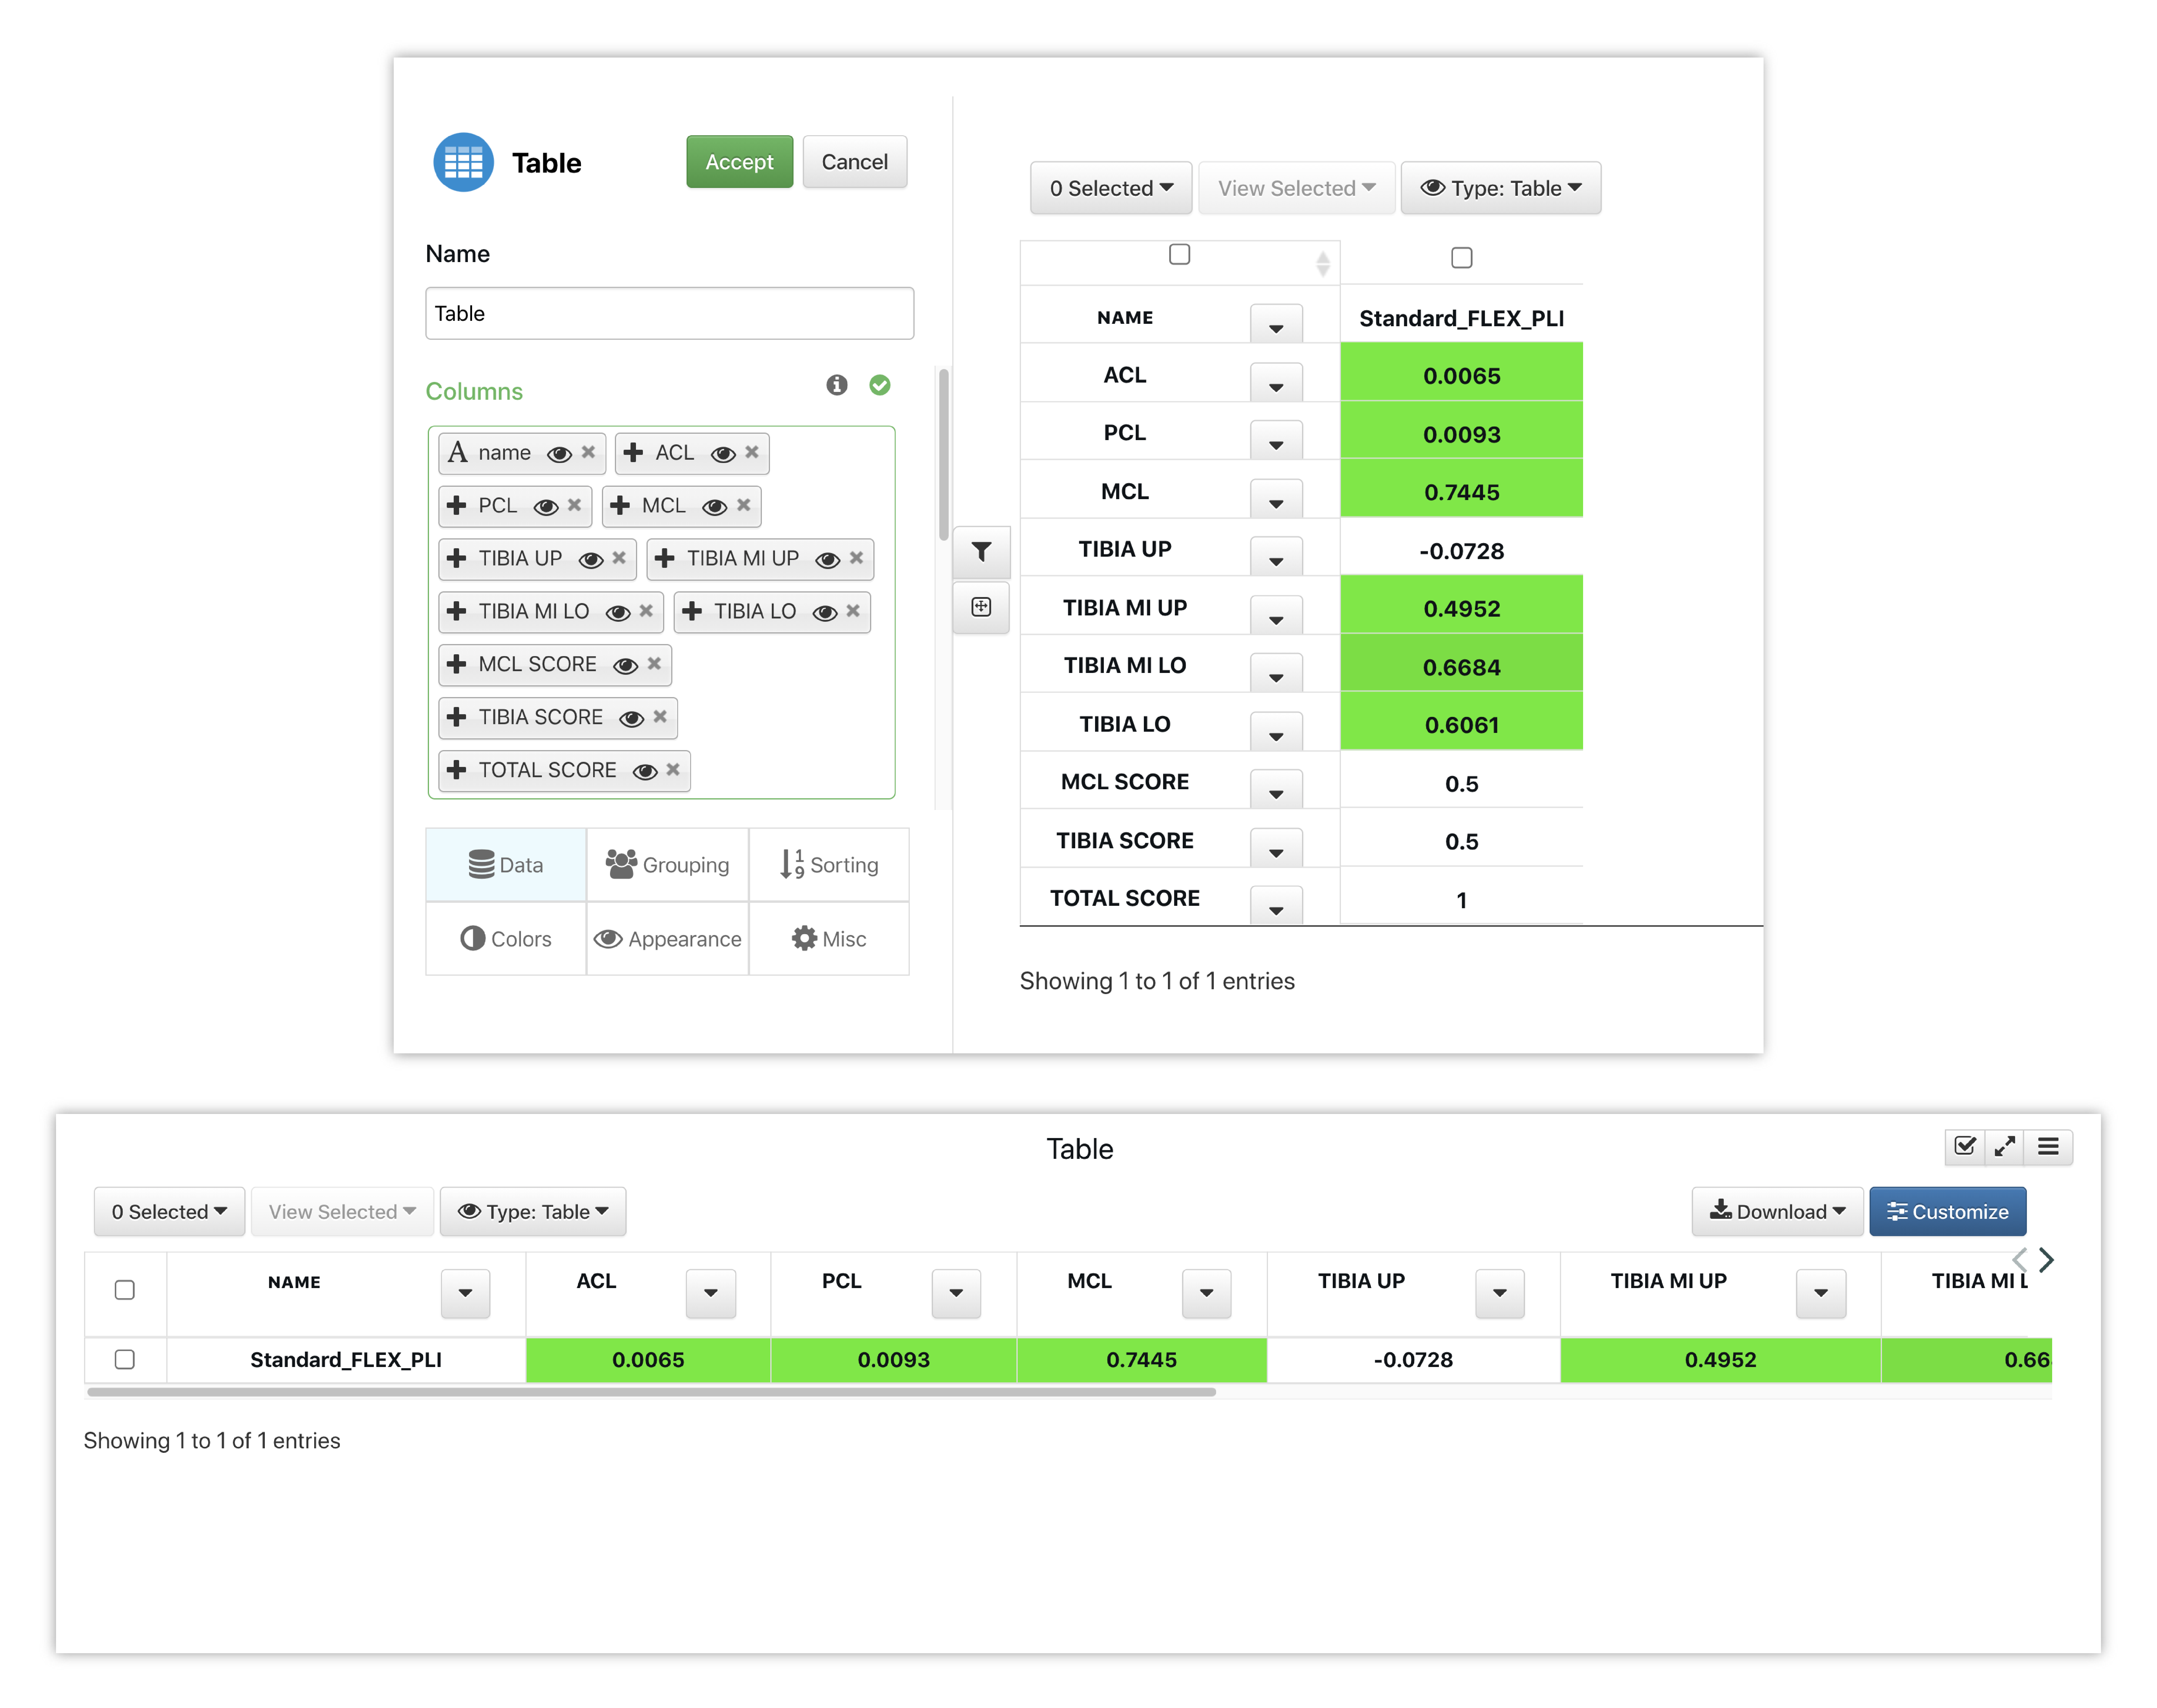
Figure 24: Score Card Options
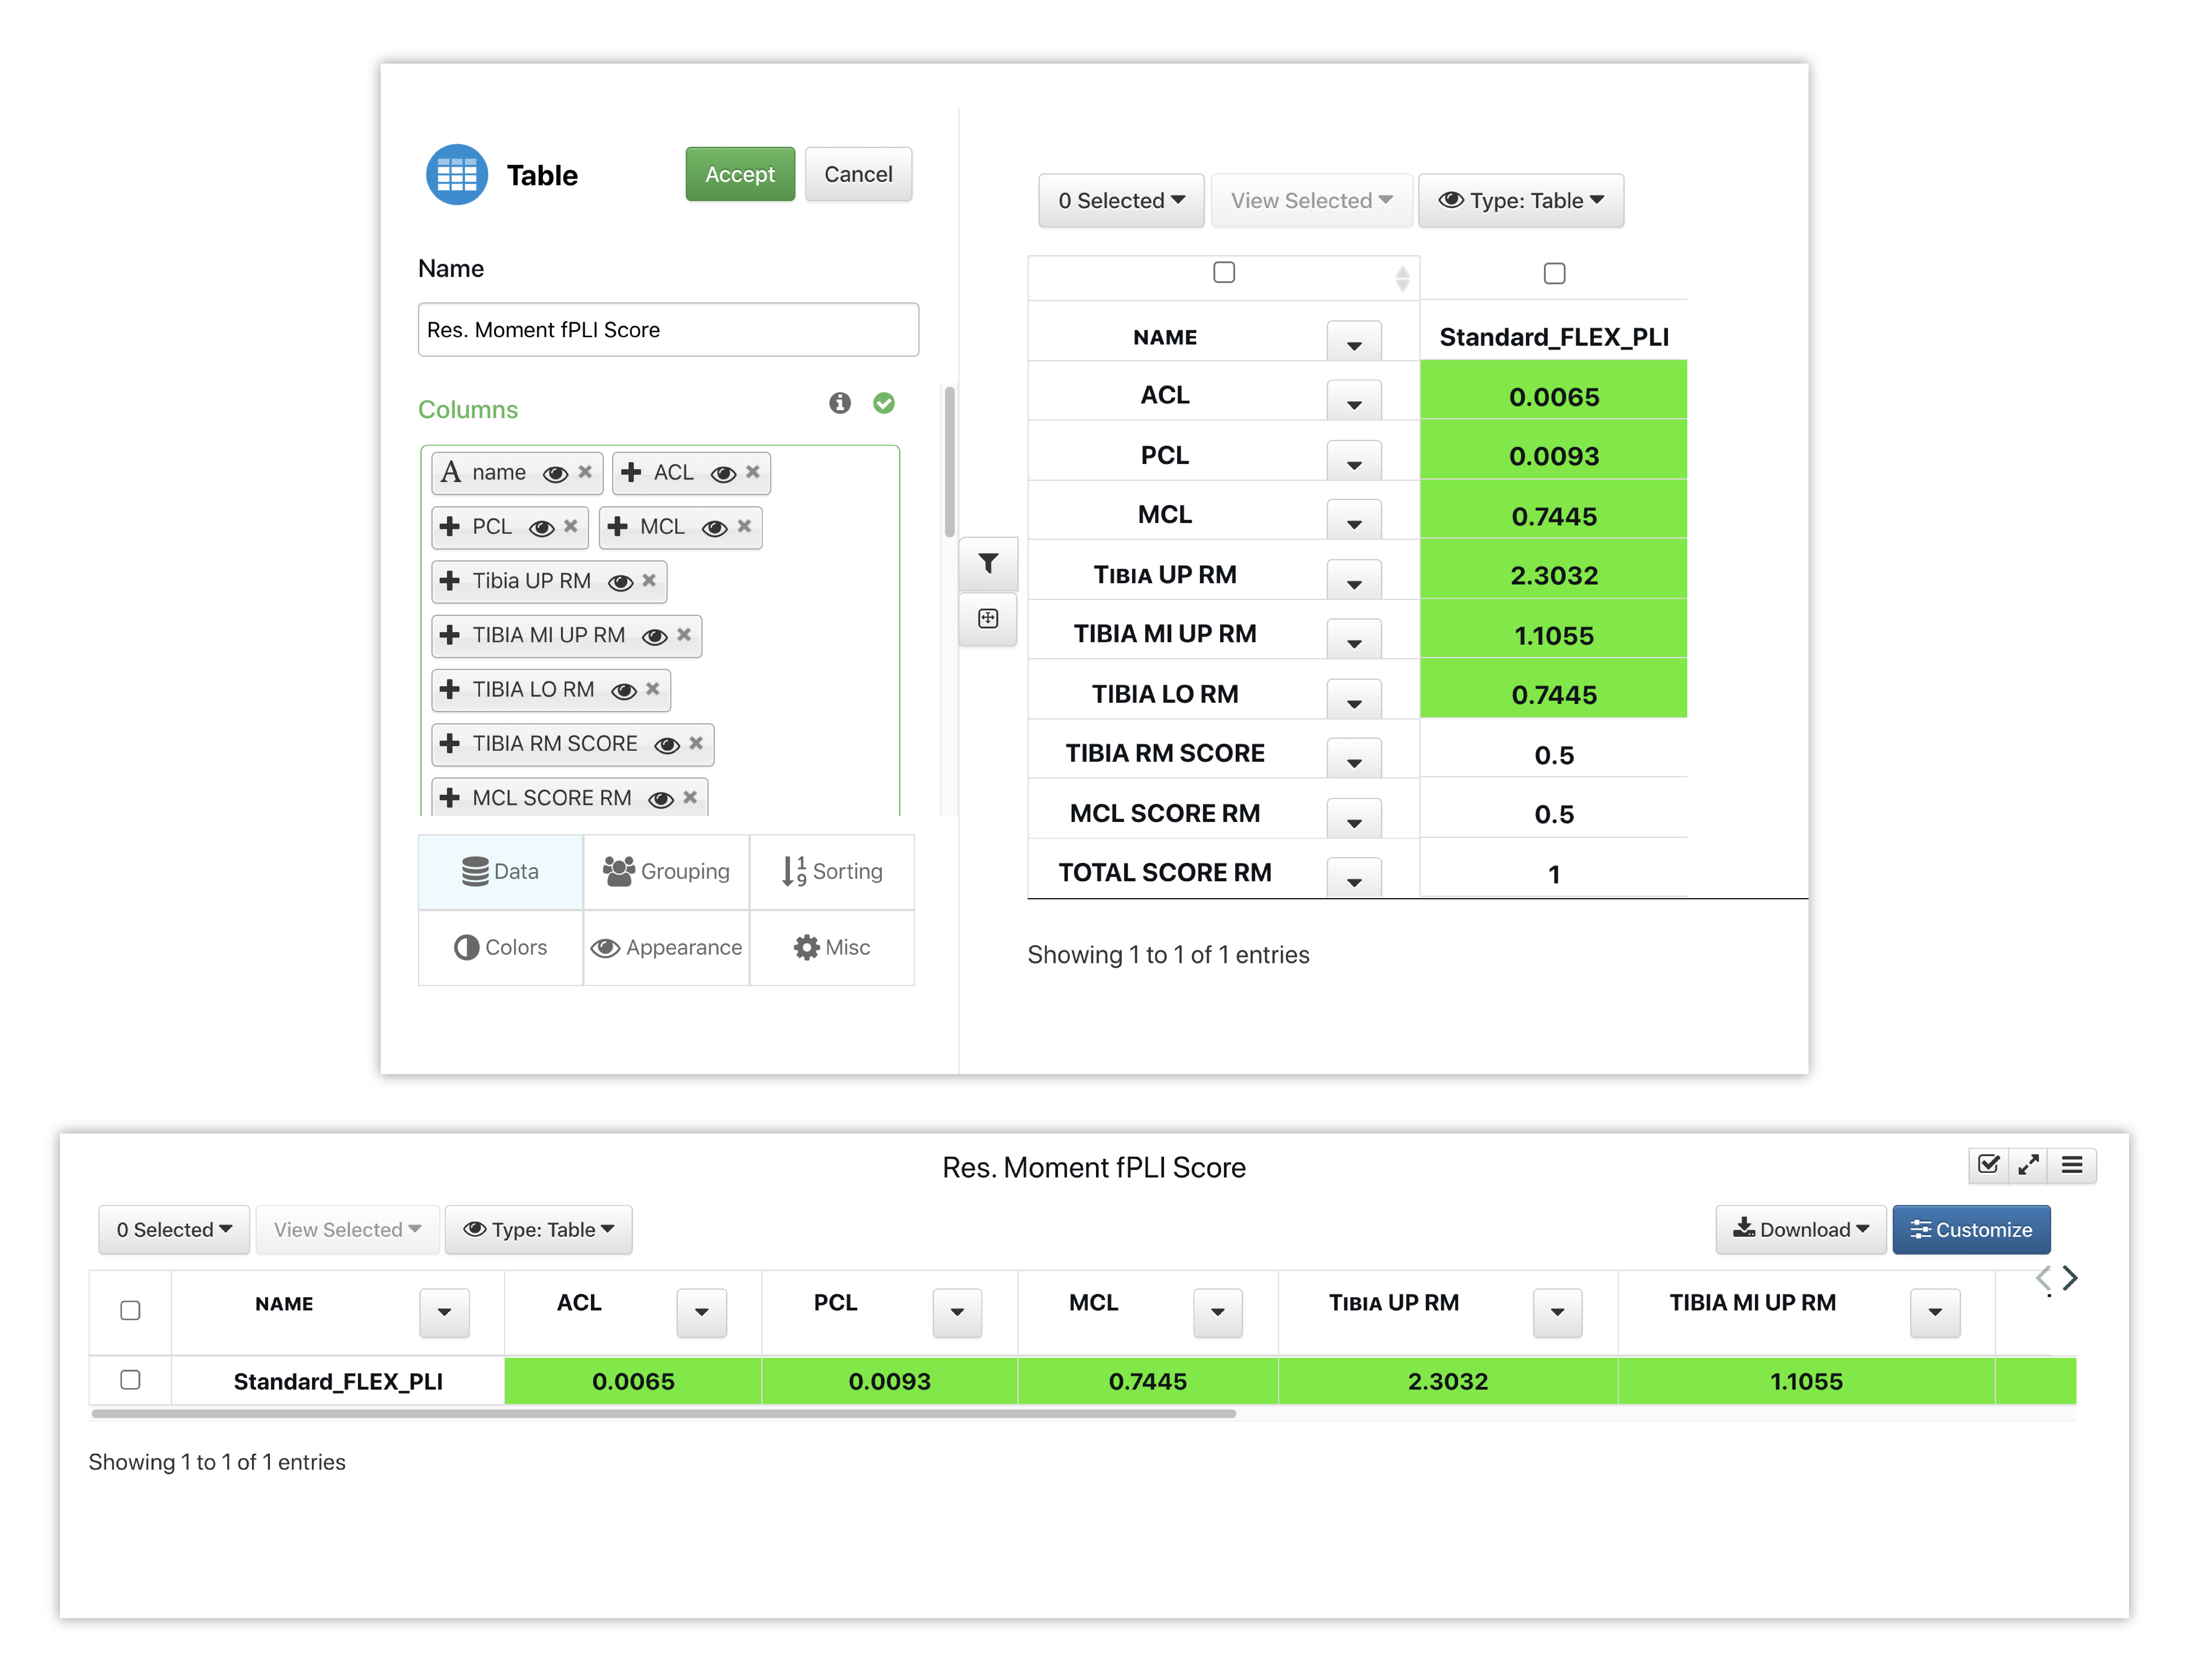
Figure 25: Score Card Options