13.  Data Drilling
Data drilling in Simlytiks refers to navigating between multiple dimensions of data on one chart. A chart with data-drilling options presents multiple columns of data in hierarchal layers allowing us to explore data on different levels within the same container.
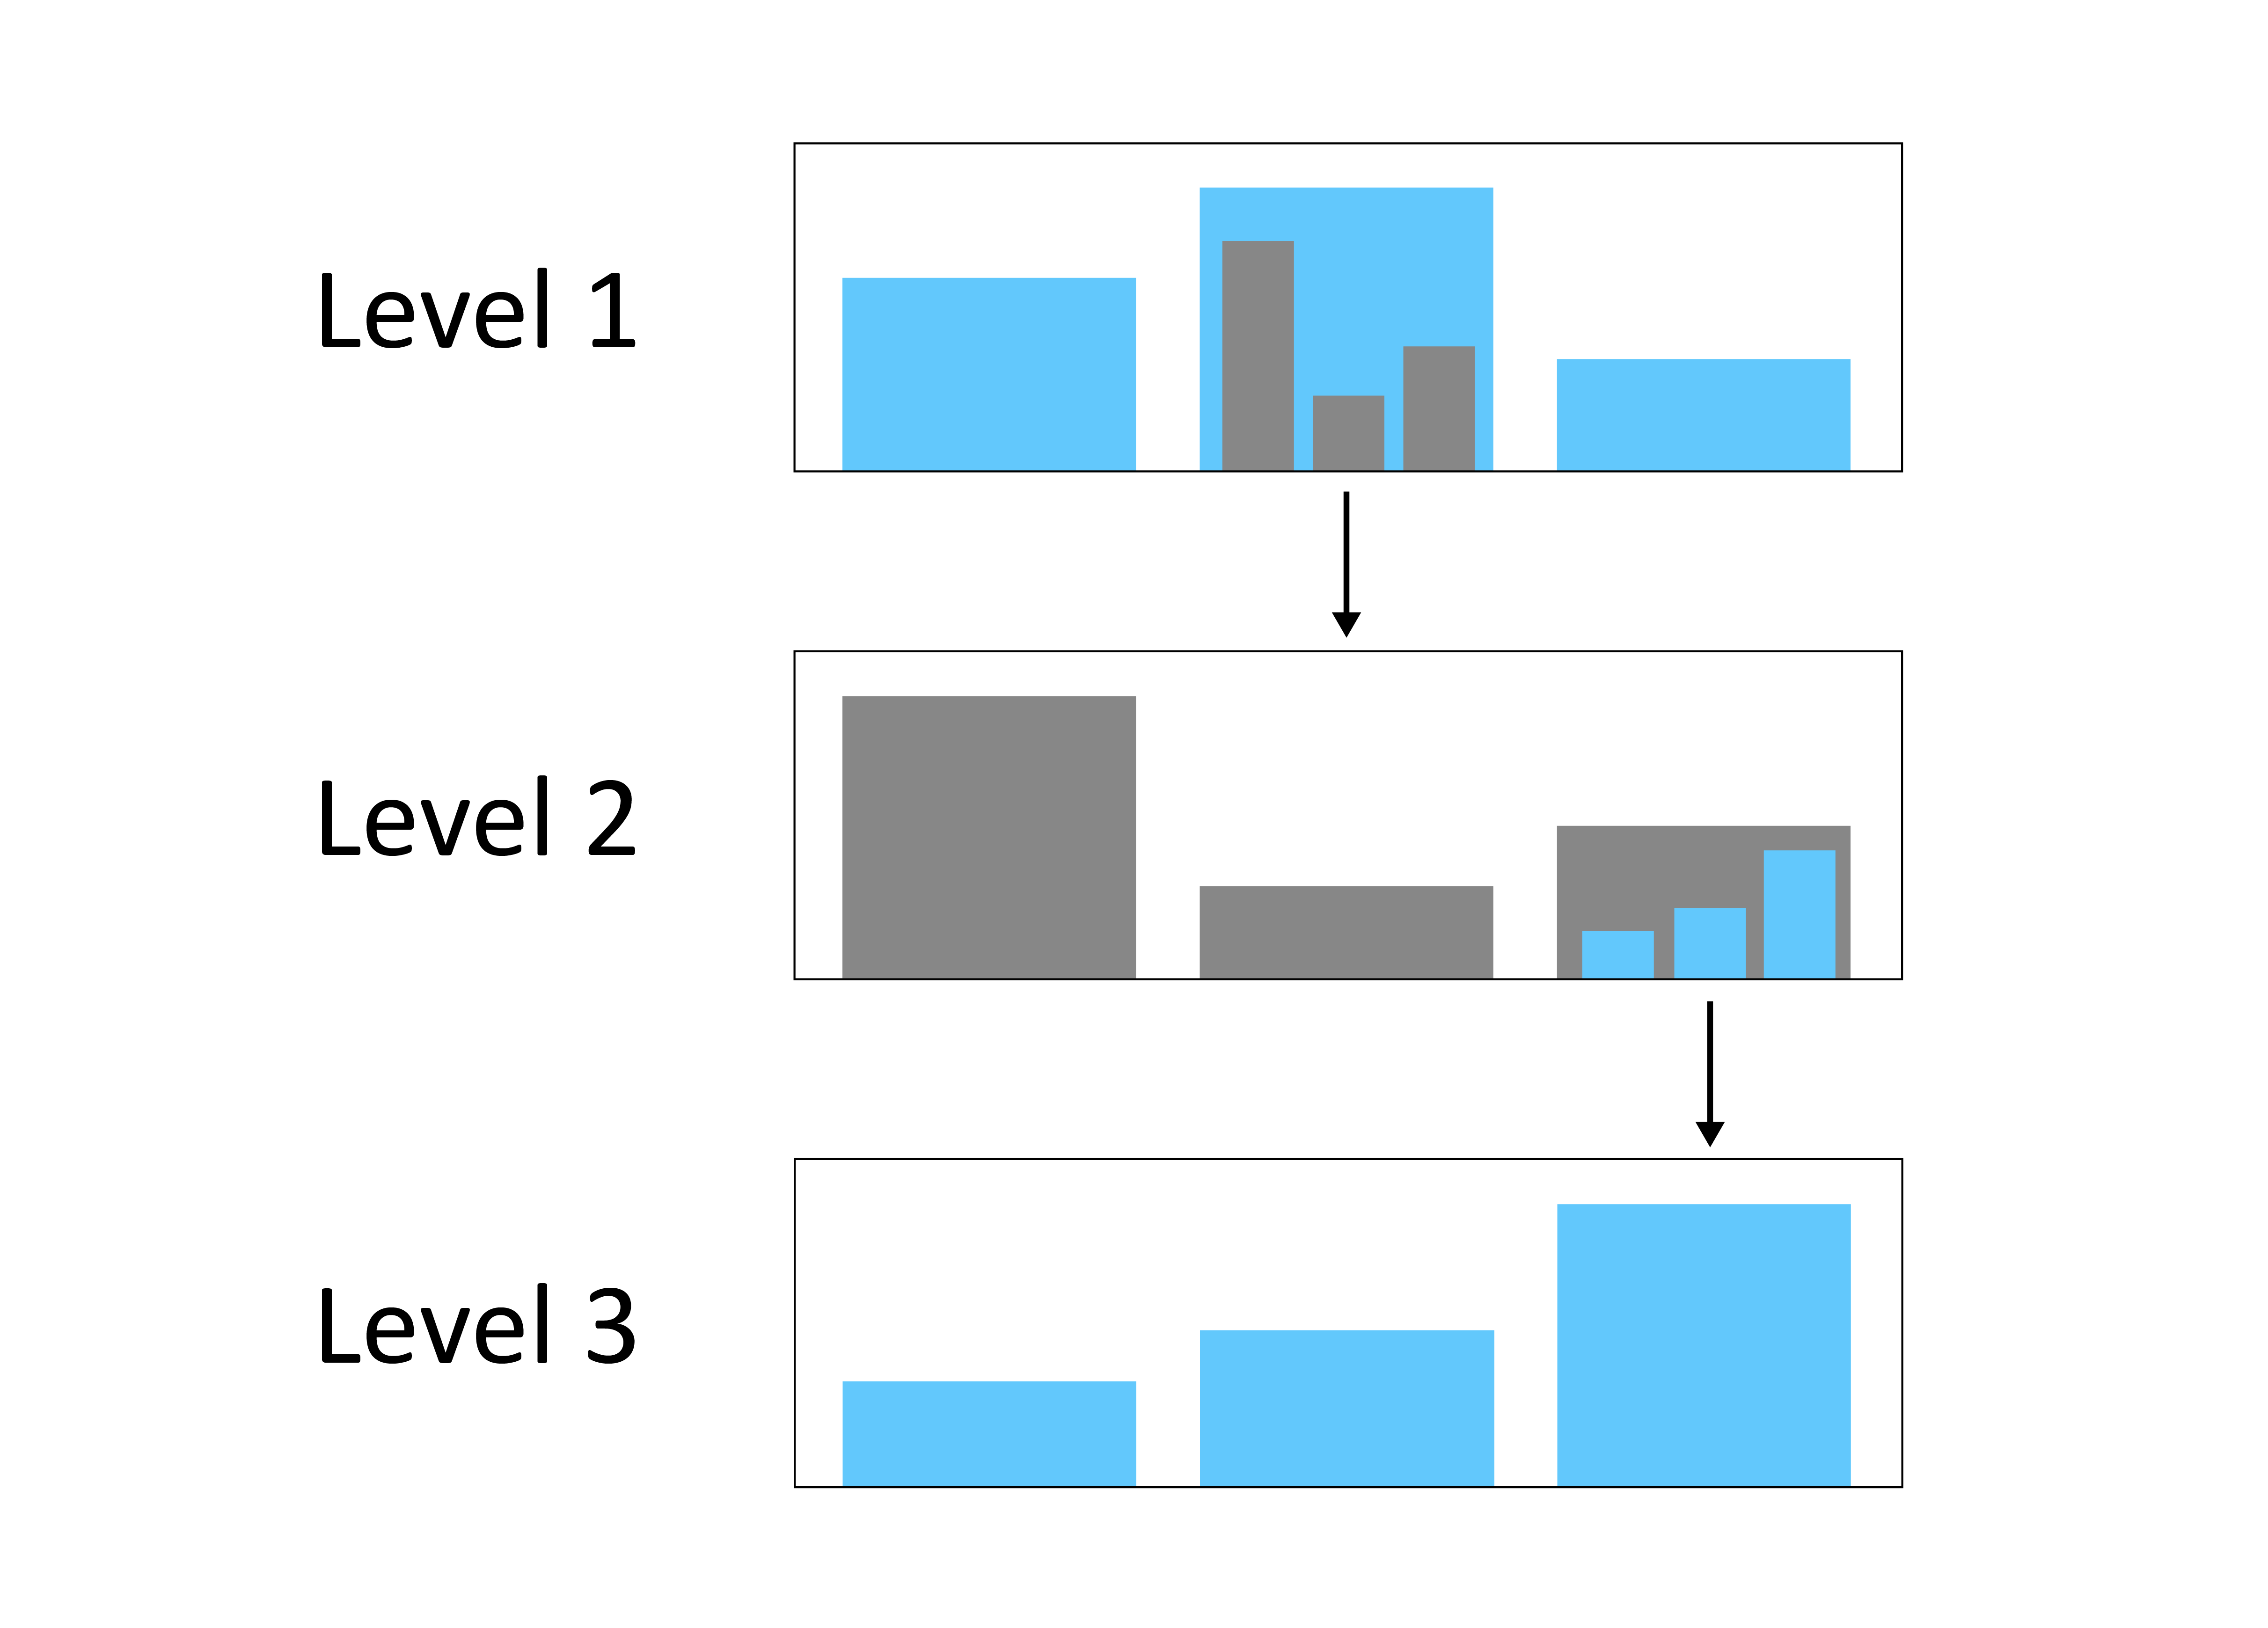
Figure 1: Data-drilling
Initial layers show a summary of the ones after it, generally getting more detailed as we navigate down levels and view more specific data. Though, the layers don’t necessary have to connect in hierarchal format. We can choose any columns of data in any order for our charts and use drilling as a way to view the correlation between columns or important aspects separately under one chart.
Fruits Pivot Table Drill Downs
Simlytiks has 4 main chart types that can drill data up or down: Pivot Table, Vertical Bar Chart, Pie Chart and Tree Map. For all these charts, we’l make sure the data is added in the order of viewing, with the top level chosen first and each subsequent level chosen there after.
13.1. Pivot Table
Pivot Table uses data-drilling based on its rows. Choose more than one data column for this option when setting up the chart.
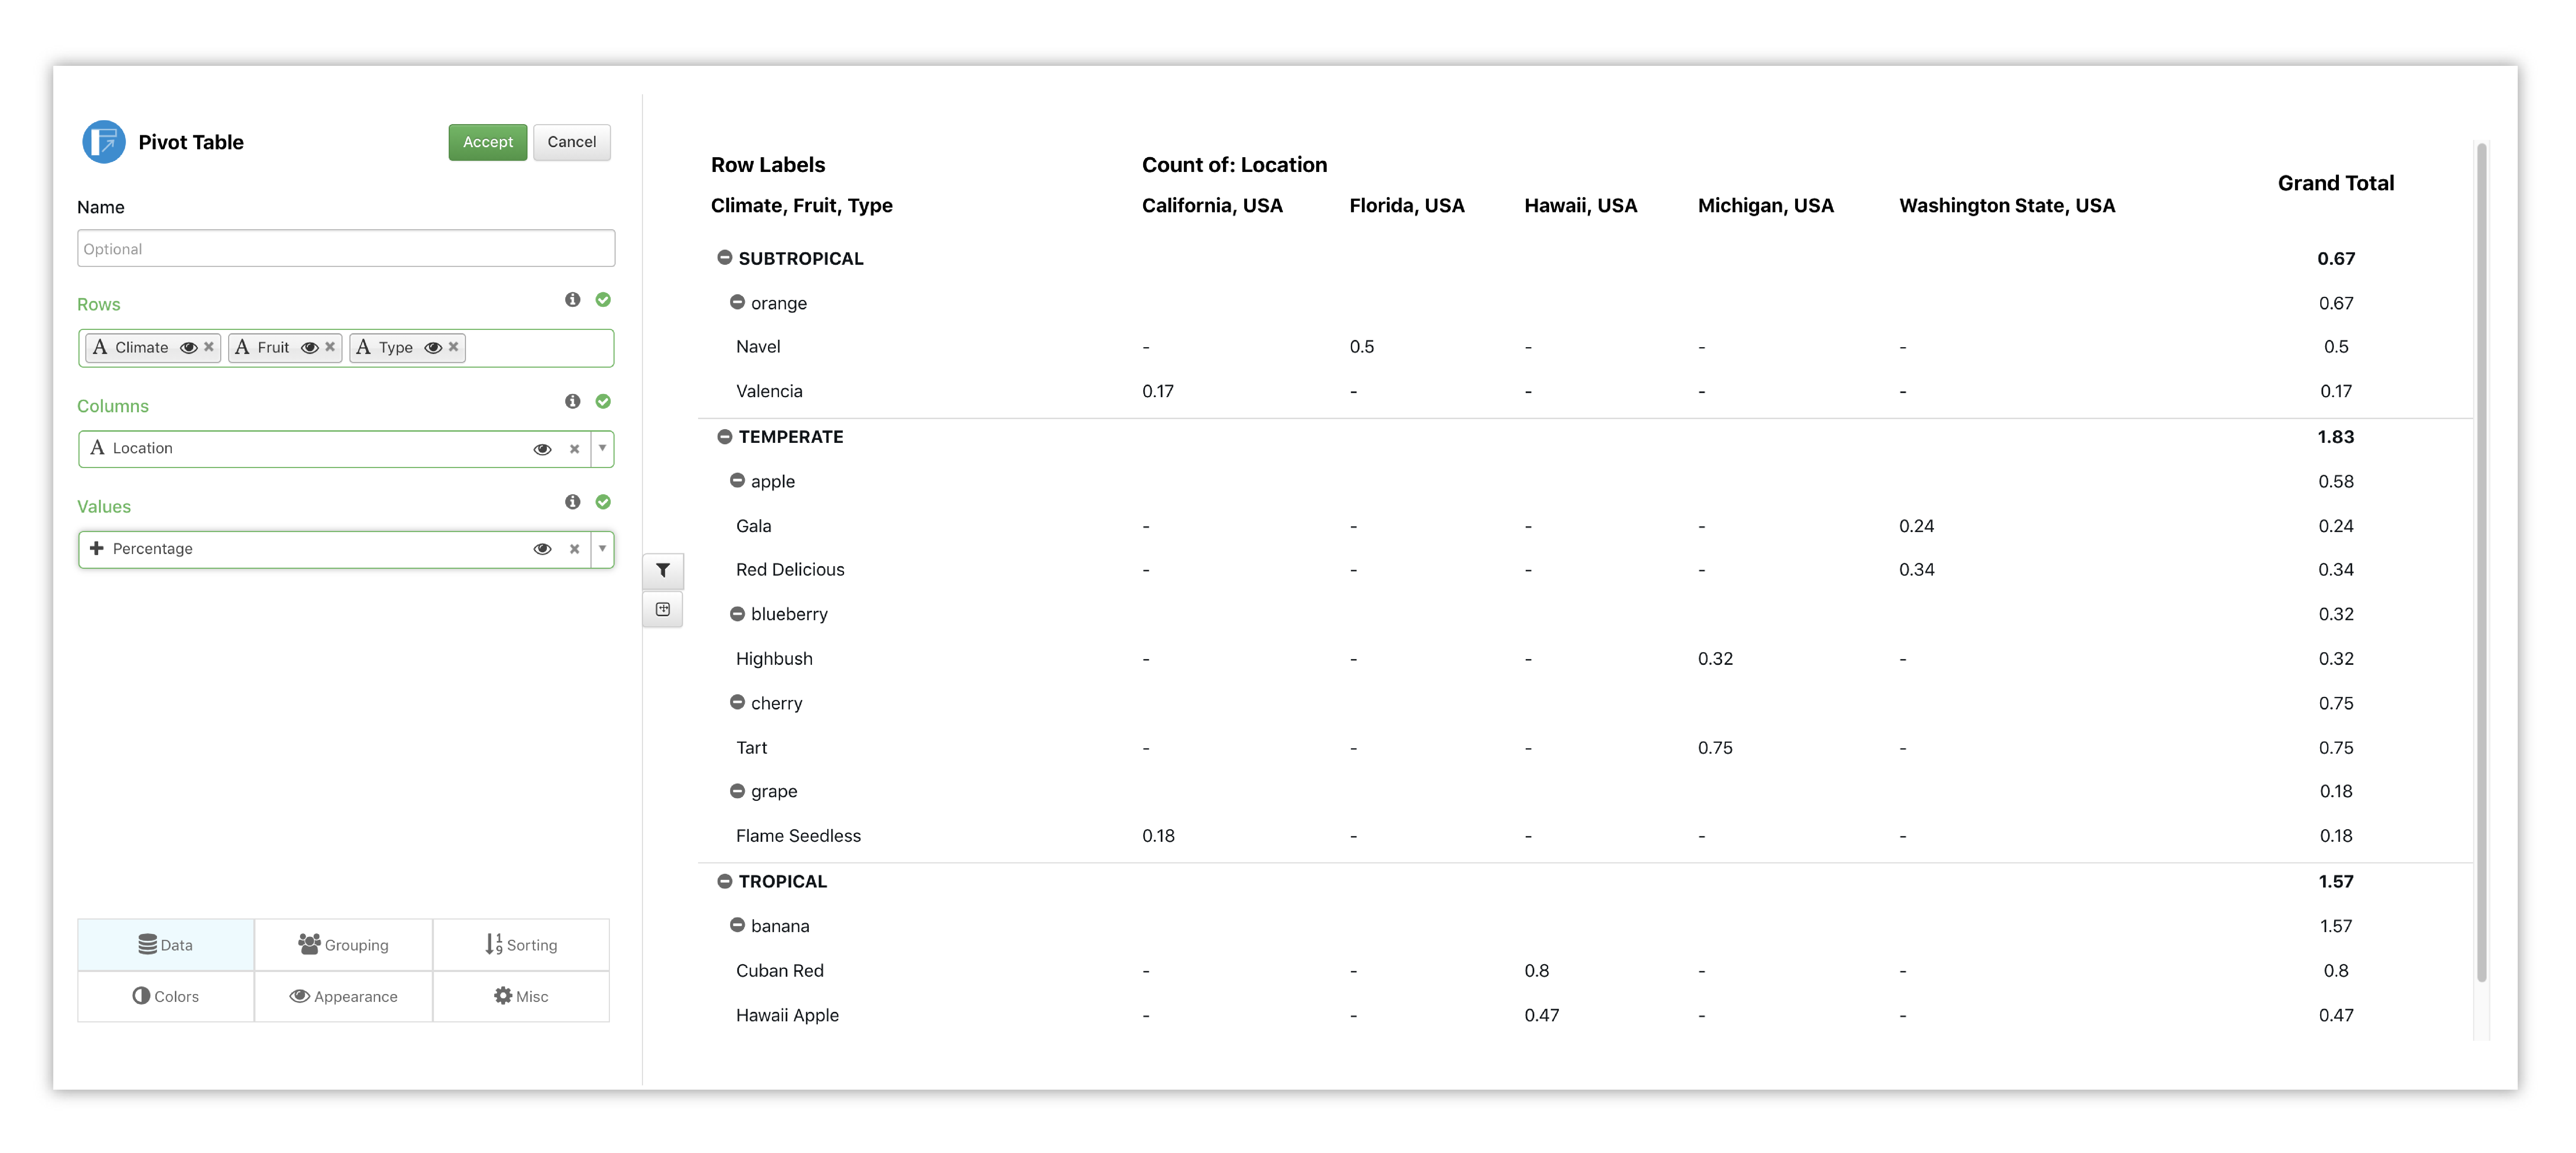
Figure 2: Data-drilling in Pivot
Multiple rows can be pivoted out to view or pivoted in to hide. Each added row becomes another level of data to be viewed with the whole or hidden away for summary analysis. Here is a video showing how to pivot through the data:
NEW as of 5/3/2022: Pivot Table now has an option to group dates.
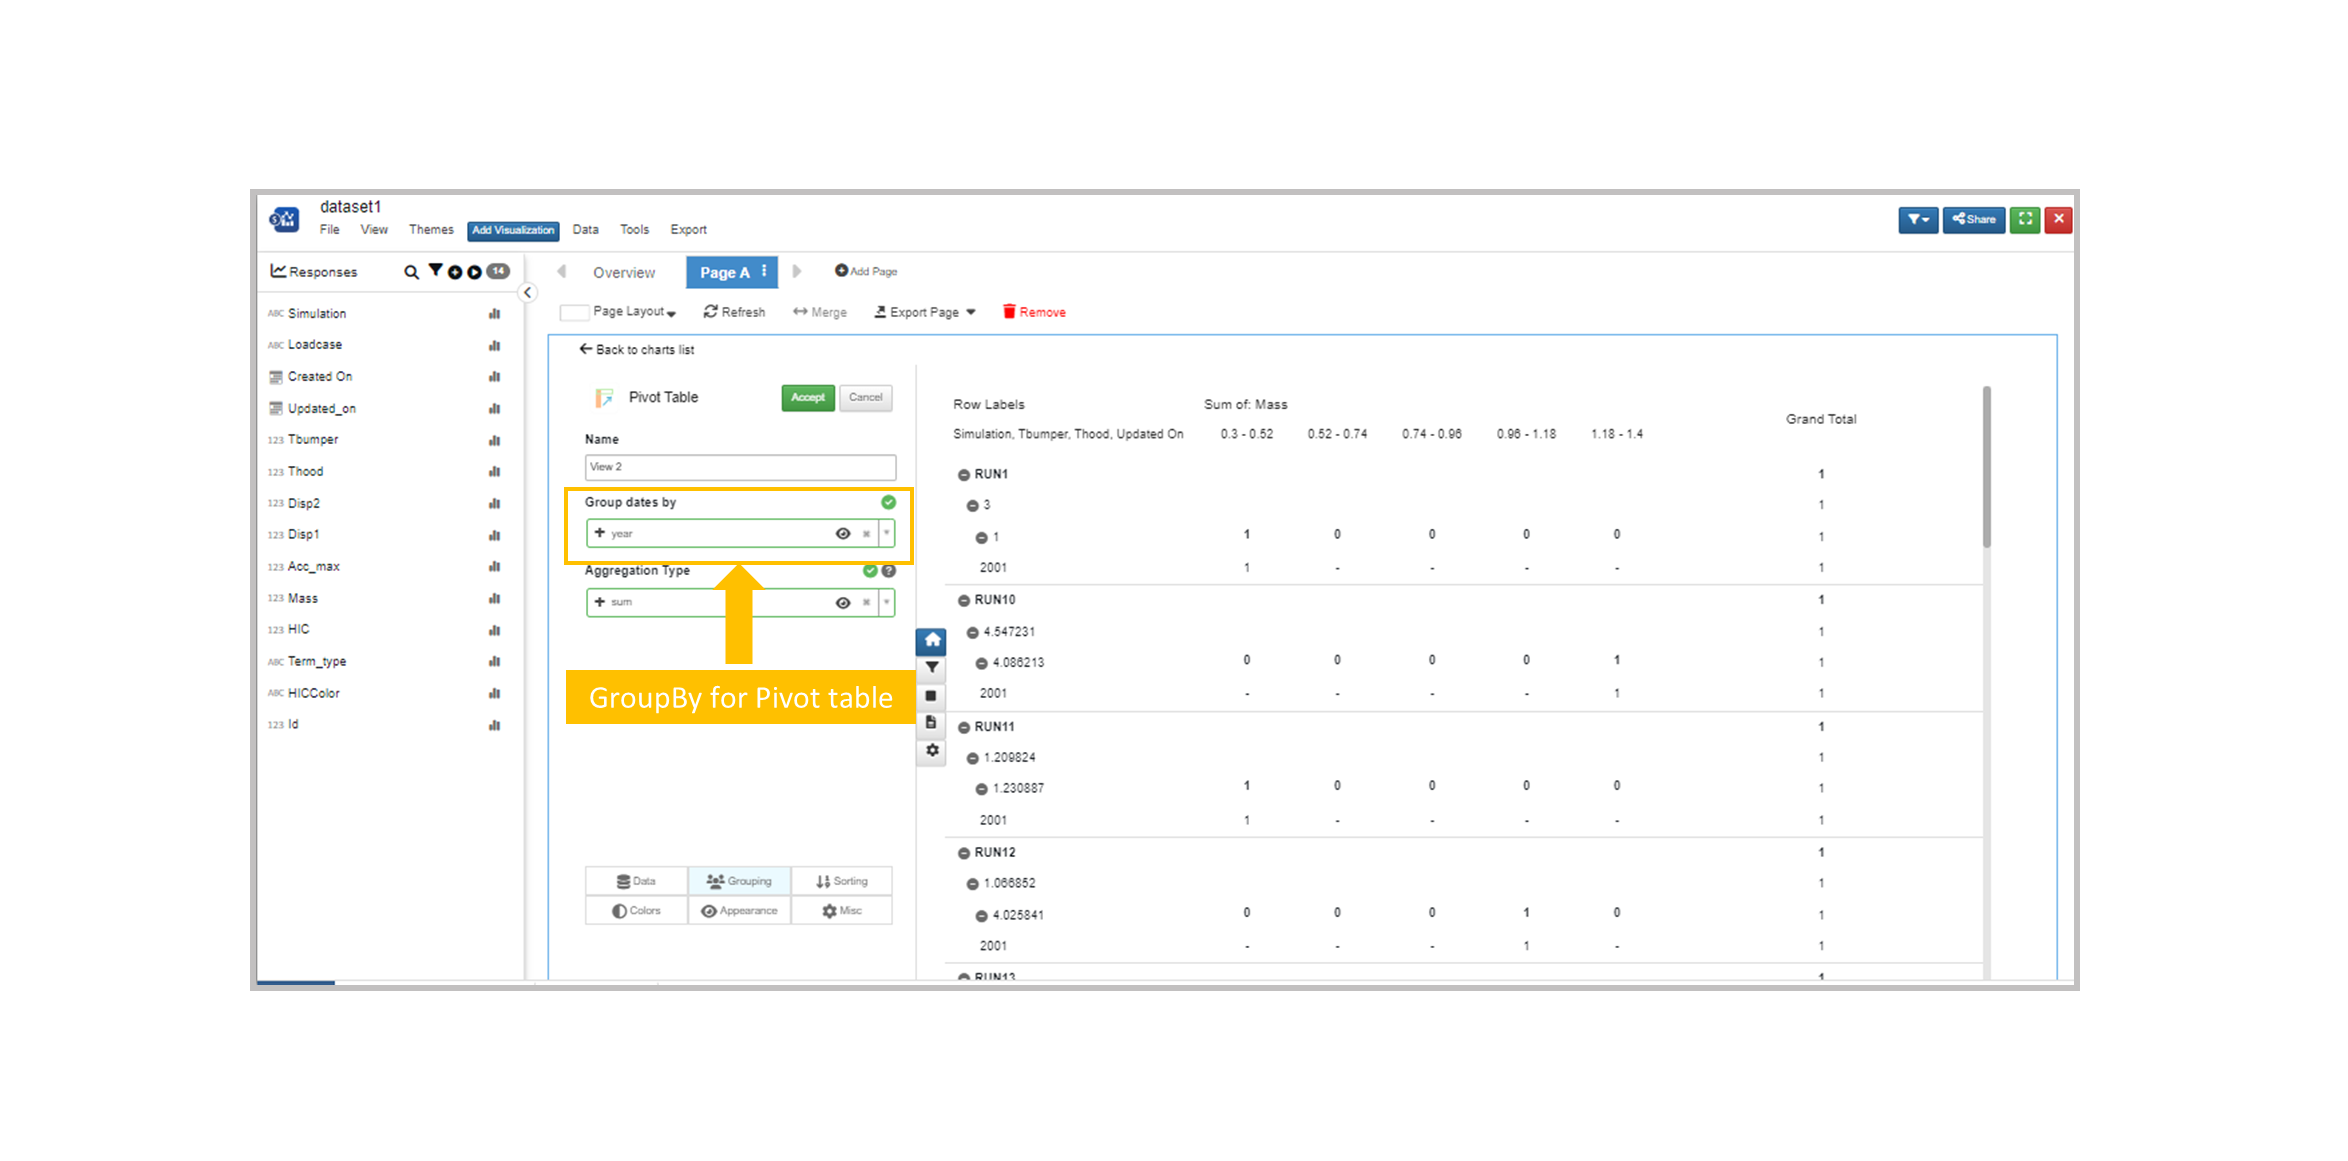
Figure 3: Group Dates in Pivot Table
NEW as of June, 2022: You can view Simulation/Test records when clicked on enabled link by switching on link cells option.
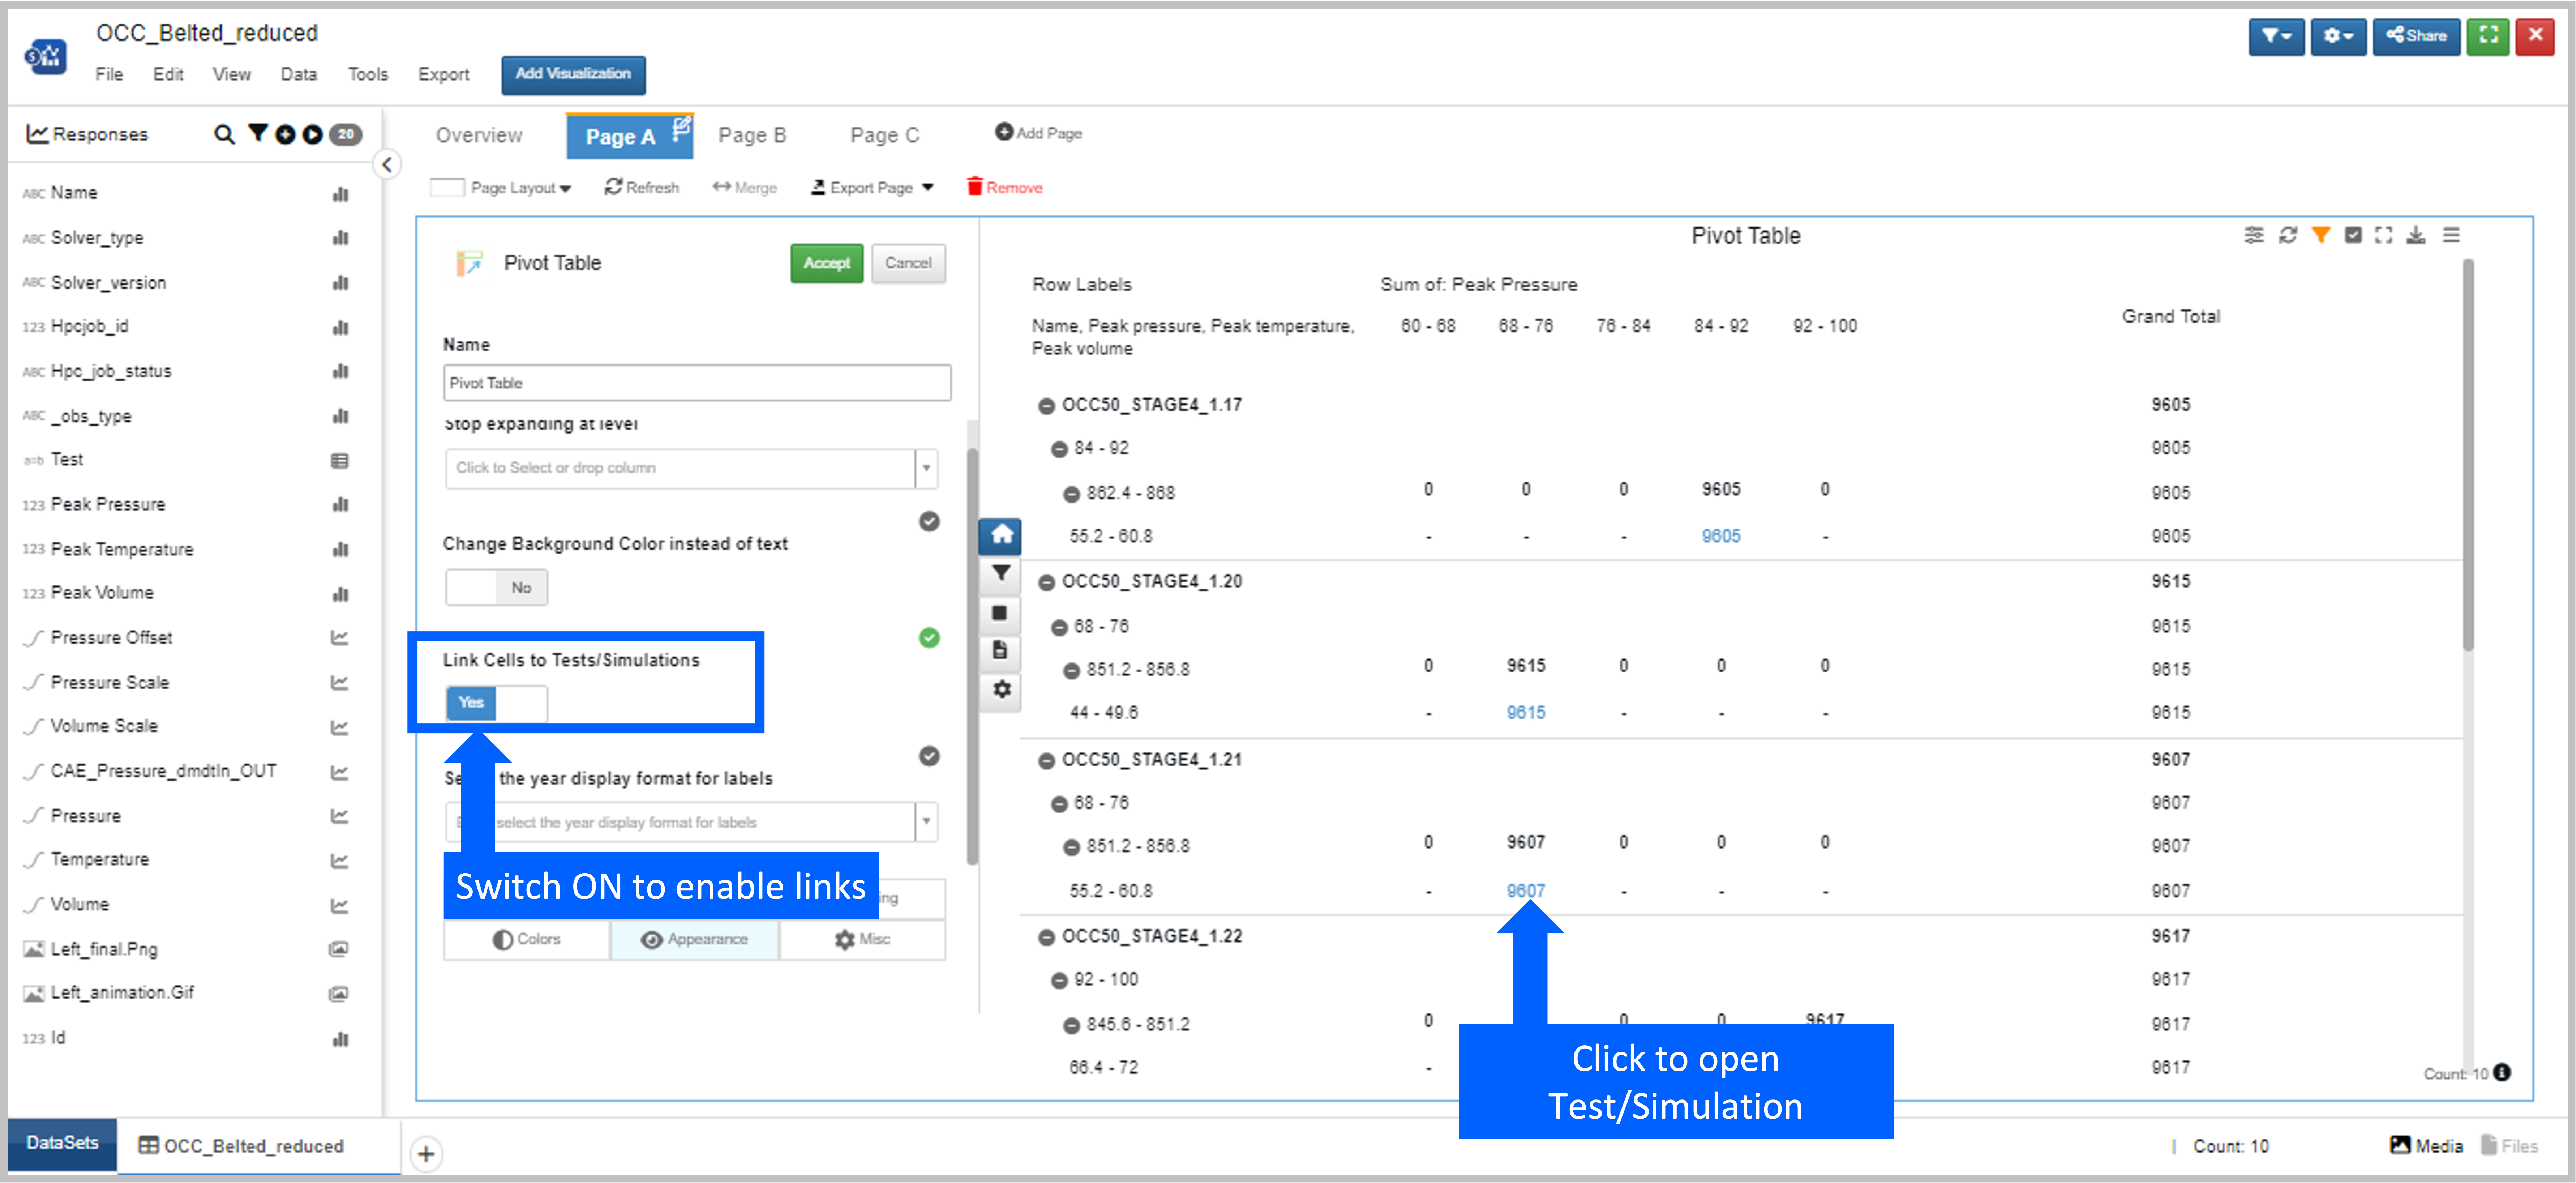
Figure 4: Link Simulation/Test Records
13.2. Vertical Bar
Vertical Bar Chart uses data-drilling in accordance to the X-axis. Adding multiple data columns for X data creates our multidimensional bar chart.
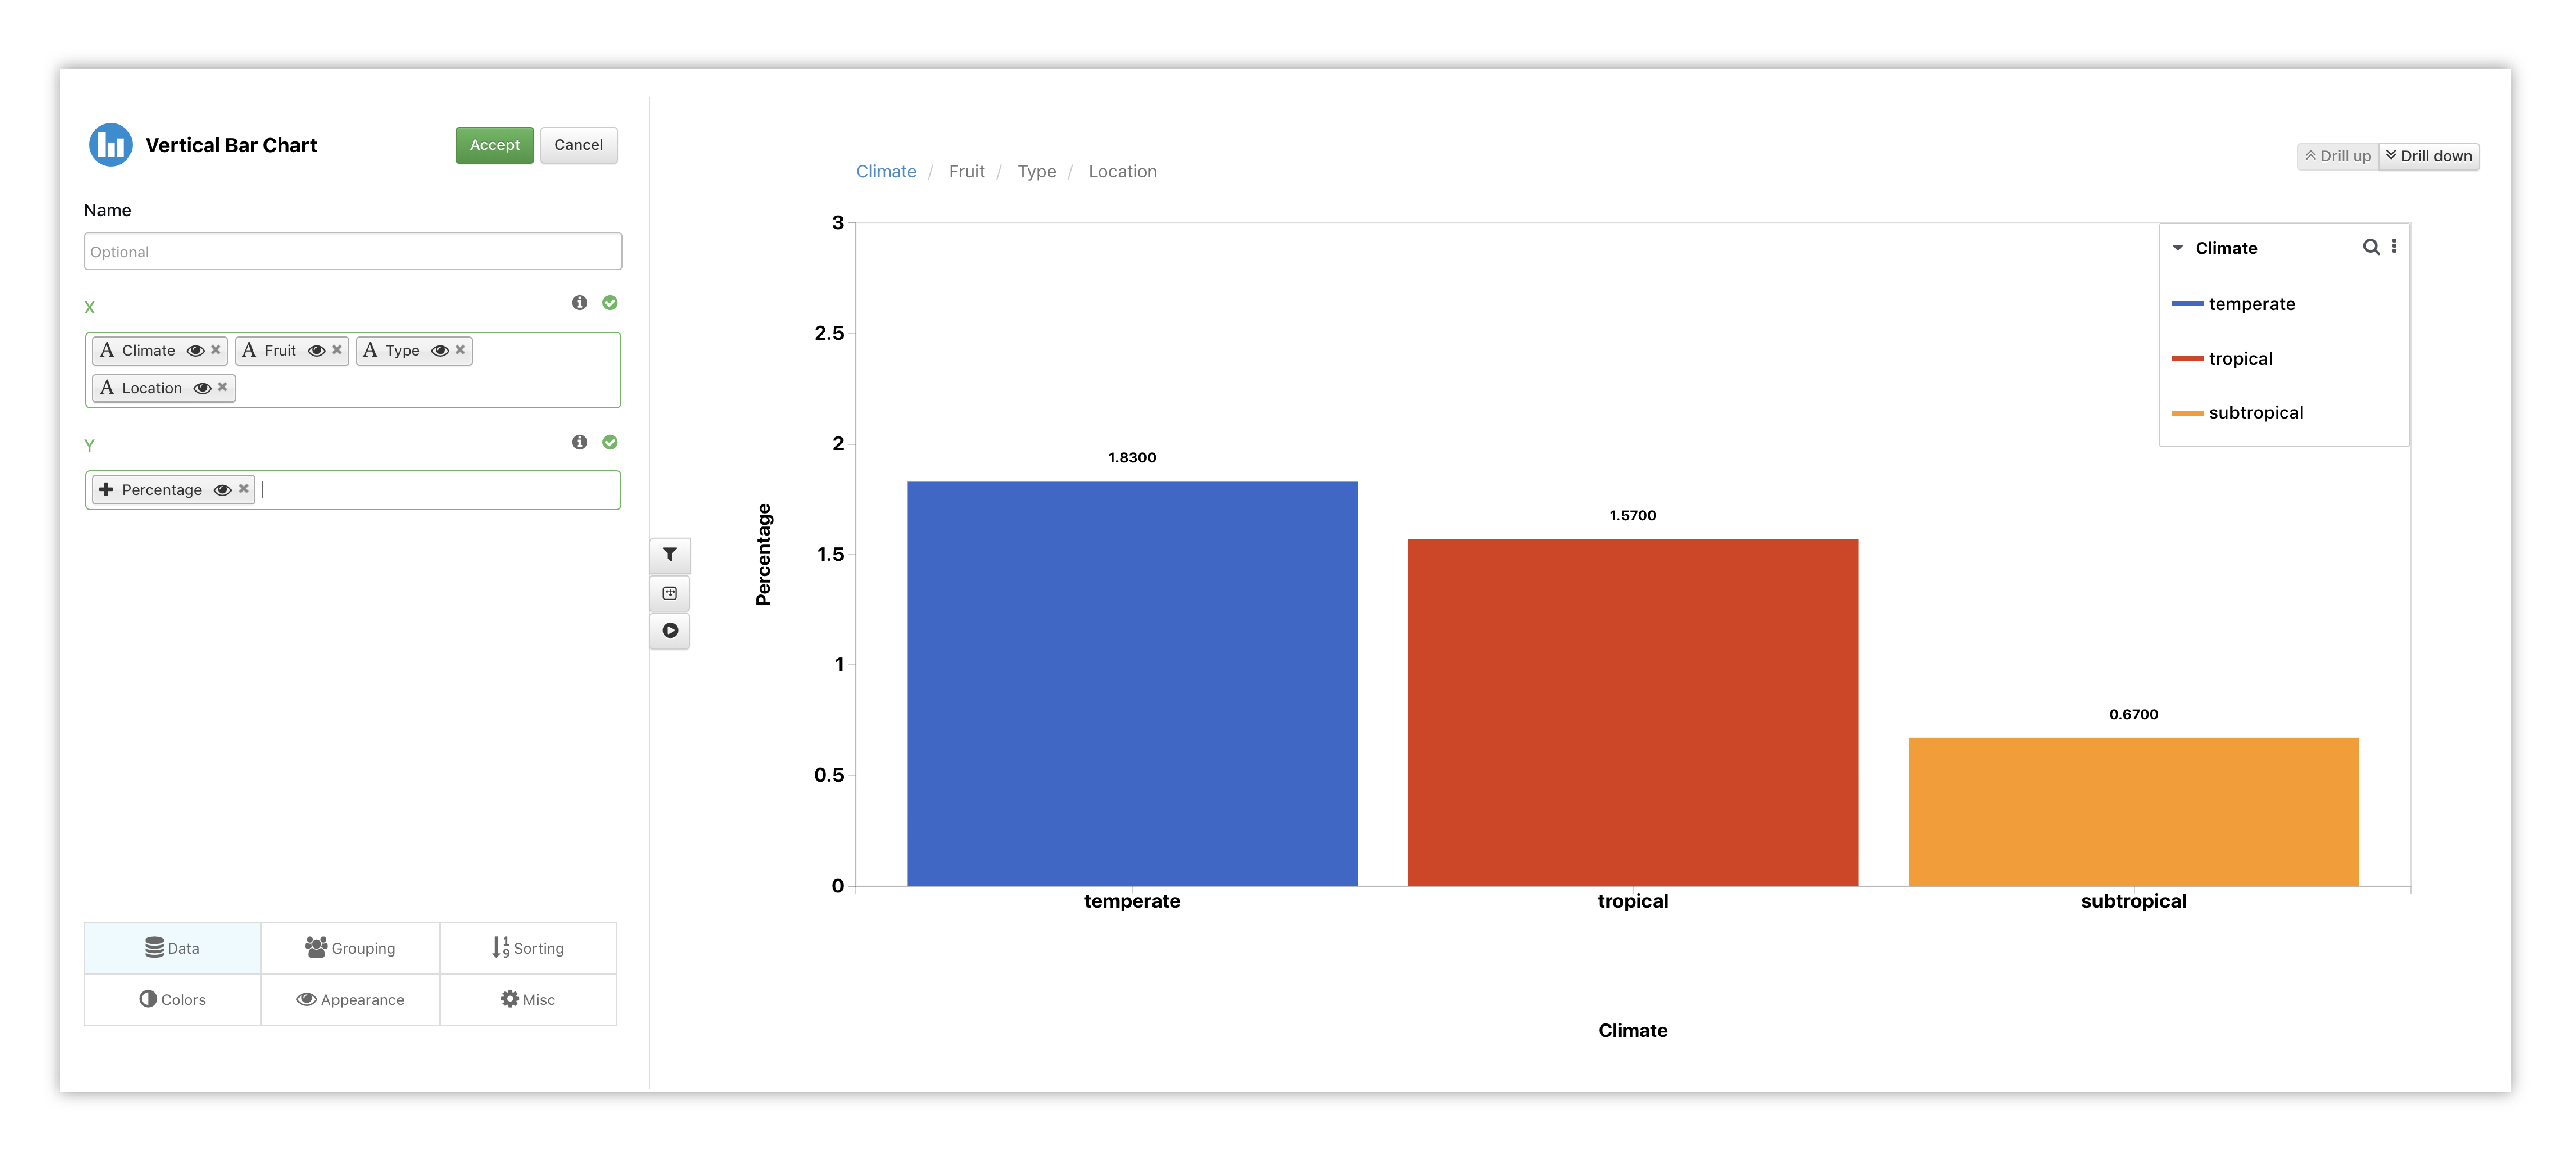
Figure 5: Data-drilling in Bar
We can drill down by clicking on individual bars and drill back up using the navigation at the top. Check out the following video to see how its done:
13.3. Pie
Pie Chart uses data-drilling with multiple columns of data, which can be added under this option in the chart set up.
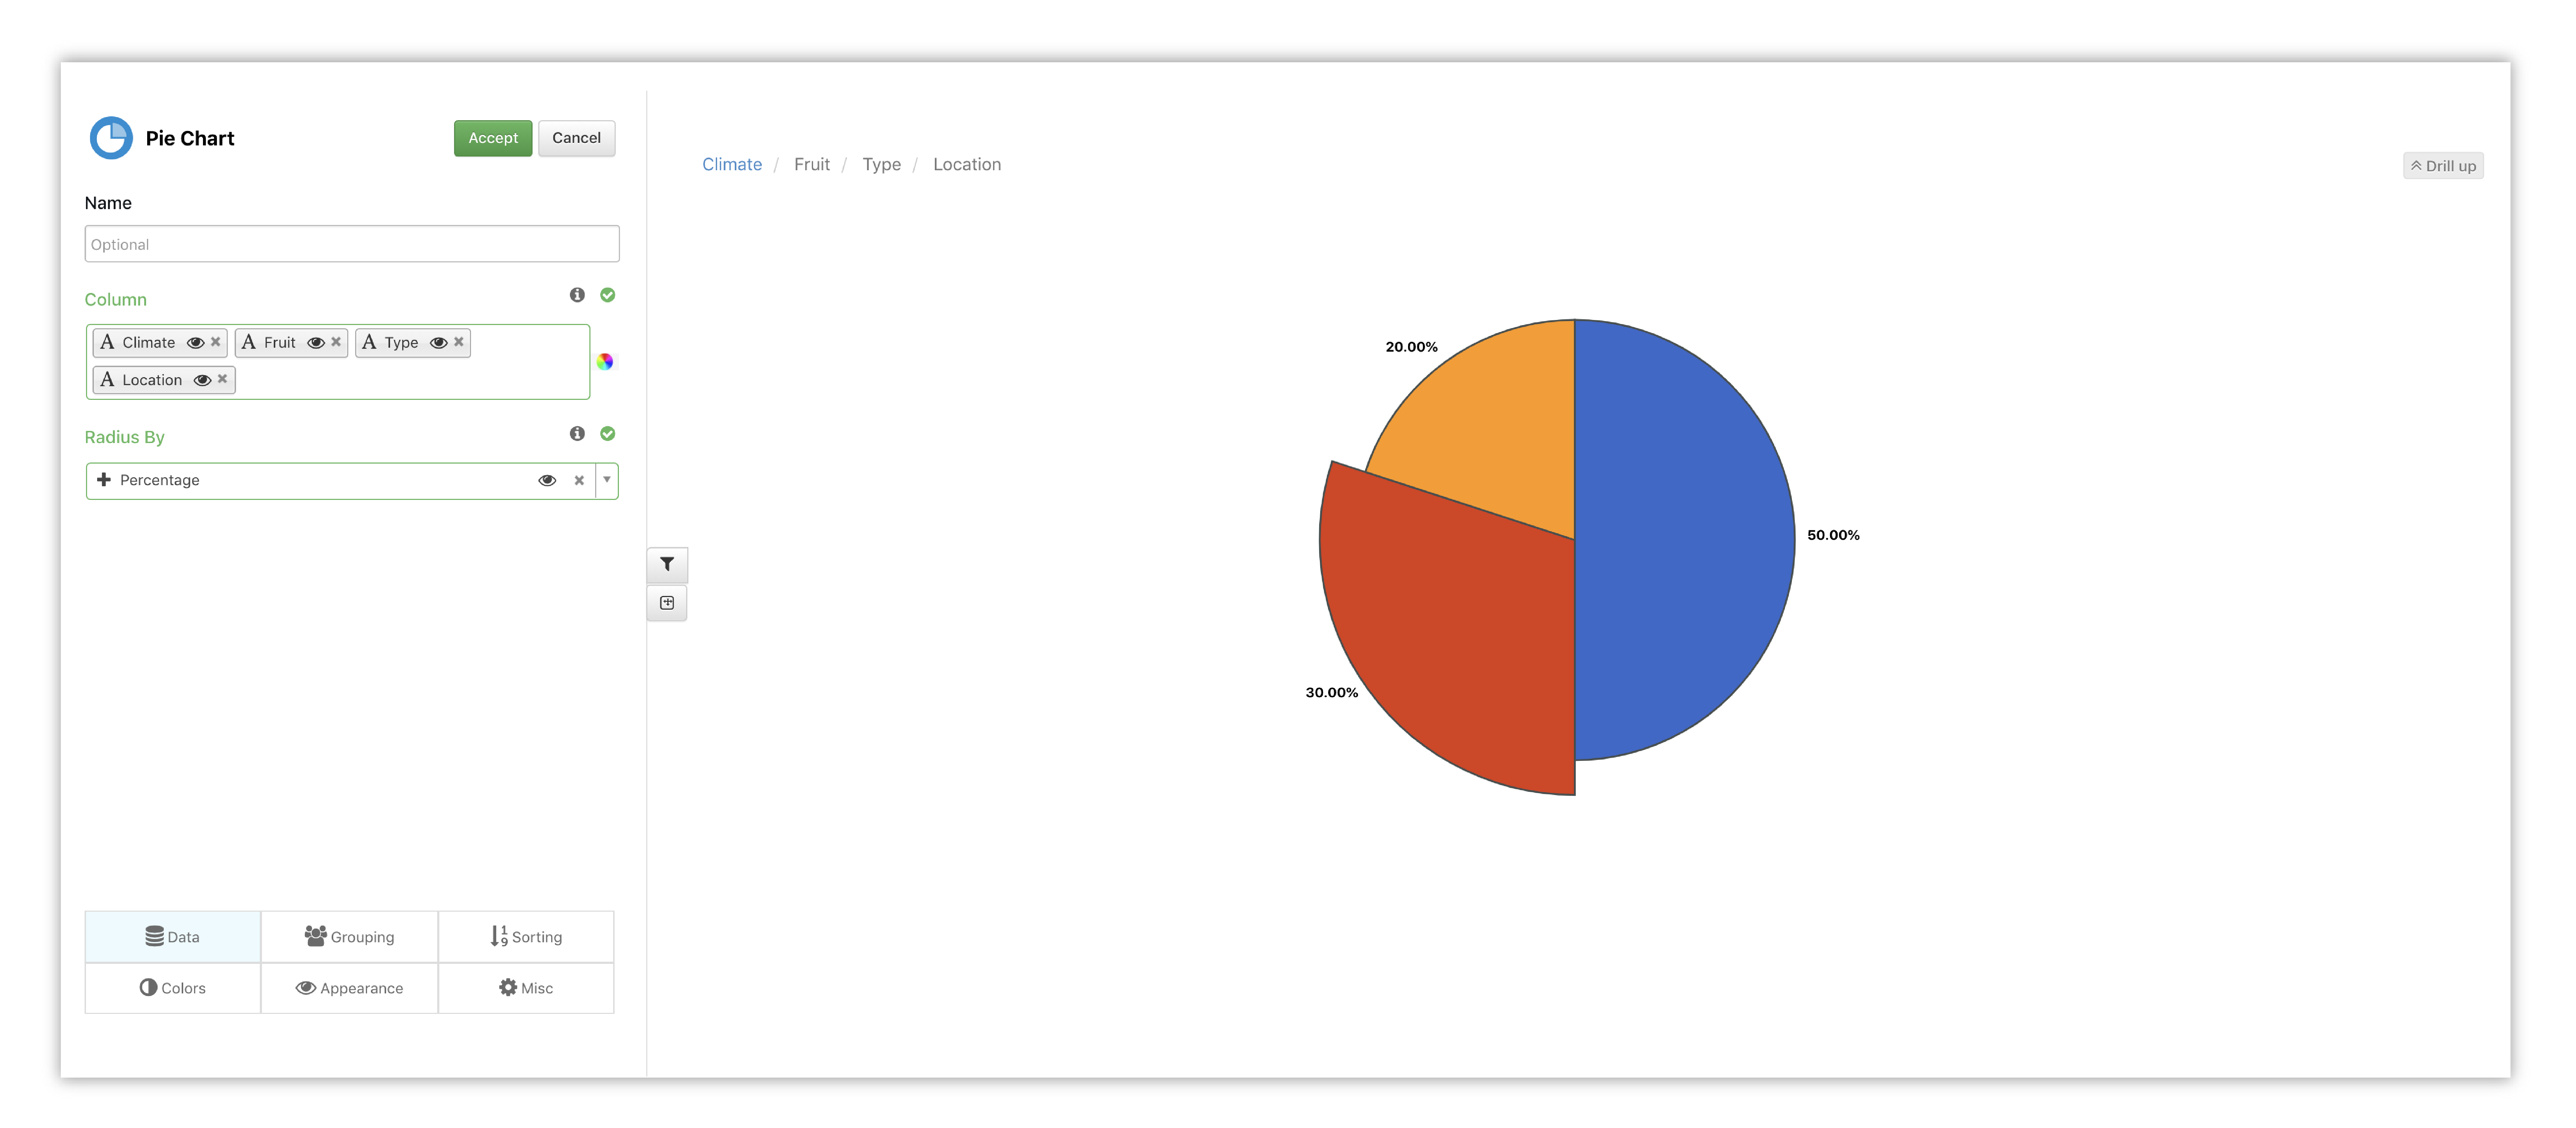
Figure 6: Data-drilling in Pie
Drill down through data by clicking on pie pieces and drill back up using the navigation at the top. Here is a video showing how to navigate through the dimensions of data:
13.4. Tree Map
Tree Map uses data-drilling via its grouping factors. Choose more than one data column for this option when setting up the chart.
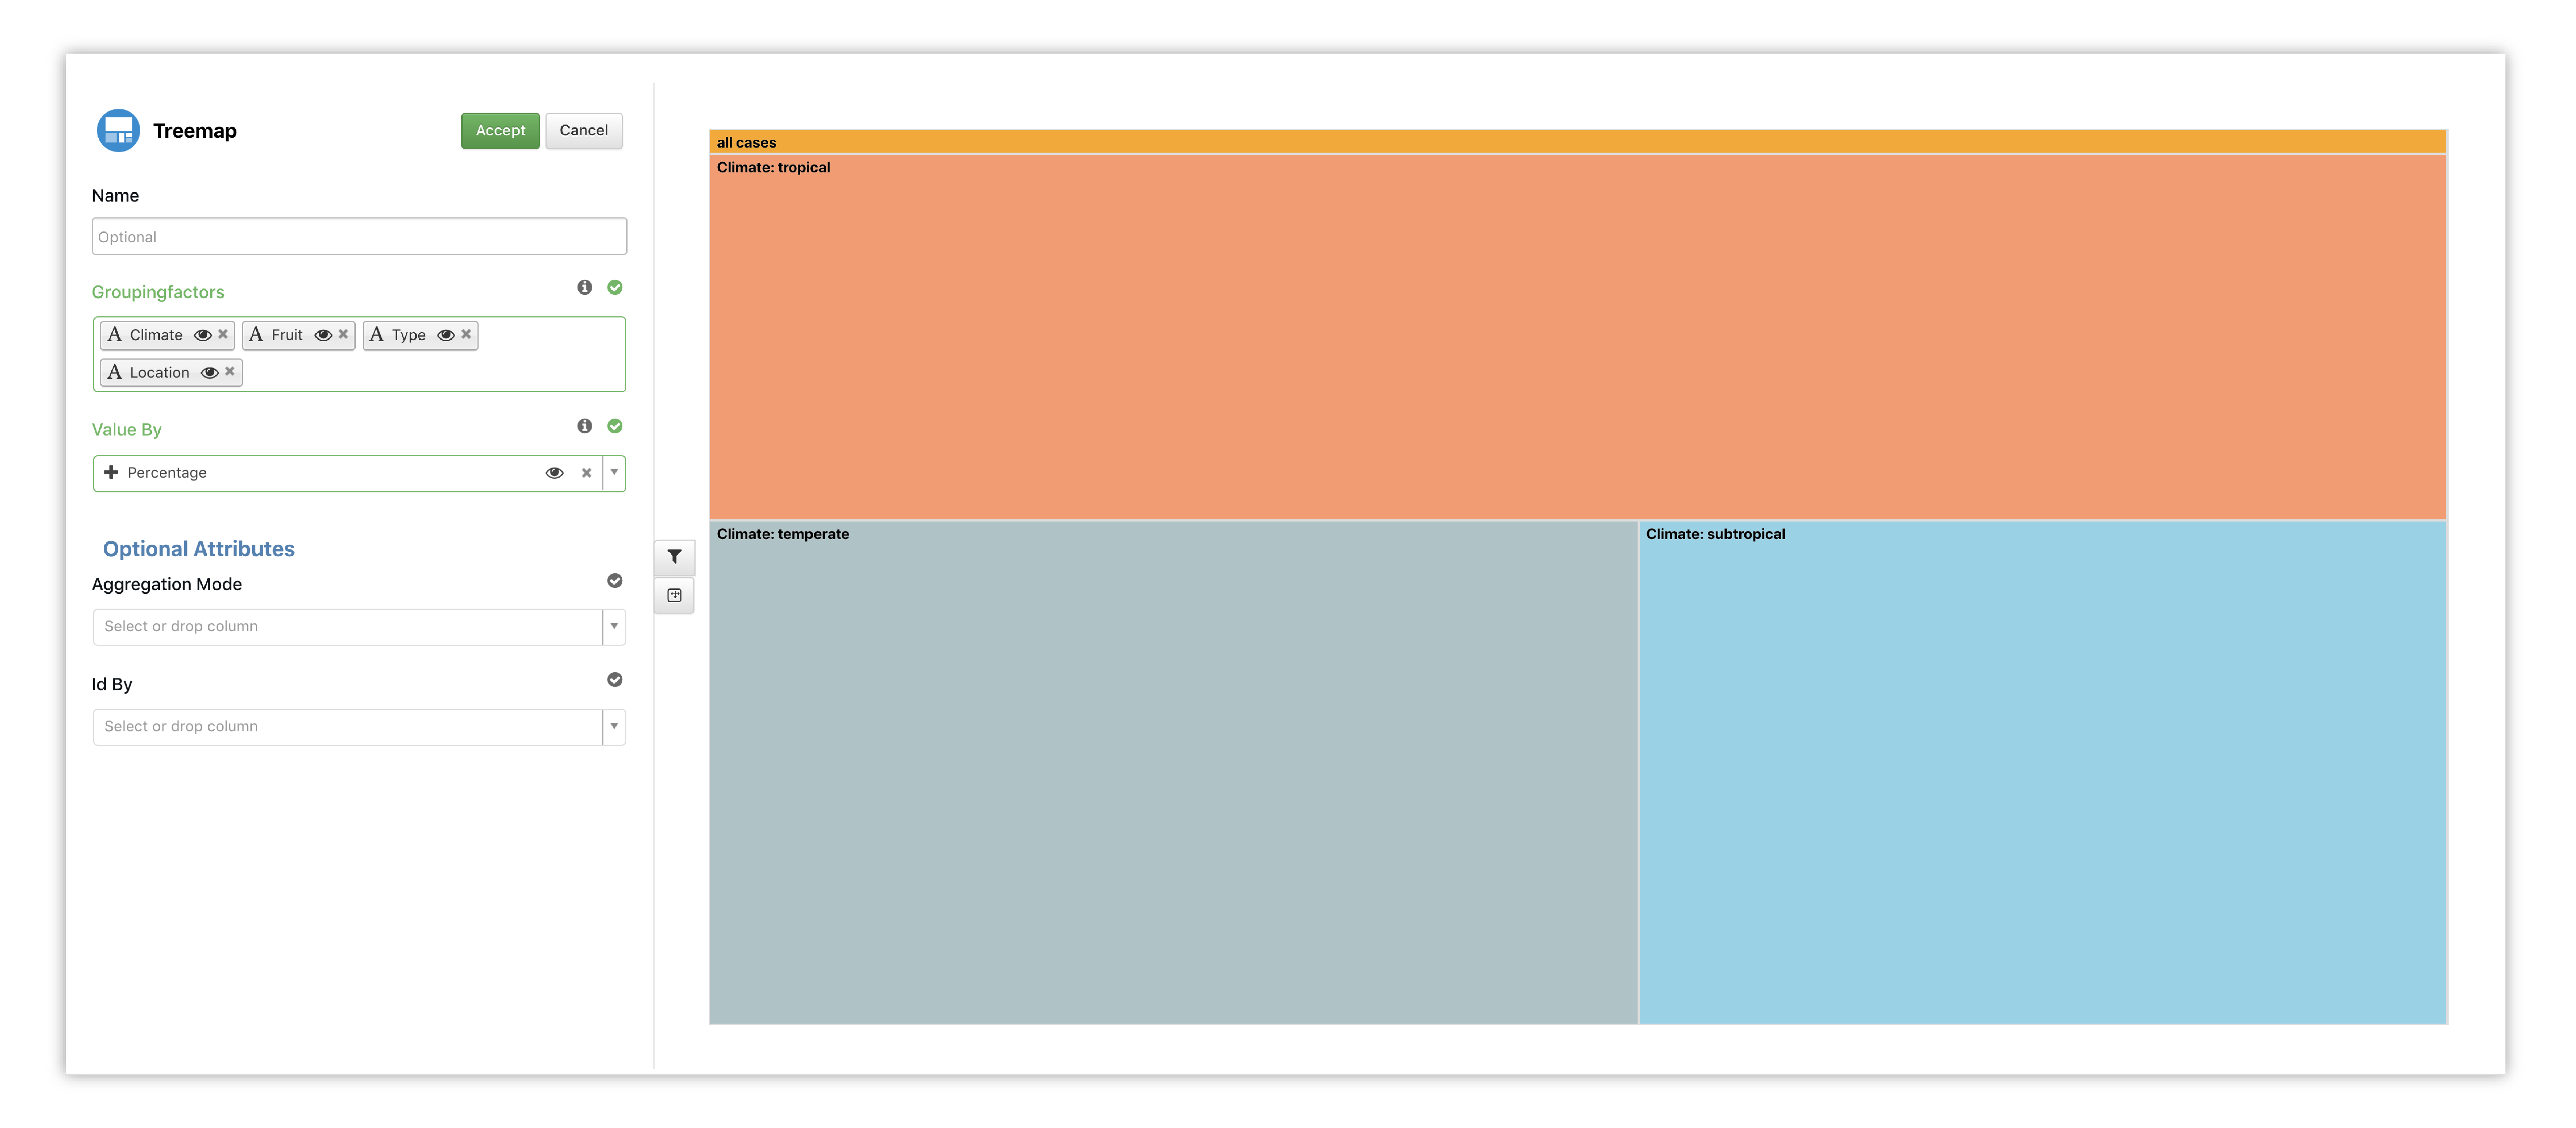
Figure 7: Data-drilling in Tree
We can drill down through the map by clicking on the squares or groups and drill back up using the navigation at the top. Watch the following video to see how it’s done: