
9.  Annotating
In this section, we’ll go over how to use the image annotator for creating annotated charts.
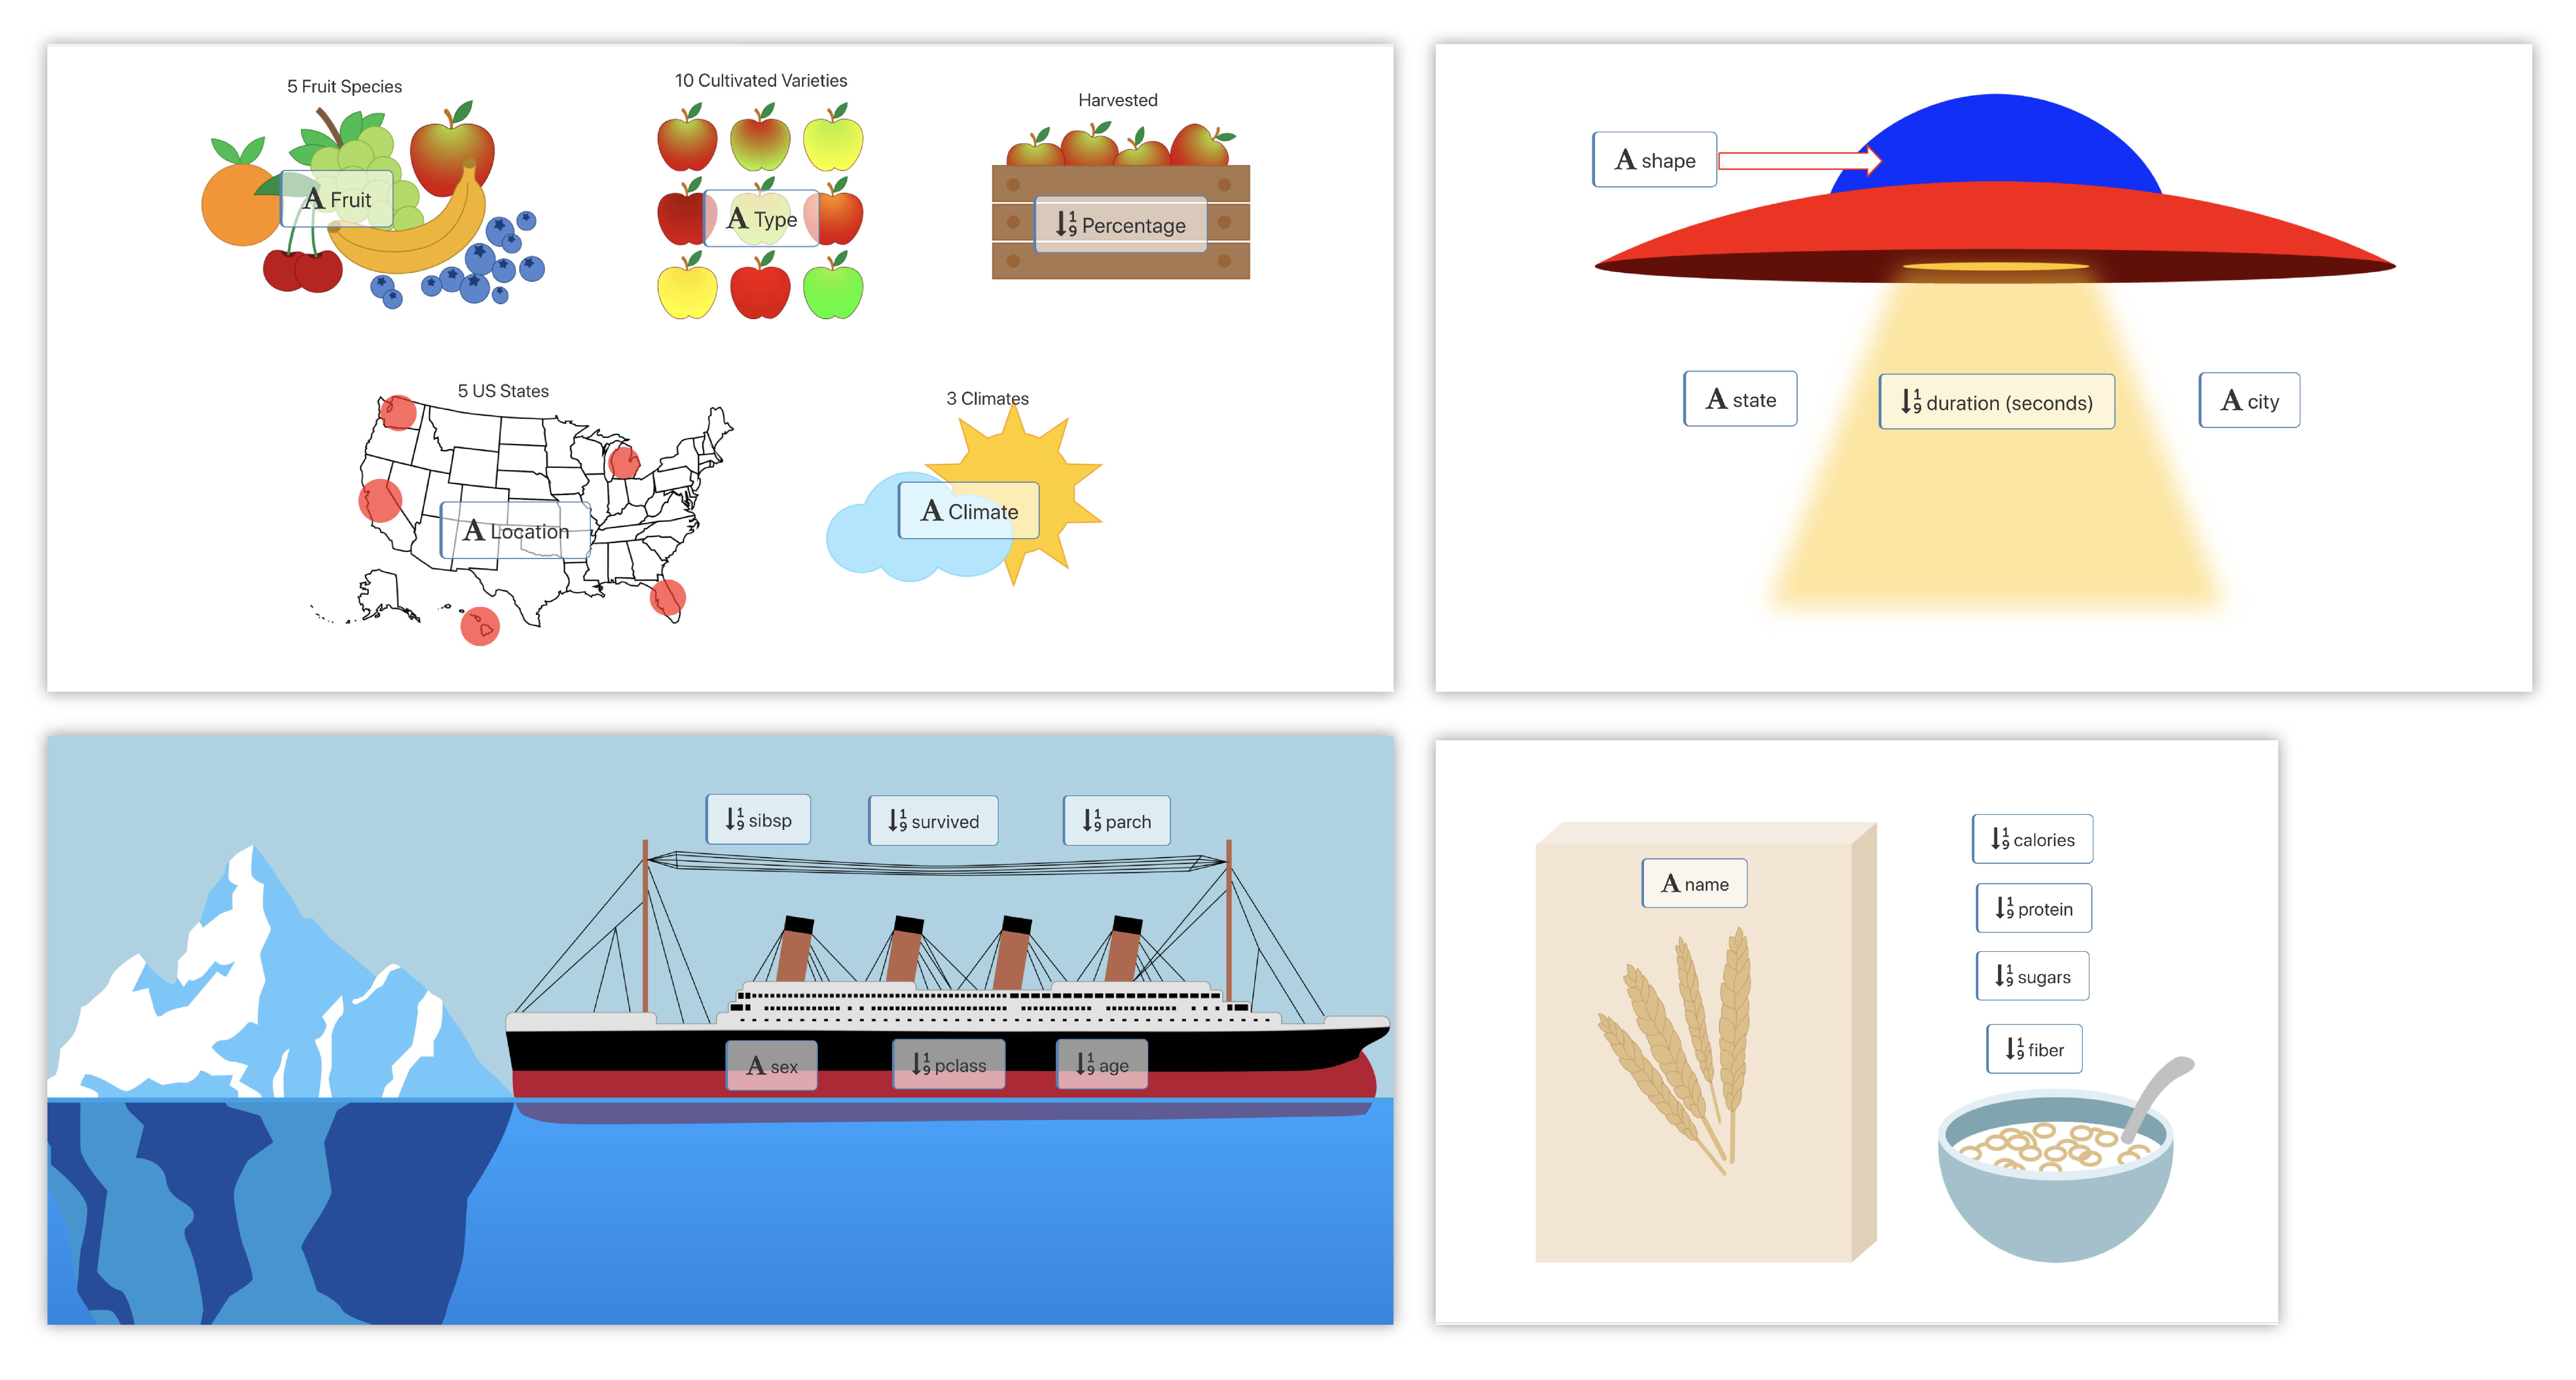
Examples of Annotated Images
9.1. Image Annotator

The Image Annotator Visualizer allows for quick and easy image annotating via drag-and-drop. It works for all datasets and is the most recommended way to convey information.
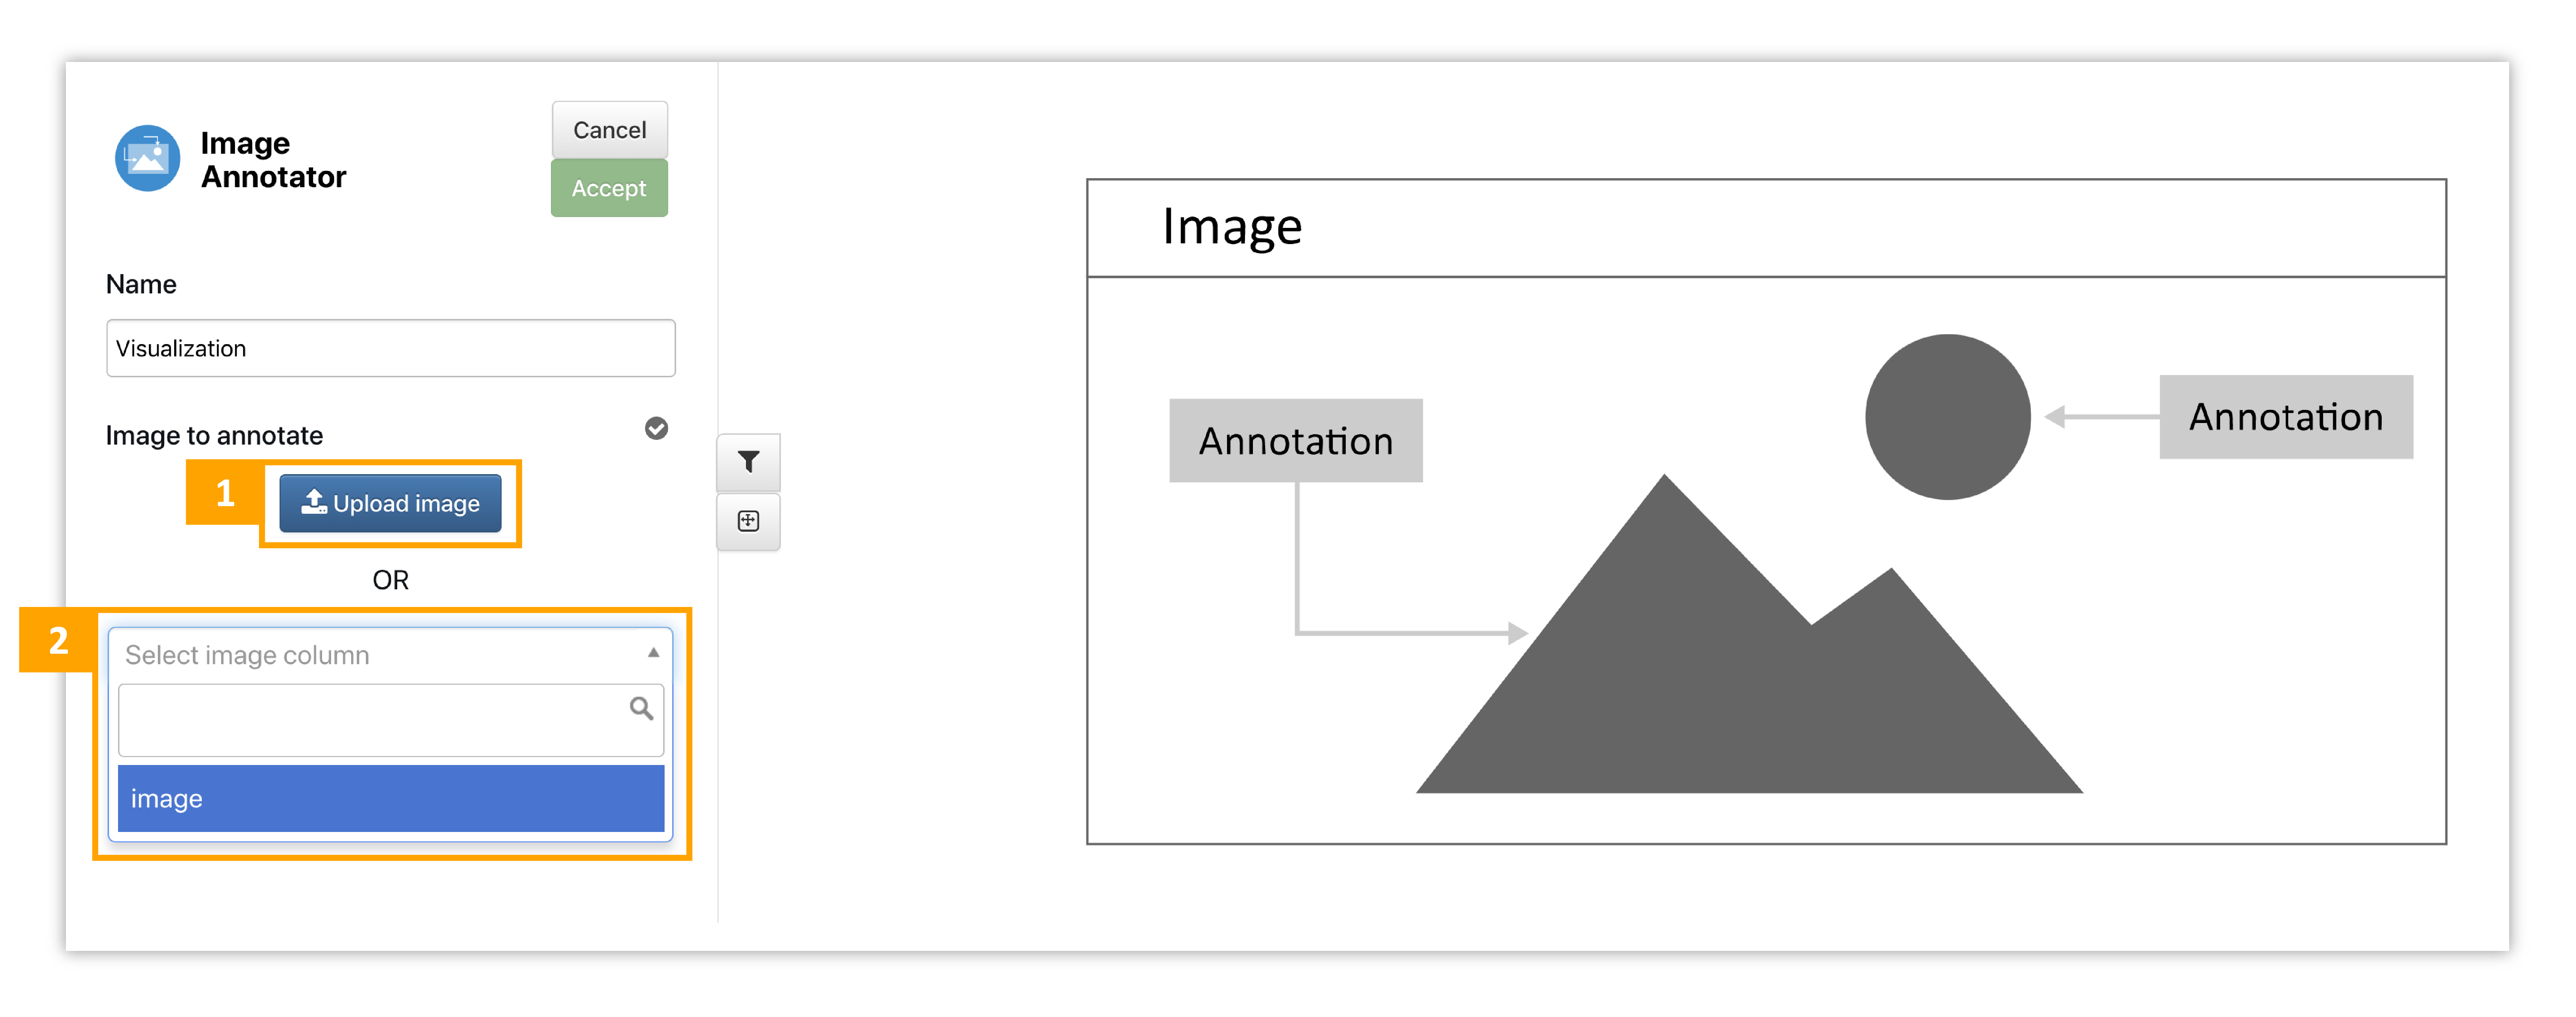
Figure 4: Image Annotator
- Upload local image to annotate.
- Choose an image from the dataset to annotate.
Choose an image from the dataset or upload a new one to add it to the chart area. Then, drag-and-drop data columns from the left panel onto the image. Annotations can be moved around by clicking and dragging as well. Click on the A in the upper right corner of the chart area to add shapes, arrows and text. Labels are added by clicking anywhere and specifying text. There is no need to annotate the image will in Edit Viz mode as we can annotate our images at any time. Watch the following video to see how it’s done:
Here is our final annotated image for our fruit dataset, showing a visual summary of the data.
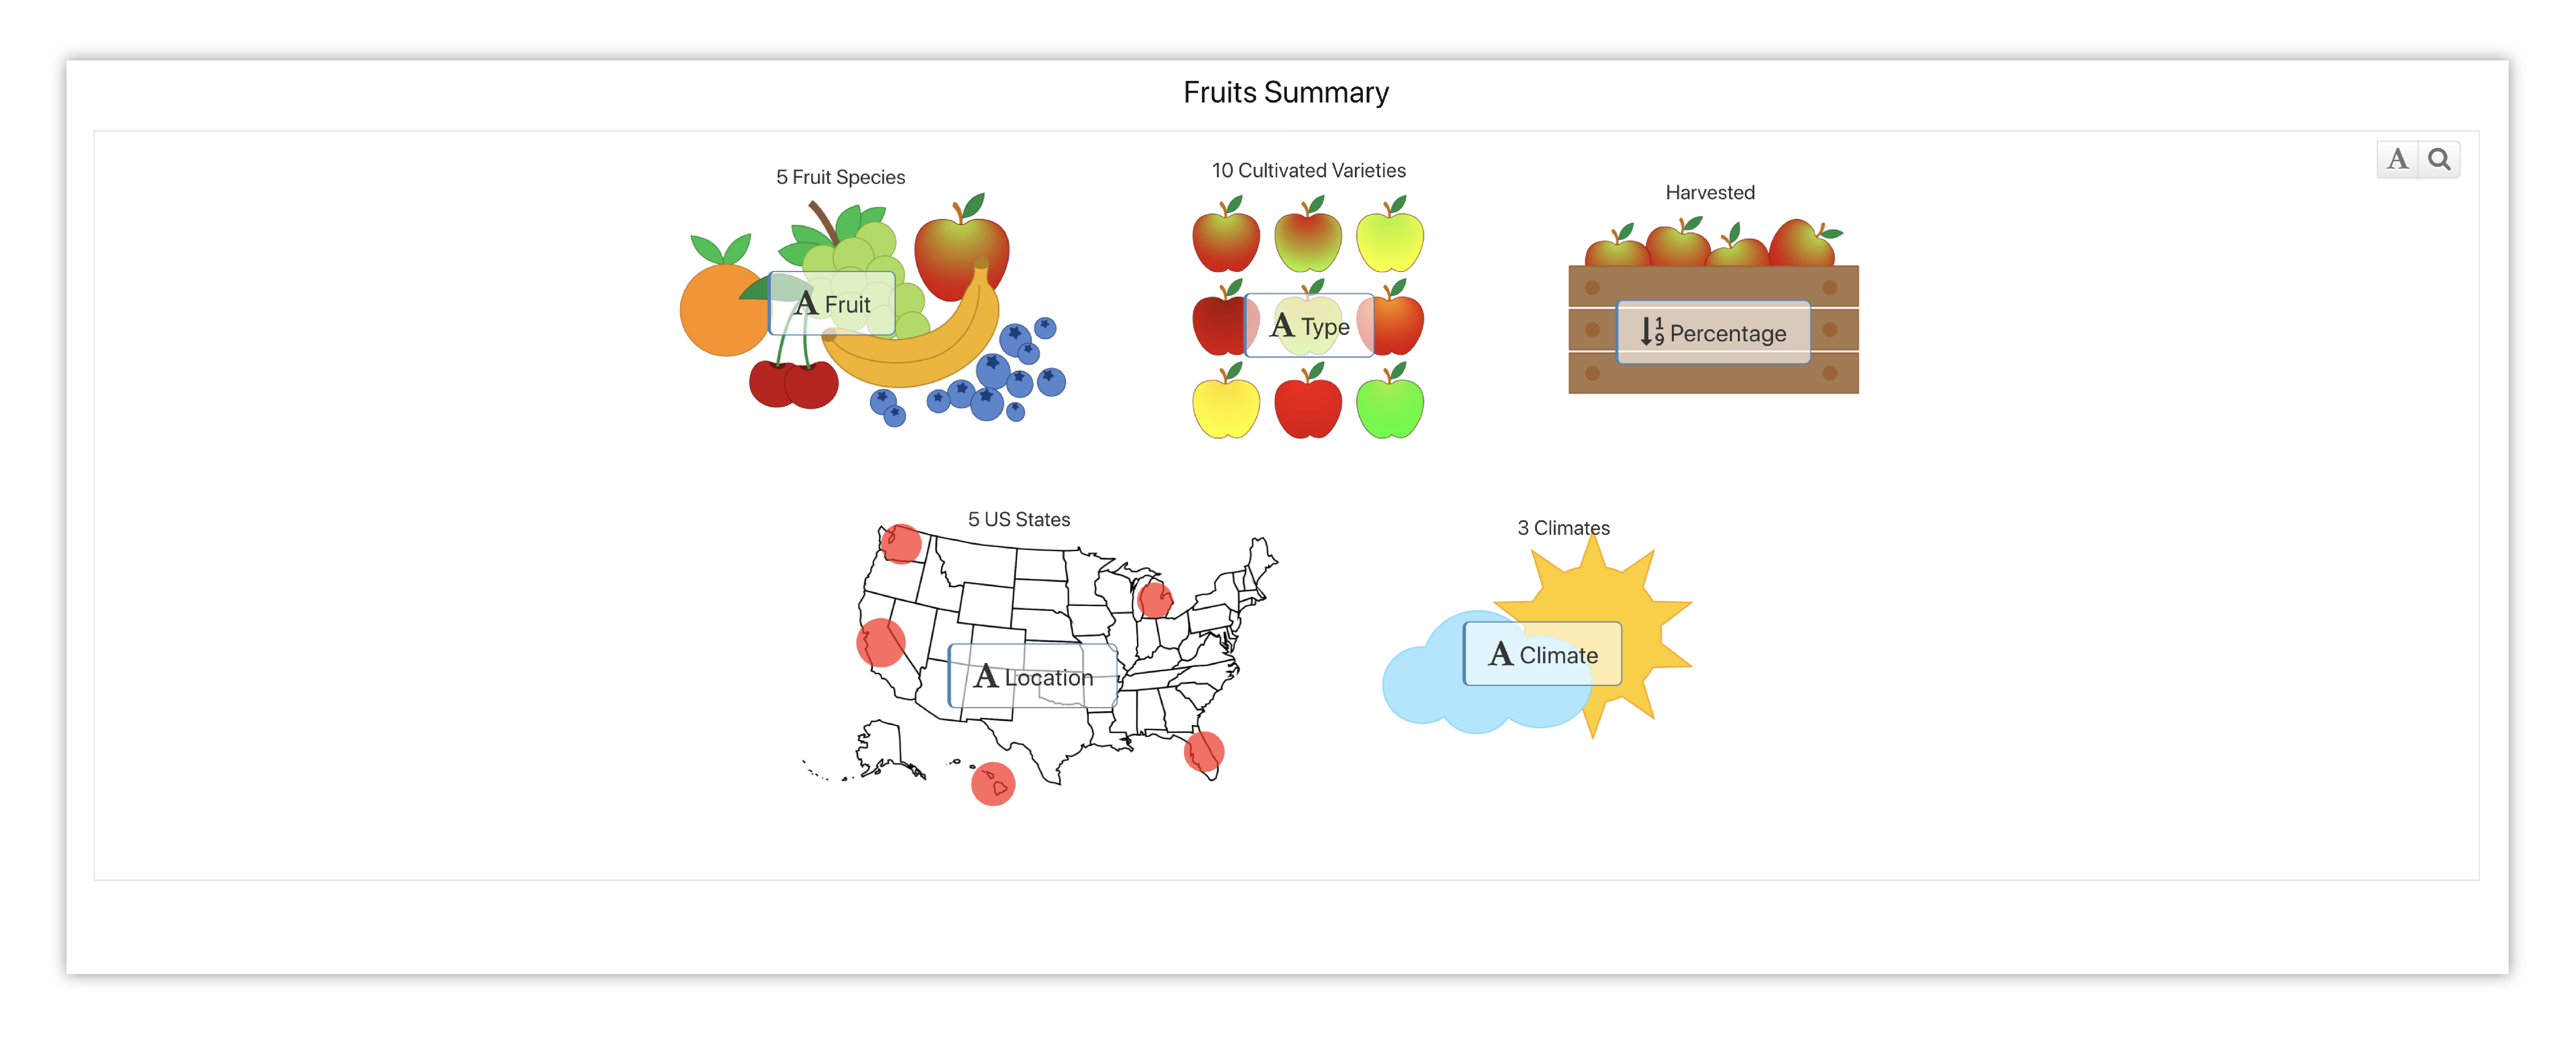
Figure 5: Fruit Summary Annotated Image
9.2. Scientific Examples
The following are image annotator examples using scientific datasets.
Occ Belted
The Occupant Belted scientific dataset explores crash analysis on the driver. Here is an image annotation for the forces at play on the driver.
Here is our final annotated image for this Occ Belted dataset.
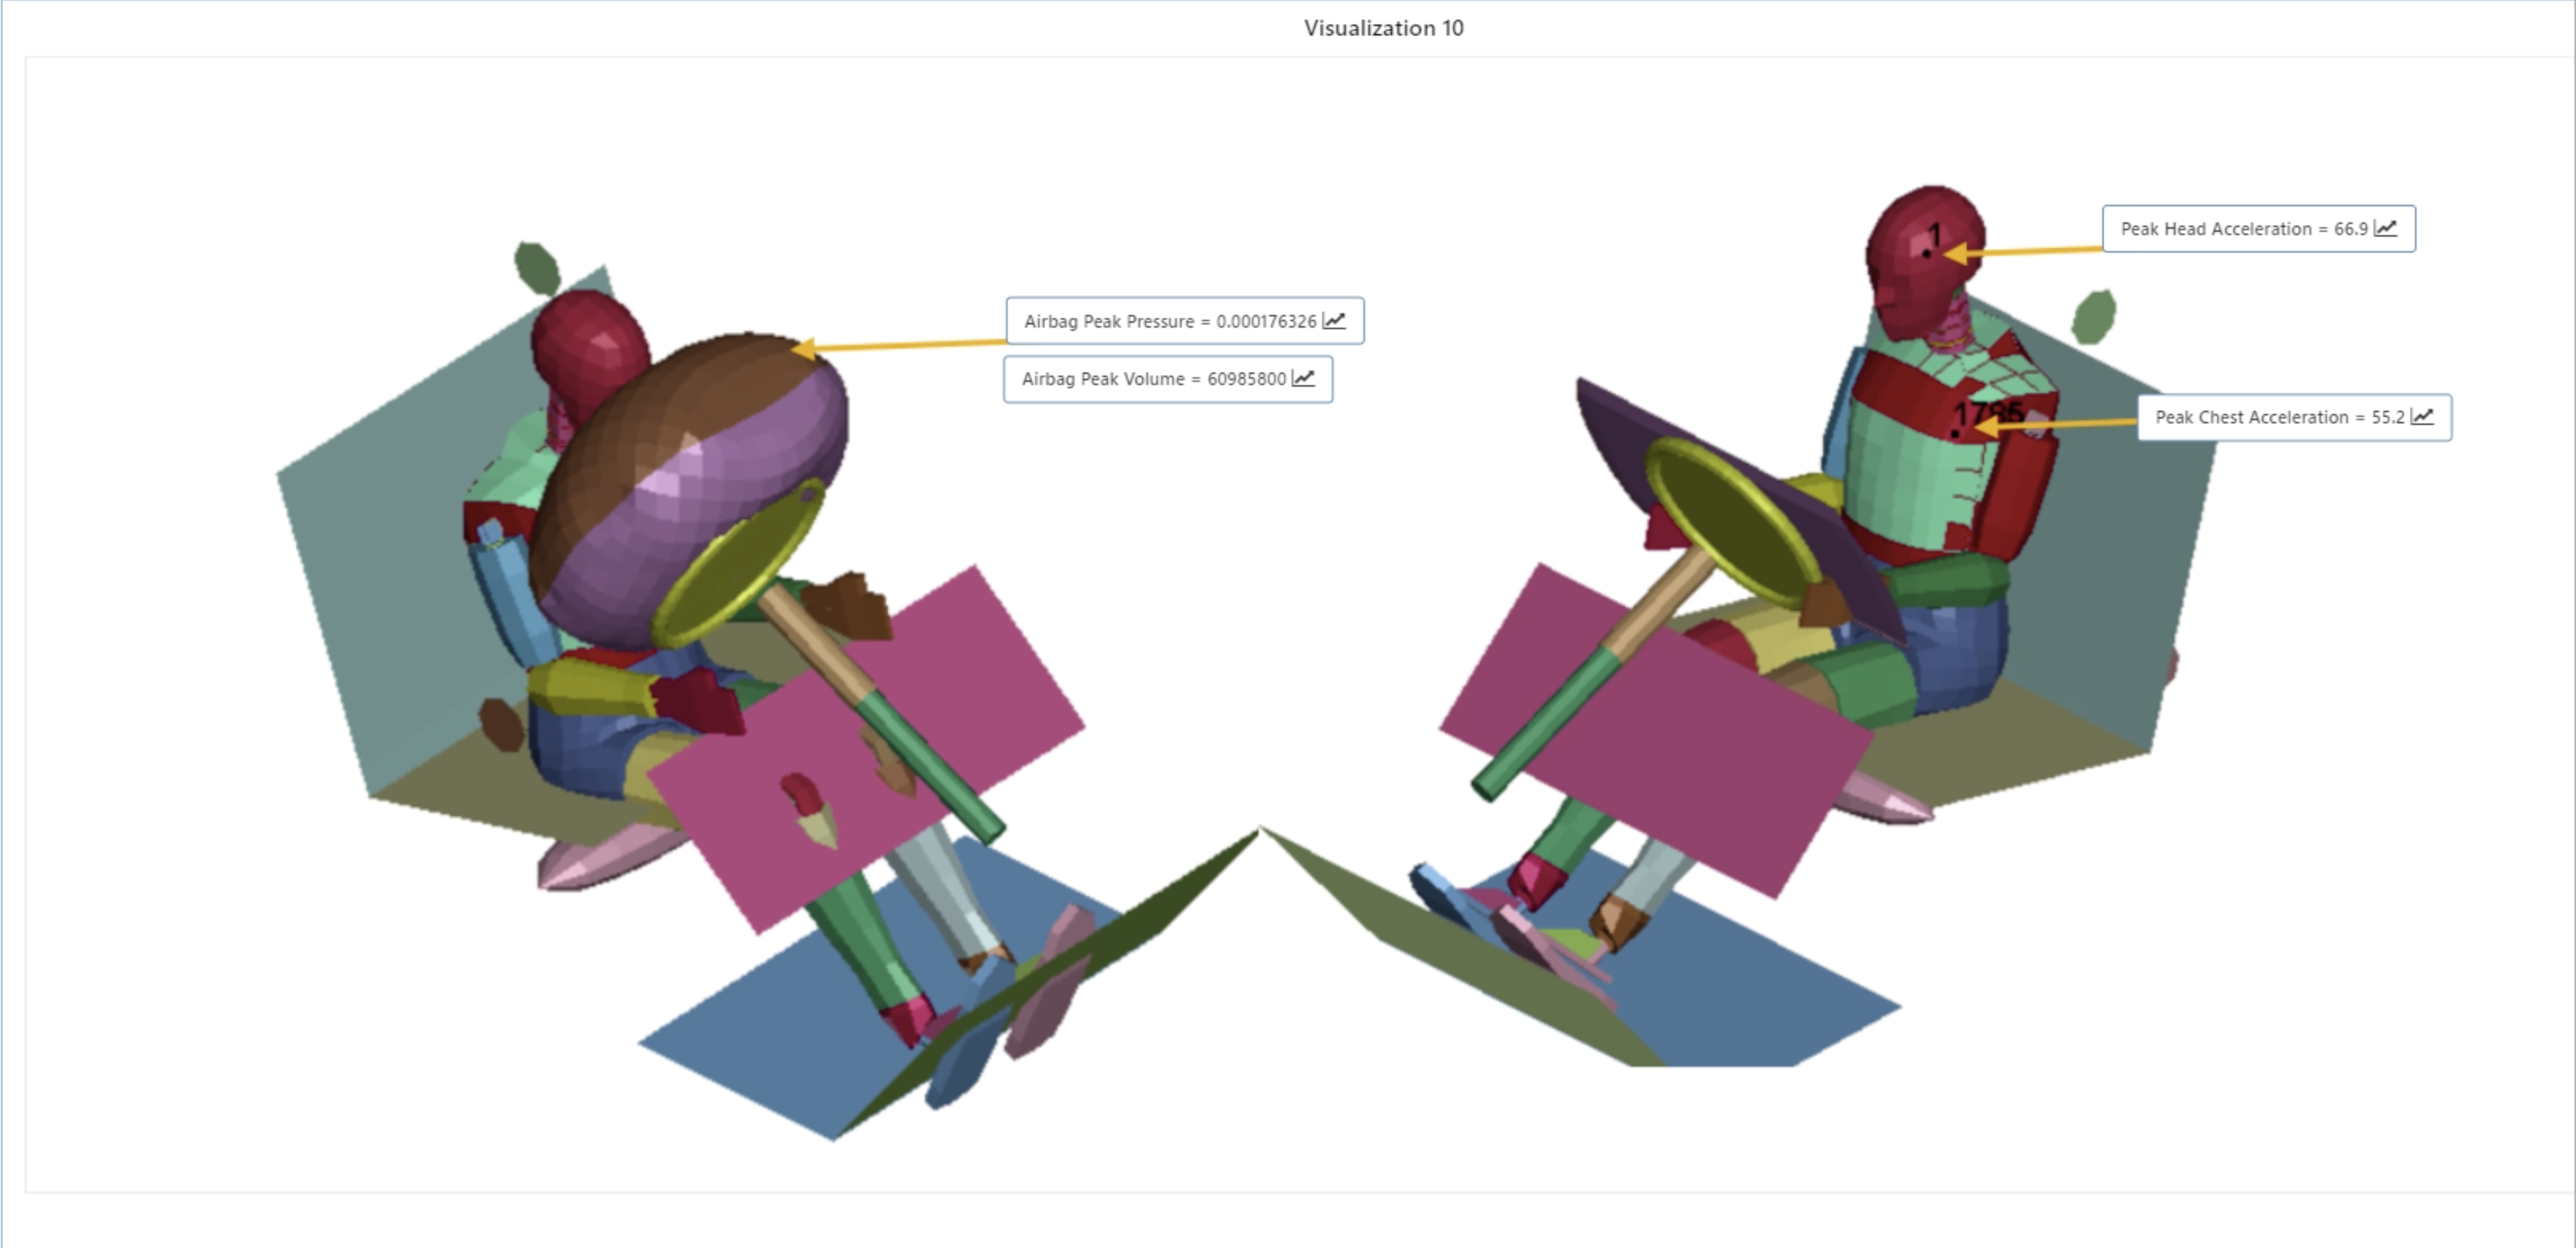
Figure 6: Occ Belted Annotated Image
Rail Model
The Rail Model scientific dataset explores an axial crush material calibration simulation. Here is an image annotation for the forces at play during the crush.
Here is our final annotated image for this Rail Model dataset.
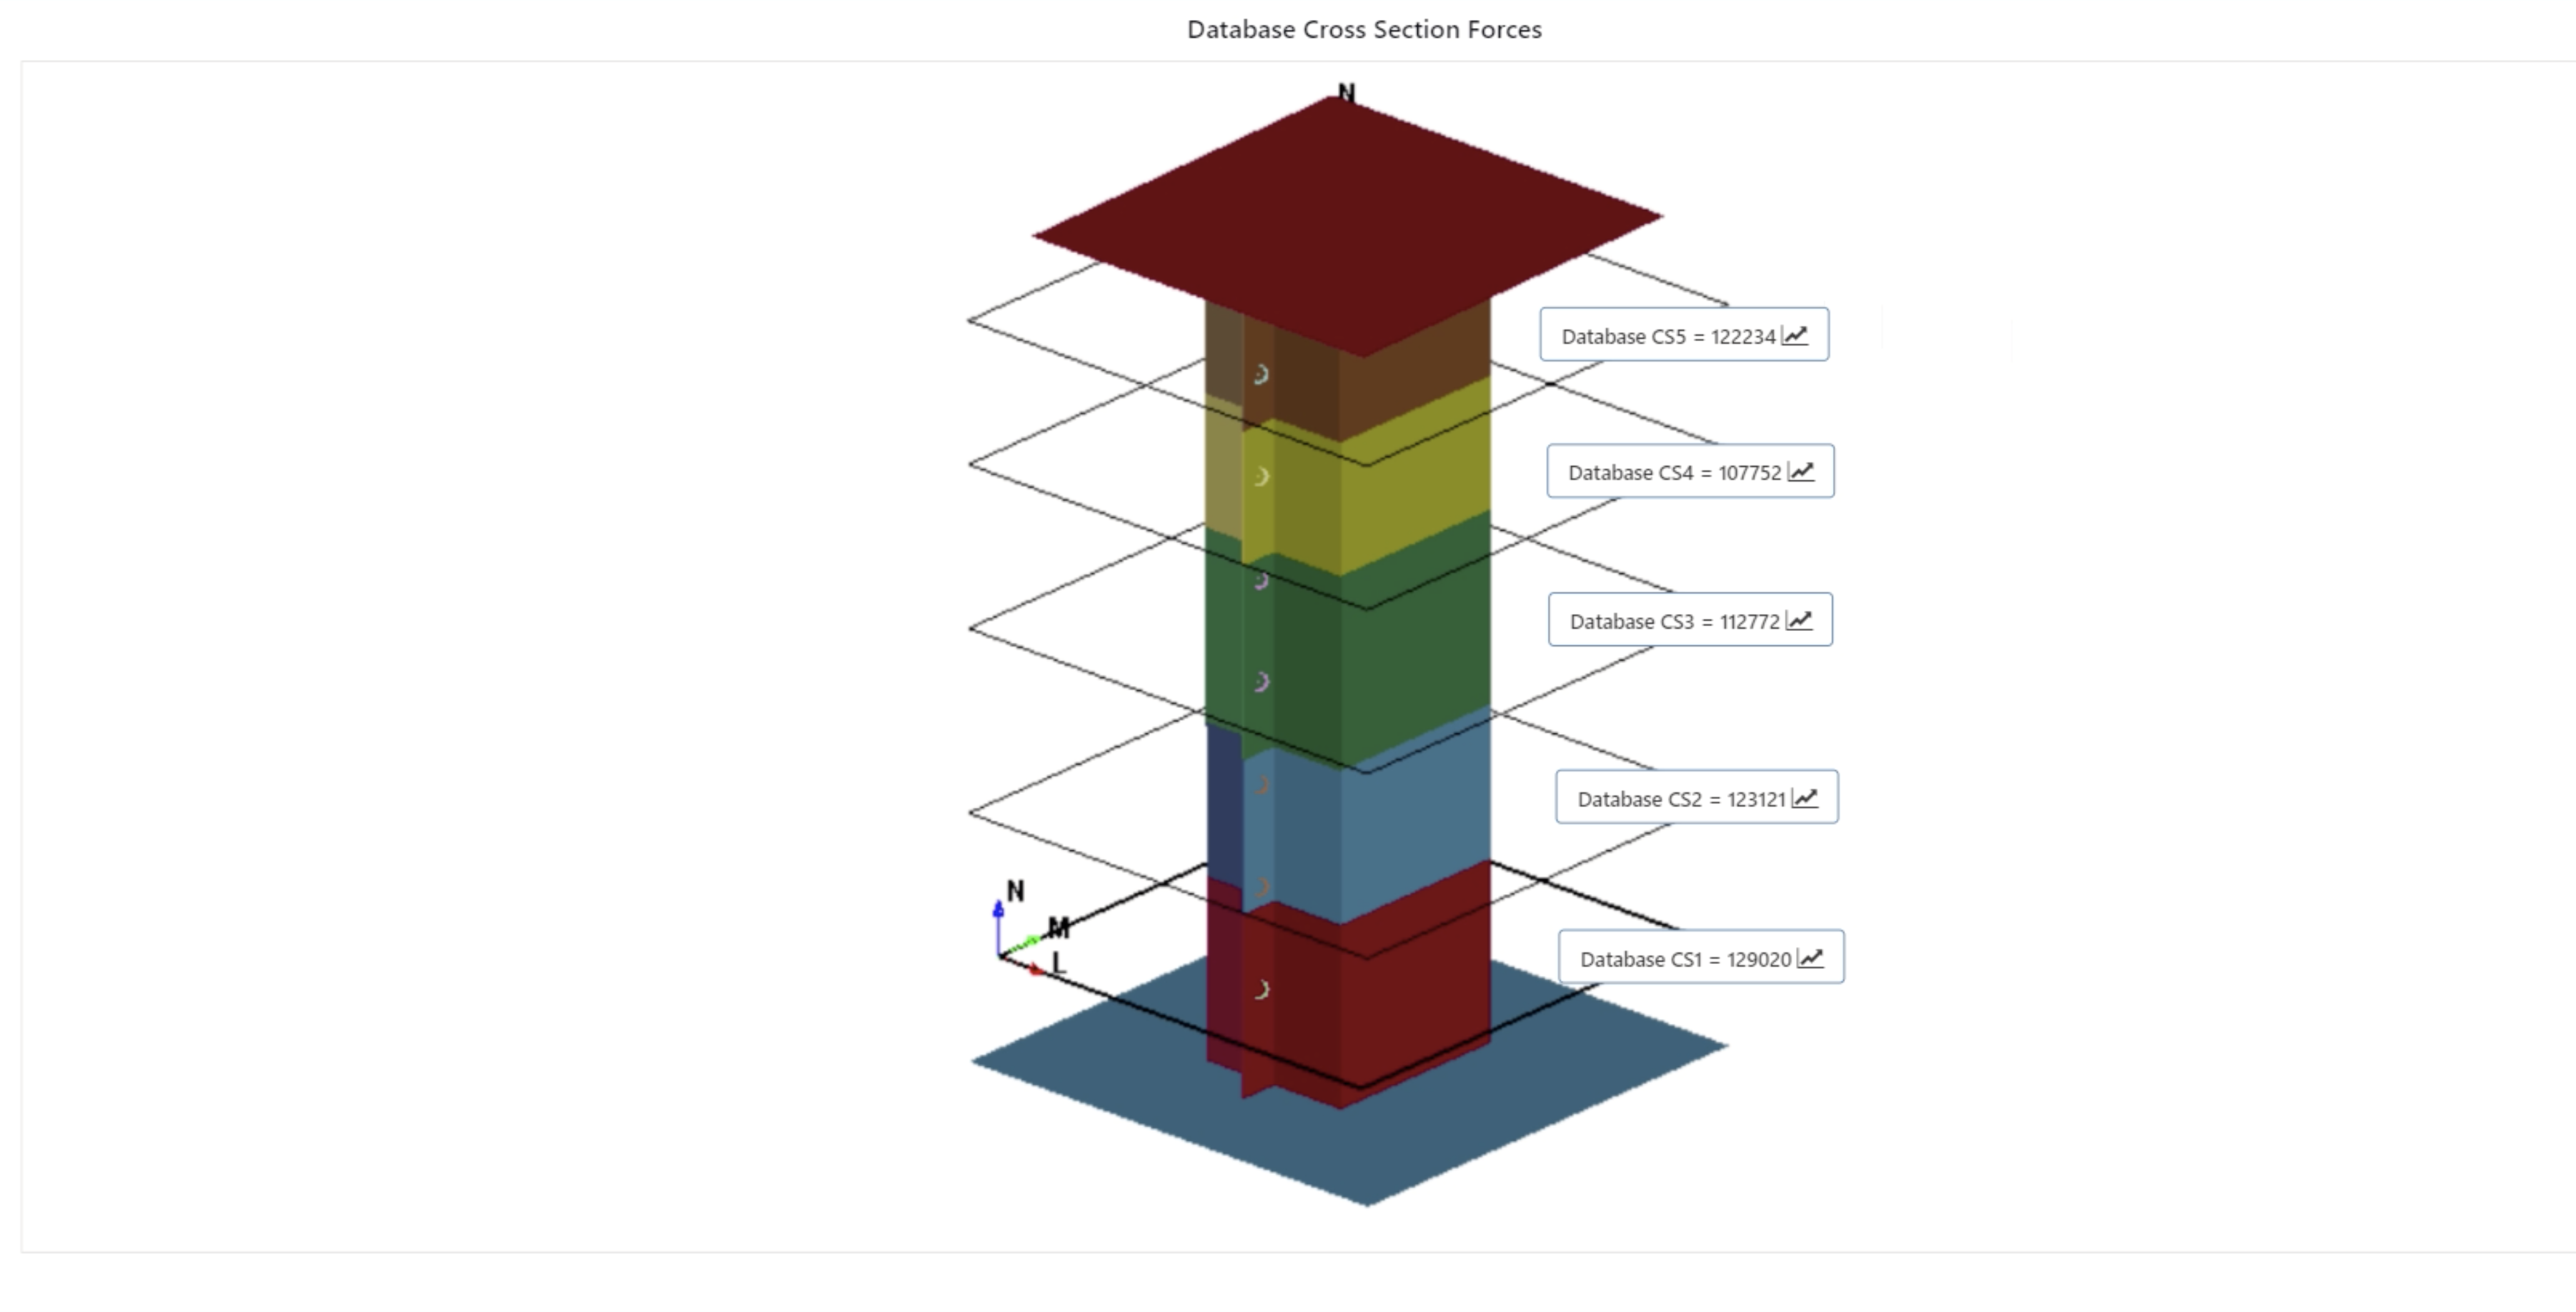
Figure 7: Rail Model Annotated Image
9.3. Other Examples
The following image annotator examples use generic datasets including the ones found under Chart Examples.
Car Release
The Car Release dataset explores the release of car brands based on programs and platforms. Here is an image annotation showing the release summary.
Here is our final annotated image for the Car Release dataset.
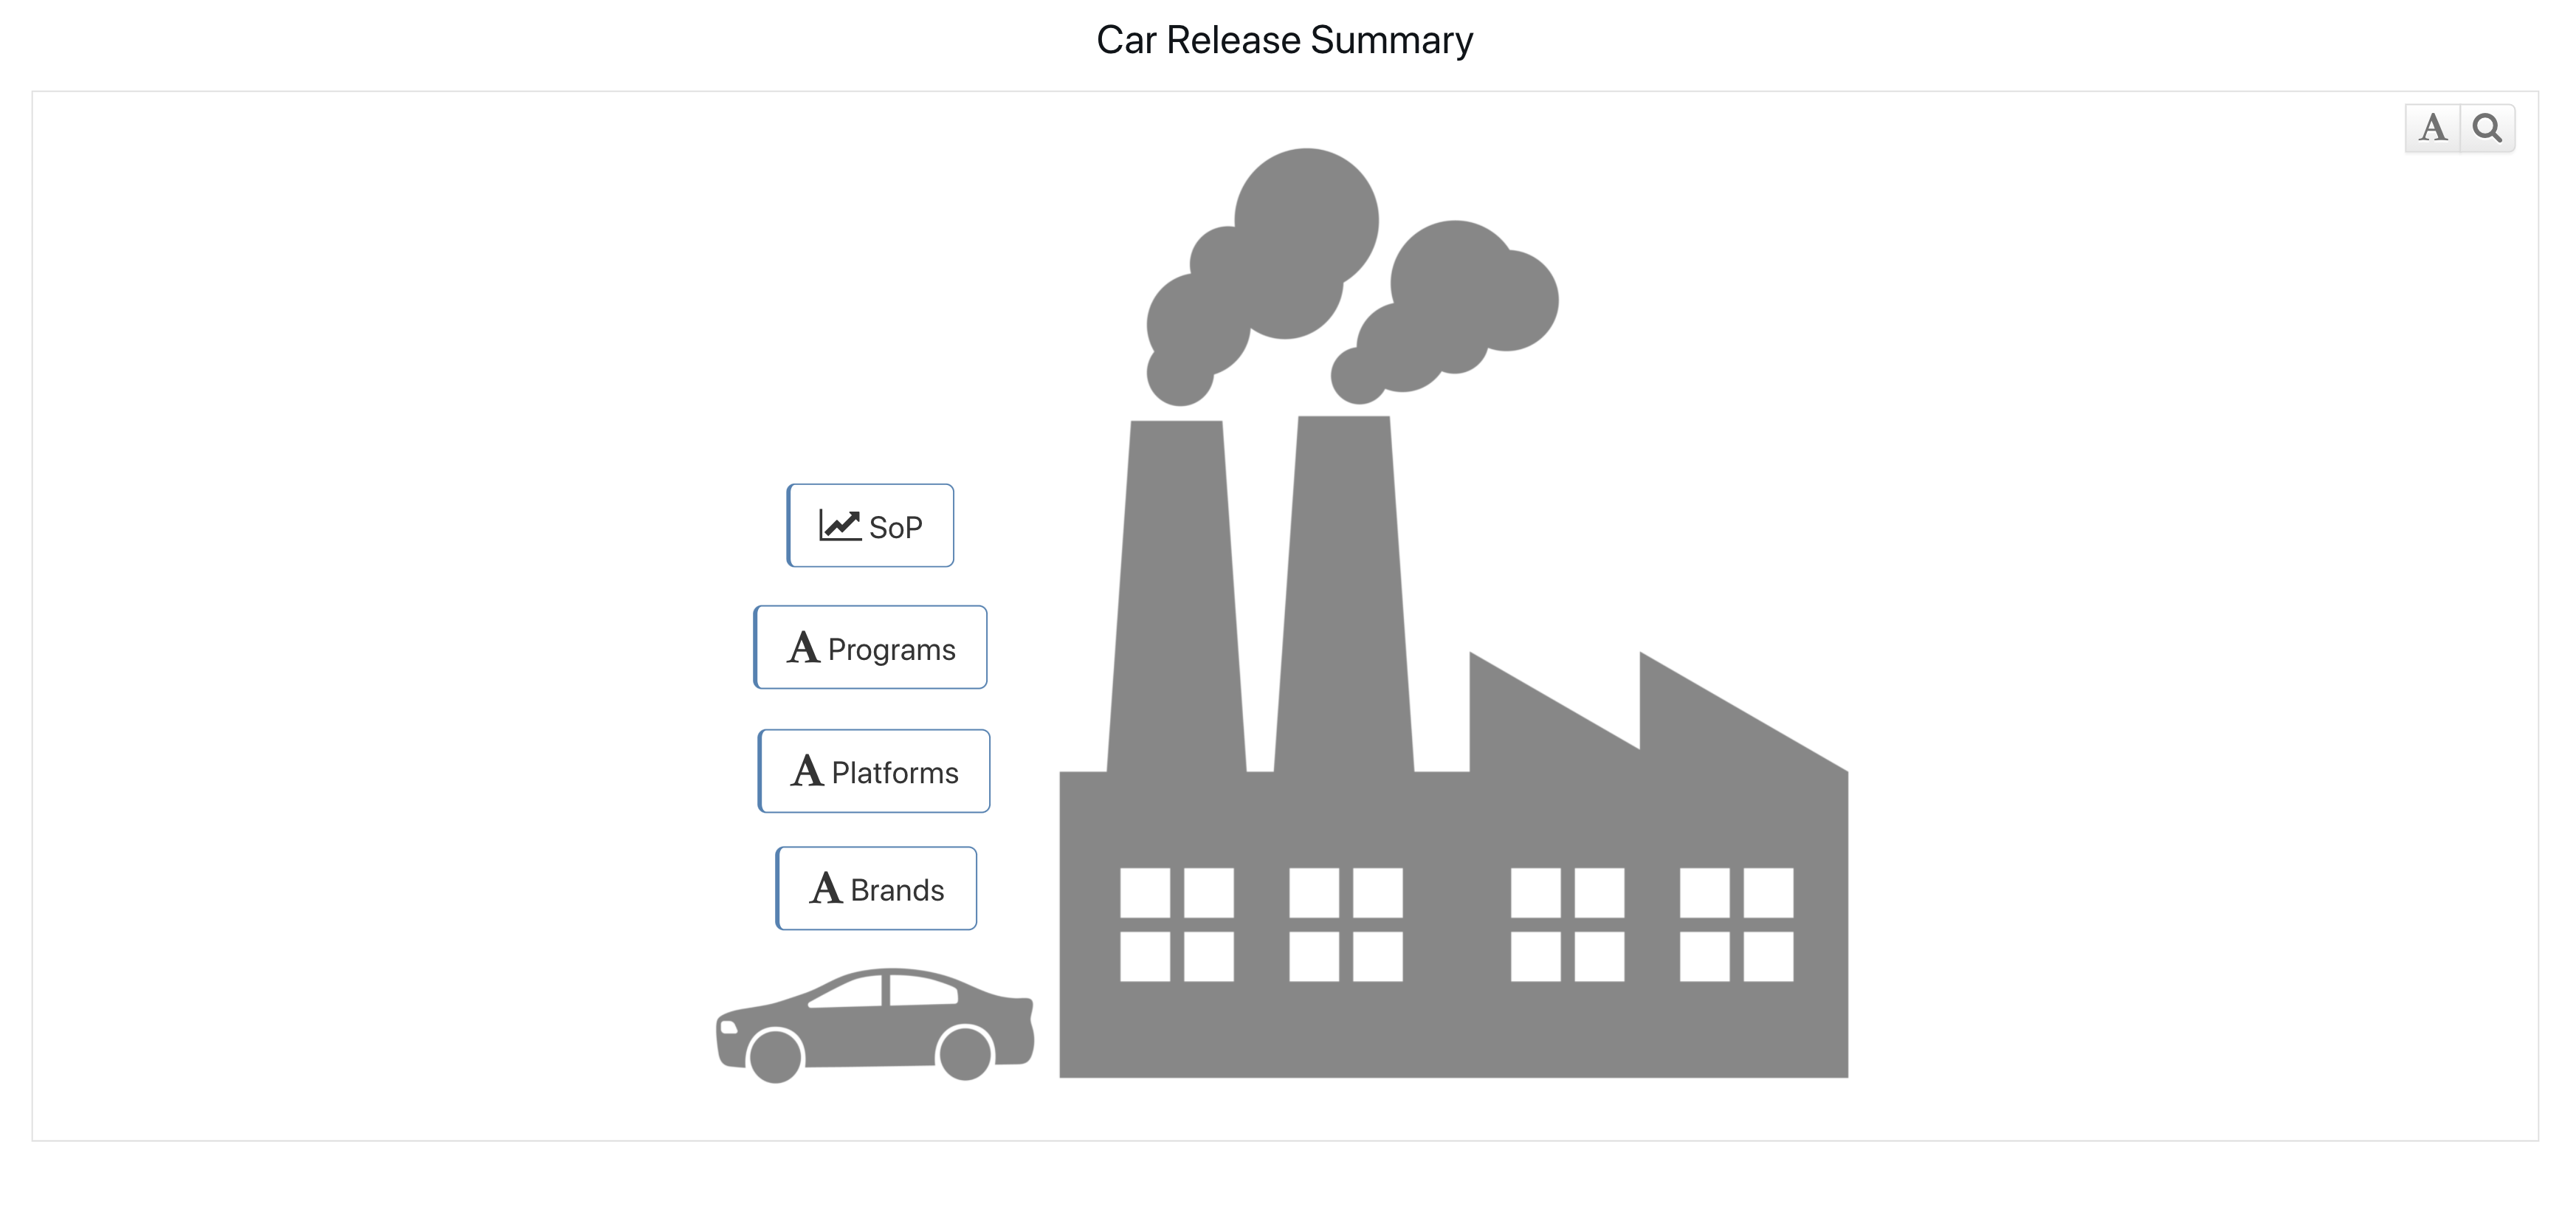
Figure 8: Car Release Annotated Image
NFL Teams
The NFL Teams dataset explores the points and yards statistics for each team. Here is an image annotation showing yard stats.
Here is our final annotated image for the NFL Teams dataset.
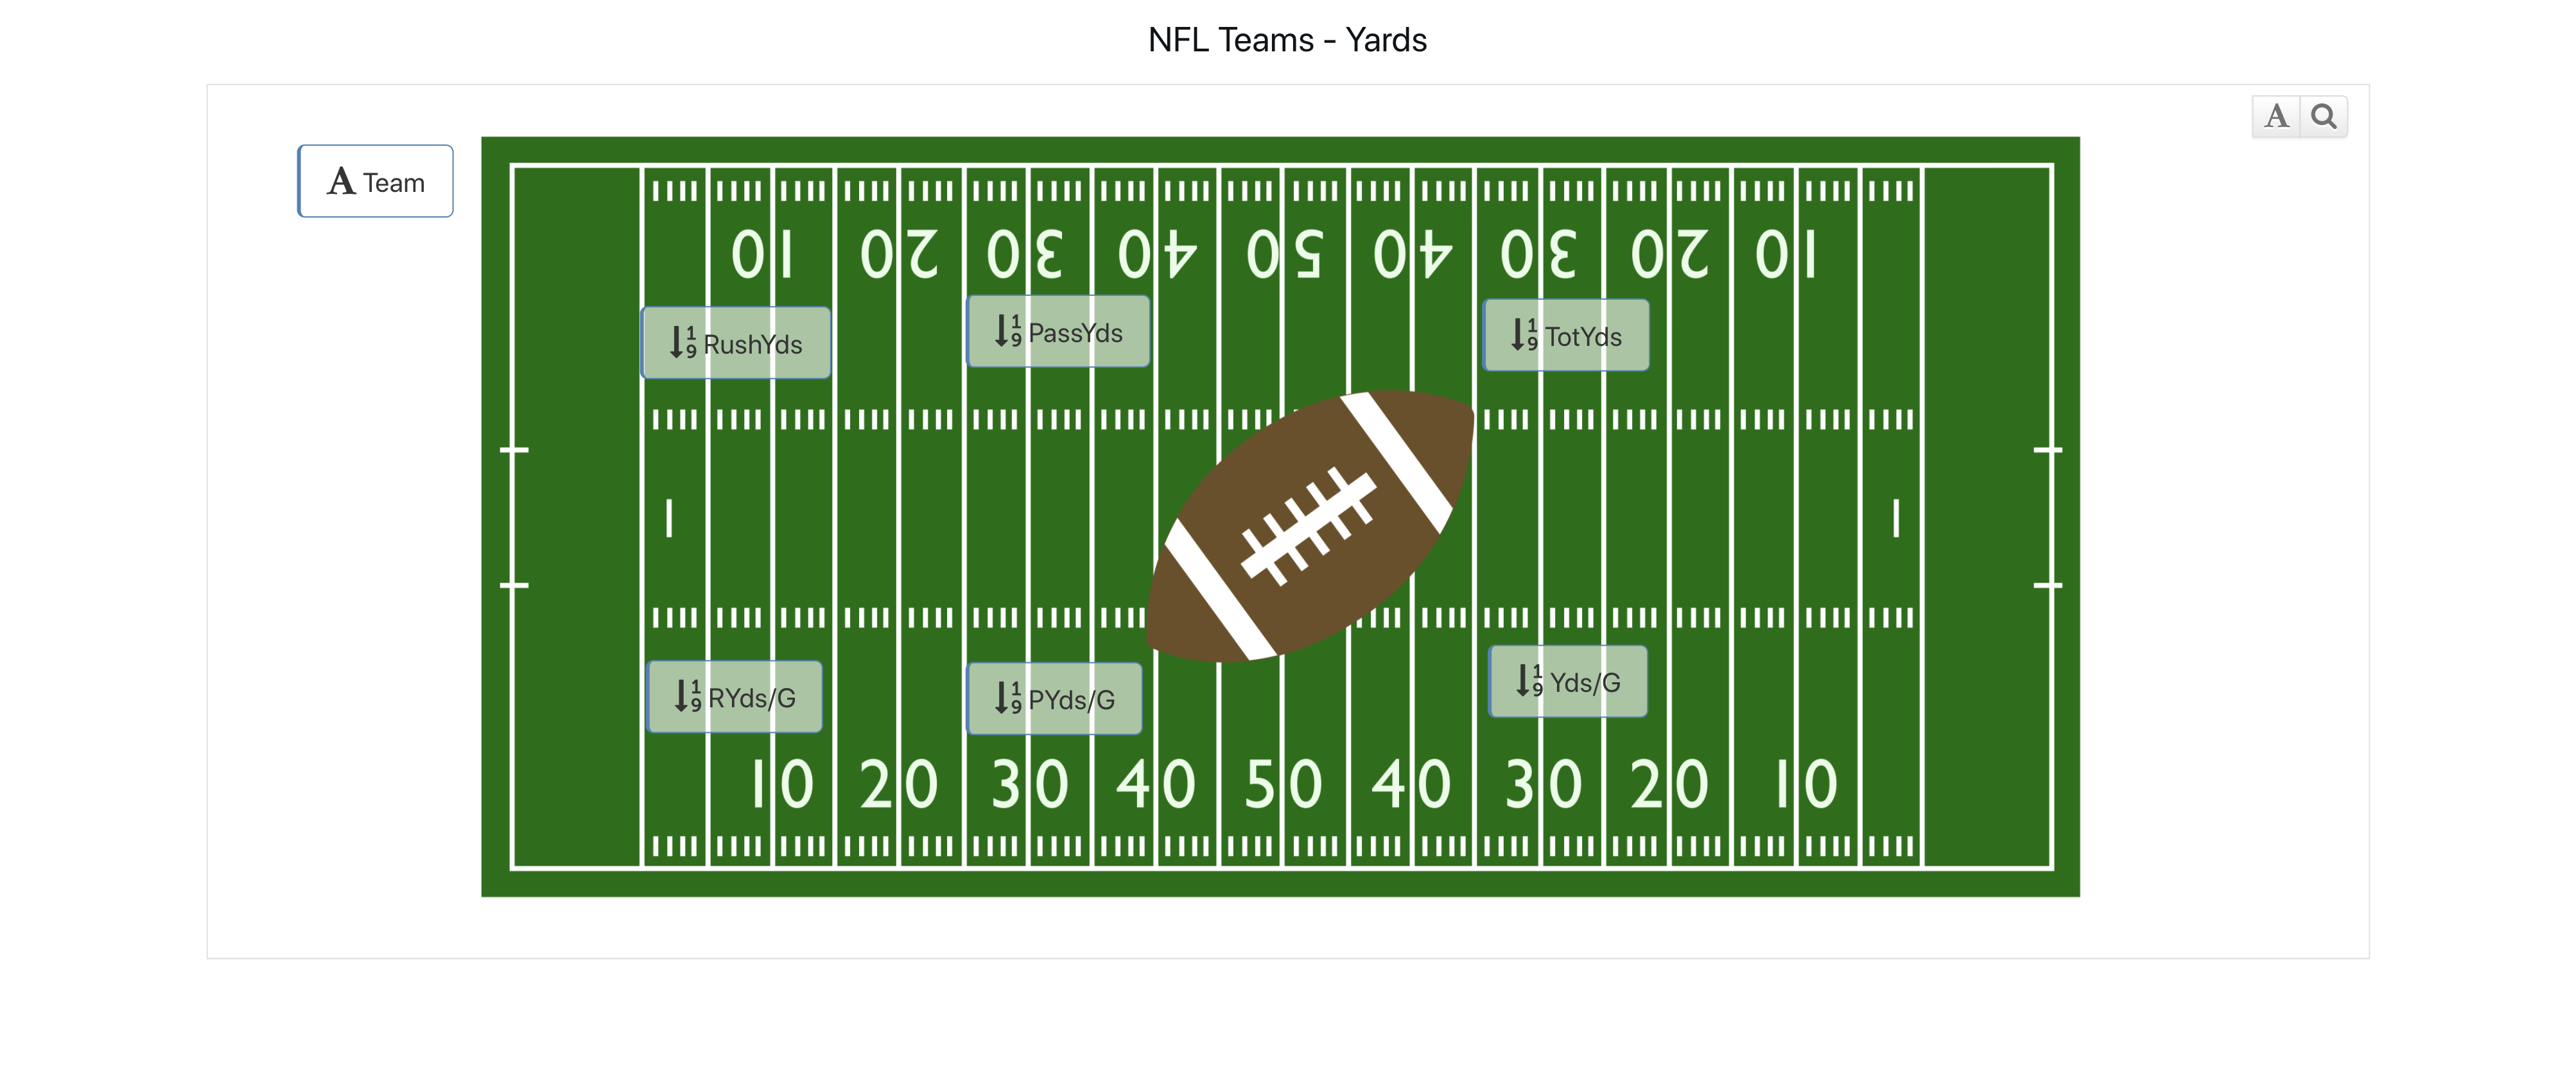
Figure 9: NFL Teams Annotated Image
UFO Sightings
The UFO Sightings dataset explores location, duration, shape and comments of the sightings. Here is an image annotation showing the location, duration and shape.
Here is our final annotated image for the UFO Sightings dataset.
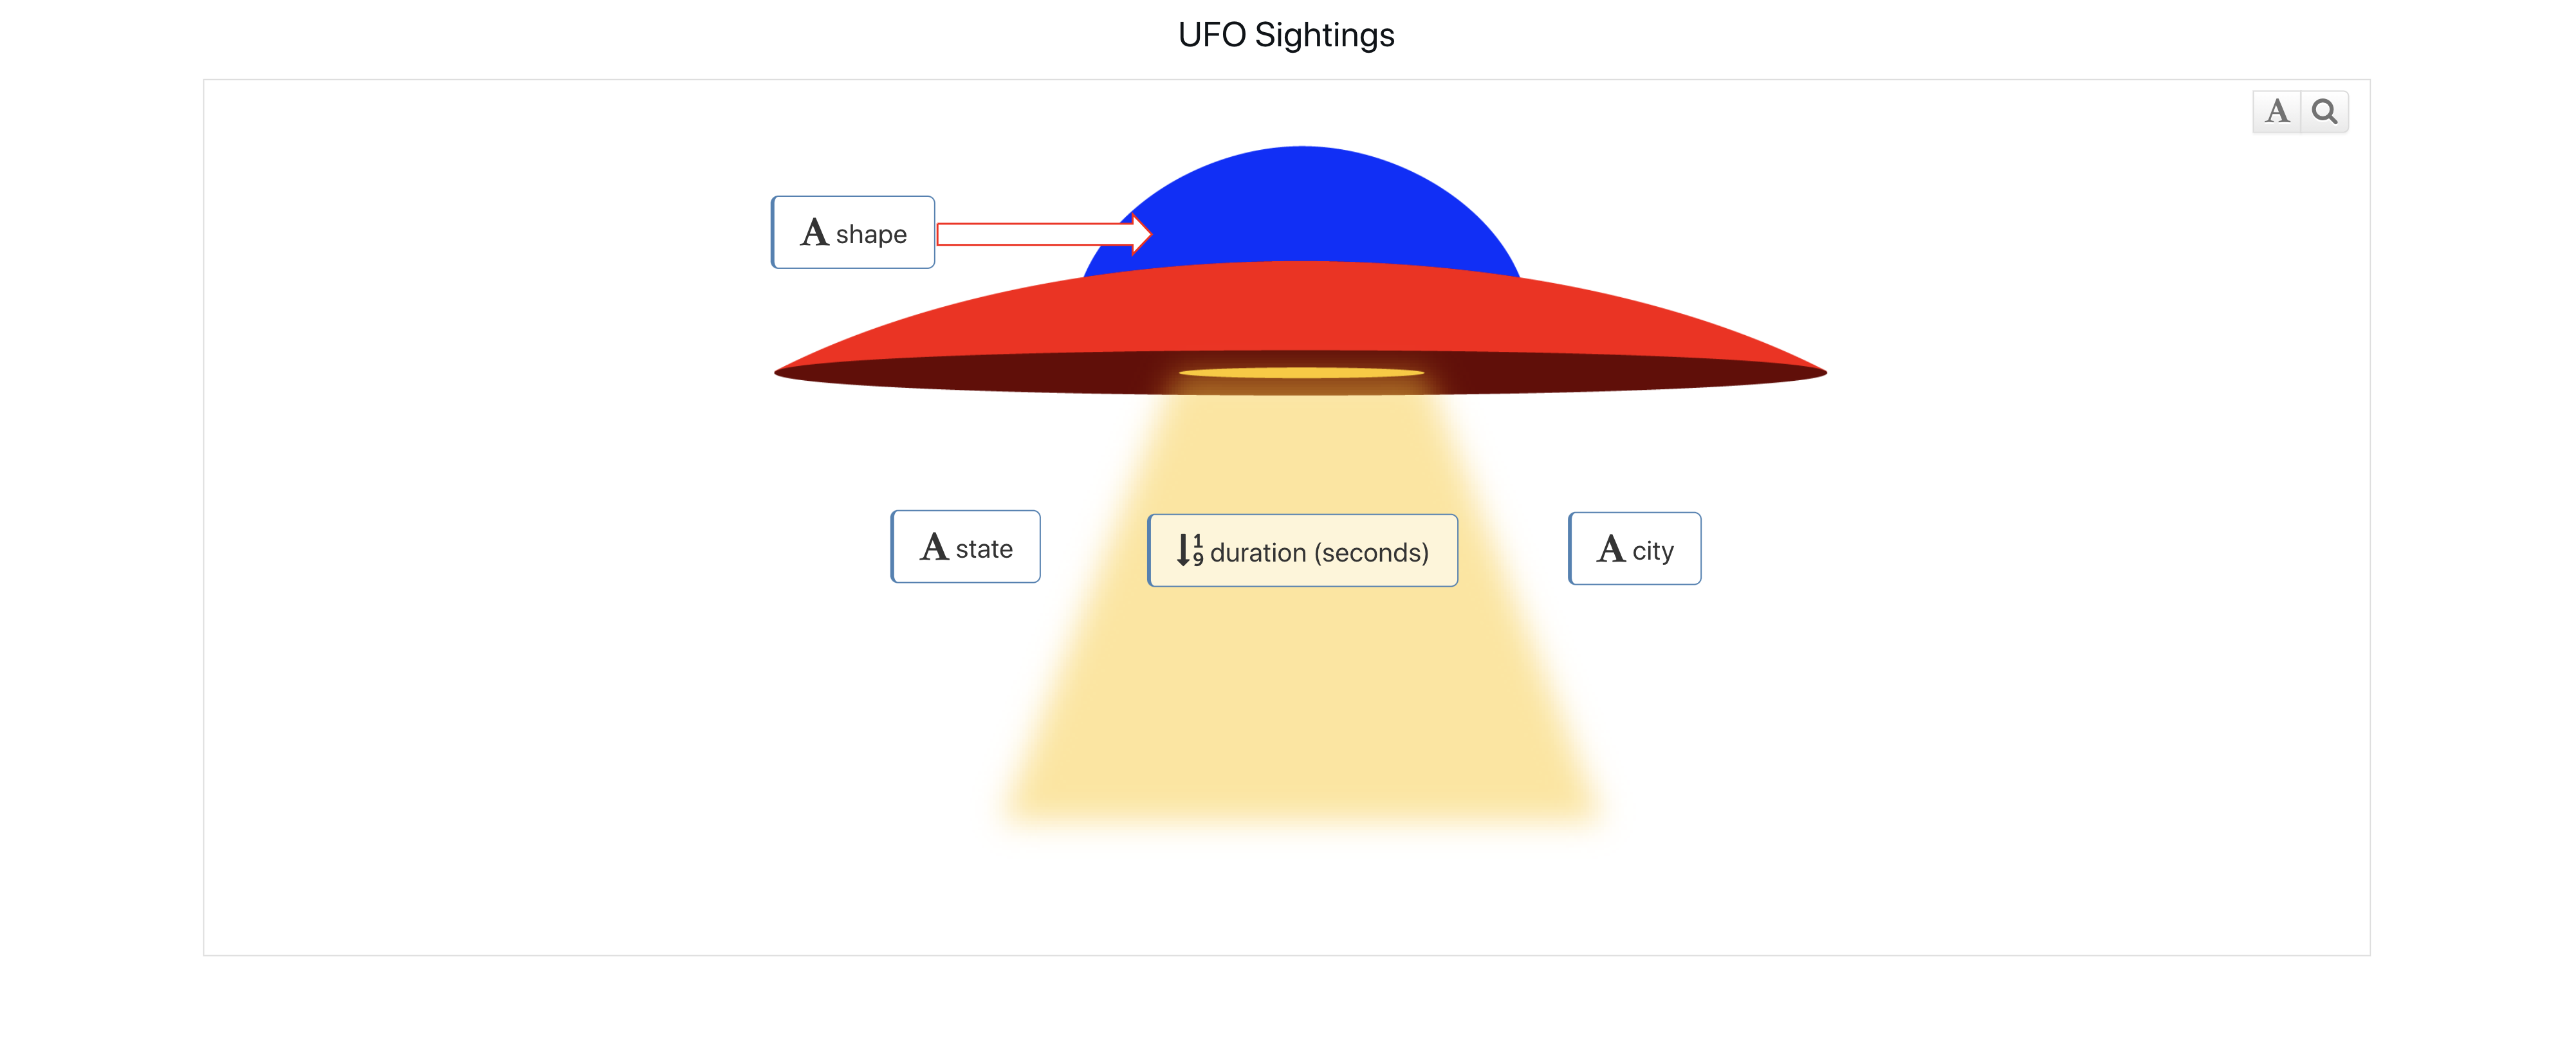
Figure 10: UFO Sightings Annotated Image
Breakfast Cereals
The Breakfast Cereals dataset explores nutritional values of popular cereals. Here is an image annotation showing calories, sugars, protein and fiber.
Here is our final annotated image for the Breakfast Cereals dataset.
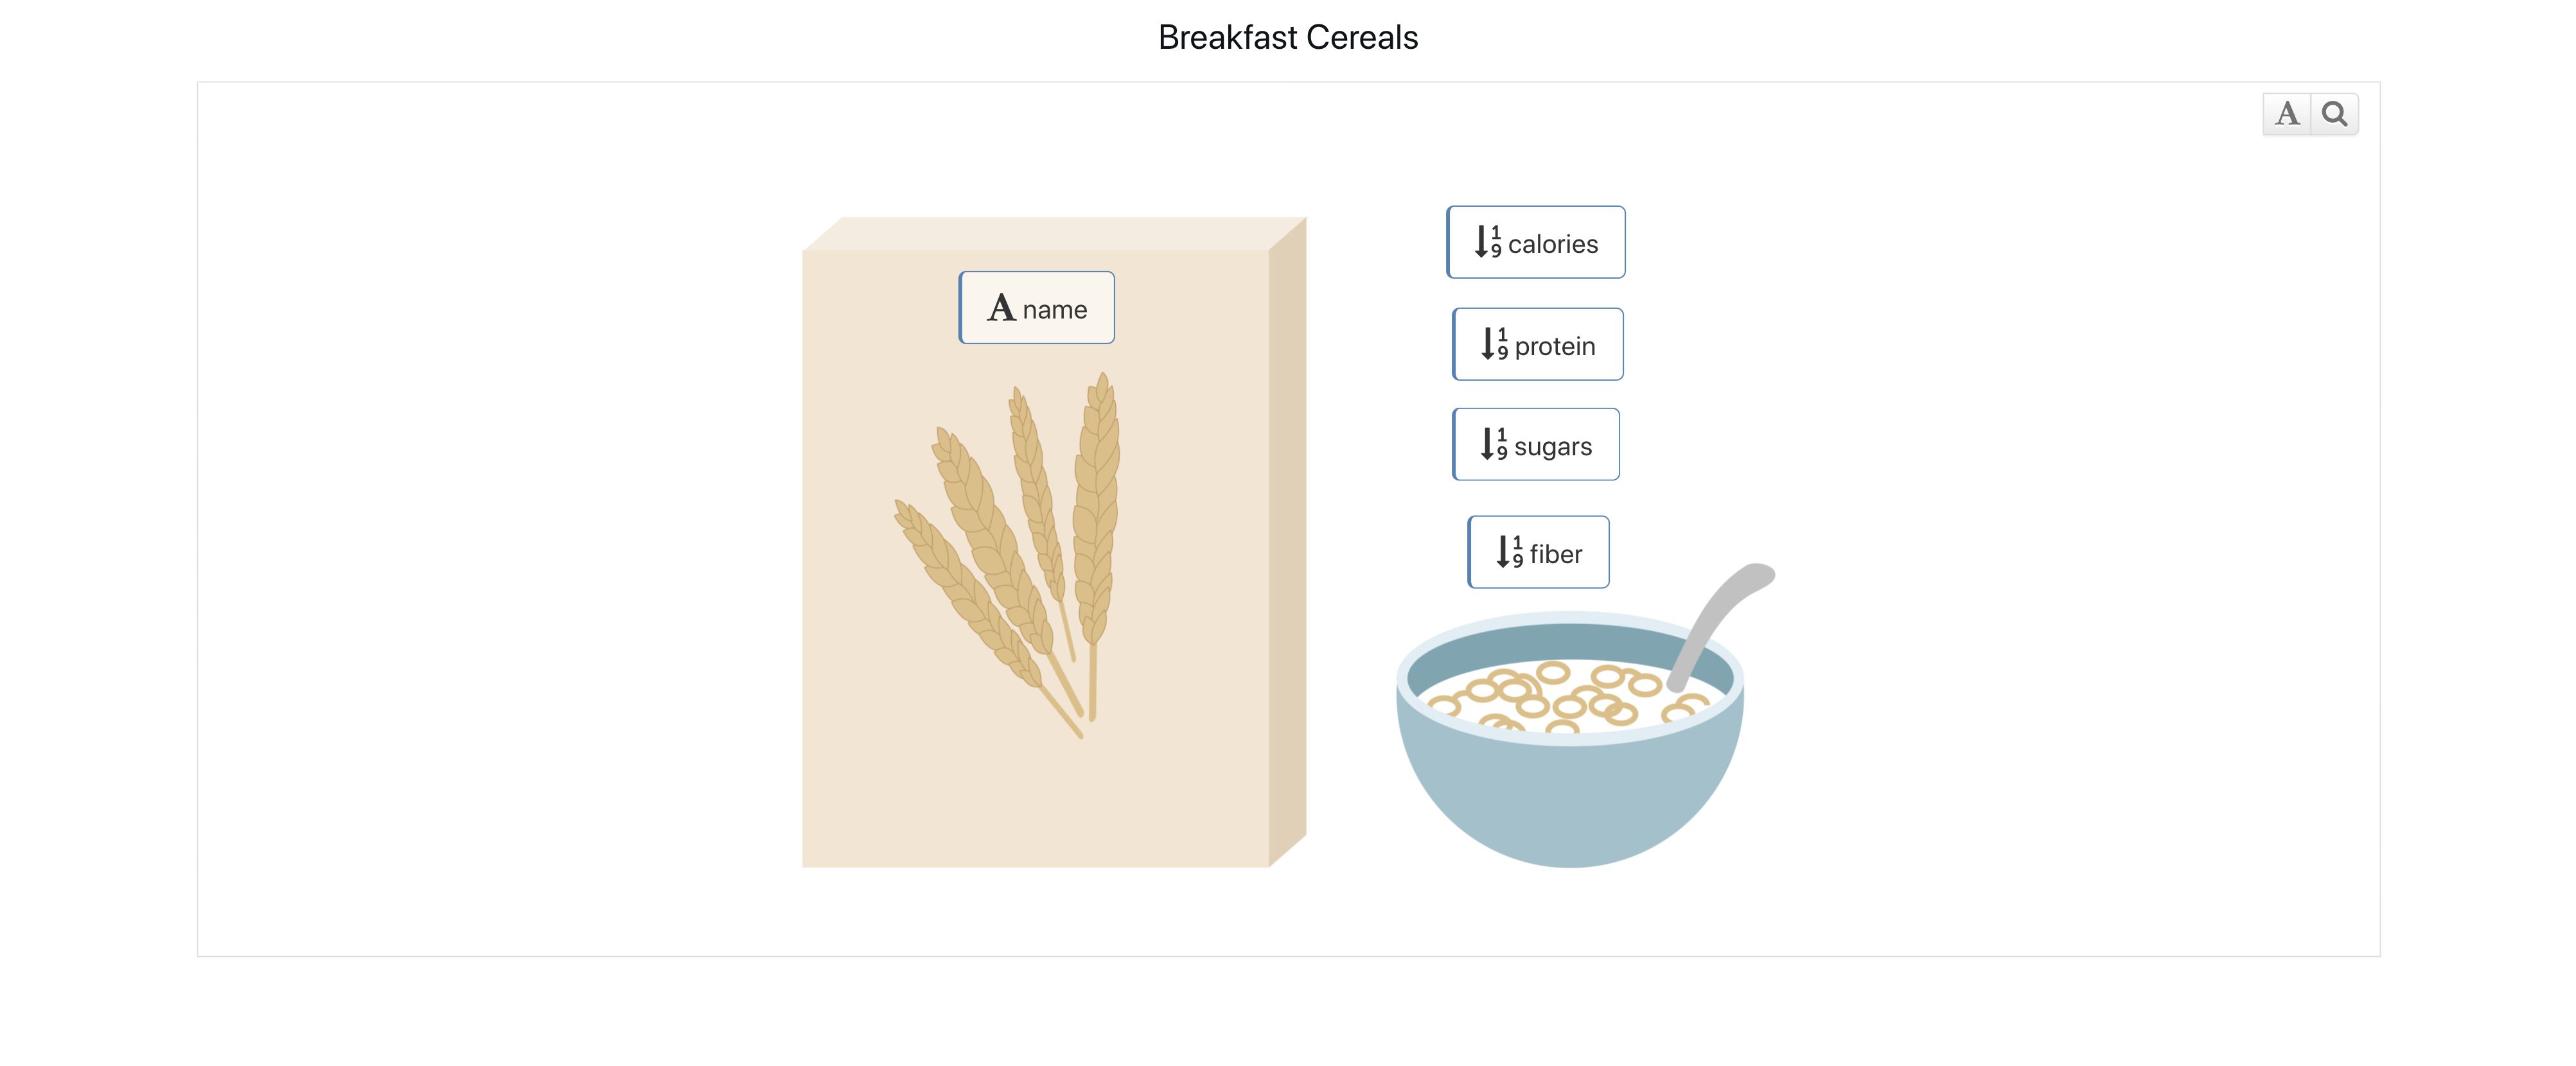
Figure 11: Breakfast Cereal Annotated Image
Michigan Museums
The Michigan Museums dataset explores different types of museums and their finances. Here is an image annotation showing city, type, income and revenue.
Here is our final annotated image for the Michigan Museums dataset.
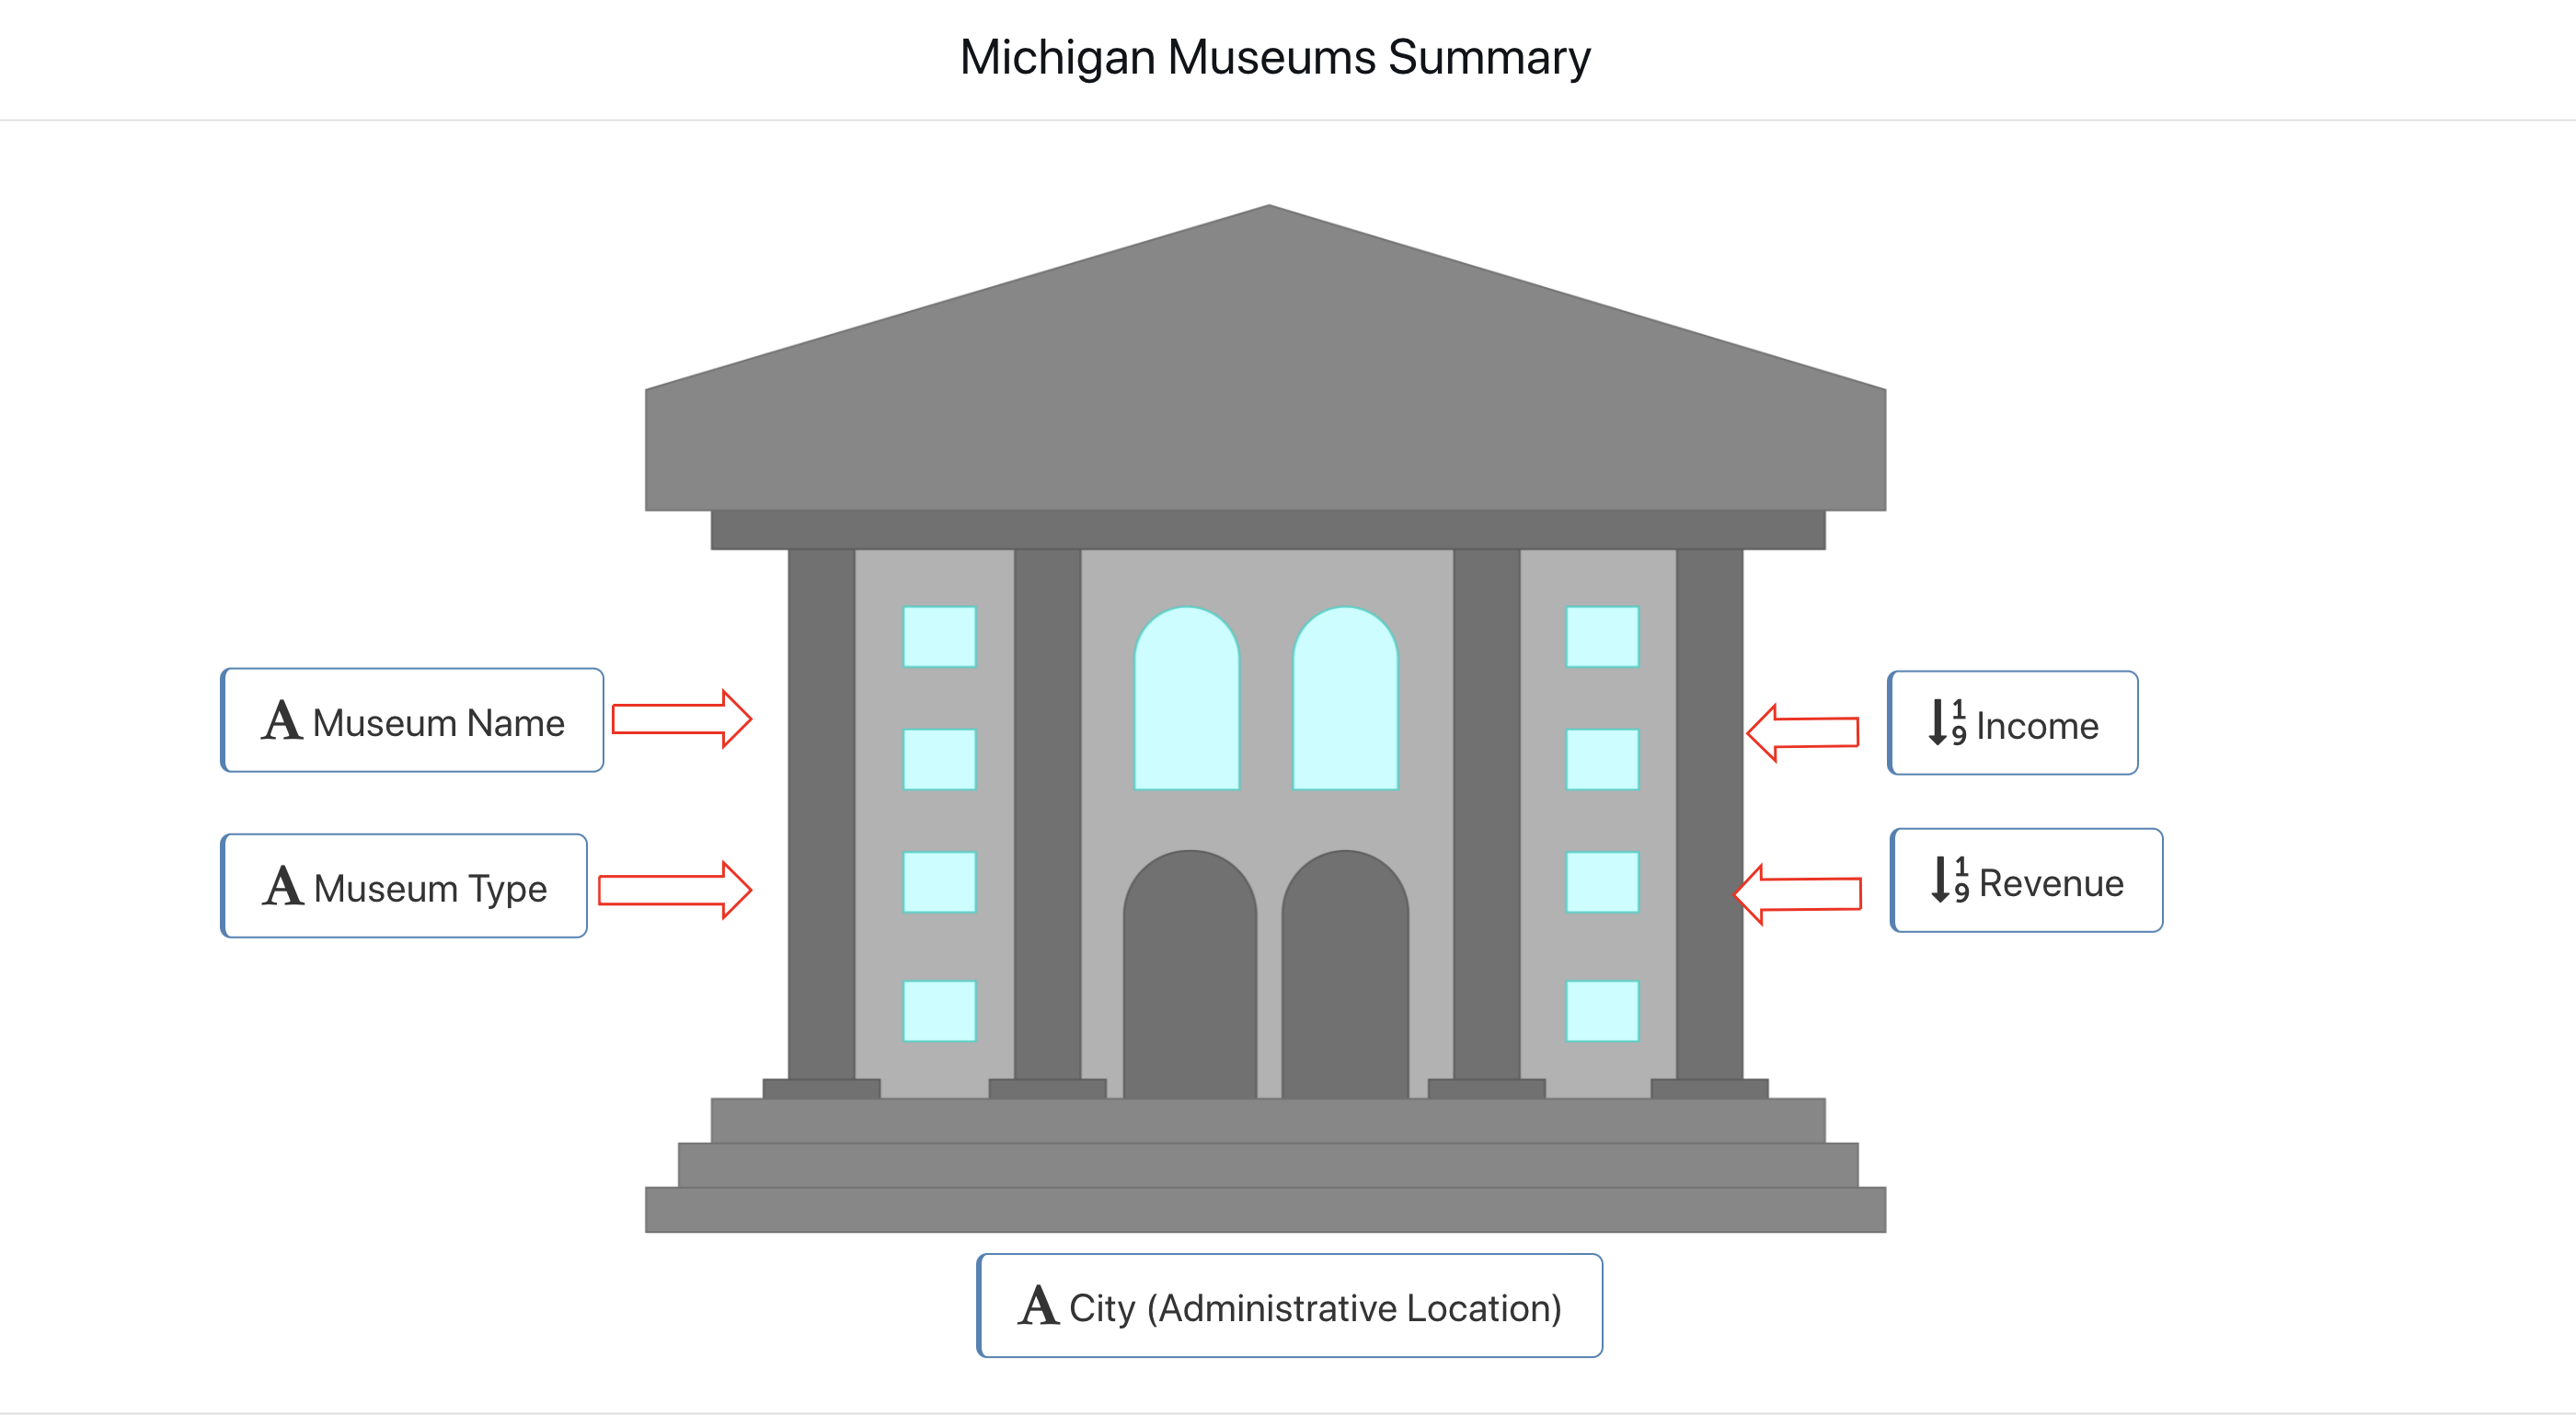
Figure 12: Michigan Museum Annotated Image
Average Weather
The Average Weather dataset explores yearly averages for European countries. Here is an image annotation showing average temperature, average high, average low and average precipitation.
Here is our final annotated image for the Average Weather dataset.
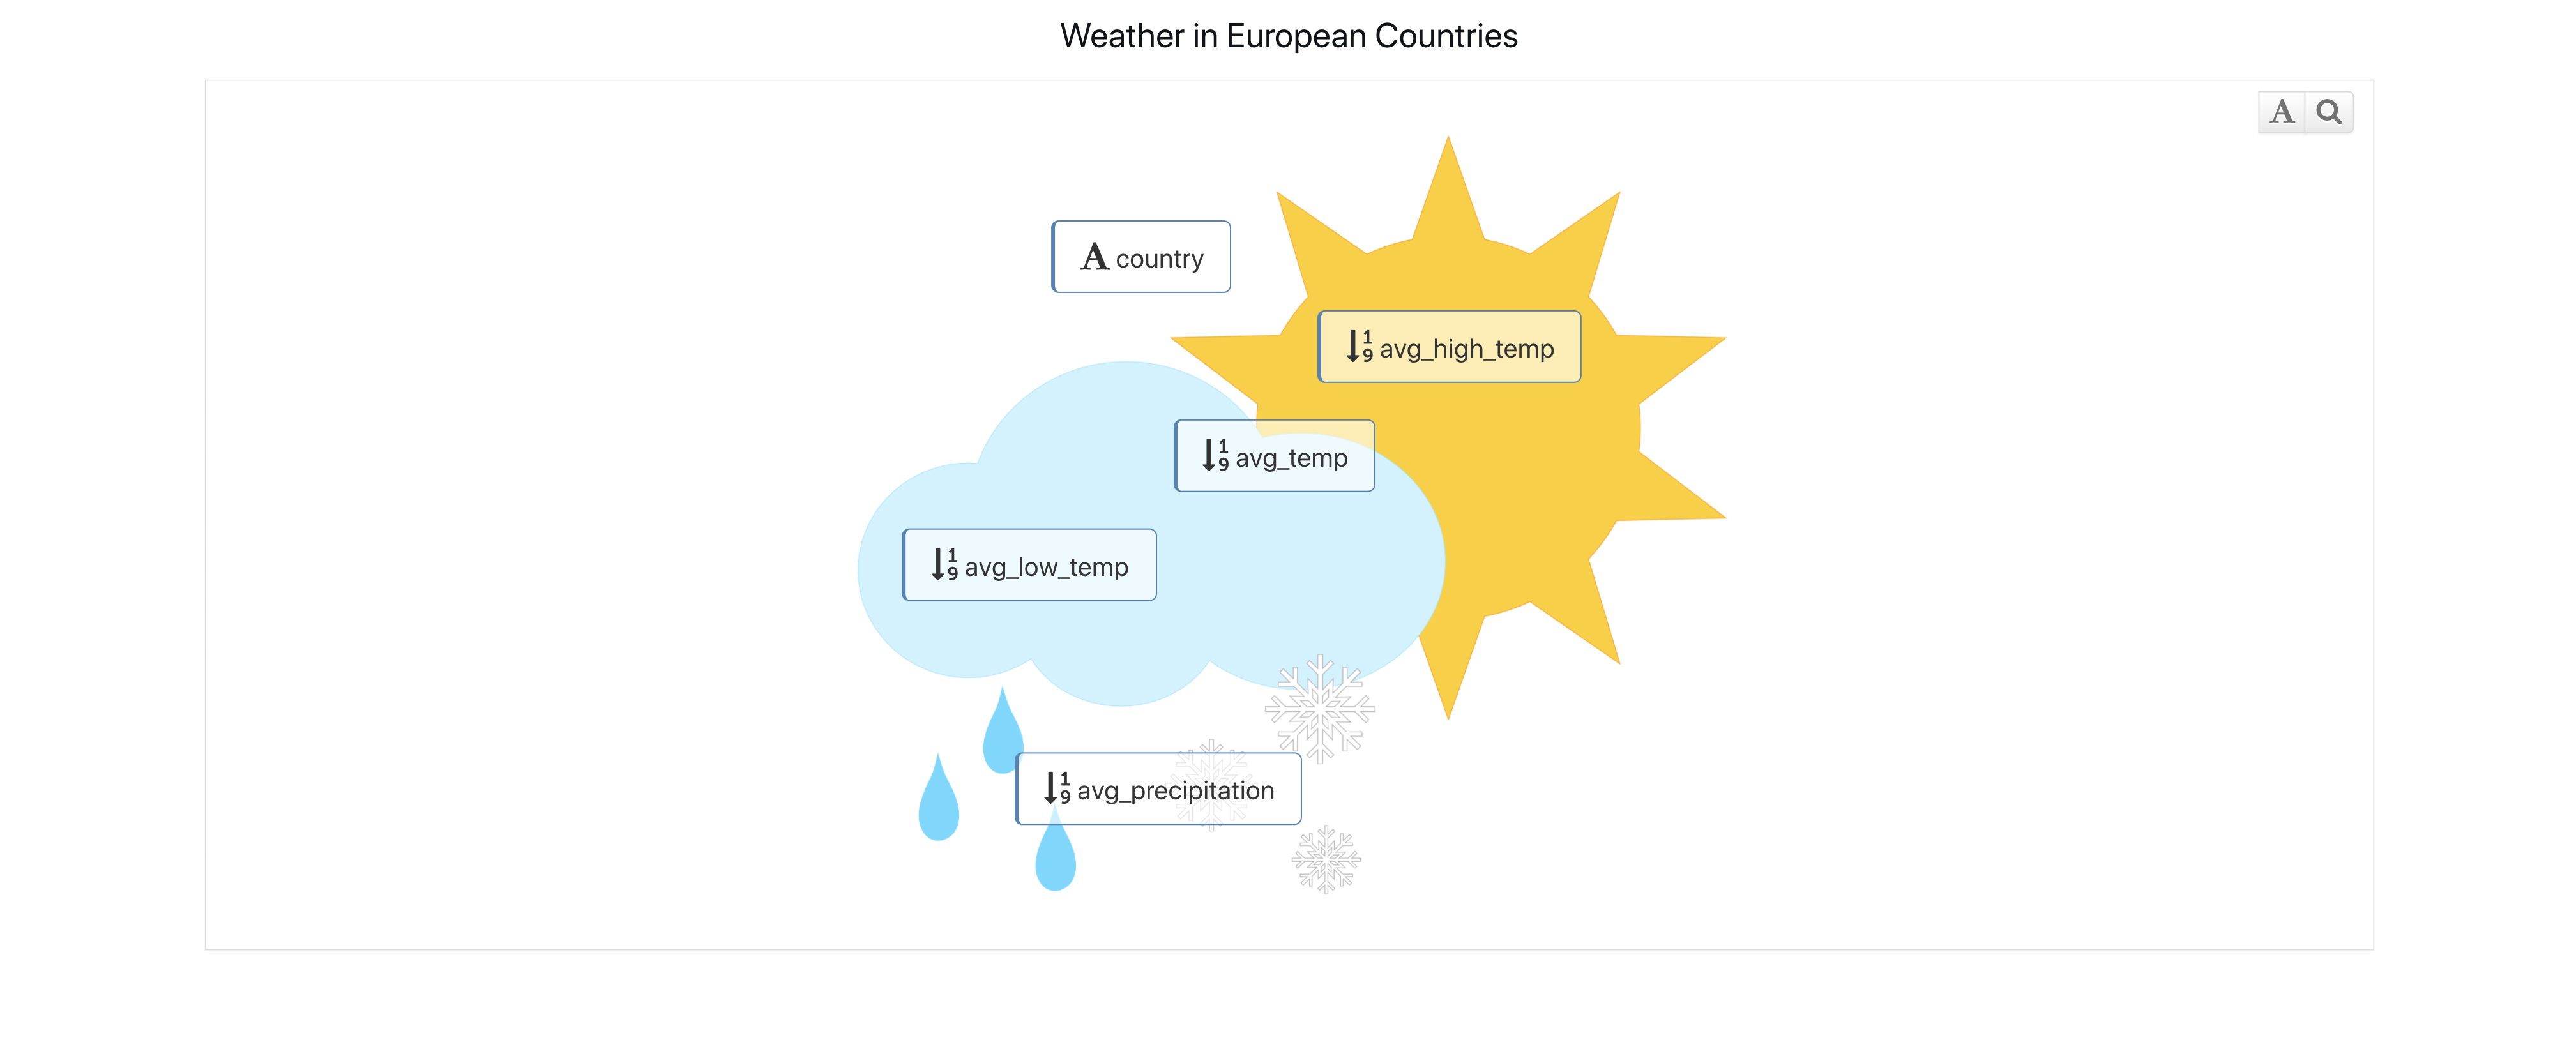
Figure 13: Average Weather Annotated Image
Craft Beers
The Craft Beers dataset explores ABV values and types for American craft beers. Here is an image annotation showing the ABV and beer style.
Here is our final annotated image for the Craft Beers dataset.
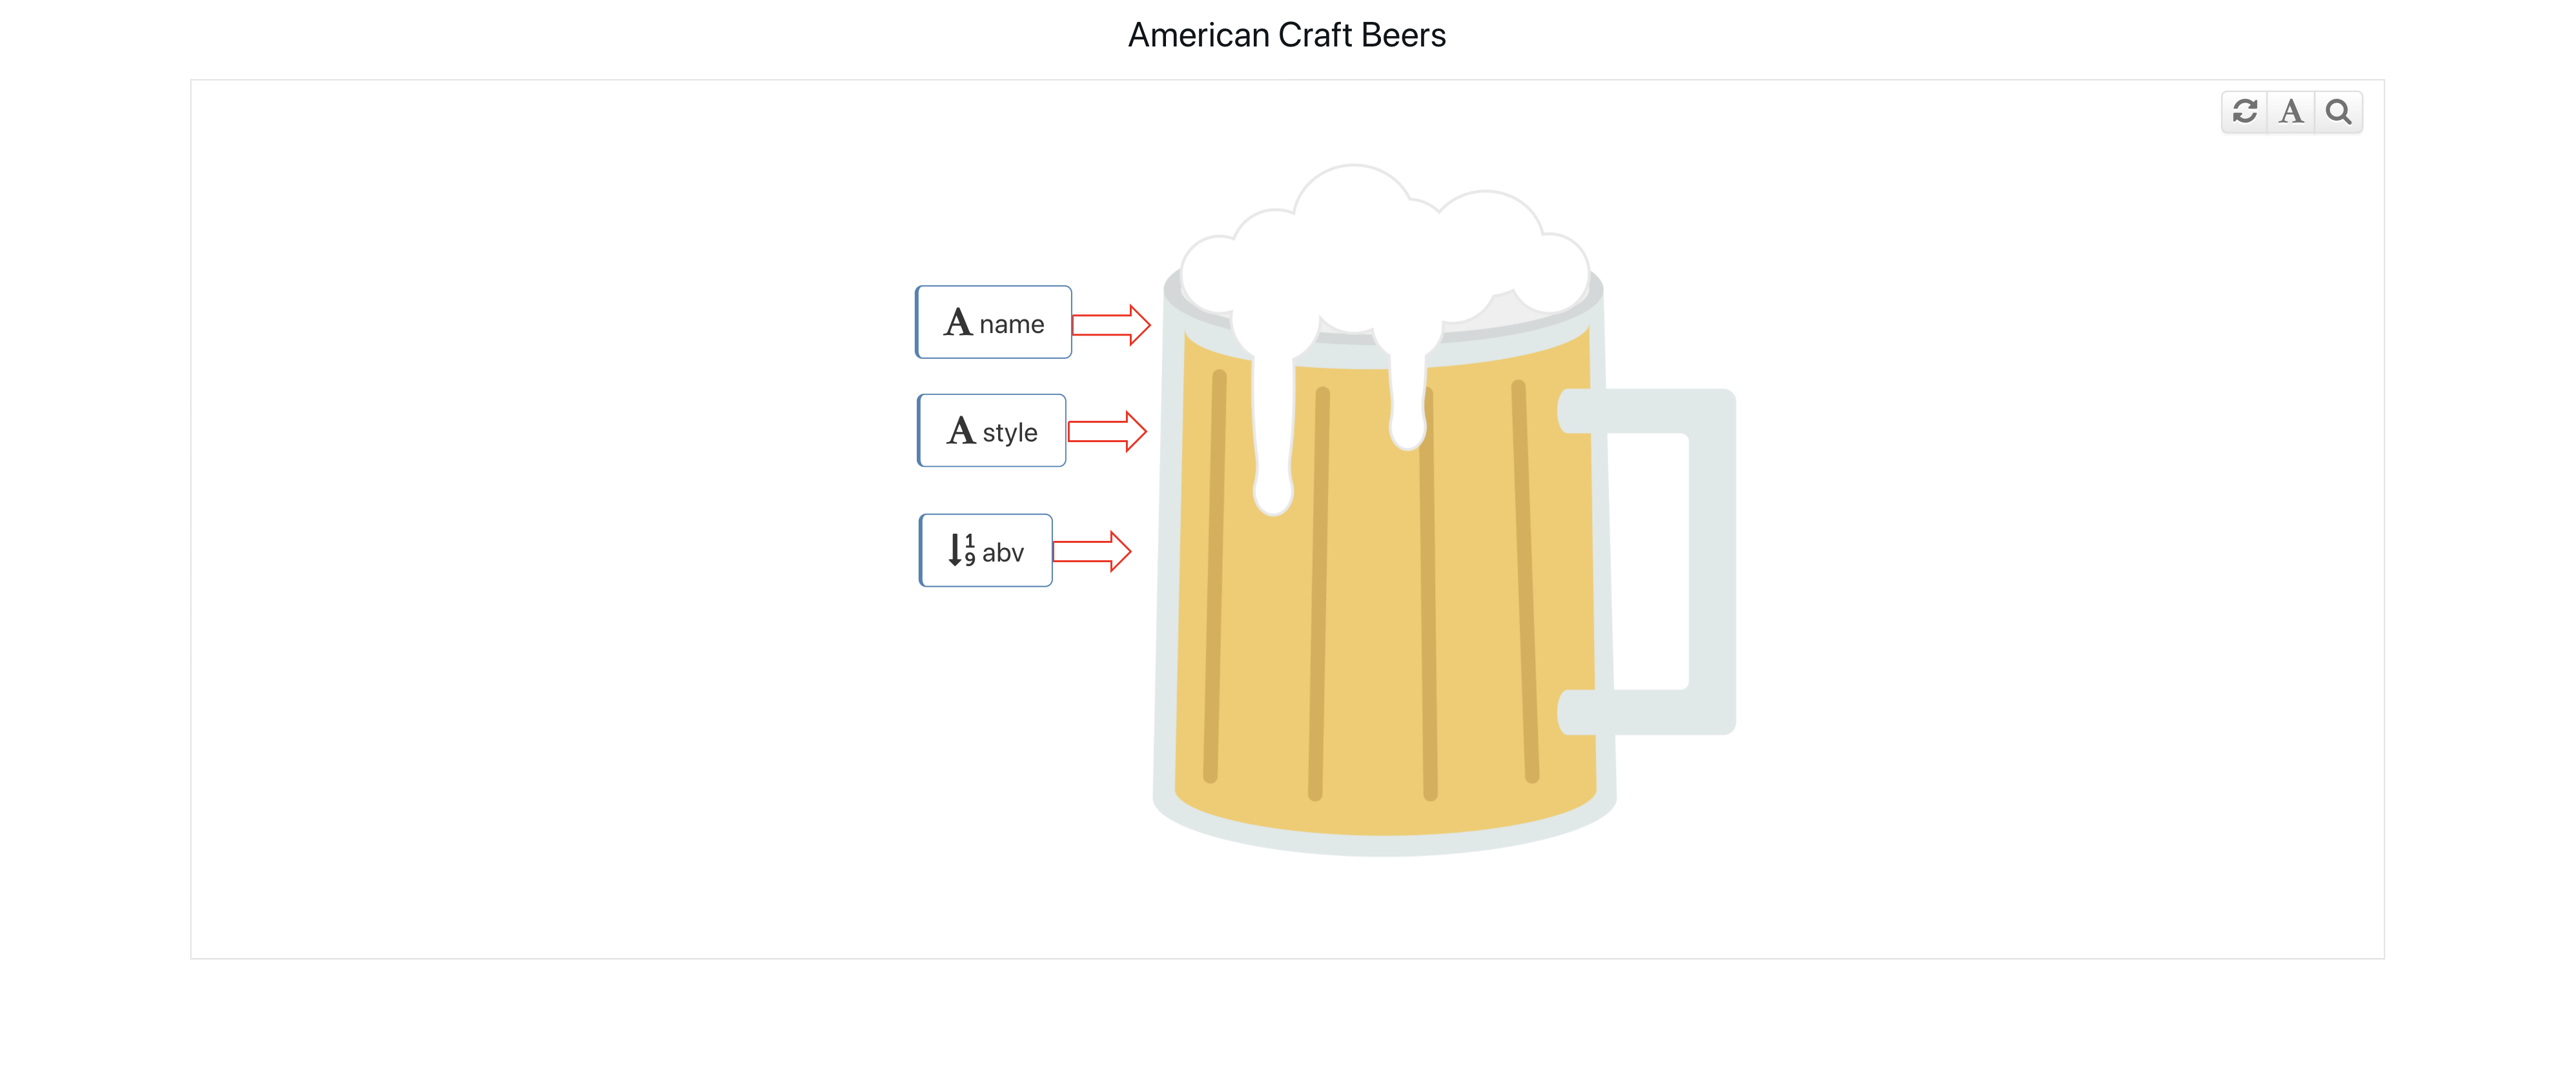
Figure 14: Craft Beers Annotated Image
2020 World Happiness
The 2020 World Happiness dataset explores happiness score values based on a multitude of variables. Here is an image annotation showing the summary of these factors for over 100 different countries.
Here is our final annotated image for the 2020 World Happiness dataset.
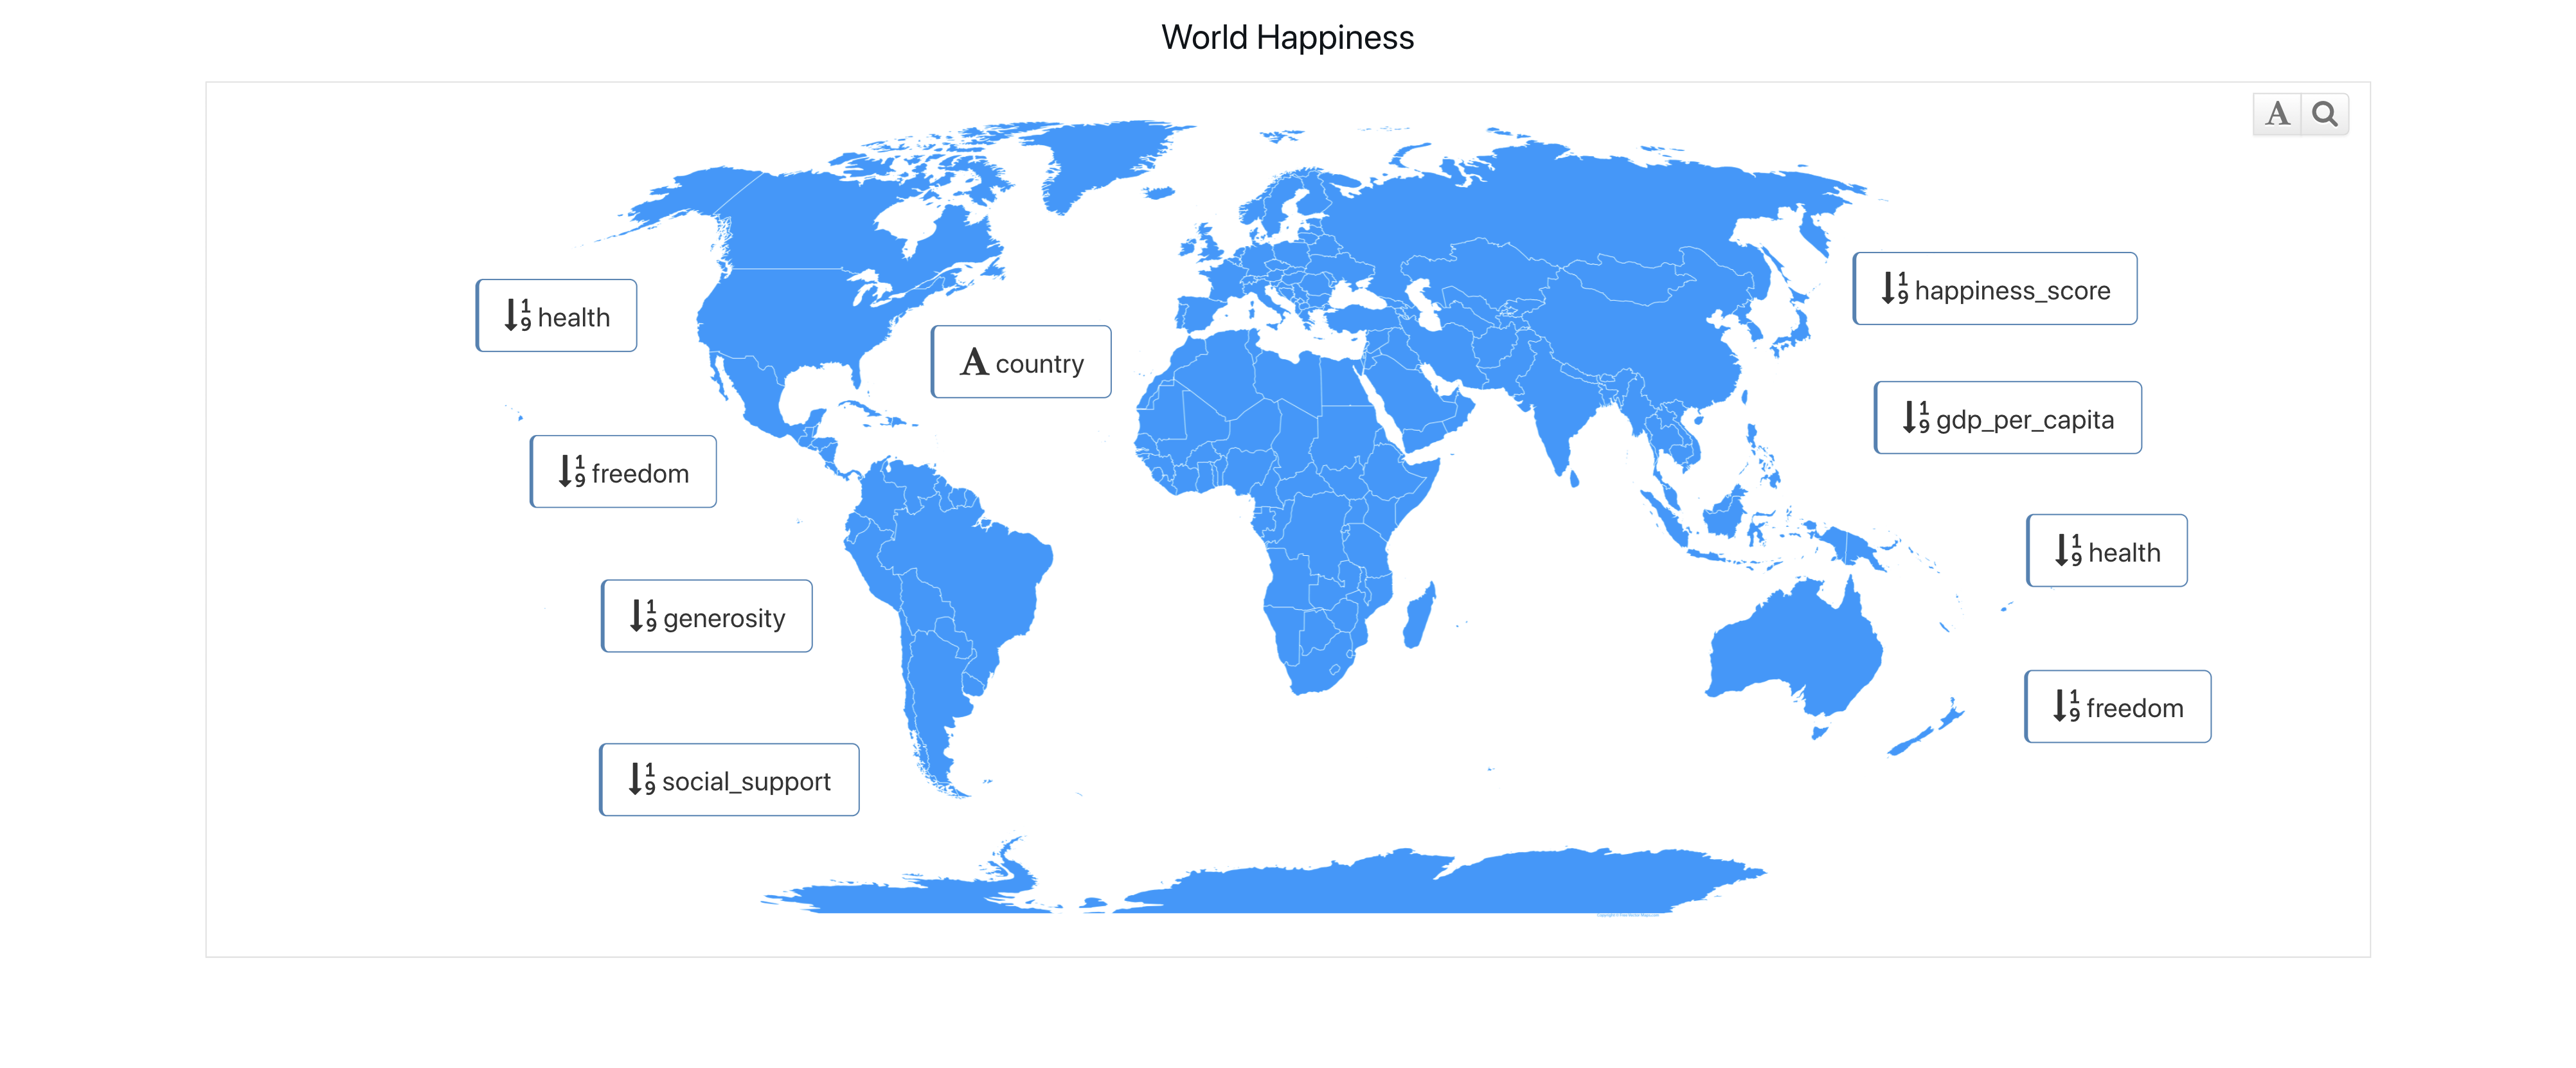
Figure 15: 2020 World Happiness Annotated Image
Head Impact
The Head Impact dataset explores the crash analysis on pedestrian head impact. Here is an image annotation showing hood and bumper forces, mass and peak acceleration.
Here is our final annotated image for the Head Impact dataset.
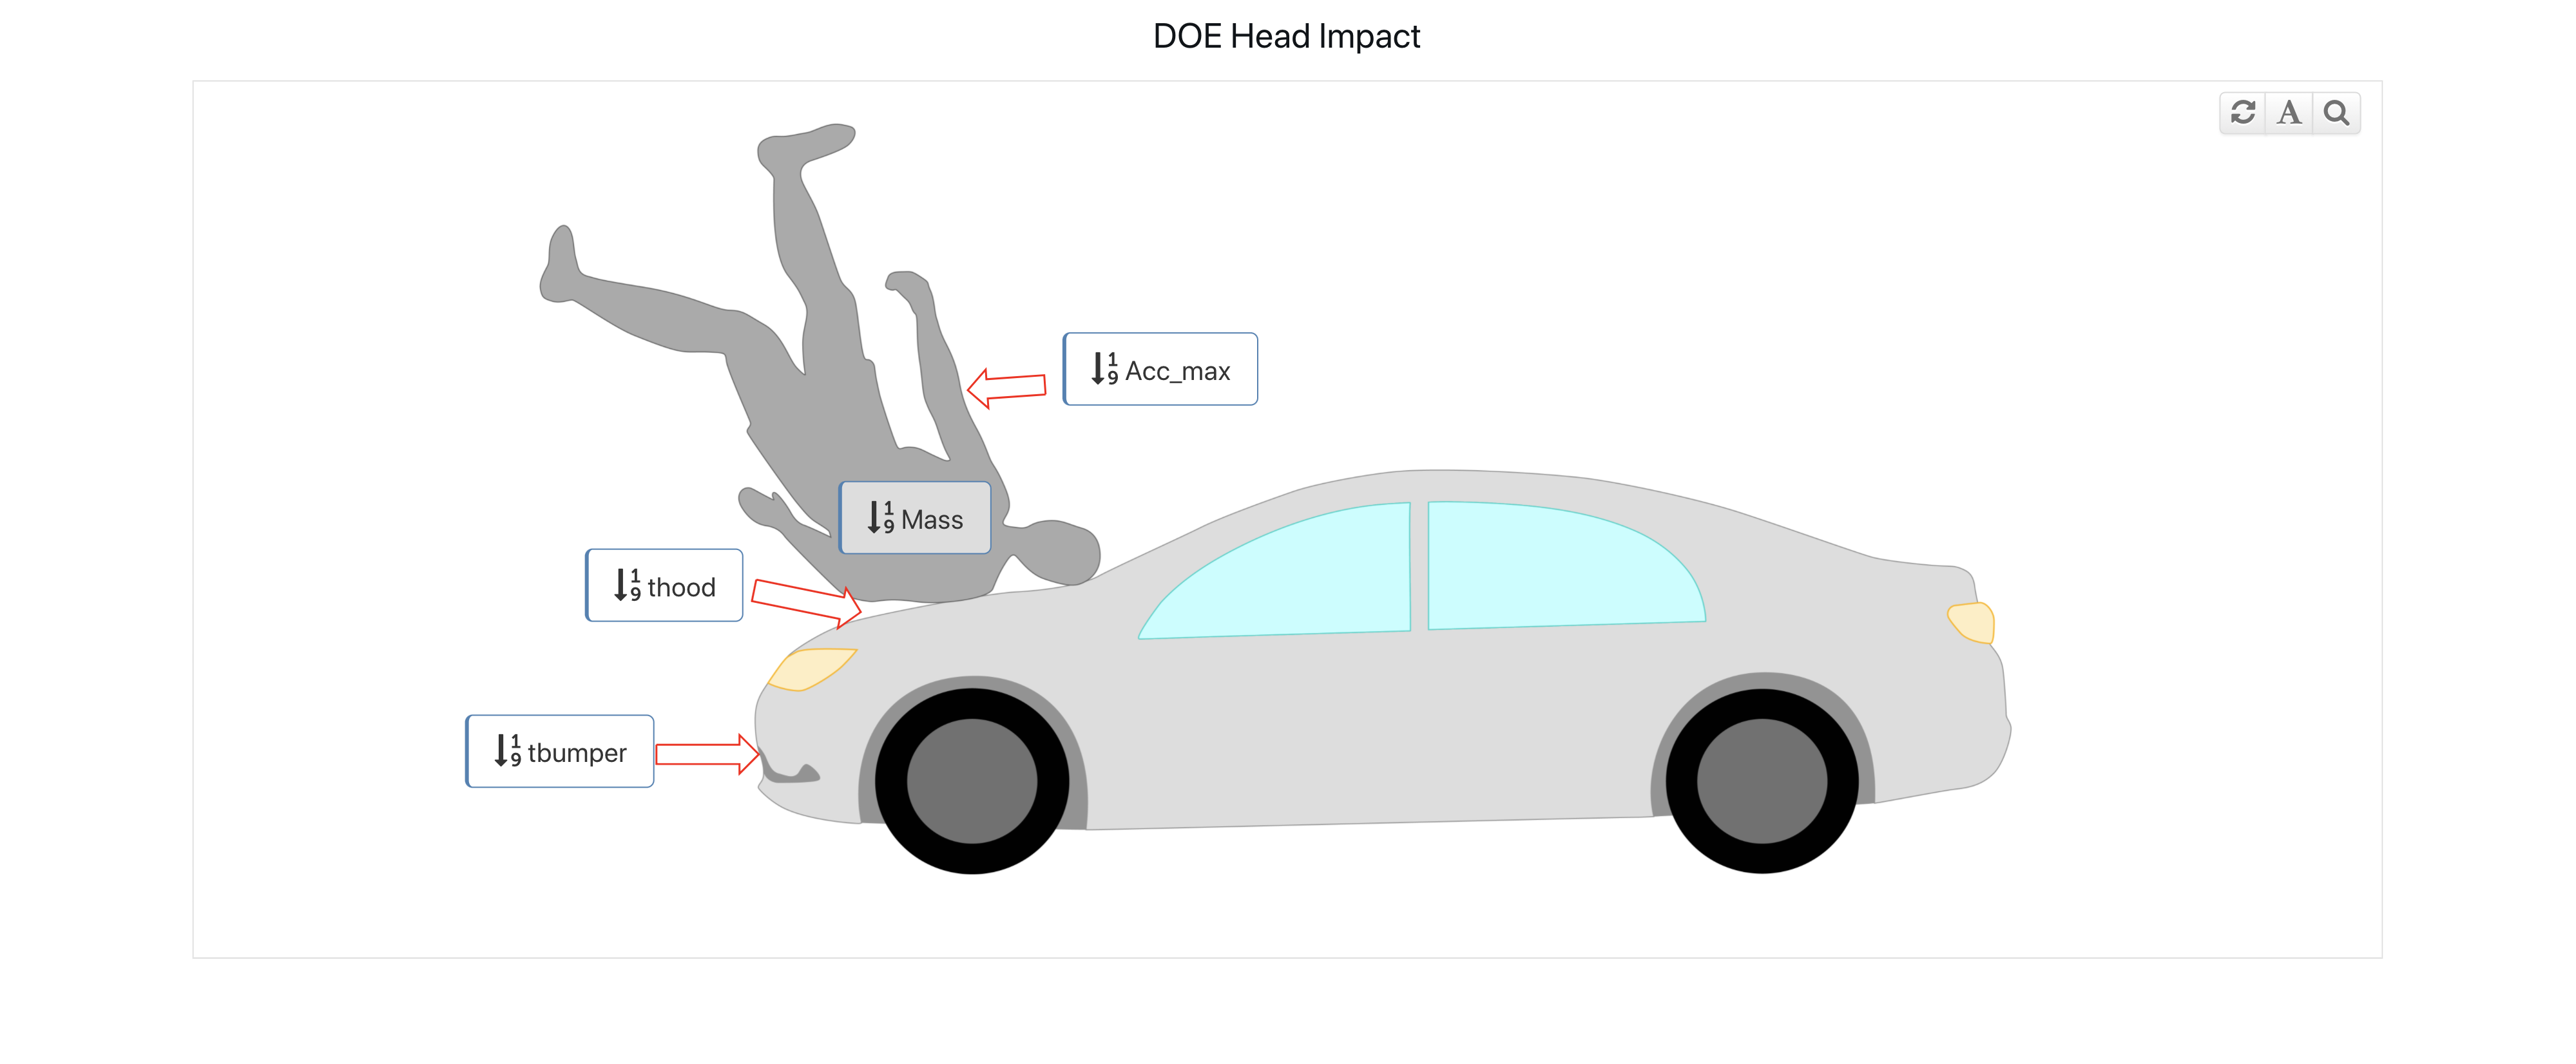
Figure 16: Head Impact Annotated Image
Diabetes
The Diabetes dataset explores factors that may cause diabetes. Here is an image annotation showing pregnancy factors and the diabetes pedigree function.
Here is our final annotated image for the Diabetes dataset.

Figure 17: Diabetes Annotated Image
Insurance
The Insurance dataset explores insurance holders based on certain variables. Here is an image annotation showing a summary of these insurance categories.
Here is our final annotated image for the Insurance dataset.
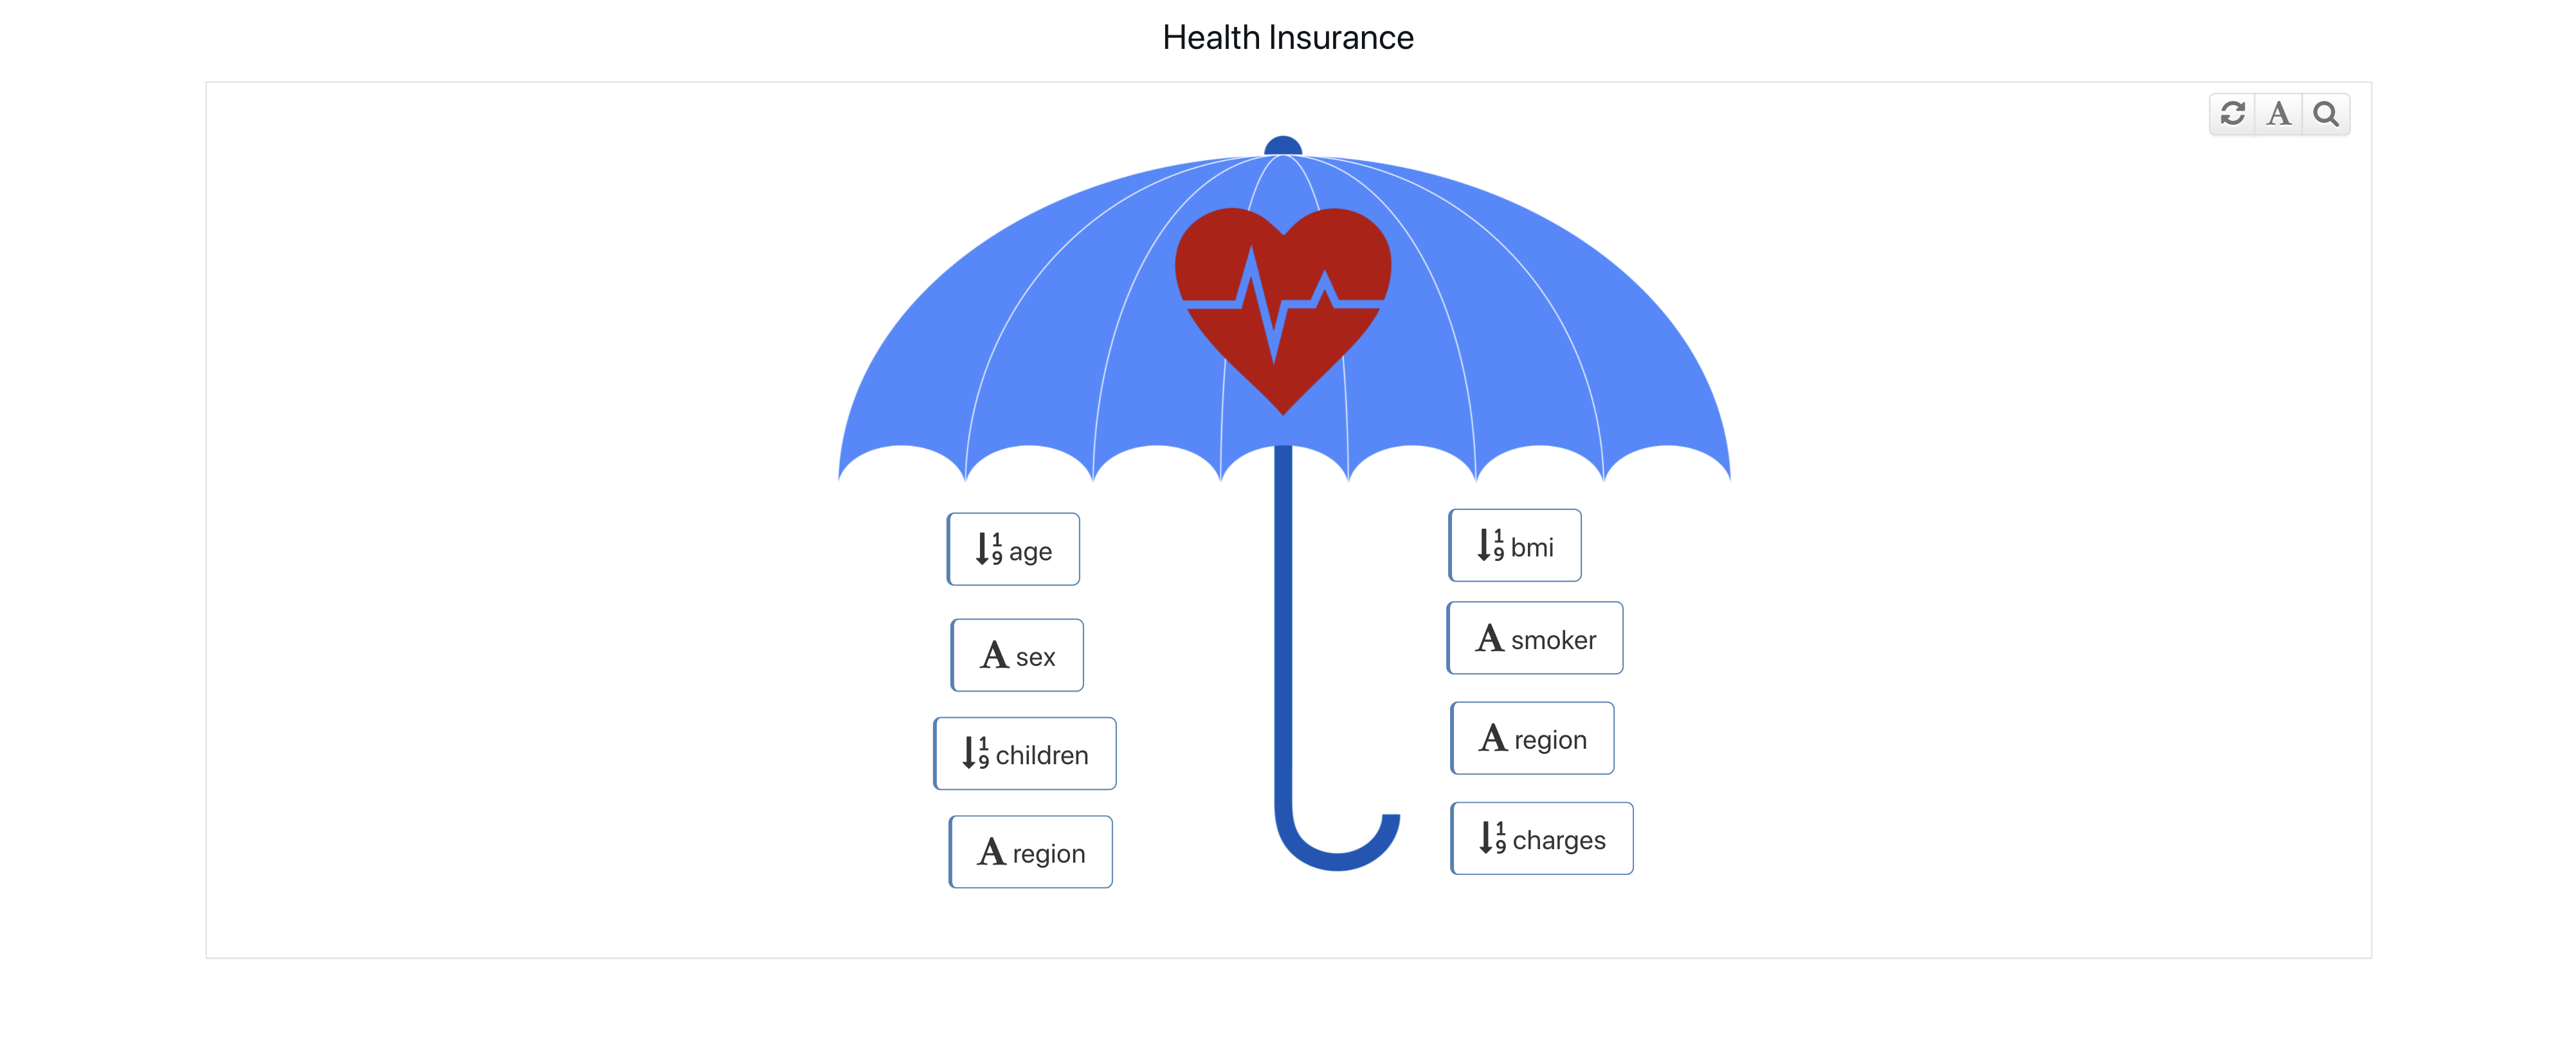
Figure 18: Insurance Annotated Image
Automobiles
The Automobiles dataset explores basic statistics of cars. Here is an image annotation showing a summary these statistics which include MPG, cylinders and weight.
Here is our final annotated image for the Insurance dataset.
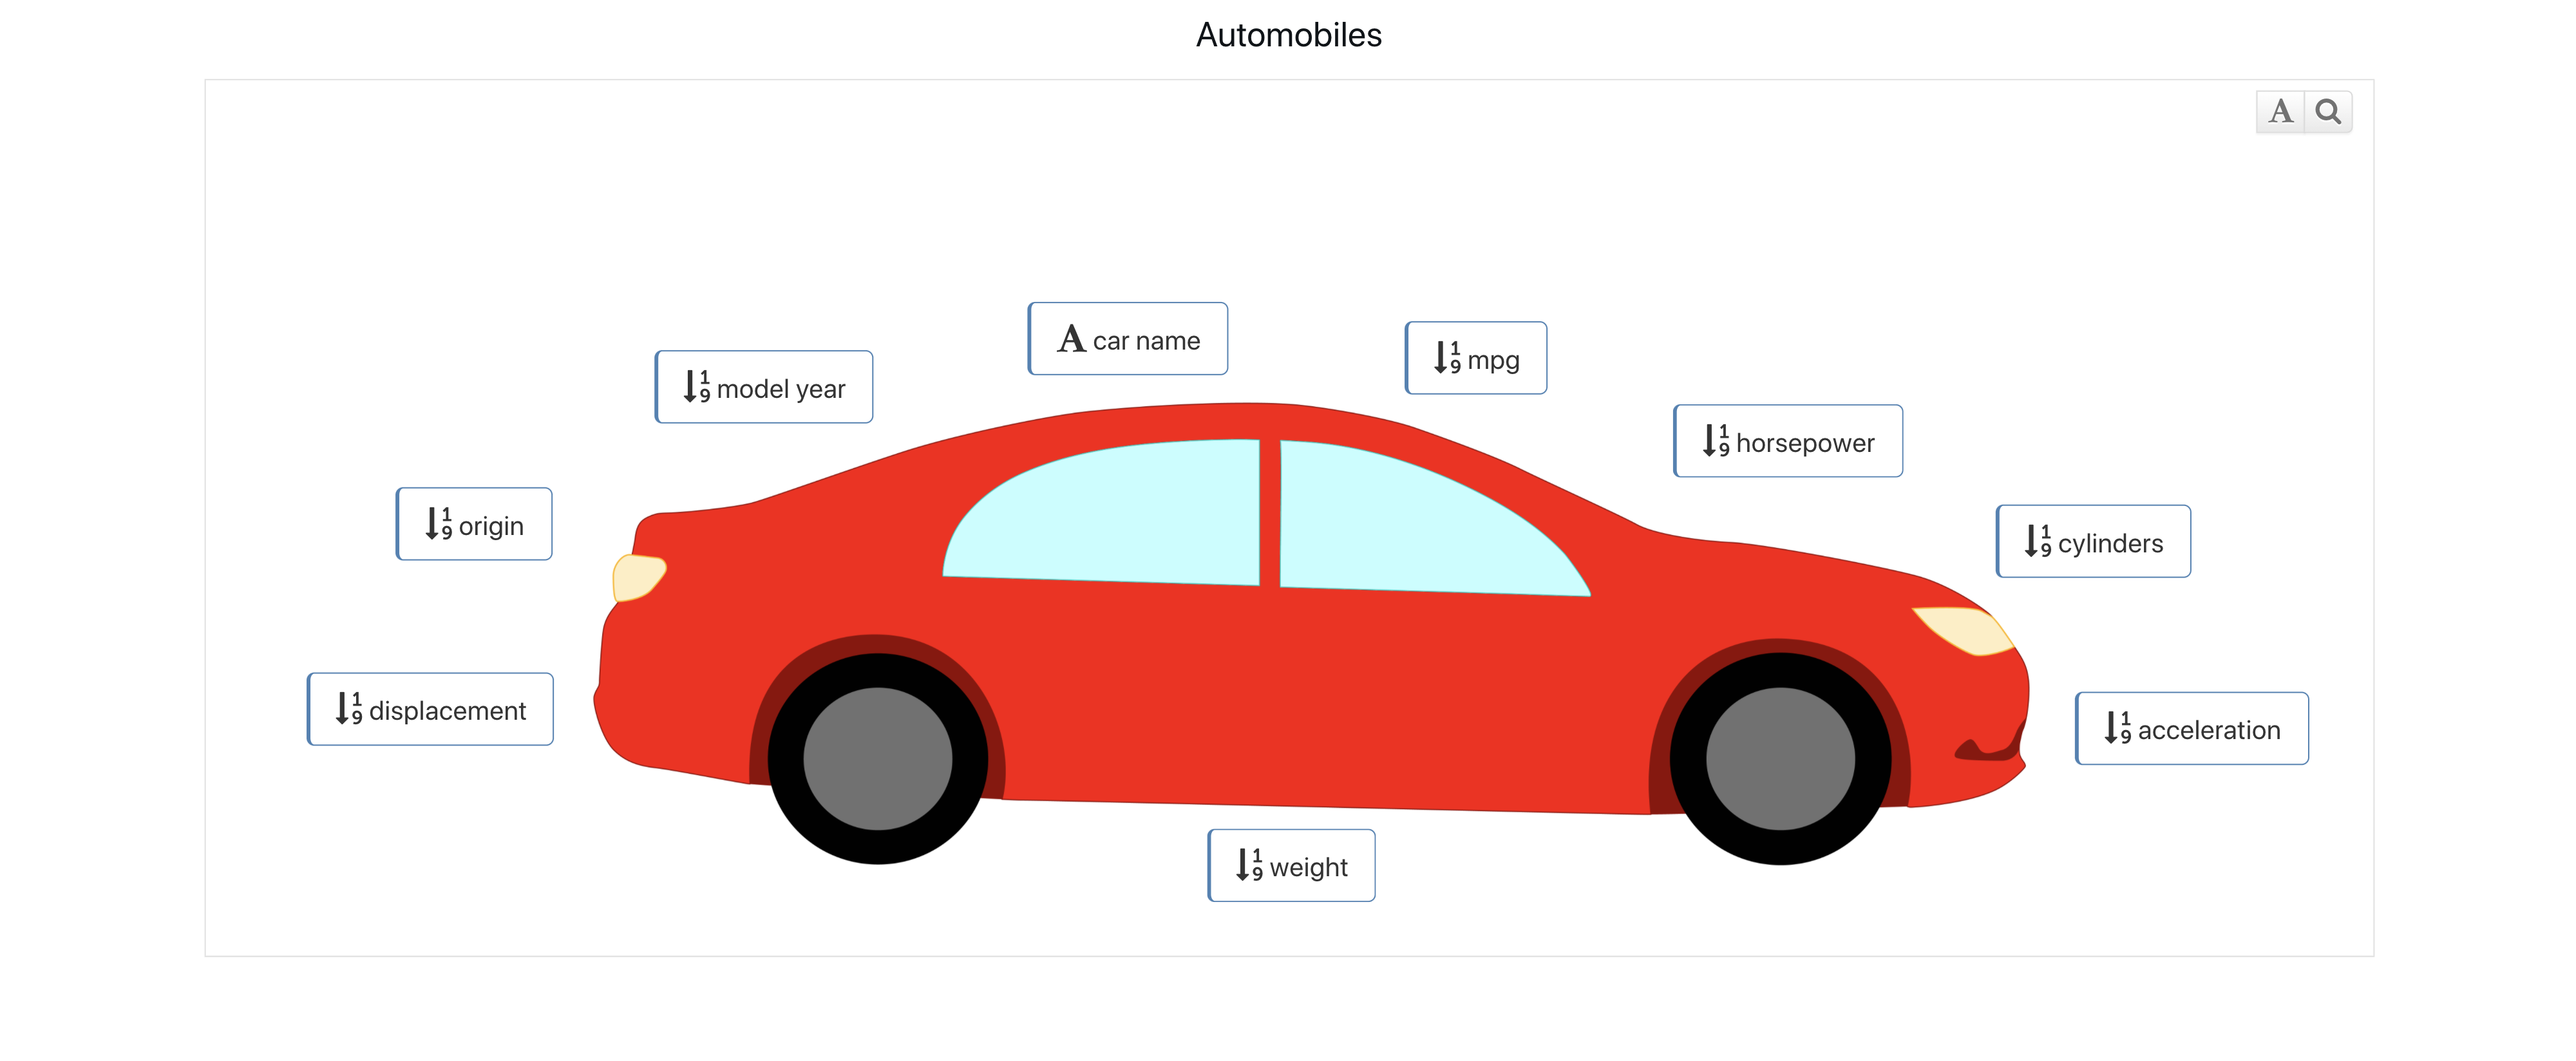
Figure 19: Automobiles Annotated Image