14.  Time-Series
In this section, we’ll go over time-series charts and how to explore them.
Examples of Time-Series Charts
Watch this short video about Newton Curve Plotting to gain a general understanding of the application:
14.1. Curve Respones
For scientific datasets, time-series curves can be plotted and viewed easily by dragging-and-dropping responses.
This Barrier Crossmember dataset contains columns of curves with one column denoting time.
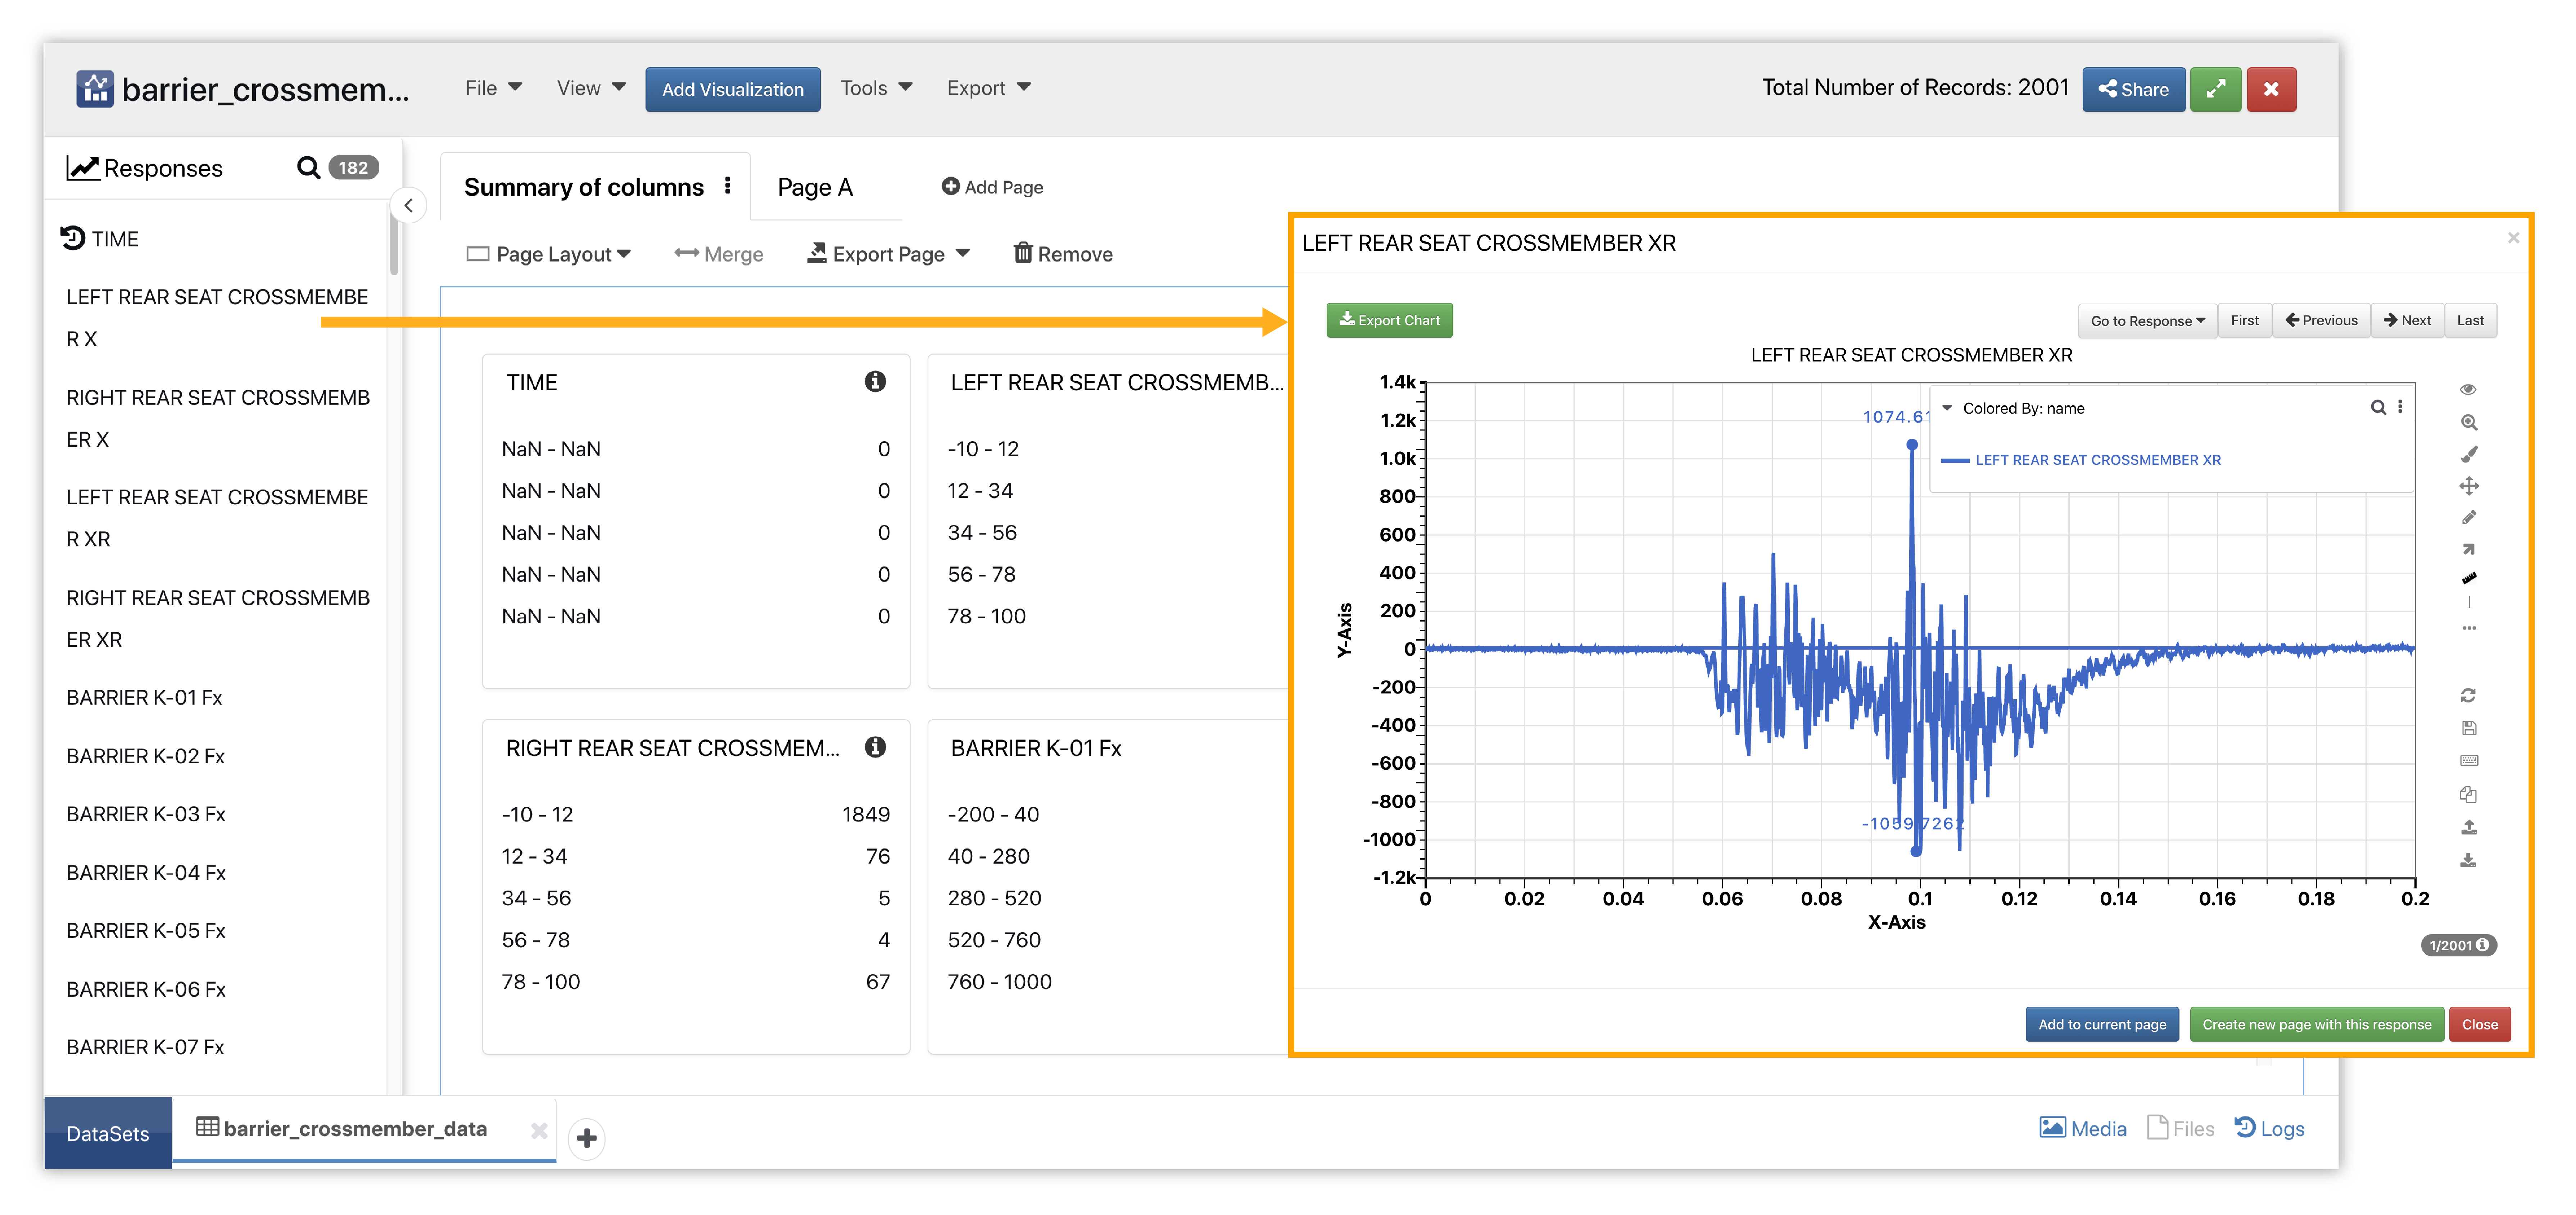
Figure 1: Barrier Crossmember Dataset
We’ll drag the curve columns into a new page to plot the curve quickly. We can drag other responses onto of the plotted curve to replace the curve it or choose to overlay as many other responses as we like for easy comparisons.
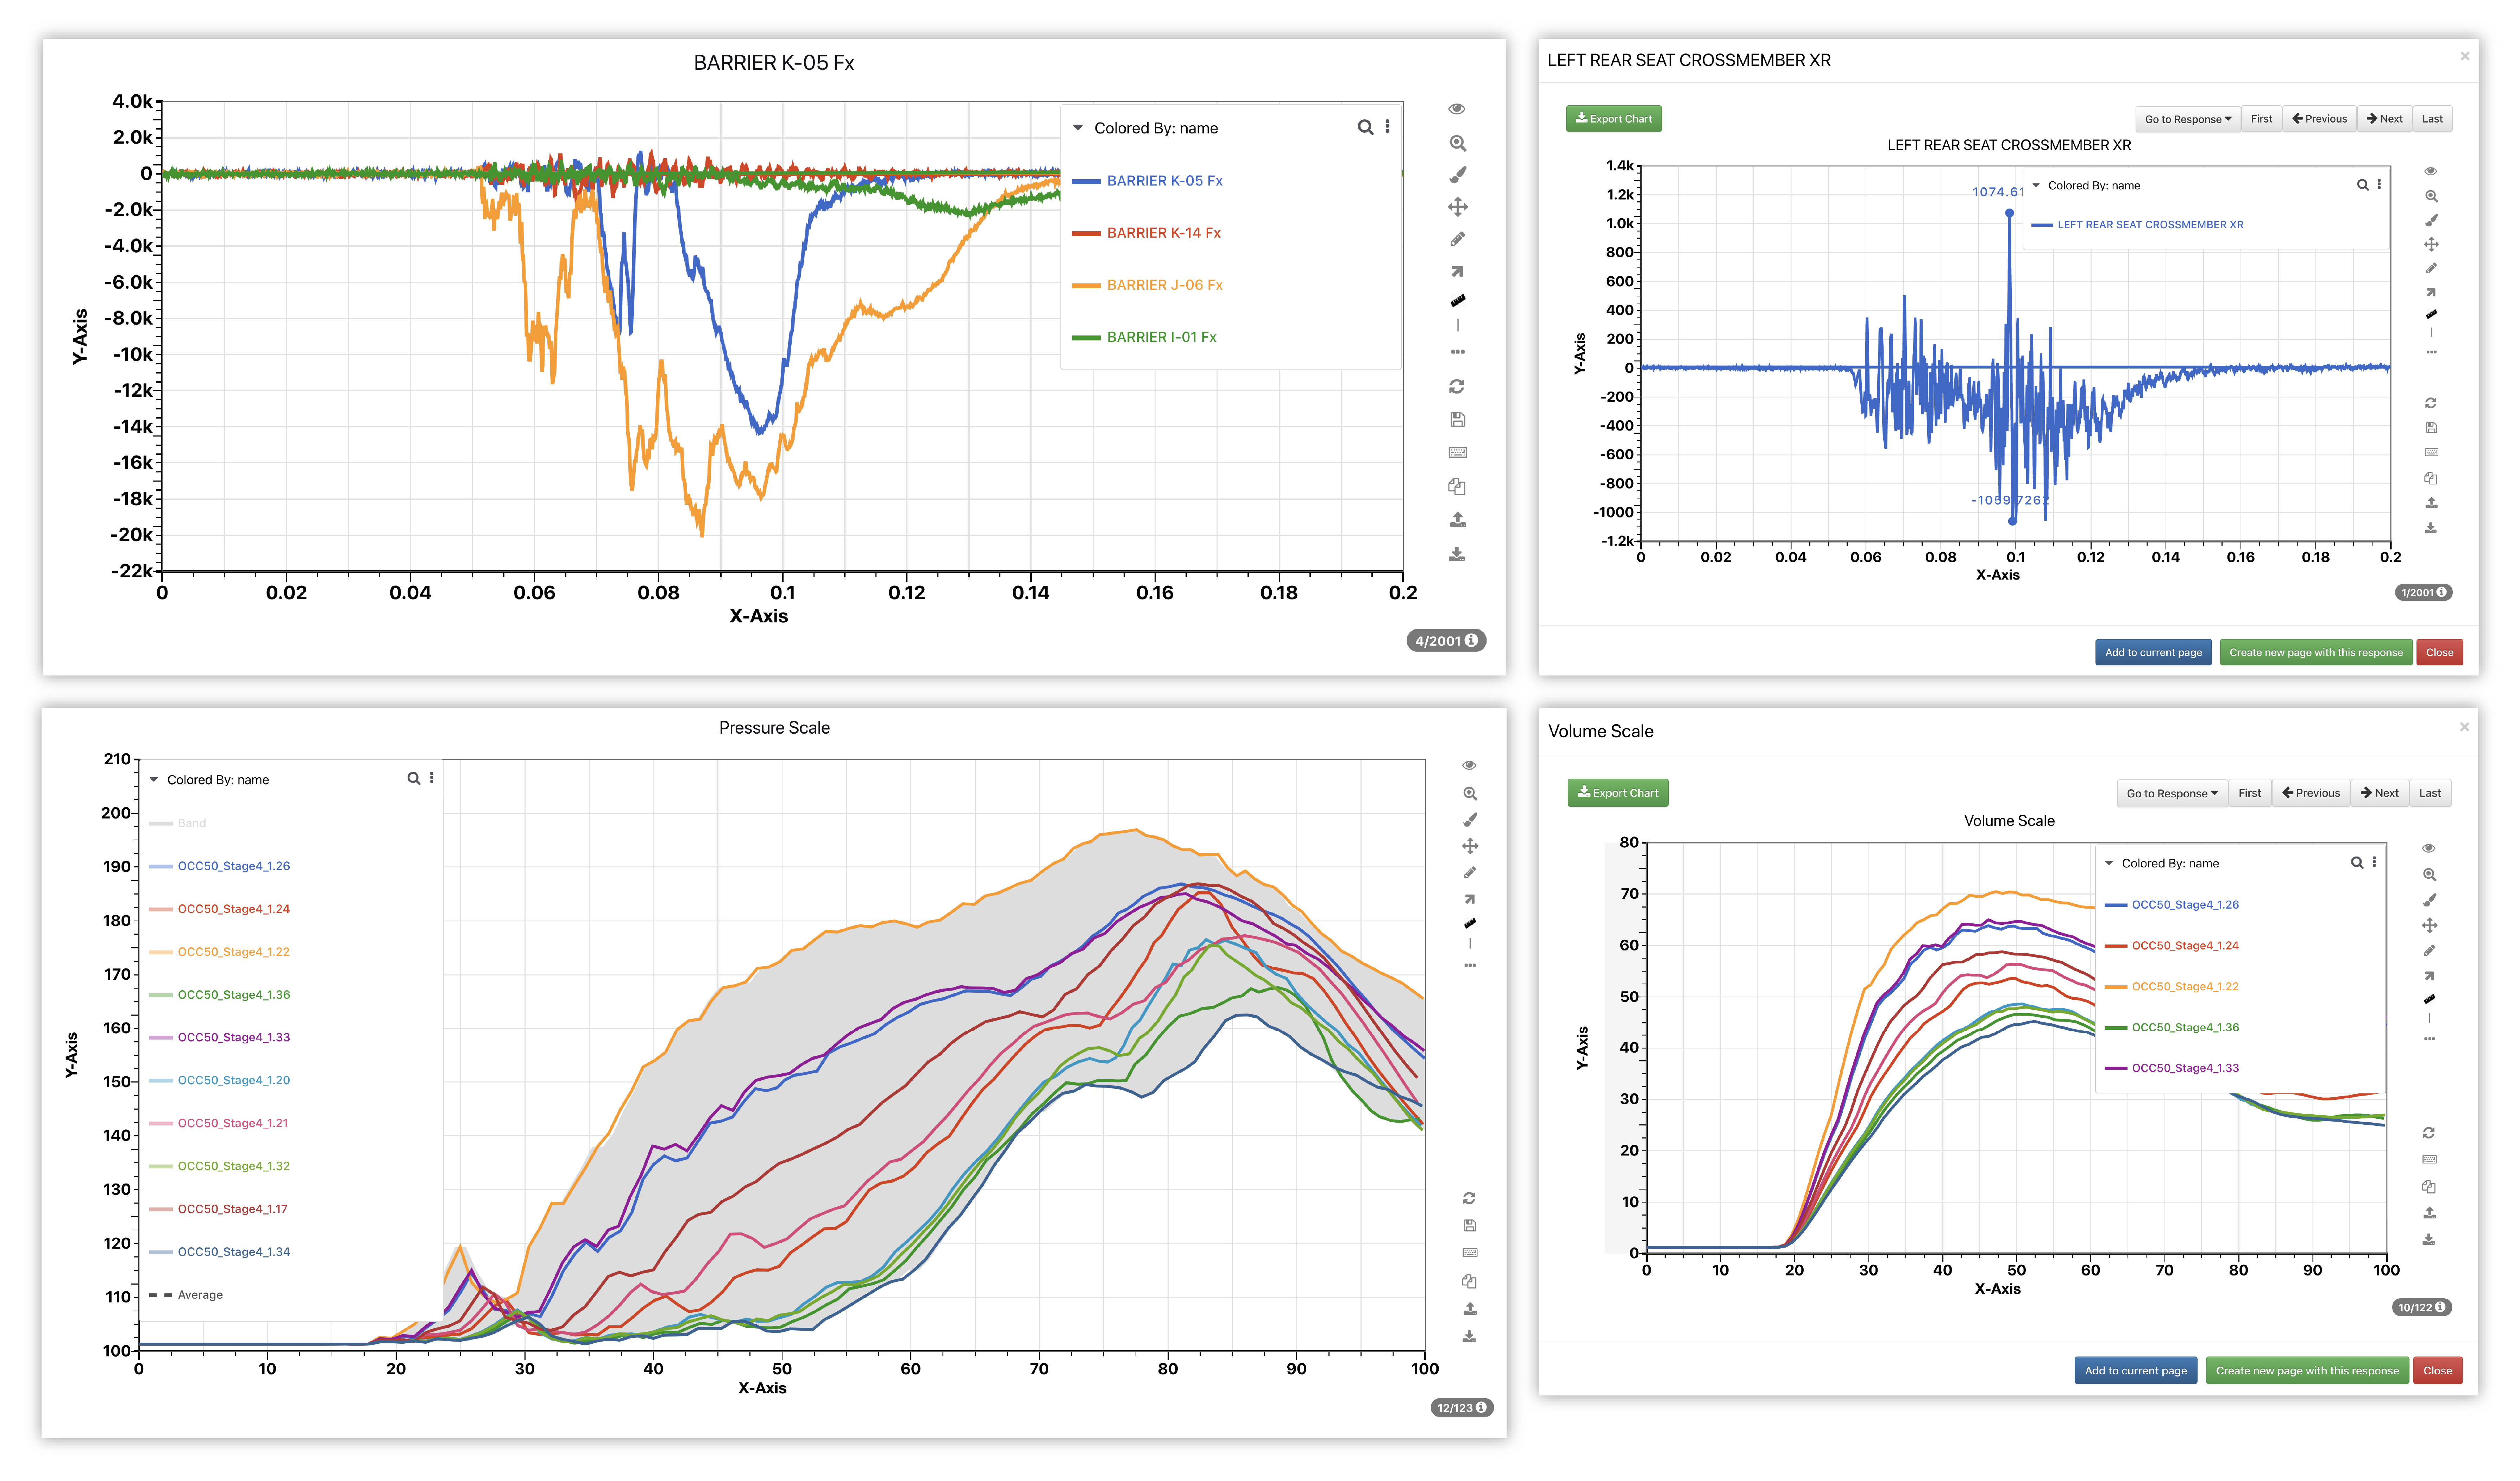
Here is the curve plot with overlaid time-series curve responses.
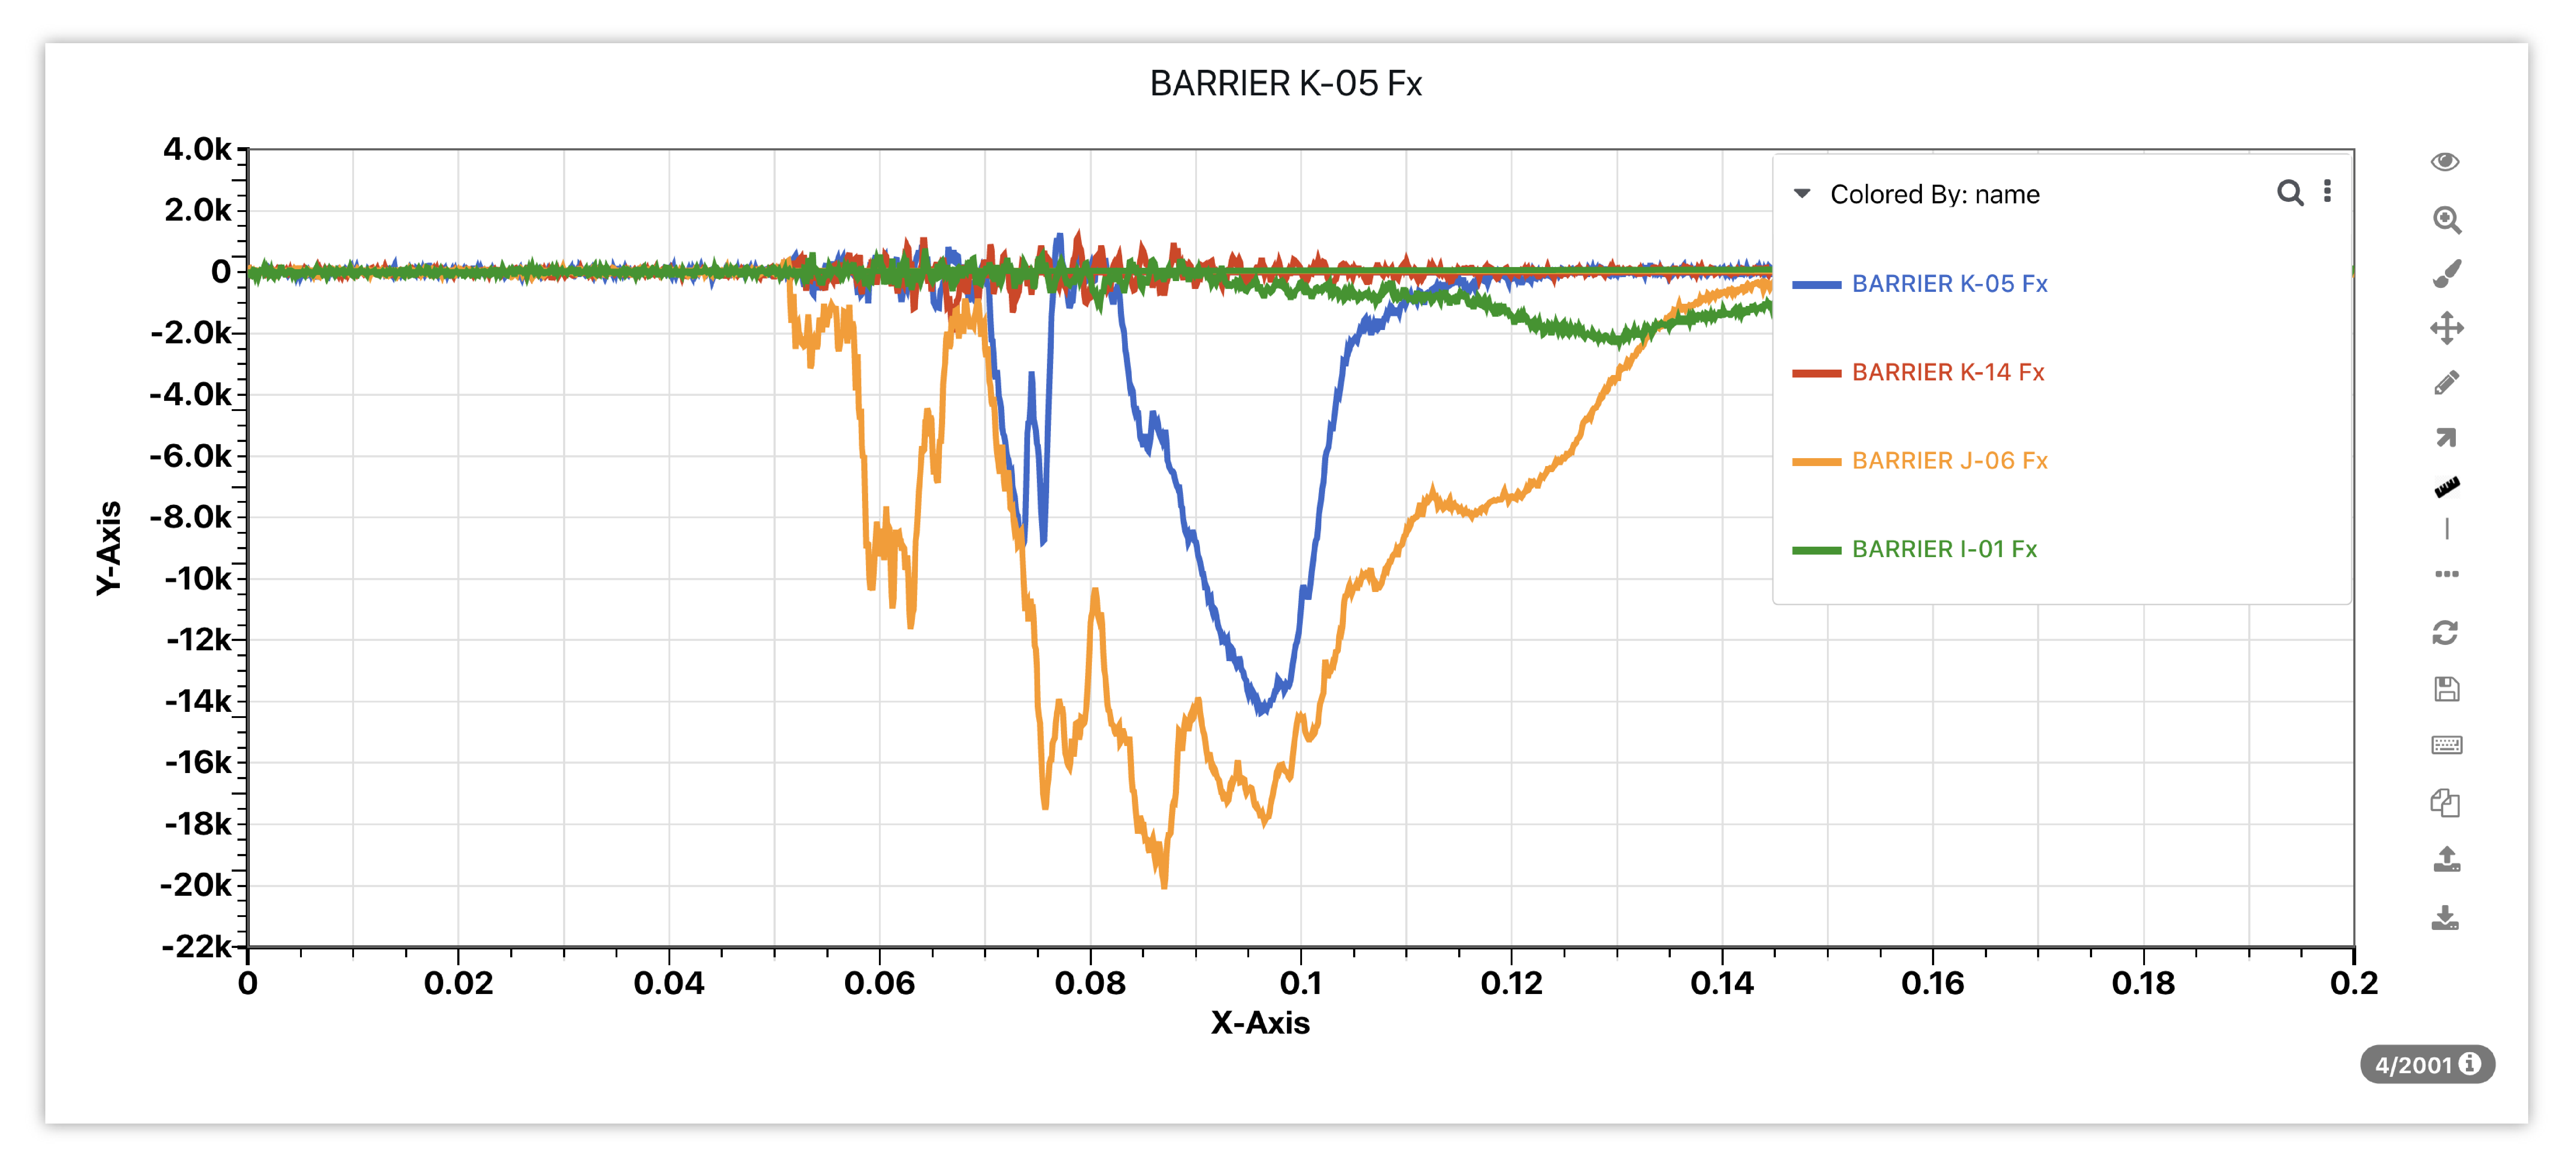
Figure 2: Barrier Crossmember Curve Overlay
14.2. Newton Visualizer

Newton Visualizer, also referred to as curve plotting and curve viewer, is Simlytiks’ main time-series chart. It can support up to 100 curves and millions of points in one plot. Newton is highly interactive and customizable; some useful features include zooming, scrolling, dragging, highlighting and filtering. It also integrates with other applications on d3VIEW aside from Simlytiks.
We’ll be using the Occupant Belted sample scientific dataset which has curve responses with time as the x coordinate to help explain Newton.
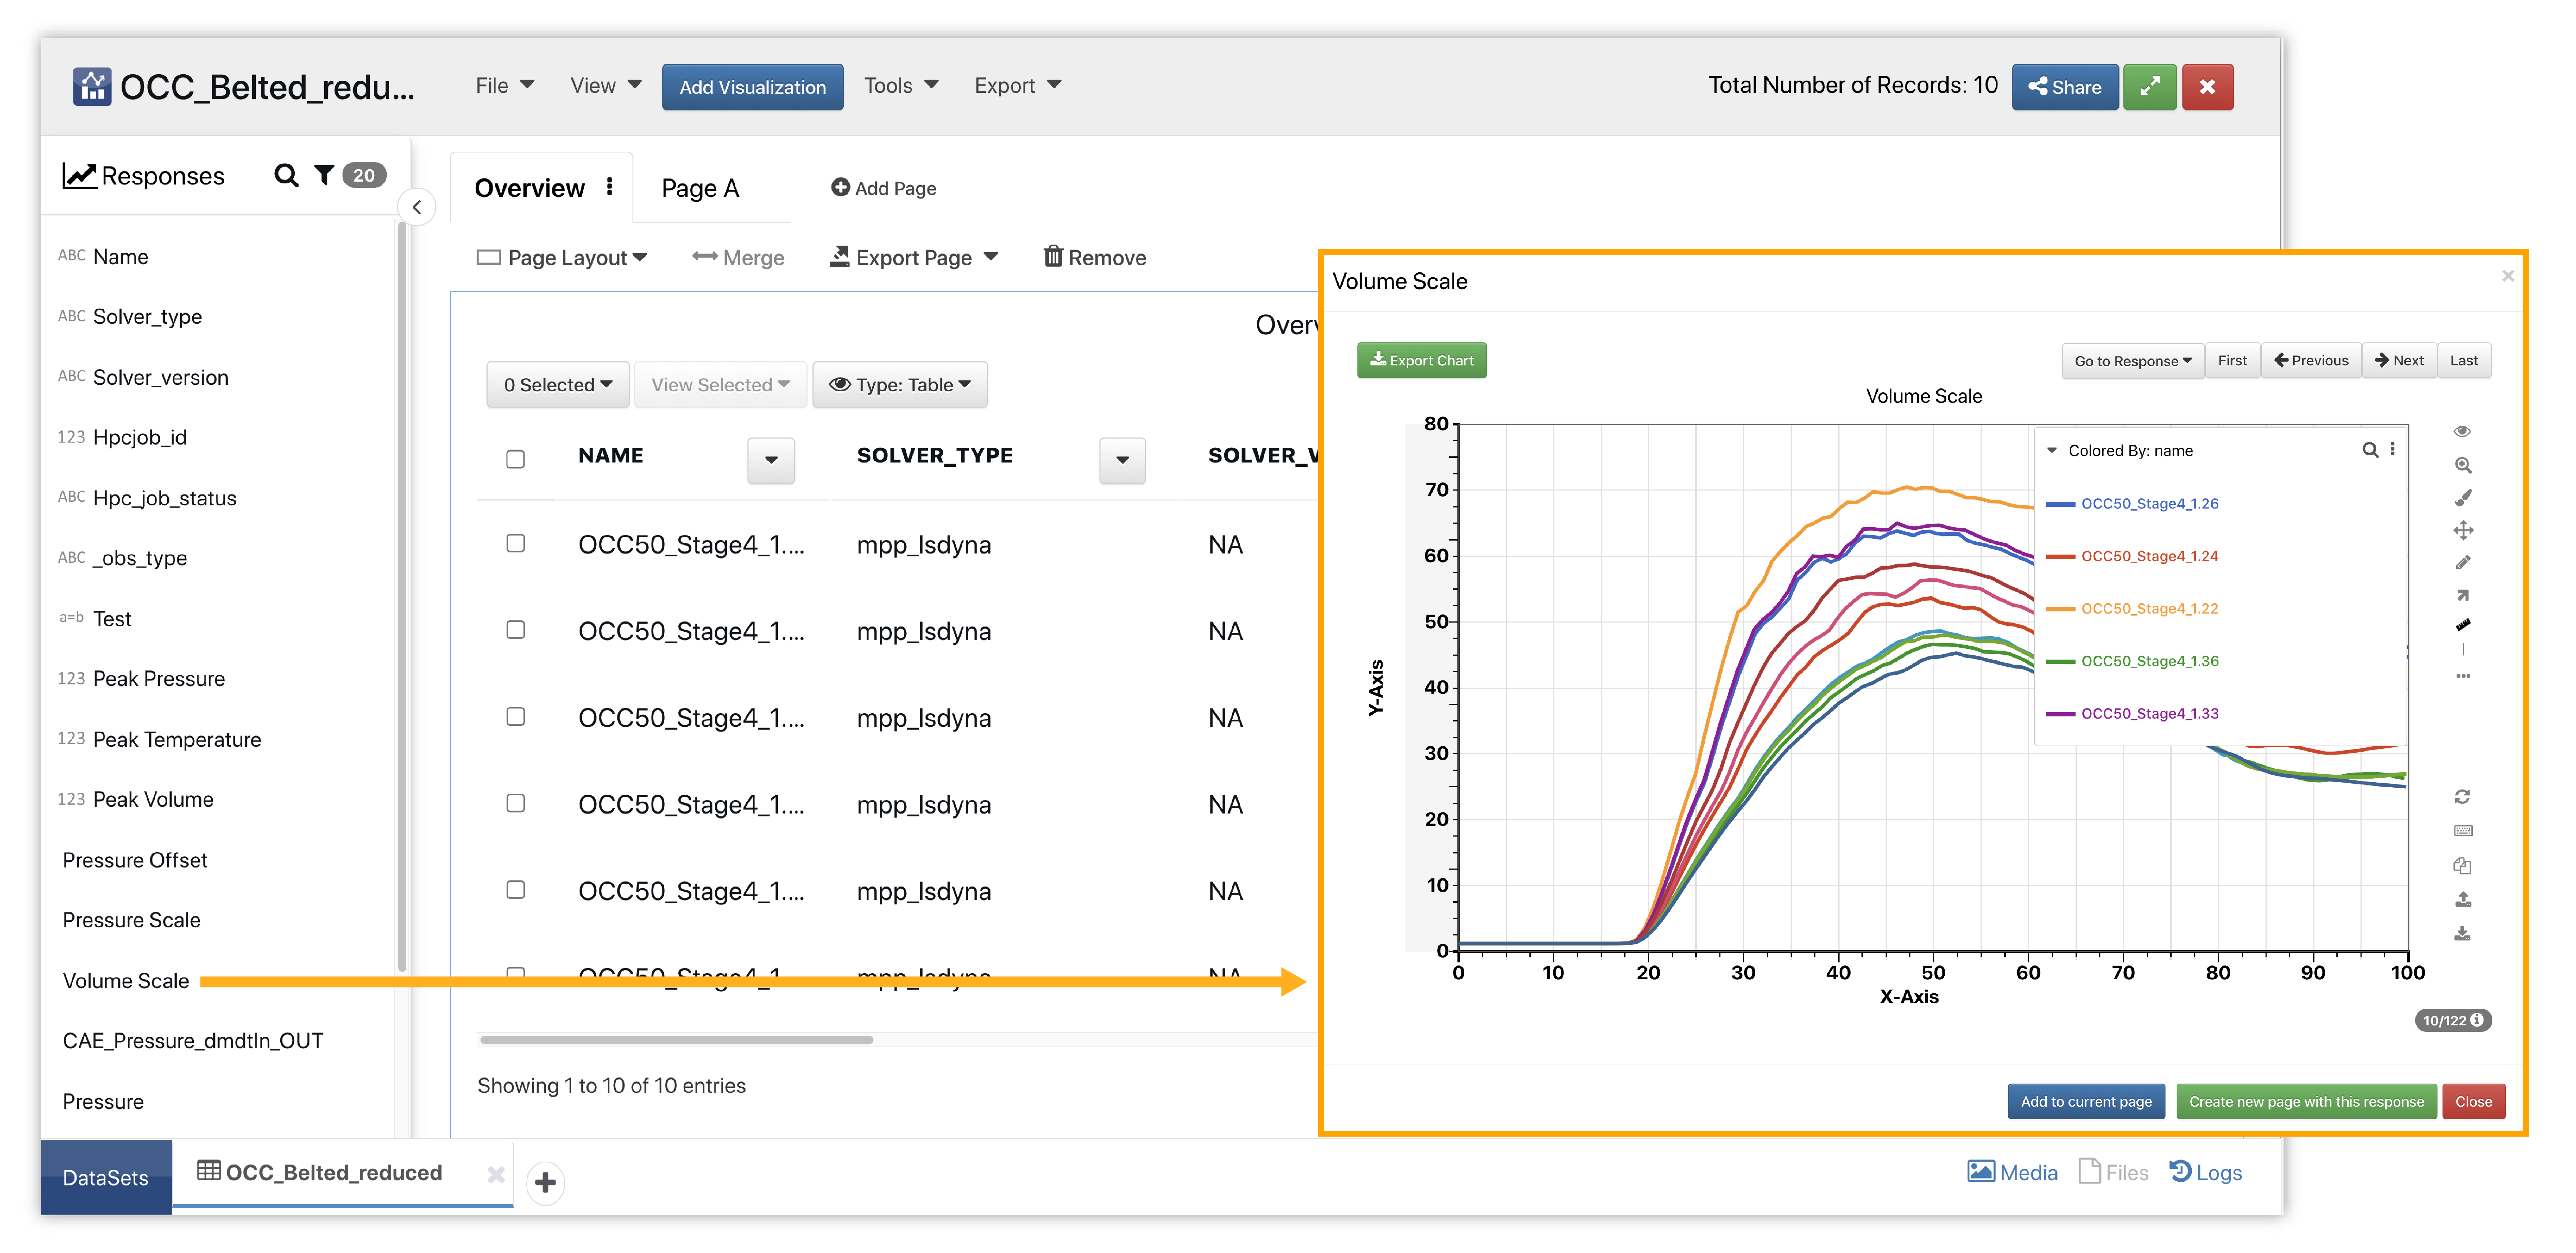
Figure 3: Occupant Belted Dataset
Simply drag-and-drop a curve response into a new page section or choose curve plot in the visualization menu and input data for the plot.
14.3. Newton Tools
The following image gives an overview of the chart and maps out all its tools.
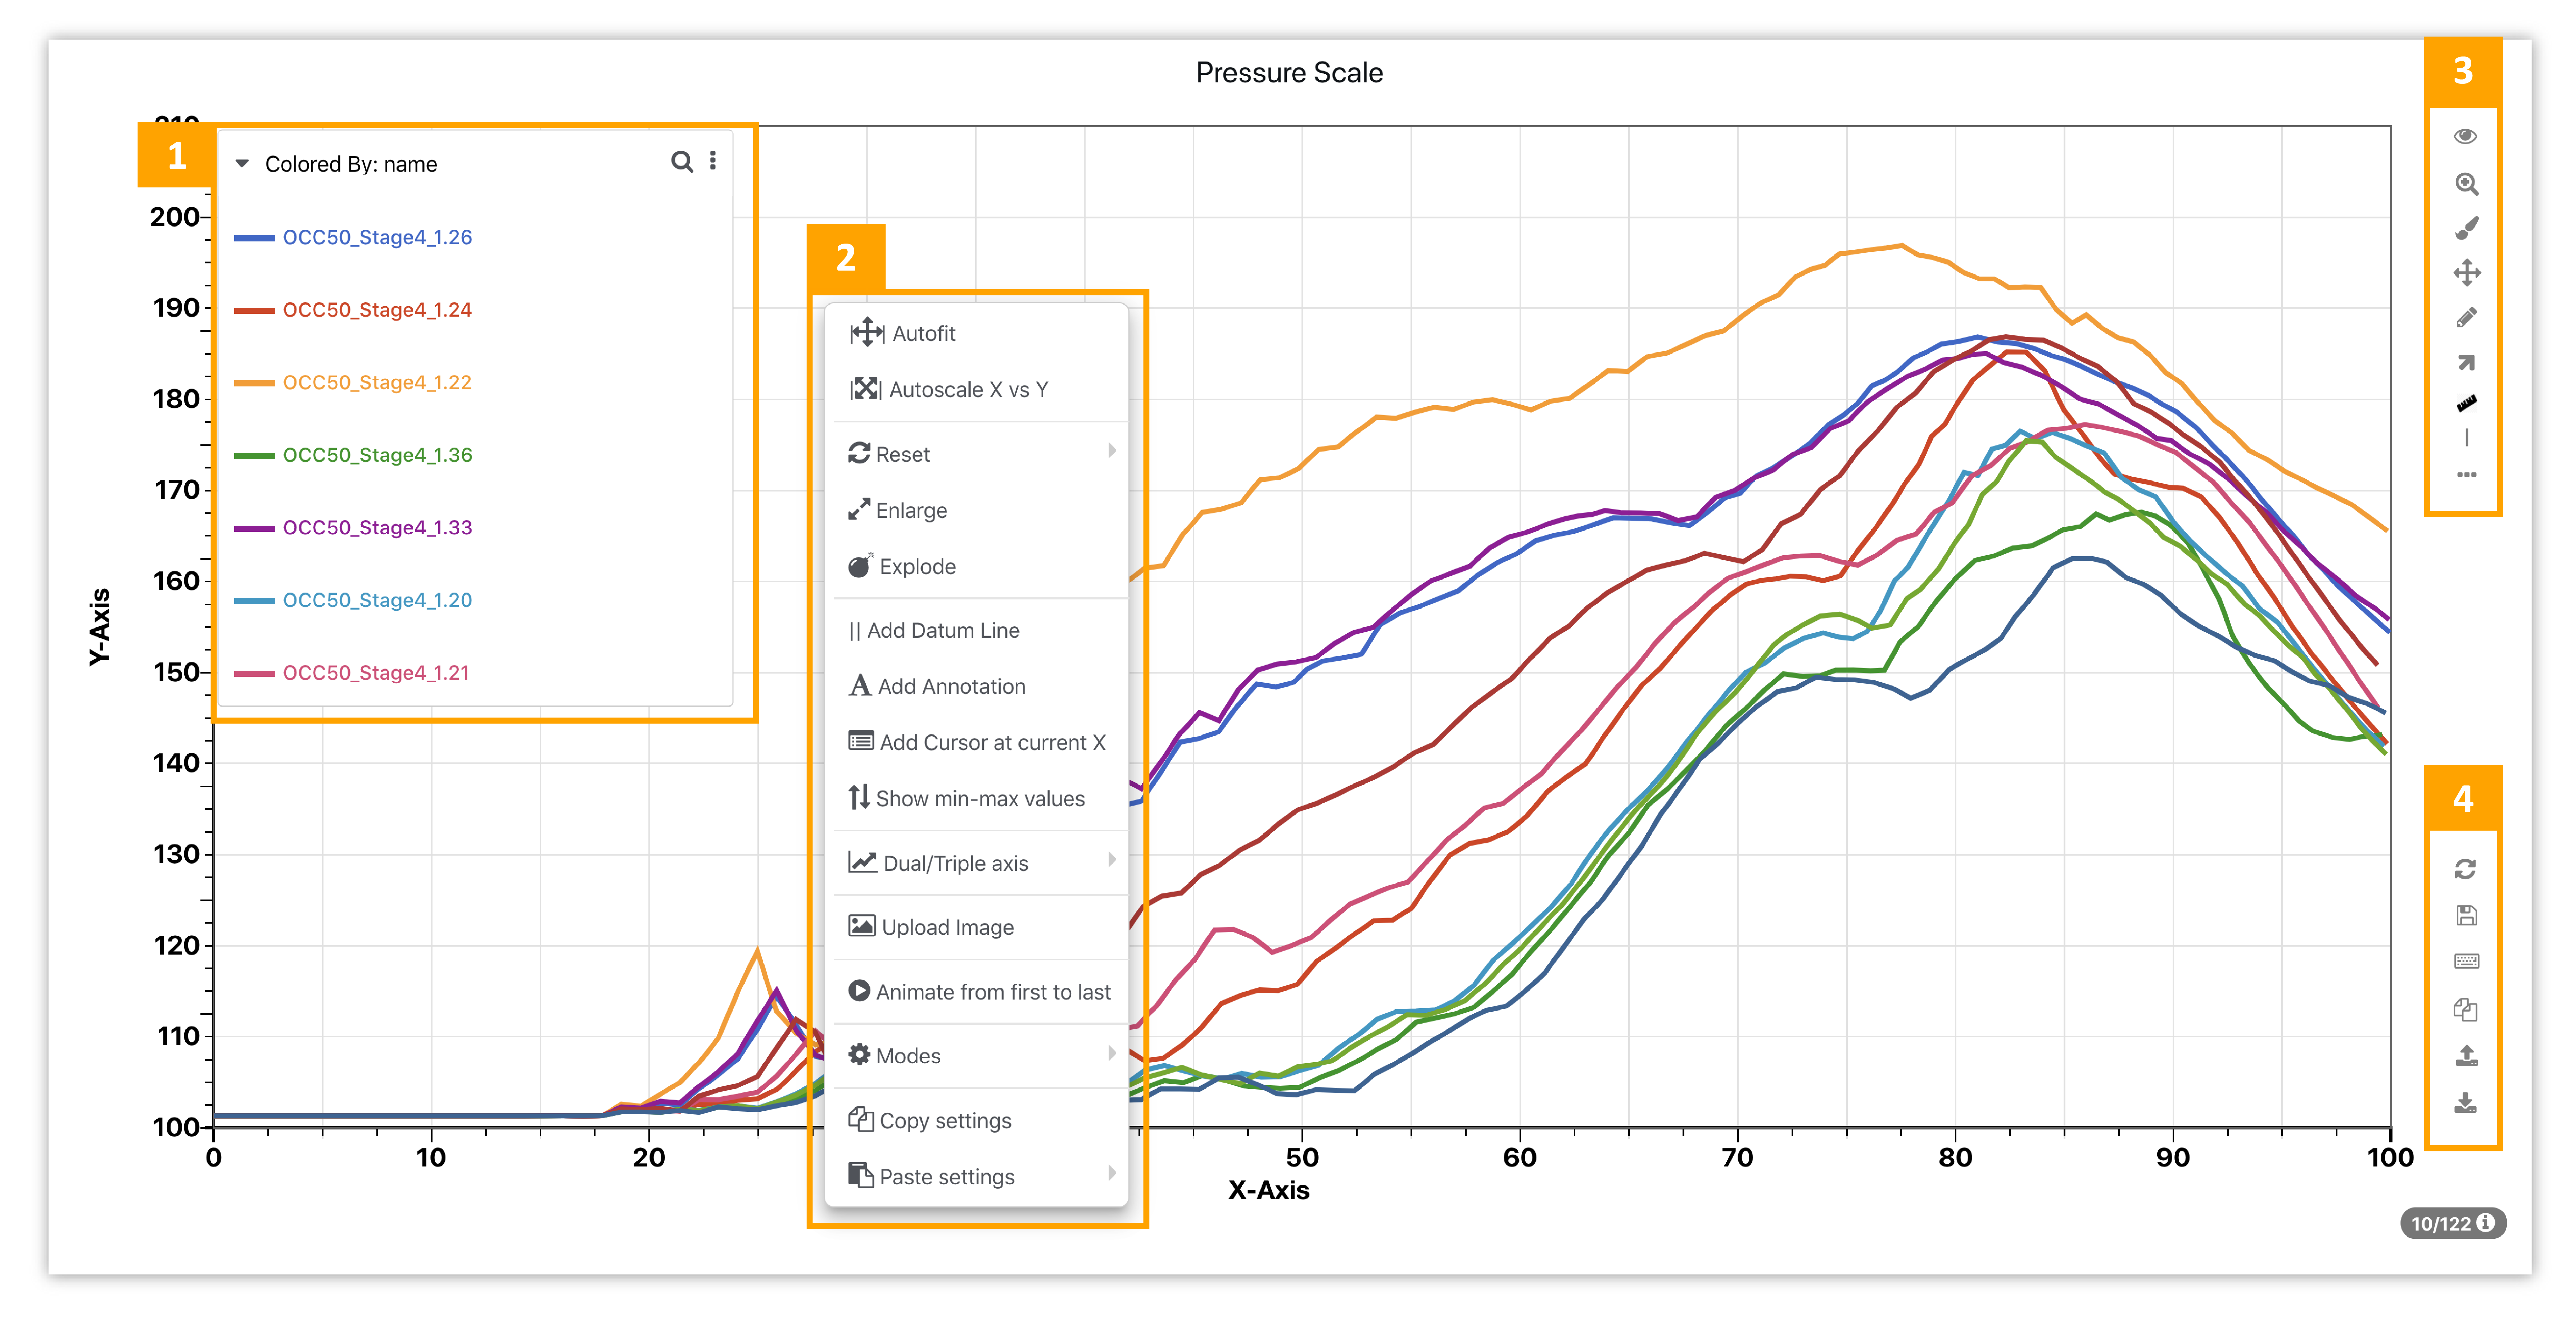
Figure 4: Newton Tool Bars
- Curve Legends: Shows names of all curves on the plot
- Right-Click Menu: Access these curve plotting options by right-clicking
- Top Right-Side Toolbar: Options include (from top to bottom) Chart Type, Zoom, Highlight, Drag, Add Text, Add Arrows, Measurement Tool, Free-form Datum Line
- Bottom Right-Side Toolbar: Options include (from top to bottom) Reset Options, Save Settings, Keyboard Shortcuts, Copy Chart, Import Curve(s), Export Options
Datum Lines
Create datum lines to better understand the curves by clicking on the line icon in the right-side toolbar or choosing the datum line option under the right-click menu. The toolbar option is free-from while the right-click option is axis based.
Curve Dragging
Drag curves around the chart to compare with other curves by choosing the crossing arrows icon in the right-side toolbar. We can choose the drag the curve freely, vertically or horizontally.
Customizing
Customize curves under the 3 dots in the right-side toolbar.
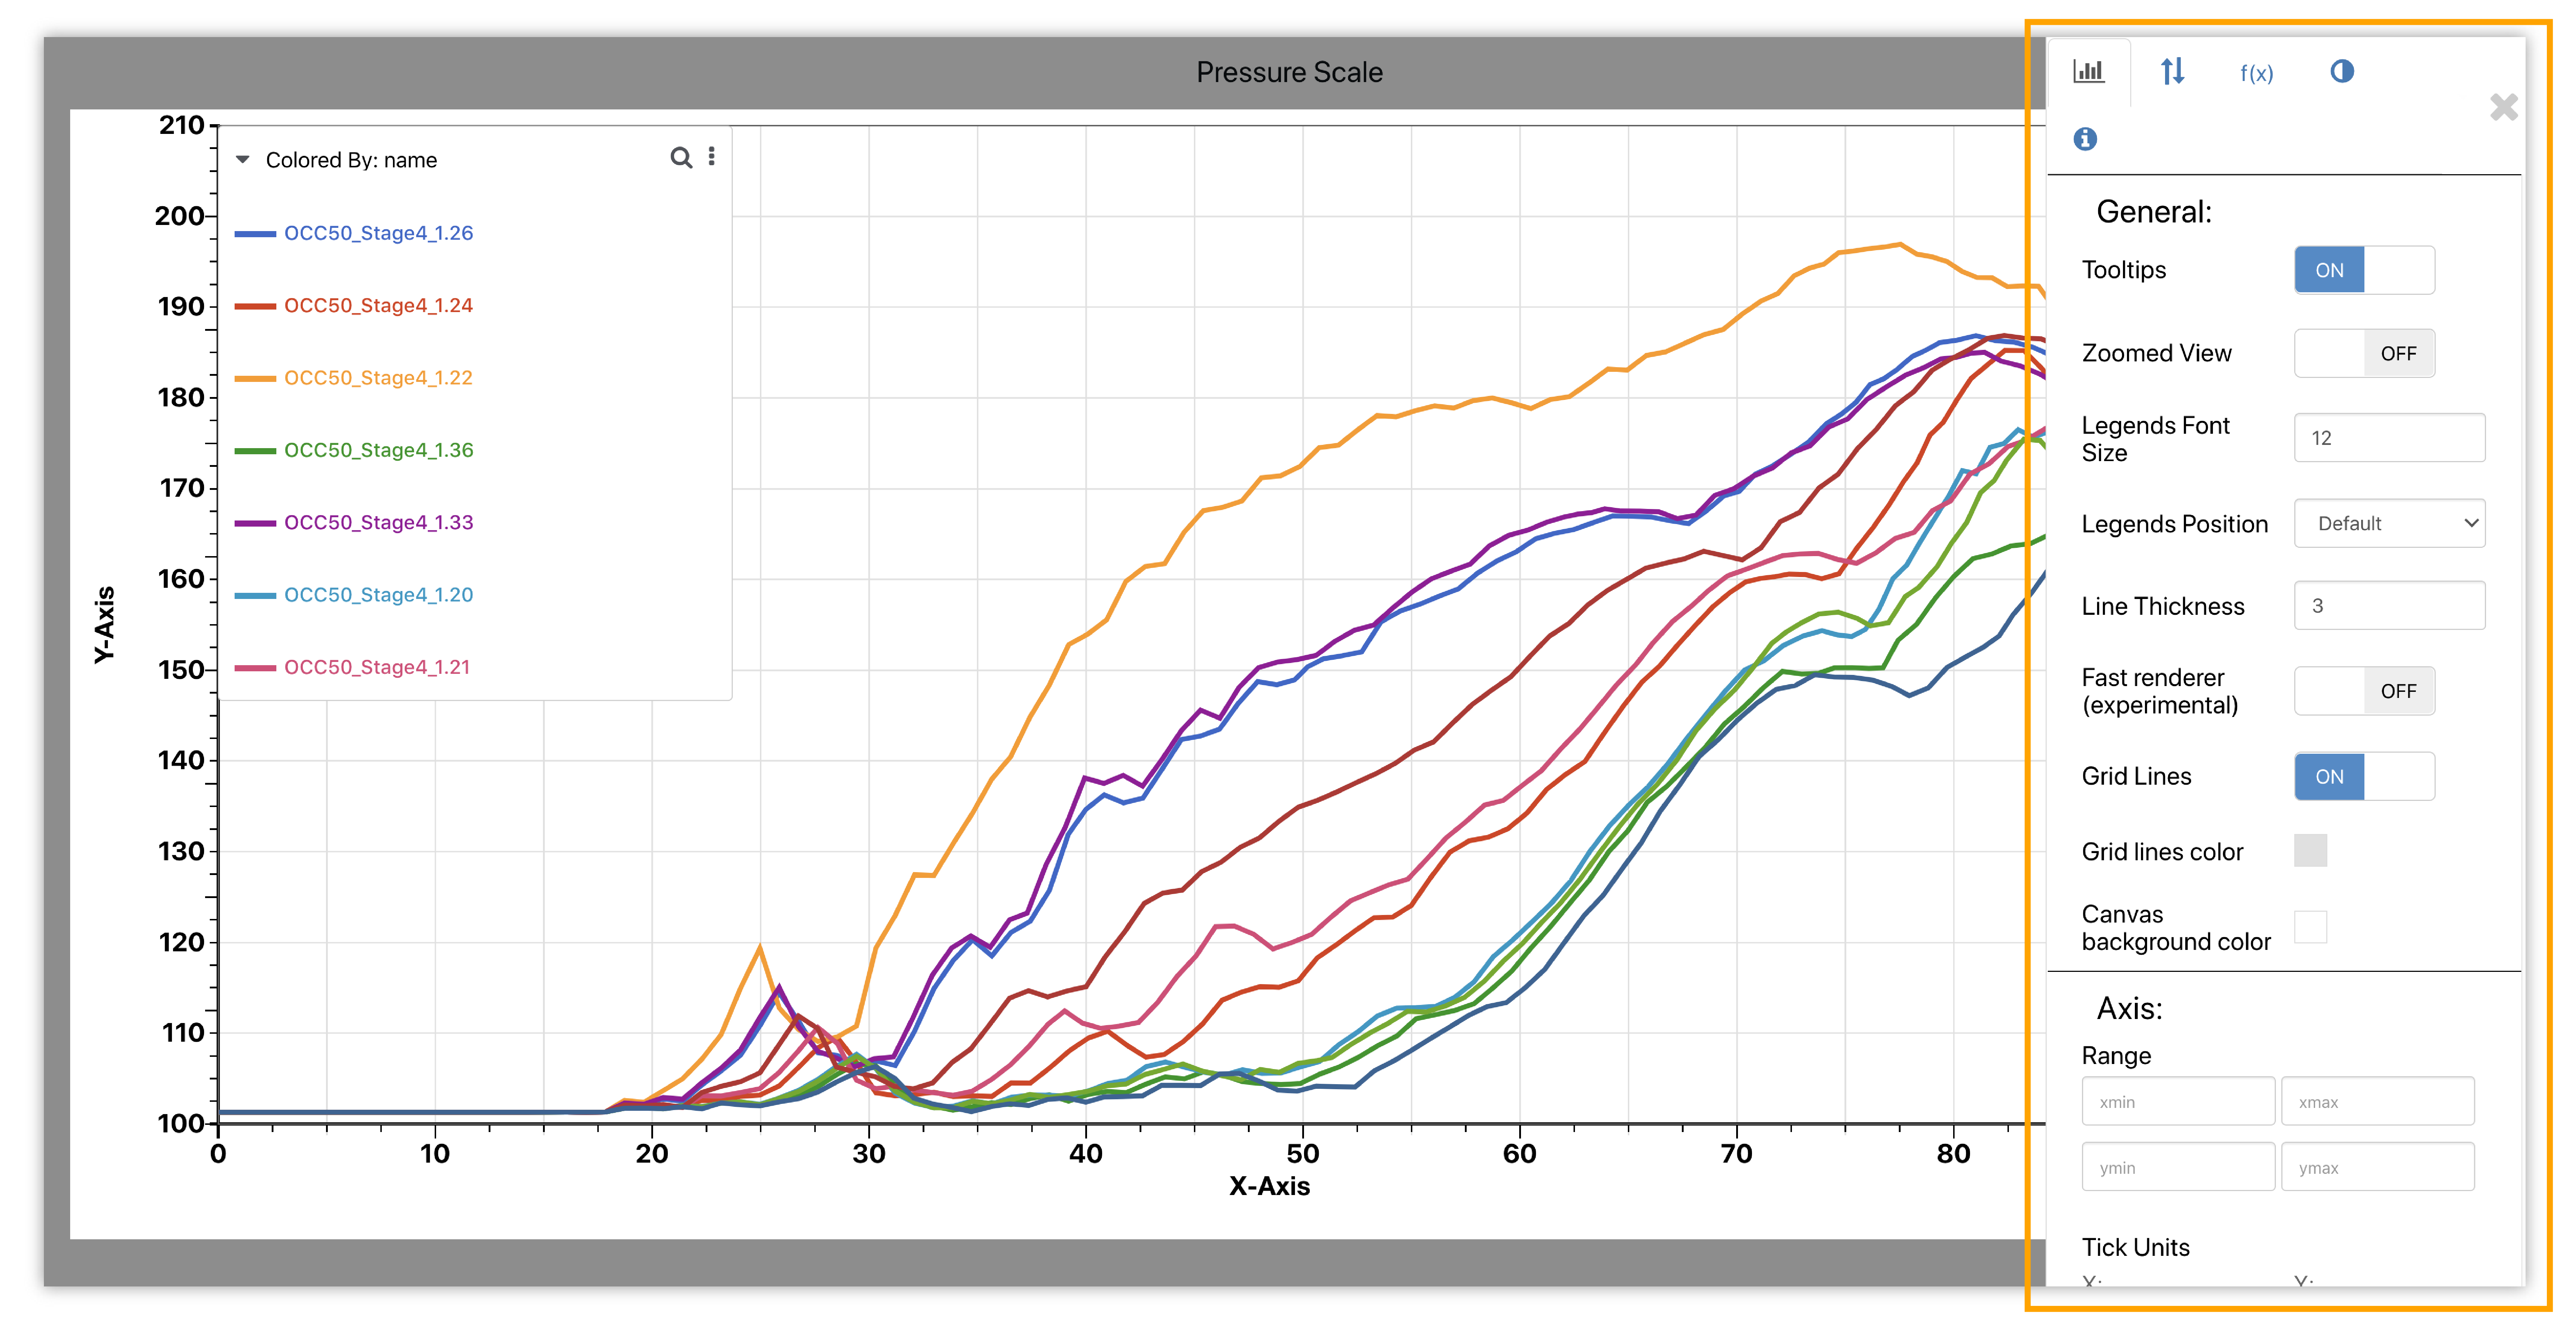
Figure 5: Newton Chart Types
Here, we can change font sizes, choose a different position for our legends, and make other modifications.
Reset changes anytime by using the reset options (circular arrows icon) in the toolbar.
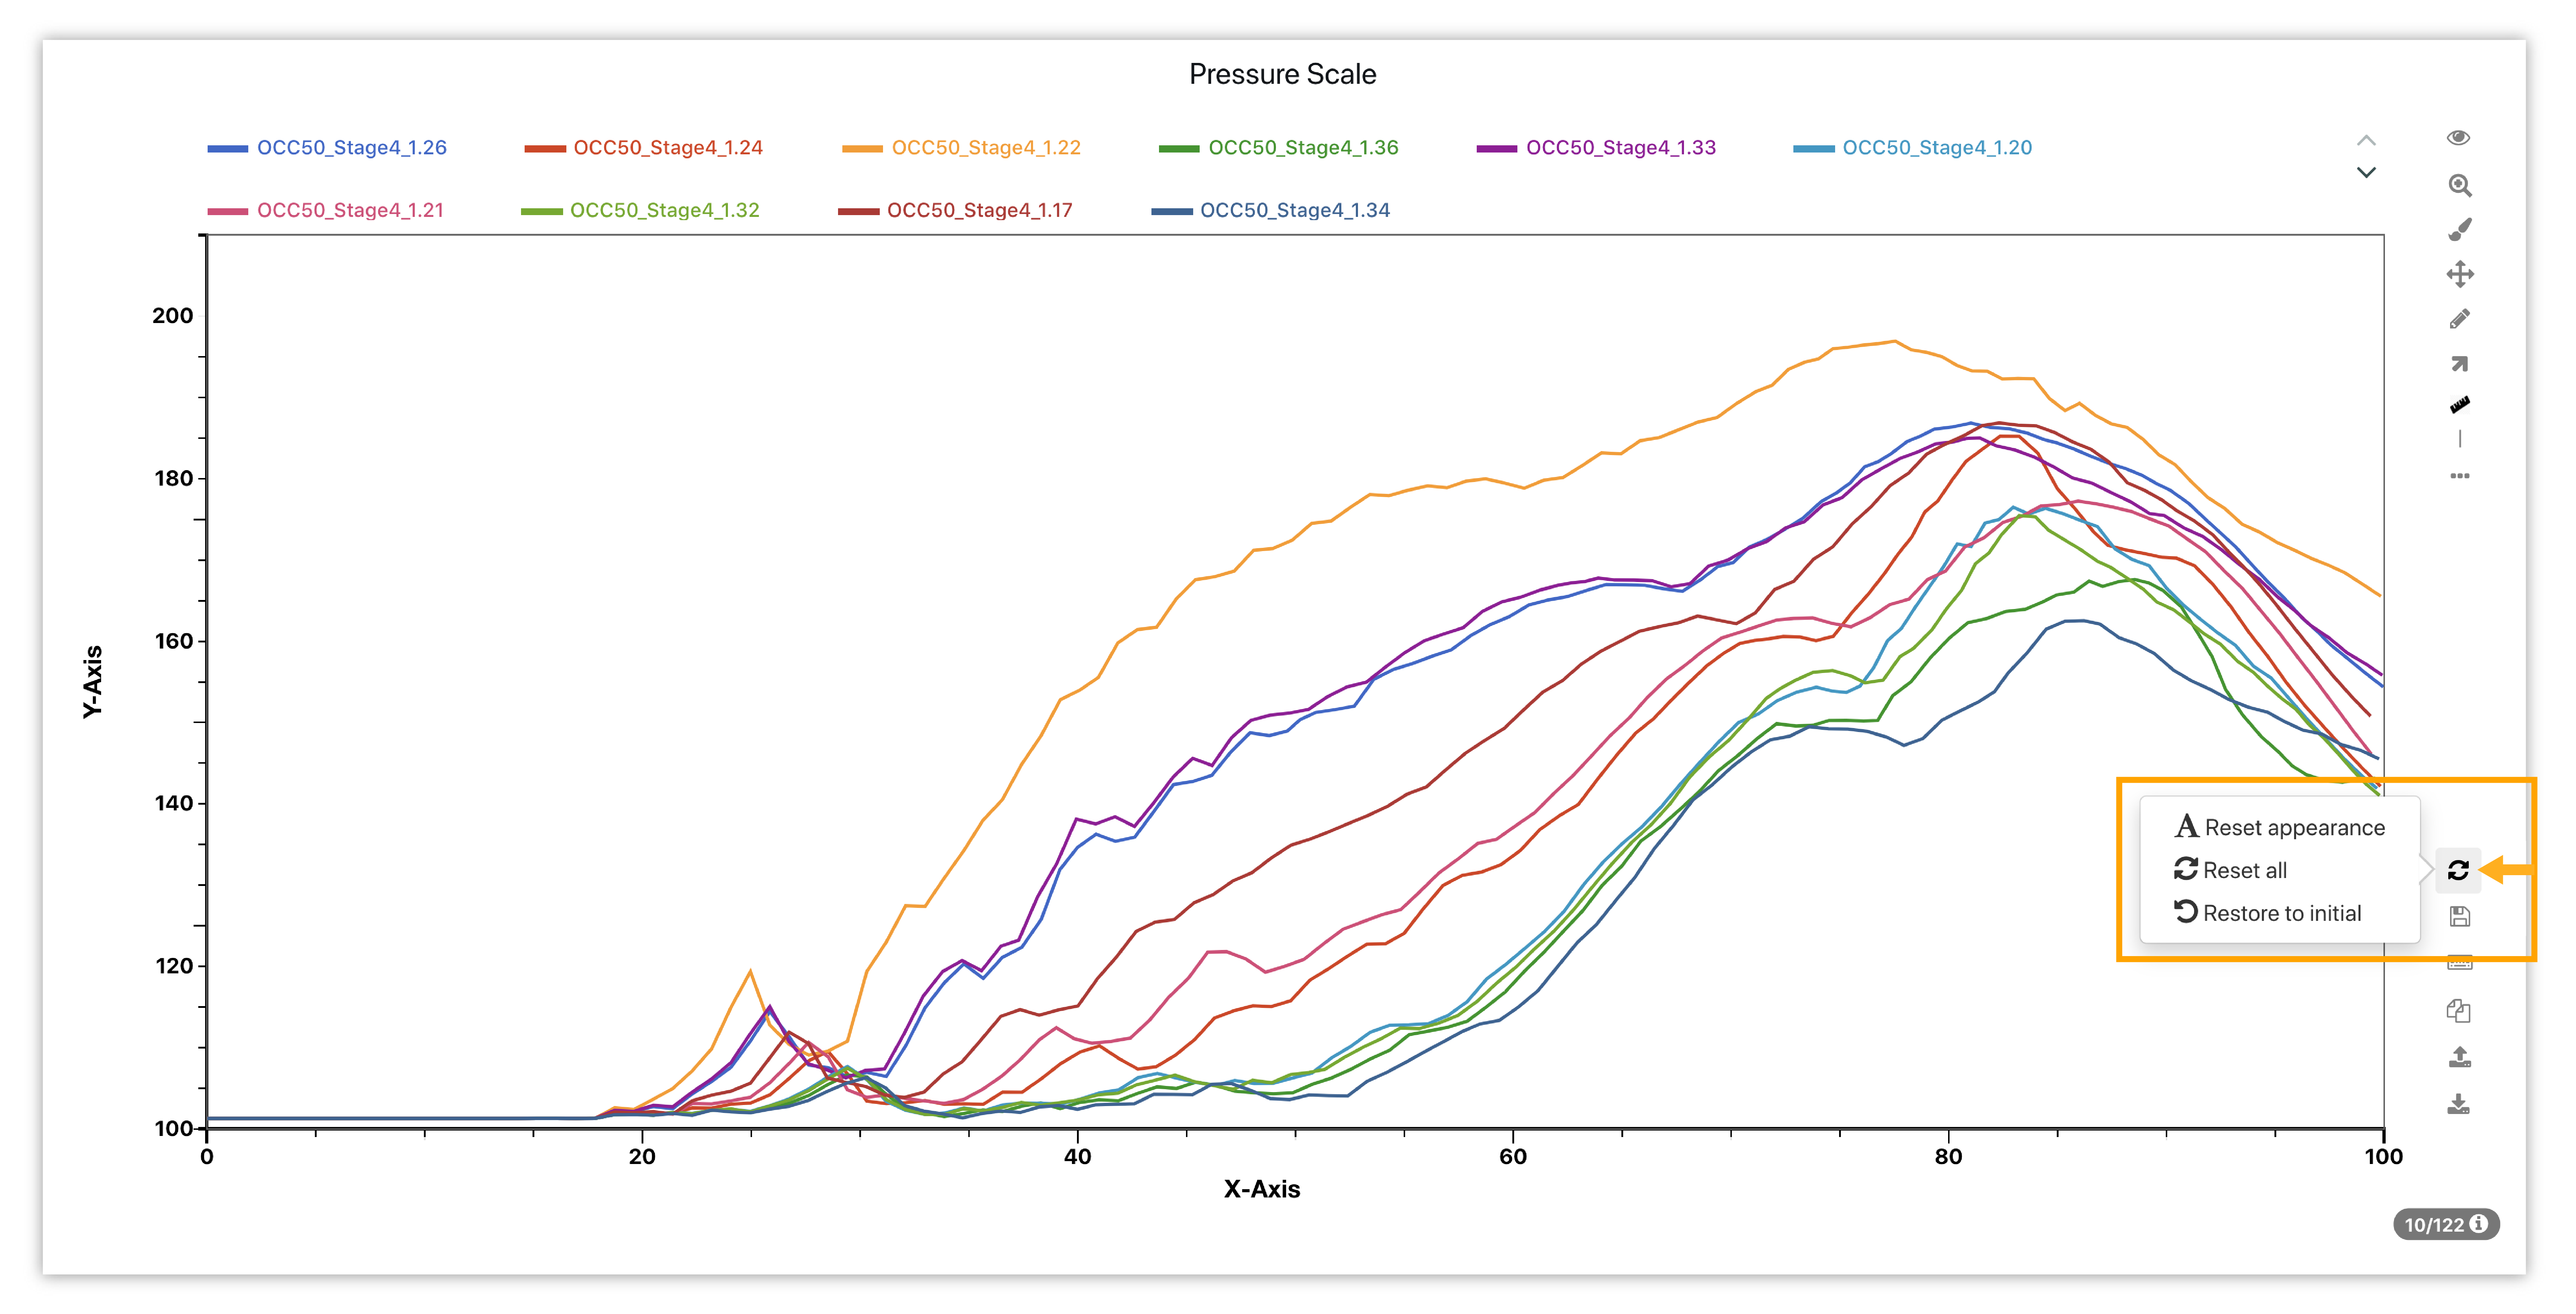
Figure 6: Reset Options
Curving Brushing
When using the highlighter tool, right click on the chart to keep, exclude or remove the brushed curves.
Figure 7: Curve Brushing Options
Event Mapping
Newton has a feature that allows you to map and detect events of curves. Watch the following video to see how its works:
Annotations
Click on the pencil icon to add text. Edit the label under right-click which also supports variables.
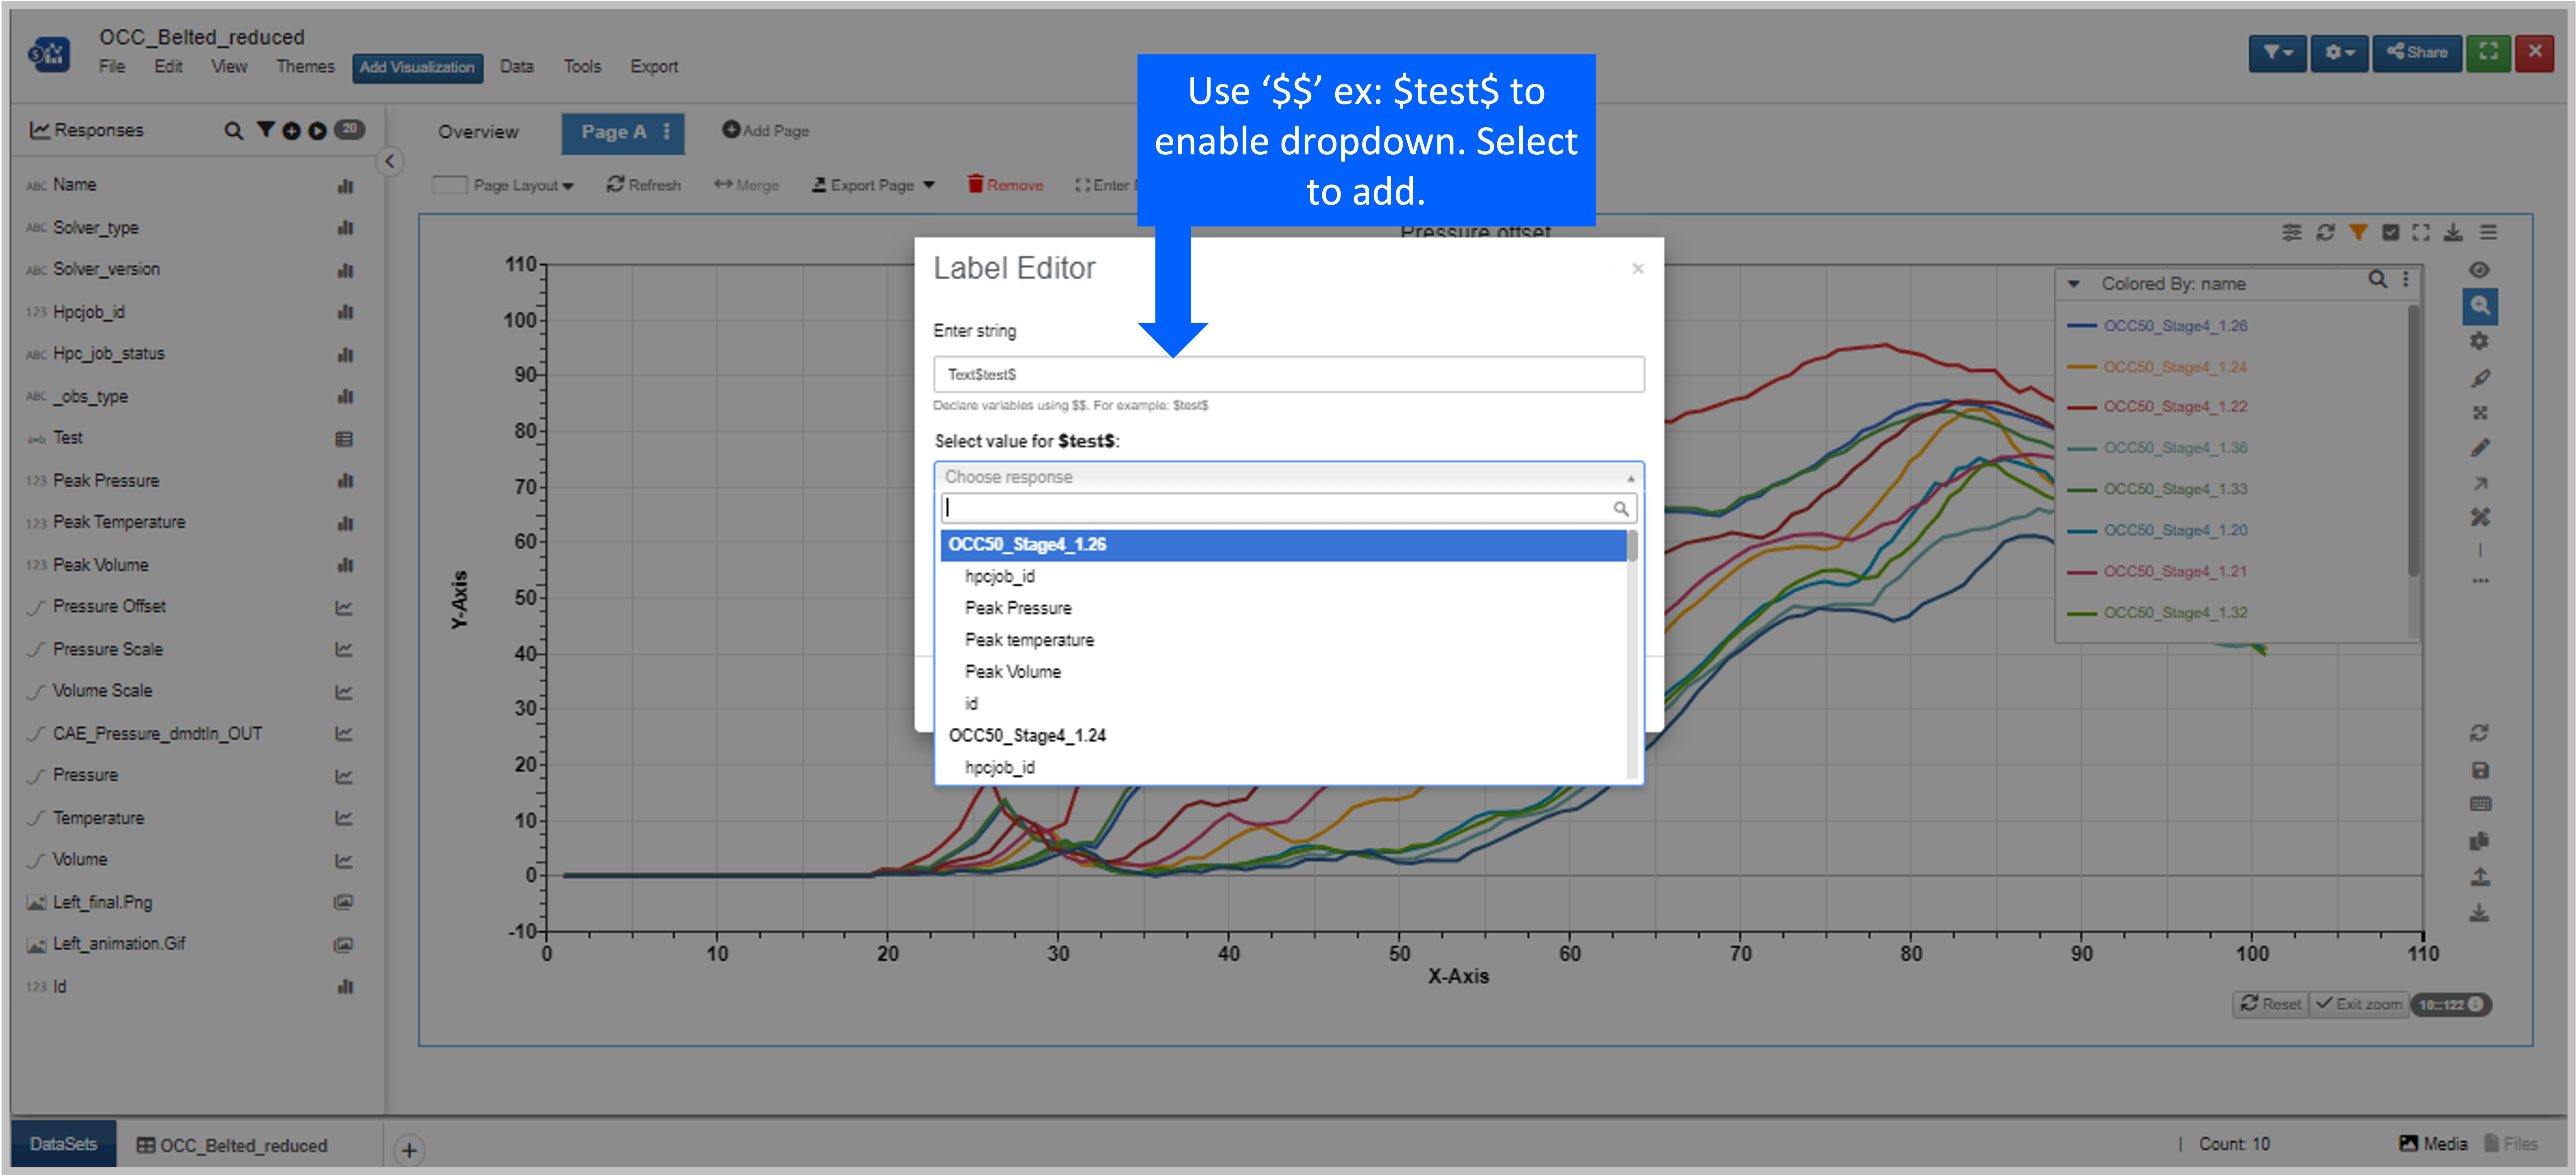
Figure 8: Annotation Variables
Sync
Click on the sync option at the top of a Newton page to sync the current page’s visualization together.
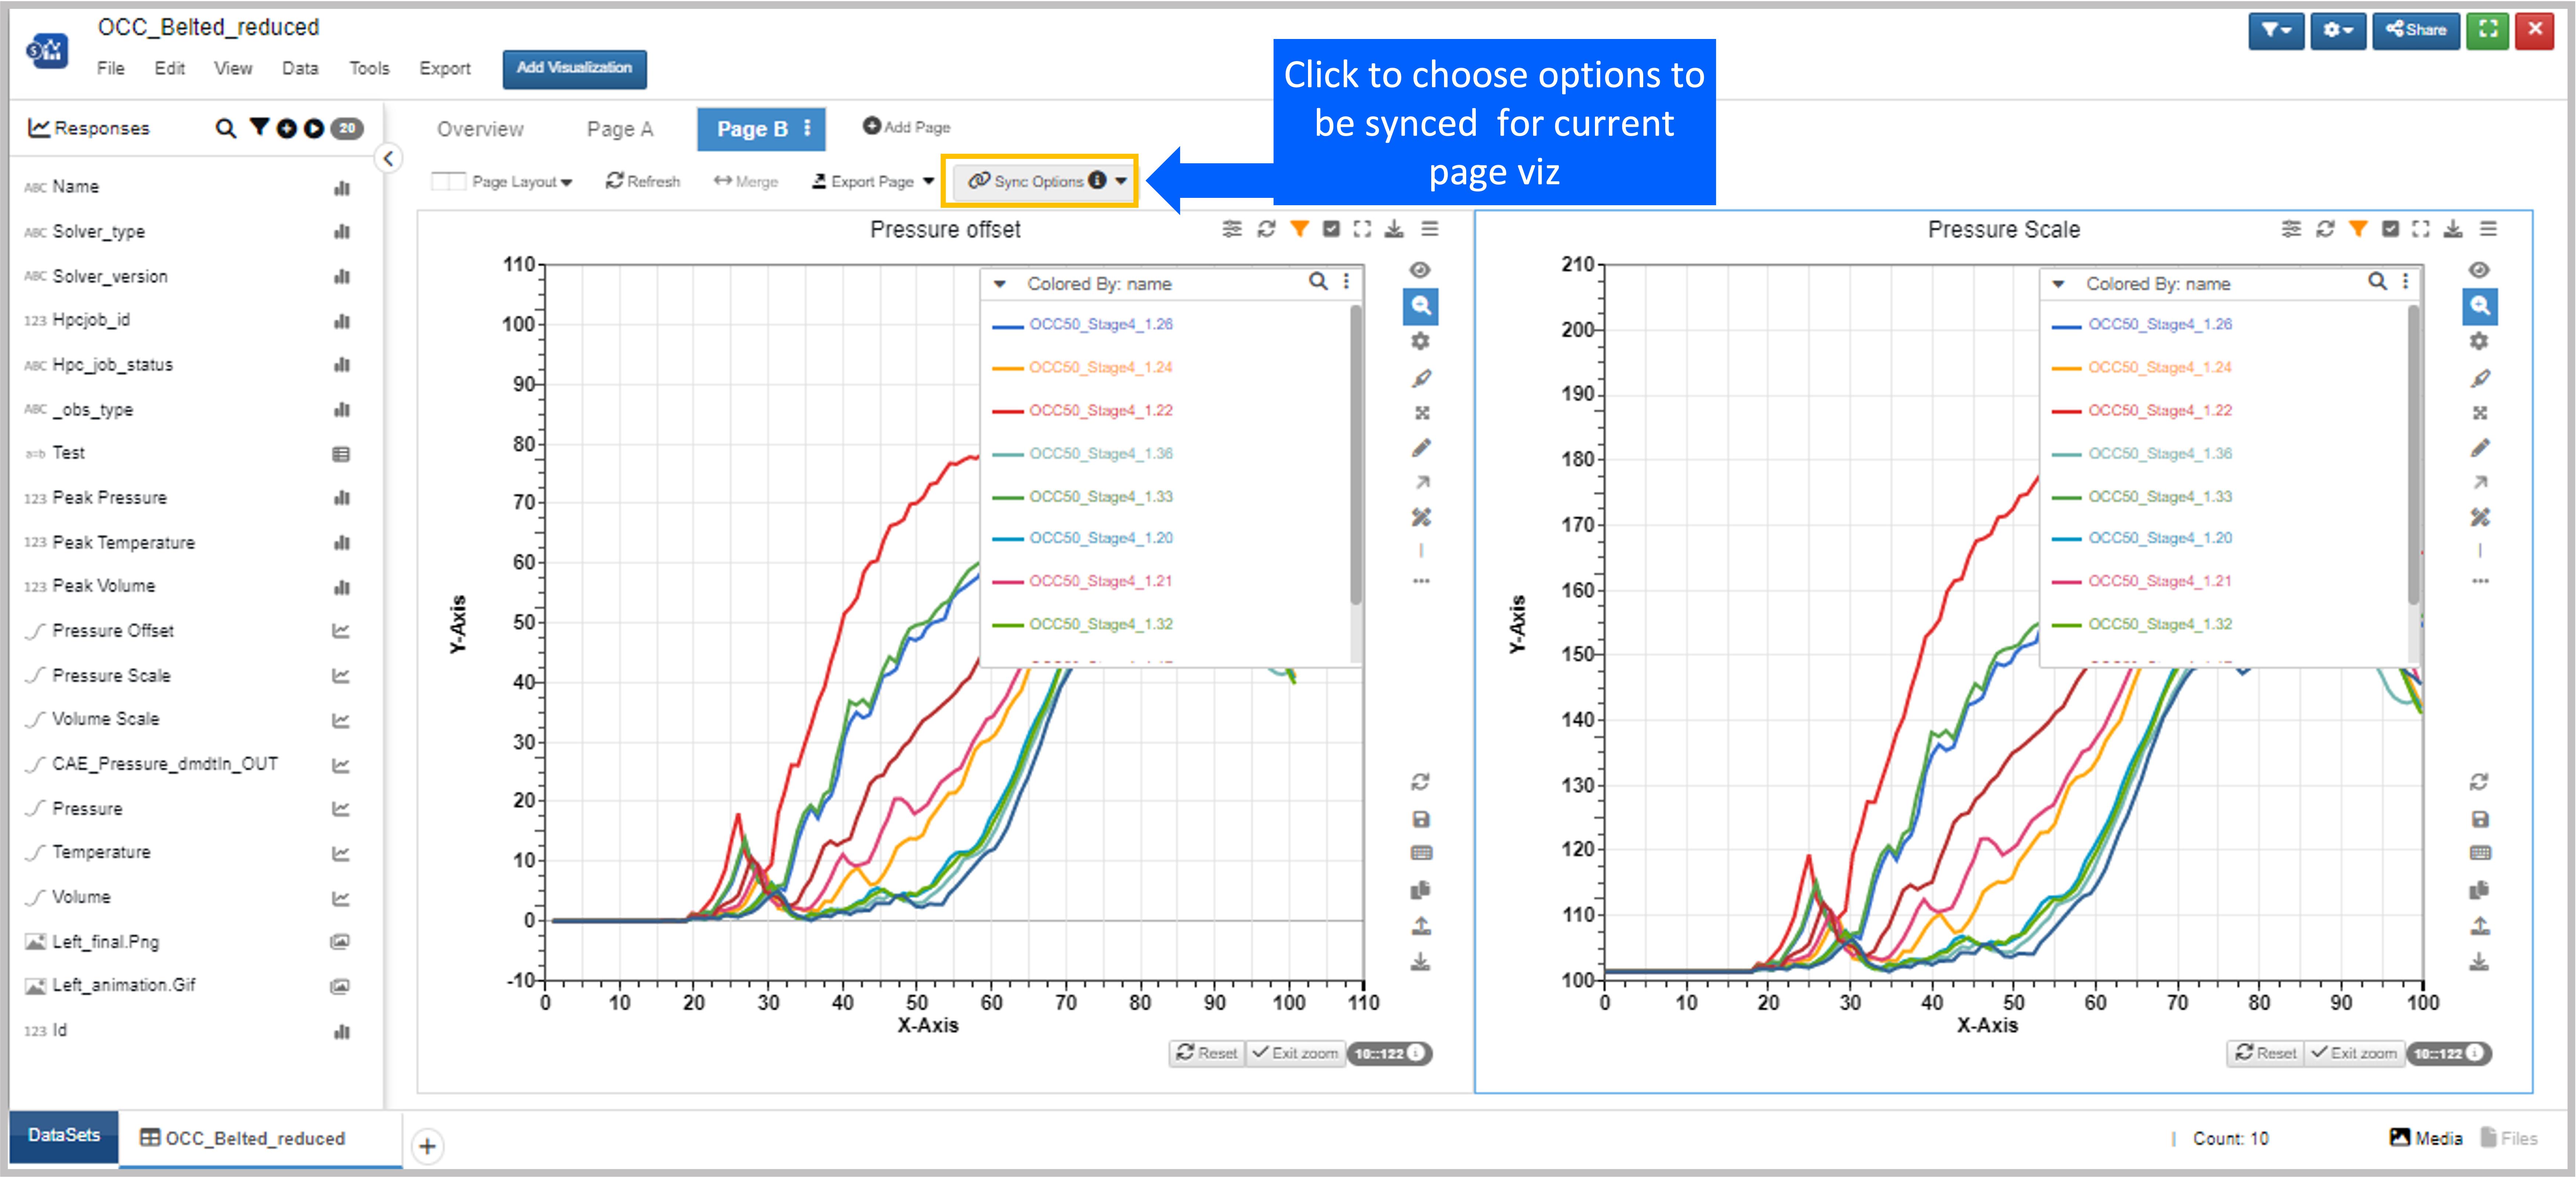
Figure 9: Annotation Variables
Progressive Rendering
Progressive view for complex curves computes the top 5000 points along with not missing out of min, max, 0, and important drops in the curve. Since Newton syncs with other applications, this applies to any other curve viewing throughout the platform aside from just Simlytiks.
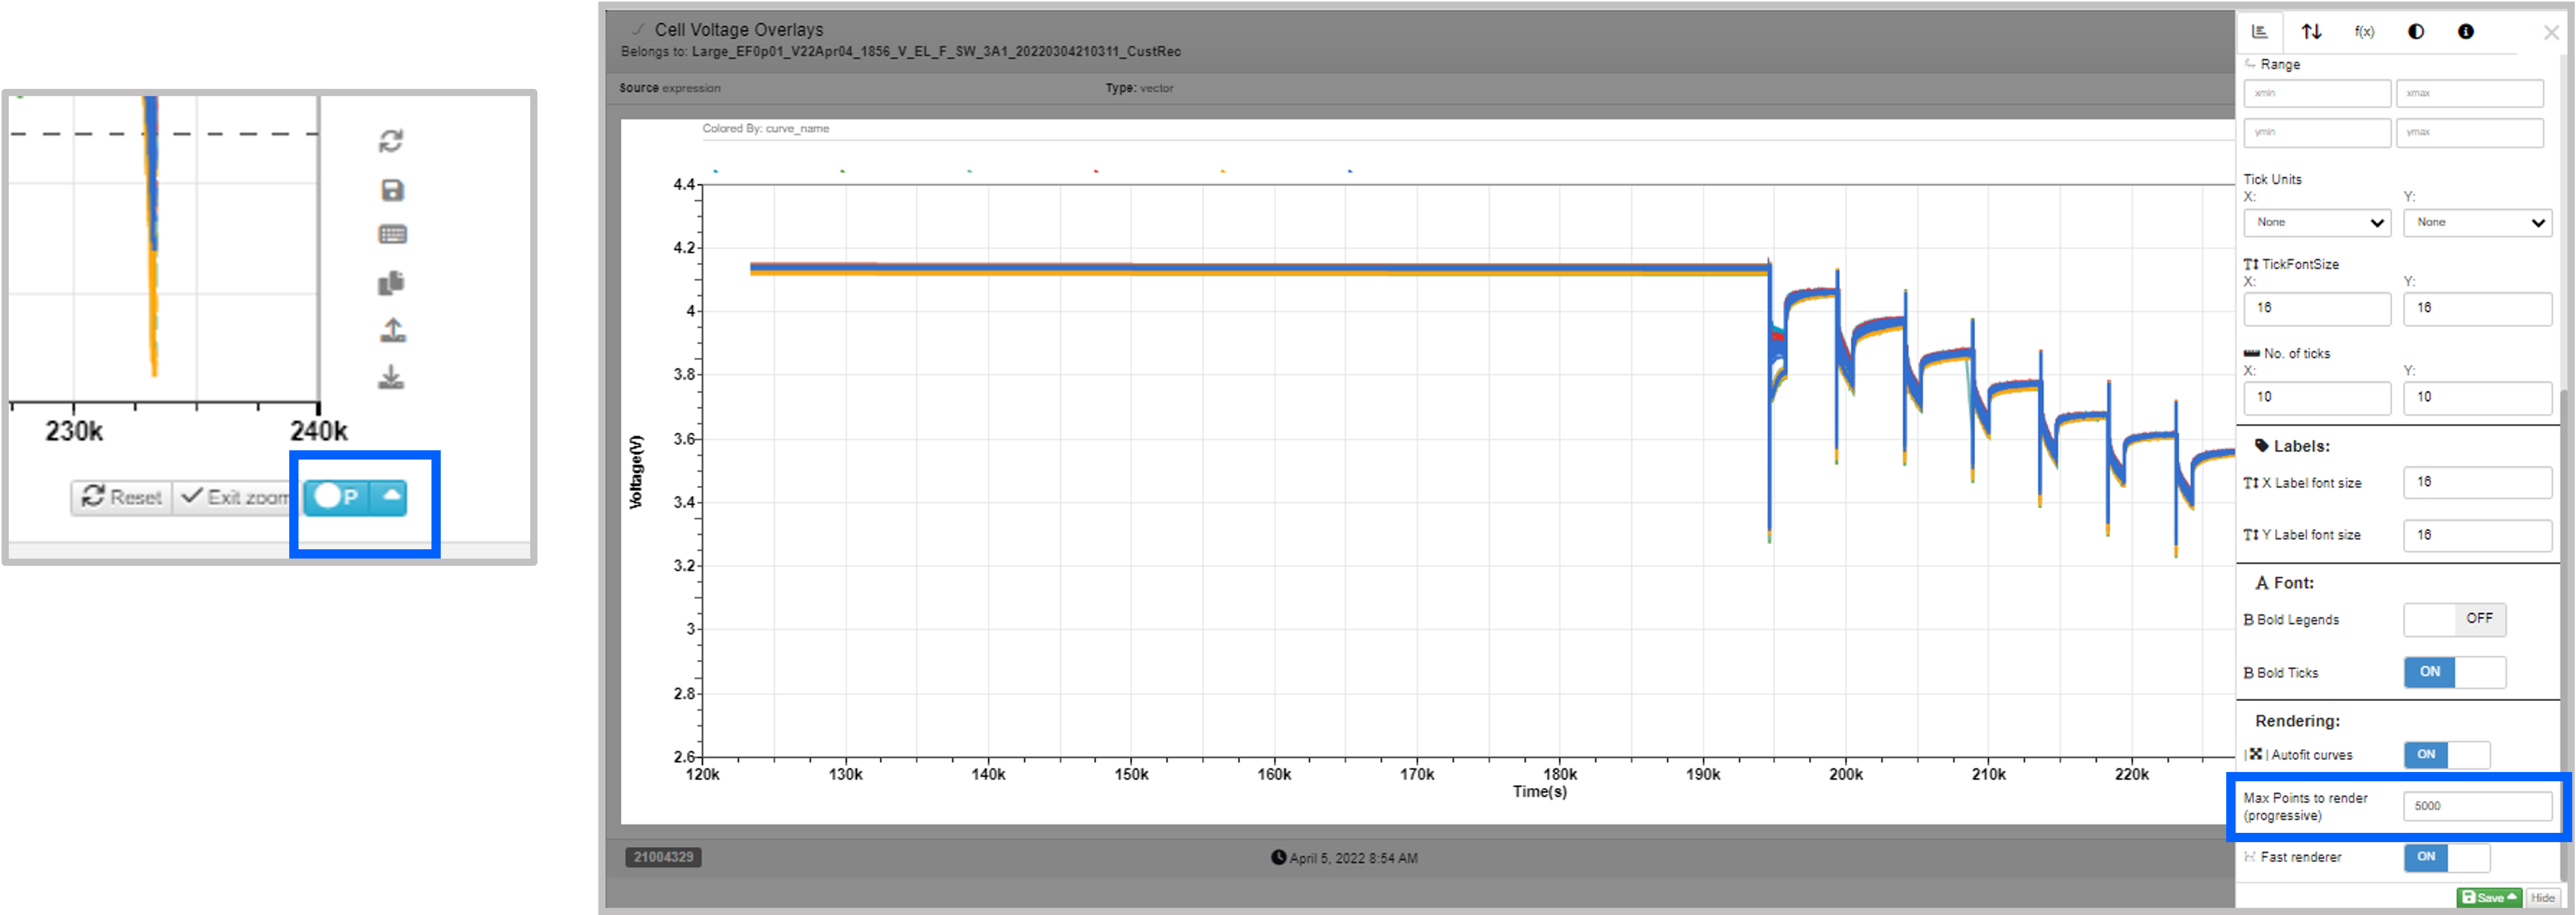
Figure 10: Progressive Rendering
14.4. Newton Chart Types
Under the eye icon in the right-side toolbar, we can change the chart type of our time-series plot. Aside from the main plot type, there are 10 other ways to view our curves. Let’s review a few of them.
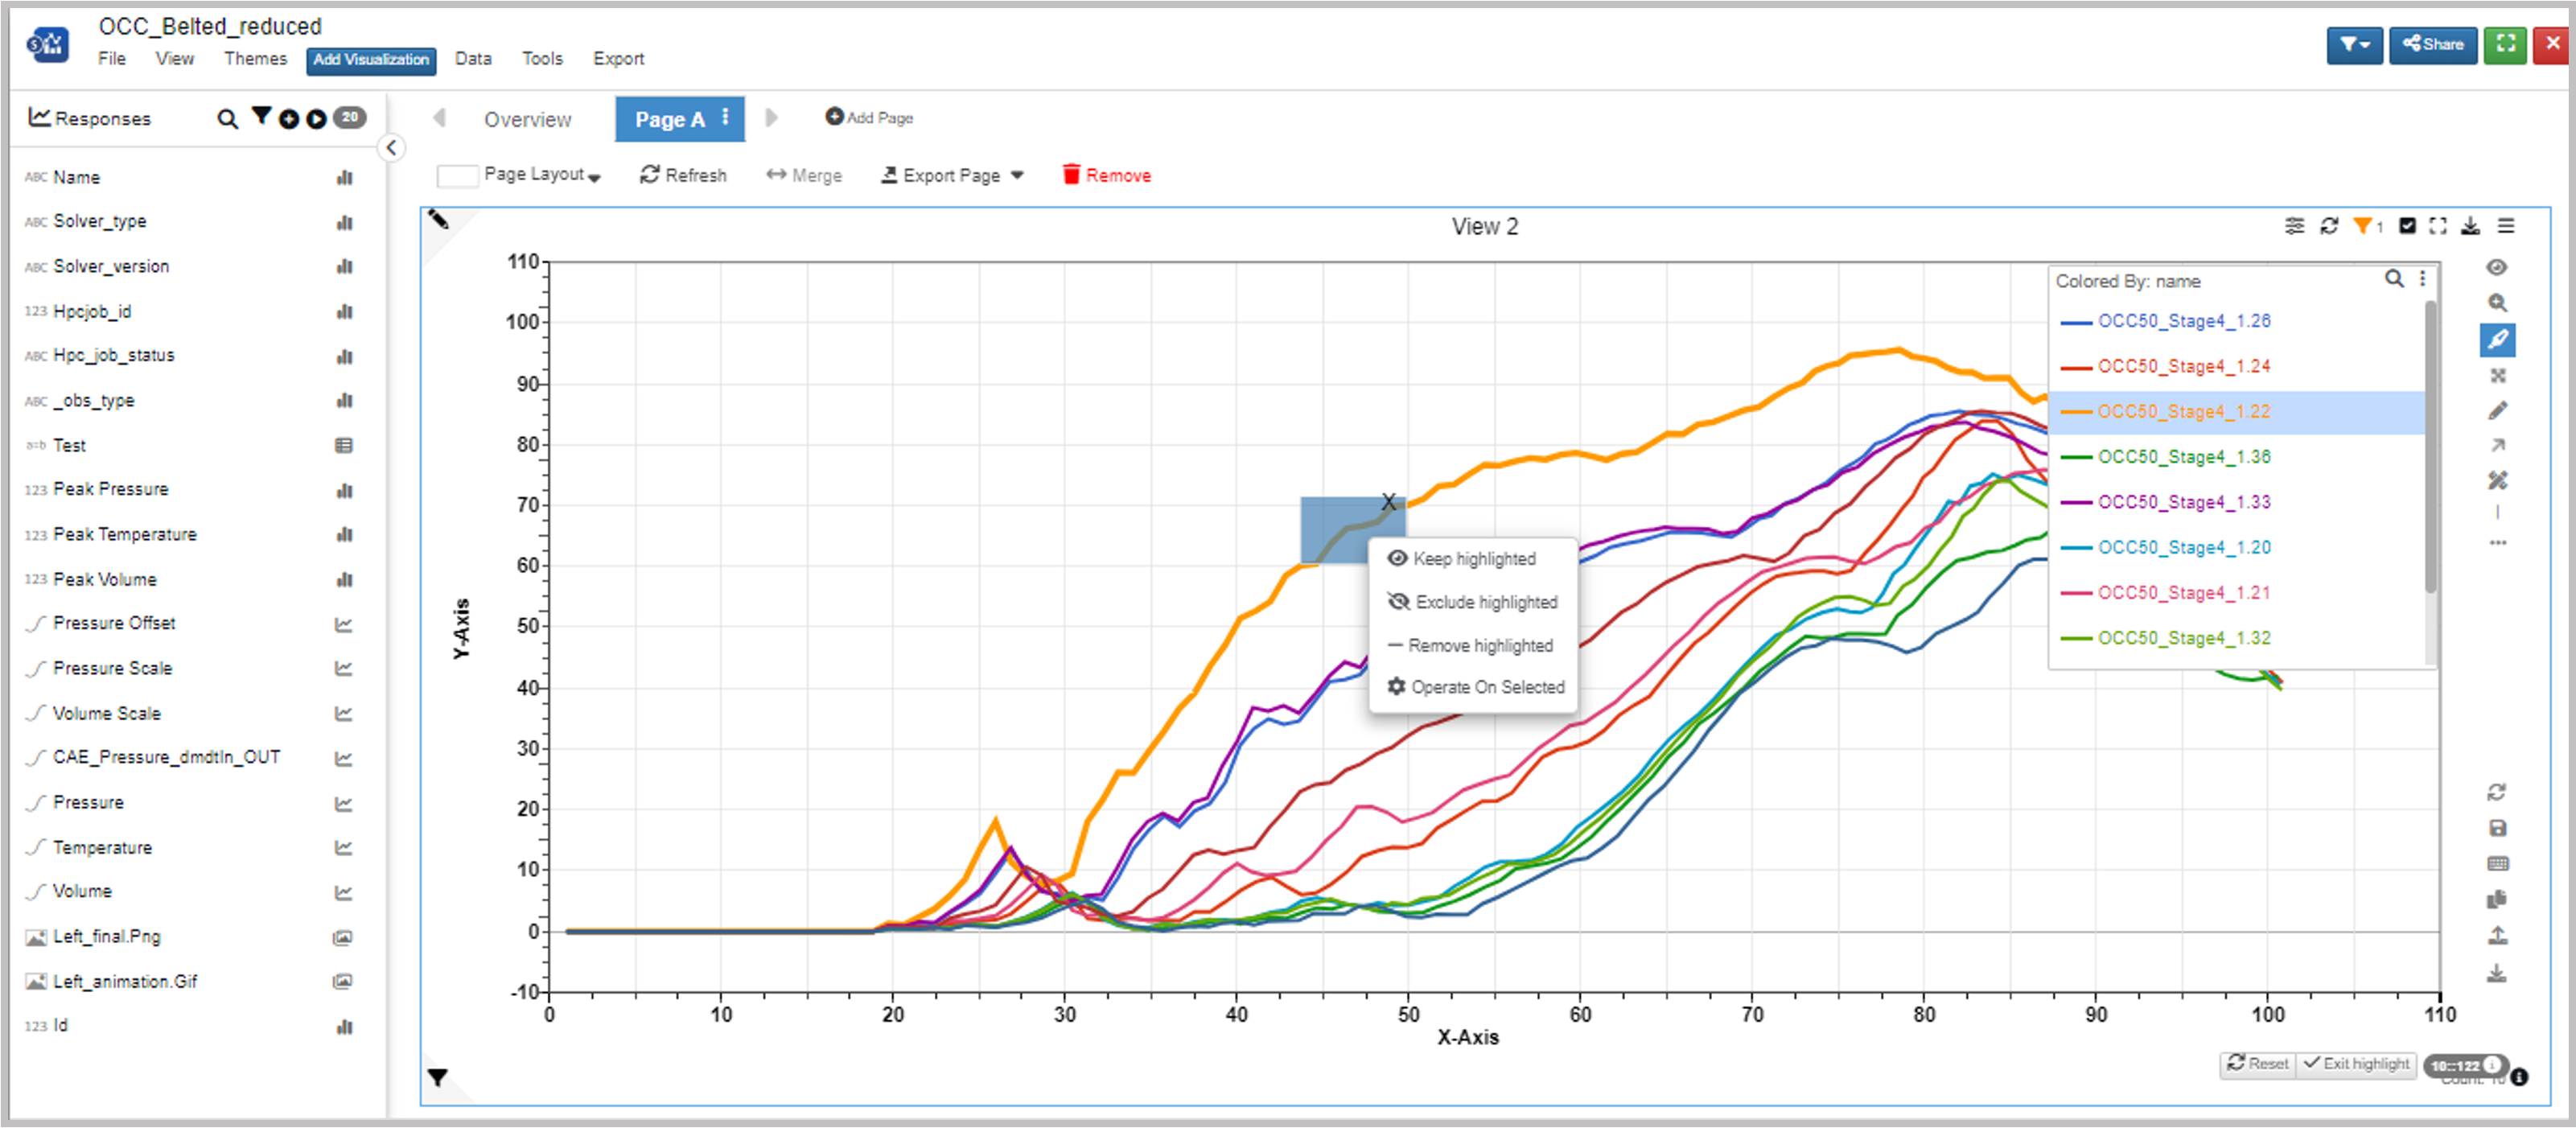
Figure 11: Newton Chart Types
Scatter Band
The Scatter Band chart type shows the band area of the curves along with the average curve of all (shown as the dashed line).
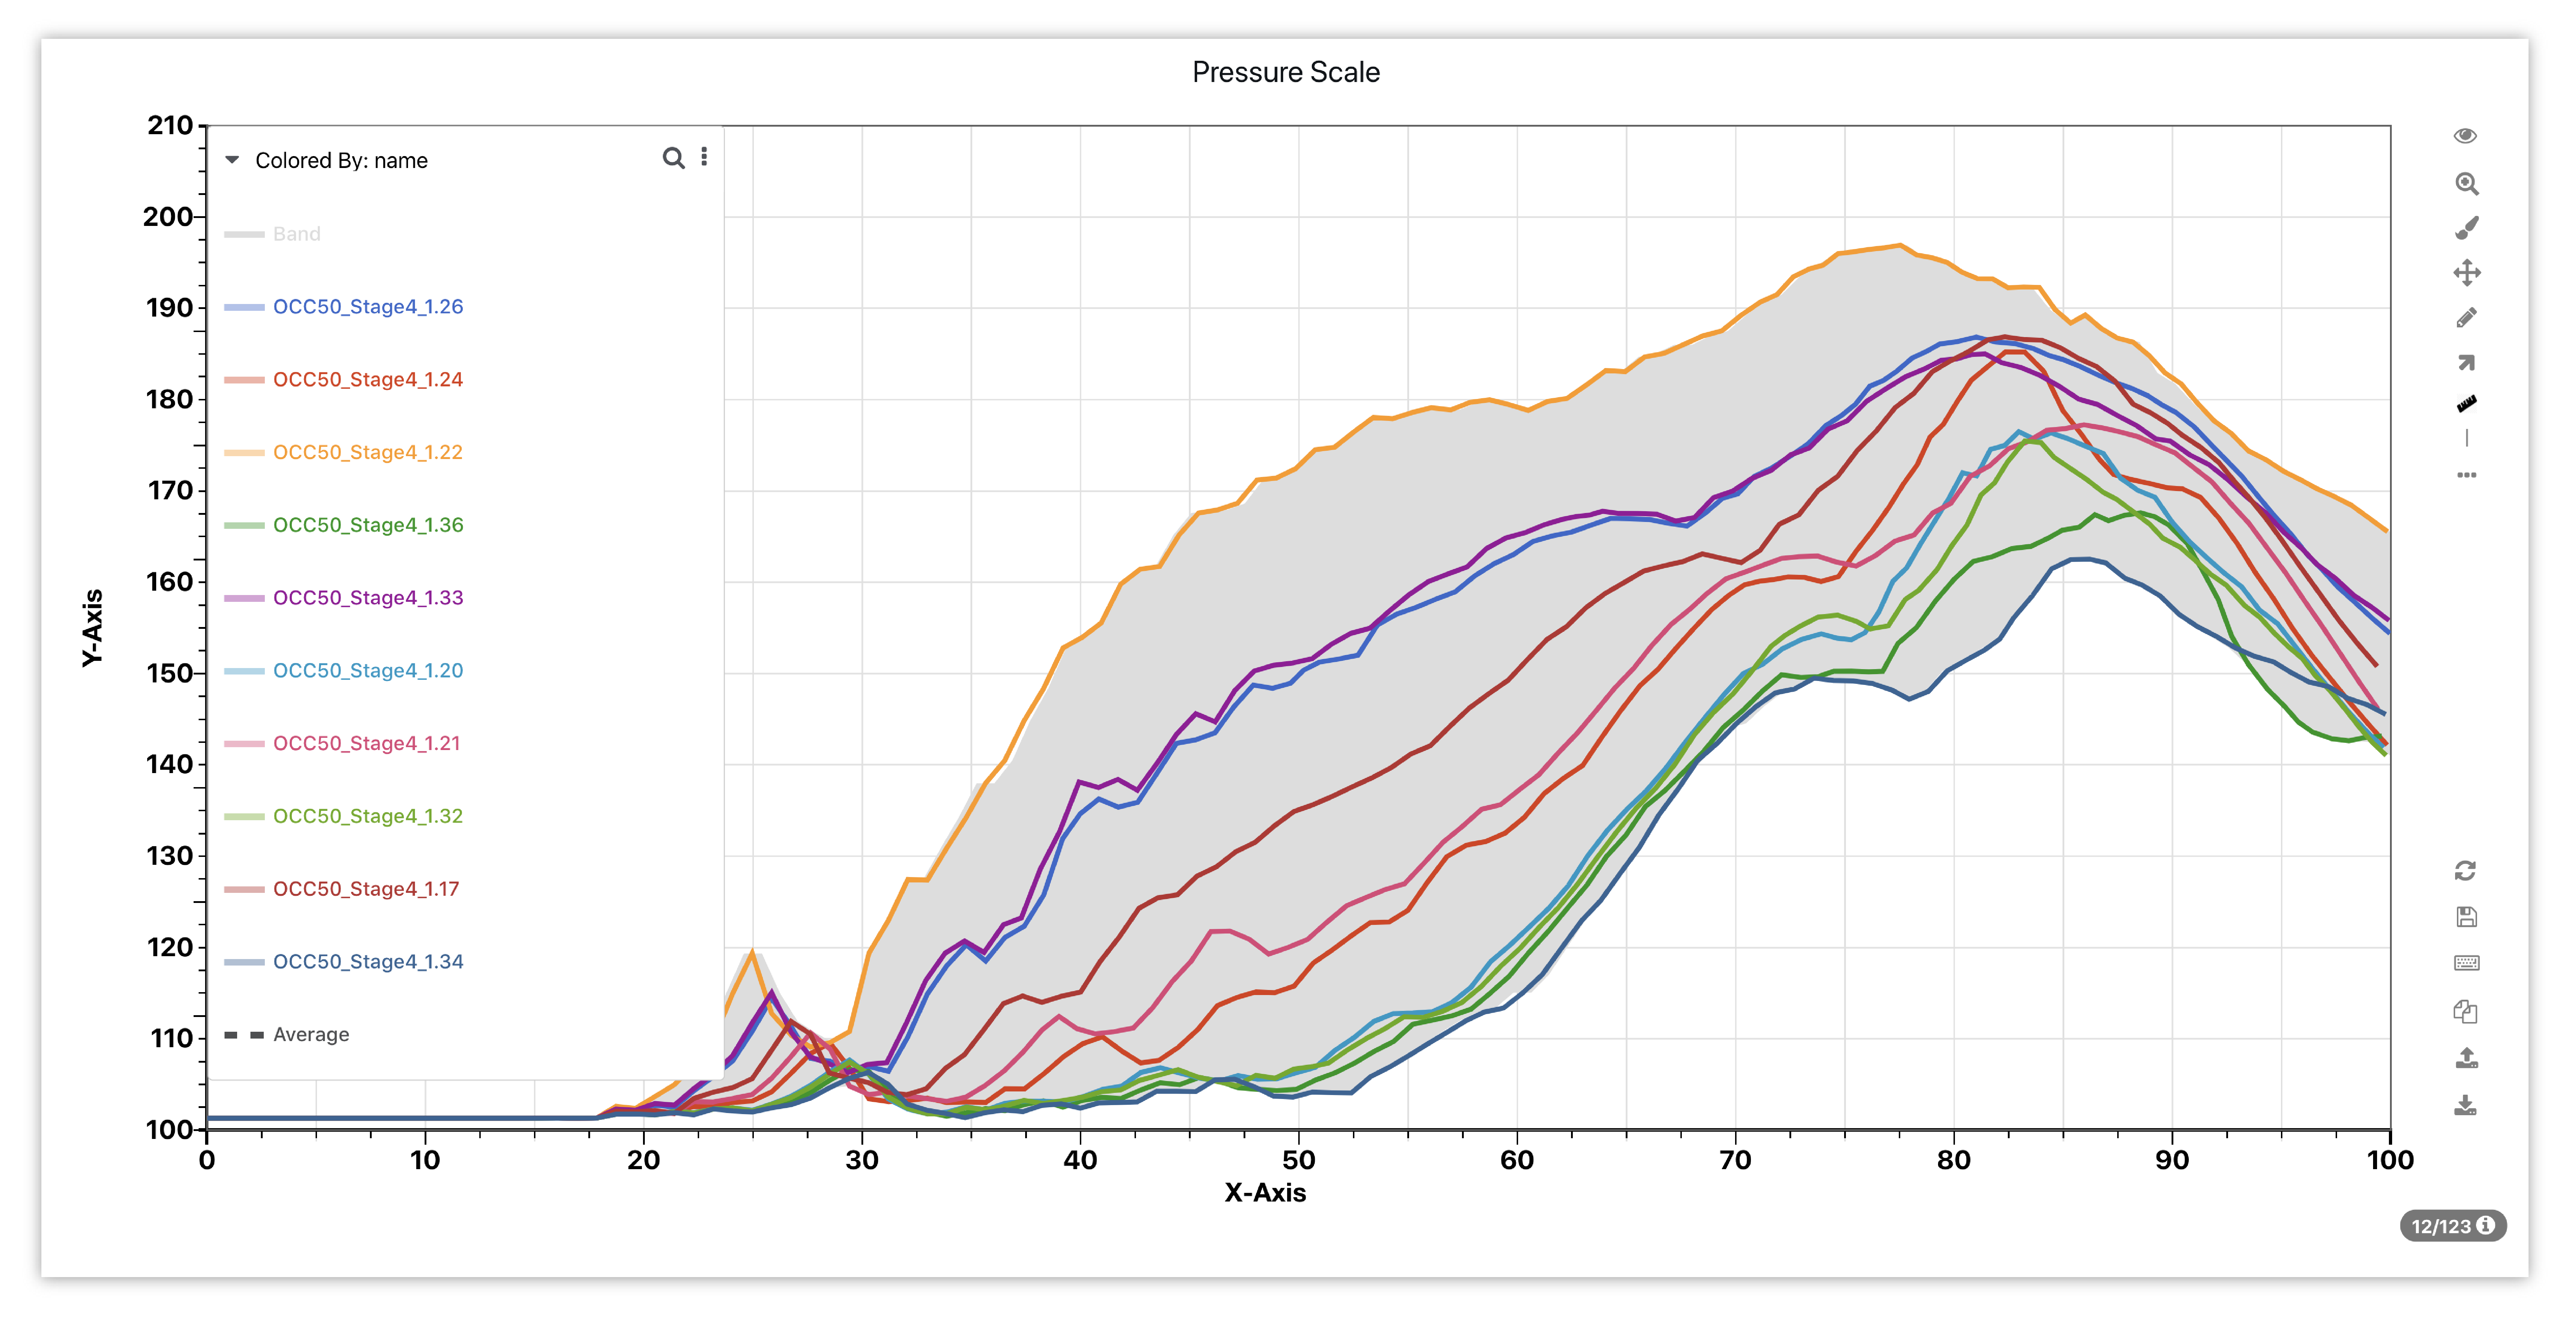
Figure 12: Scatter Band
Histogram
The Histogram chart type shows a distribution of data for each curve and how it relates to the others.
Curve Difference
The Curve Difference chart type takes the y current and subtracts the y previous to see where incremental variations are within each curve.
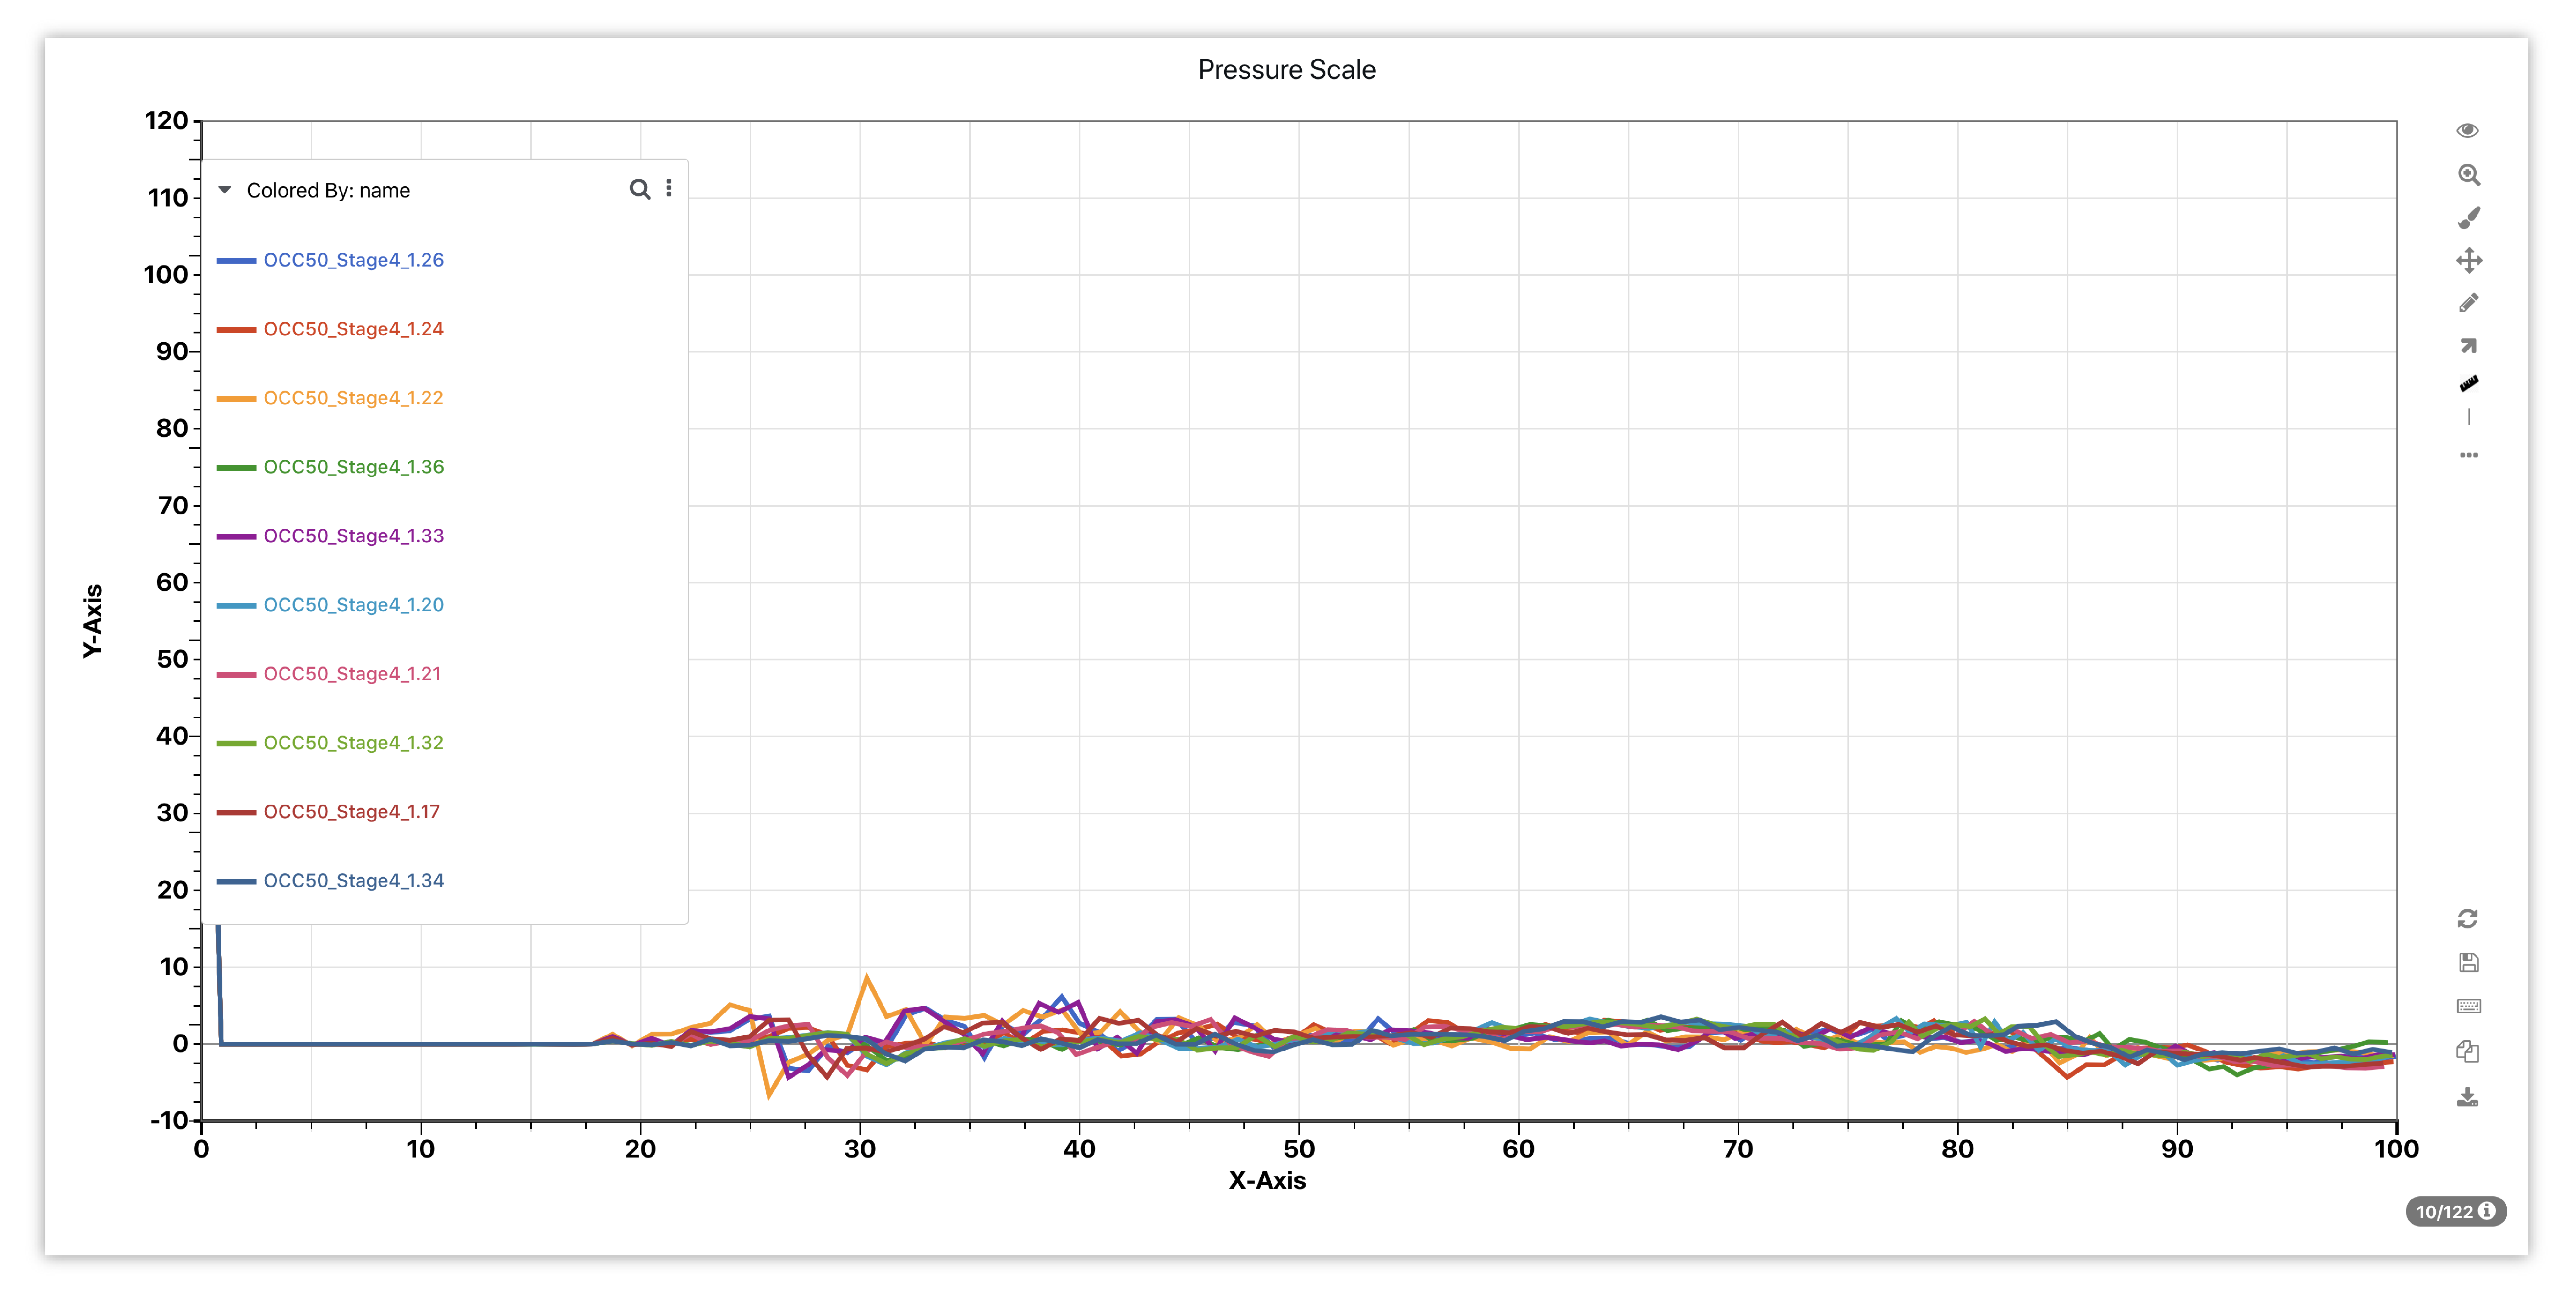
Figure 13: Curve Difference
Time-Series Summary Table
The Time-Series Summary Table chart type resents scientific data in the table cells including curves and histograms, as we see these respected columns.