Curve Digitization in d3VIEW

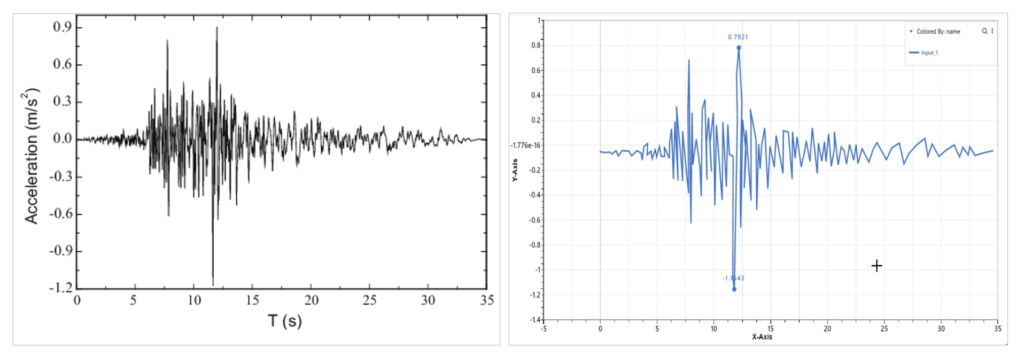
In several instances, time-history curves may need to be imported from either an Image (PNG/JPEG,.) or PDF files for use in comparison with simulations or for material calibration. d3VIEW Workflows now has the ability to digitize these images into a usable data curve. This post reviews the 5-step process in digitizing the image from a…

September 27, 2021 | by

Generate Part Contours with New d3VIEW Workers

Measuring the behavior of materials via specific procedures such as tension or shear tests aids in designing sound and safe products. d3VIEW supports this process by offering tools such as Material Calibration workers in our Workflows application. Recently, two new workers have been created for this, Key Value Generate Part Contours and Curves Generate Part…

August 13, 2021 | by

New and Refined Workflows User Interface (and a sneak peak into Workflows)

d3VIEW’s Workflows application has gotten a make-over. The new user-interface is more lucid and quite easier to navigate. Menus have been structured to keep options contained and grouped to make the Workflow application even more user-friendly. Read on to learn more. Edit Mode Refinements The new edit-mode menus are located at the top left. Click…

July 1, 2021 | by

Crashworthiness Tools in d3VIEW

d3VIEW isn’t just a general data mining and visualization platform. It caters to specific industries and concentrations, enhancing and accelerating product design. Crashworthiness, the pinnacle of vehicle safety and an important element in vehicle design, is no stranger to the platform. Featured below are some tools d3VIEW has specifically designed for crashworthiness. Crash Workers The…

June 17, 2021 | by

New Workflow Features

d3VIEW platform is continually enhanced for improved efficiency, better usability and more intelligent processes. The Workflows application has recently been updated with a lot of these enhancements. In addition to the abundance of amazing features that exist already, the app now has some remarkable improvements to add to the mix. Highlighted below are a few…

June 10, 2021 | by

Highlighting Our Favorite Curve Transformations

Did you know d3VIEW has over 900 workers for employing data extractions and scientific processes? Many of these workers also correspond to transformations that can be applied individually to data responses, particularly curve responses. Curves may very well be the most used way to visualize scientific data which is why curve transformations can be so…

May 20, 2021 | by

d3VIEW Applications: A Cheat Sheet on How They All Connect

The d3VIEW Applications collaborate together to make your data-to-decisionTM experience seamless. Each application has a specific role, from data management in Databases to data exploration in Simlytiks, as part of the whole. Structure your data-to-decisionTM making based on how they connect to get the most out of your experience on the platform. The following graphics…

April 15, 2021 | by