Introduction
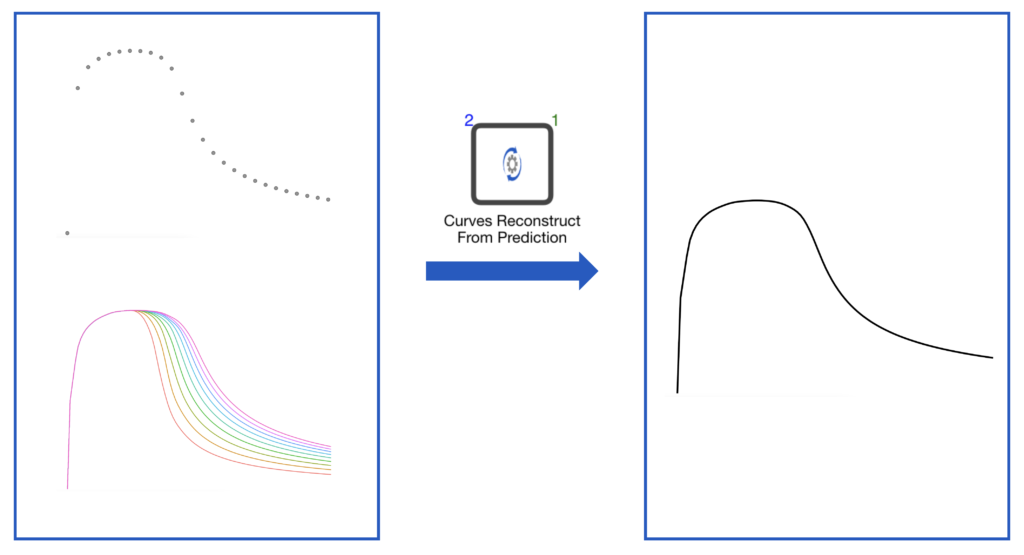
Given a set of points, we want to construct a curve that shares some specific patterns described by a group of curves.
From the description of the problem, there are two pieces of information available to us. First, the points available (Prediction Points) are part of an unknown curve we want to reconstruct. Second, this unknown curve (Prediction Curve) shares the same characteristic patterns defined by a group of known curves (Input curves). The information determines that a simple interpolation will not fulfill the goal of integrating the characteristic patterns to the reconstructed curve.
Curve reconstruction with d3VIEW Workflow
d3VIEW Workflow has a curves_reconstruct_from_prediction worker to perform the task. It takes two inputs, the group of input curves and prediction points. And the output is the constructed curve that passes the given prediction points and shares the characteristic patterns. Instead of a simple interpolation, it is a weighted average of the points from the input curves. As a result, it has the capability to capture the patterns from the input curves.
Examples
It is intuitive that more prediction points will generate a more accurate reconstructed curve. Meanwhile, we are interested in knowing if there is a number of prediction points that is small but also large enough so that the error between the reconstructed curve and the prediction curve is acceptable.
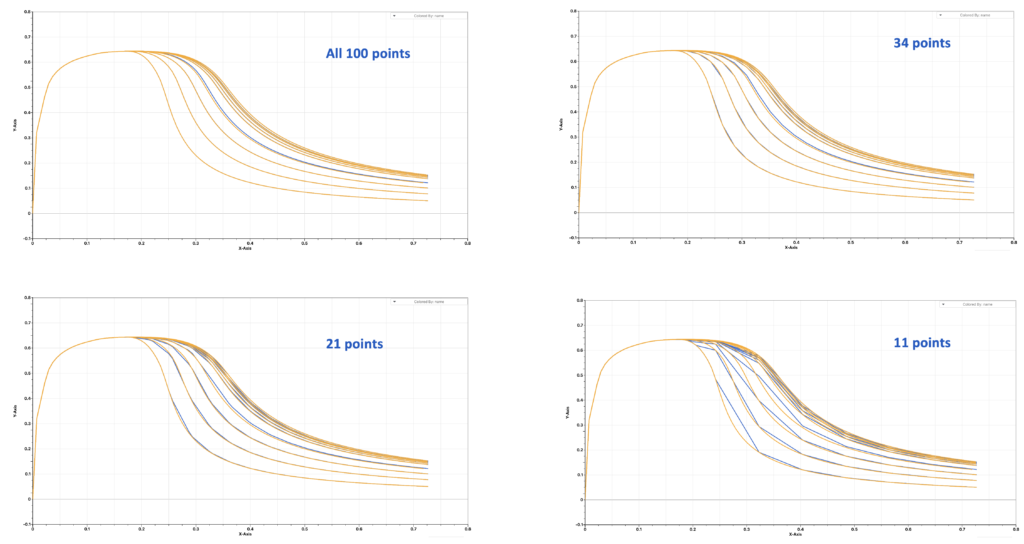
To find it out, we generate some simulation curves by varying the parameter and digitize them so that each curve has 100 points. These will be our input curves. We take a different number of points, say all 100 points, 34 points, 21 points and 11 points, from each of these input curves as the prediction points and use them for the curve reconstruction. The output will show us how many points are necessary to get a good result.
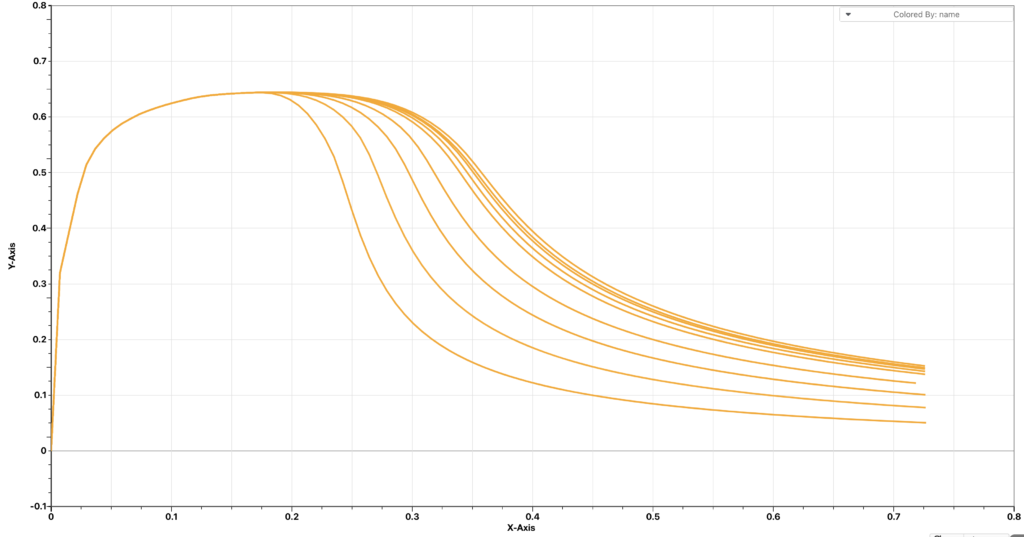
The figure below shows how the reconstructed curves compare to the input curves. It is clear that 11 points will miss some patterns from the input curves and reconstructed curves with around 30 points are fairly close to the input curves.
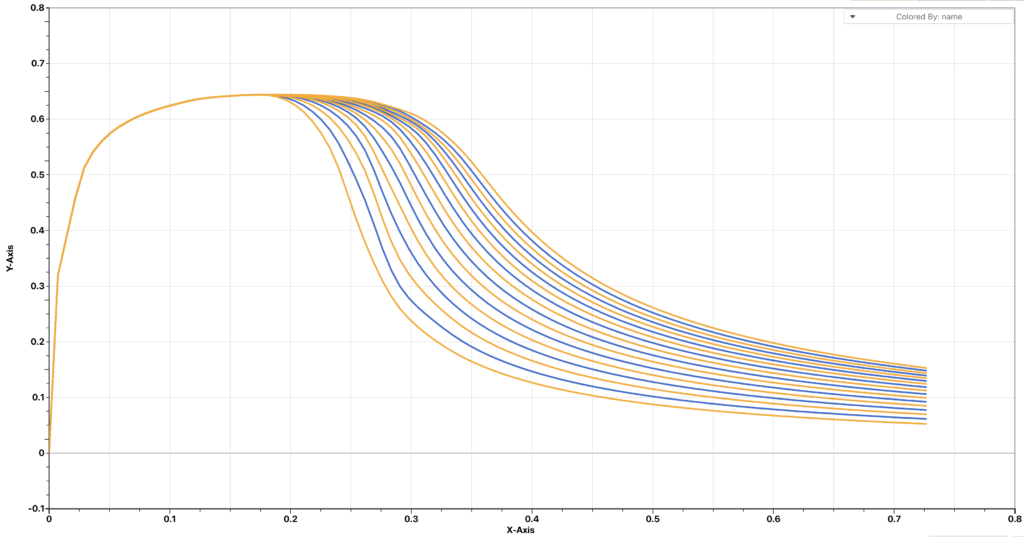
In the case above, we are taking prediction points from the input curves and thus the input curves are also the prediction curves. Now let’s take the prediction curves from a different set of curves (but with the same patterns).
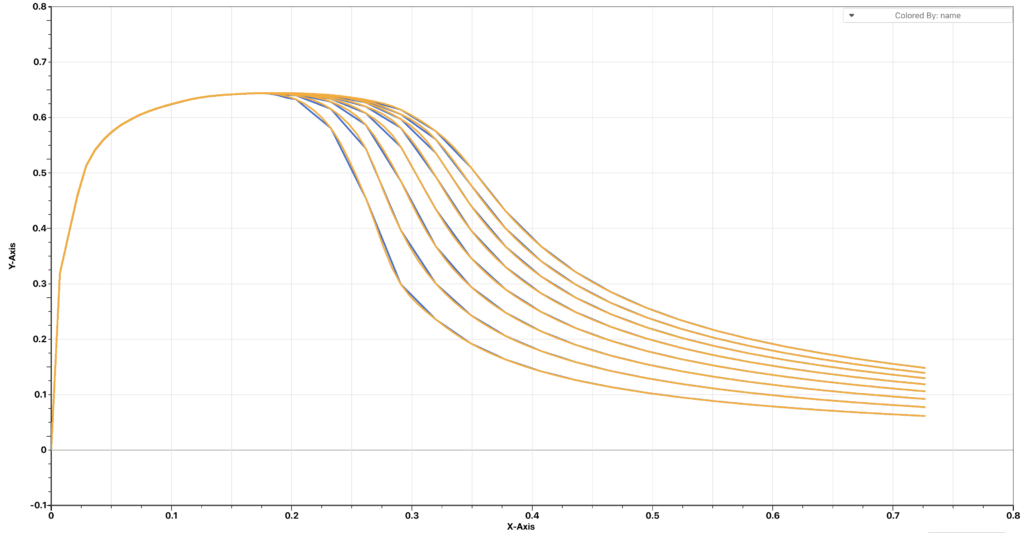
We take 26 points from each curve and use them as prediction points. The reconstructed curves are shown below. We can see that the reconstructed curves are very close to the prediction curves.
Prediction Points
Prediction points is a critical input for the worker curves_reconstruct_from_prediction to perform its computation accurately. Prediction points includes only y values. The requirements for the prediction points input are
- The x values of the selected points are symmetric. In another word, they are equally distanced.
- The first prediction point is the y value of the first point of the prediction curve and the last prediction point is the y value of the final point of the prediction curve.
Basically, the prediction points are y values of a subset of points from the prediction curve, the curve we want to reconstruct. And these points must spread out equally on the whole range of the time domain where we want to reconstruct our curve. If these requirements are not met, the reconstructed curves will either be purely not accurate or show an offset from the prediction curve.
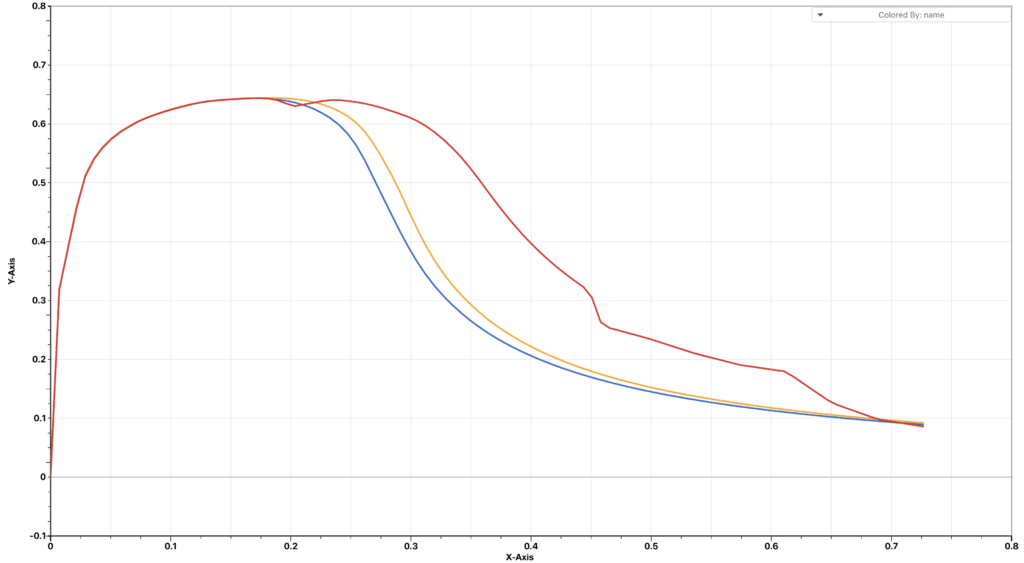
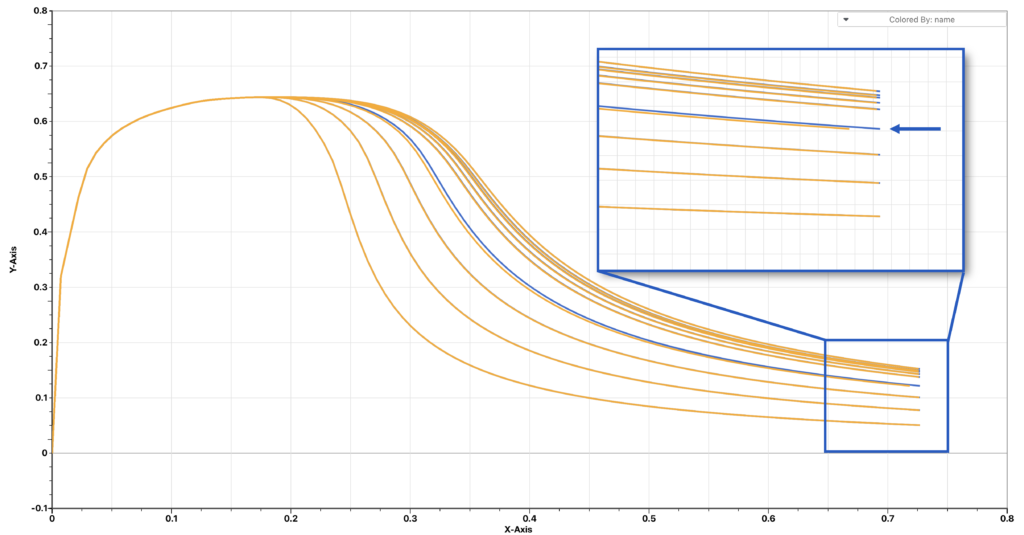
This is the reason why one of the reconstructed curve in the previous example shows an offset even when we were using all 100 points as prediction points. If we look closely to the end, that specific curve is shorter than the other input curves and thus the provided prediction points for that curve will not be equally distributed on the whole time domain, which is slightly longer than that for that specific curve.
Summary
The curves_reconstruct_from_prediction worker provides a great tool to reconstruct a curve from a subset of its points. Not only it reconstructs the curve, it also captures the patterns defined by a group of curves. It is a very useful tool when we want to restore a simplified curve to its original resolution at the cost of a small compromise of its accuracy. Meanwhile, we want to be cautious when we are providing the prediction points input. Both requirements must be met in order to get a good result.