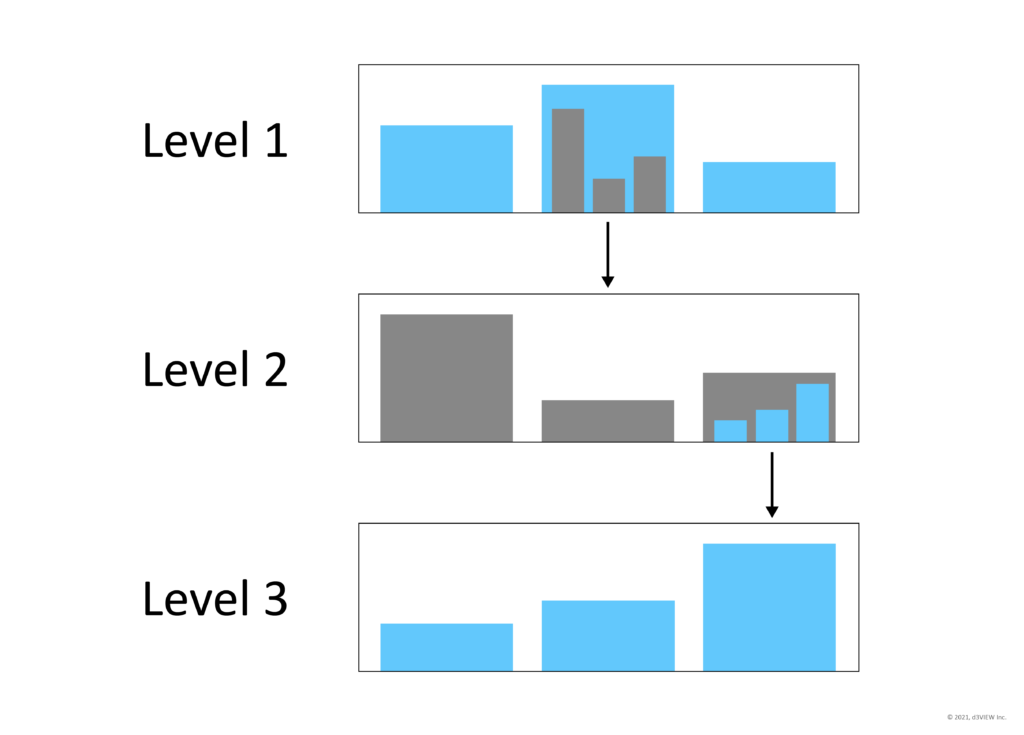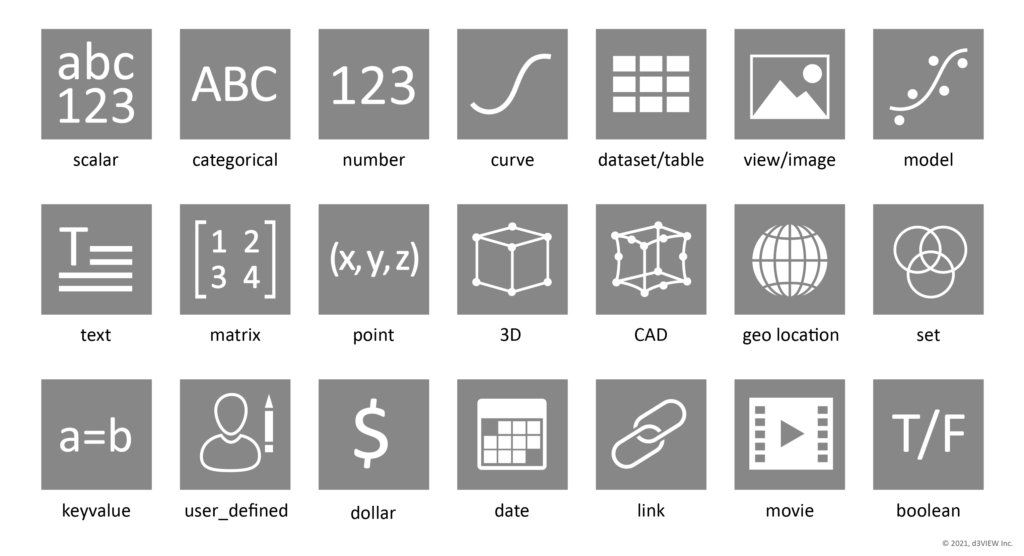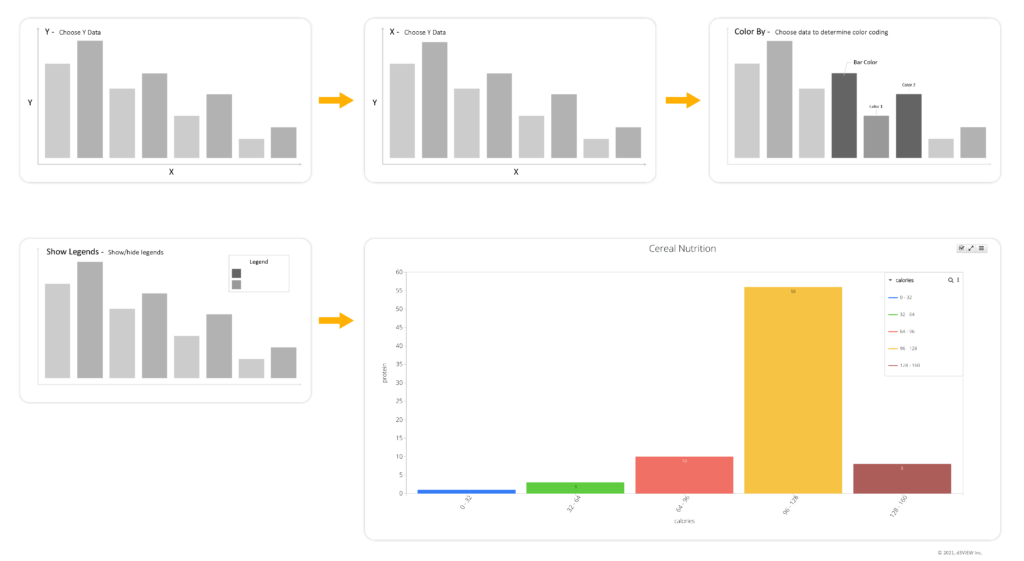
The endless amount of data exploration on Simlytiks makes the ability to effortlessly share our findings for reporting crucial. Reporting an exploration can be implemented via exporting or sharing single visualizers, pages or data sets. We’ll go over the most effective ways of exporting or sharing with the intention of efficiently reporting your findings.
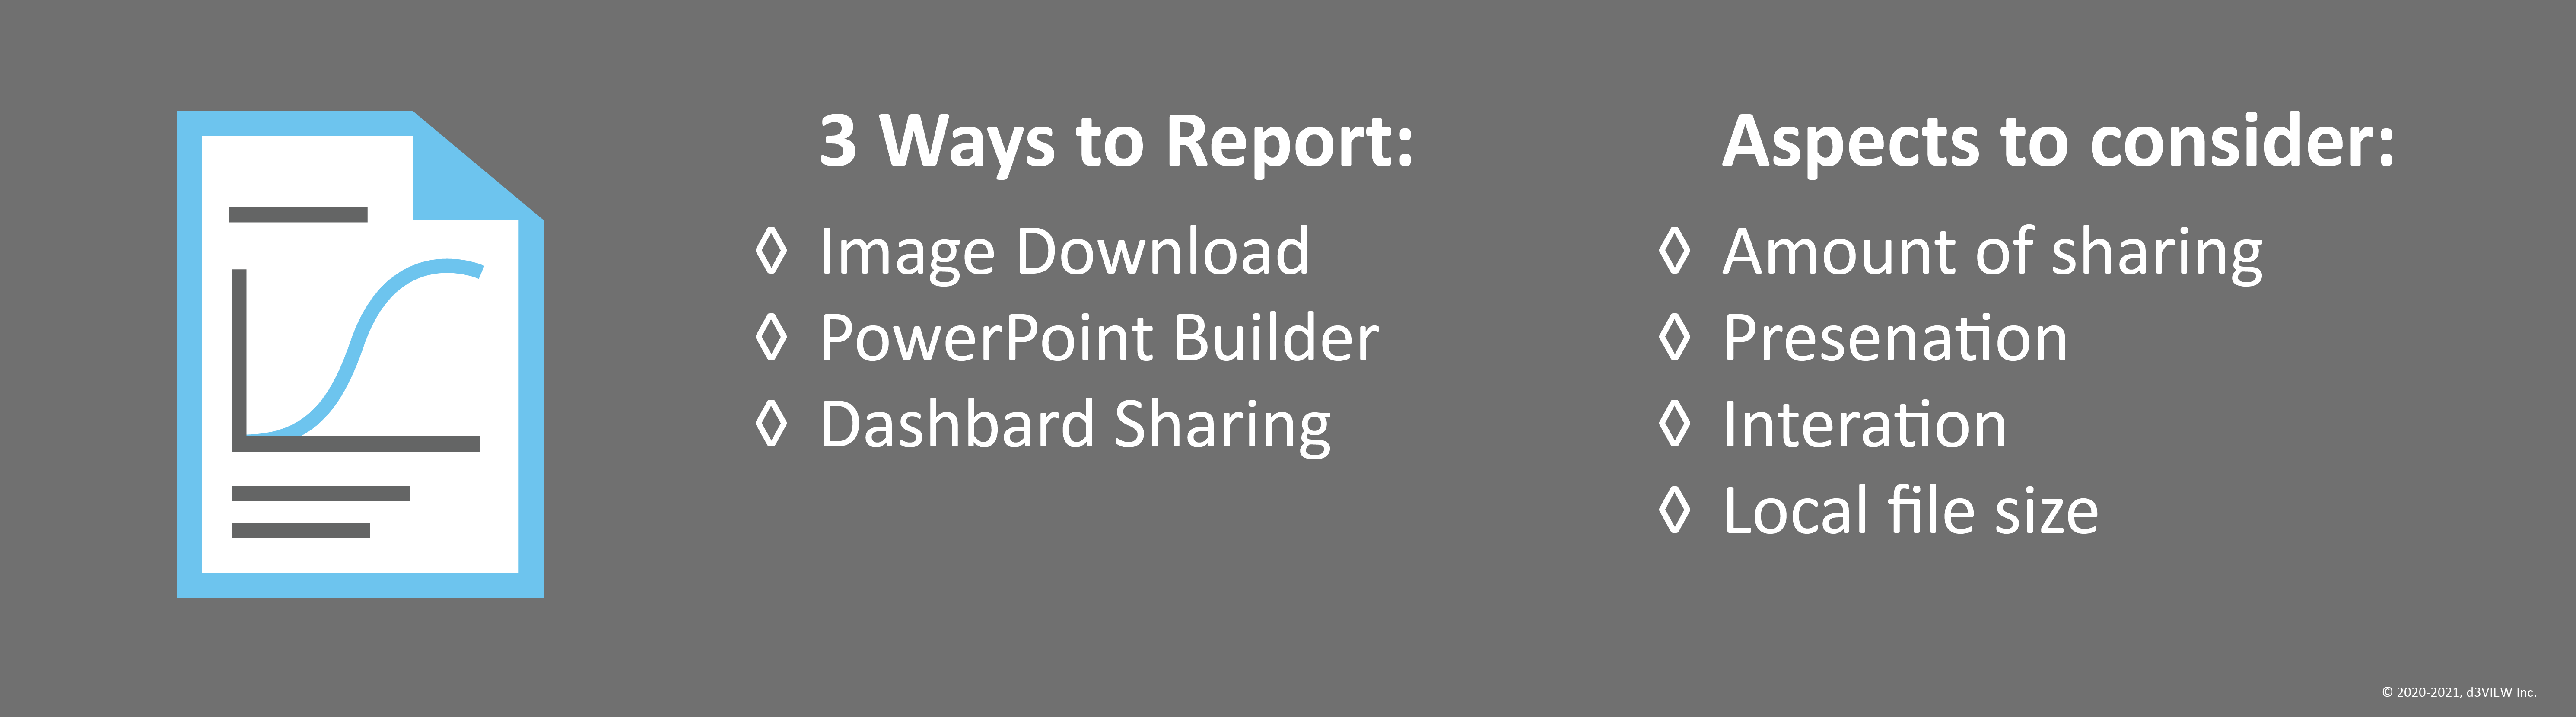
For reporting data exploration specifically, certain features over others help organize or share visualized data more productively. These include:
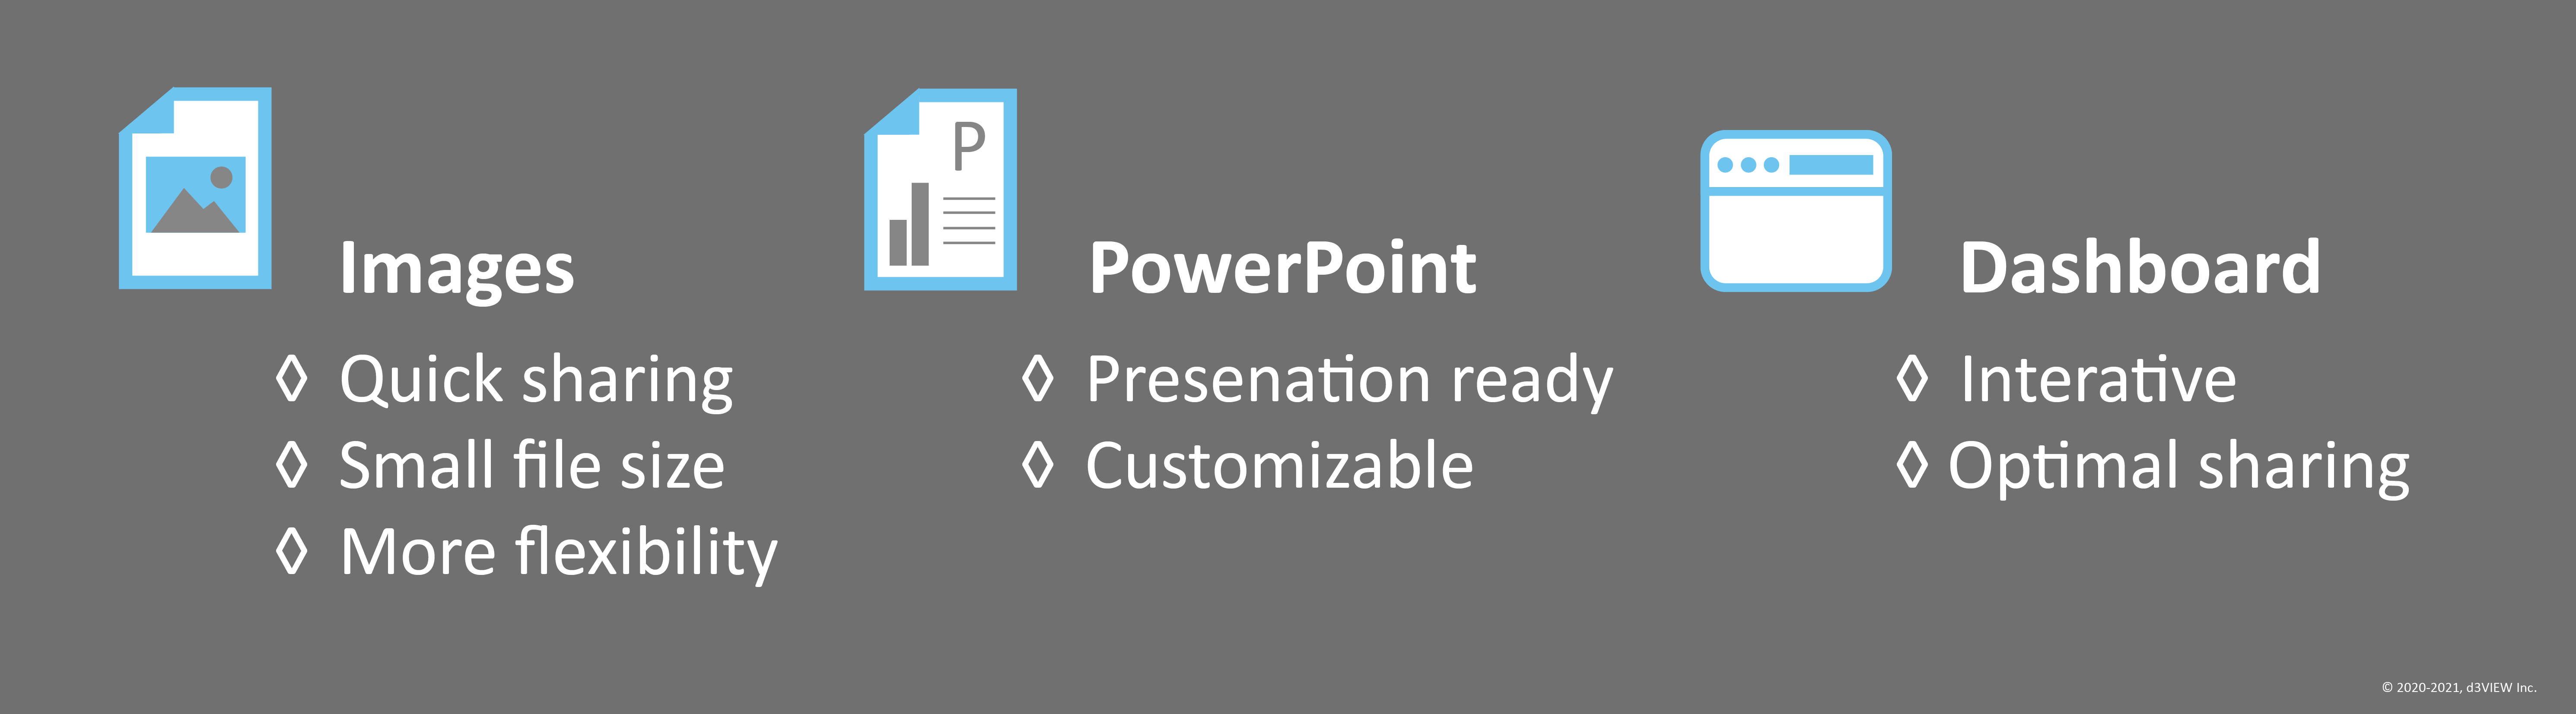
- Exporting visualizers as images
- Utilizing the PowerPoint builder
- Sharing the Simlytiks dashboard
Each option will work better for different situations. Some aspects to consider when choosing how to report findings:
- How much of the exploration do I need to share?
- How does this exploration need to be presented?
- Does the receiver need to interactive with the exploration?
- Does the report need to be locally savable? And what is the size limit for the file in question?
Exporting Visualizers as Images
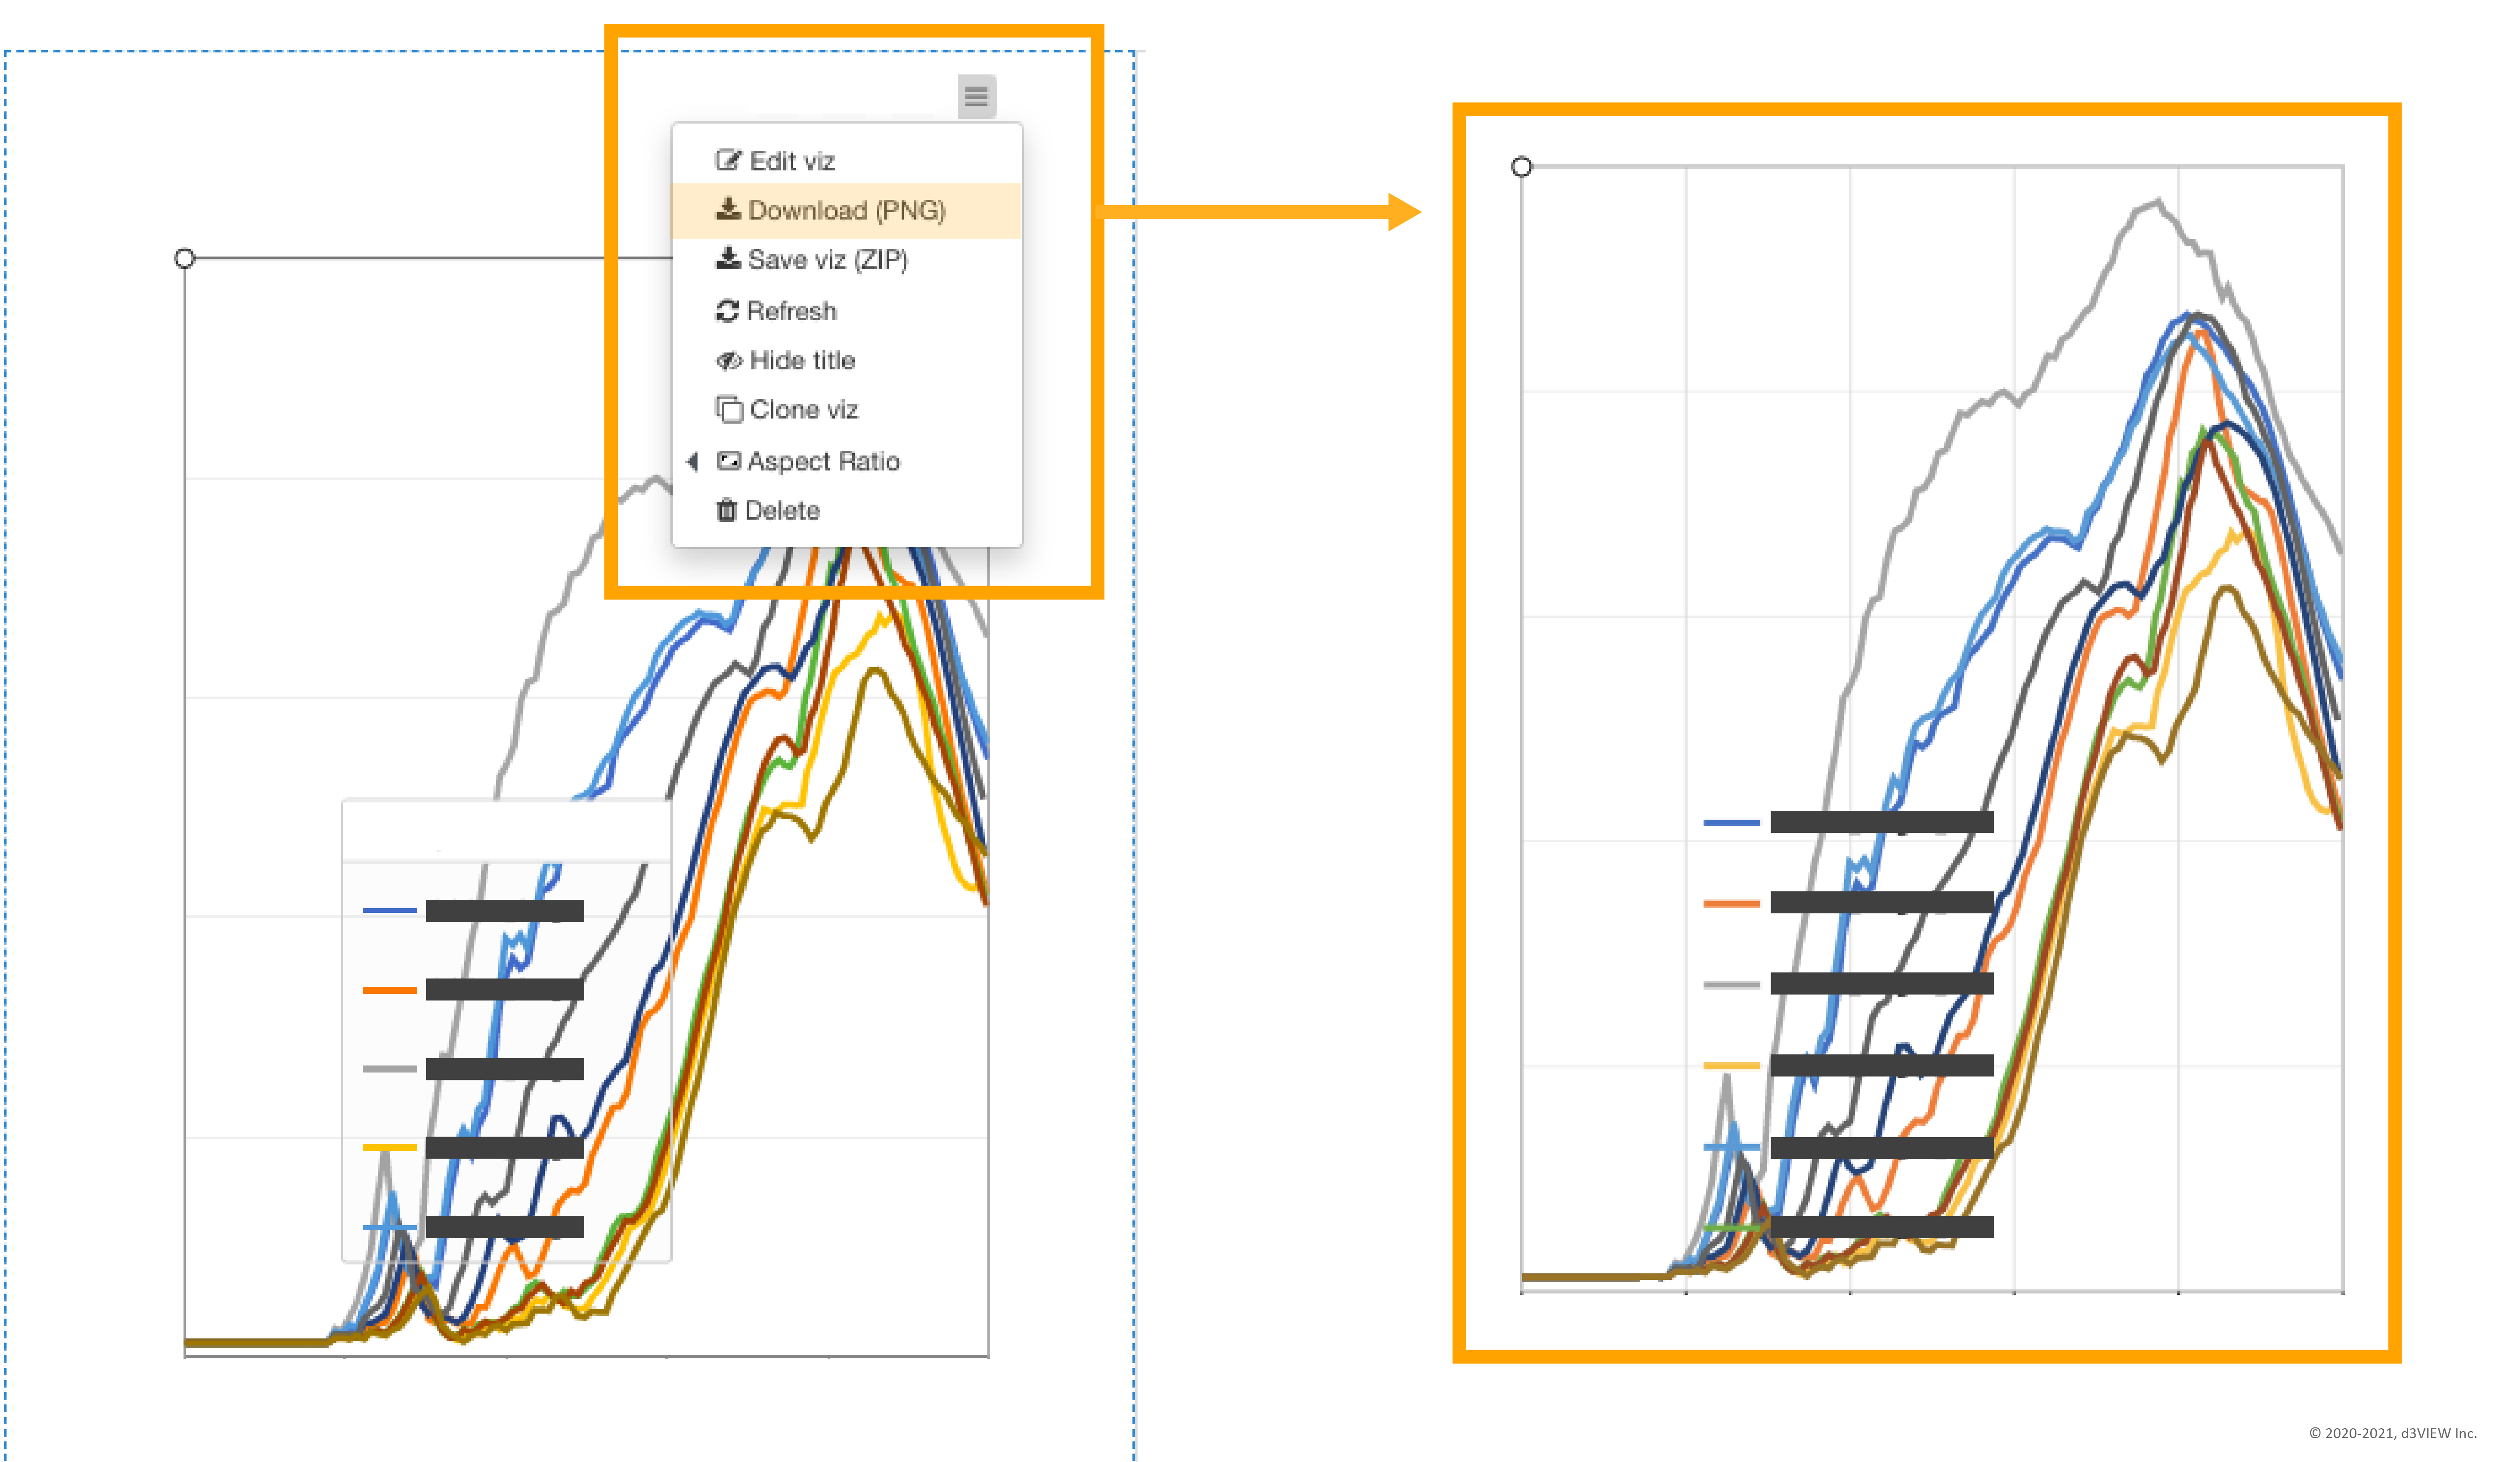
This option works best for quick sharing of individual visualizations, pages or entire data sets. Export Visualizations as PNGs or a ZIP of all images included in a page or data set. Not only are PNGs files smaller and easiest to download locally, image files provide more flexible reporting as you can place them into the presentation application of your choosing, like Keynote or Prezi.
Utilizing the PowerPoint Builder

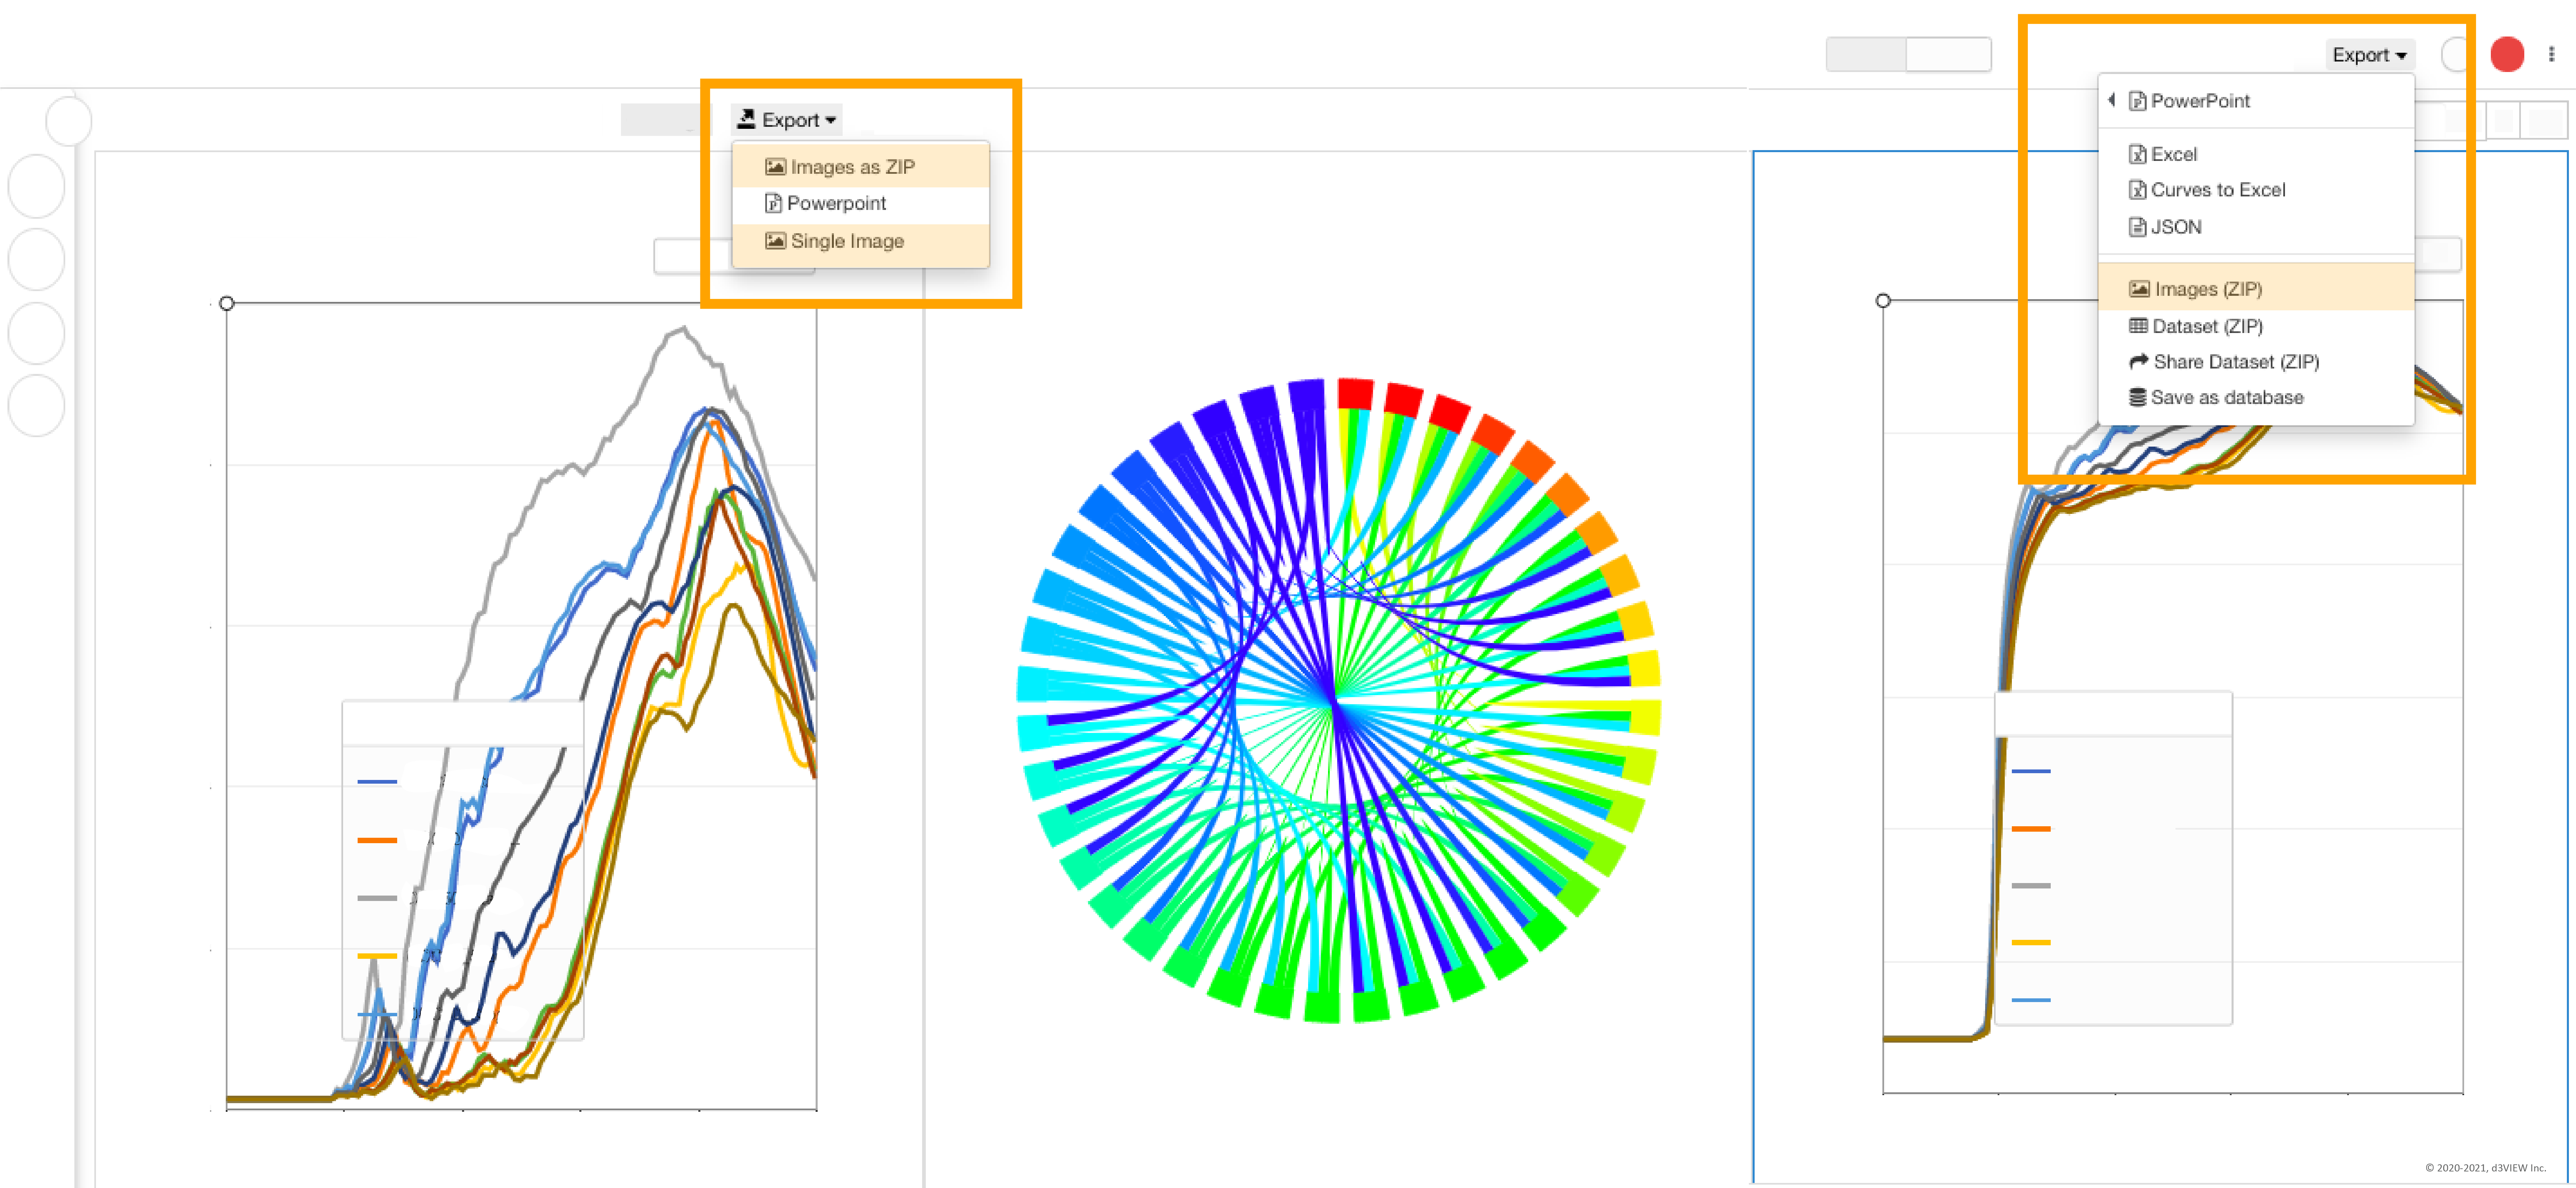
This option is helpful for presenting your findings in a more organized manner without having to transfer them into PowerPoint yourself. You can add basic text and symbols to help enhance your reporting. Change visualizer titles, add notes or draw arrows connecting important information. Add more slides and more visualizers from your exploration. You can also import your own PPT template or slides. When you are done setting up your report, download the presentation as a PPT or a PDF.
Sharing the Simlytiks Dashboard

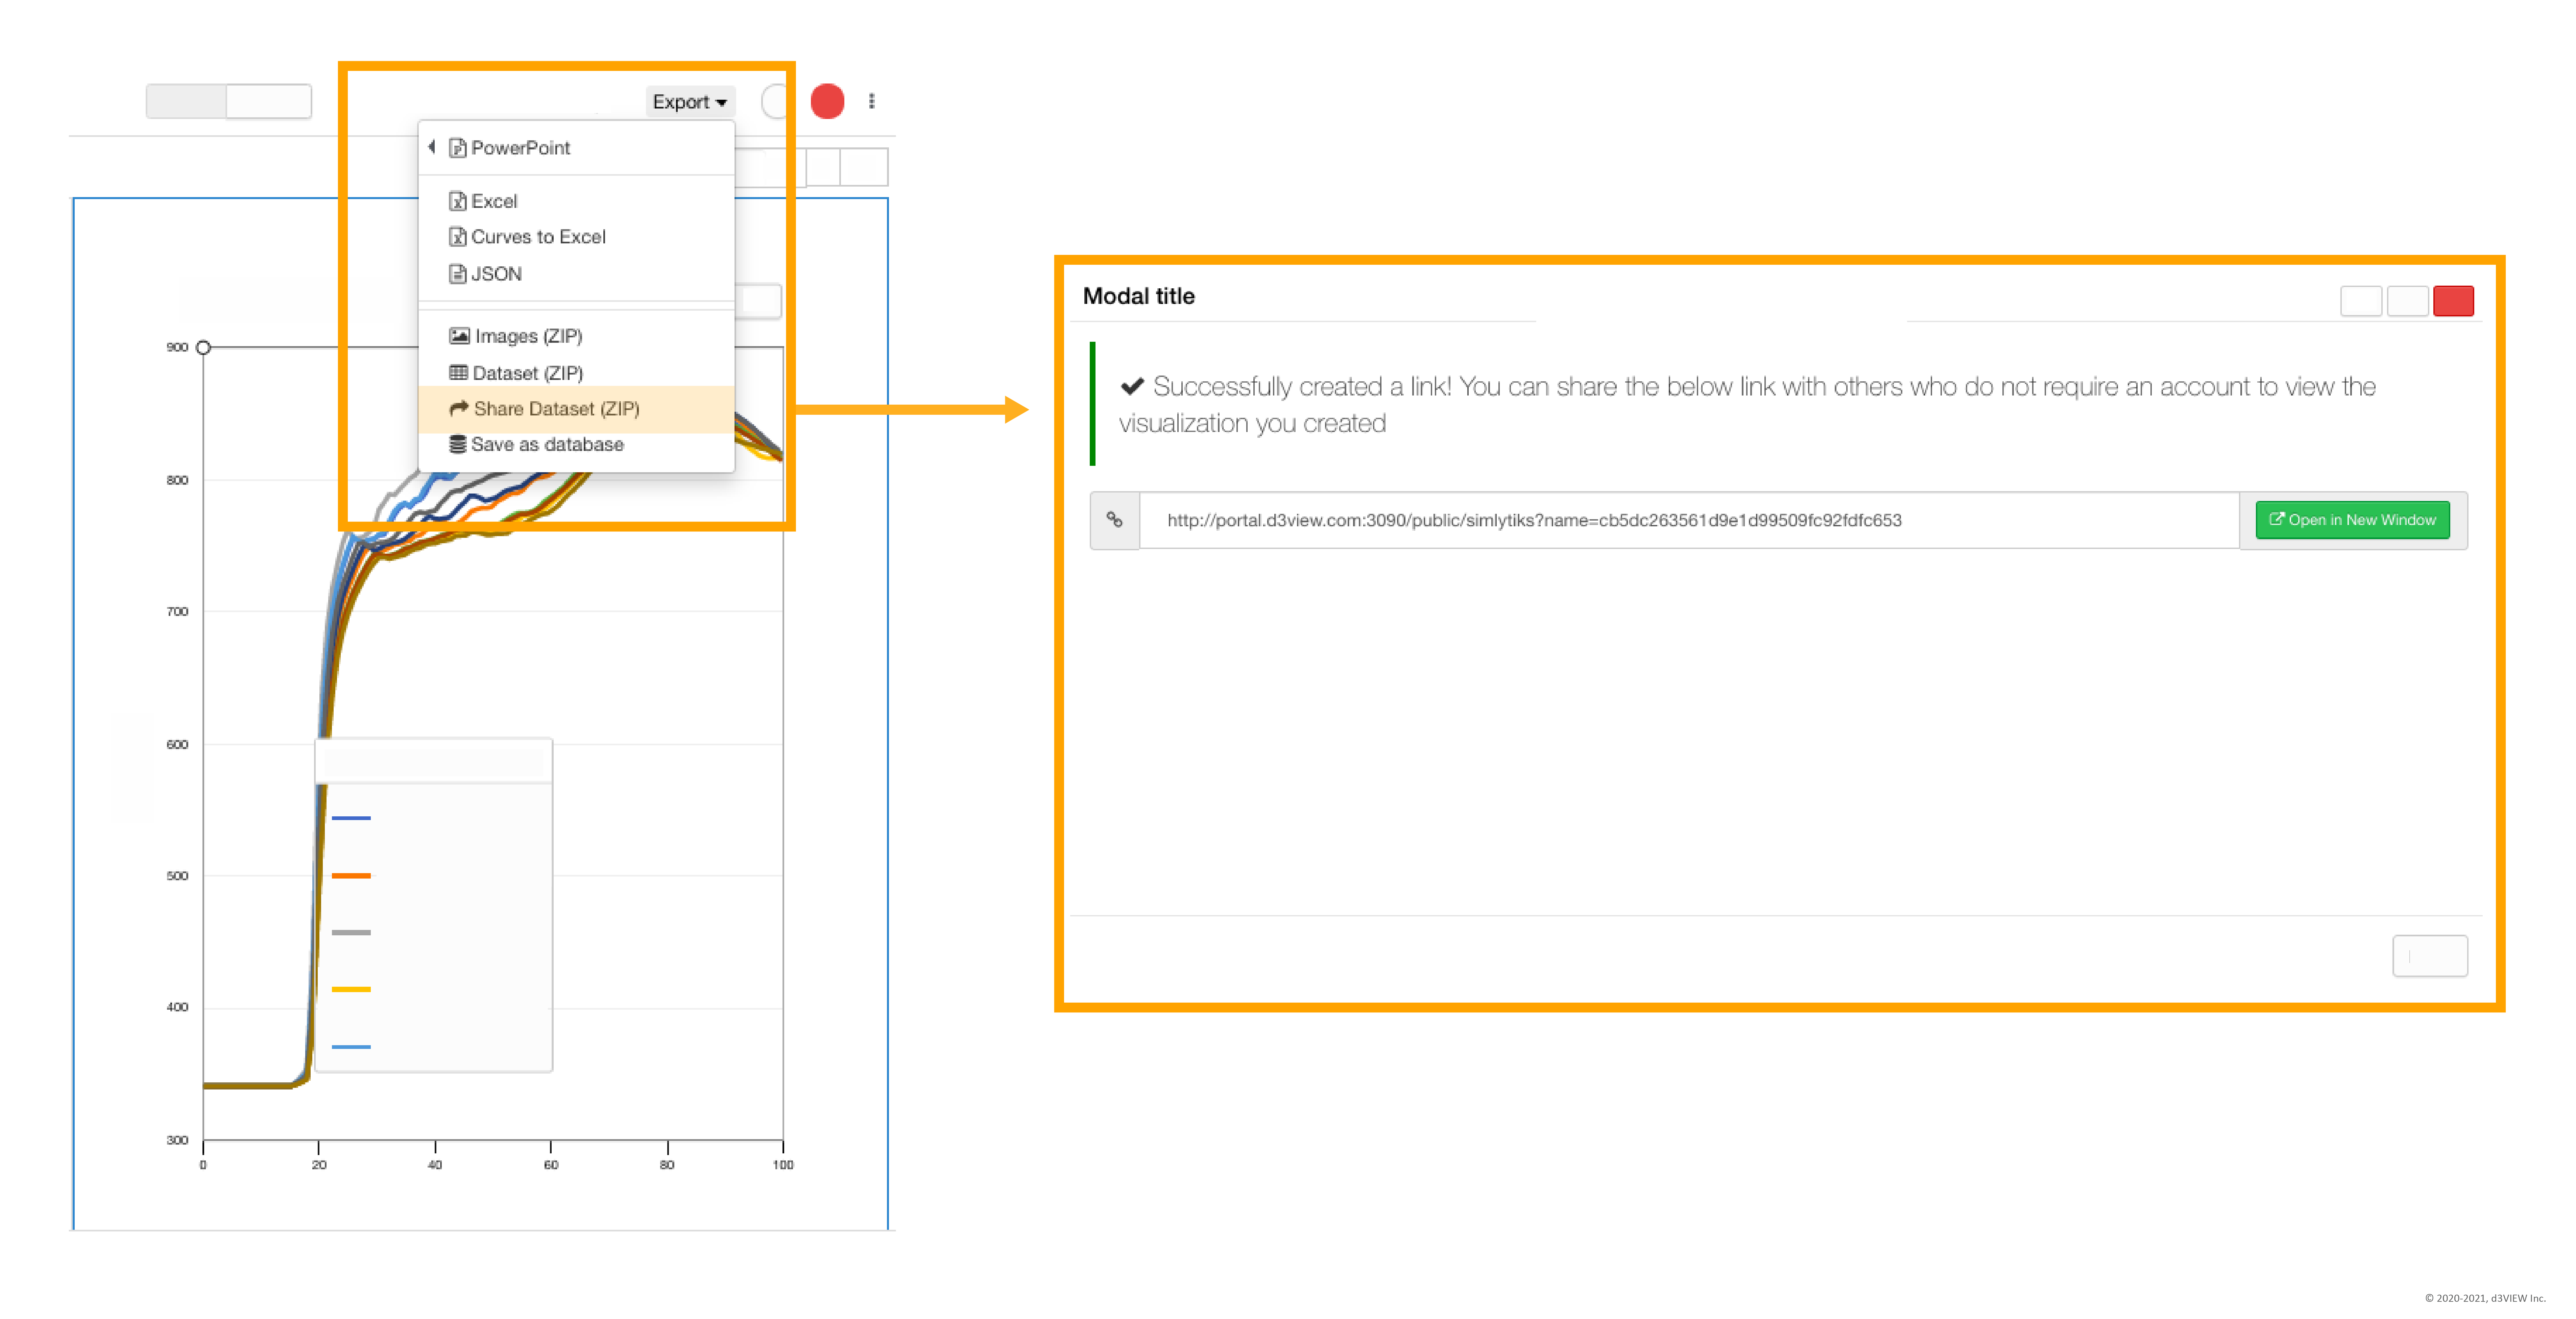
This option makes it easier for the receiver to explore on his/ her terms and does not require you to download any files. Share a link to the exploration that can be viewed by anyone even if they do not have an account on d3VIEW. The receiver will be able to interact with the exploration using this link. Since the link is a duplicate, the receiver can explore more visualizations and make changes without effecting the original dashboard.
A Last Look
Aside from showing the ease of reporting data exploration in Simlytiks, we hope this article helped shed light on which reporting method is best for you in each business situation. If you need anymore help on how to navigate the platform, please visit our tutorial documentation on your d3VIEW account. You can also contact our team for any other questions at support@d3view.com