d3VIEW’s Data Visualization Application, Simlytiks, offers a wide-variety of charts with different options for an enhanced data-mining experience. One of these chart features includes data drilling which involves navigating through multiple dimensions of data. A chart with data-drilling capabilities presents data columns in hierarchical layers allowing us to explore different levels within the same container.
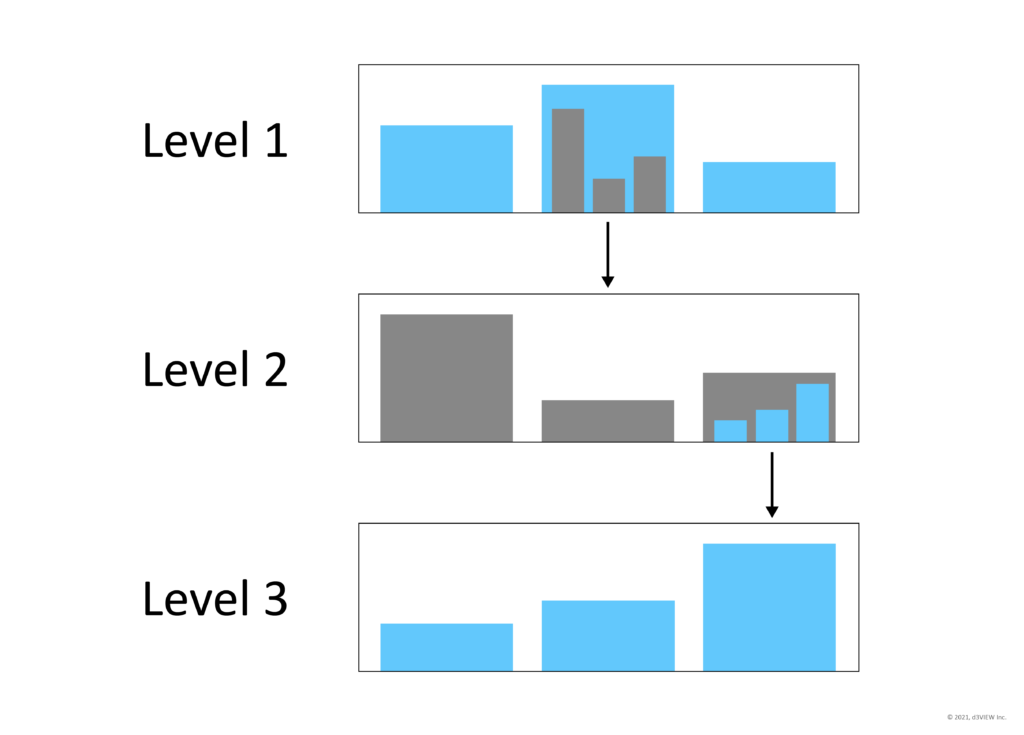
Initial layers show a more broad summary, generally getting more detailed and specific as we navigate down the levels. Though, the layers don’t necessary have to connect in hierarchical format. These charts can showcase columns of data in any order with their drilling capacity as a way to view the correlation between columns or important aspects collectively. And, drill-down paths aren’t necessarily linear as certain paths may connect back to others because of shared data records.
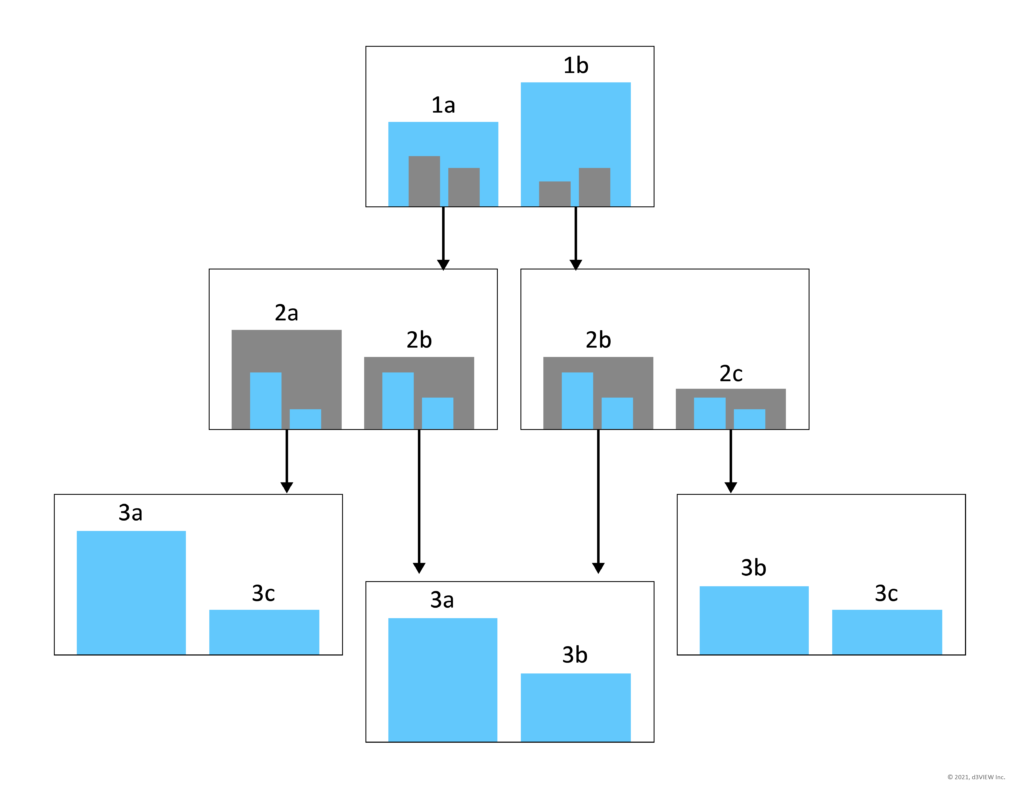
Simlytiks has 4 main chart types that drill data up or down: Pivot Table, Vertical Bar Chart, Pie Chart and Tree Map. Let’s take a look at how these charts are drilled. For reference, the order in which we choose our data columns determines the hierarchy of the layers in these charts.
Drill Downs with Pivot Table
Pivot Table uses data-drilling based on its rows and hinge points.
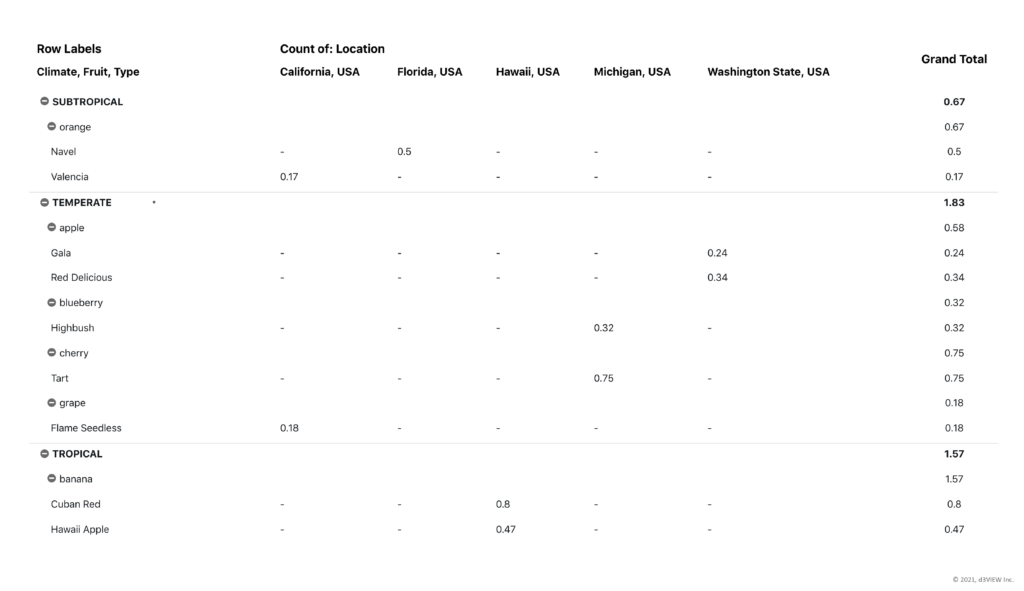
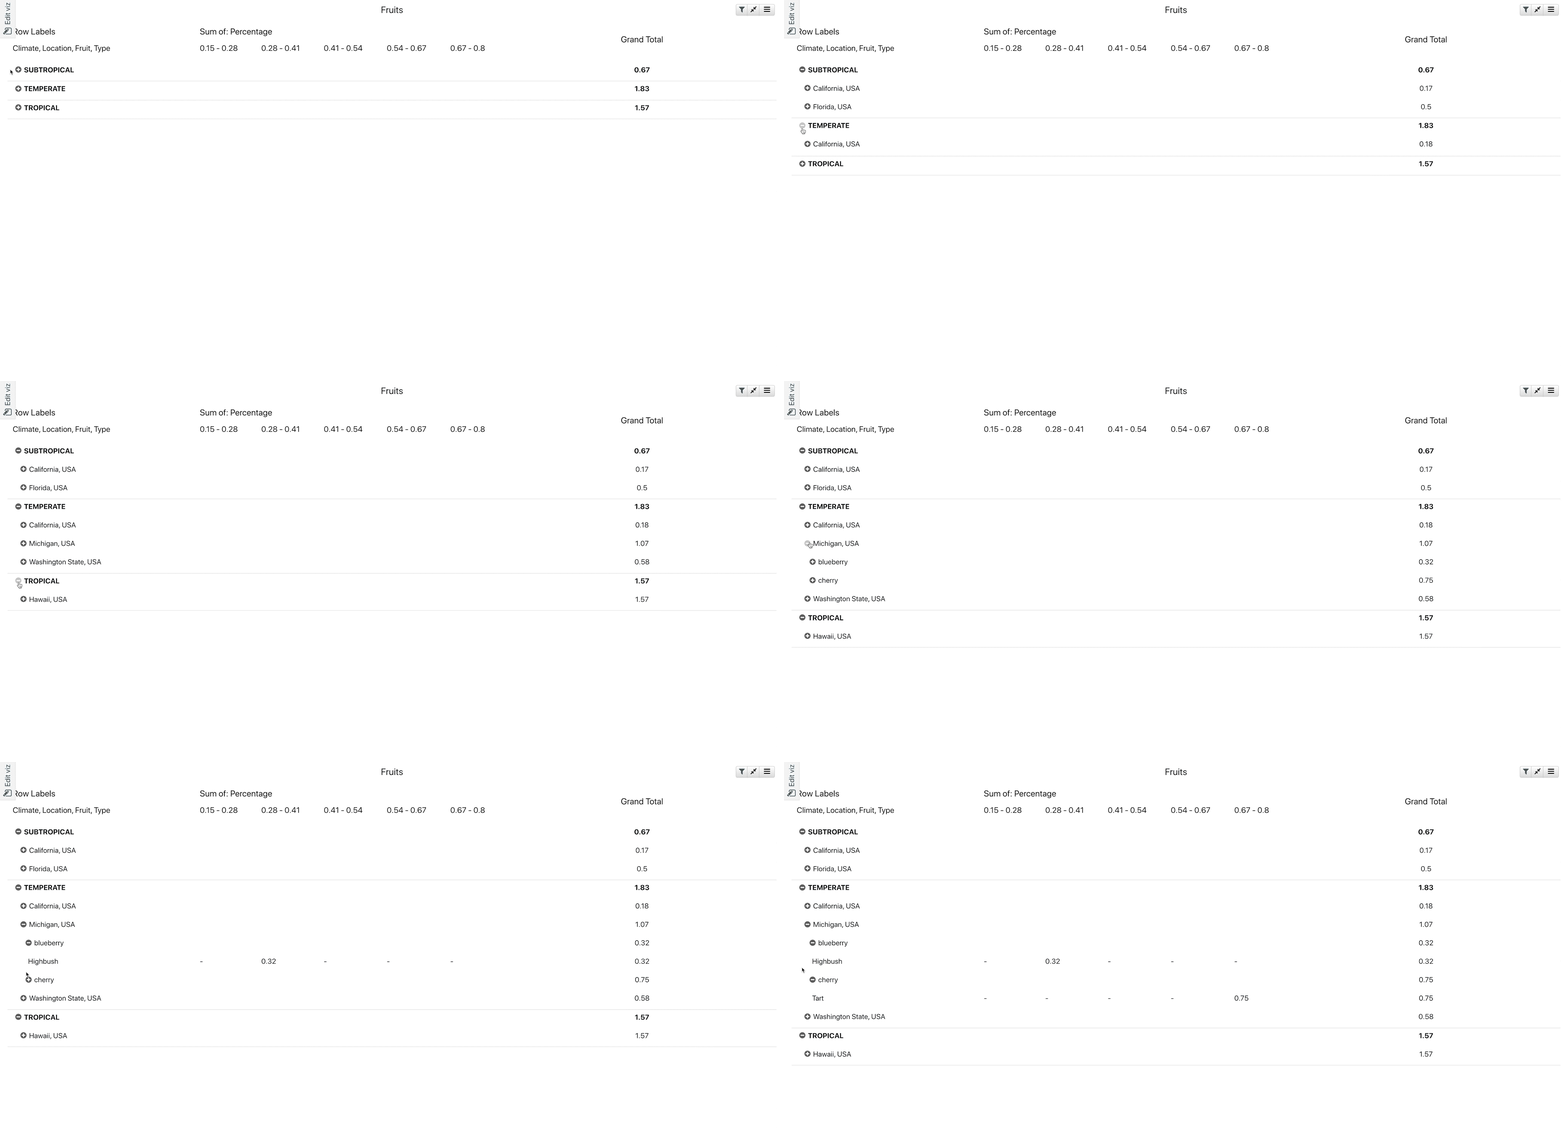
Multiple rows can be pivoted out to view or pivoted in to hide. Each added row becomes another level of data to be viewed within the whole or hidden away for summary analysis.
Drill Downs with Vertical Bar Chart
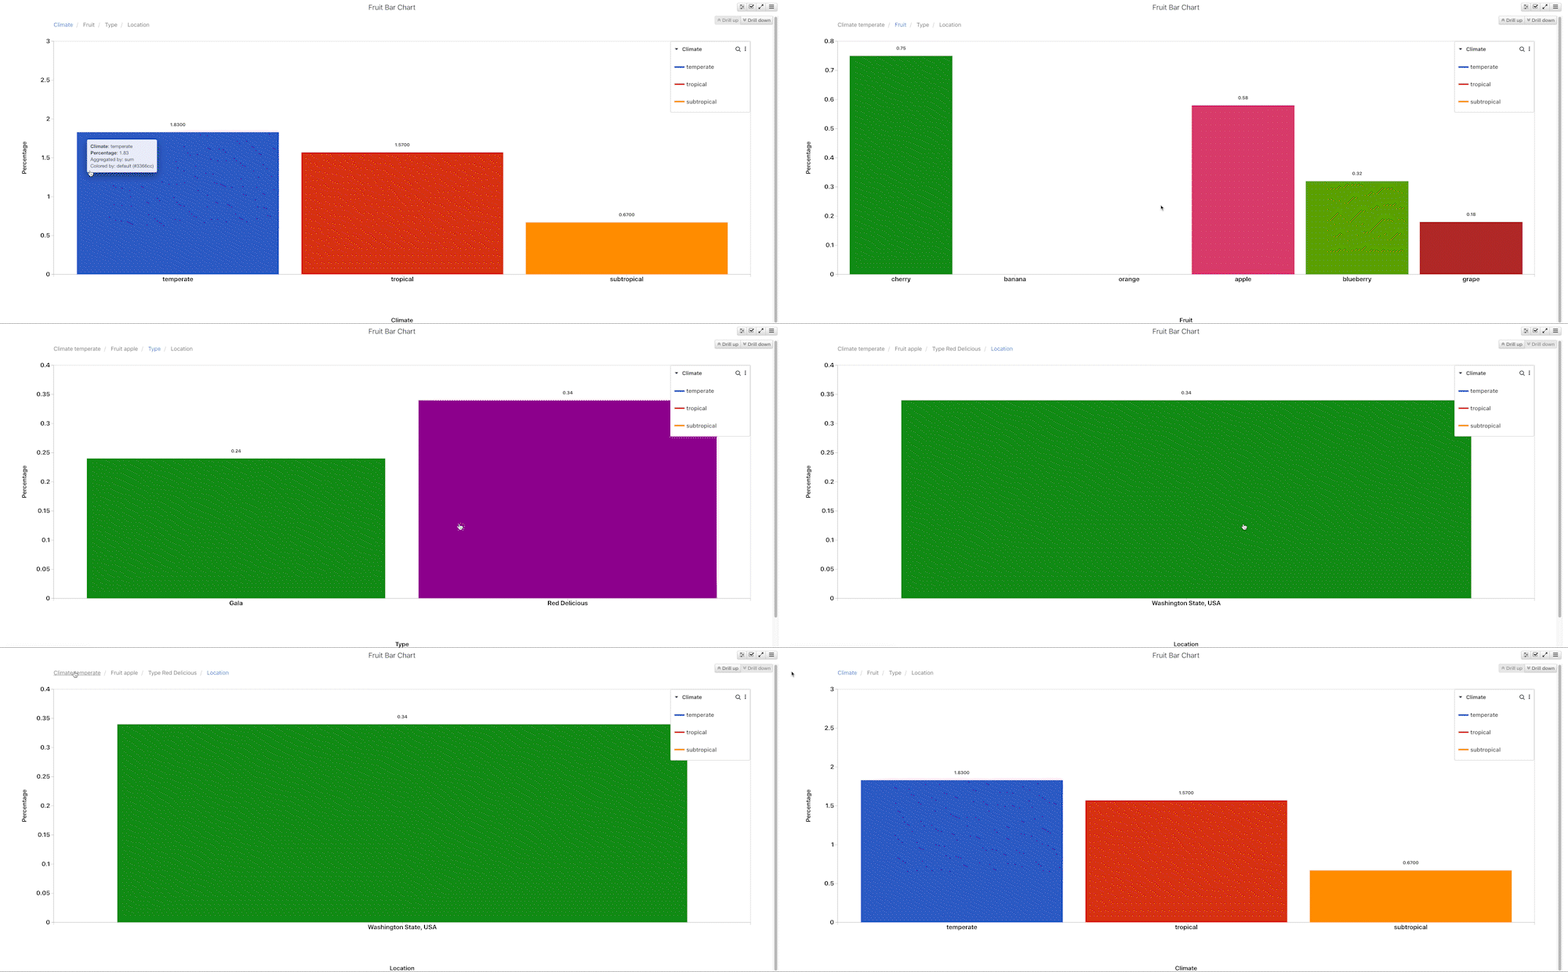
Vertical Bar Chart uses data-drilling in accordance to the X-axis when assigning multiple data columns to it.
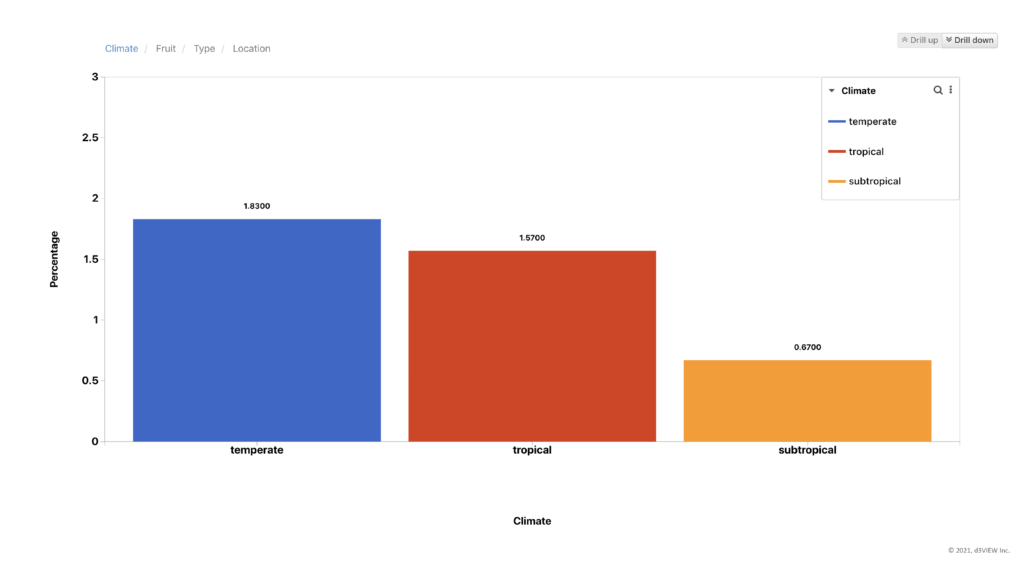
We can drill down by clicking on individual bars and drill back up using the navigation at the top.
Drill Downs with Pie Chart
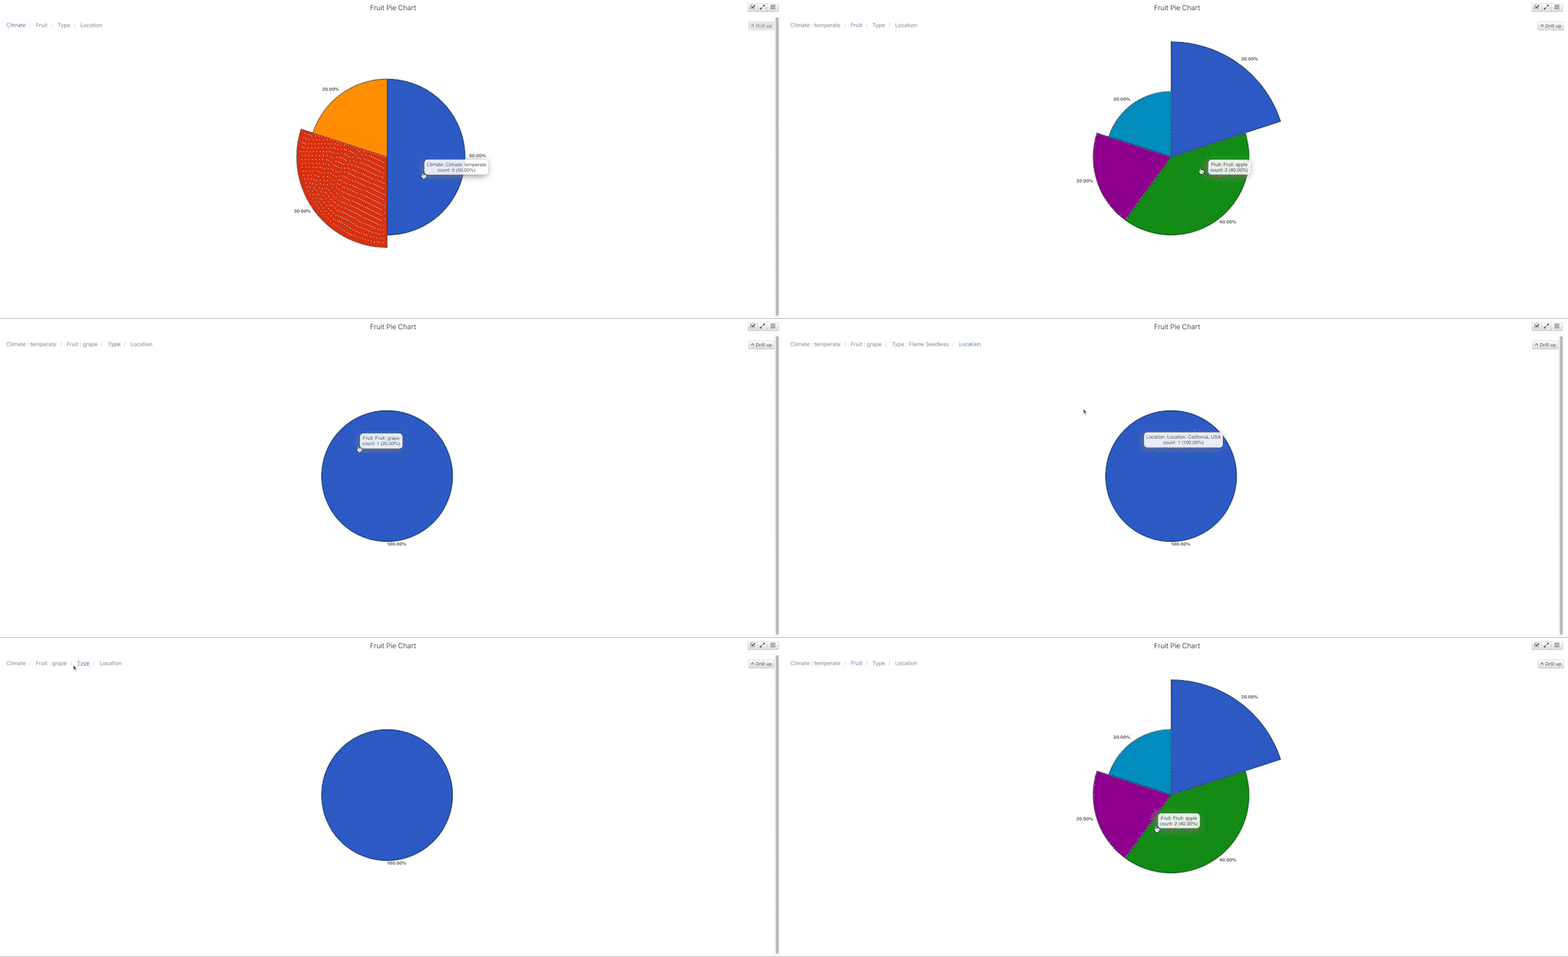
Pie Chart uses data-drilling with multiple columns of data for its slices.
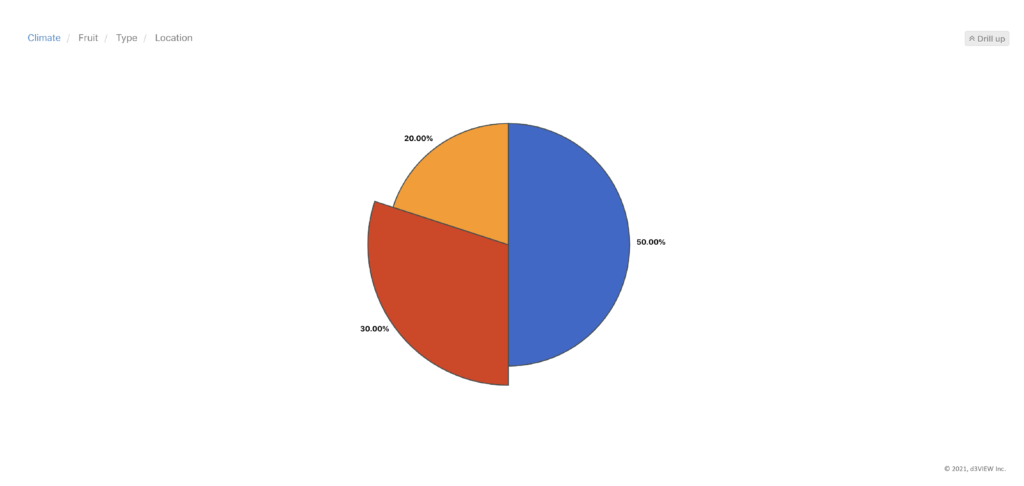
Drill down through data by clicking on pie pieces and drill back up using the navigation at the top.
Drill Downs with Tree Map
Tree Map uses data-drilling via its grouping factors.
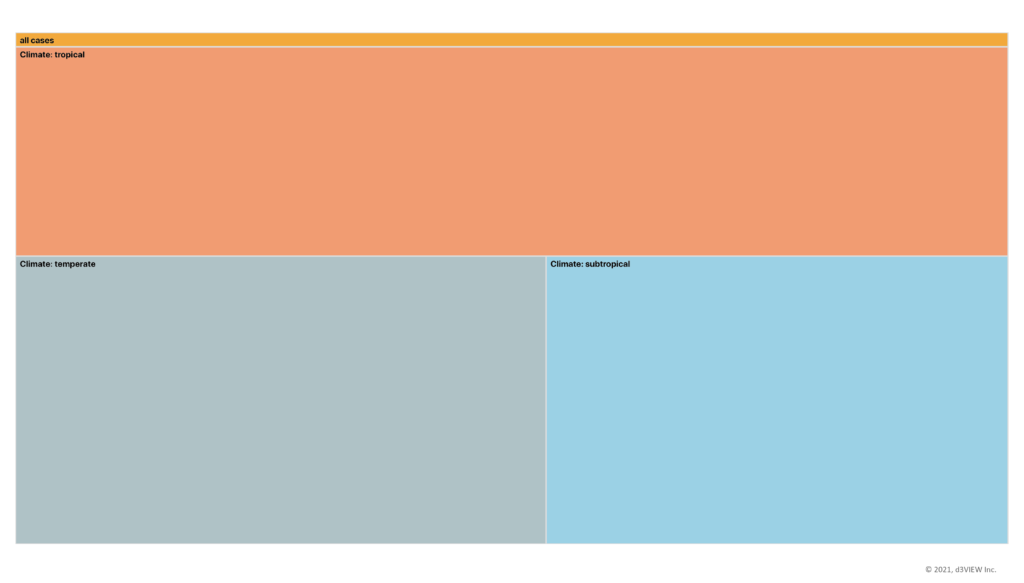
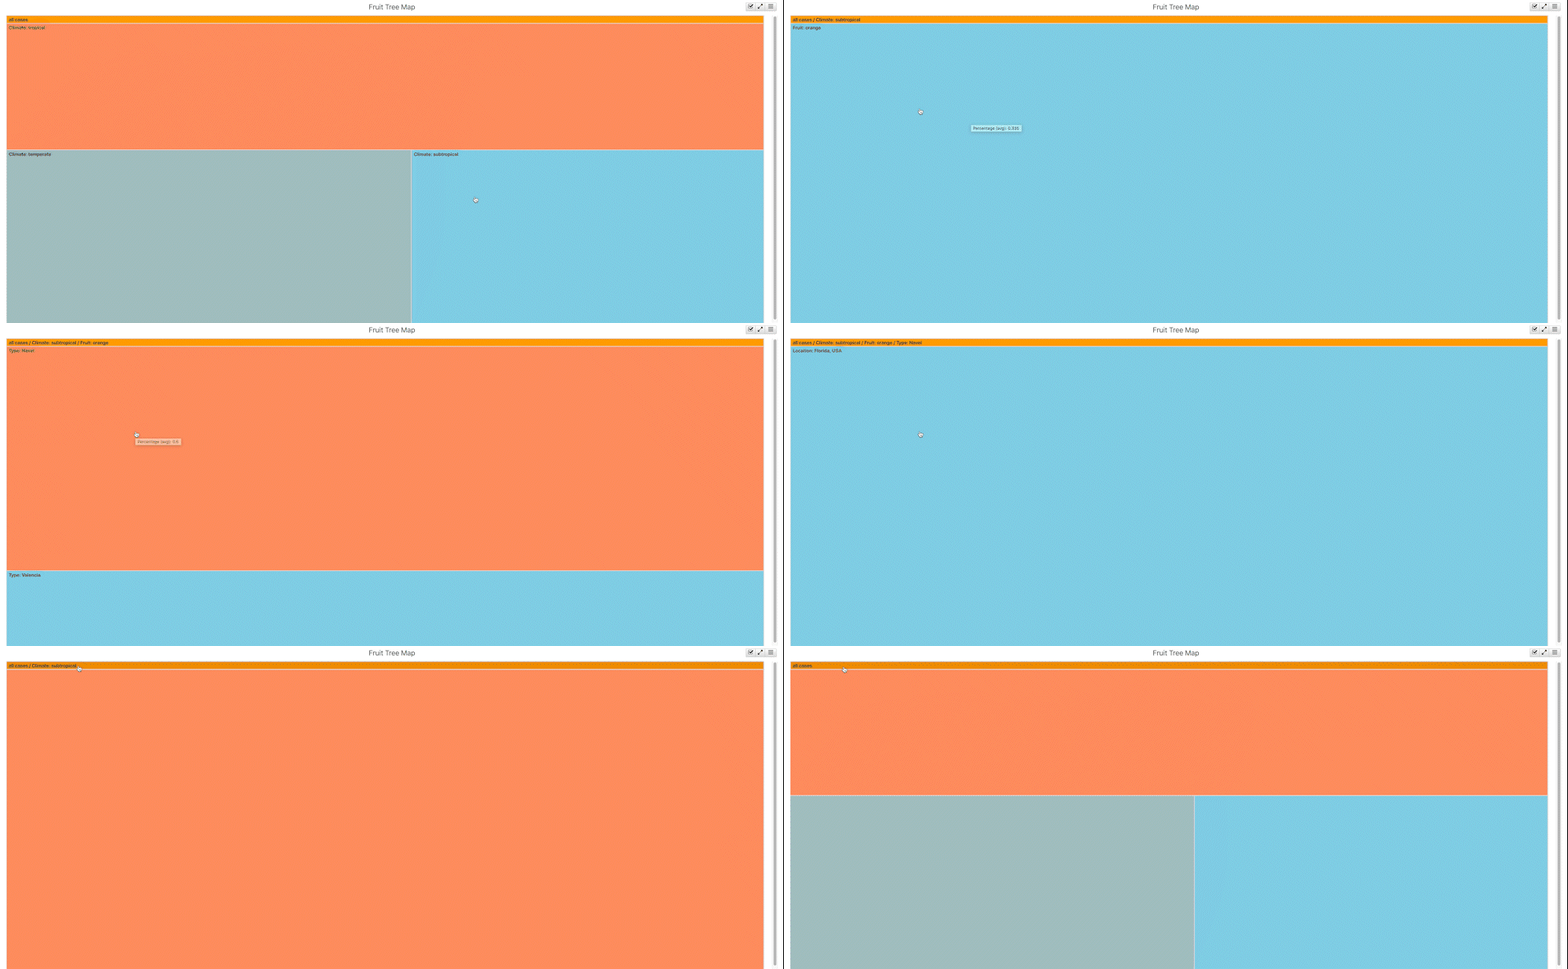
We drill down through the map by clicking on the squares or groups and drill back up using the navigation at the top.
To learn more about Simlytiks visualizations, check out these two blog posts: