d3VIEW’s visualization application Simlytiks® now has a new page layout called Dashboard that allows users to set-up a free-form presentation-styled page using dedicated widgets. Add custom text, images, data filters and aggregators, and Simlytiks charts as well.
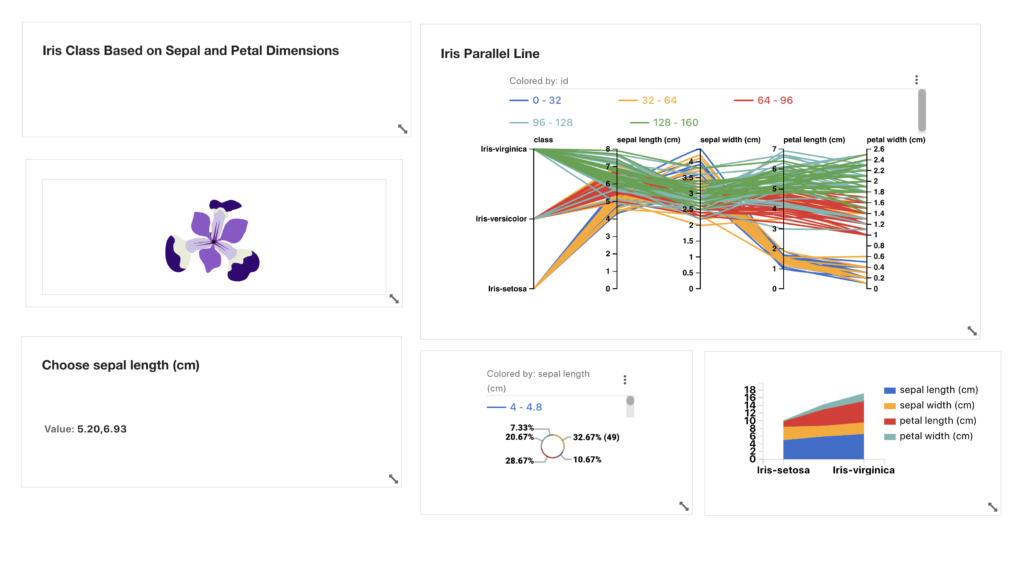
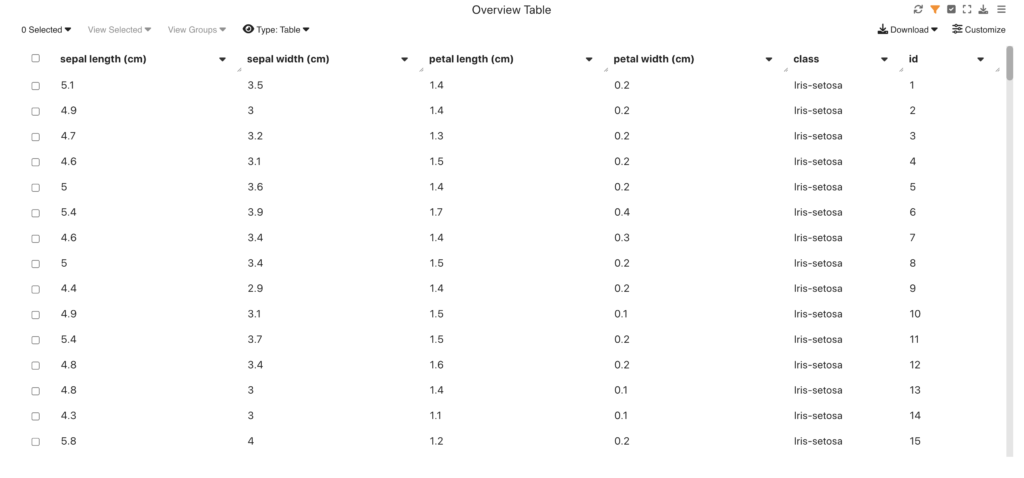
To better illustrate Simlytiks Dashboard capabilities, we’ll be looking at the Iris Class dataset which looks at how sepal and petal dimensions of an Iris flower indicates the Iris class: Setosa, Versicolor and Virginica.
Basic Widgets

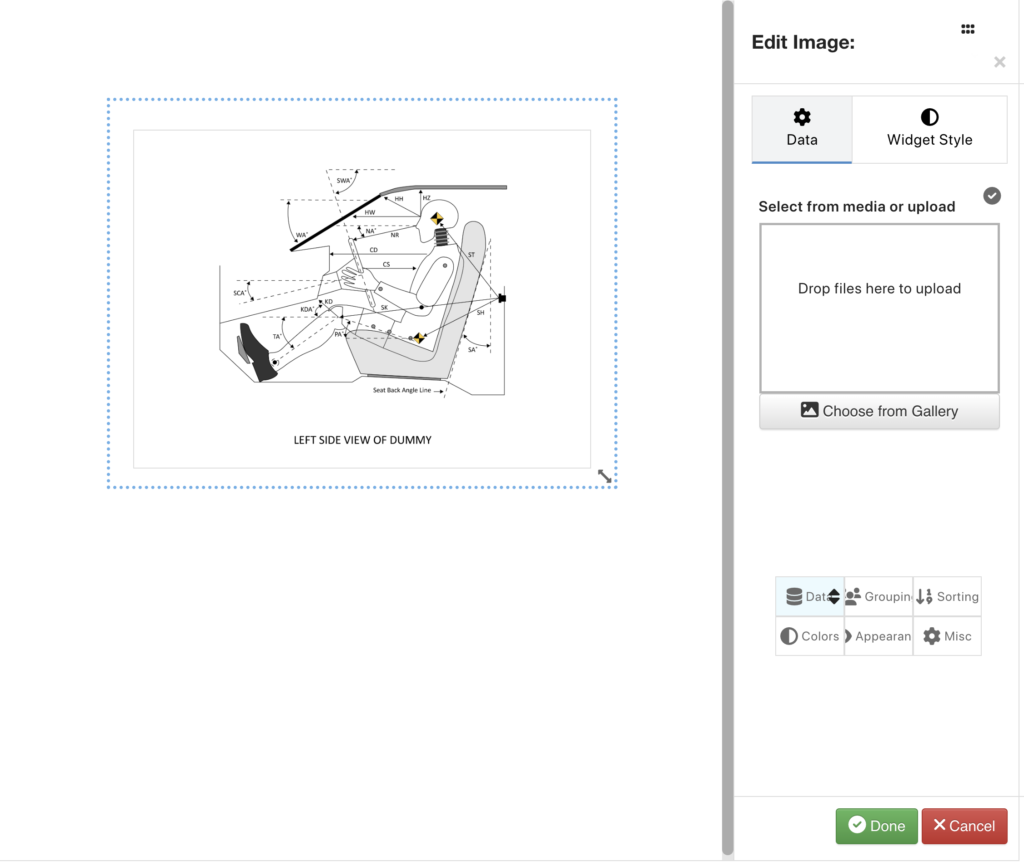
Design your dashboard by adding customized heading or body text, uploading a custom image and adding dividers to differentiate sections. The basic widgets help bring your data and charts together for a polished look.
Data Filters & Aggregators

Set-up filters and aggregators for your data to use for updating your charts.
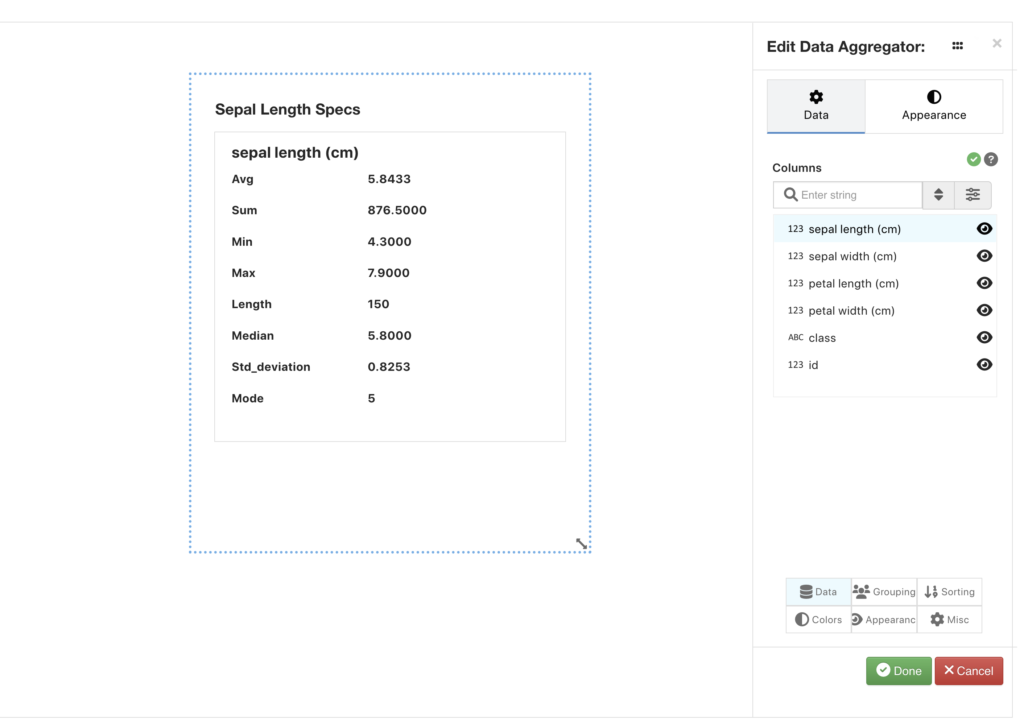
These specialized tools dynamically link between charts and data on the dashboard to show how data responses are affected by one another in the dataset.
Visualizations

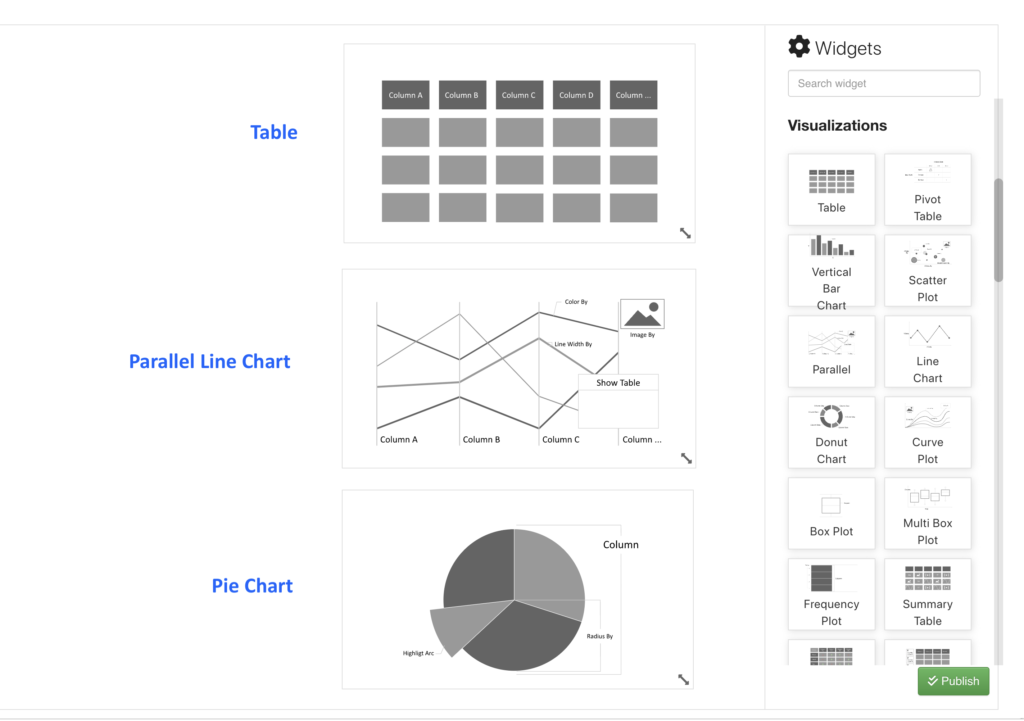
The same charts in Simlytiks® rich visualization library can be found in the dashboard widget pane. Include as many charts as desired for your dashboard that can be dynamically linked using the above data filters!
The image annotator in particular can be used to showcase data directly on an image. You can even add data records from different responses to display that then can be filtered in or out.
Dynamic Linking
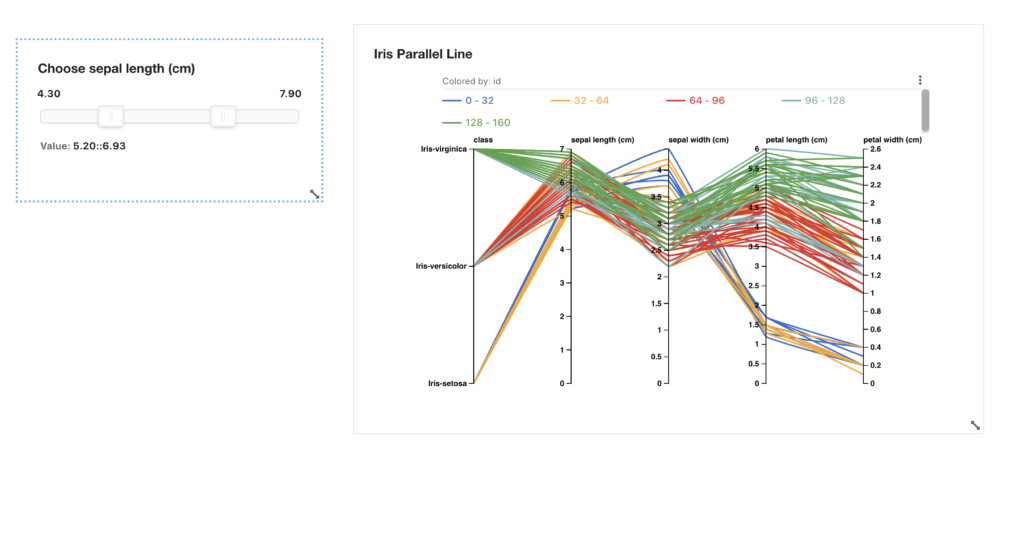
As mentioned earlier, charts, data filters and data highlighters are dynamically linked through out the dashboard. Specific data filters affect the data highlighters and charts in the dashboard. The following is an example of dynamic linking in action for our Iris dataset.
Check out this short overview video on Dashboards:
To learn more about Simlytiks® Dashboards, contact us for a live demo!