19. VIZ AI MODEL
Viz_AI_Model : Added support to display original (raw) data alongside AI predictions in charts. Raw data is shown in blue, while predictions are displayed in red. Added toggle option to include/exclude Raw data display.
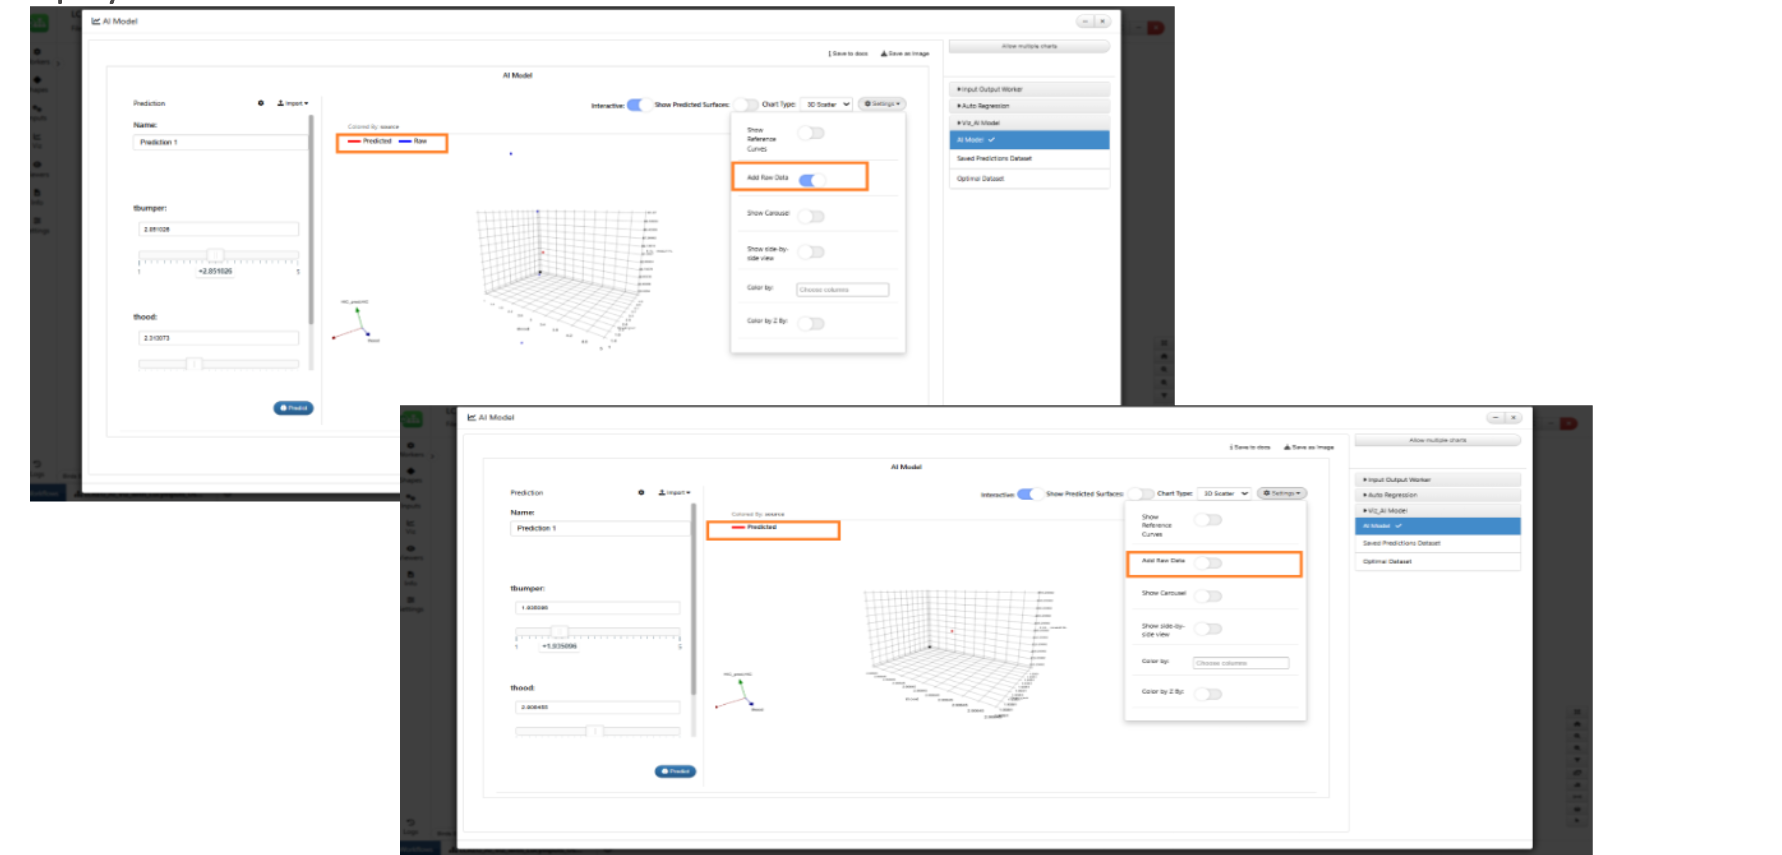
Raw and Predictions
New option called ‘Calculation Type’ is added in AI Model visualization worker.
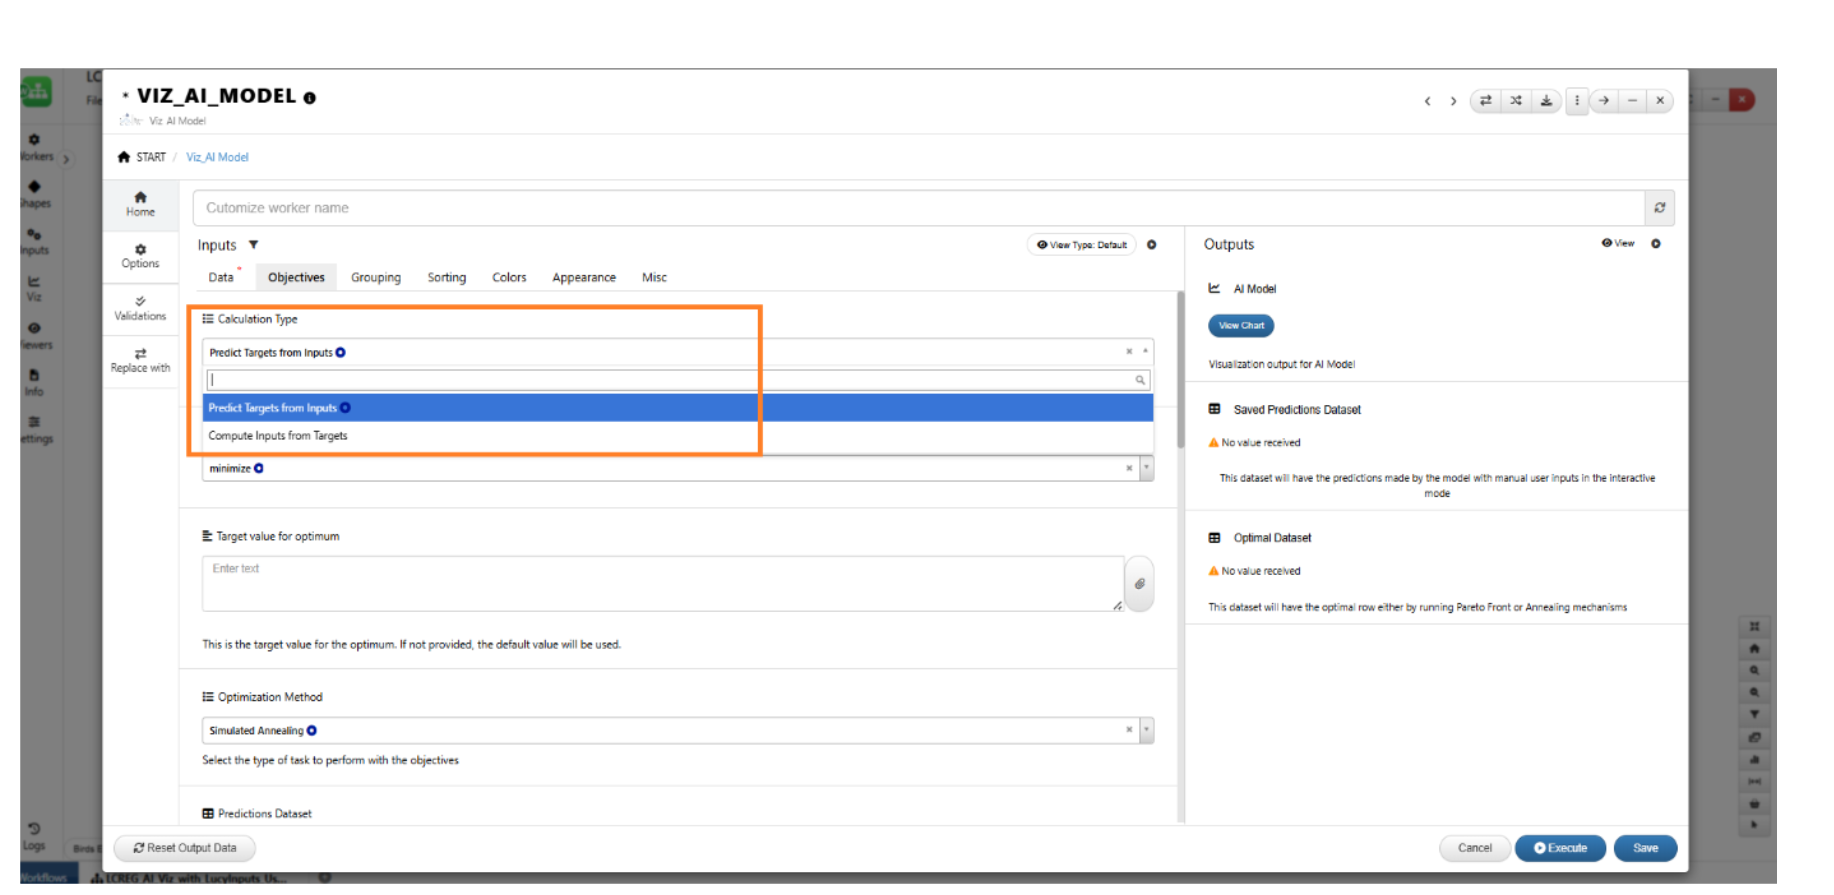
Calculation Type
Added new Viz type called 2D Scatter in VIZ_AI_MODEL worker.
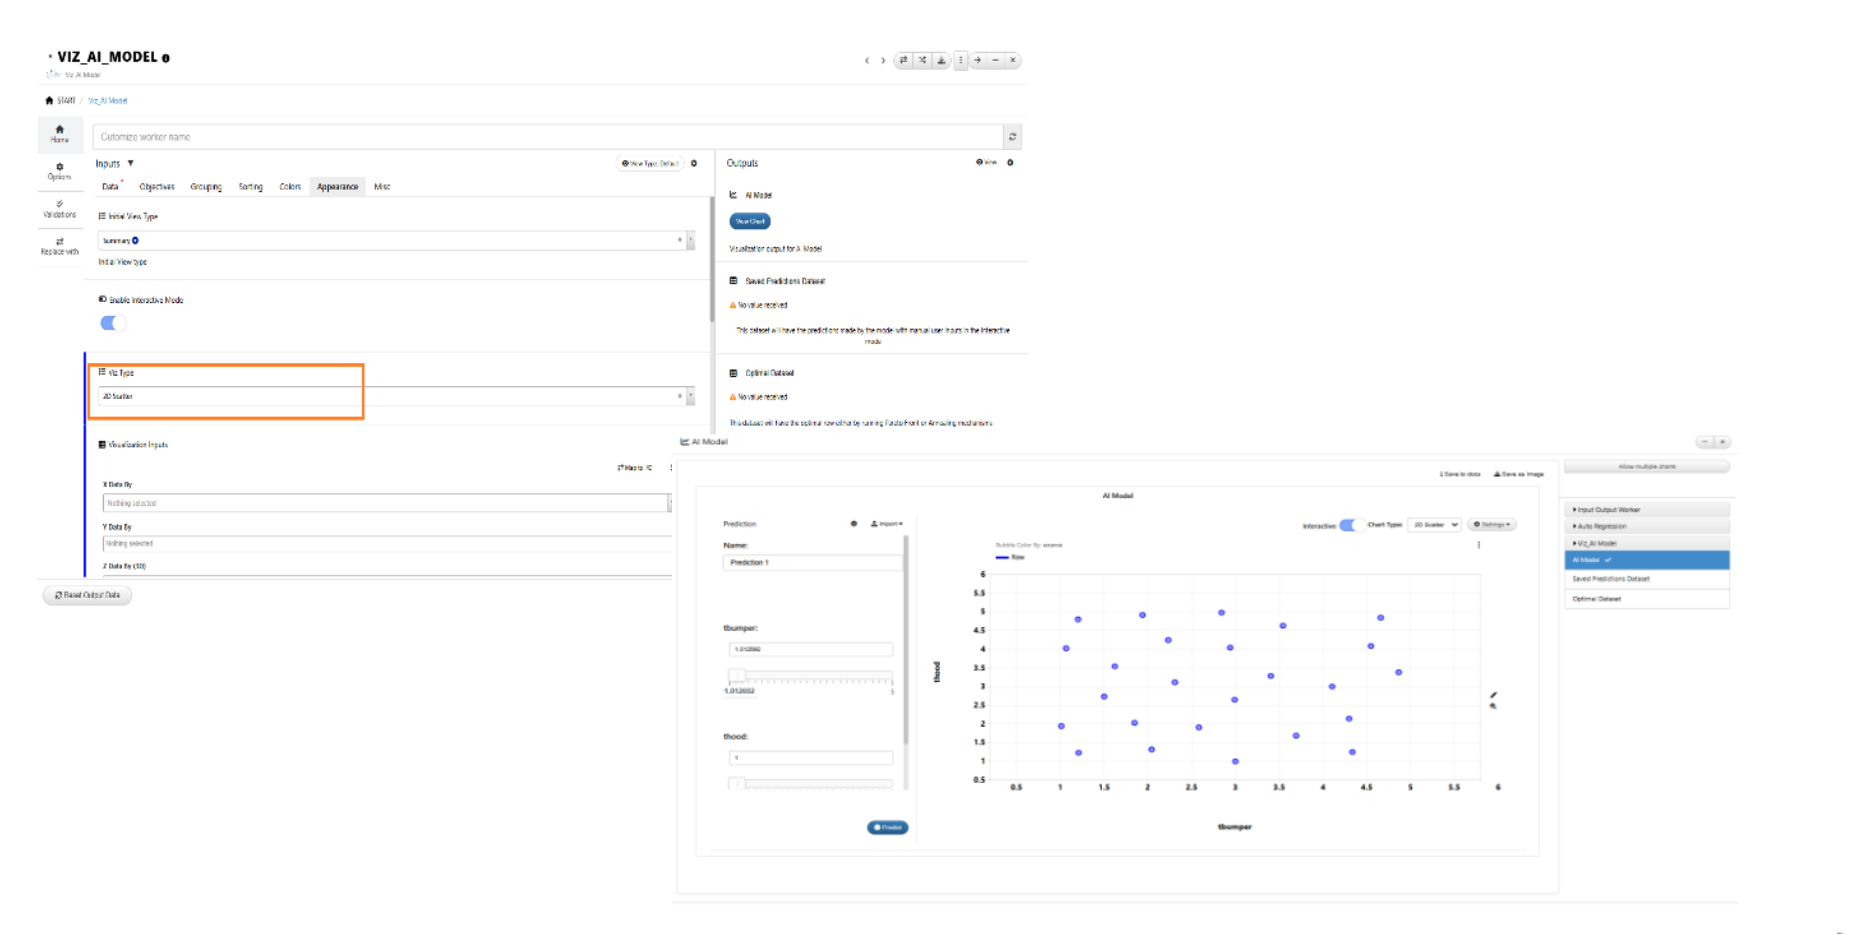
2D Scatter
AI Model visualization worker supports the following options: Initial View Type and Visualization type. The Visualization inputs change based on the selected Viz Type and get carried over to the Viz in ML View.
AI Viz worker -> When the calculation type is Compute Inputs from Targets, the worker on execution will run either Pareto Front OR simulated annealing optimization methods and provide the Optimum dataset output.
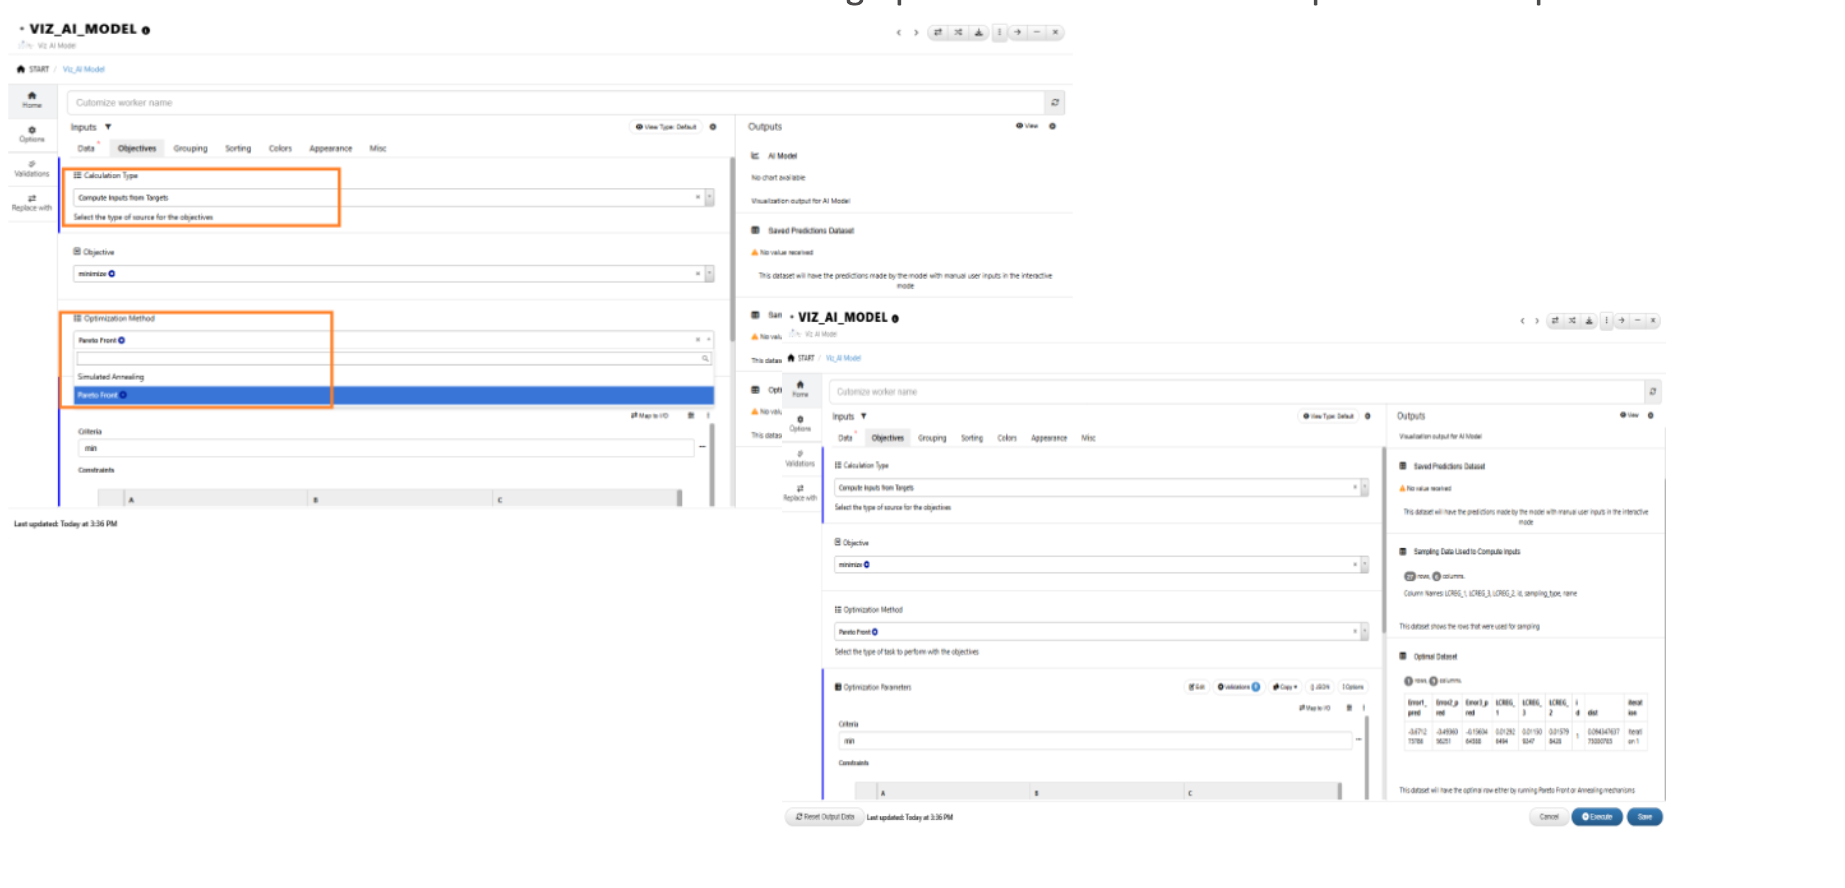
Compute Inputs from Targets
19.1. Output Predictions
AI Viz now supports target inputs for which predictions can be obtained.
The generated experiments and DOE output now include a new column ‘Target_Predicted’ when running the AI VIZ Model worker.
19.2. Data tab/merging
AI Viz: Added support for Primary Key in the AI Viz model, enabling column merging from the input dataset into the AI dataset using the Primary Key.
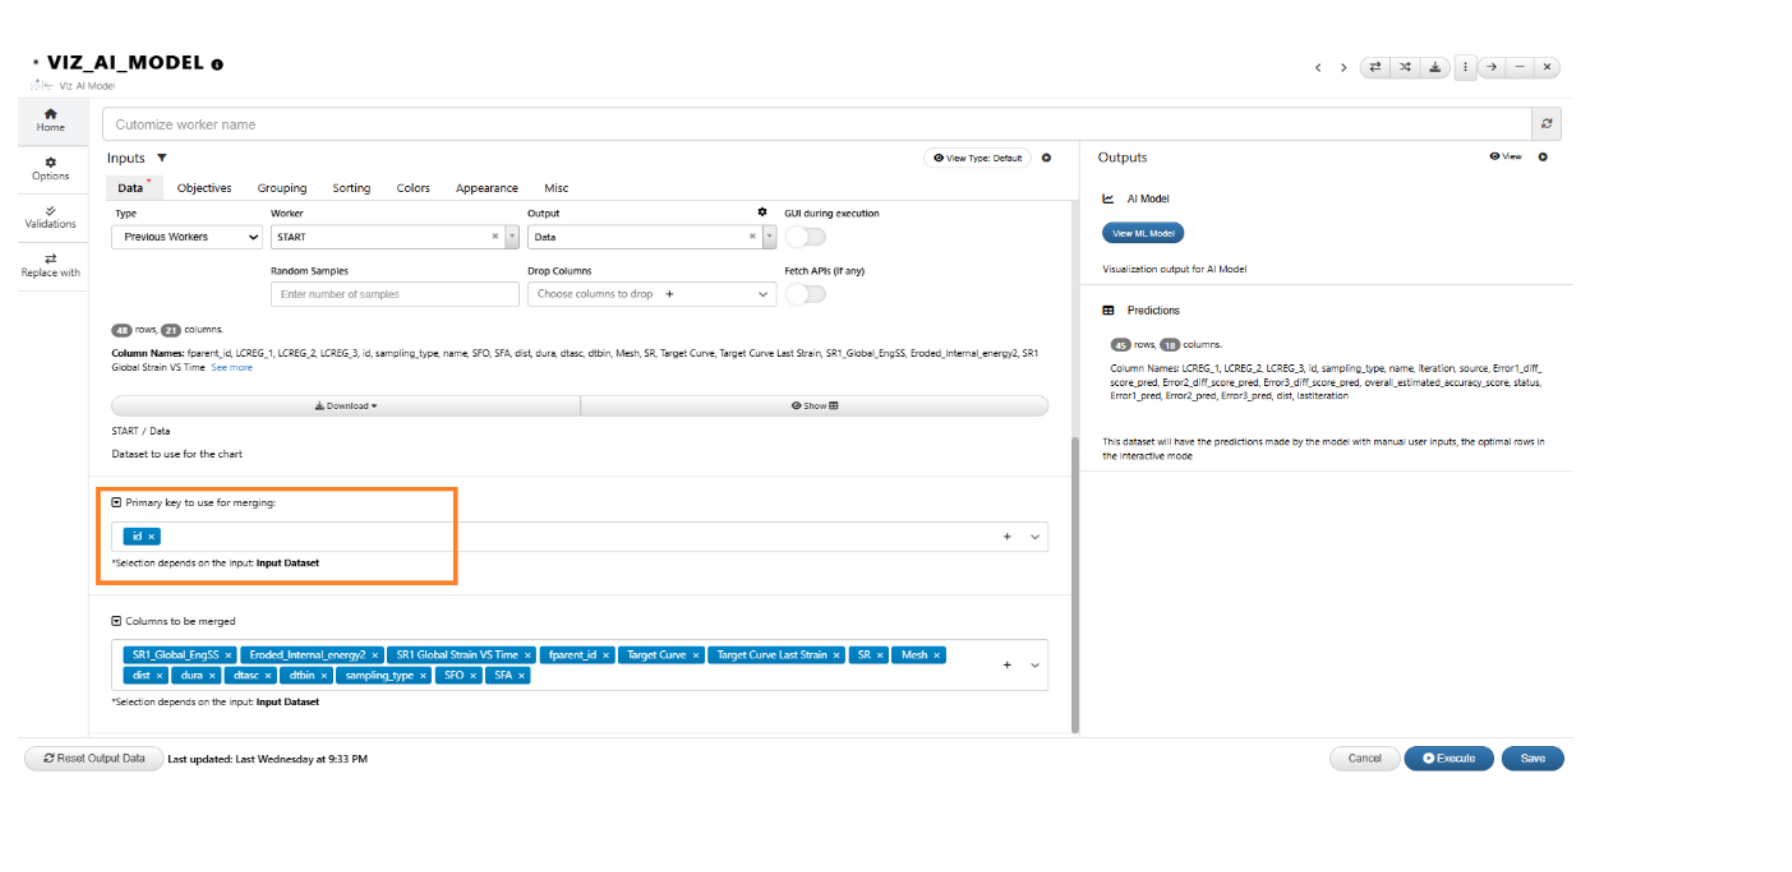
Merging
AI Viz: Support added to carry over all columns from the input dataset by merging with Primary key and displaying them in the prediction table with full support for all curves and datasets
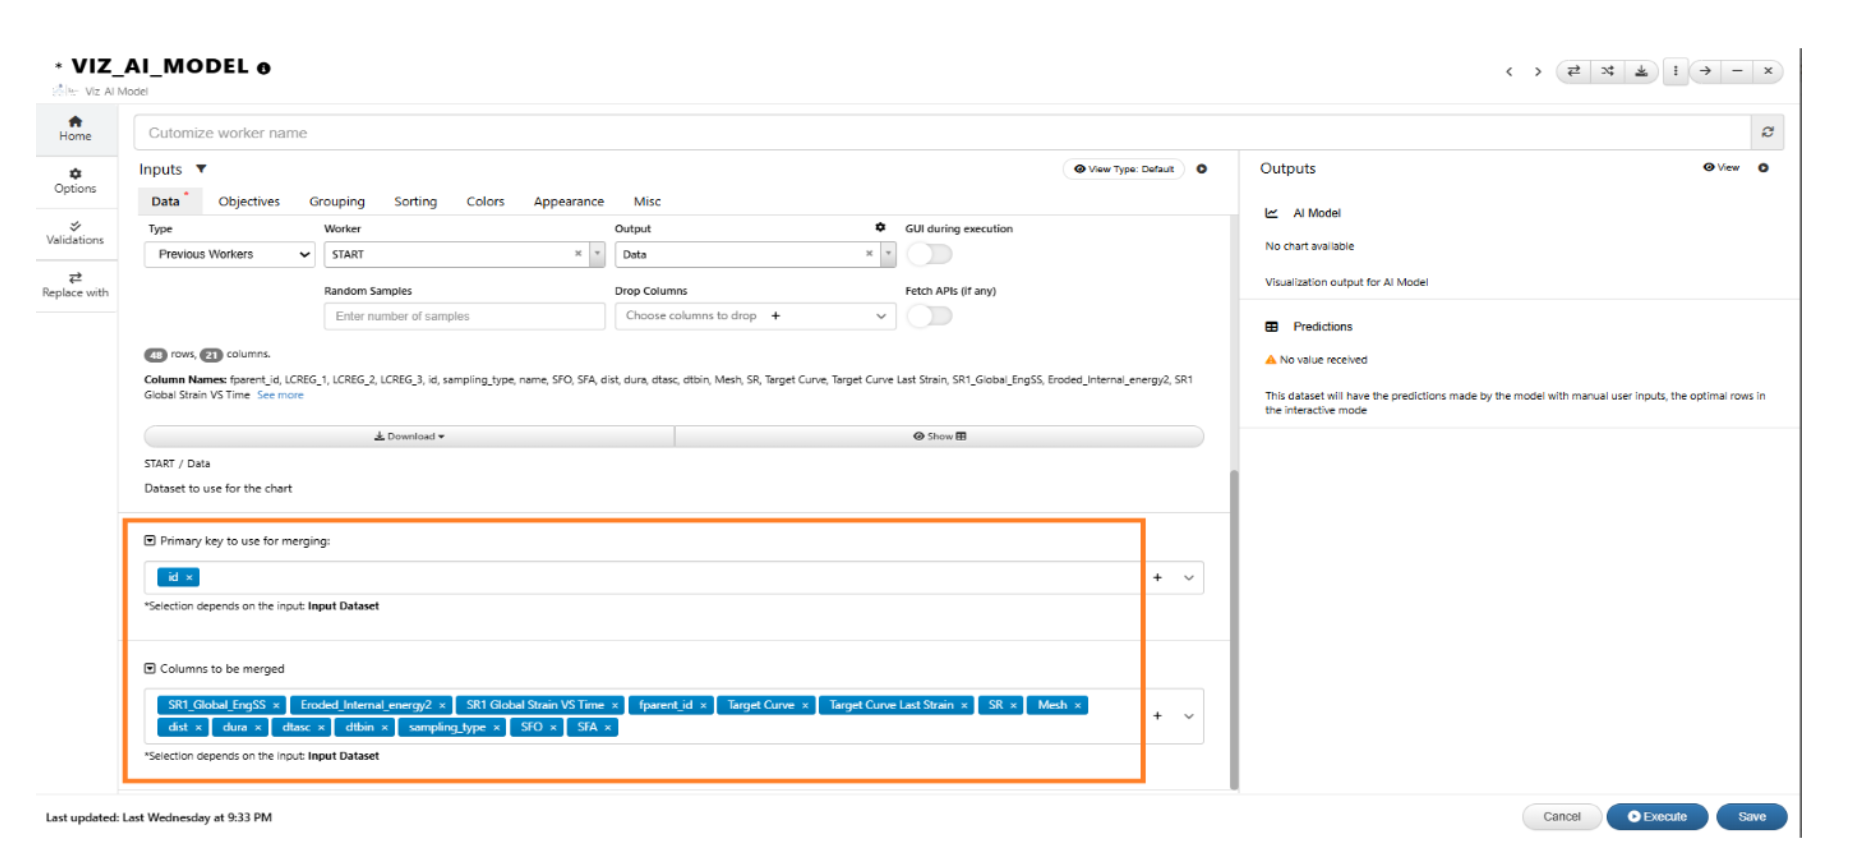
Primary key Merging
*VIZ_AI_MODEL worker has options in the Data tab to pass the X points dataset and X prefix to the ML model. These will be used as reference in output.
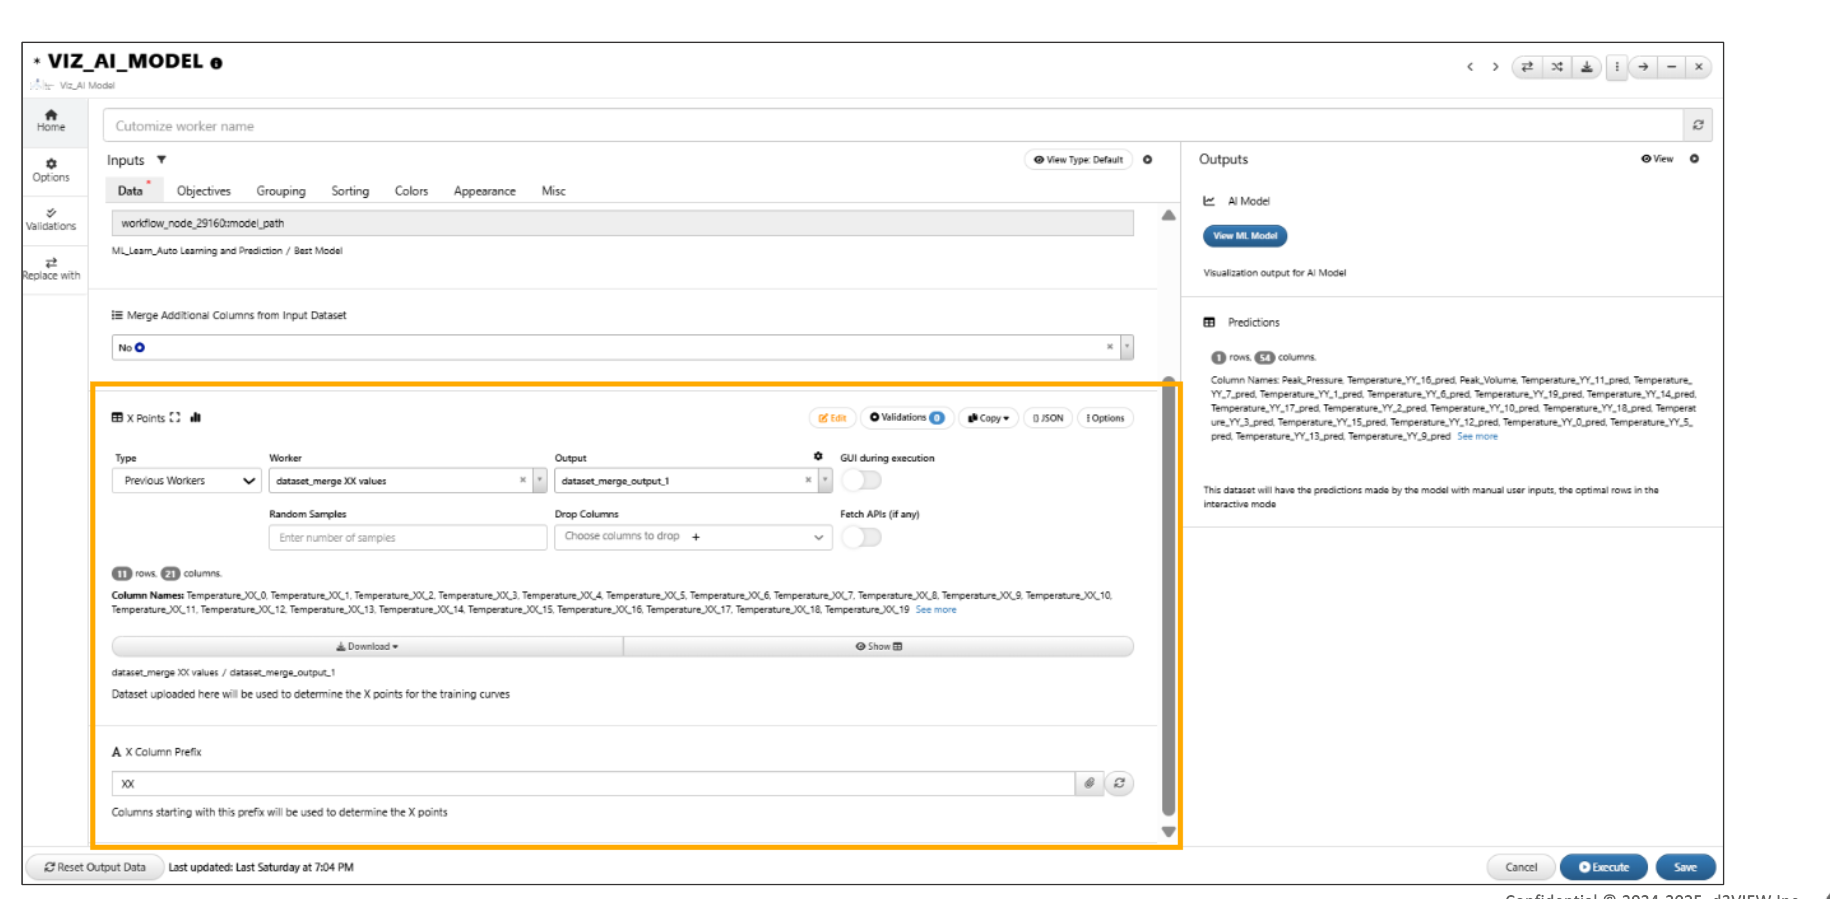
X points
19.3. Appearance Tab
AI Viz worker has new options in Appearance tab and all the settings found in ML Model viewer such as viz type, sliders, colorByDifference, colorBy etc. are now included within the Appearance tab.
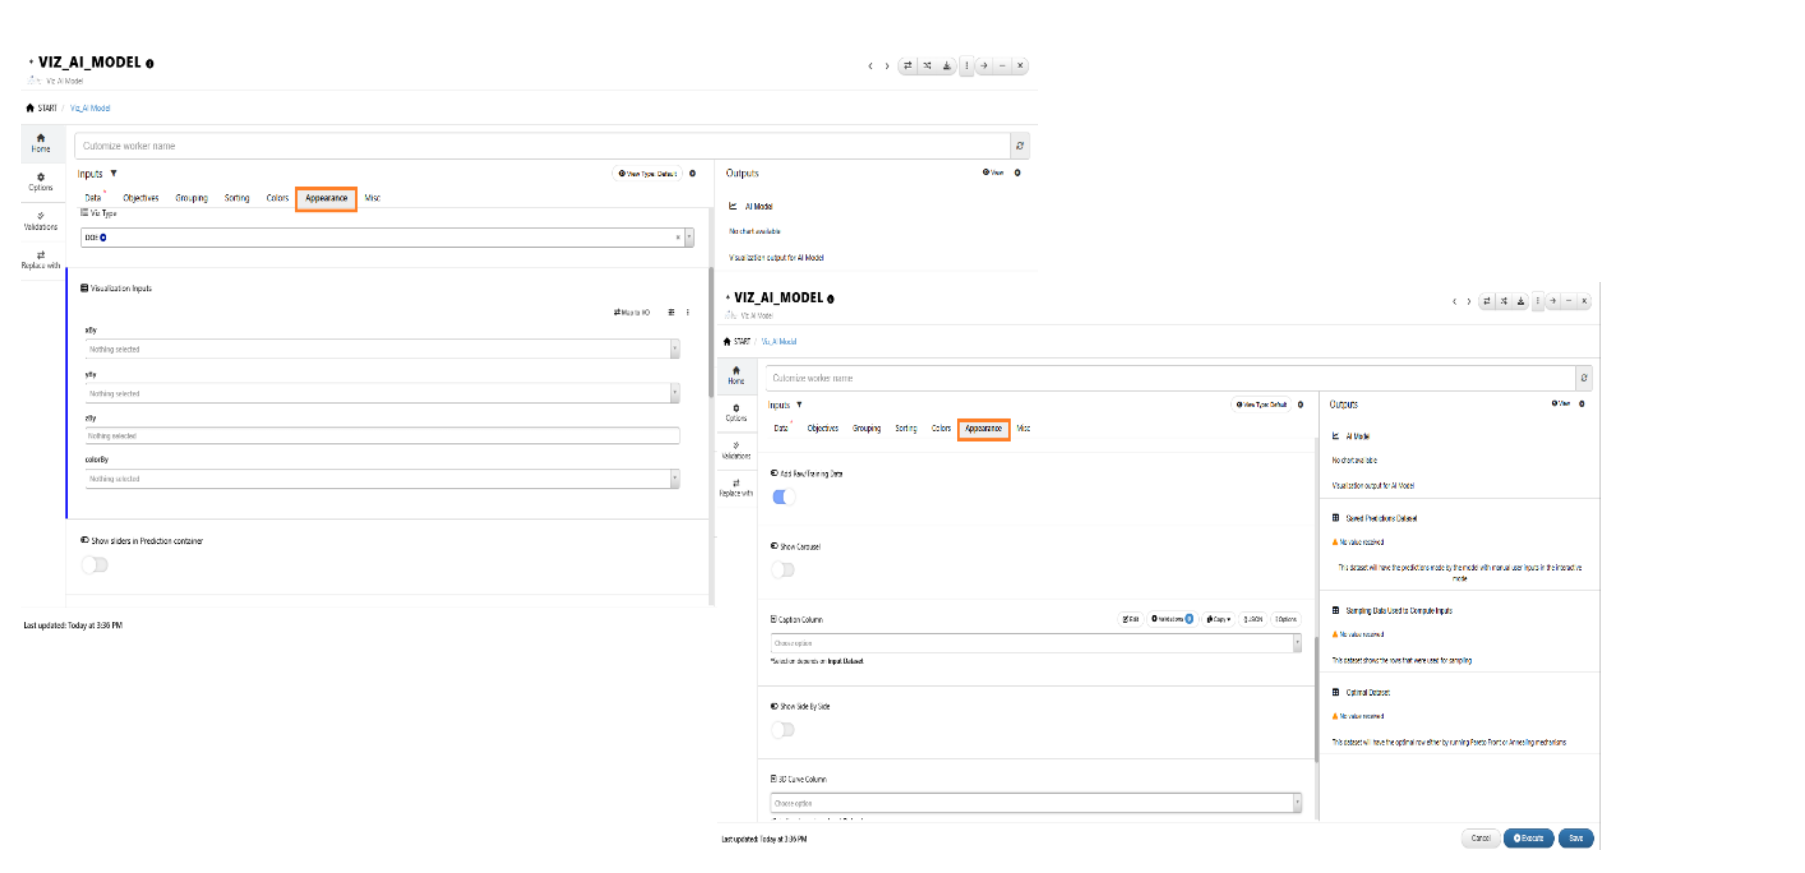
Appearance tab
AI Viz -> ‘Add Raw/Training Data’ input is available for all the visualizers (parallel, table, DOE,2d,3d,etc)
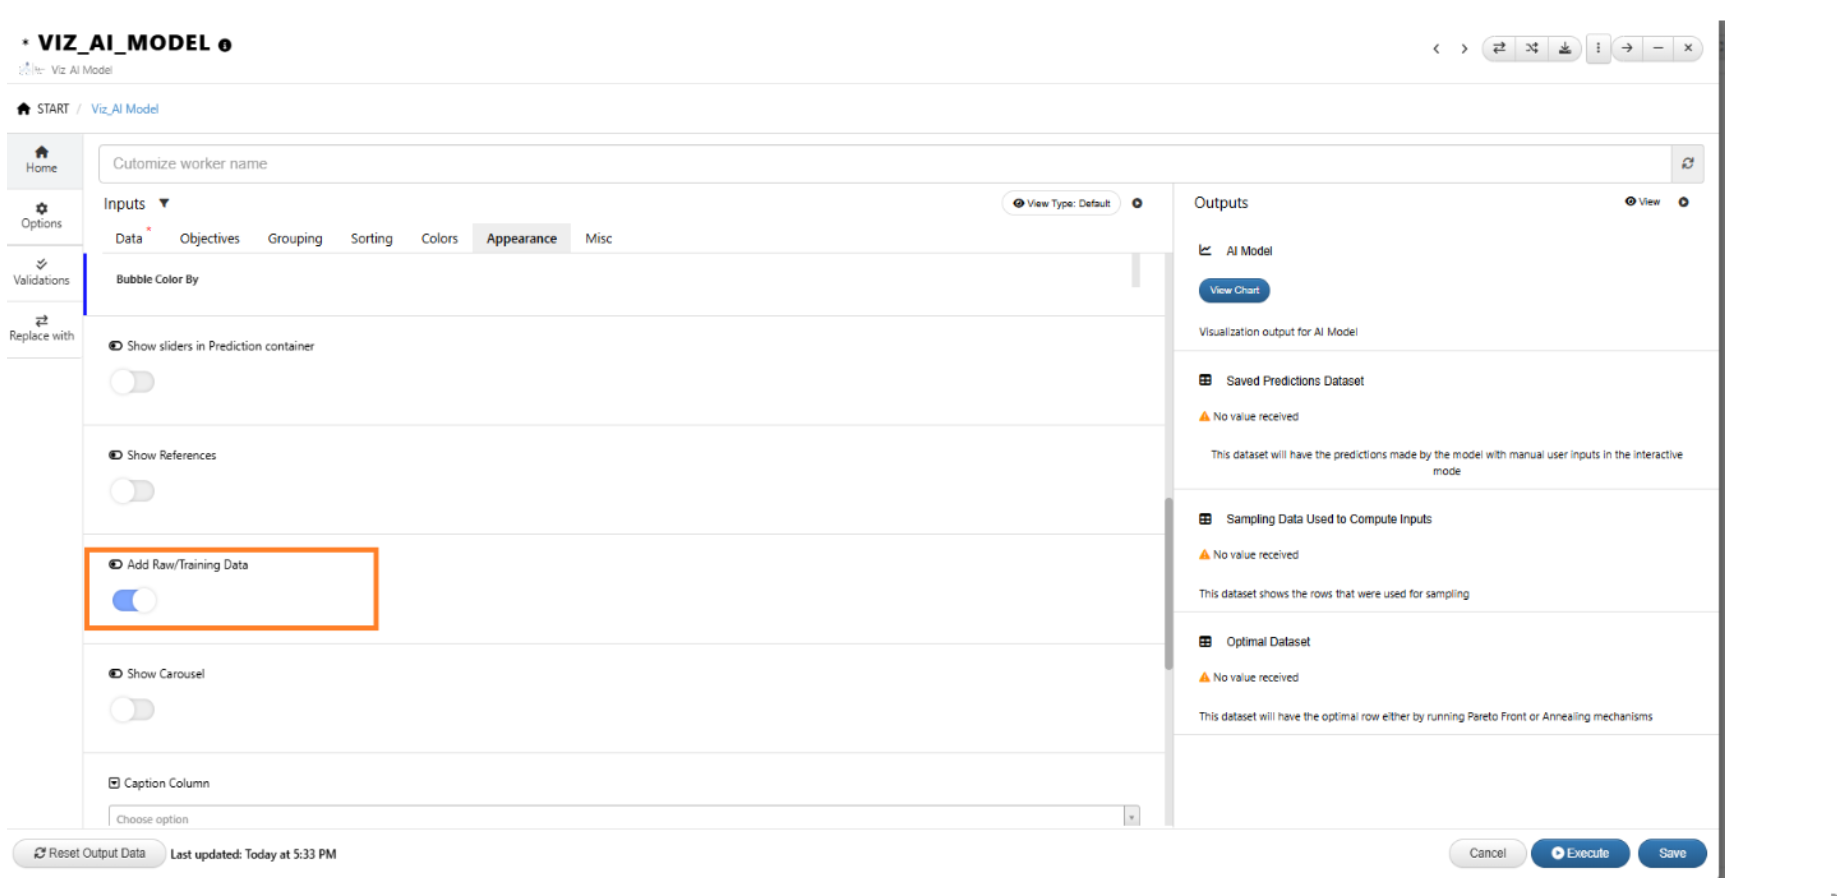
Add Raw/Training Data
In VIZ_AI_MODEL worker, new option called Auto Compute Distance With Reference upon Prediction is added under appearance tab, this will compute and add new column ‘Euclidean distance’ to saved predictions output dataset.
19.4. Objectives
AI Viz -> Option available under Objectives tab to use Sampling data when Computing inputs from Target is chosen as the calculation type. This will show the sampling parameters and create sampling data in the output.
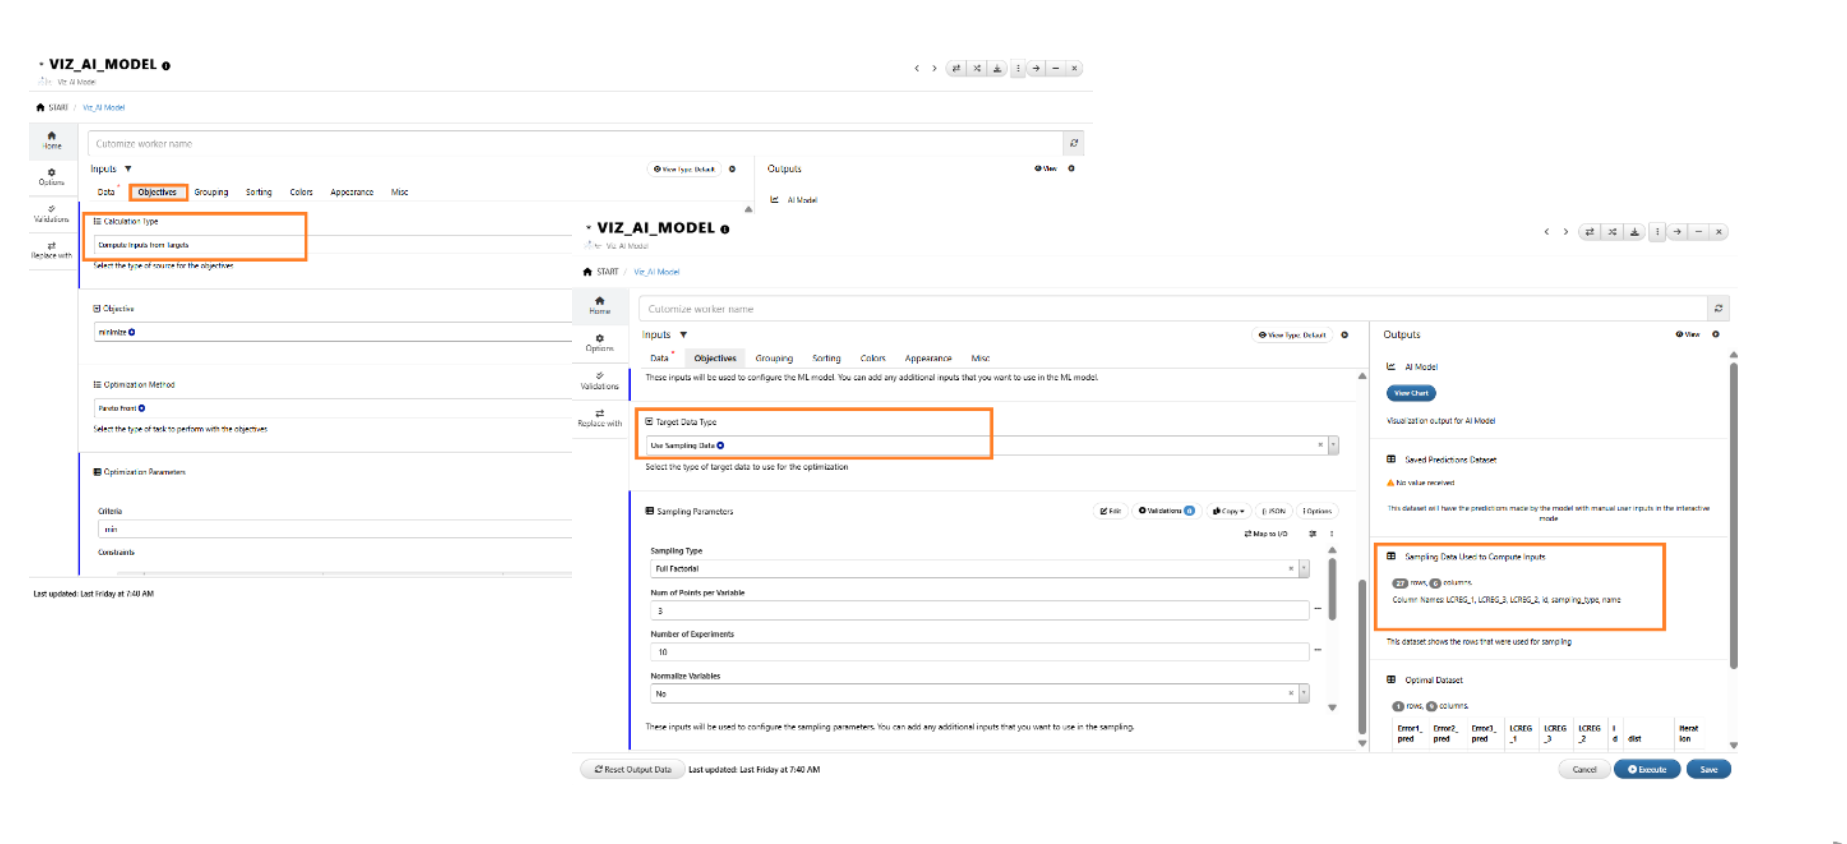
Objectives tab
AI Viz -> Option called ‘Optimization Method’ is available under Objectives tab when Computing inputs from Target is chosen as the ‘Calculation Type’.
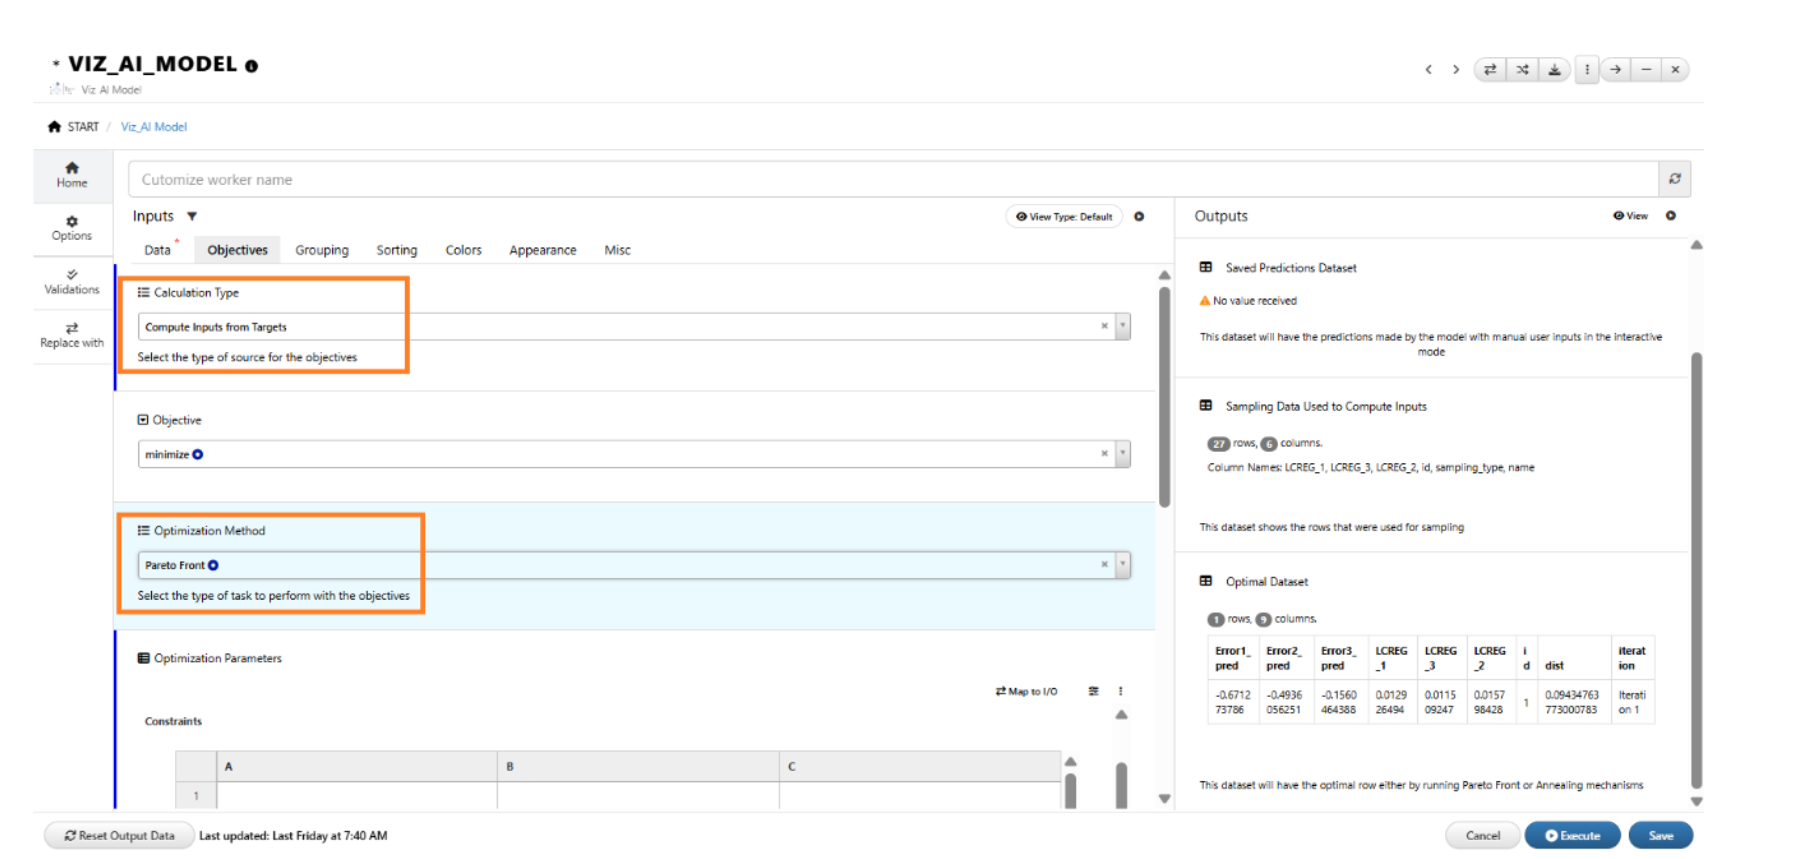
Optimization Method
Two new inputs called ‘Enable Domain Reduction’ and ‘Reduction iterations’ are available in objectives tab for *VIZ_AI_MODEL worker.
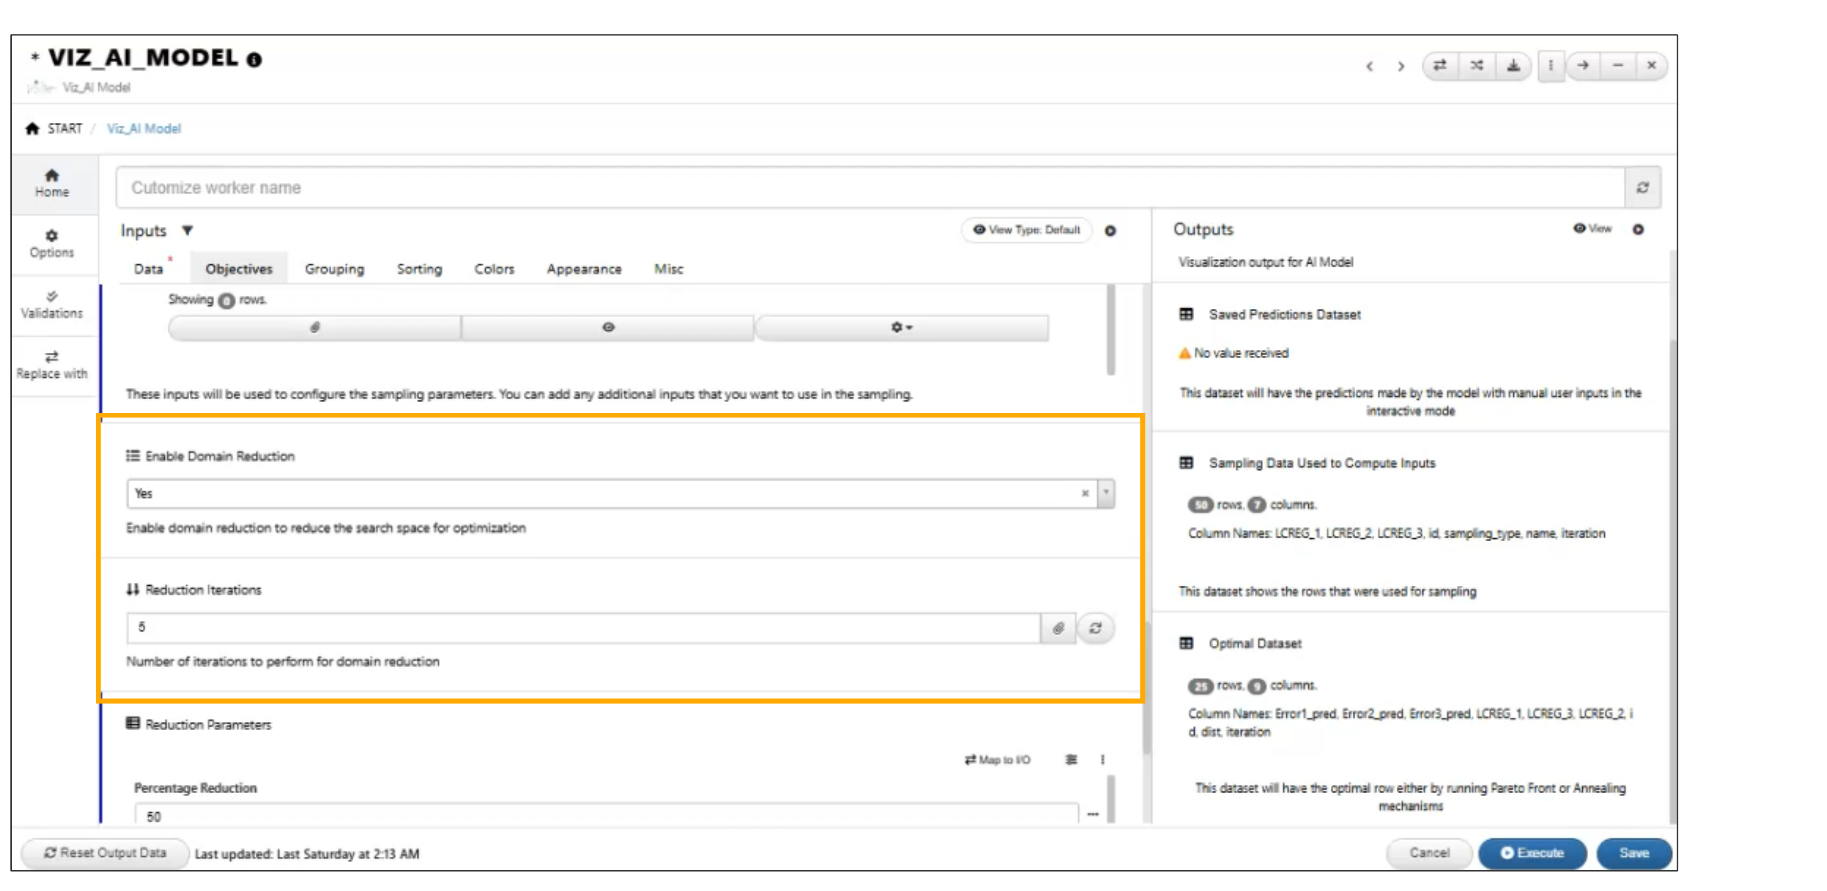
Enable Domain Reduction
*VIZ_AI_MODEL worker supports ‘Reference dataset’ input in Objectives tab which will be shown in black circles in the ML viewer.
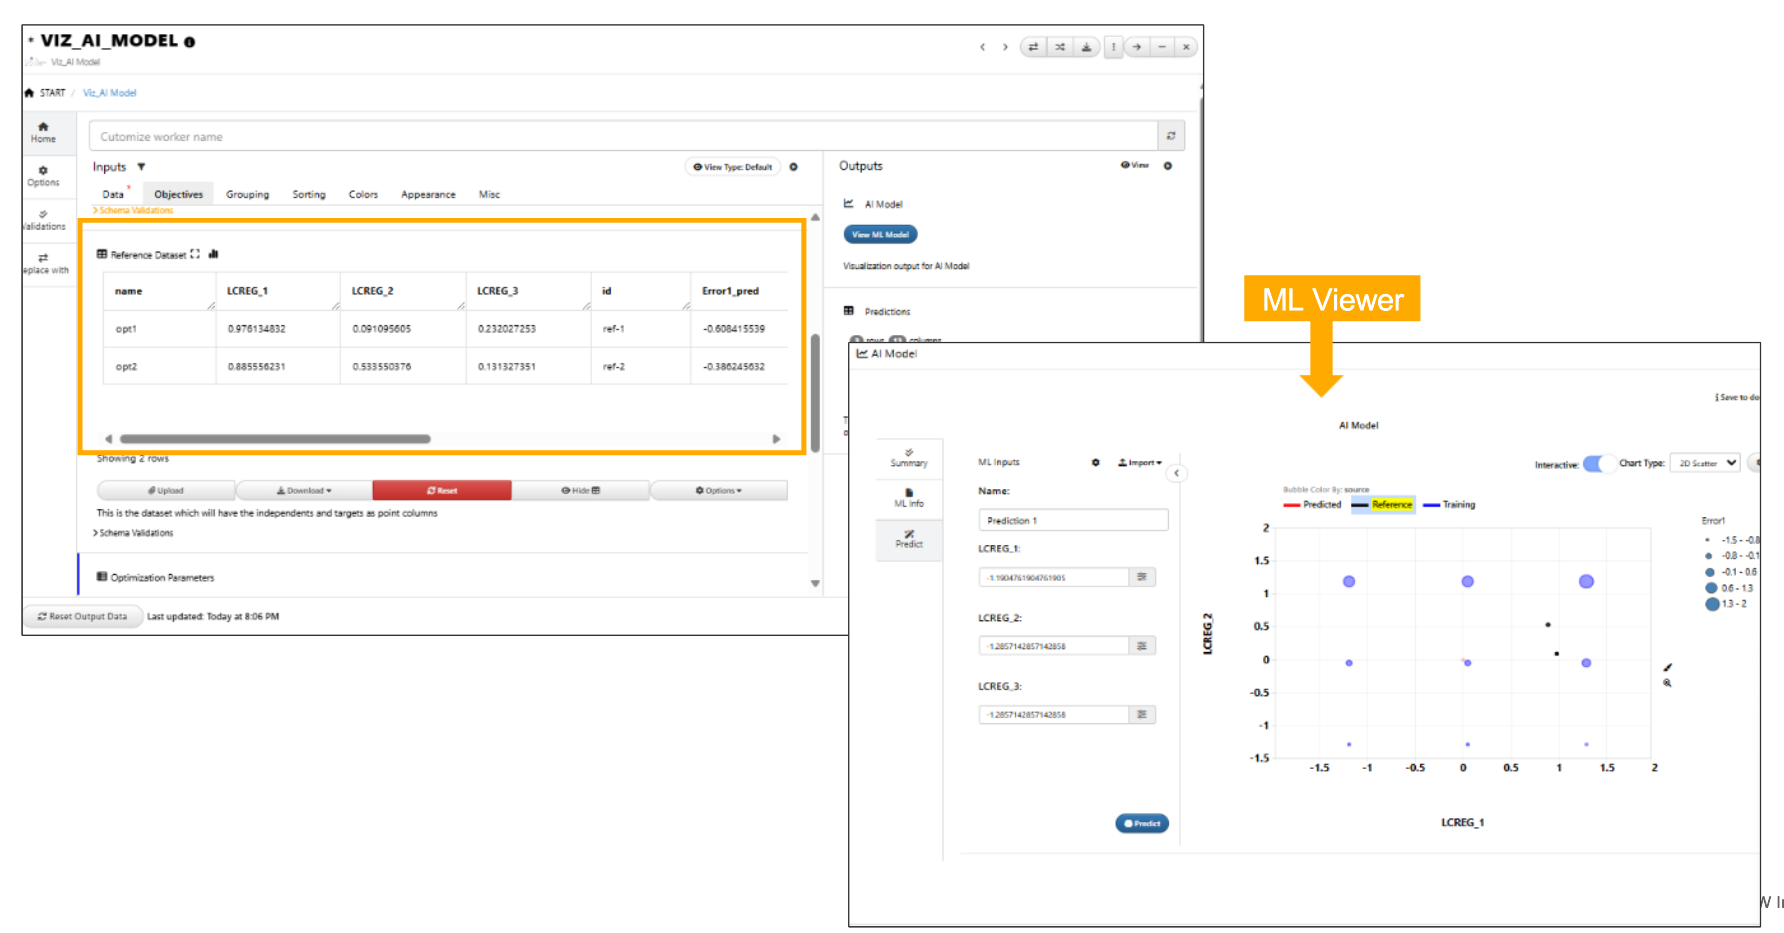
Reference dataset
*VIZ_AI_MODEL worker will display the Reference Dataset input even when the Main Task is set to Optimization.
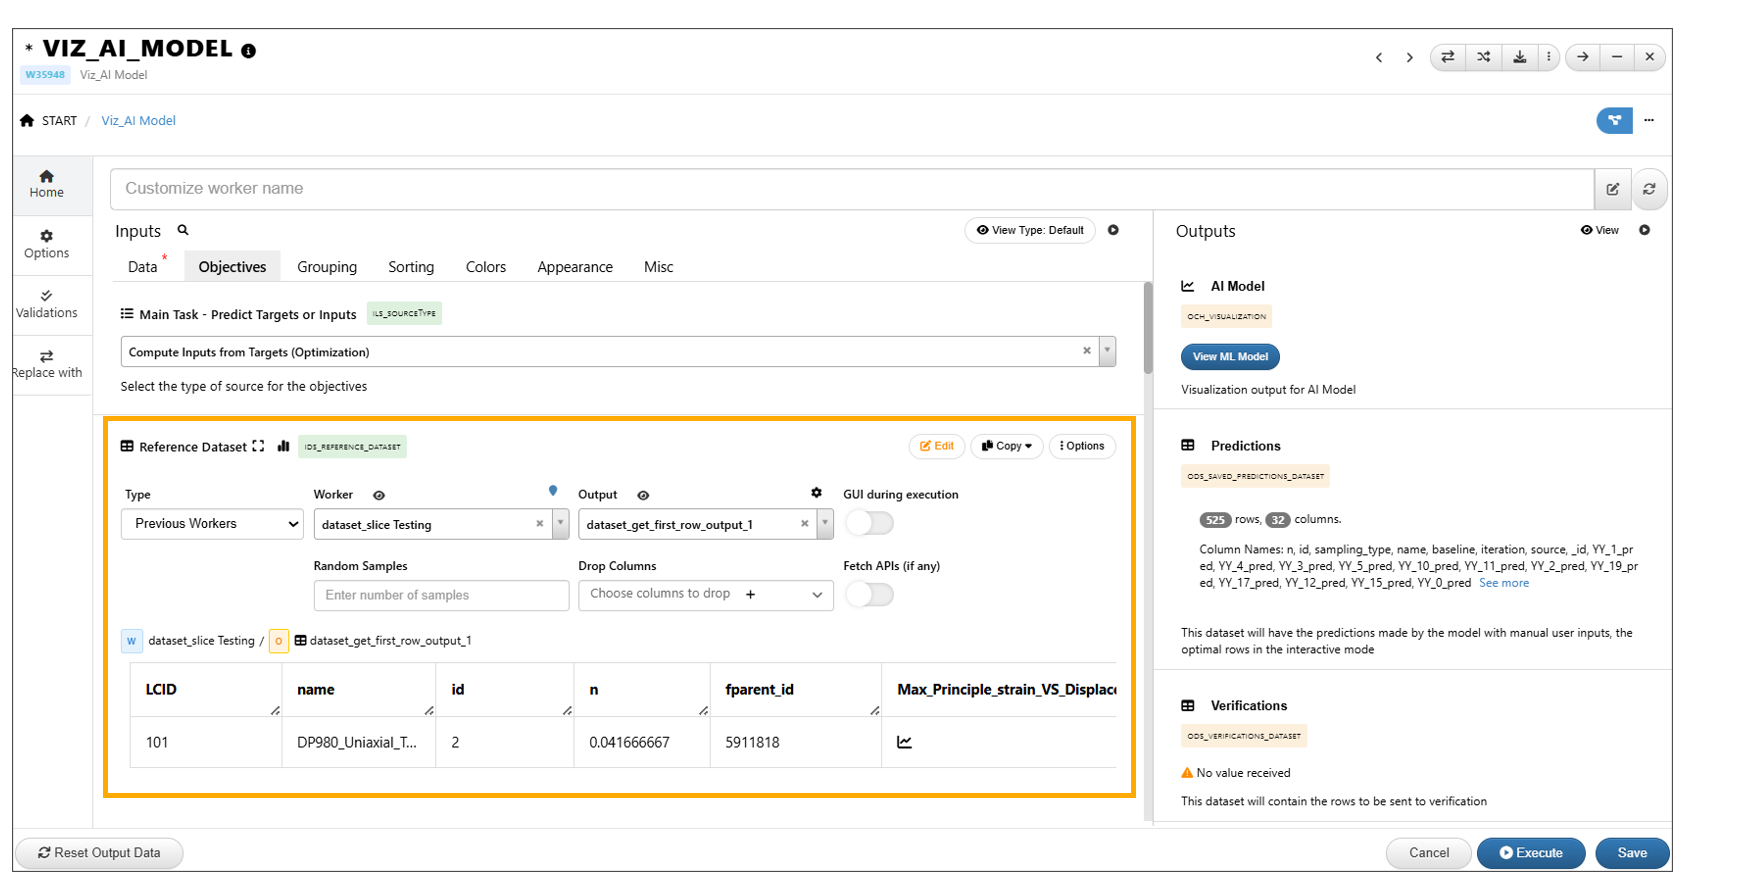
Reference dataset
ML Model view -> Prediction tab now has a collapse button to collapse the sliders to the left.
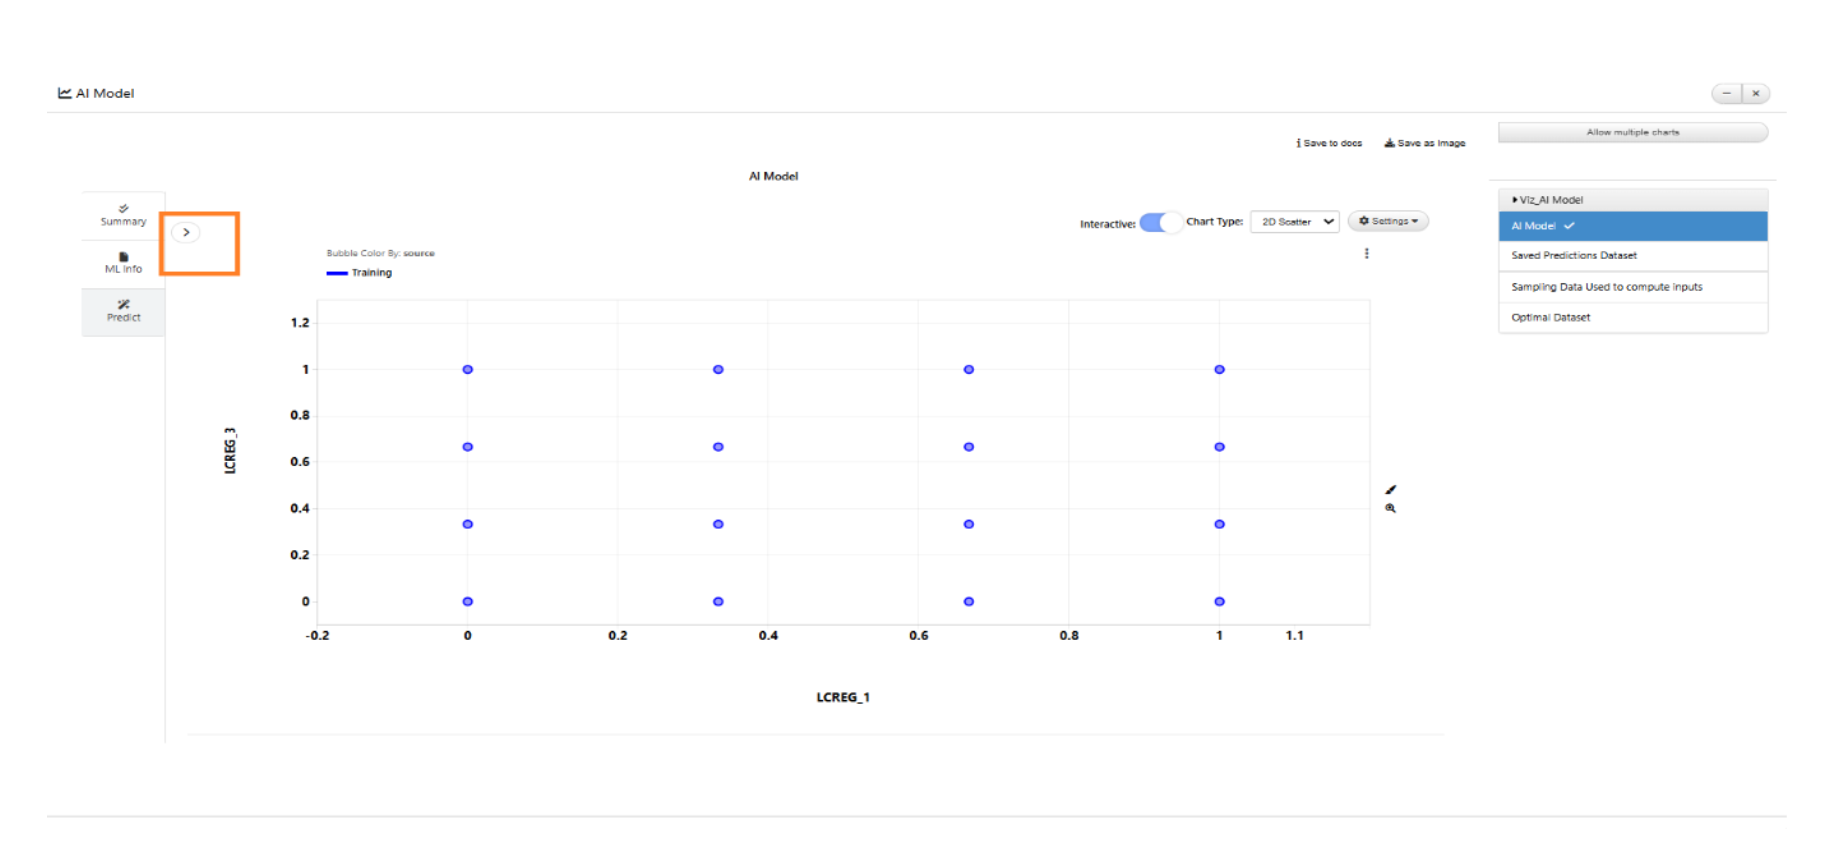
collapse button
New input called ‘Compute Accuracy’ is added under Objectives tab in AI_VIZ_MODEL worker. This will create accuracy columns in the output predictions dataset after execution.
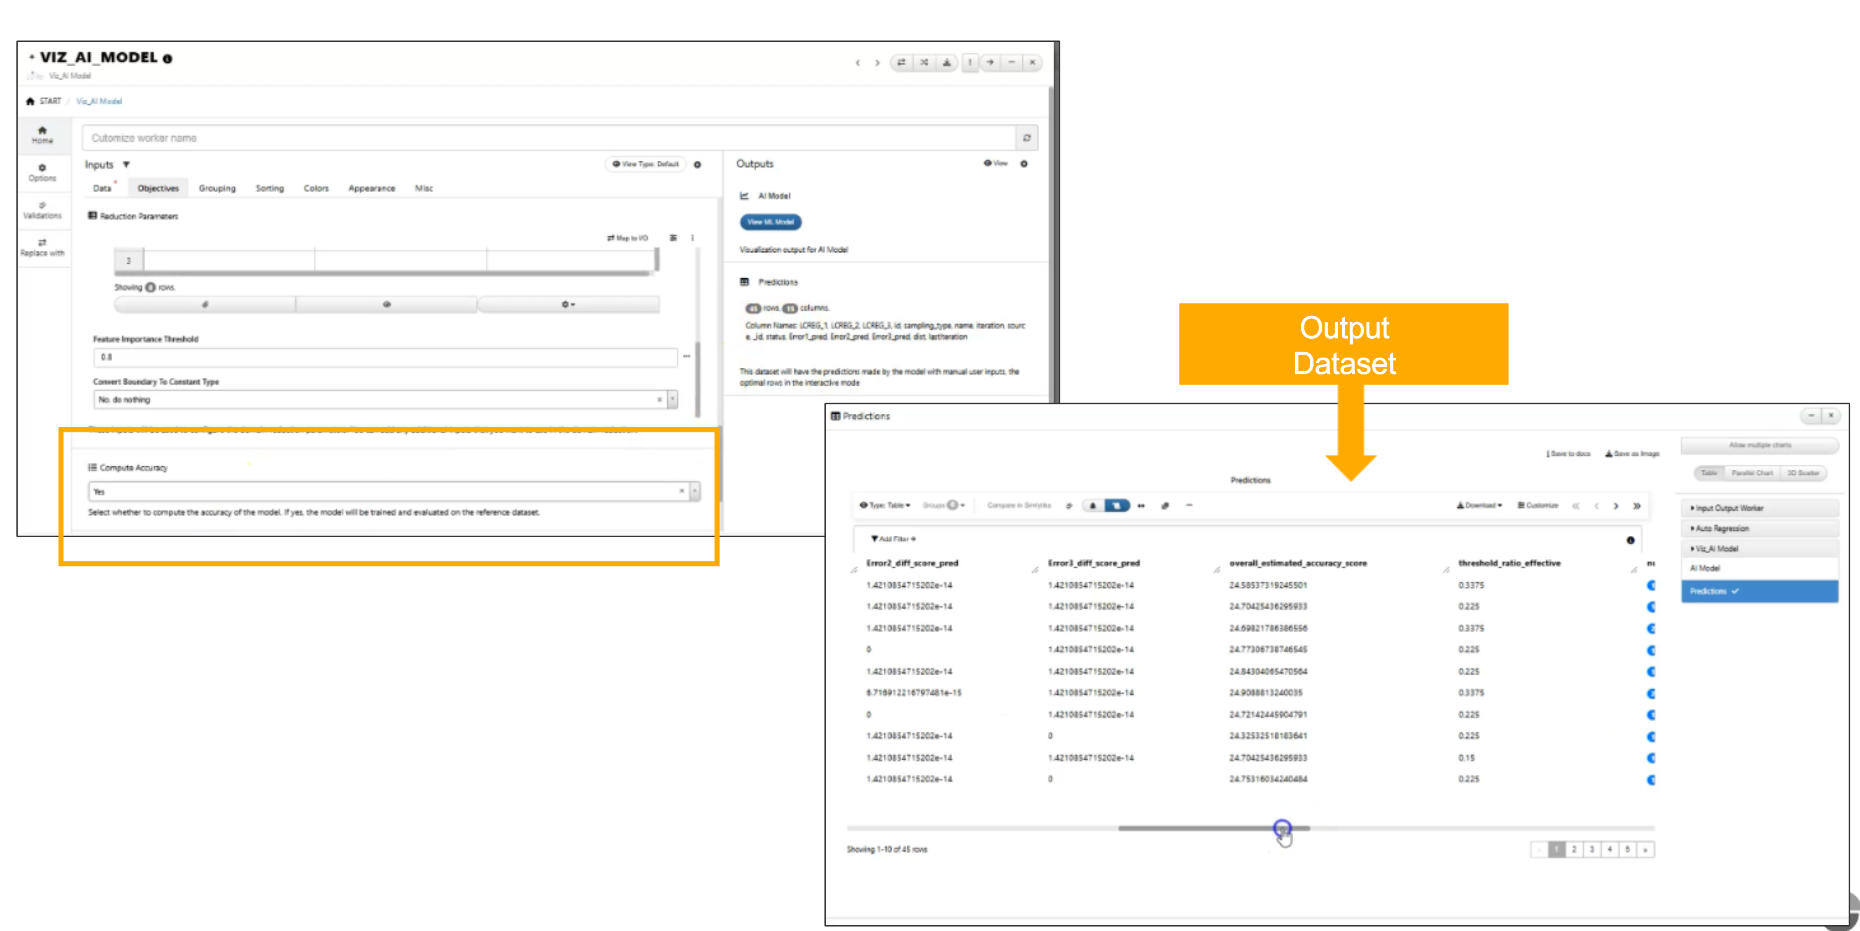
Compute Accuracy
AI Viz: When domain reduction is applied in AI Viz, a new tab will appear in the AI/ML view displaying the distribution of optimal rows, color-coded by iteration. Supported visualization types include Bubble chart (default), Table, and 3D Scatter.
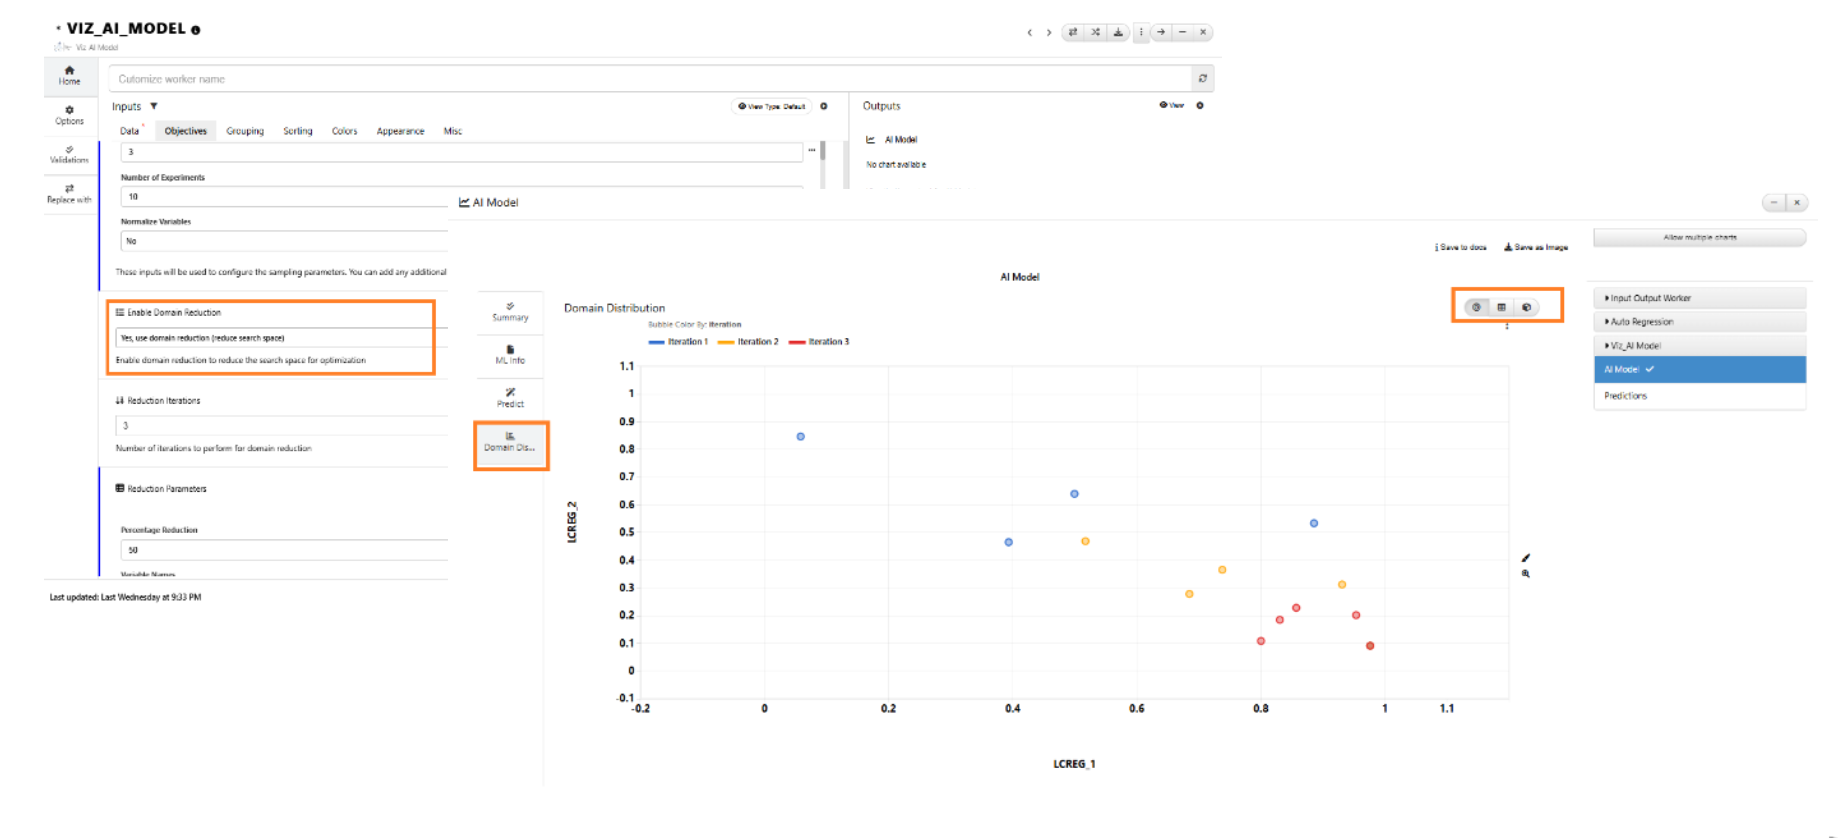
Domain reductions
The *VIZ_AI_MODEL worker now computes Accuracy and include columns in the output predictions dataset.
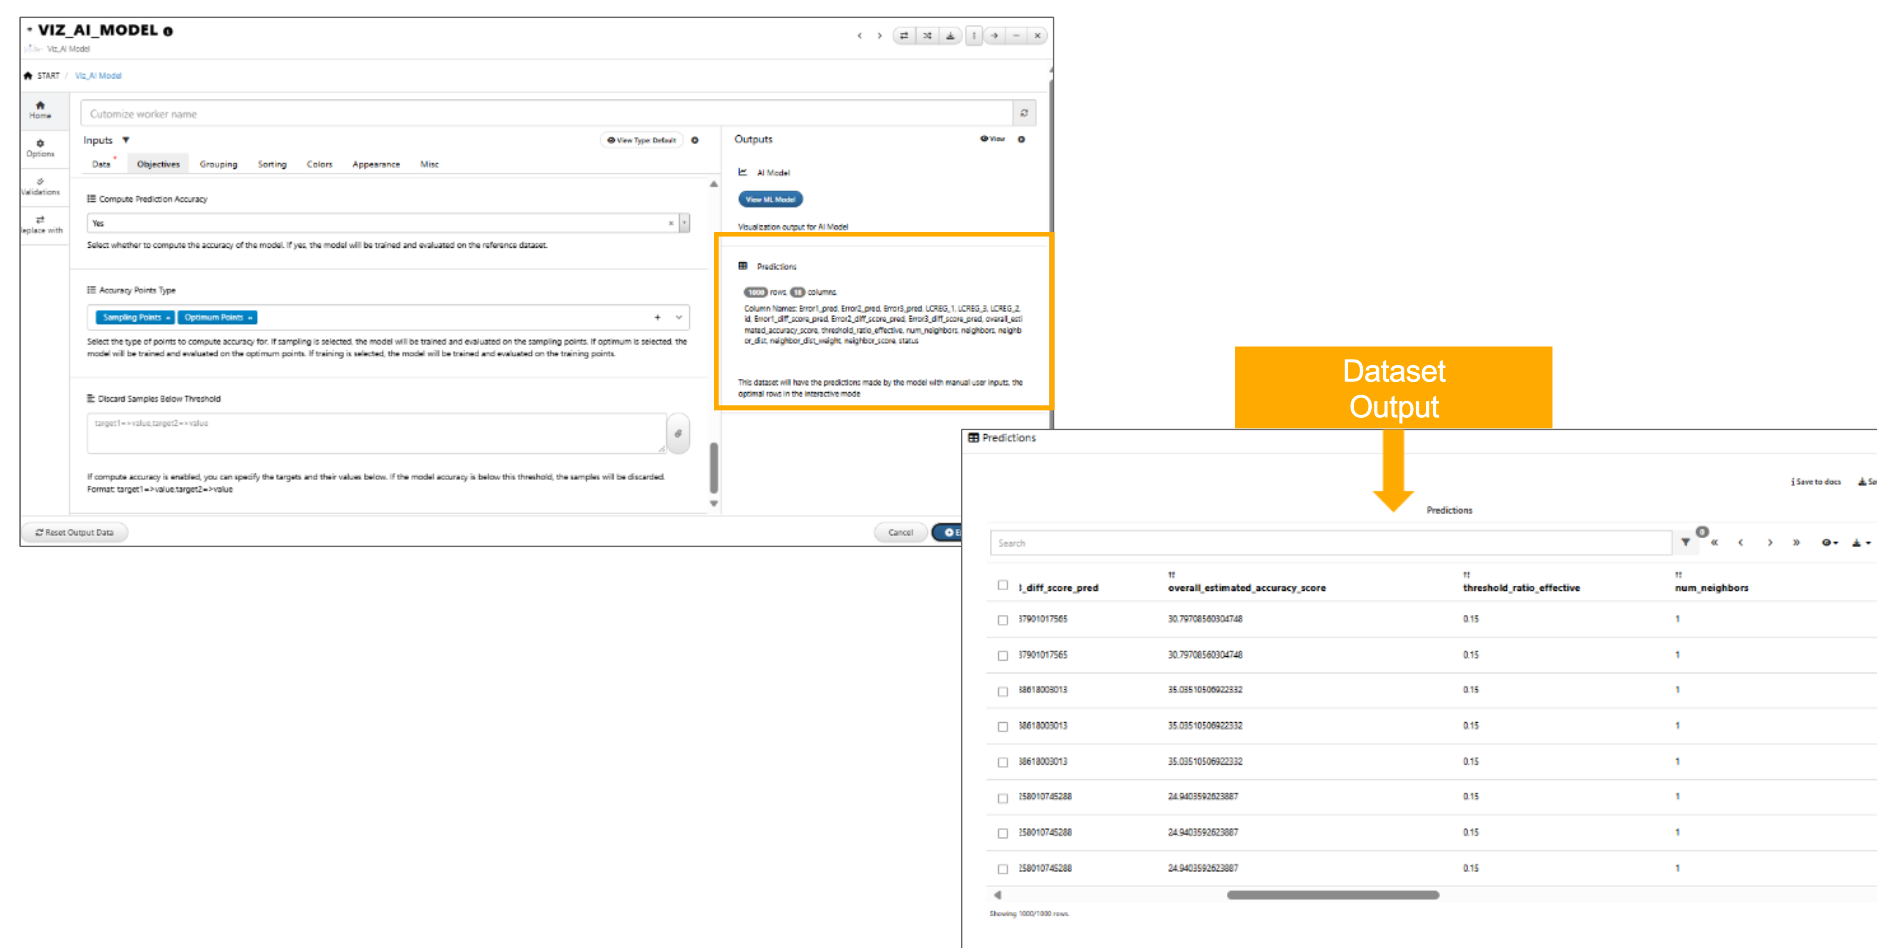
Accuracy
In the *VIZ_AI_MODEL worker, we have two points type called ‘Sampling points’ and ‘Optimum points’ to predict accuracy.
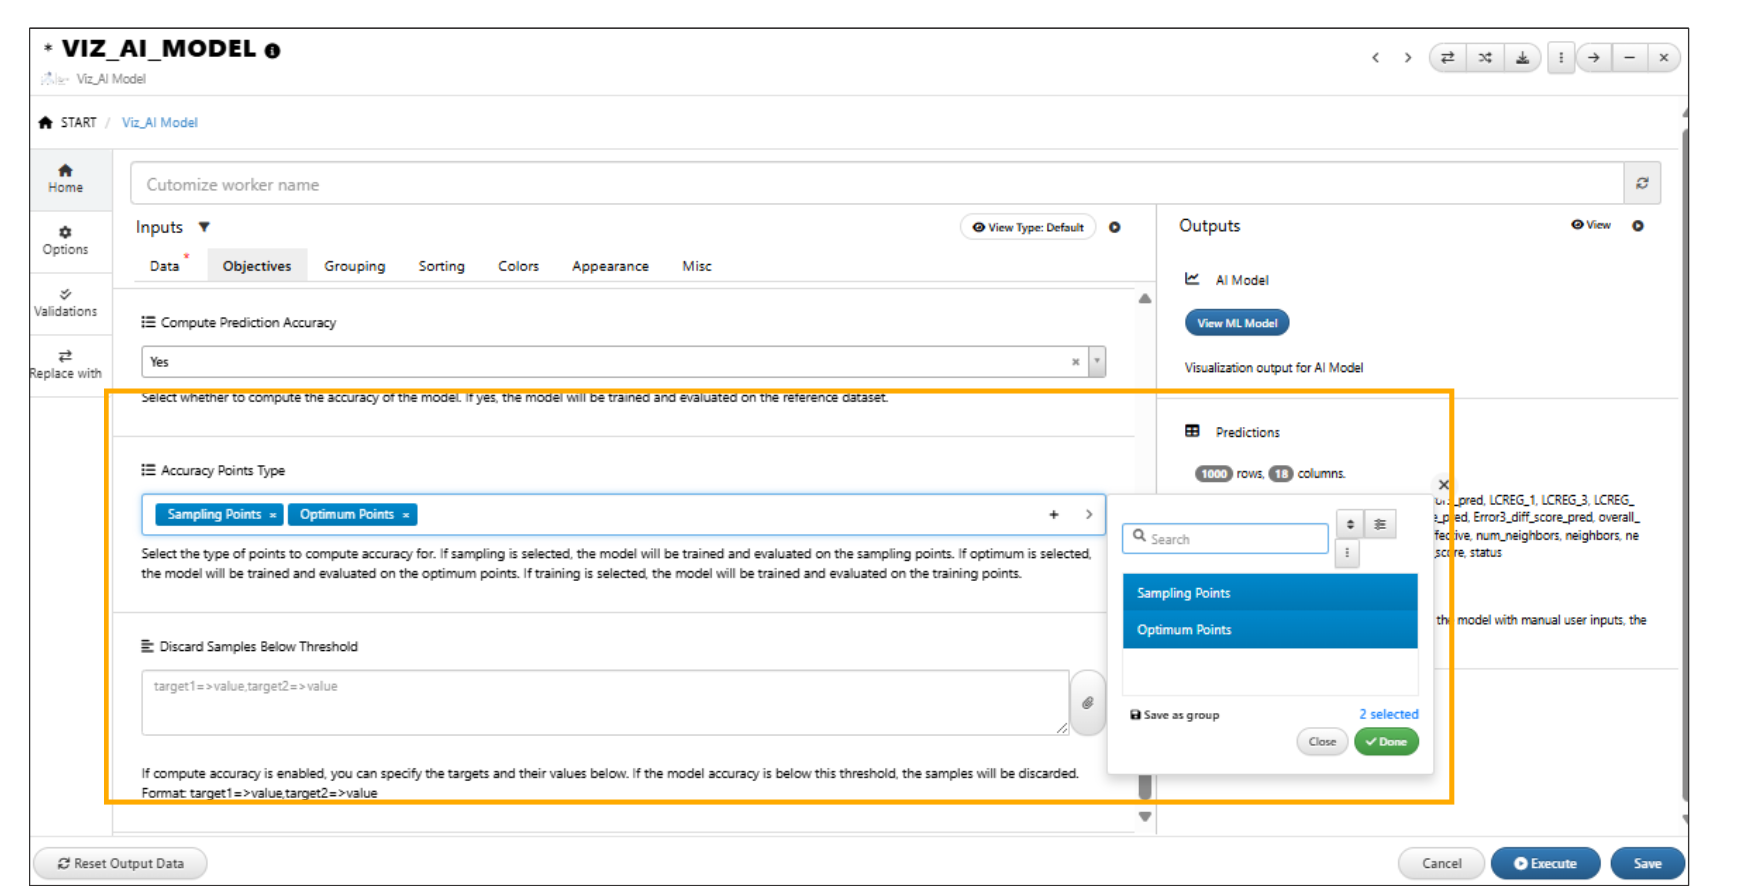
Points type
In VIZ_AI_MODEL worker, the Accuracy points type now include training points as input.
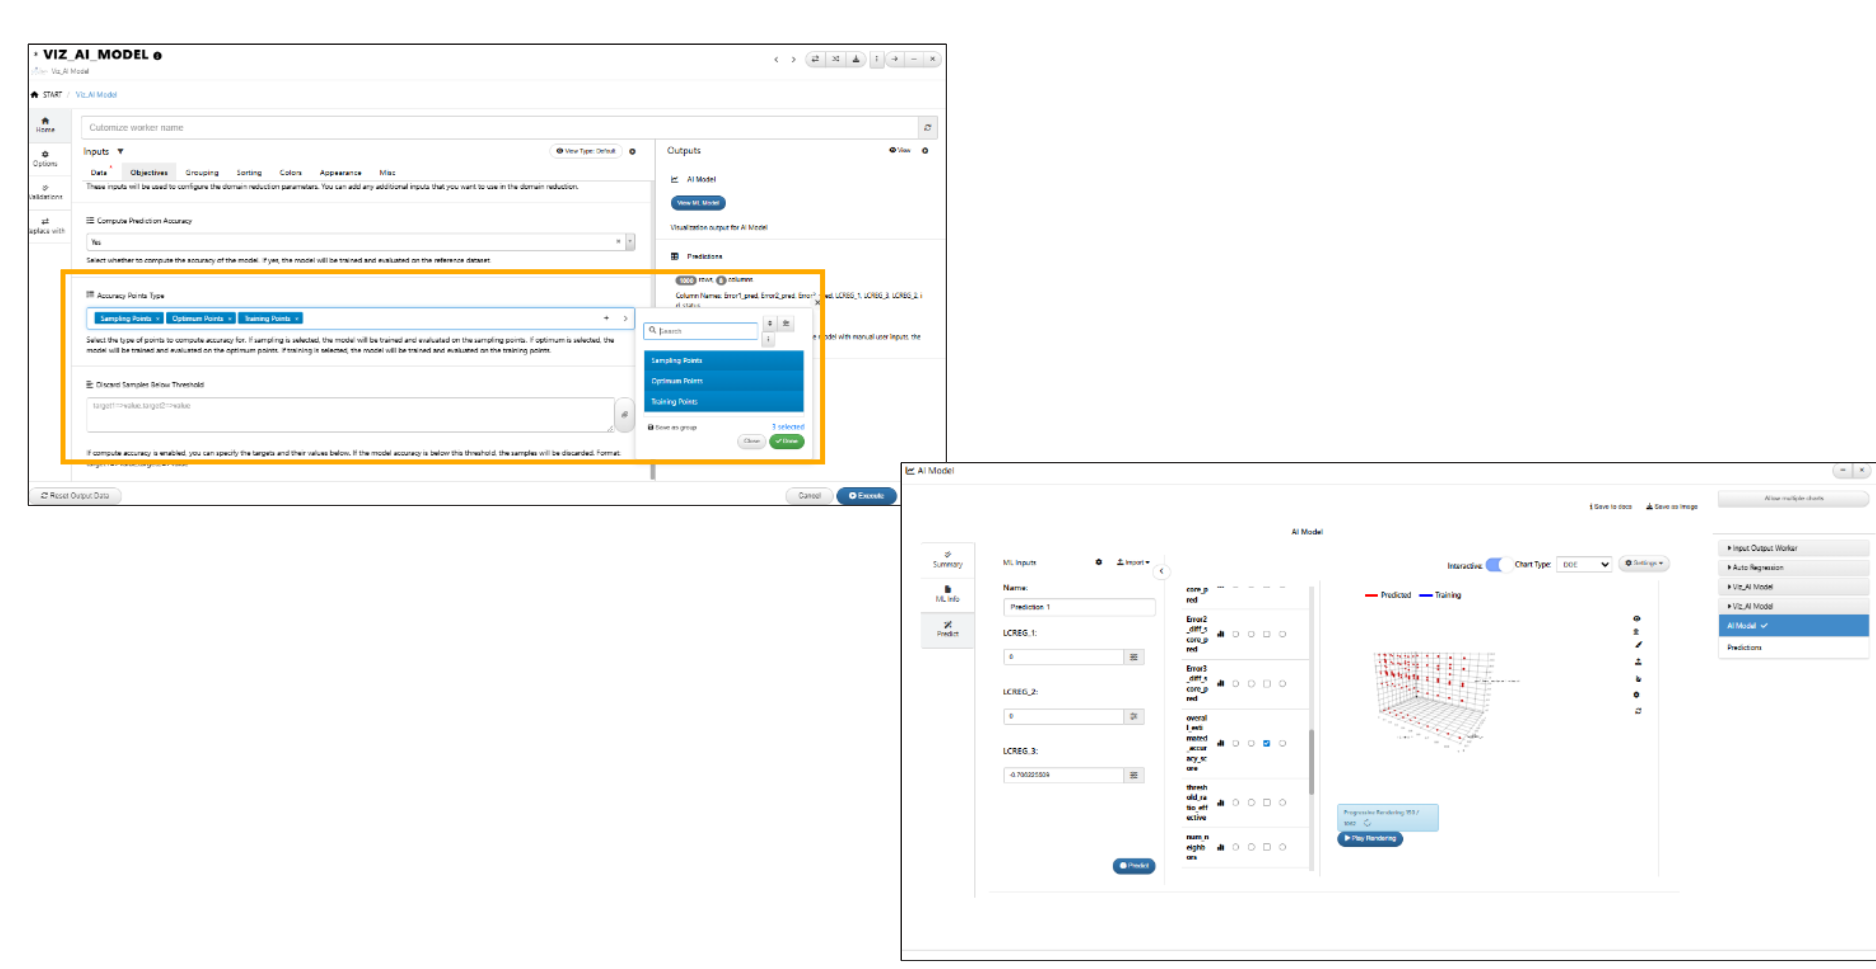
Points type
*VIZ_AI_MODEL worker -> Objectives tab has new input option below Reference Dataset to select a curve column from the Reference dataset. This is carried over to the ML model where the reference curve is displayed in the output.
In VIZ_AI_MODEL worker, new dataset input called Optimum has been added under the Objectives tab. This input passes the dataset to the Verifications dataset output after execution.
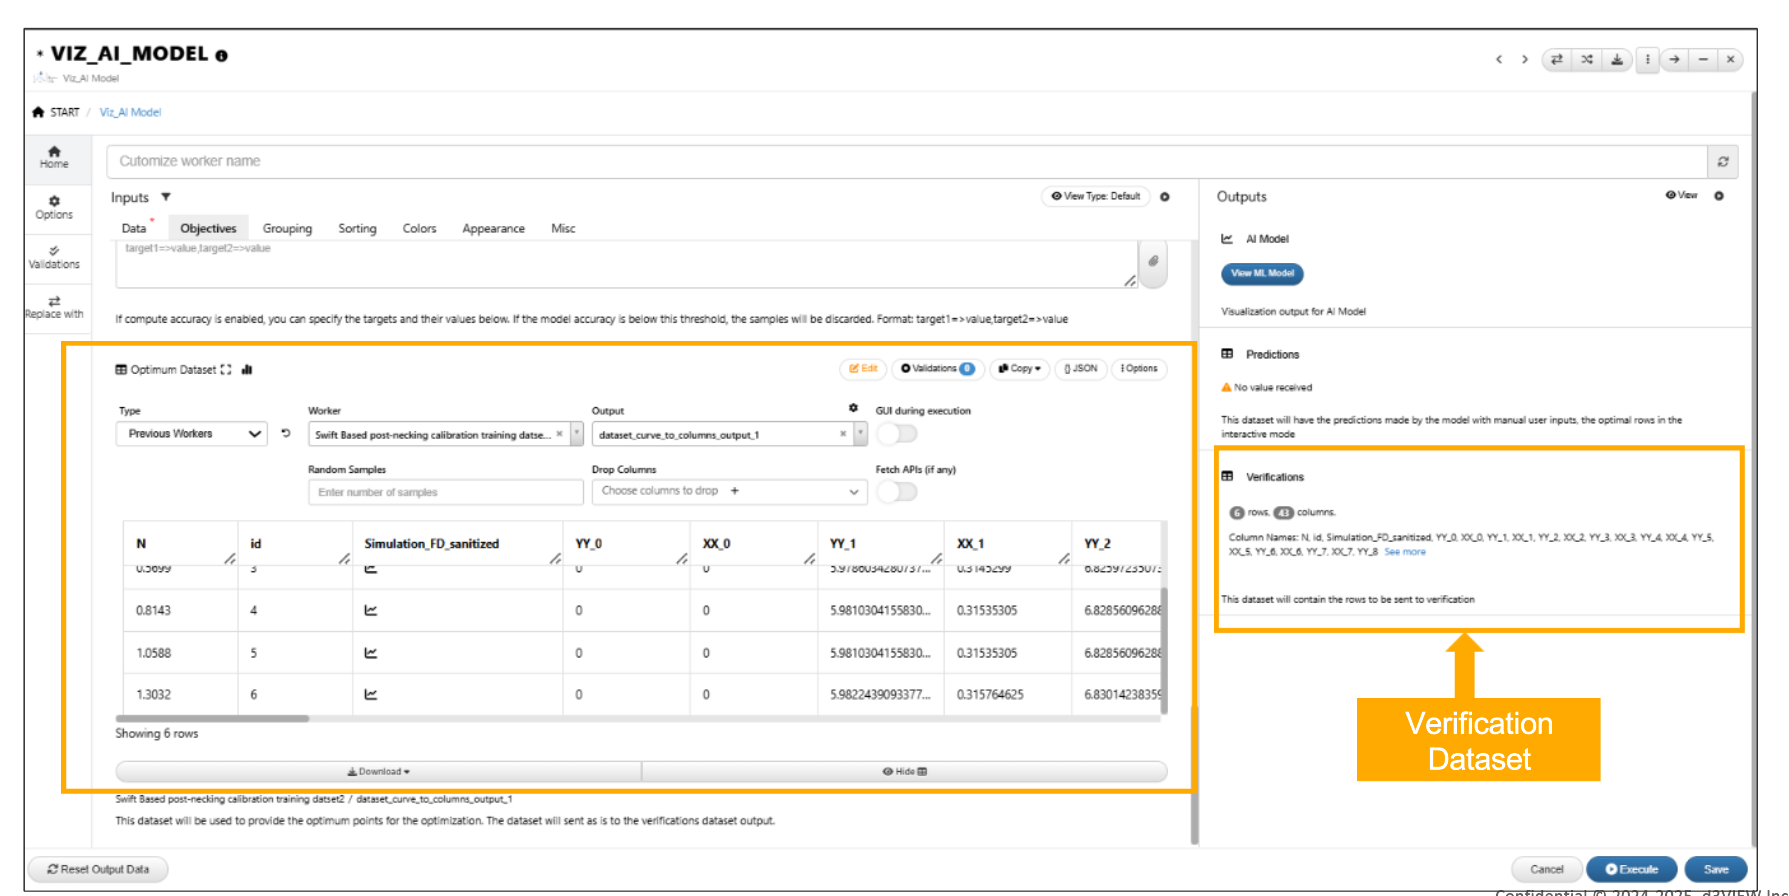
Optimum dataset
Optimum dataset
19.5. Colors
Added a new Custom Colors dataset input in the Colors tab of *VIZ_AI_MODEL worker. These colors are applied to charts in the Predicted outputs.
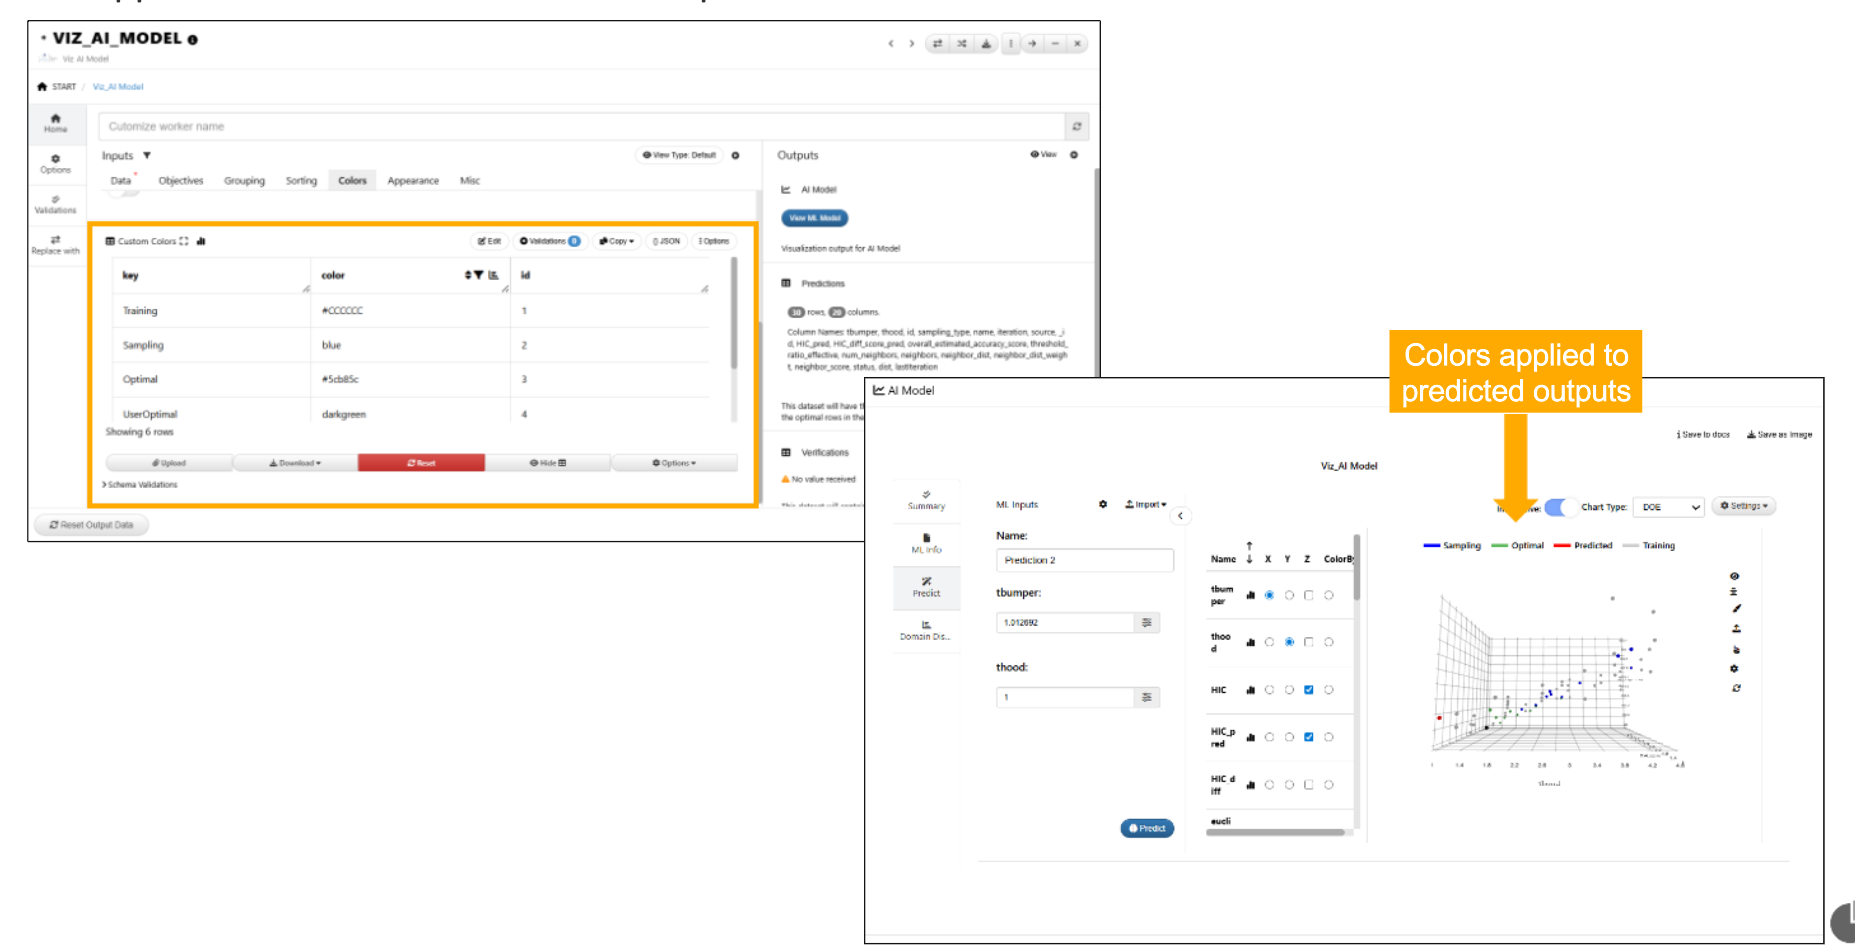
:sup:`Custom Colors dataset `
19.6. Predictions output
*VIZ_AI_MODEL worker now has only one predictions output after execution and has a new column called source to identify predicted and reference values.
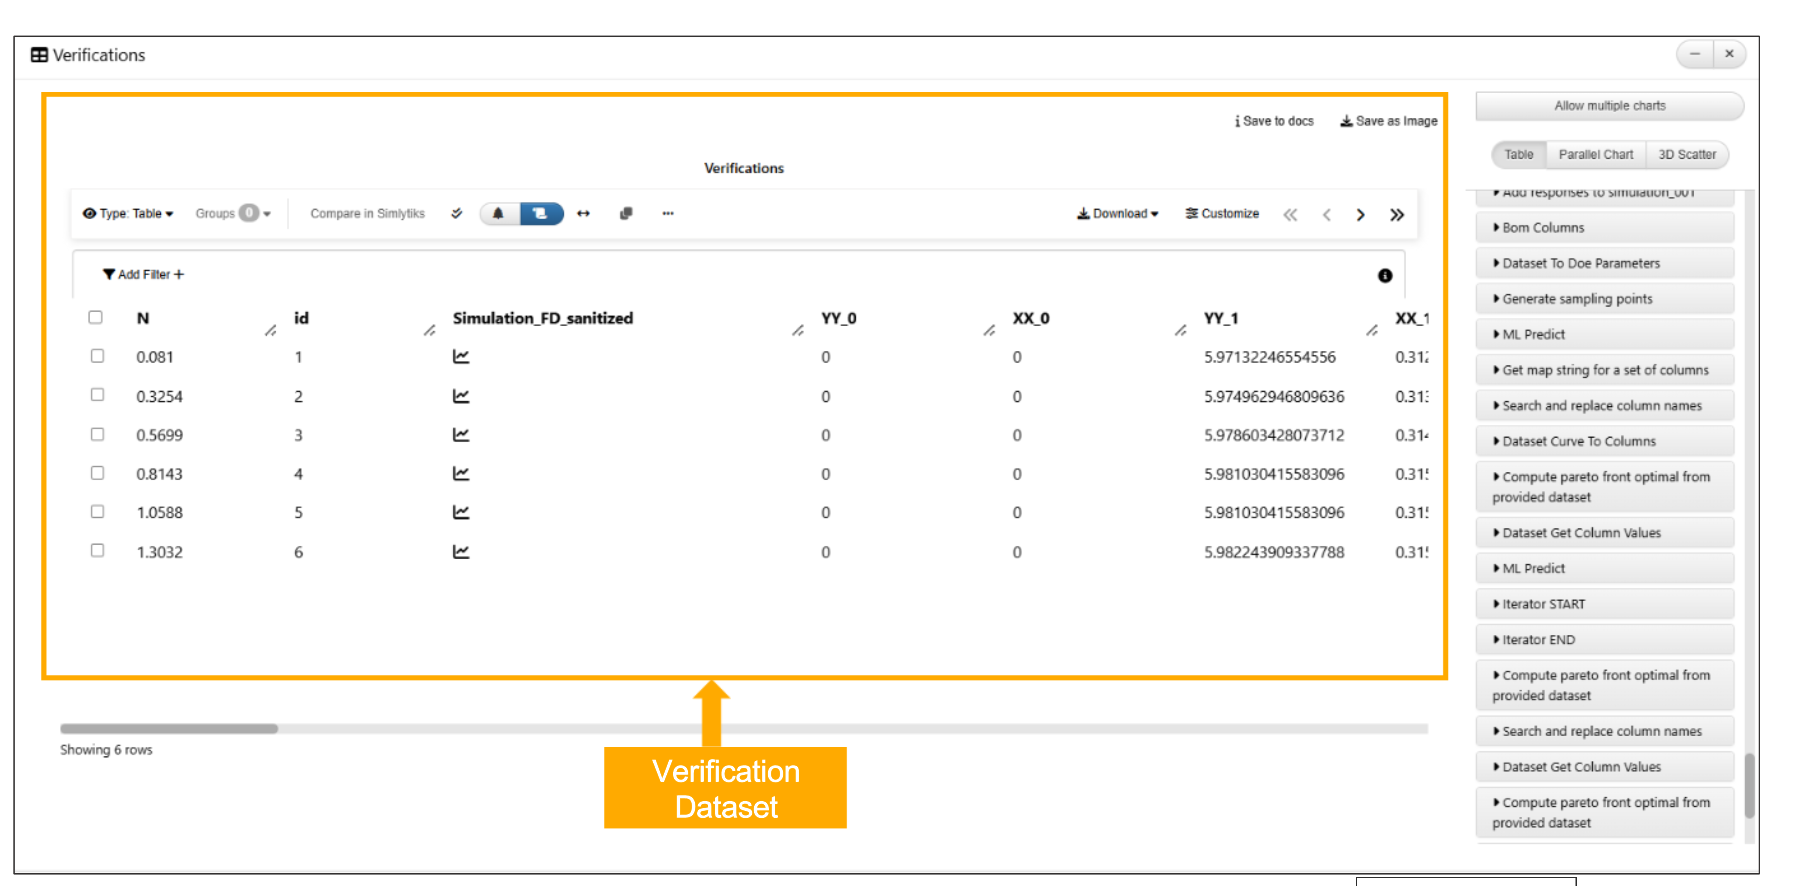
19.7. Verifications
The model viewer in *VIZ_AI_MODEL worker has new context menu option called ‘Add to verifications’ for the predictions which will then be available under verifications output in the worker.
19.8. Compare in Simlytiks
AI Viz: The context menu for selected rows in the Predict tab now includes a new option called ‘Compare in Simlytiks’, which instantly opens a new Simlytiks tab and visualizes the selected rows.
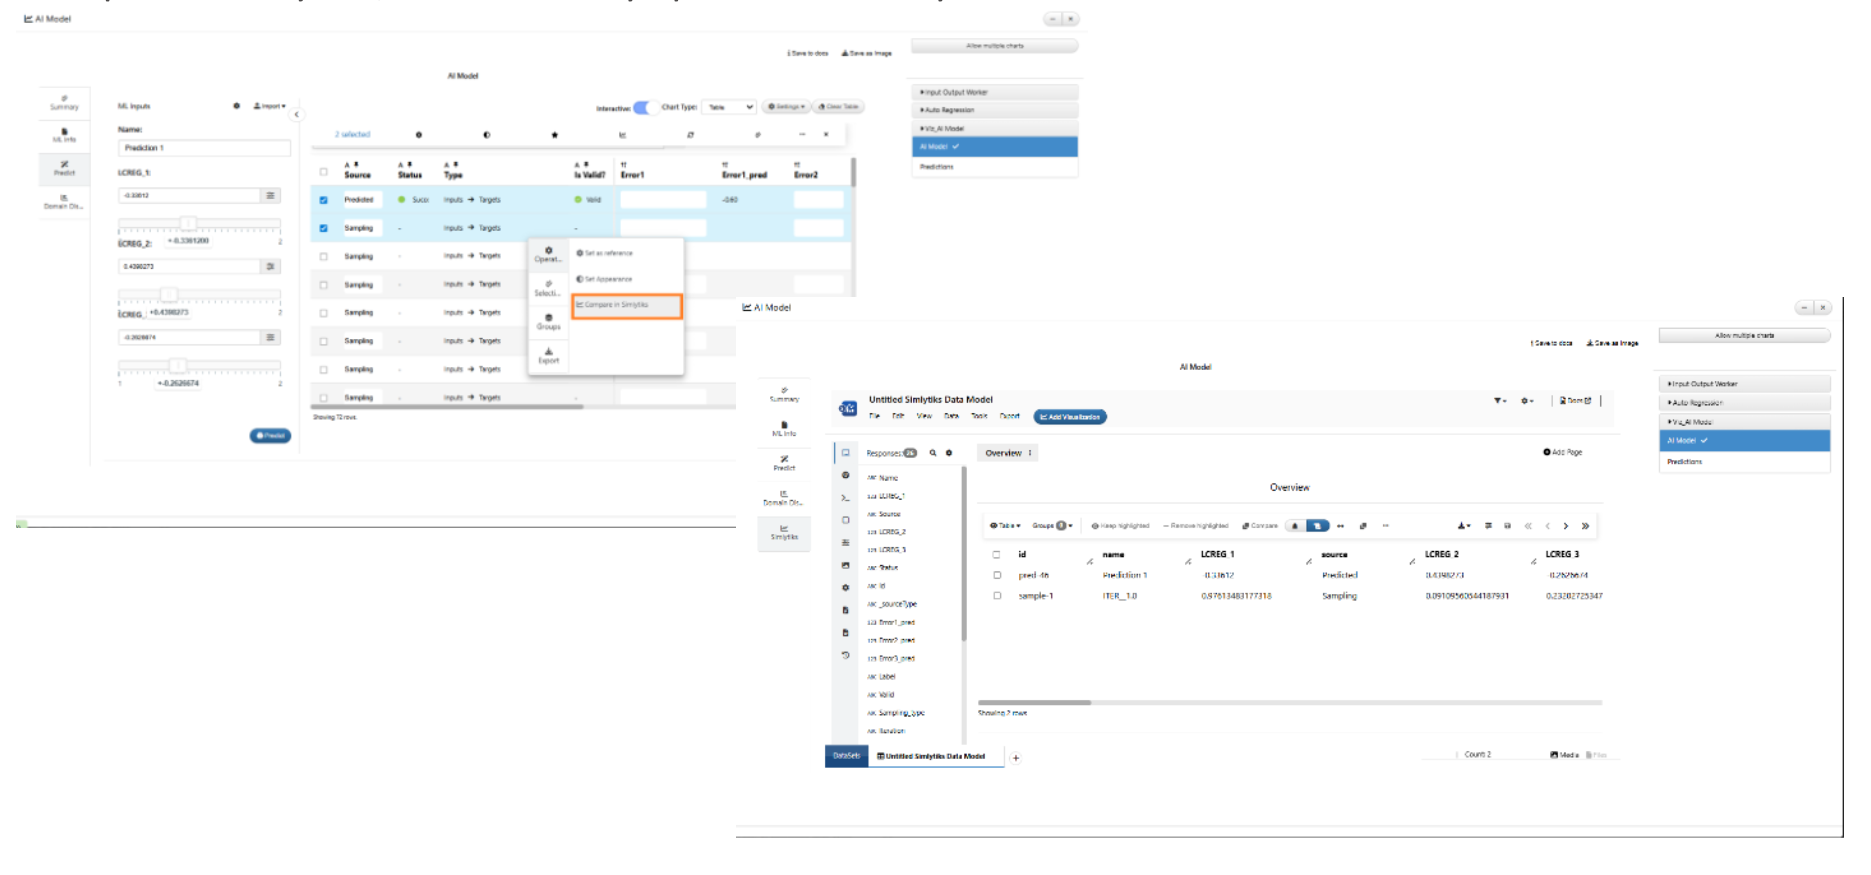
Compare in Simlytiks