36.  Frequently Asked Questions
36.1. Workflow Main
How do I access the Workflows Application?
Click on the application menu in the upper left hand corner. Then, choose the Workflows icon which by default will be the 3rd one down in the first column.
How do I filter through all my workflows?
Filter through workflow records using the options at the top of the Workflows main page. Choose to view owned and/or shared workflows and sort via new to old (or vice versa) or A to Z (or vice versa).
How do I create a new workflow?
On the Workflows main page, click on the blue button at the top right corner of the page that says “+ New Workflow”. A fresh new workflow canvas will then open.
36.2. Importing Data
How do I add inputs to the START worker?
Click on the START worker to configure it. Drag-and-drop inputs from the left onto the form-builder. Then, add data for each input manually, using sample data or uploading local files.
How do I Add Sample Data To Curve Workers?
Under a curve worker, we can add sample data by clicking on “Choose from sample” under the drop box for the curve input. Then, we’ll pick our x and y ranges for our curve in the excel viewer.
How do I Import A Workflow File?
From the workflow canvas, go under the File menu and click Open. Choose which file to upload from your local machine. If you are uploading a file while already having a workflow on the canvas, you will be prompted to replace or merge the new file with the existing workflow.
36.3. Building and Configuring
How do I Access the Worker Library and find necessary workers?
Click on the cog icon on the left side panel menu. From here, we can search for workers at the top or use the filters under the filter icon to the right of the search bar to find the correct worker we need.
How do I Add Workers?
Add a worker onto the canvas by dragging-and-dropping anywhere onto the workflow, using the add options or running the wizard.
How do I Configure A Worker?
Click on a worker to configure it in a separate modal window. For each input, choose how to get data, either by inputing local data, using data from previous worker or getting it from the workers list.
How do I Set Up A Decision Worker?
Add a decision worker or hub from the Shapes menu in the left side panel options. Click on the worker to start configuring it. From here, we’ll make sure to choose the max amount of iterations in the input tab. Then, we’ll click over to the validations tab to tell the decision worker how to continue the worker execution. Then, we’ll add rows to populate our validations.
How do I Set Up The Report Generator?
Under the shapes menu, click and drag the PPT Report onto the workflow right before the end worker. Then, click on the worker to configure it. Here, we’ll configure our report manually by clicking on this button under Template Layout. This gives us a preview of our Simlytiks Report layout. We can drag-and-drop inputs or outputs onto page sections to create our desired layout. Here, we’ve added all the outputs to their own page section as shown with Curve Digitizer. Finish by clicking Apply and saving the worker.
How do I Unlink A Worker from a workflow?
Right-click on the worker you want to unlink. Then, choose this option under the right-click menu.
How do I Link Workers in a workflow?
Hover over a worker to view the connections points. Click on a connection point of the first worker. You’ll notice a line appear connected to your mouse. Finish the connection by clicking on a connection point of the second work.
How do I Clone A Worker?
Right-click on the worker you want to clone. Then, choose this option under the right-click menu.
How do I Configure the END Worker?
Click on the END worker to configure it. Sift through workflow outputs on the right side panel by expanding workers. Click the add button for any outputs you would like to have visualized in the END worker. Finish by clicking Save.
36.4. Saving and Sharing
How do I Save A Workflow?
Choose which way you want to save under the File Menu. If it’s a new workflow, you’ll be prompted to give it a name and description.
How do I Save Part of a Workflow as a New Workflow?
Click on the Select Multiple button at the bottom right corner. Drag to select the part of the workflow you would like to saved as a new workflow. Then, right-click on the workers, and choose the Save As New Workflow option under this menu. Give it a name and description in the prompt window before hitting Save.
How do I Export A Workflow?
Click the Export button at the top right and choose between a JSON file or a fully packaged ZIP file which includes all input files.
36.5. Executing
How do I Run A Workflow?
To execute your workflow, open it in run mode. Then, hit ‘Run’ on the top right. Make sure the Workflow is performing from START to END and click ‘Run’ again. Upon successful execution, the status will be at 100% with the message ‘Executed END successfully’.
How do I Test the Execution of a Worker?
In edit mode, click on a worker to bring up the configuration modal. Then, click on the Test Execution button at the bottom right of the modal window. View the output on the right hand output panel.
How do I Execute a Worker in Run Mode?
While in run mode, you may want to only execute on worker. We can do this by right-clicking on the desired worker and choosing the Execute option. There are also a few other execute options under this menu which include executing with child nodes (workers that follow) and starting the execution from the worker.
36.6. Viewing Data
How do I View Results?
Under the eye icon in the left-side menu, we can view all data inputed and extracted from our execution.
How Do I View Curves?
Under the eye icon in the left-side menu, we can view all curves which includes all input and output curves.
How do I View The Generated Report?
Open the Report Generator Worker. Click on “View Report” (1) to see an overview of the report via the PowerPoint Builder that can be downloaded as a PPT or PDF. Or, click on “View Simlytiks” (2) to study and interact with the report via the Simlytiks Application.
36.7. Iteration
How Do I Set Up Iterator?
Click on the worker that will be iterated to get started. We’ll turn on the iterator by clicking the switch at the top right corner of the window. From here, we can add iterations by clicking on the blue button. Then, we’ll add other desired inputs for the iterations in the second column.
36.8. Parallelization
How do I Parallelize A Workflow?
Click on the Select Multiple option at the bottom right corner. Then, we’ll drag-select the part of the workflow that we want to clone. Finally, we’ll right-click and choose the “Clone” option. Finish by connected the cloned parts to the start and end workers.
36.9. Curve Digitization
How do I Digitize A Curve
Step 1: Upload image in curve input field. Step 2: Click on X min (1), pick the X min point on the curve (2) and enter the X min value (3). Step 3: Workflows will auto switch through X max, Y min and Y max. Select points for each to assign values. Step 4: Hit automatic selection or manual to select more points. Step 5: Click on Extract Data (1) and Save (2).
36.10. How do I Import I/O Json
We can now import workers’ I/O as JSON to workflow and new table view is shown for summary of workers, all possible replacements and enable/disable applying of the new value individually.
Download Inputs JSON in worker modal will now export the JSON in the same format as global Export -> Workers I/O JSON which can then be imported in other workflows ( with similar workers) using File -> Import I/O from JSON.
Progress window with percentage and message is now available when Download Inputs JSON or Outputs JSON is clicked within the worker modal
as Workflow zip
In Workflows, the File -> Import I/O now supports uploading a workflow ZIP to the canvas.
36.12. Text Parameterize worker
The below video shows how to create parameters in Text parameterize worker.
36.13. Join Datasets
How to join two datasets together?
1/ When we have two datasets and we want to join them together, we can use Dataset_Join worker.
2/ Worker inputs
a/ Datasets
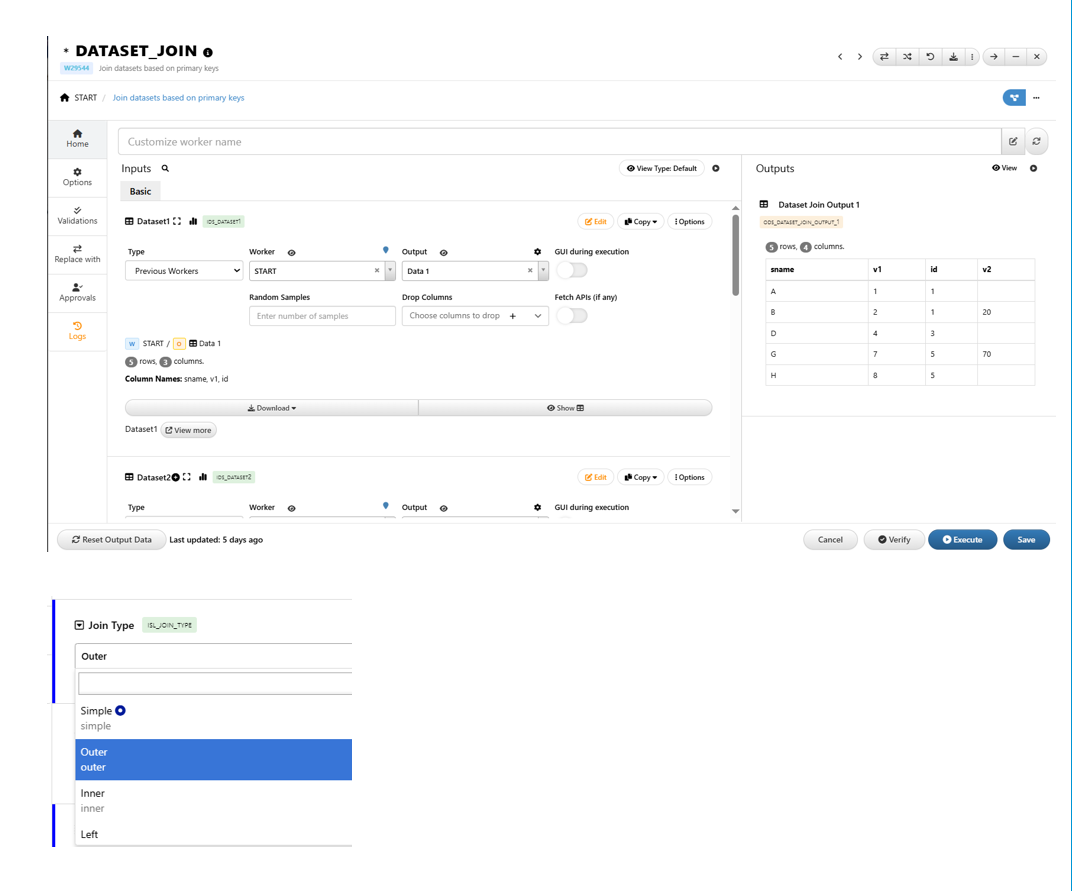
Two datasets to be joinedb/ Join Type
Join Type controls how the rows from each dataset associate with each other.
1/ Simple : row 1 from dataset 1 is associated from row 1 from dataset 22/ Inner/Left/Outer : We associate rows from dataset 1 to rows from dataset 2 using specified primary key
Inner : primary keys must exist in both datasets
Left : Using one dataset as reference and match the other dataset rows to the first dataset
Outer : use primary keys from both datasets to form the new datasets
c/ Primary key
Column with unique values (within each dataset). The primary key will be used to associate rows from two input datasets to be joined.
36.14. Multiple Curves
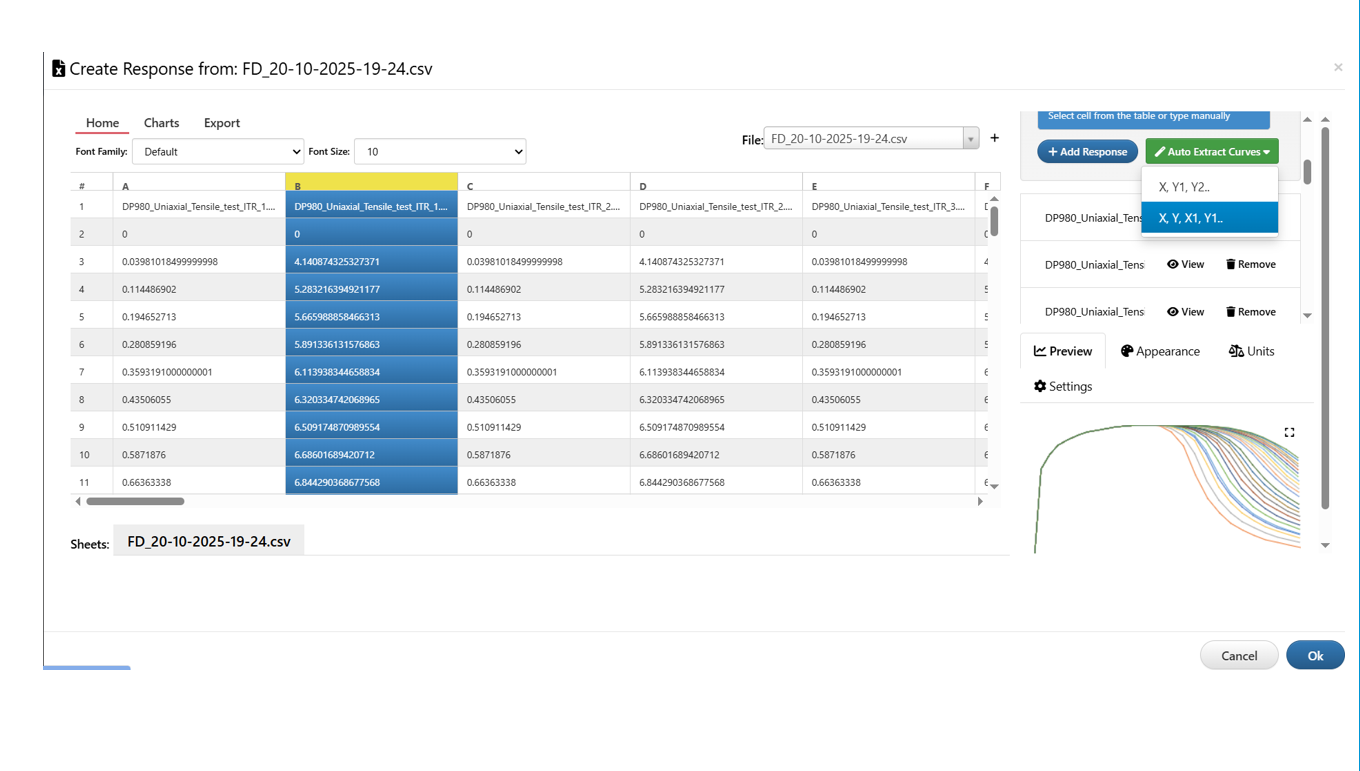
How to update multiple curves to START worker.
1/ Arrange the X and Y values of each curve in the following format
Format 1 : X, Y1, Y2, Y3, …
Format 2 : X1, Y1, X2, Y2, X3, Y3, …
2/ When we upload the curve to the START worker
Select the X and Y columns for the first curve as usual
There will be an option to choose the curves format
Selecting the corresponding format automatically uploads all curves
36.15. Add Curves to Dataset column
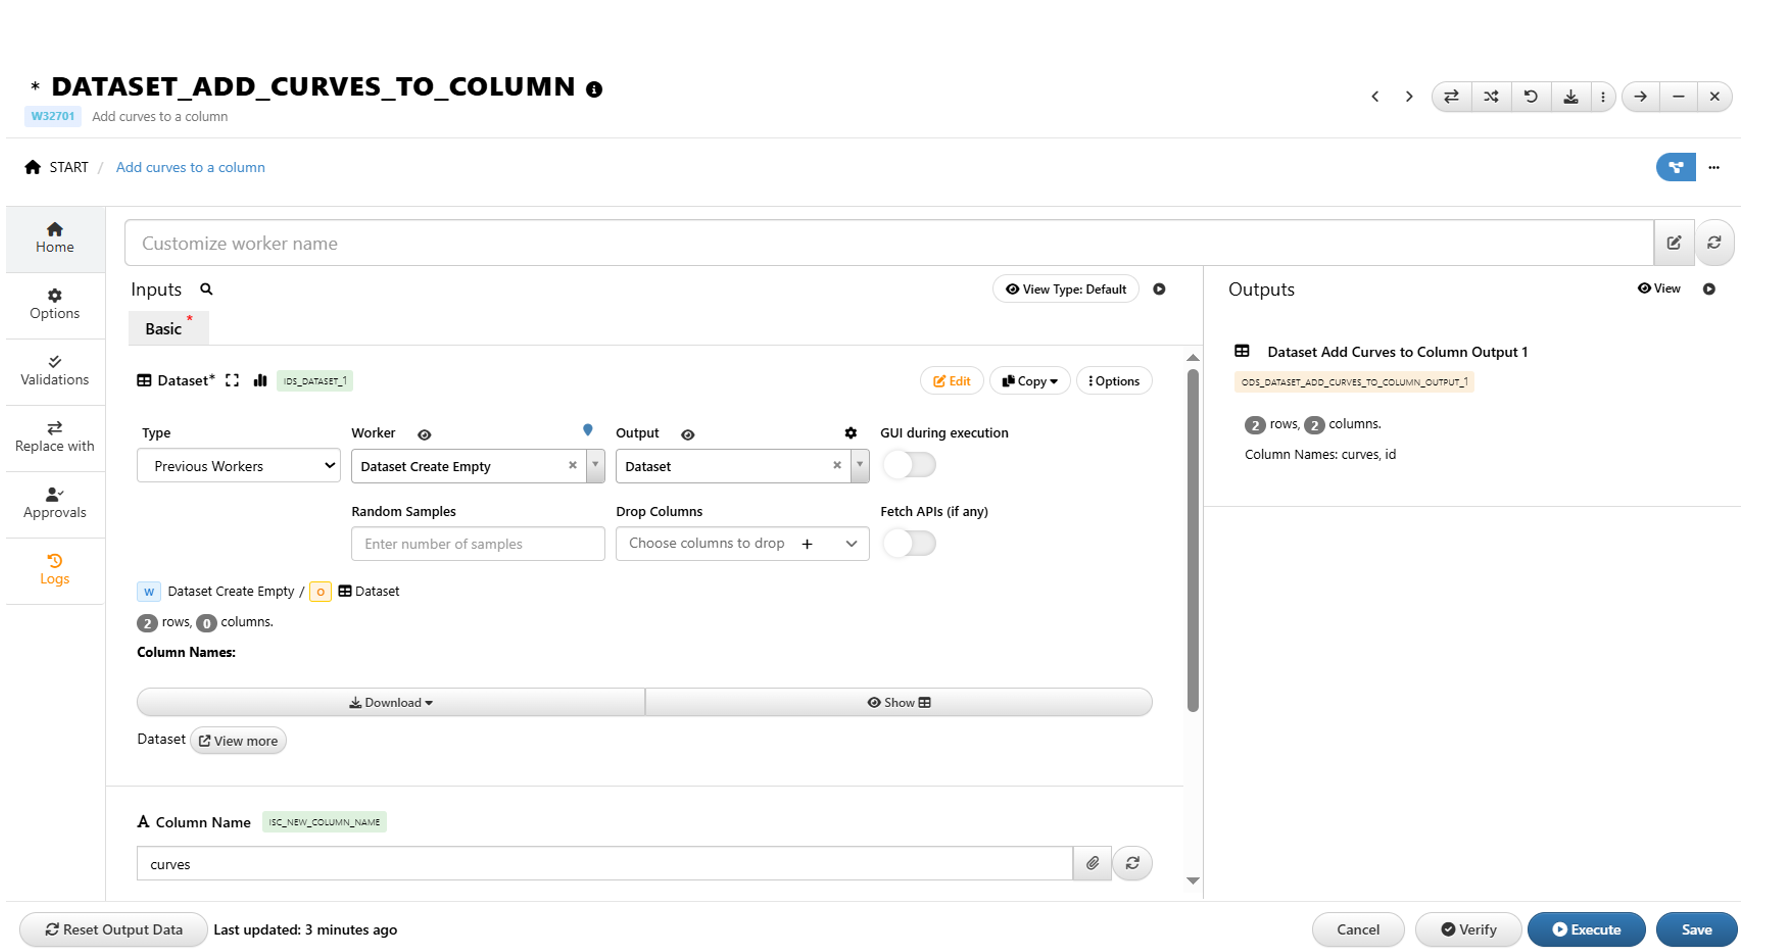
How to Add Curves to a Dataset as a Column.
1/ Use Dataset_Add_Curves_to_Column worker
2/ Worker inputs
- Dataset : Dataset where we want to add the curves
- Column Name : new column name
- Curves : Curves to be added
NOTE
Number of curves must match number of rows in the dataset
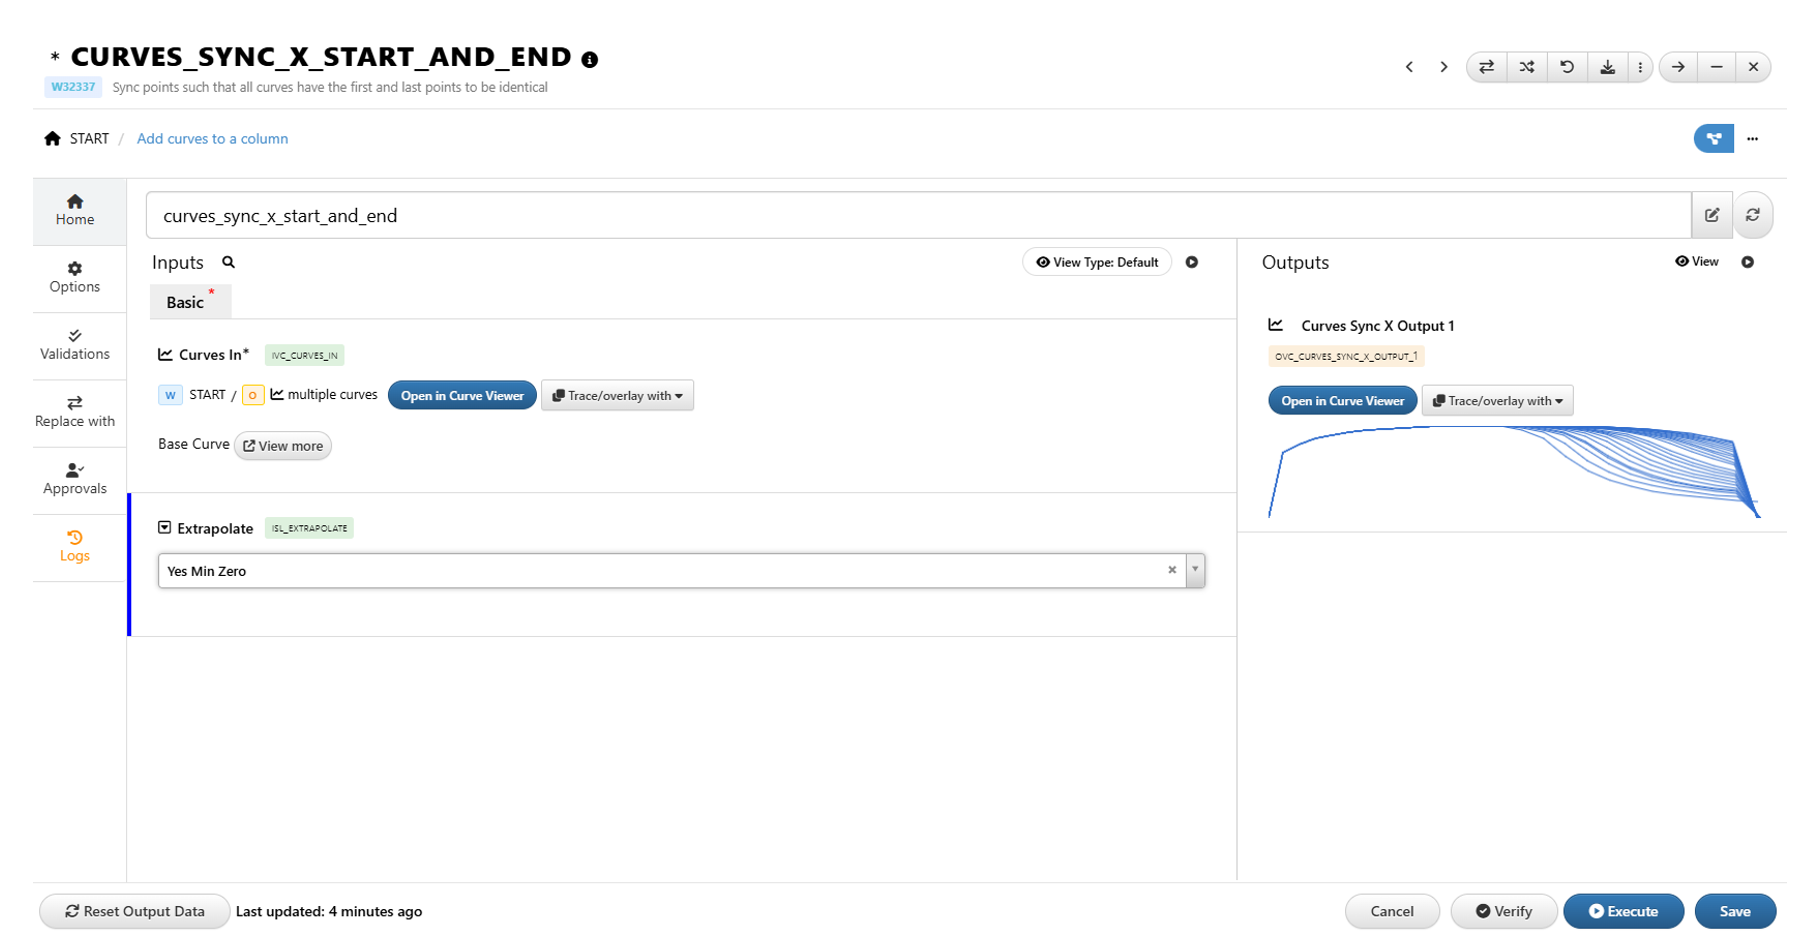
36.16. Sync Multiple Curves so they have the same min/max X values
How to Sync Multiple Curves so they have the same min/max X values
1/ Use curves_sync_x_start_and_end worker.
2/ Worker inputs
a/ Curves in
Curves to be syncedb/ Extrapolate
Extrapolation options to extrapolate shorter curves so they have the same min and max value as the longer curve
Options
- Yes : linear extrapolation
- Zero : add zero padding
- Yes Min Zero : linear extrapolation. Extrapolation stops when the extrapolated curve reaches zero. Zeros will be added after that.
- Yes First and Last Value : use first value to pad towards xmin; use last value on the curve to pad towards xmax.
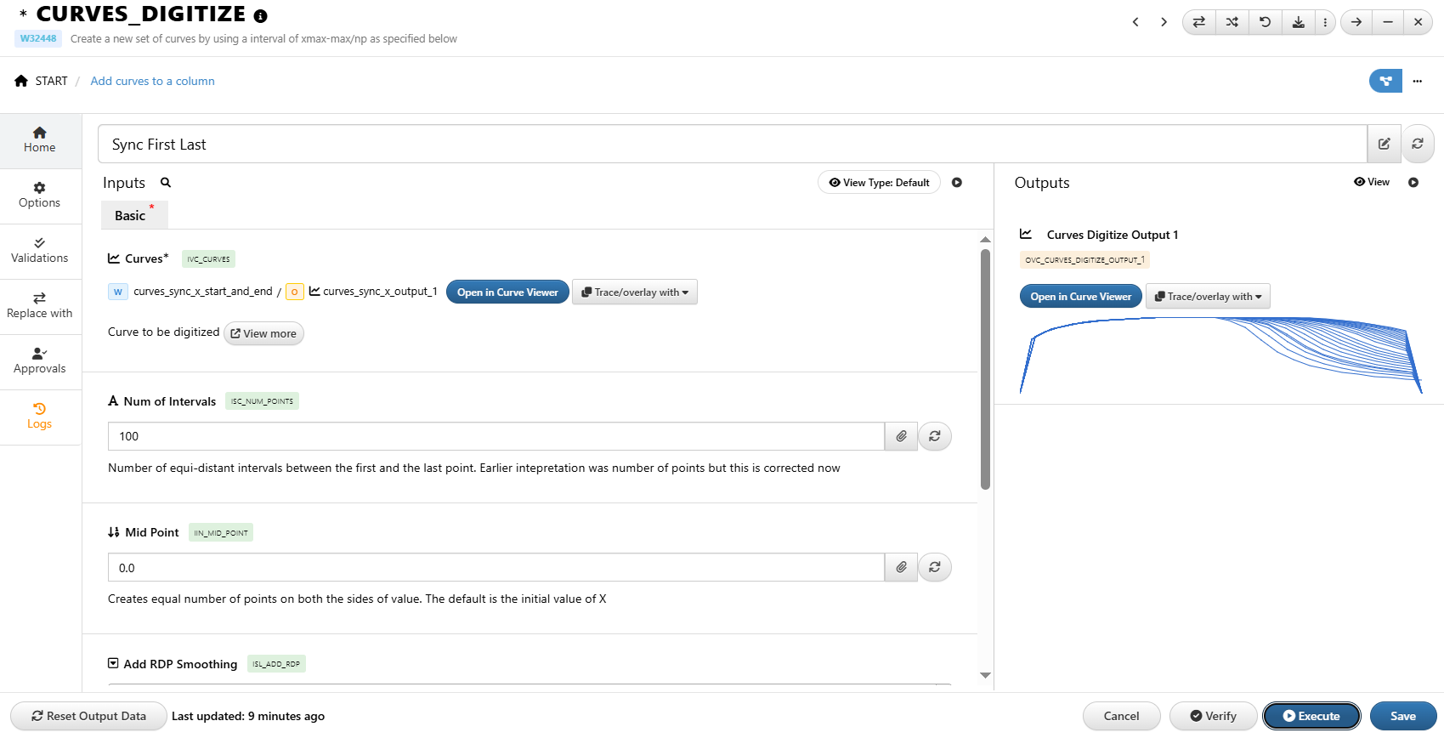
36.17. How do we make all curves have the same number of points?
1/ Use Curves_Digitize worker
2/ Required inputs
a/ Curves to be digitized
b/ Number of intervals : number of points
c/ Sync First Last : sync the curves before digitization
3/ Output will have specified number of points on each curve
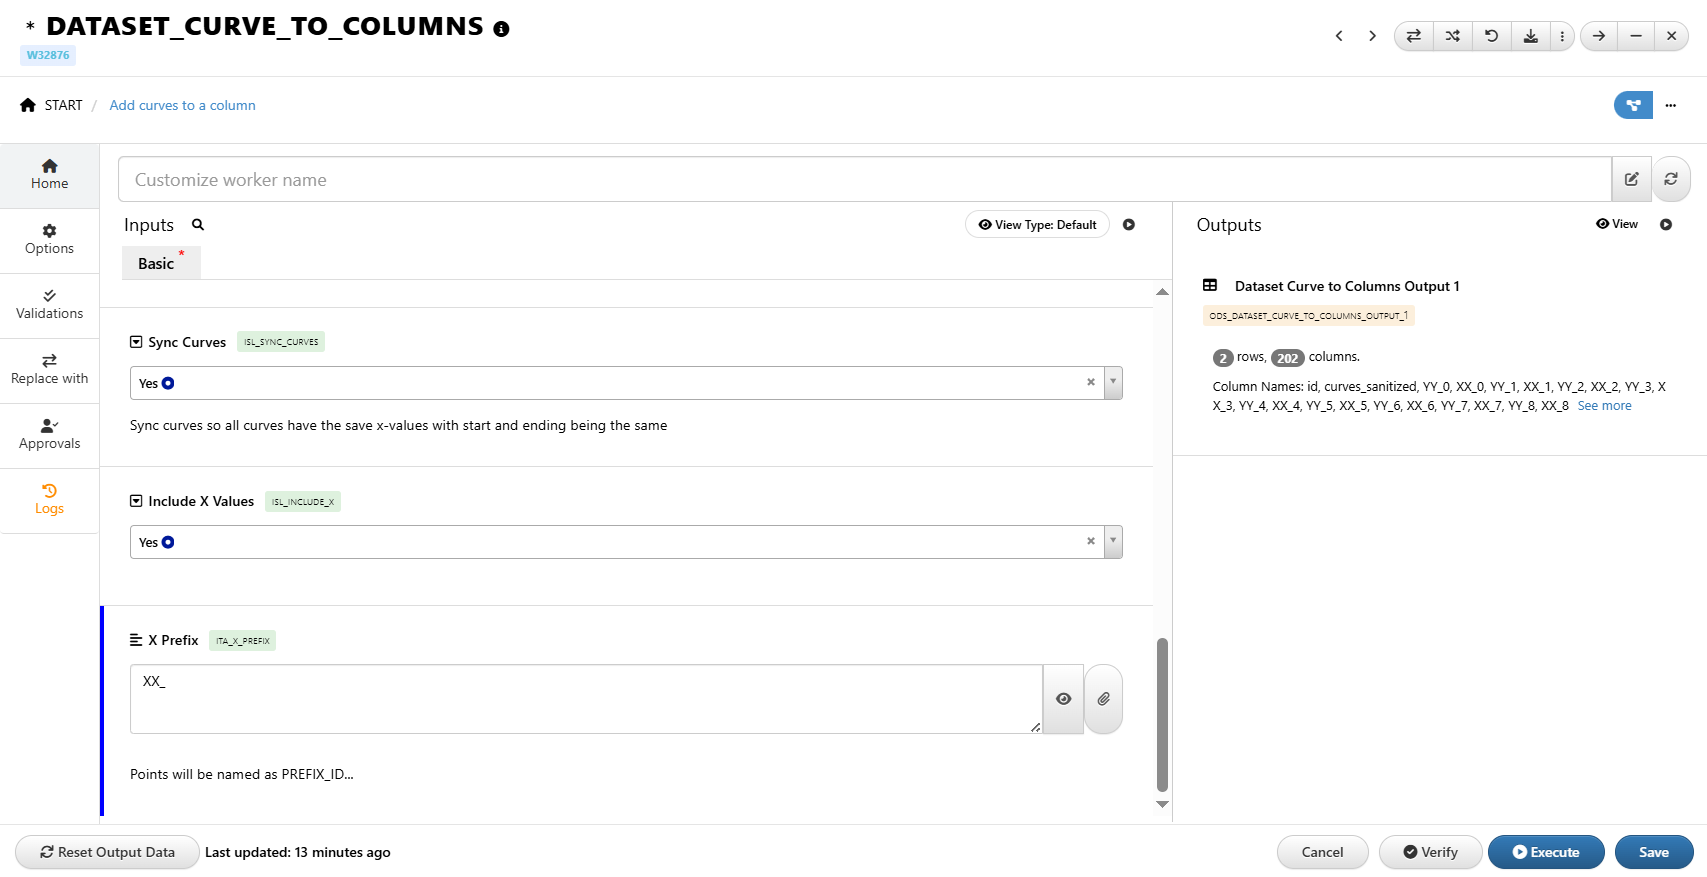
36.18. How to convert curve column to point columns in a dataset?
1/ Curve column : one single column with a single curve as value for each row
2/ Point column : each column stores the X and Y values from the curves. There are usually multiple columns in the format of : X1, Y1, X2, Y2, X3, Y3,….
3/ Use Dataset_Curve_to_Columns worker
4/ Worker inputs
a/ Dataset with curve column
b/ Curve column name
c/ Number of points
Curves will be digitized using this number before converting to point columns.d/ Prefix (for Y values)
e/ Include X values
By default, only Y values are included. If we want to include X values, we can check this optionf/ X Prefix
36.19. How to train ML models to predict curves
First we need to convert the curves columns to Point Columns. Then, we can use selected Input Columns (from input dataset) to predict the Y and/or X columns.

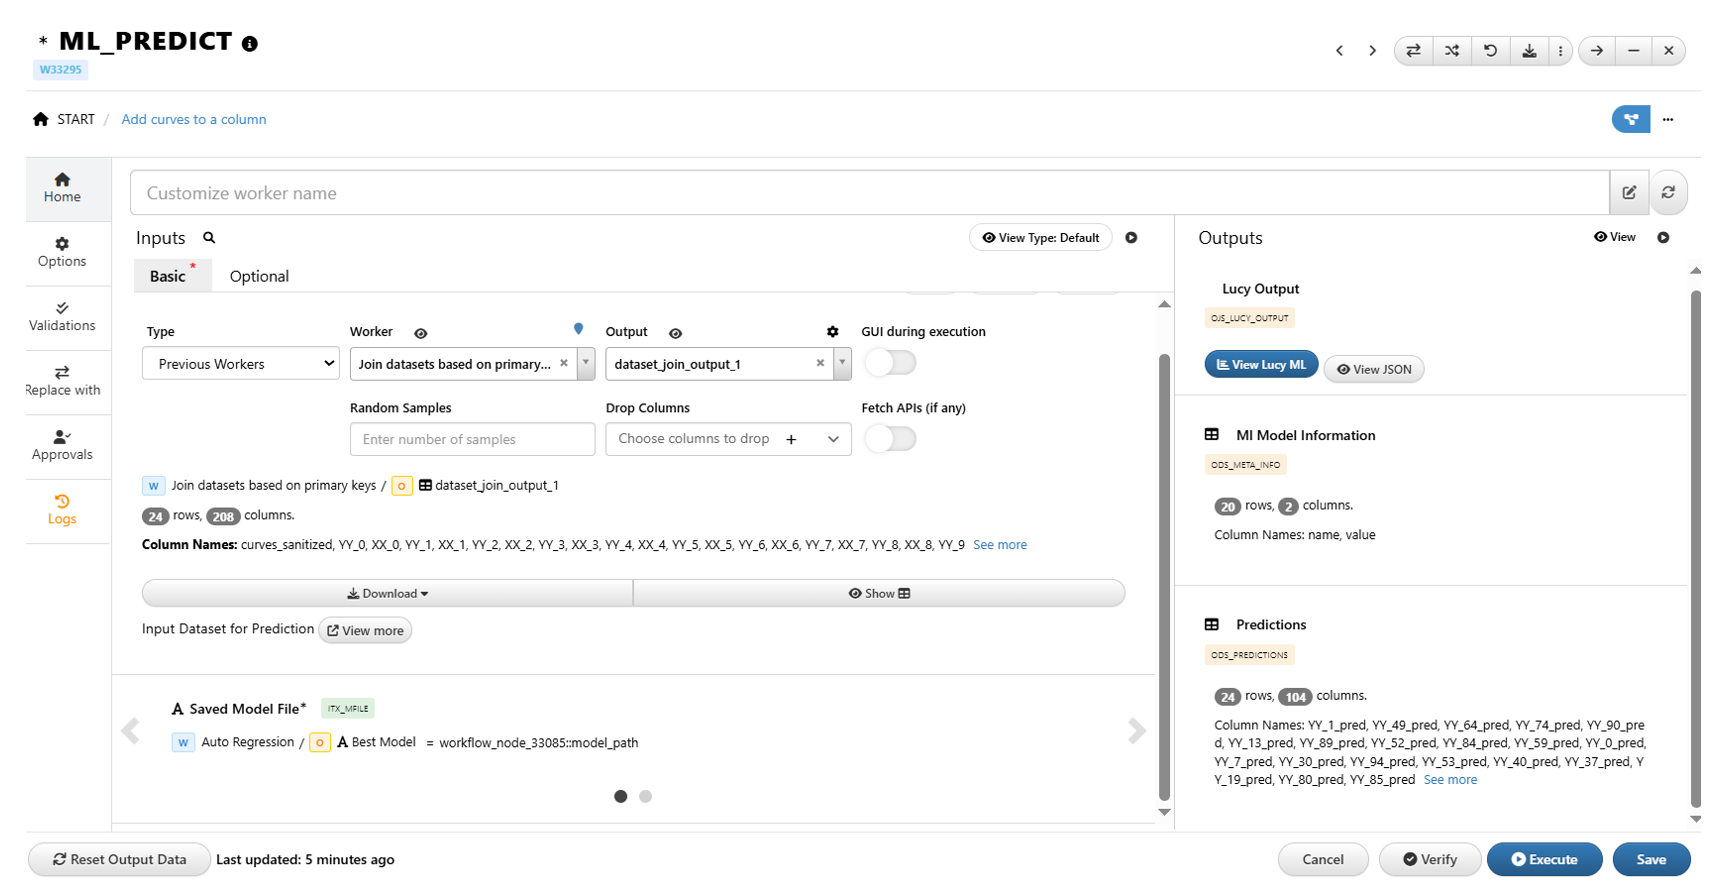
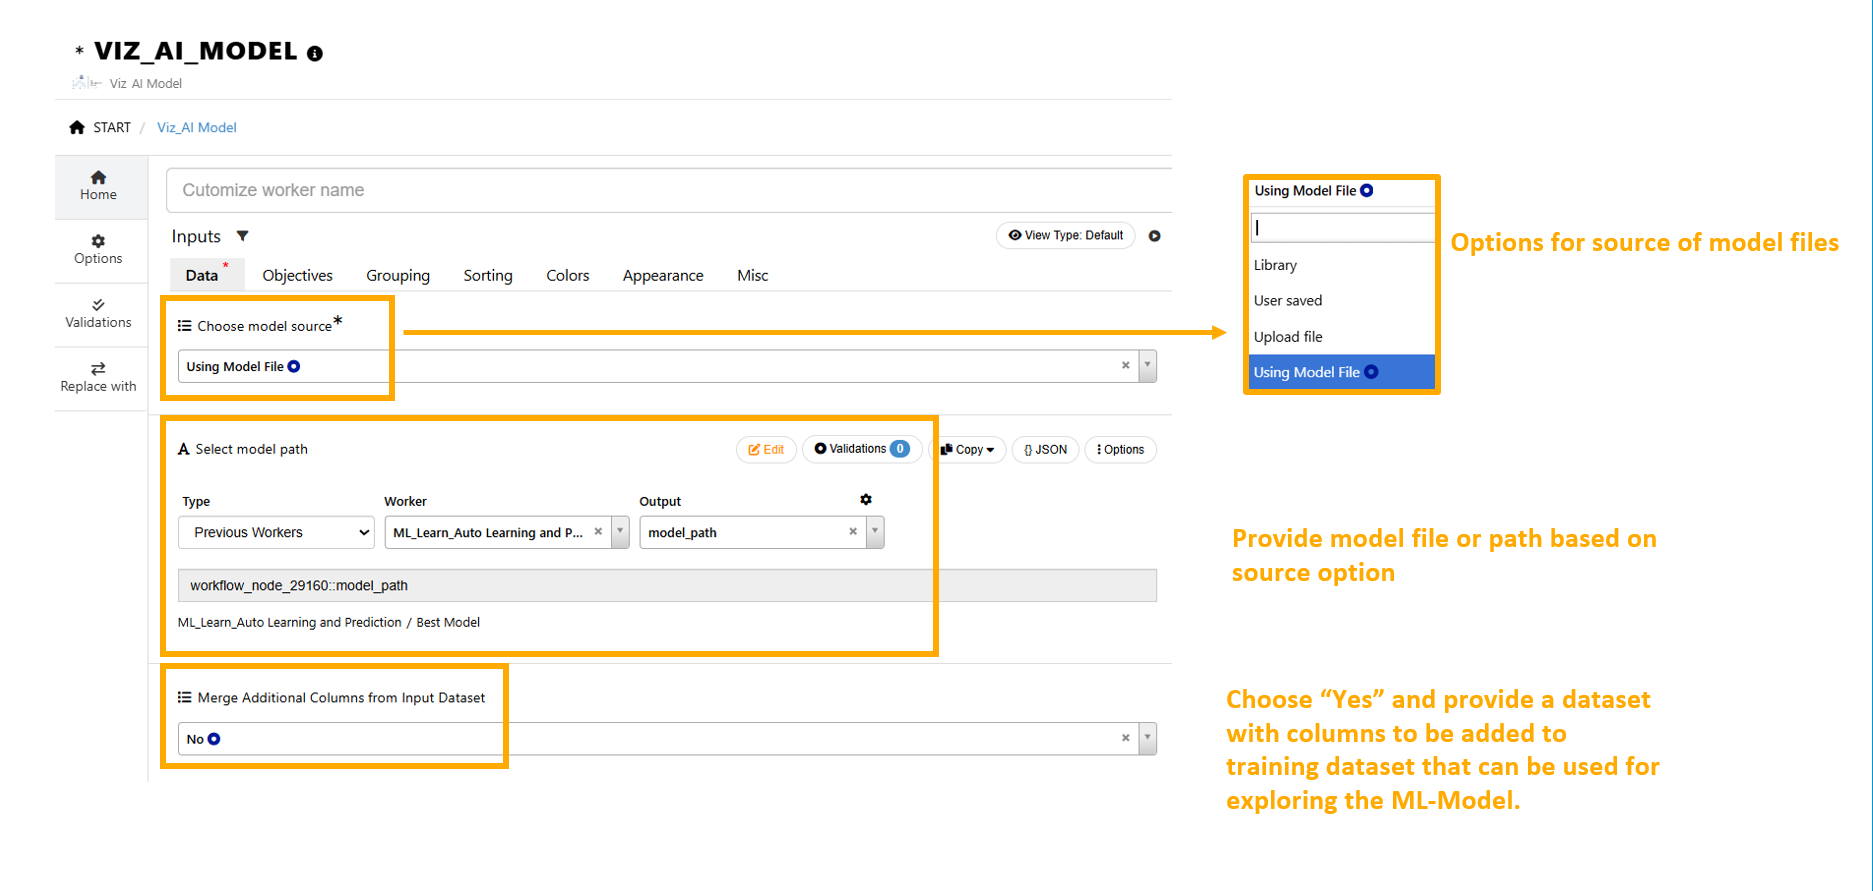
36.20. How to predict new curves given input values?
1/ Use ML_Predict worker
2/ This worker takes a dataset with input columns and the model path as inputs, returns predicted values in the output.
a/ Dataset must include the same input columns used for training the ML models.
b/ Model path can be found from ML_Learn_Auto worker output
c/ Predicted values from output dataset have a post fix “_pred” to indicate they are predicted values
d/ Output dataset do not include input columns. In order to add the input columns, we can use Dataset_Join worker to join the output dataset with predictions and dataset used for prediction with input columns.
36.21. How to save trained ML models?
1/ Use Mathmodel_Save worker
2/ This worker requires a name to save the model as and the model path from ML_Learn_Auto worker.
3/ Output returns a link that leads us to the saved mathmodel.

36.22. How to view predicted curves?
1/ Get a dataset with X values (if X values are not included as targets in the ML model)
Use Dataset_Keep_Columns worker to keep only the X columns from the training dataset
2/ Use Dataset_Join worker to join the X values and predicted Y values
One input dataset should include X values; the other dataset includes predicted Y values.
3/ Use Dataset_Columns_to_Curve worker to reconstruct the curves
Worker inputs
- Dataset containing X and predicted Y values
- New Column Name
- Prefix for X and Y columns
In the output, we will see an additional column with predicted curves

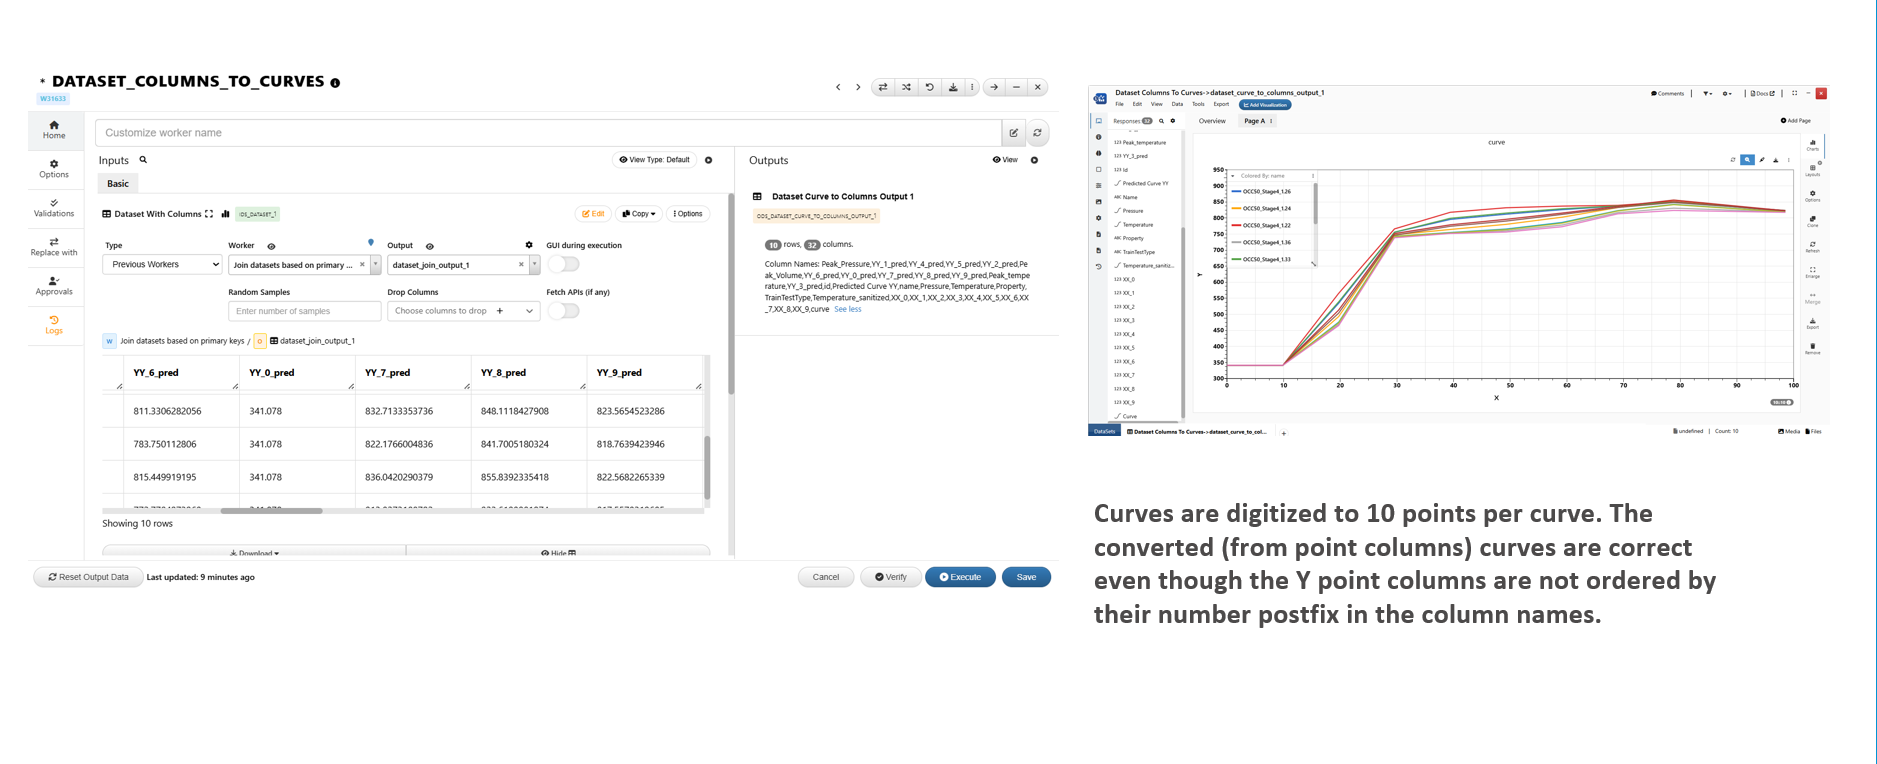
36.23. Does order of point columns matter in worker Dataset_Columns_to_Curve worker?
1/ No. As long as the following conditions are met
Both X point columns and Y point columns have the same number of points
X point columns XPREFIX_# associates with Y point columns YPREFIX_#. That is, XX_5 and YY_5 must be the X and Y value of the SAME point on the curve (in this case, the 6th point of the curve with index starting from 0)
2/ ML_Predict prediction dataset does not order the Y point columns by the number postfix. But the output curves from the new curve column are converted correctly
36.24. Which CV option to use in ML_Learn_Auto worker?
1/ When we have multiple models to compare, we use Cross Validation ( options can be found in “Selection of Validation” input) to select the best model.
2/ K-Folds CV is the most commonly used cross validation option. There are a few factors to keep in mind
a/ Number of training sample points
- The more dataset points we have, the more information we can use for training a more accurate model (low bias).
b/ Number of testing sample points
- If we include too many testing points, we have fewer training points causing less accurate model
- If we include too few testing points, the model will vary significantly among each fold (high variance).
c/ Execution time
*Training model takes time. If we include too many folds, the model training process will take long
3/ Typically,
a/ when we have enough number of sample points, choose
- 5 folds or 10 folds
b/ When we only have a few points, choose
- LOOCV
4/ For more information on how cross validation works, please check this article on d3VIEW blog.
5/ When we are training a model with hyper parameters, we want to select the “optimal” values for these hyper parameters. We can do this by choosing “Grid Search” option in “Hyper parameter tuning” input. This will use CV option from “Grid Search CV Value” input to compare different hyper parameter values and use the one with the best score.
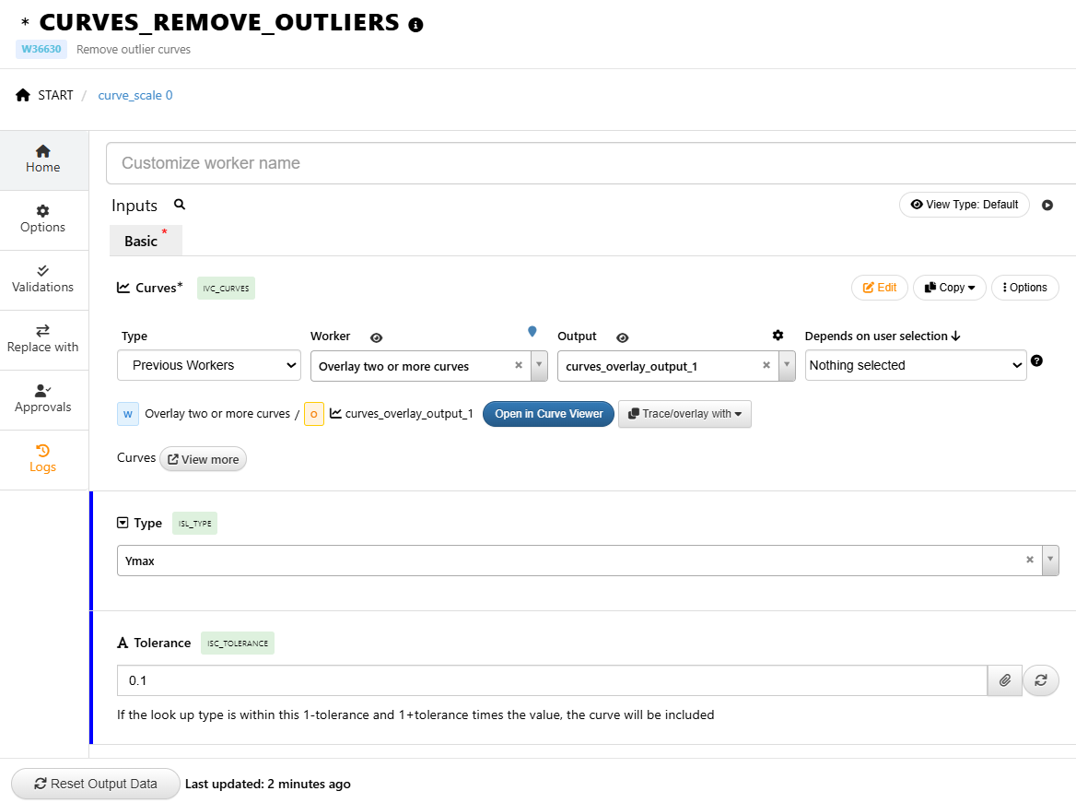
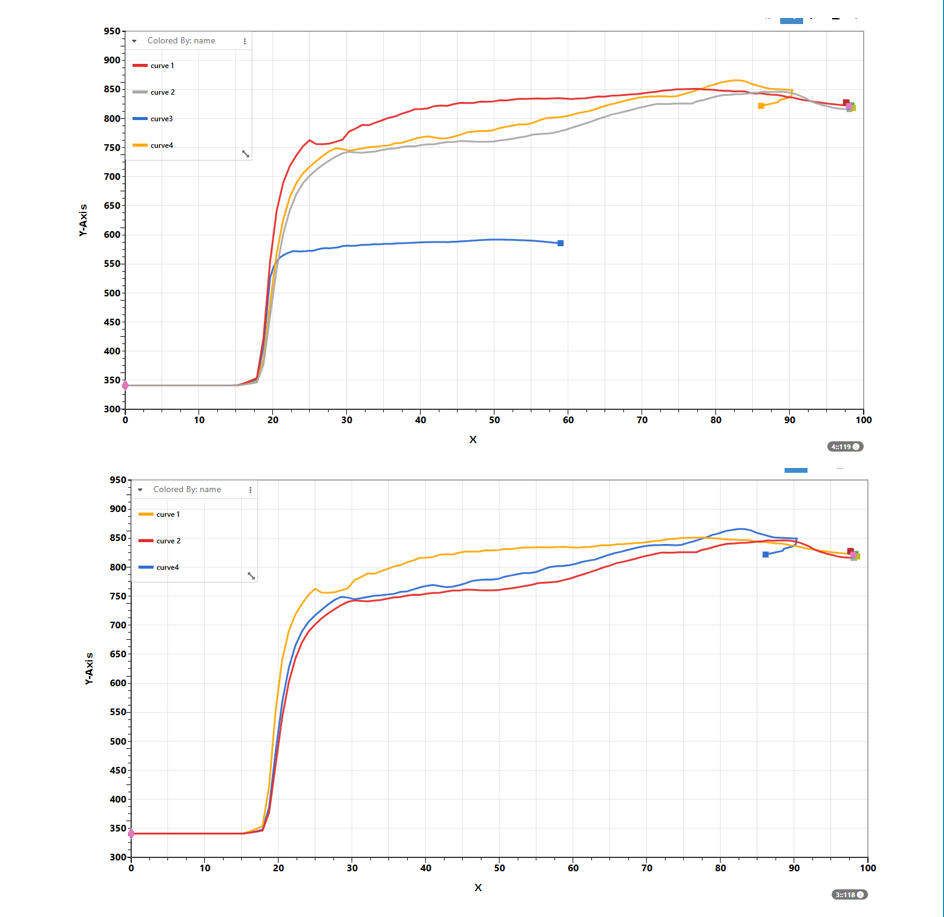
36.25. How to remove a curve that has significantly lower max values?
1/ Use worker curves_remove_outliers
2/ Set Type = “ymax”
3/ Adjust “Tolerance” as necessary
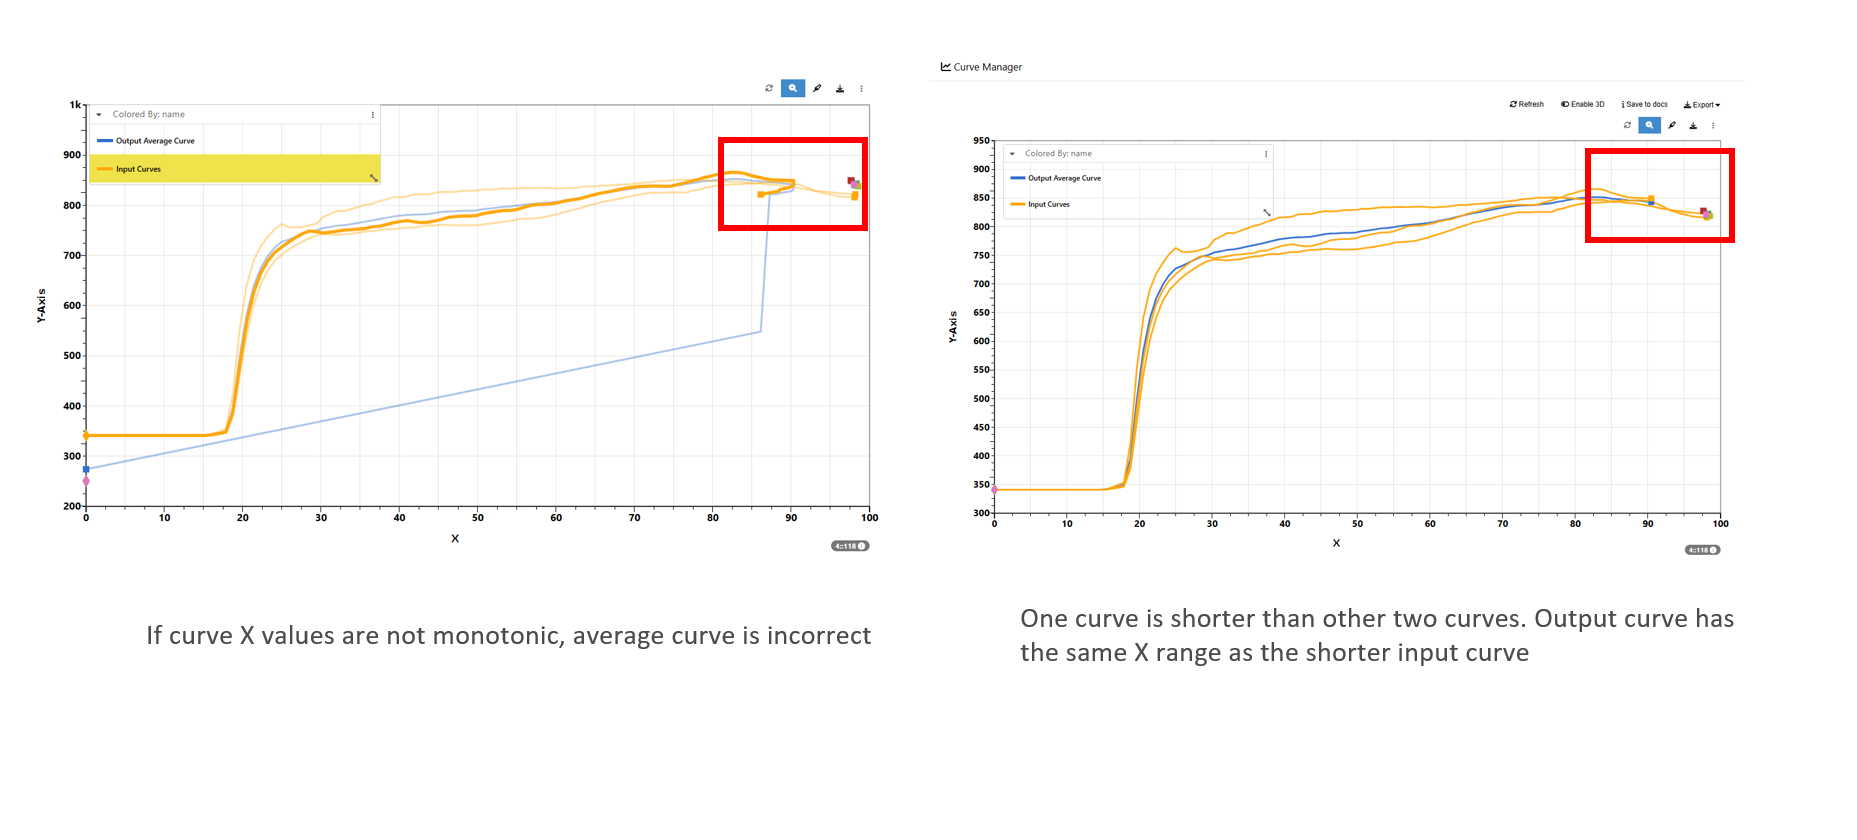
36.26. How to average multiple curves?
1/ Use worker curves_average_all or curves_average
NOTE
1/ Curve X values must be monotonic. If there is zig-zag pattern, we will get incorrect output. Use curves_monotonic worker to make the curves monotonic
2/ If input curves have different length (X range), curves will be average on the range of the shorted input curve.
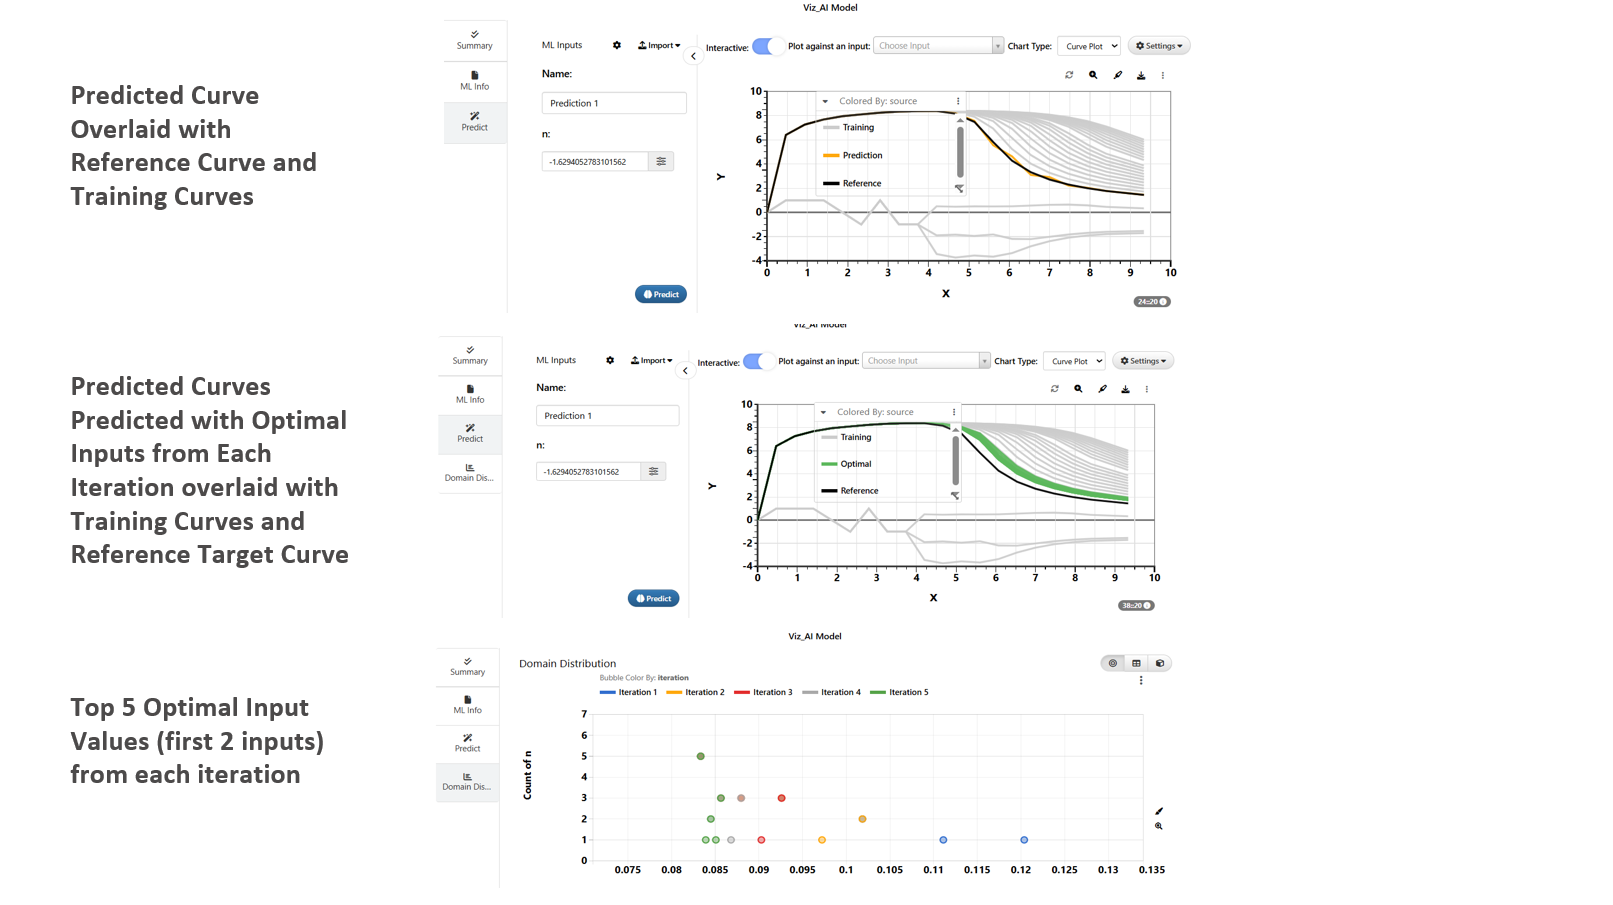
36.27. Interactive Visualization of Predictions
Explore ML-Models and Predictions Using Viz_AI_Model
1/ Viz_AI_Model is a worker that allows user to interactively explore the ML-Model
a/ Prediction
b/ View Predicted Curves
c/ Optimization
Add Viz_AI_Model viewer to the workflow

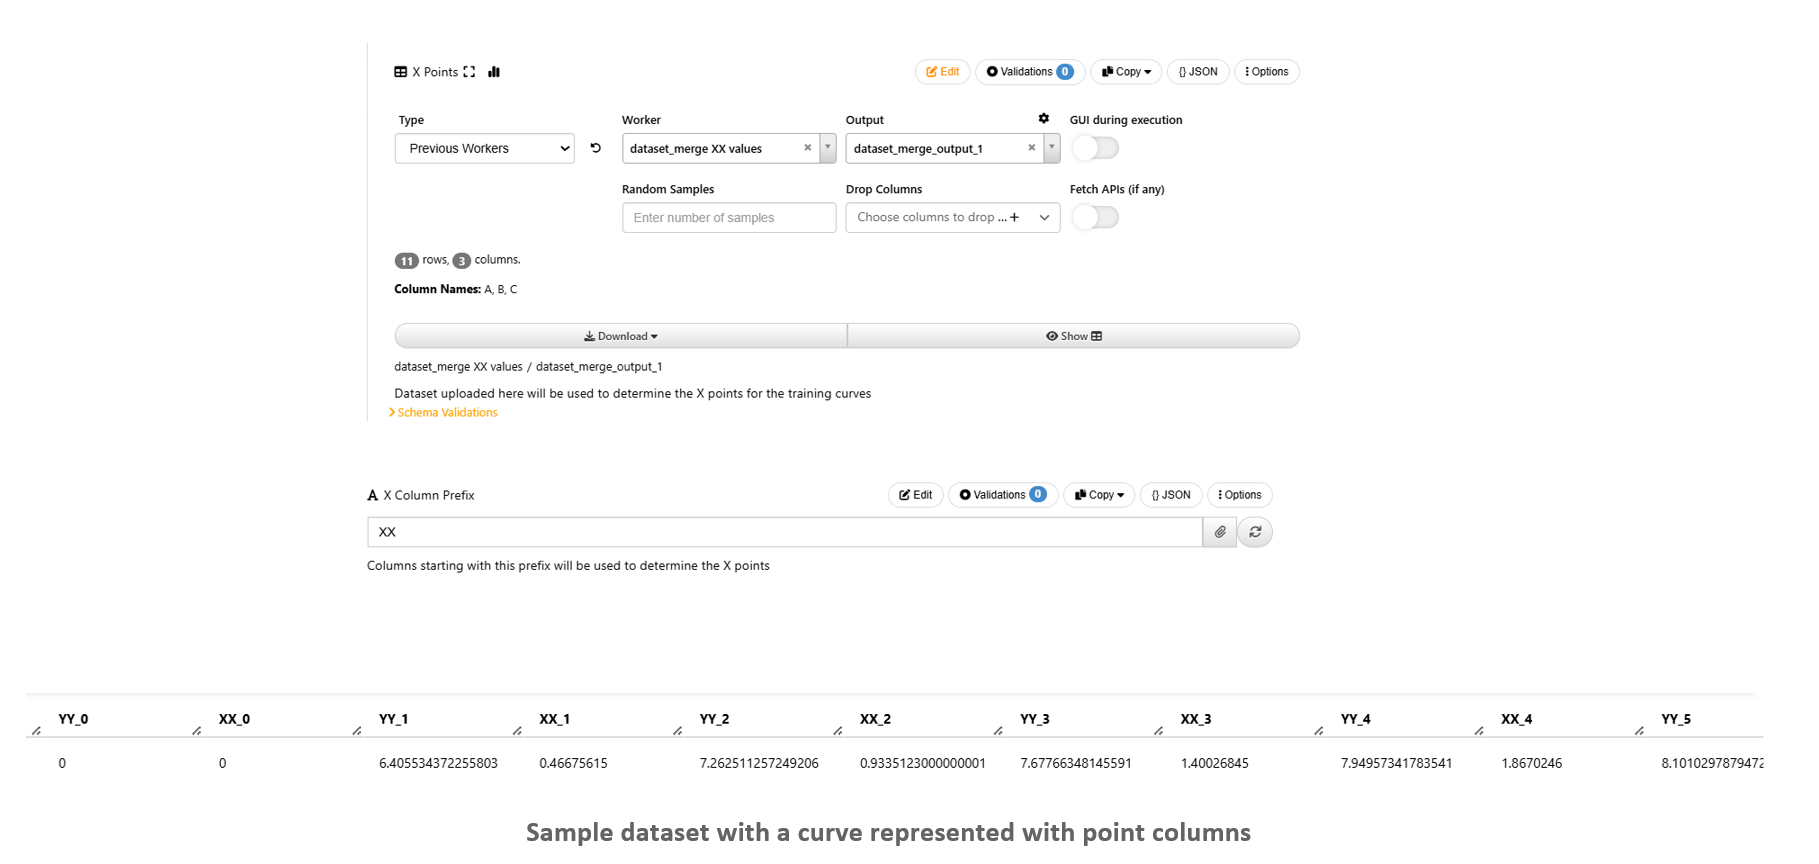
Configure Inputs and Settings : Curves (Generic)
1/ When a curve is decomposed to point columns, we will see XX_# and YY_# columns storing the X and Y values at each point of the curve.
2/ In order for restore the curves, we will need to know the X values for each point.
3/ “X Points” is a dataset with XX_0, XX_1, … columns and “X Column Prefix” helps to identify the X point columns from provided dataset.
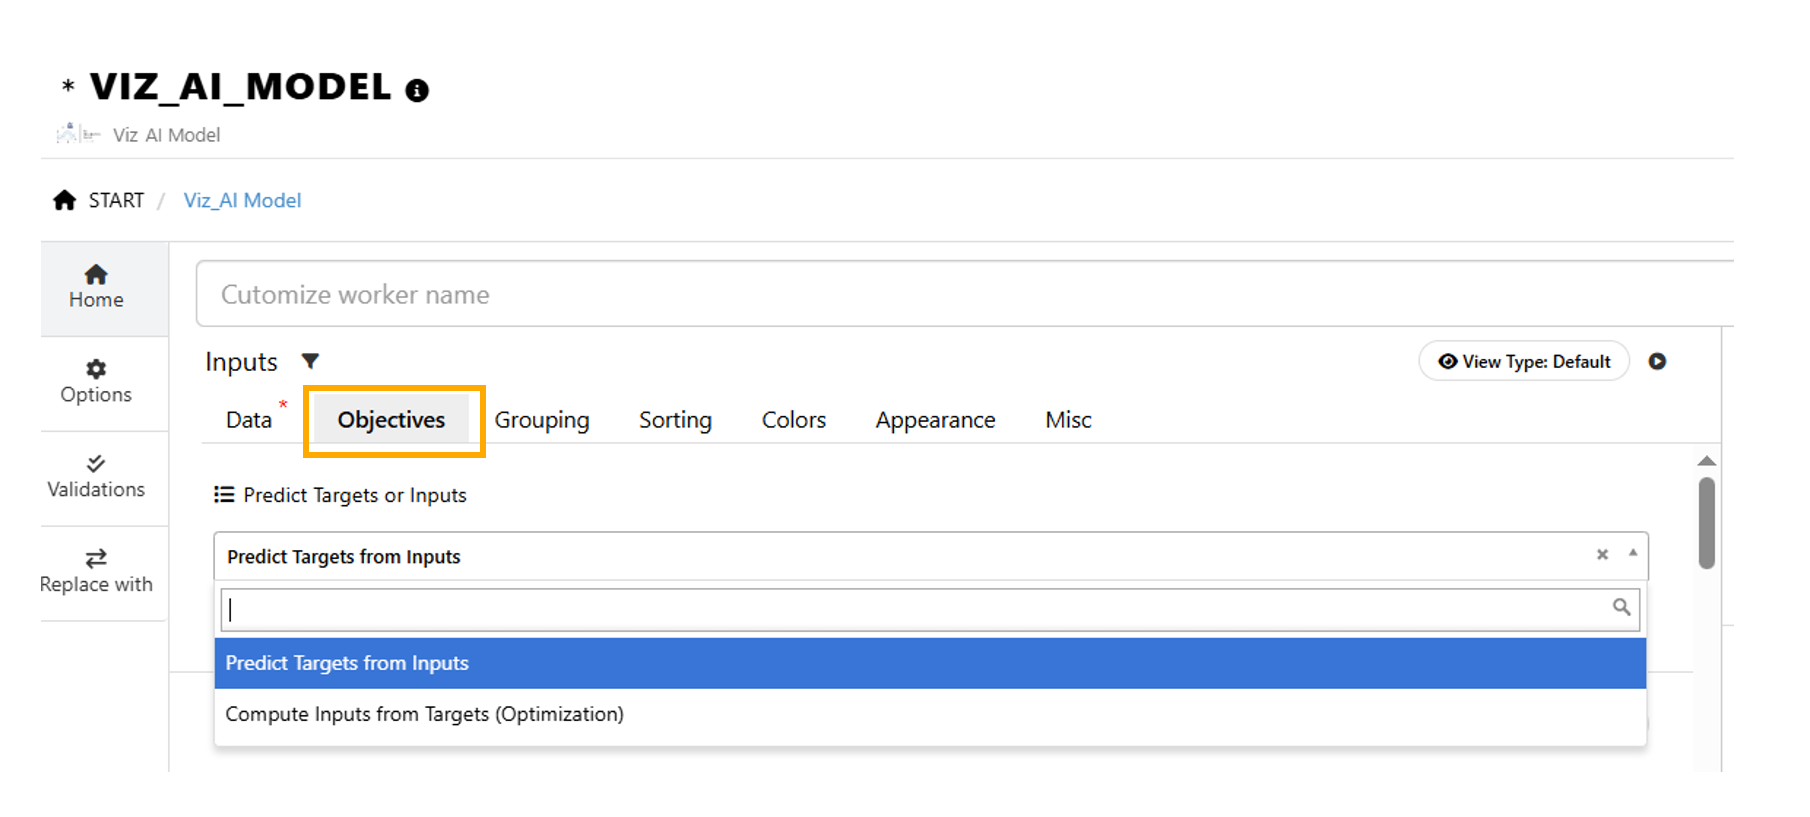
Objective : Prediction and Optimization
1/ There are two options for what we can do with this worker
Prediction : Predict Targets from Inputs
Optimization : Compute Inputs from Targets
2/ Prediction answers the question “what will the output looks like when we provide these inputs”.
3/ Optimization answers the question “What are the input values that gives us the output that is closest to this particular output value available”
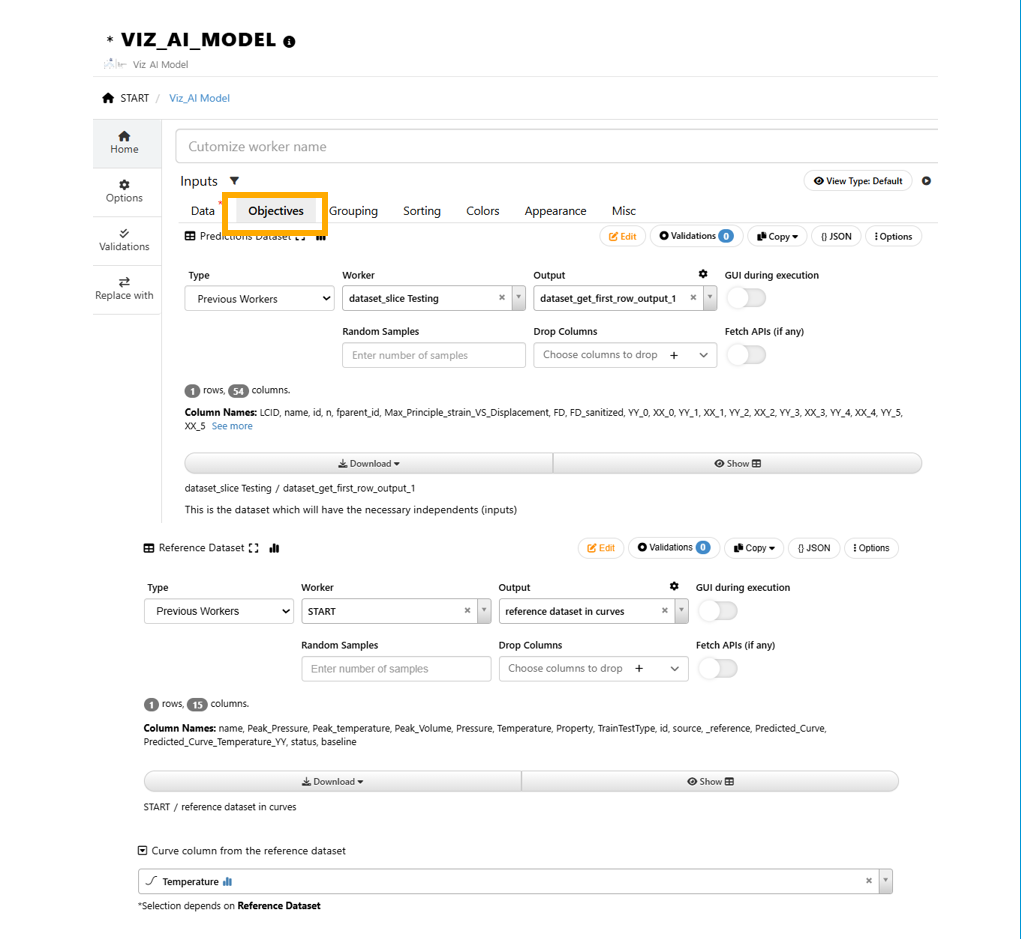
Configure Inputs and Settings : Prediction
1/ When we choose “Prediction” for Objective, we will be prompted to provide a prediction dataset and a reference dataset.
2/ Prediction dataset needs to include input columns used for training ML-Models
3/ Reference dataset needs to include the output values. If the output is a curve and it is stored as a curve column, then we can provide the column name for the curve column.