
22.  Curve Digitization
Workflows has the ability to digitize and create usable curve plot from an image of a curve. The following demonstrates how it is done.
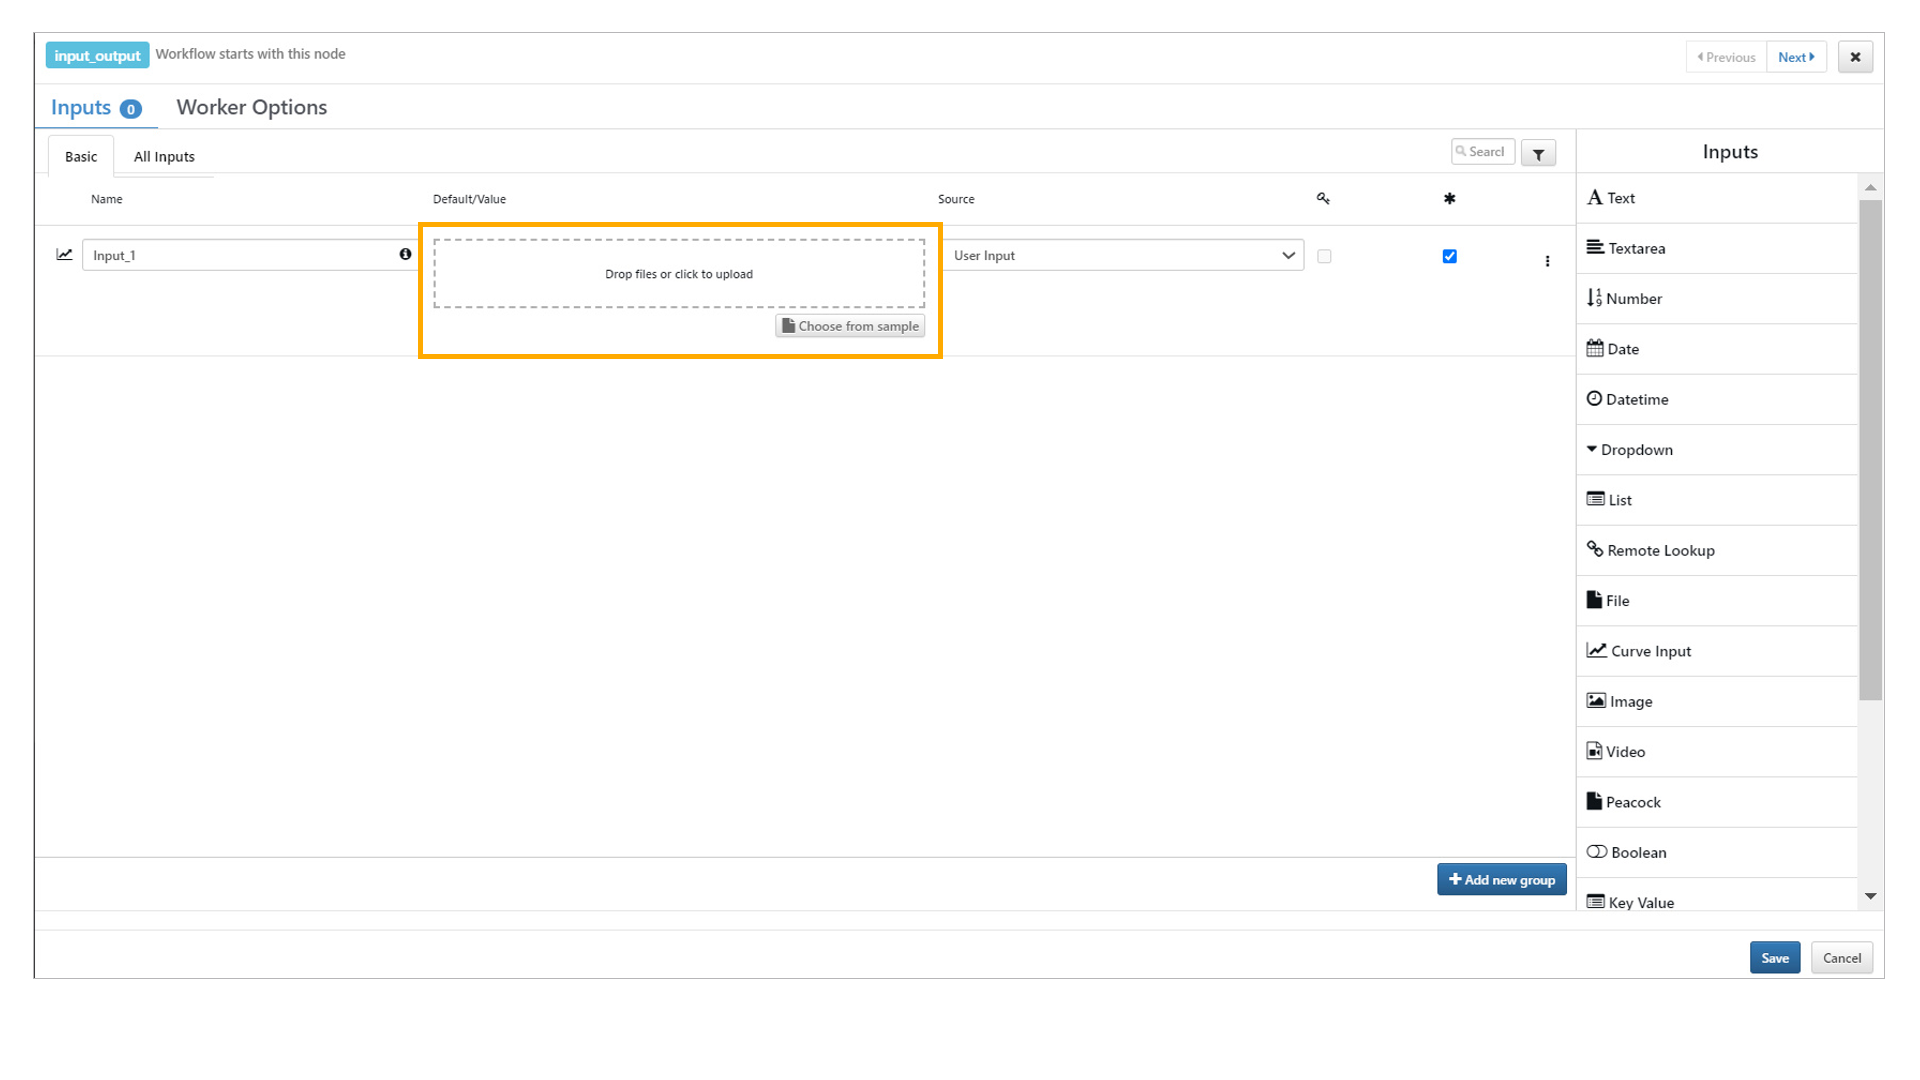
Step 1: Upload image in curve input field.
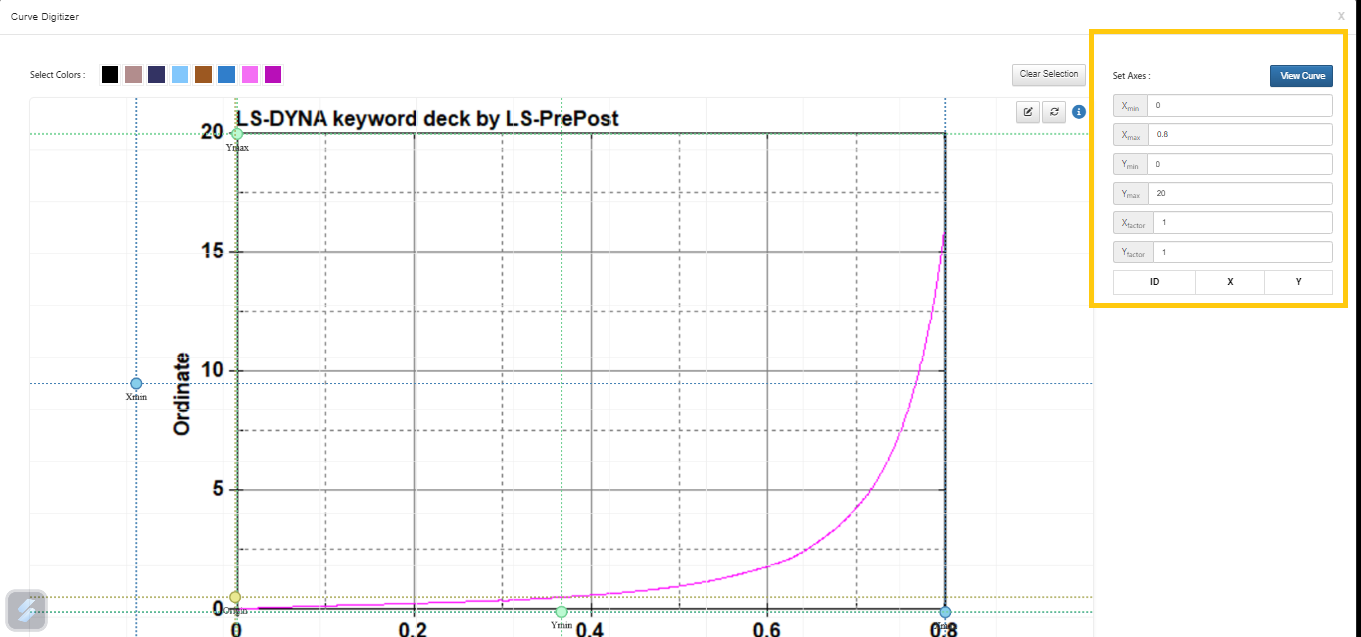
Step 2: Enter X min , X max , Y min and Y max values from the imported Curve image. Select points for each to assign values.
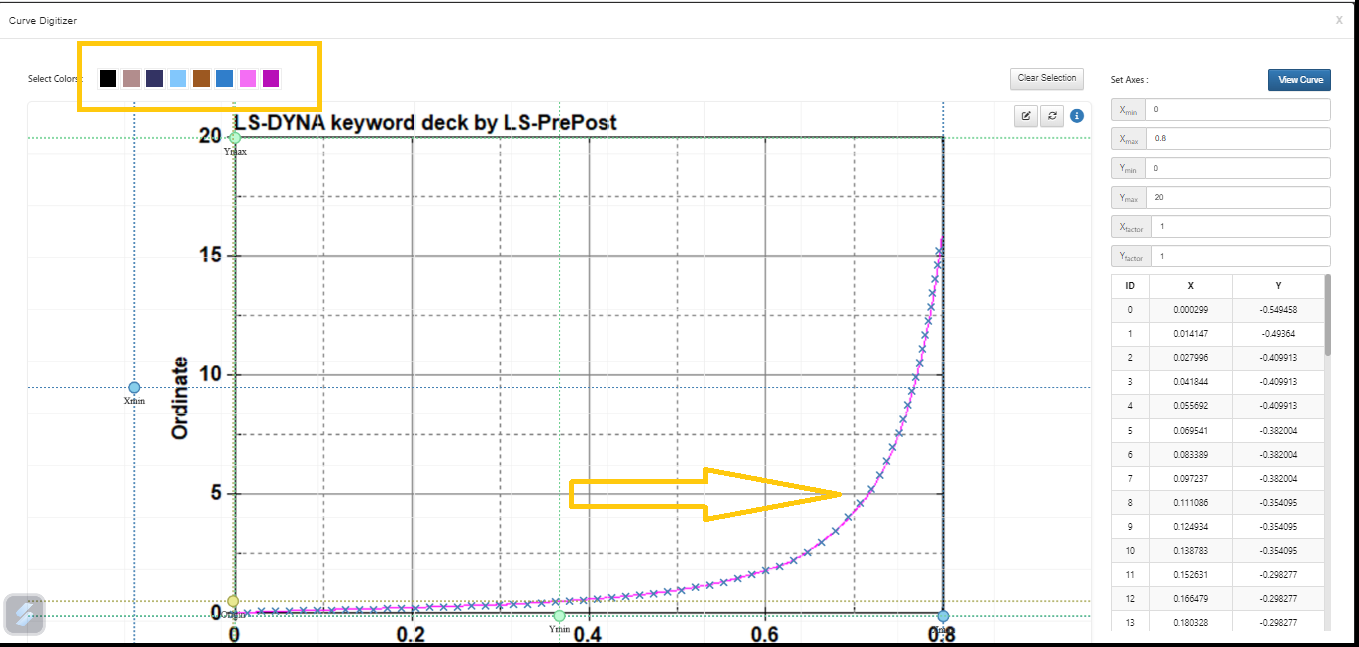
Step 3: Hit automatic selection by clicking on Curve color or manual to select more points.
Step 4: Data from Curve is extracted and we can Save the data.
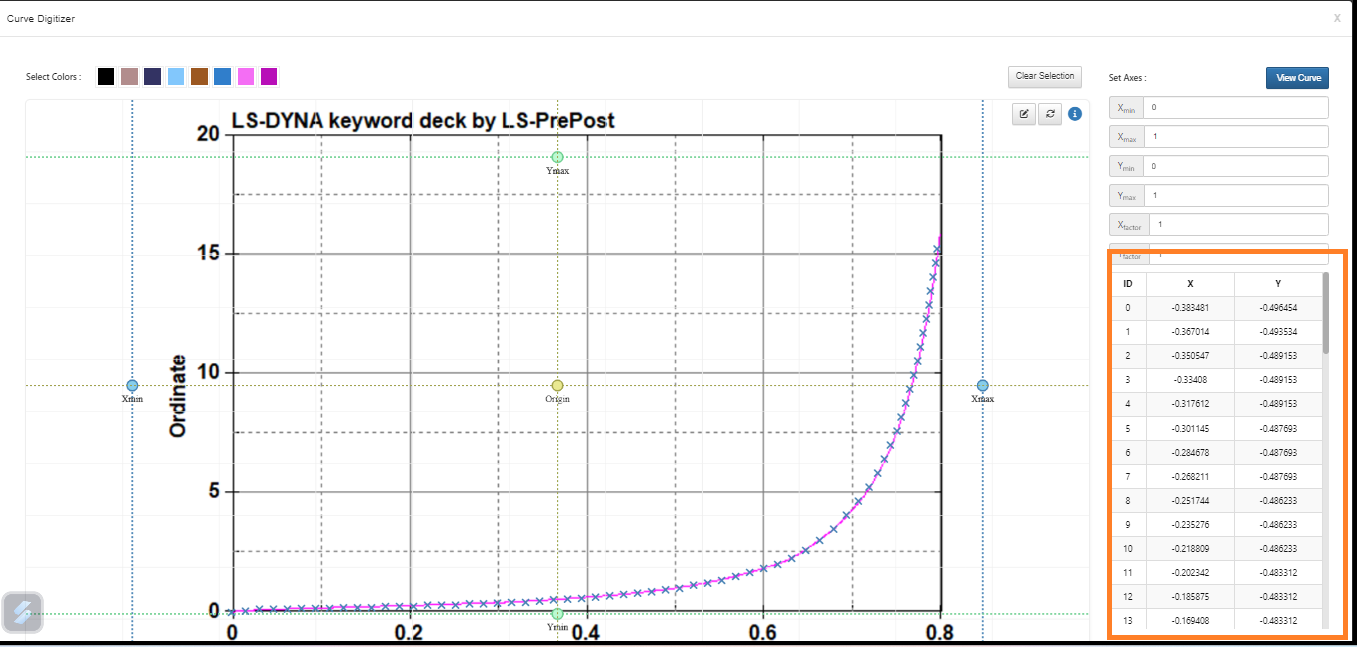
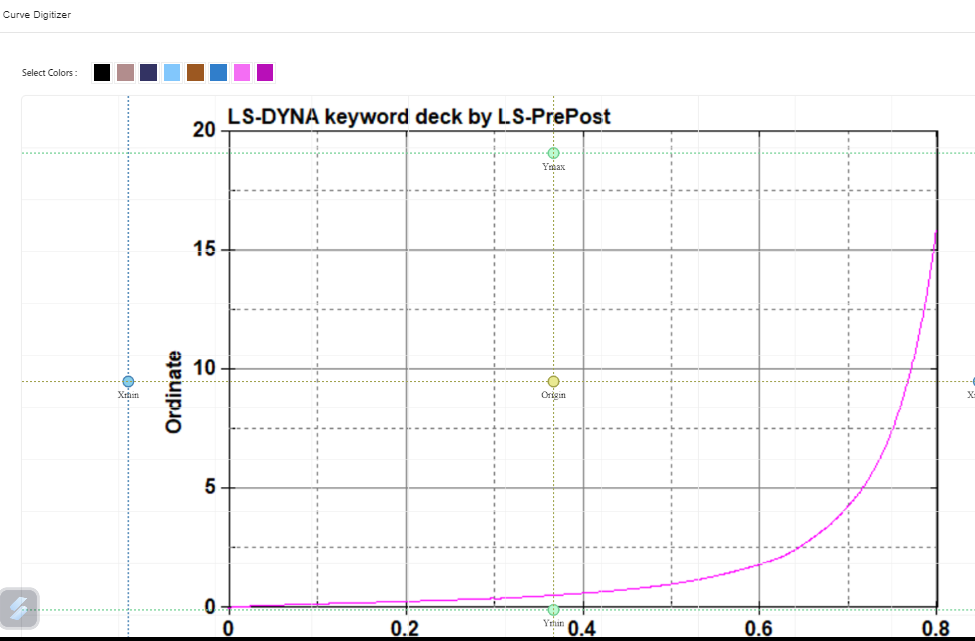
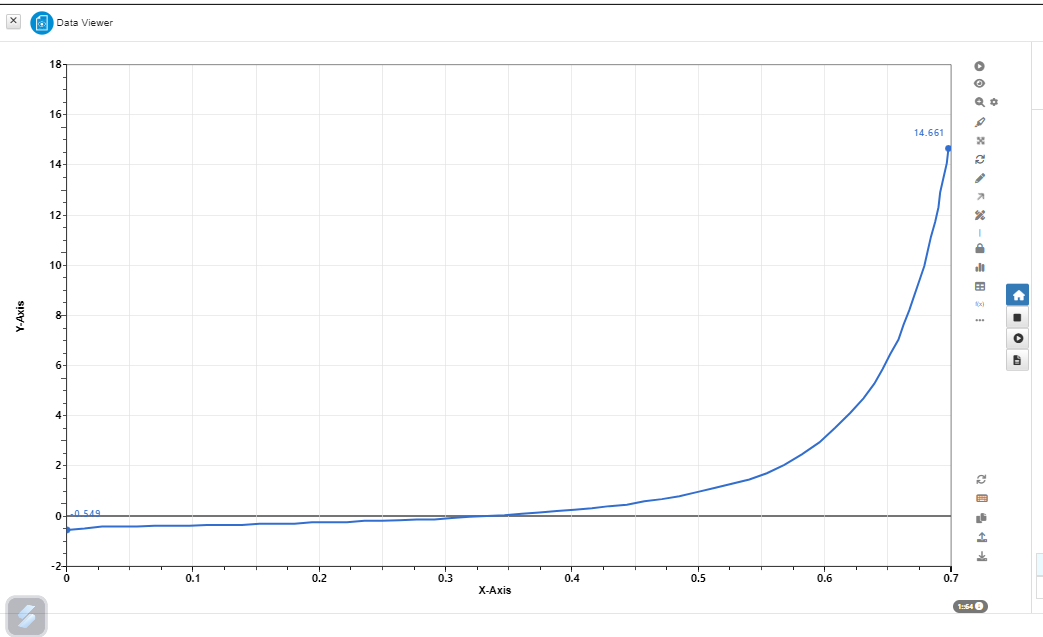
The following image shows the before and after digitization of the curve.
The following video shows the full process of digitizing the curve.
We can now erase curve in multiple curves image for Data Digitizer while extracting color curve points.
We can now crop curve in multiple curves image for Data Digitizer while extracting color curve points.
Data Digitizer has new UI update. It includes ‘Set Grid Axis’ and ‘Image & Curve Configuration’ options.
Curve Digitizer has new option in to Enable Image Panning checkbox in advanced settings, which allows us to move the image when option is enabled.
Curve Digitizer now has sort by option in settings which is used to sort the extracted curve values in Ascending order, descending order and the same order when extracted.
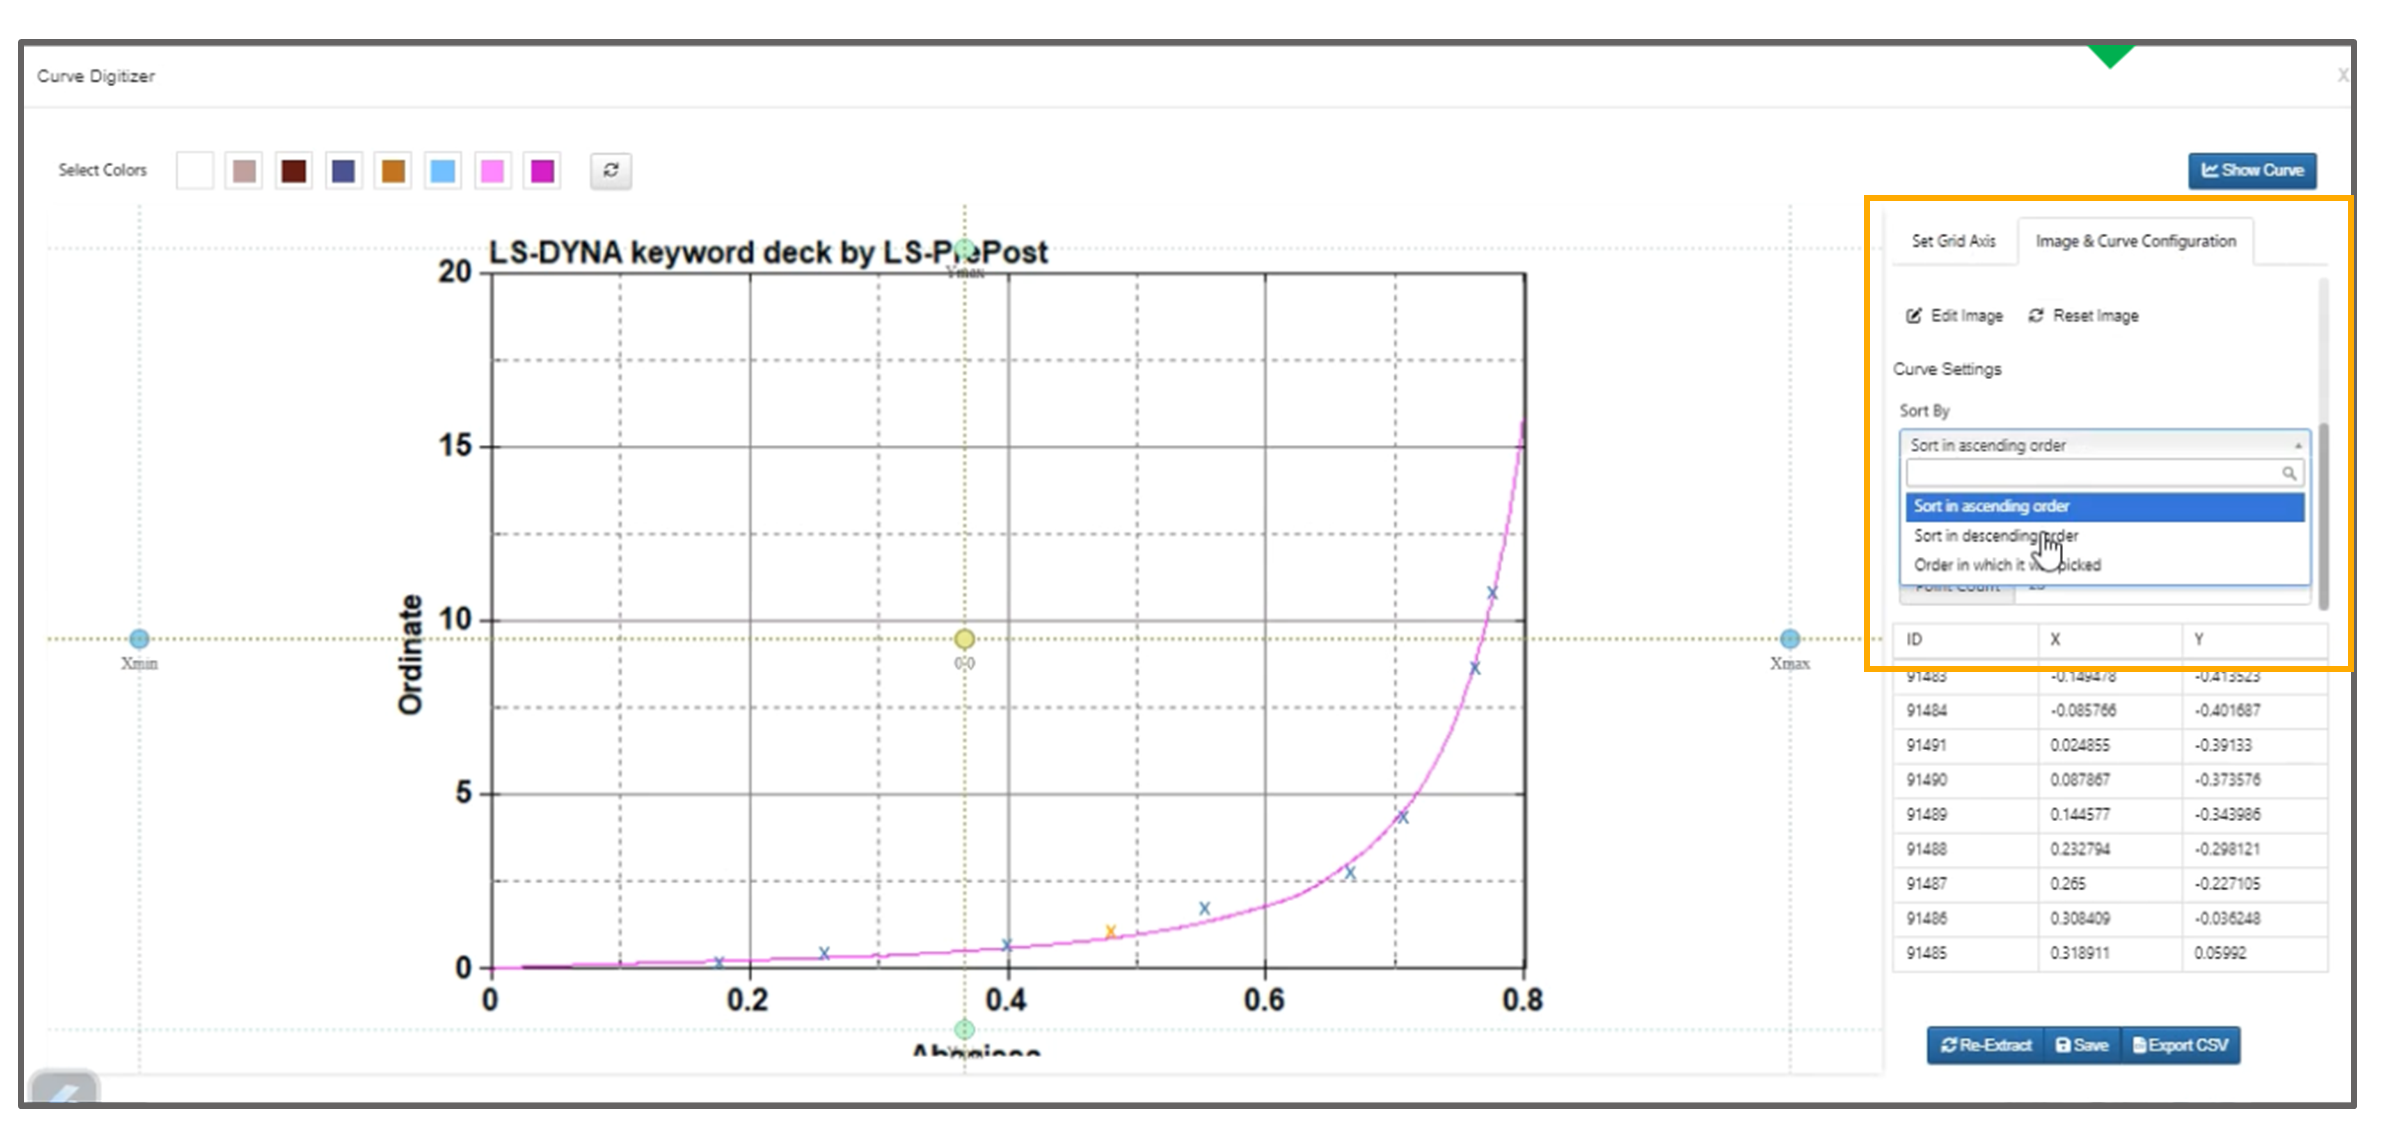
Curve Digitizer Sort by
Now we can edit the Curve image in workflows and save it to the Curve Digitizer.
Curve Digitizer has new option to ‘Show connected line’ in settings for curves. Also, Euclidean option for colors is set to minimum by default which enables a larger selection of colors.
22.1. Average Curve
Curve from Image Extractor (Curve Digitizer) now supports extracting an average curve from multiple color-mapped curves in an image. The Settings tab includes options to interpolate, specify interpolation points, and choose the computation method (simple, mean, or median).