
8.  Building and Configuring
In this section, we’ll go over building our workflow and configuring our workers in order to have a successful execution.
8.1. |cog| Adding Workers
Access the worker library by clicking on the Worker Icon in the left side tool bar.
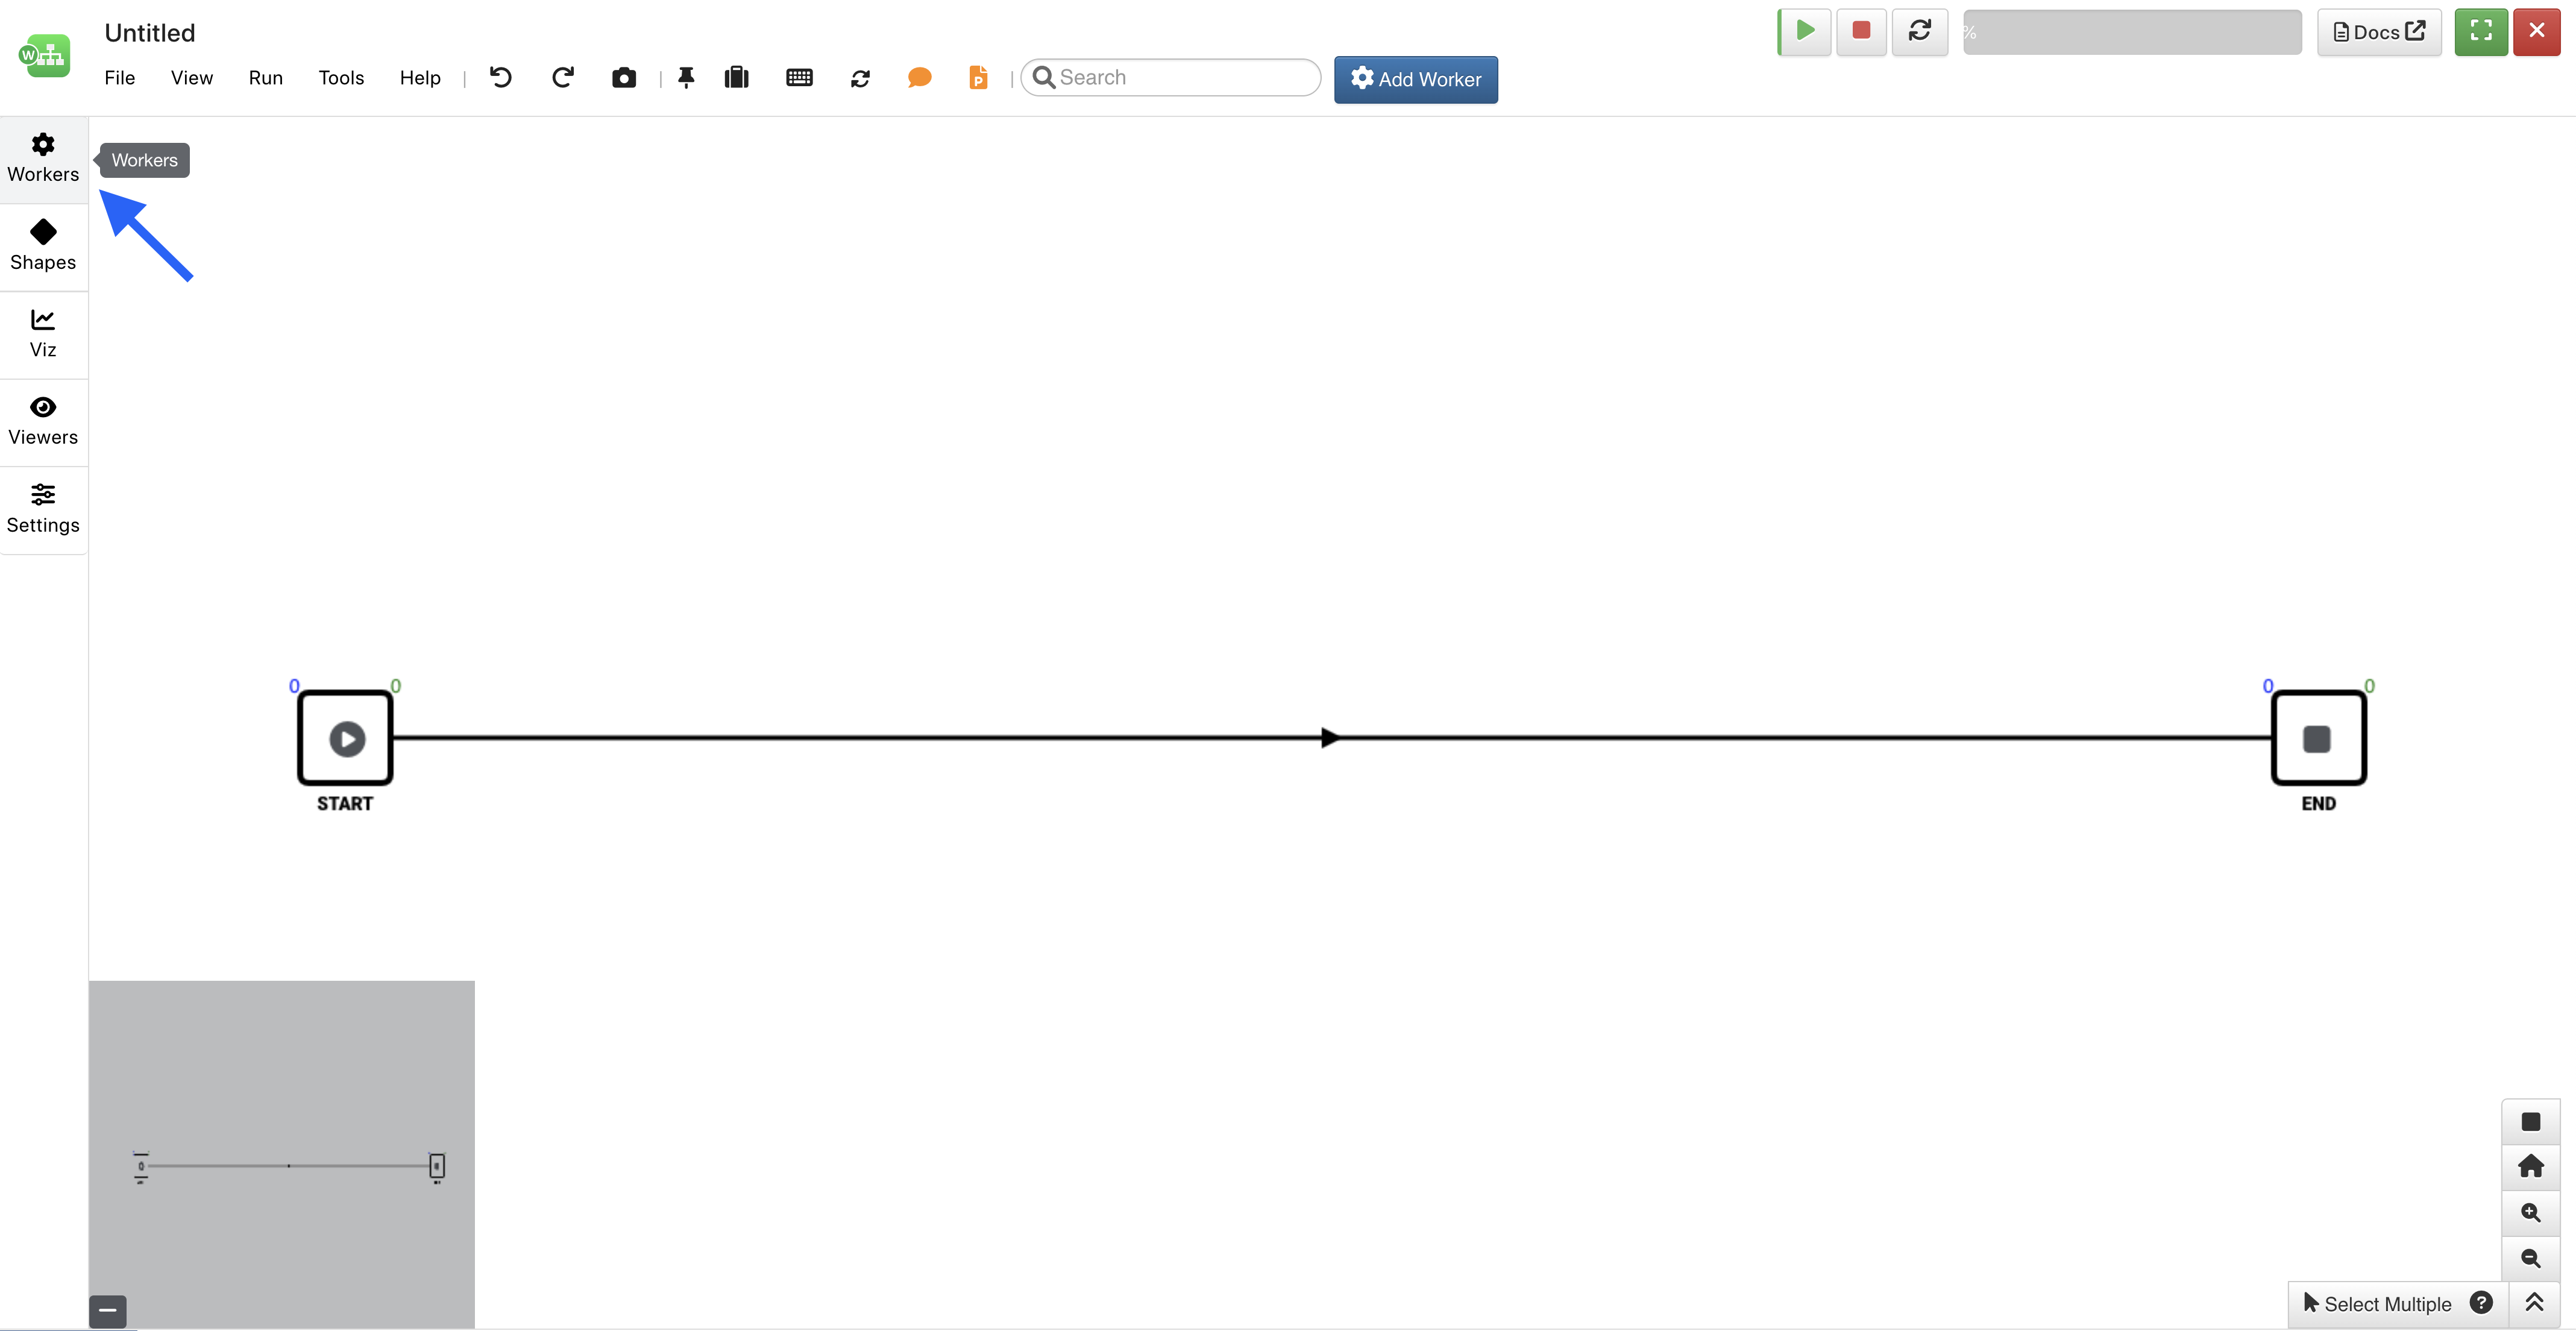
Figure 1: Add Worker
Use the filters, search bar or view settings to sift through and explore workers as shown in the following video.
Add a worker onto the canvas by clicking the add button (1), dragging-and-dropping it anywhere onto the workflow (2), or running the wizard (3). Using the add button or wizard will place the worker in front of the END worker (4), perfectly between it and the last worker (in this case, it is placed the the middle of the START and END).
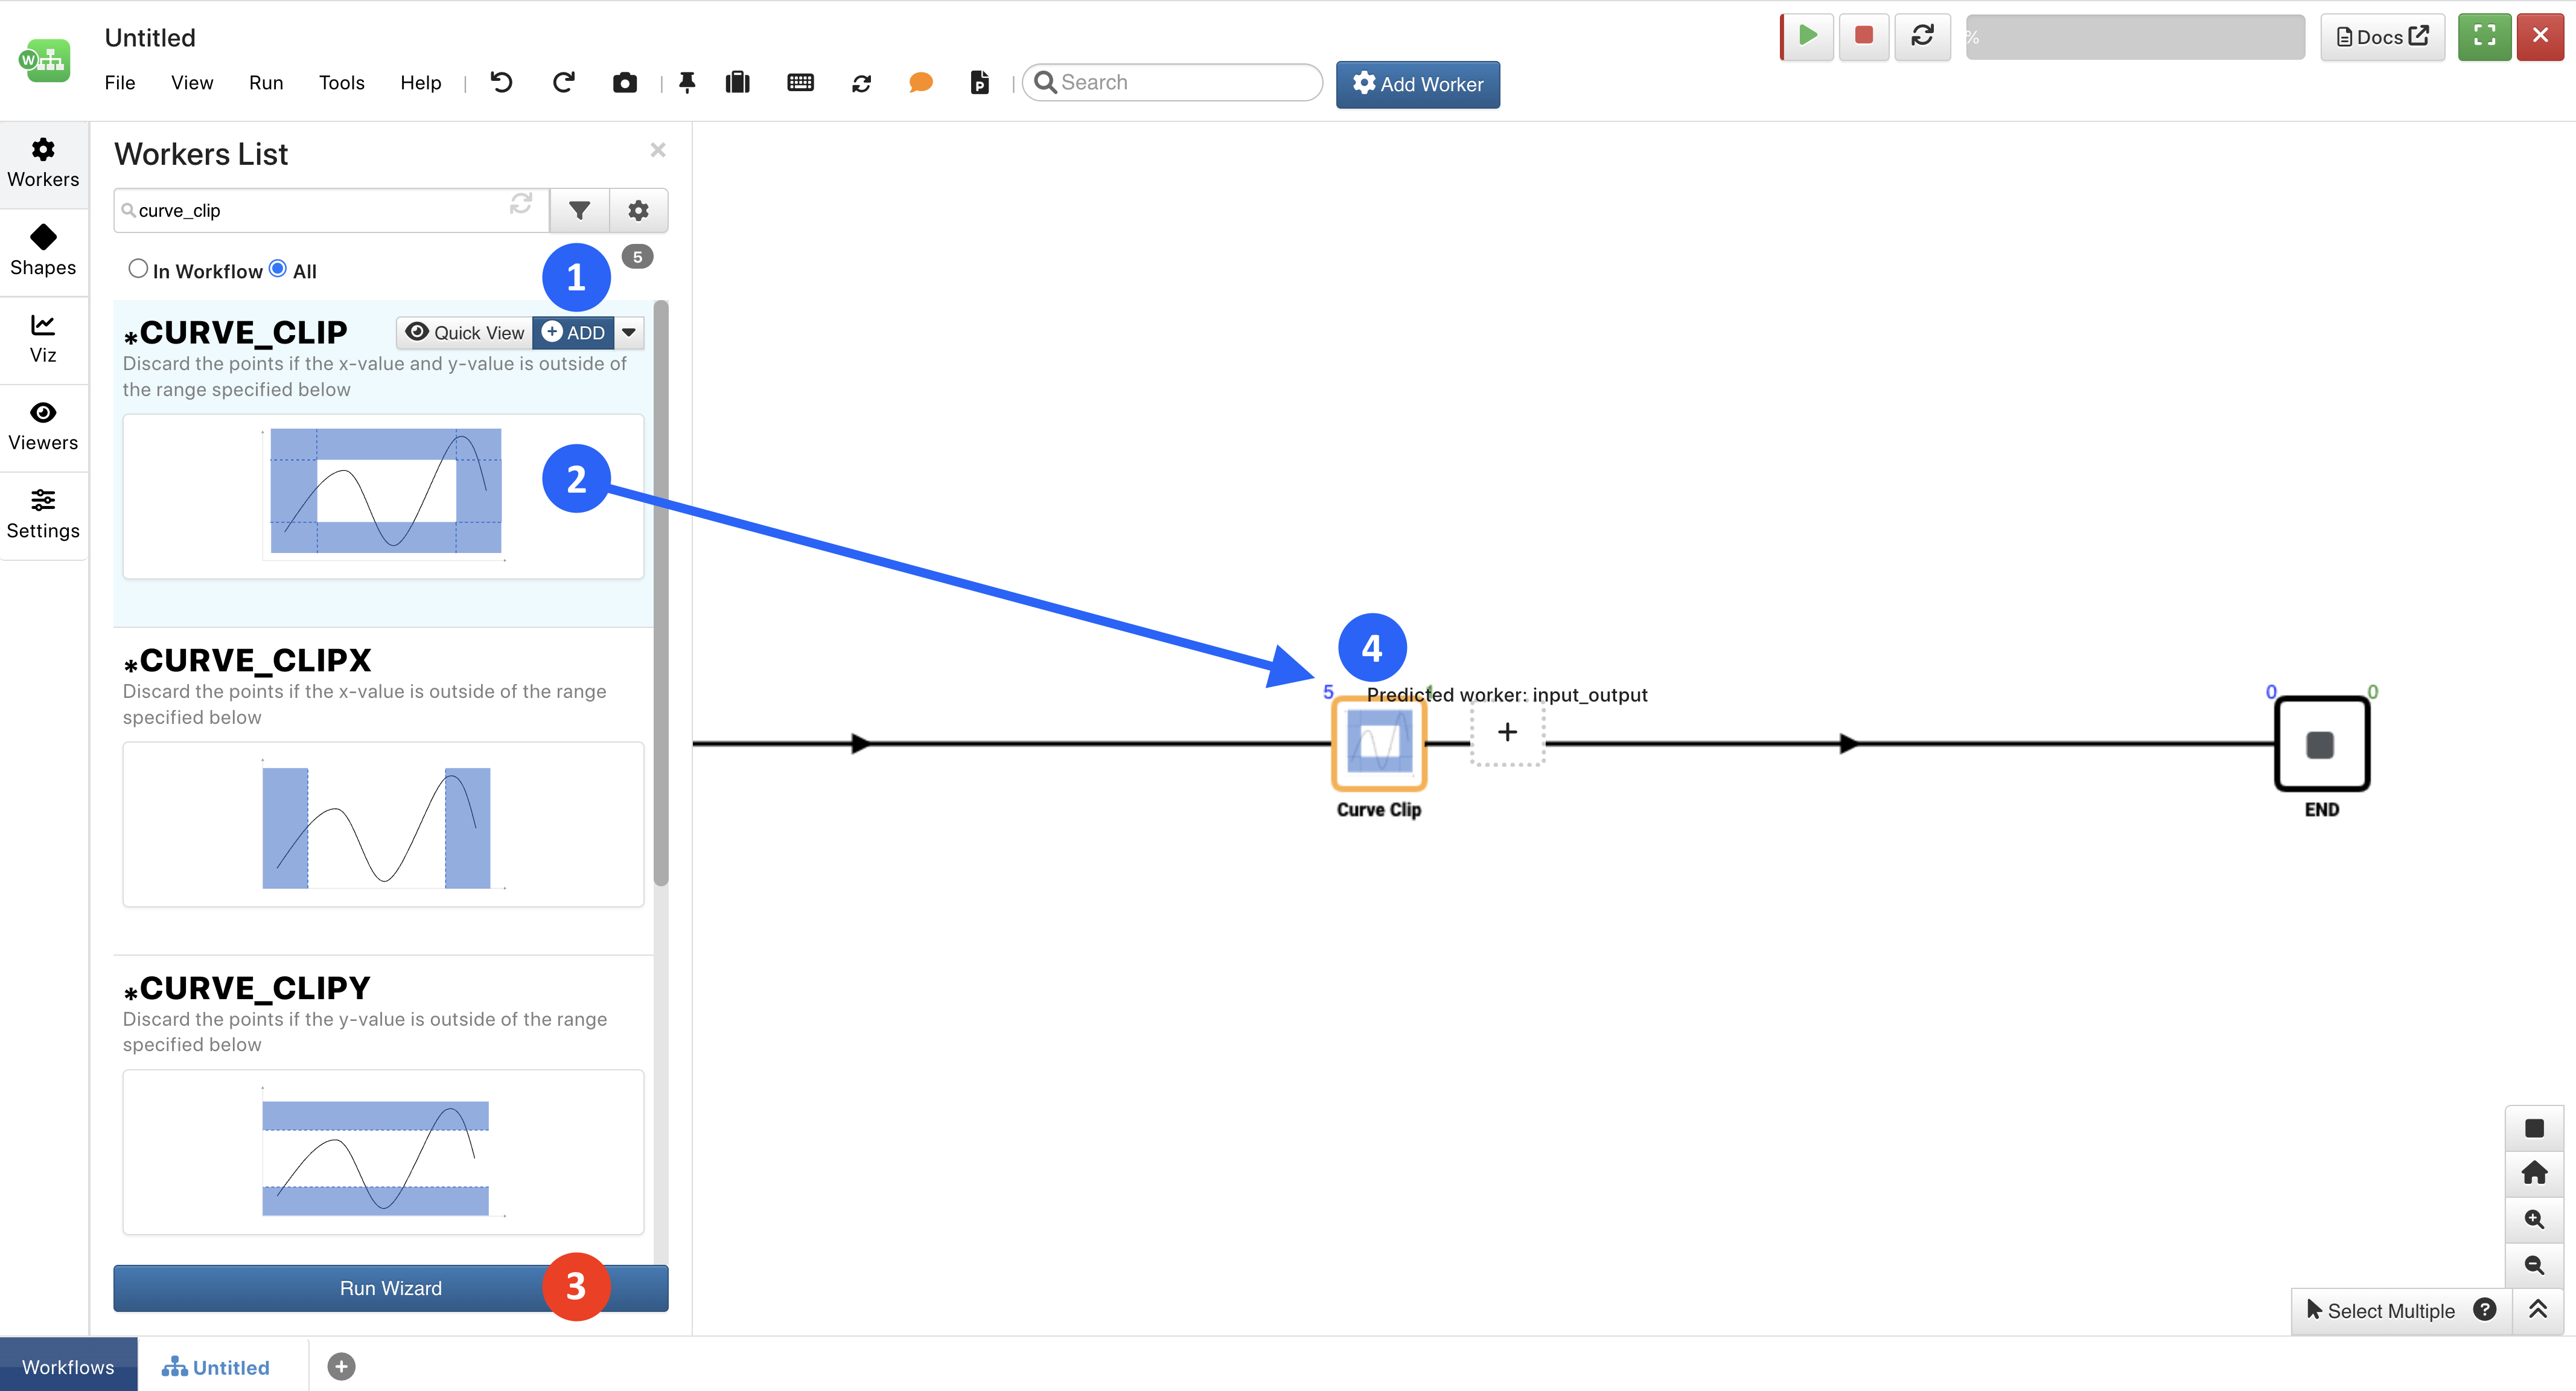
Figure 2: Add Worker
8.2. |check| Configuring Workers
In this section, we’ll review the basics of configuring workers.
The following movie shows an overview of how to configure a basic math and curve worker. Make sure to read on for more information on configuring!
Click on a worker to configure it in a separate modal window.
Figure 3: Click on Worker
For each input, choose how to get data, either by inputing local data, using data from previous worker or getting it from the workers list.
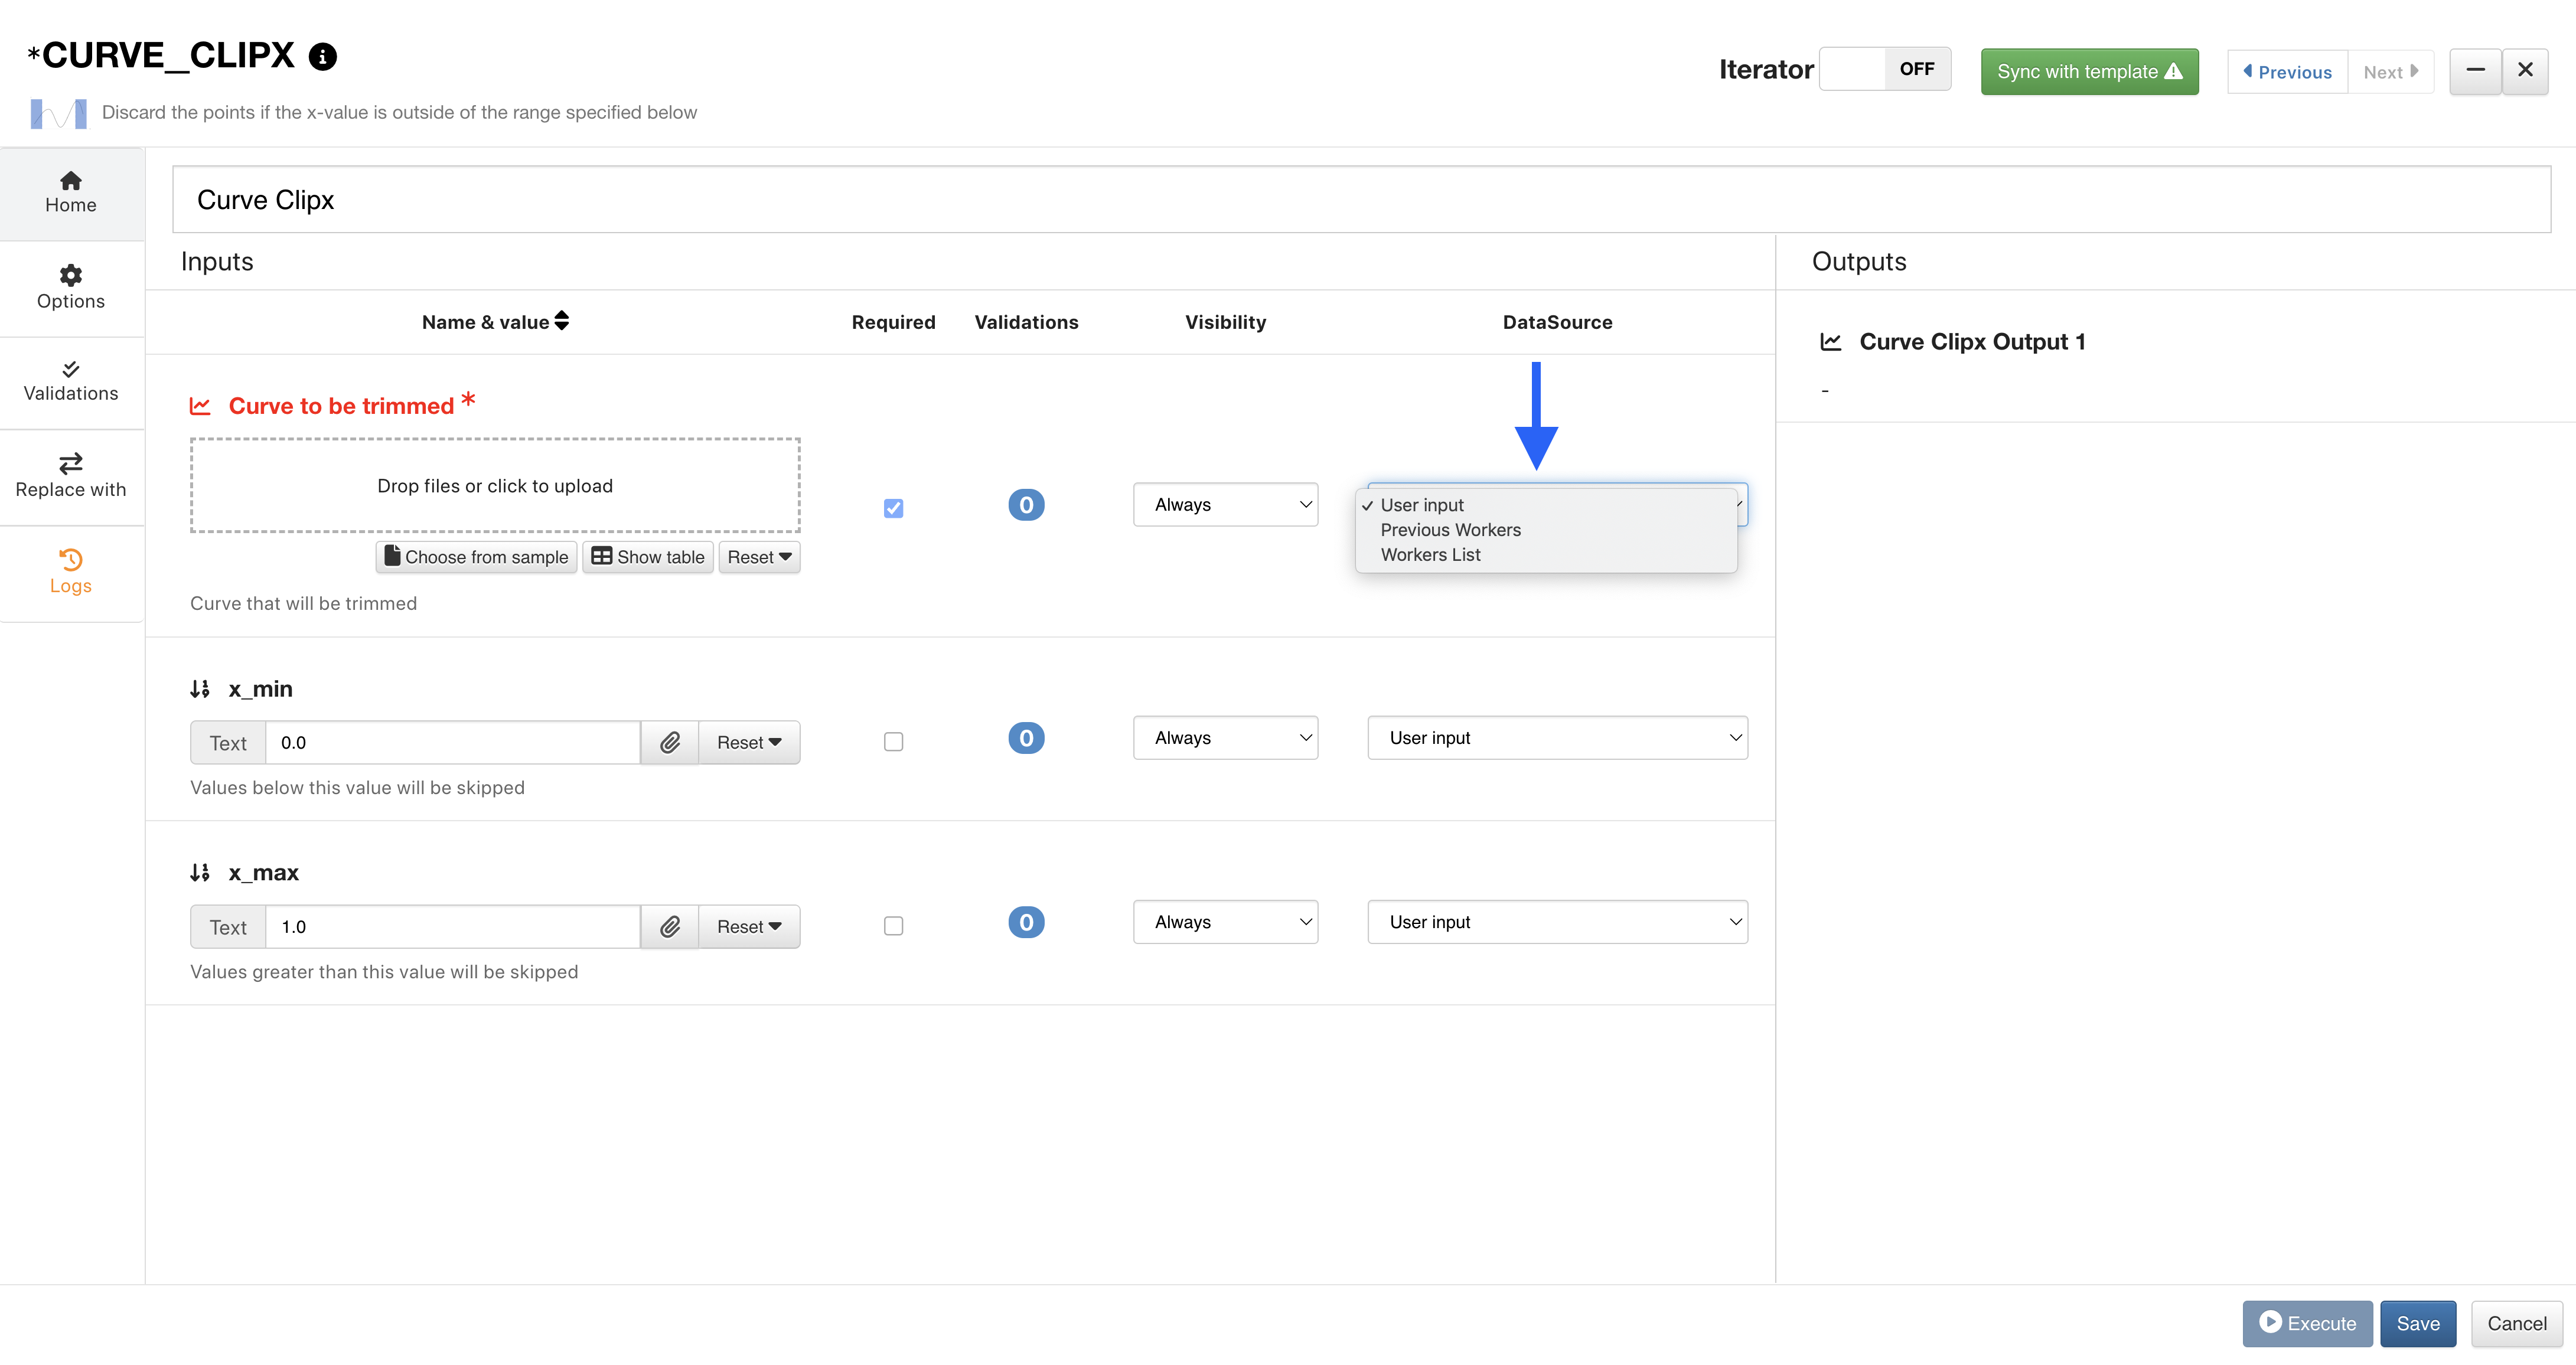
Figure 4: Input Data Source Options
The graphic illustrates the available options for inputing data into a worker:
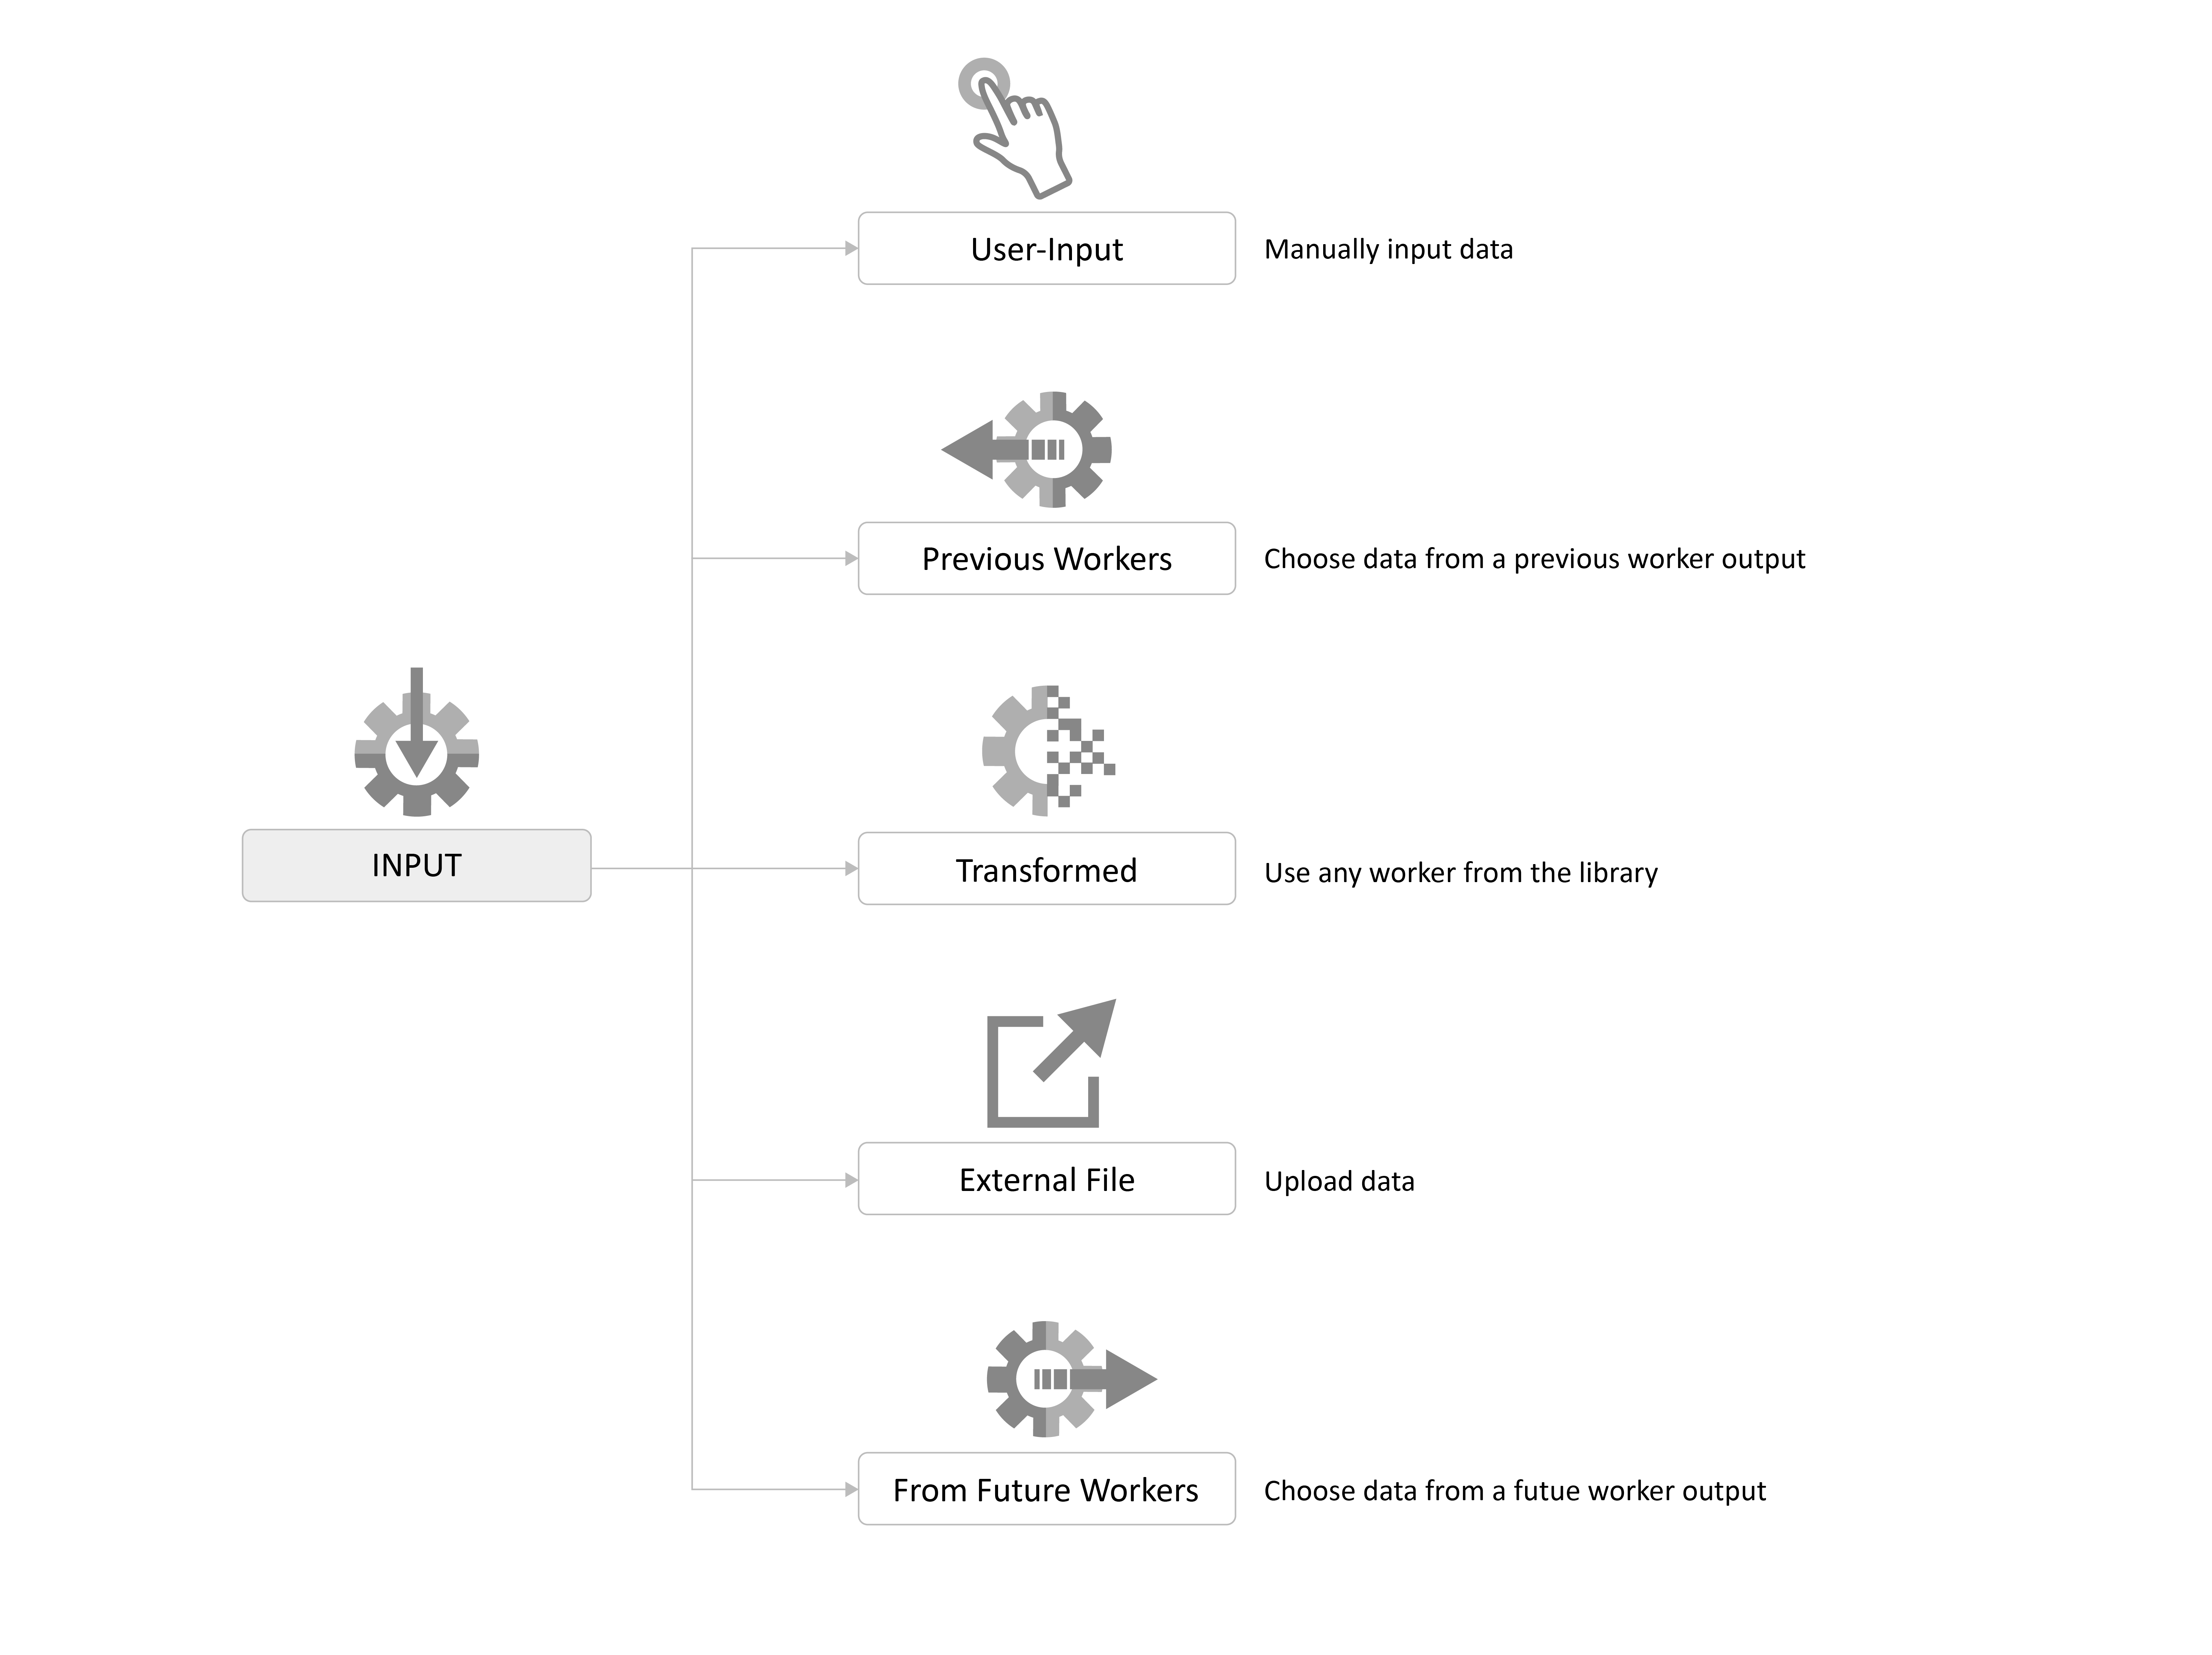
Figure 5: Worker Input Options
Here, we’ve chosen to use a previous worker input. Make sure to fill out any other necessary inputs.
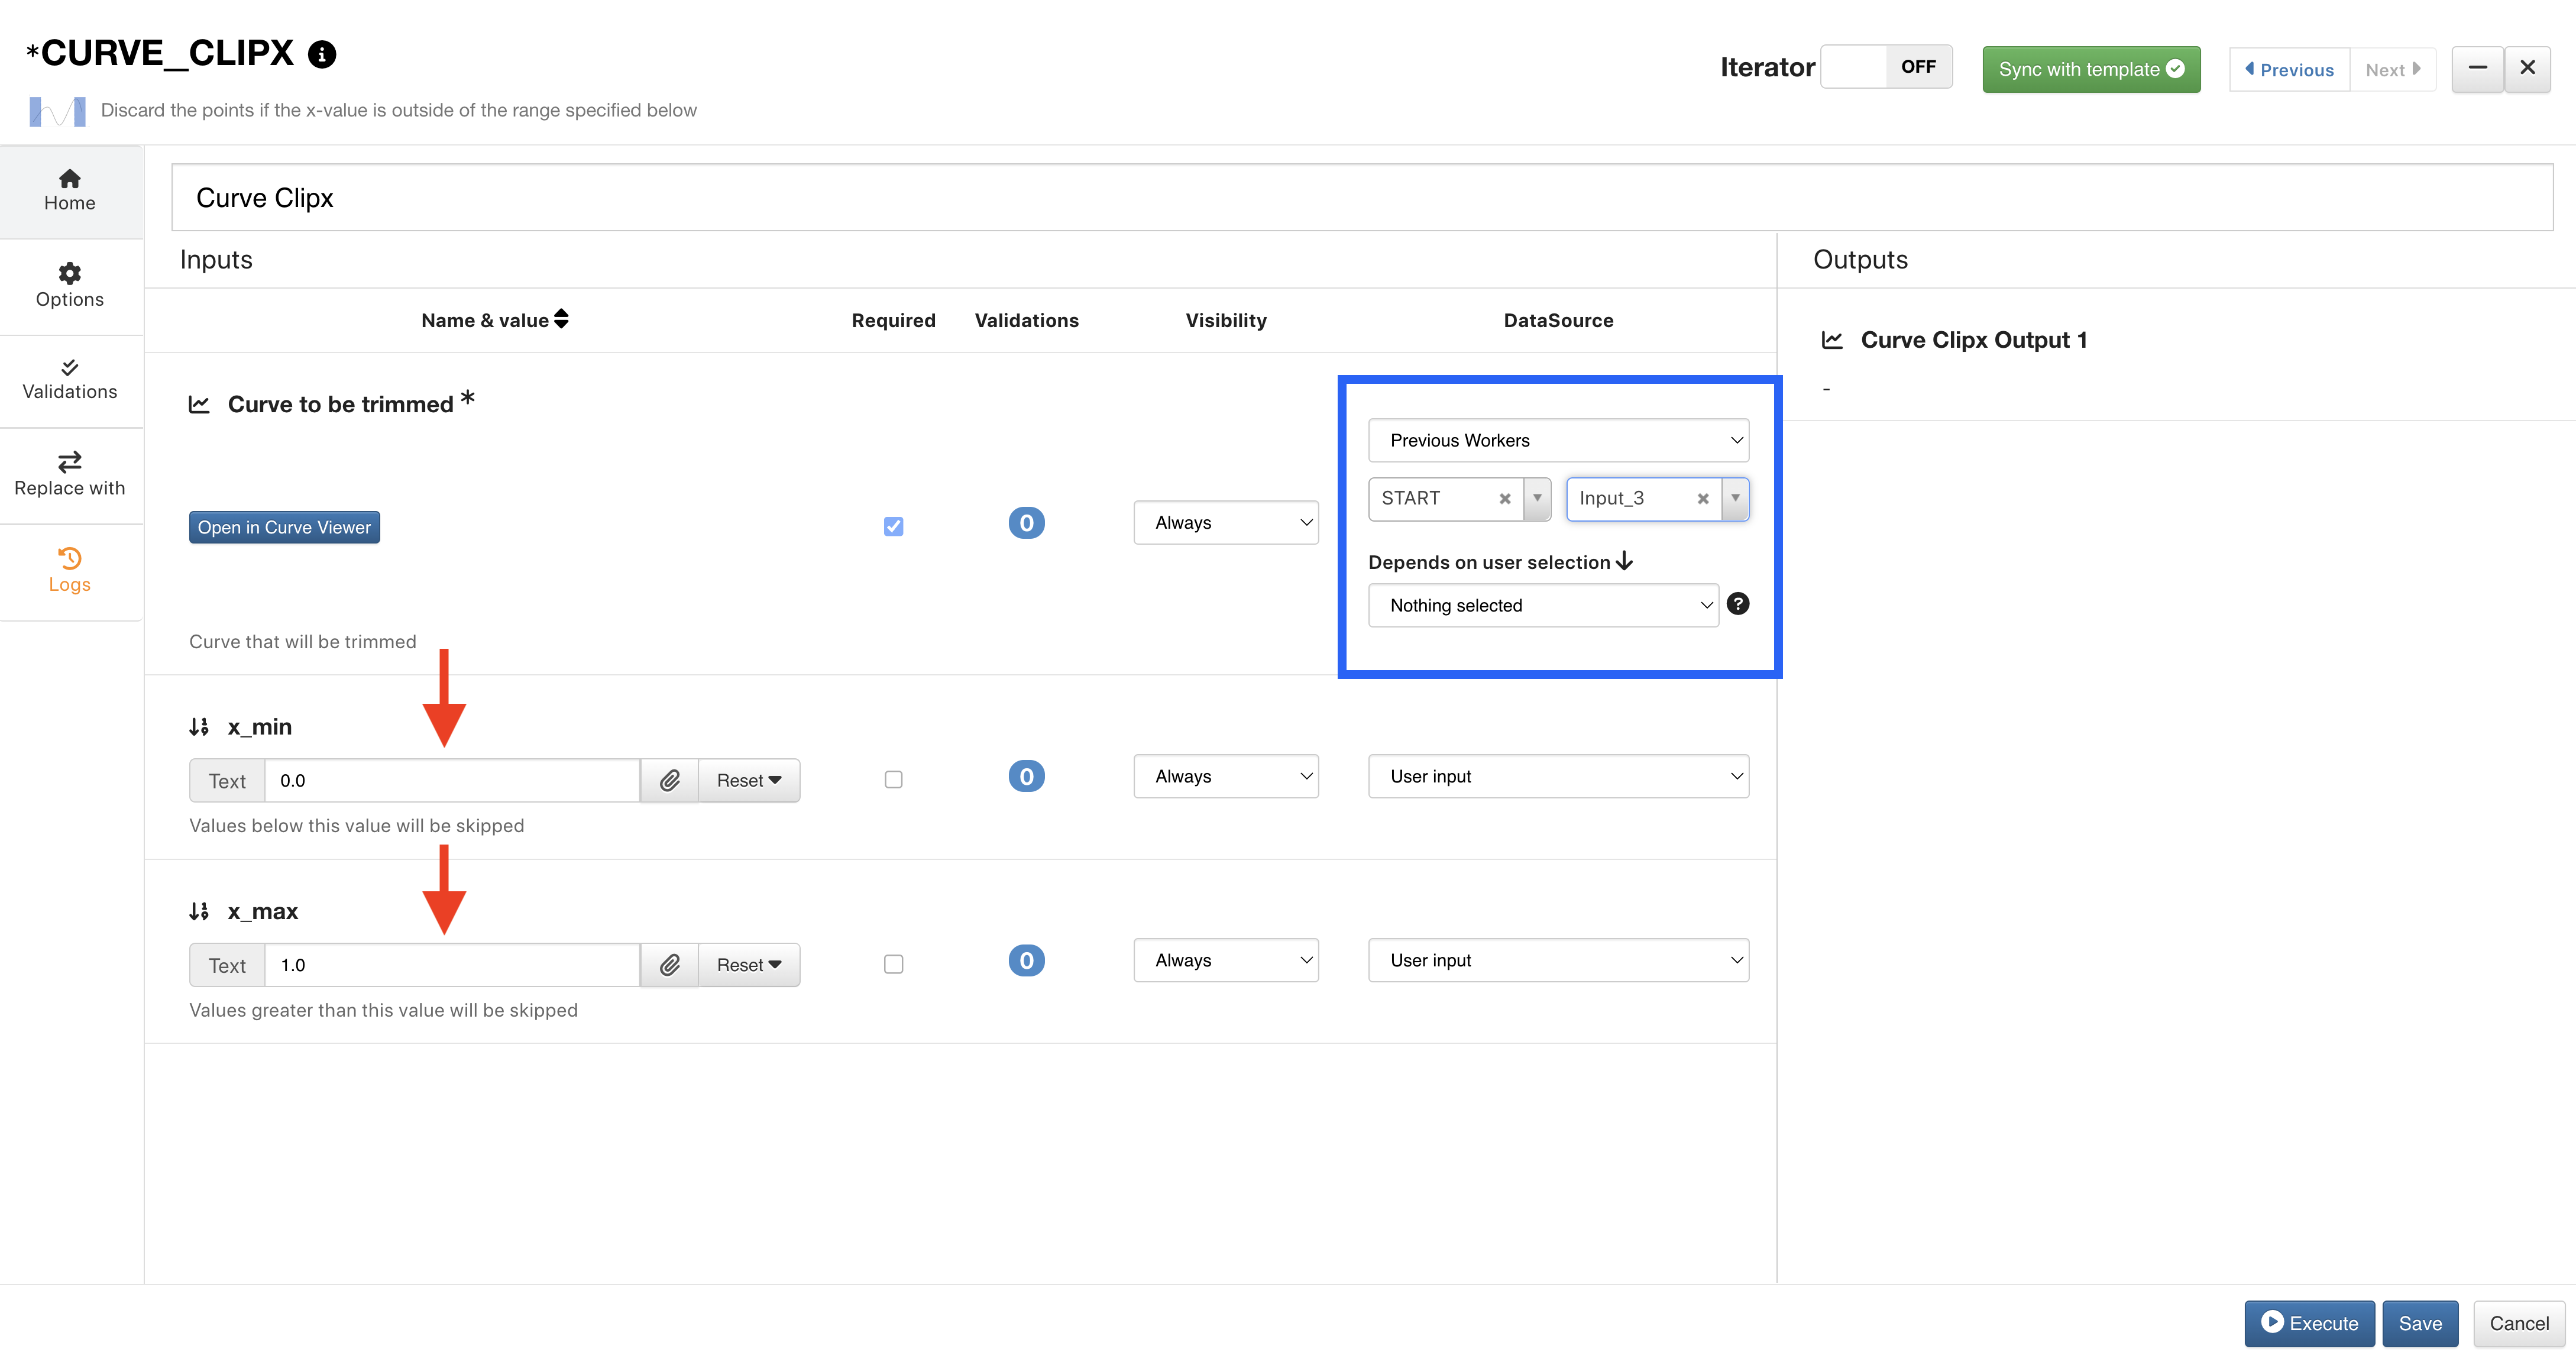
Figure 6: Input Data Source Options
Worker Tabs
Each worker will have tabs on the left side for more configuration options. The Home tab is where we set up the worker data as above. The Logs tab will populate as we start using the workflow.
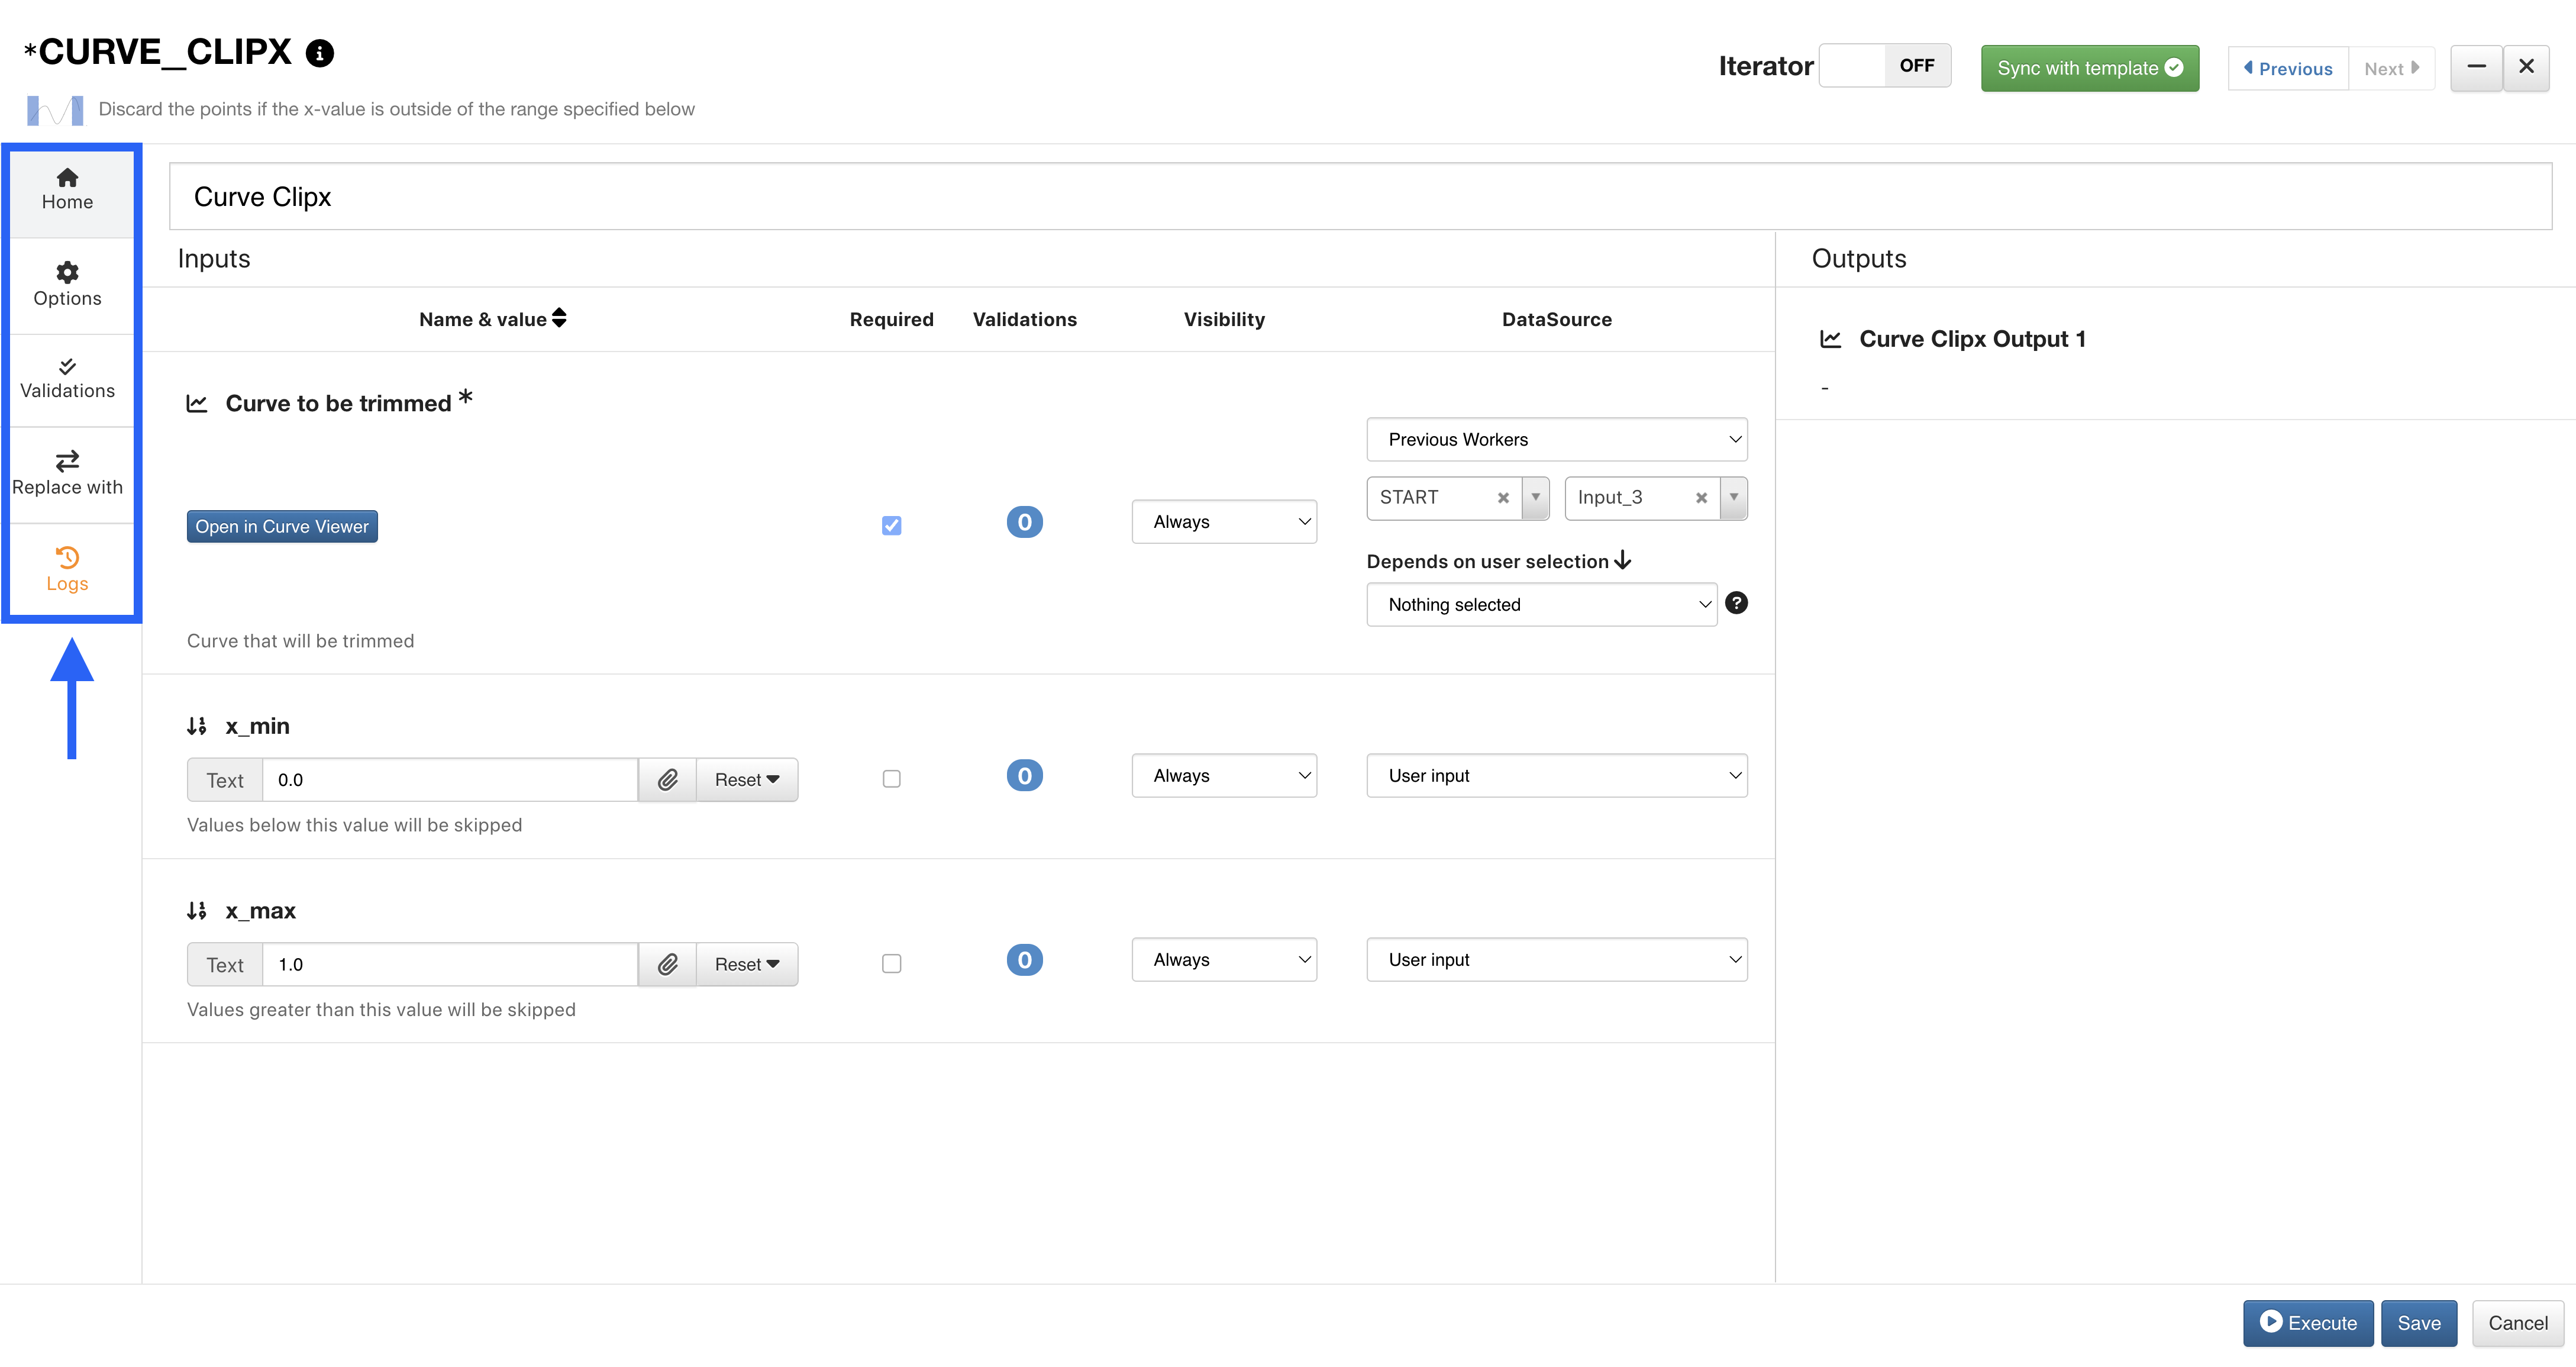
Figure 7: Worker Configuration Tabs
Options
Edit specifics of the worker under the Options Tab, such as the description (1) and label position (2).
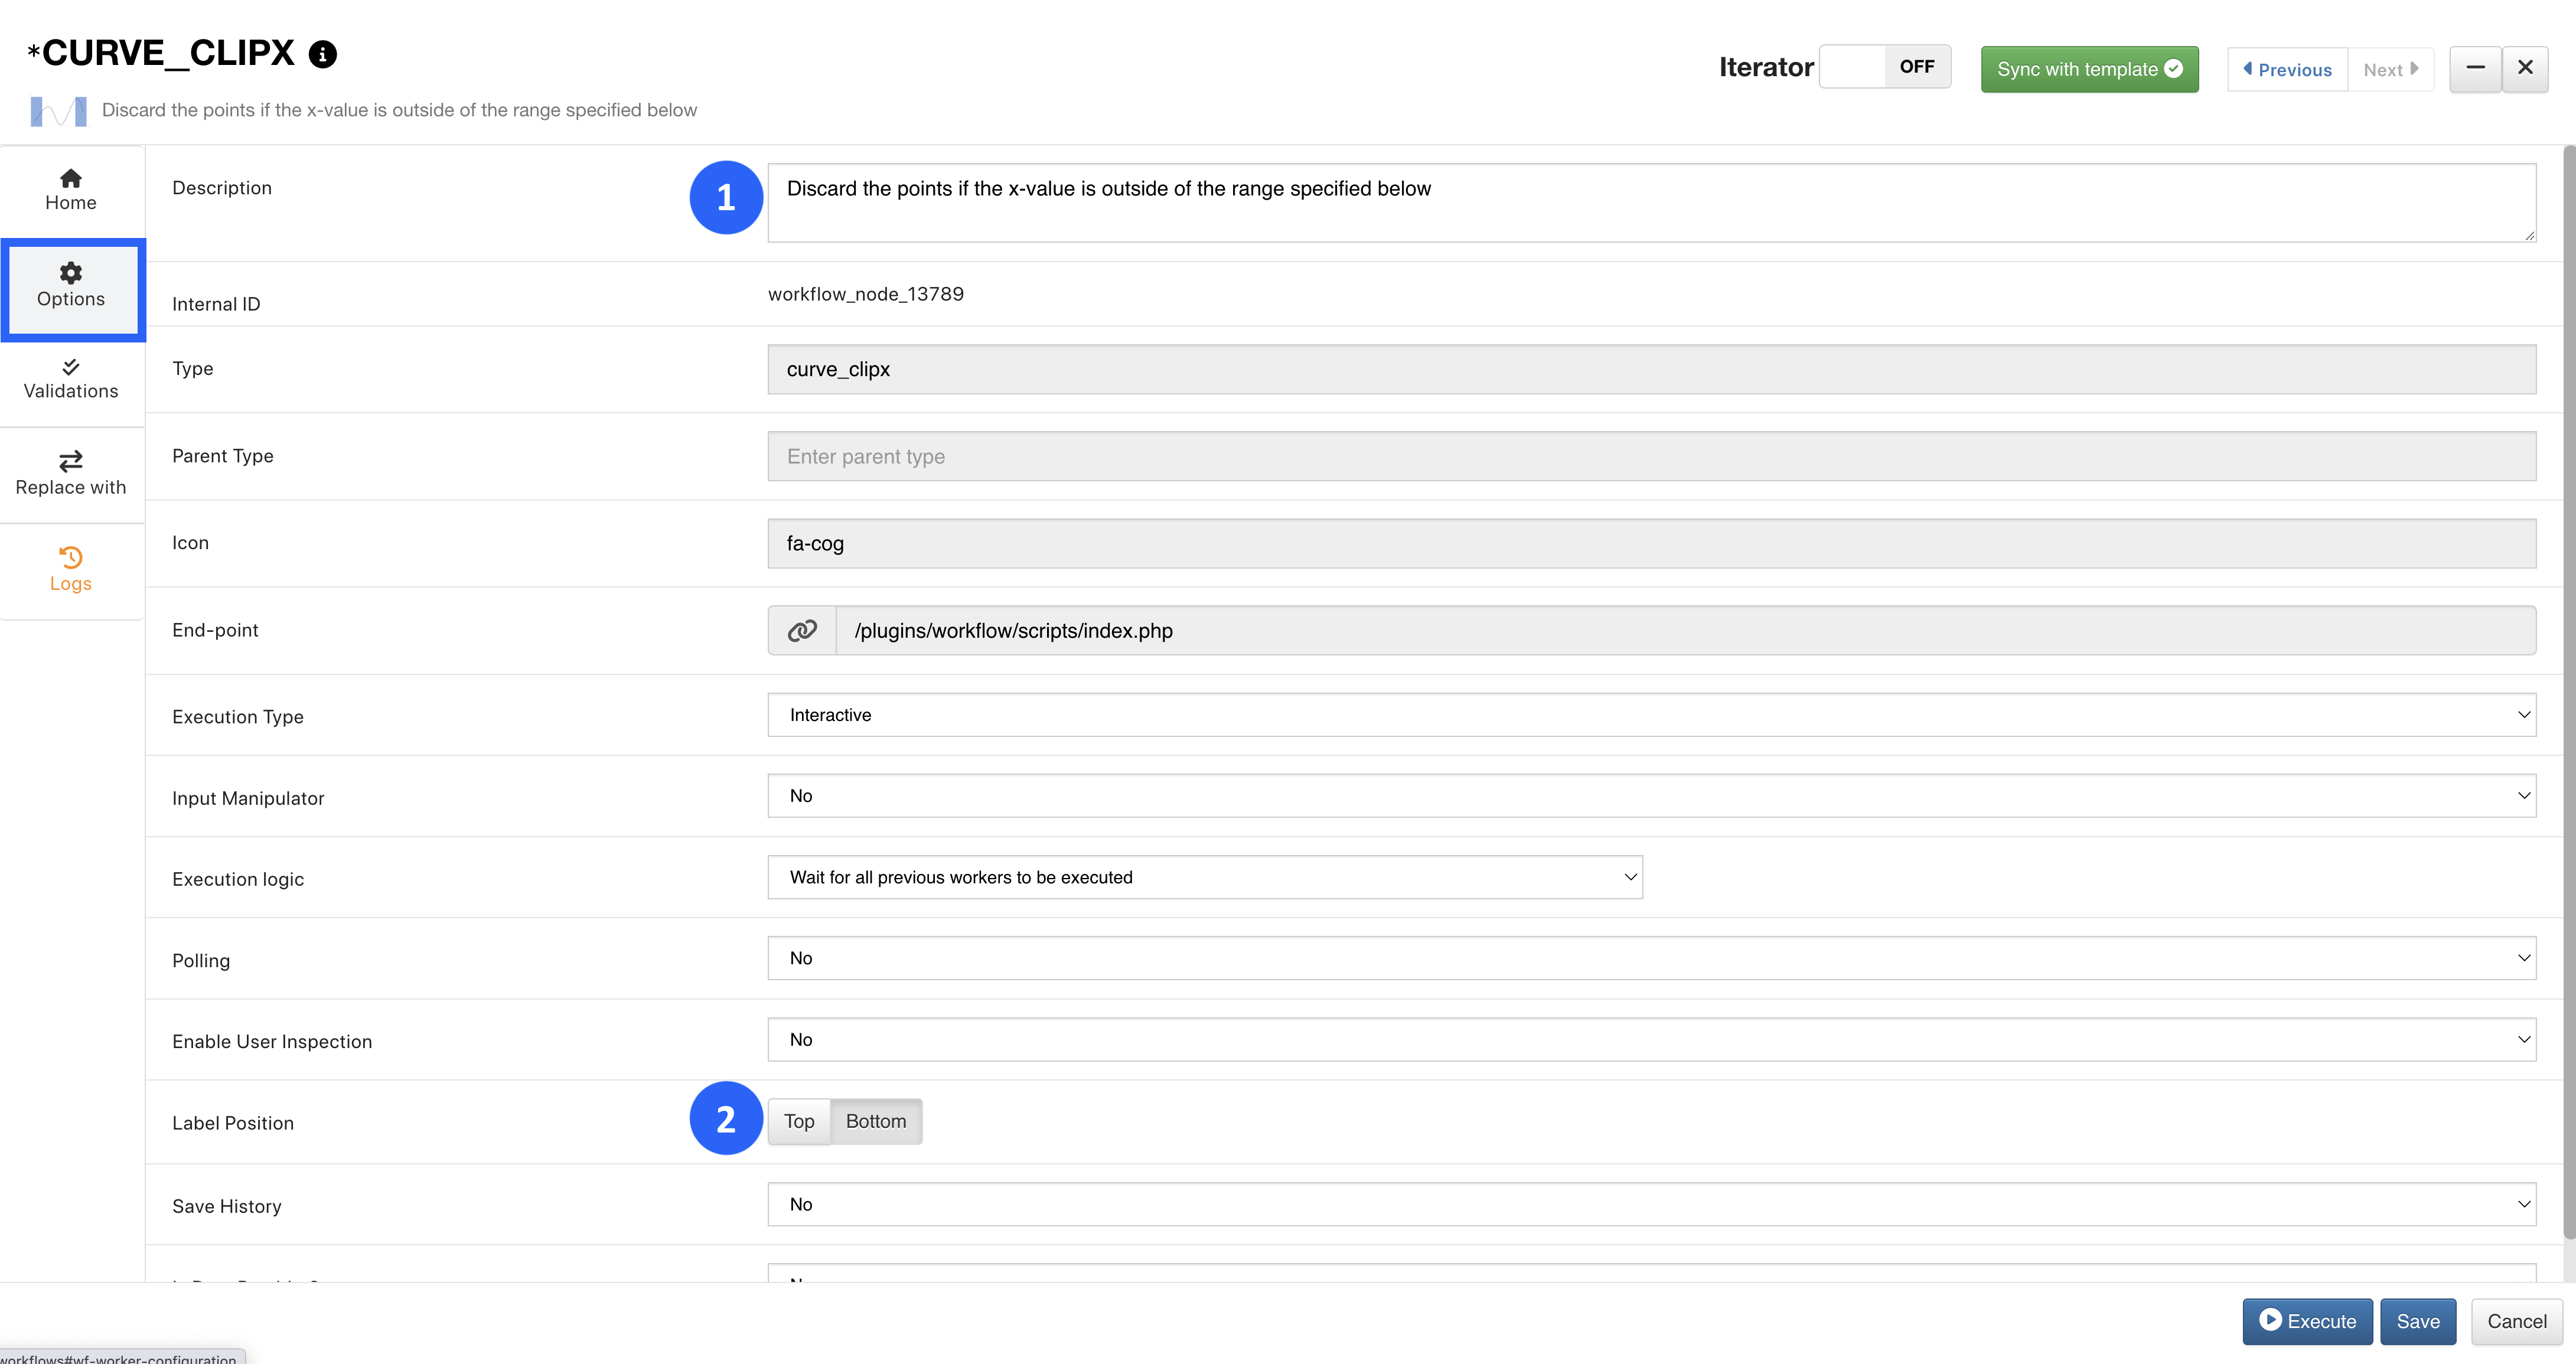
Figure 8: Worker Options
Validations
Add validations to the worker under the Validations tab. Click on Add Row to get started. Here, we’ve added one for our Curve to Be Trimmed. This will allow the workflow to only execute this worker if the requirements are met.
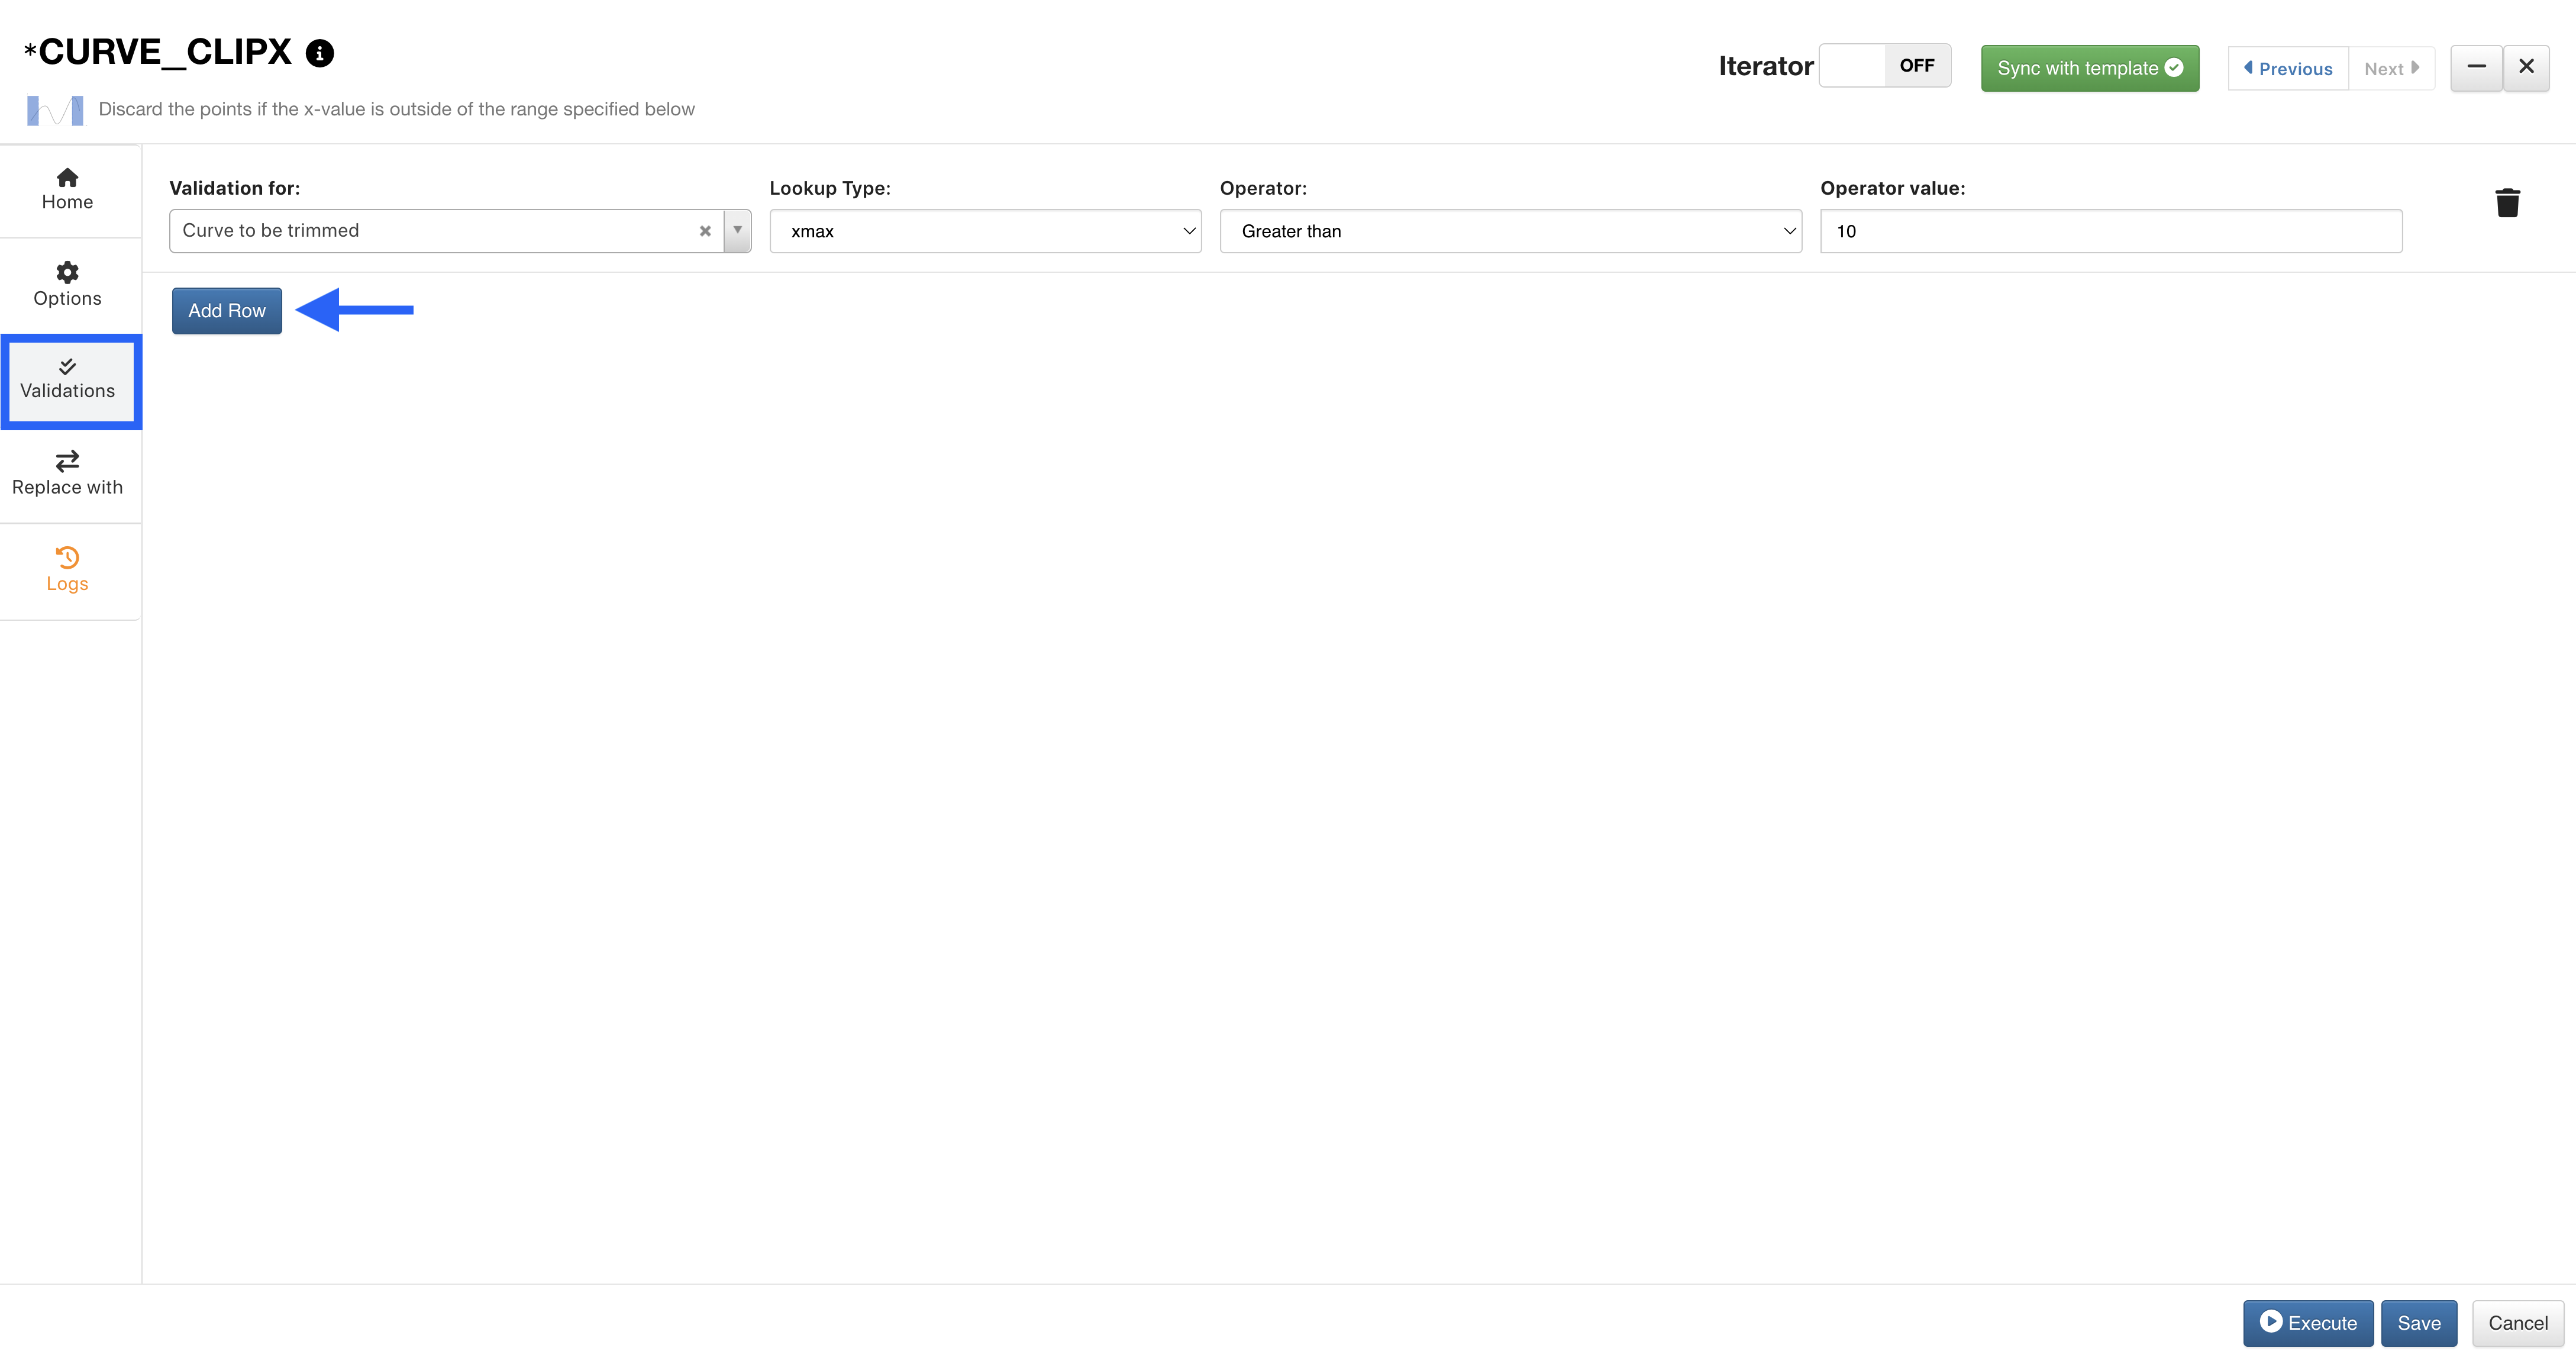
Figure 9: Validations Tab
Replace With
Under the Replace With tab, we can sift through the worker library to change our current worker to something else.
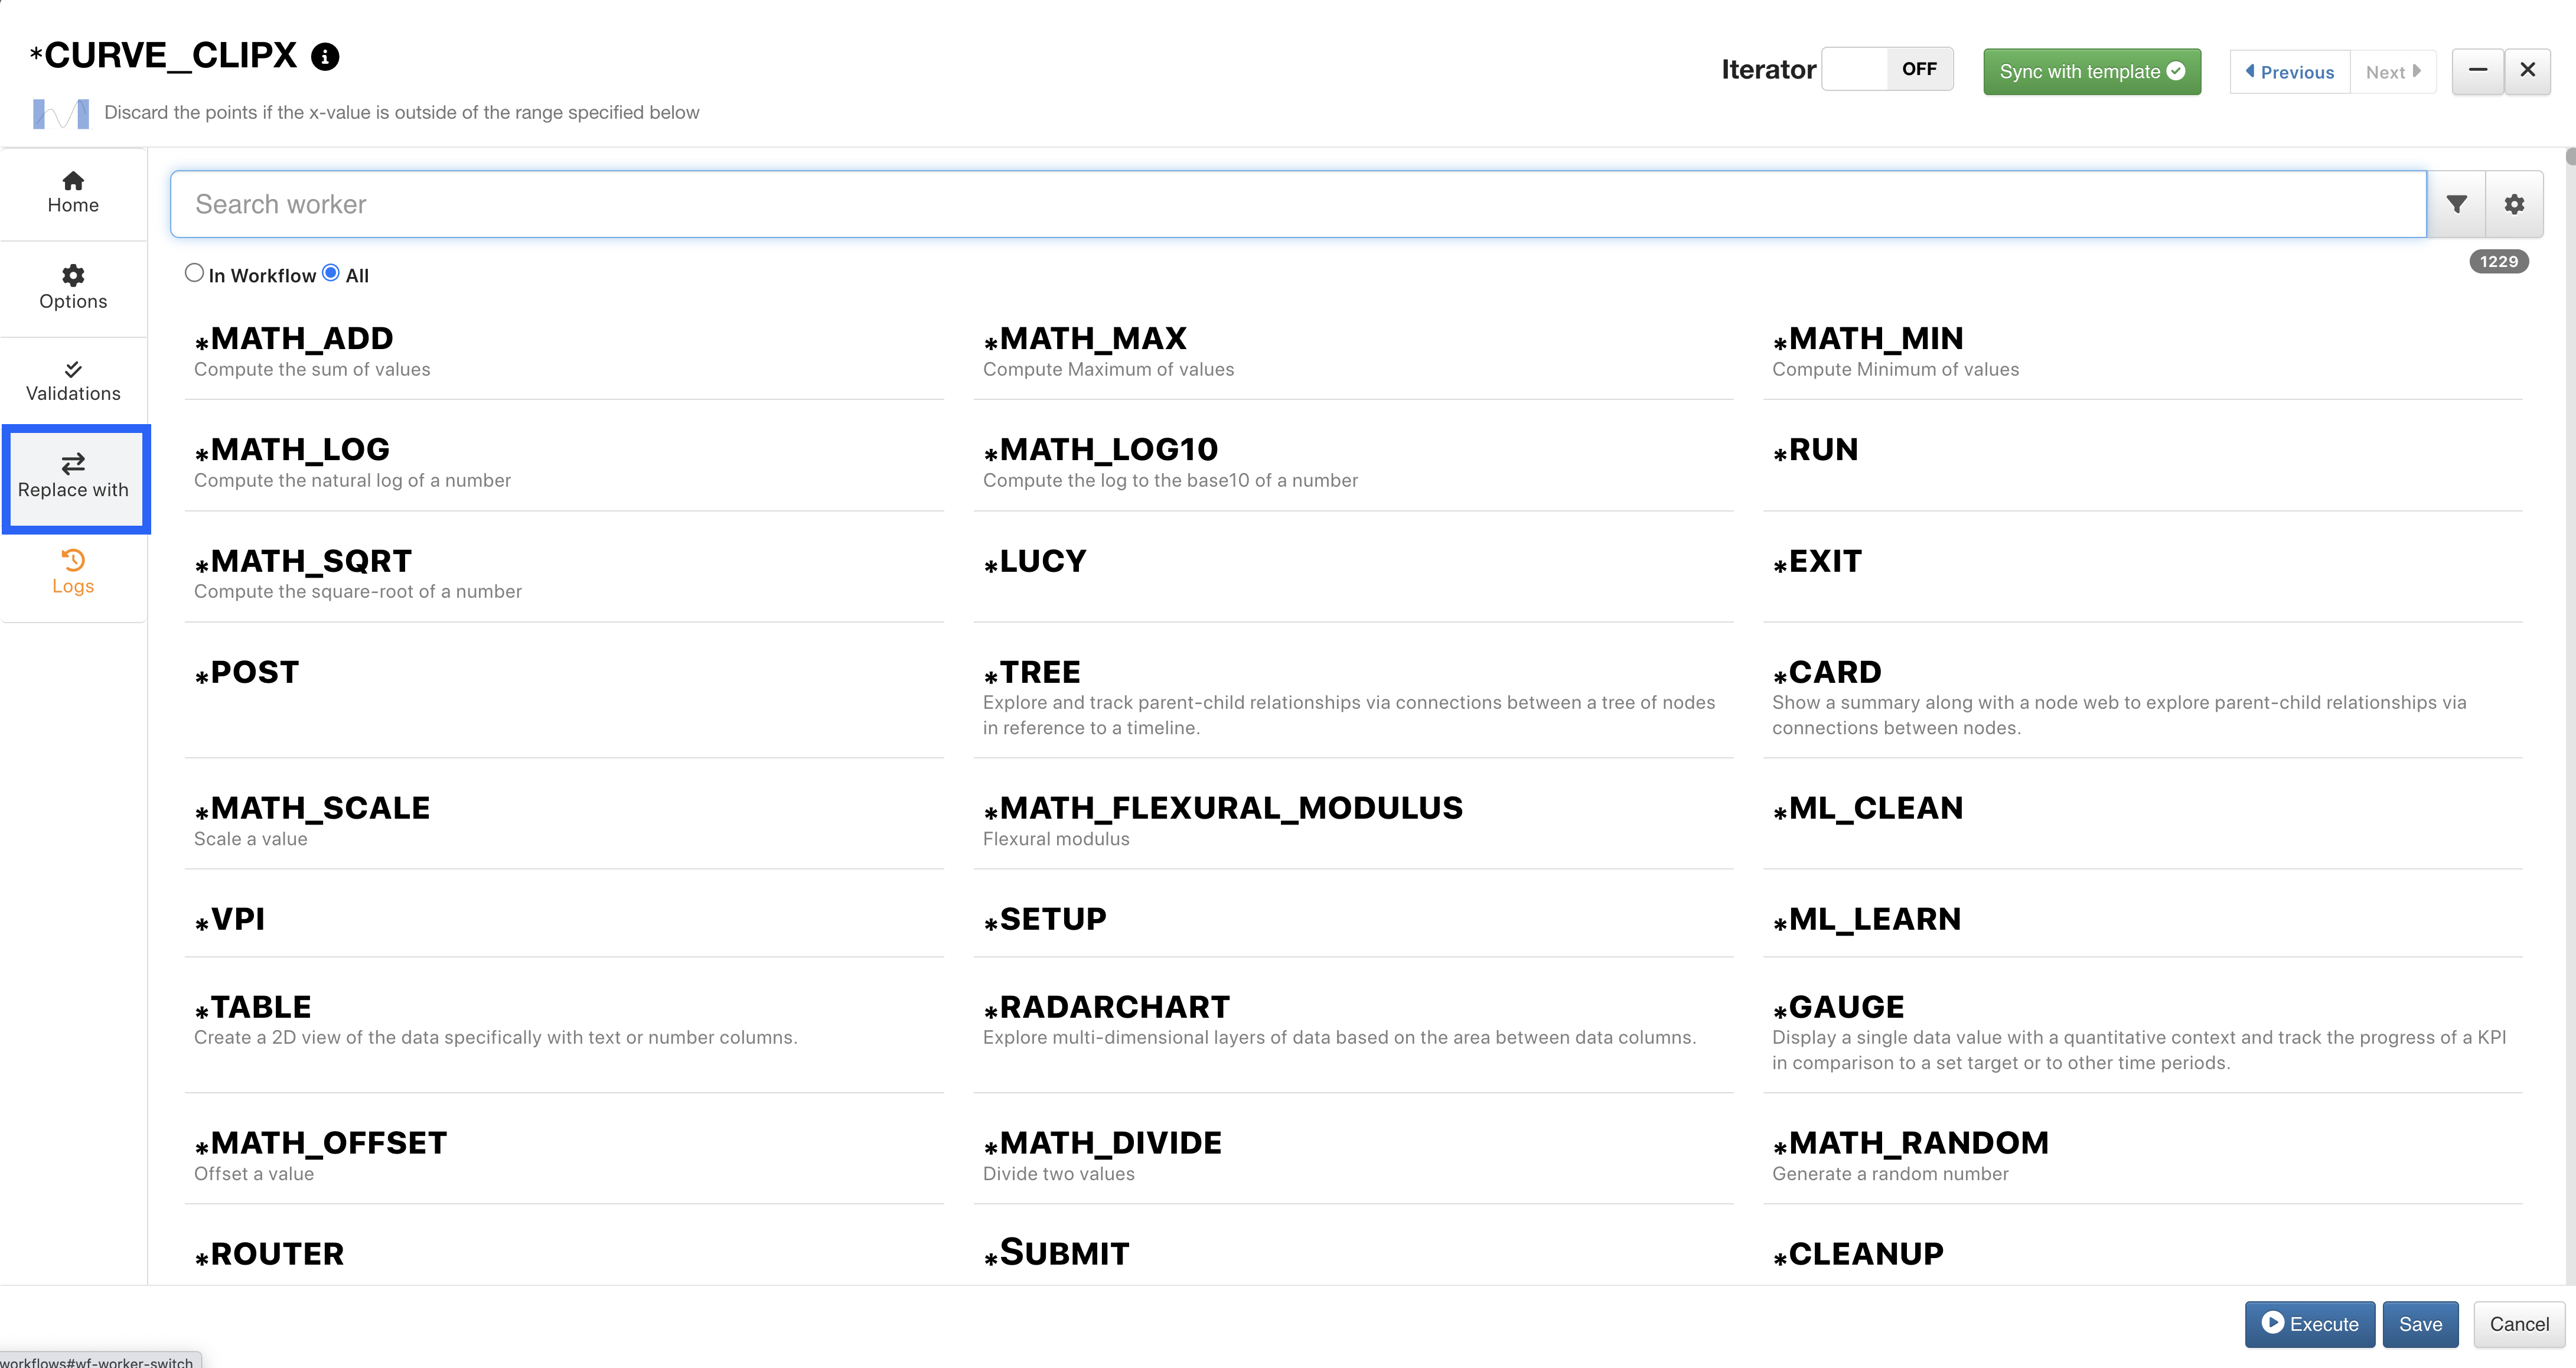
Figure 10: Replace With Tab
|flask| Test Execution
When configuring workers, we can execute the individual worker in the modal window to test it and eliminate any errors in our configuration:
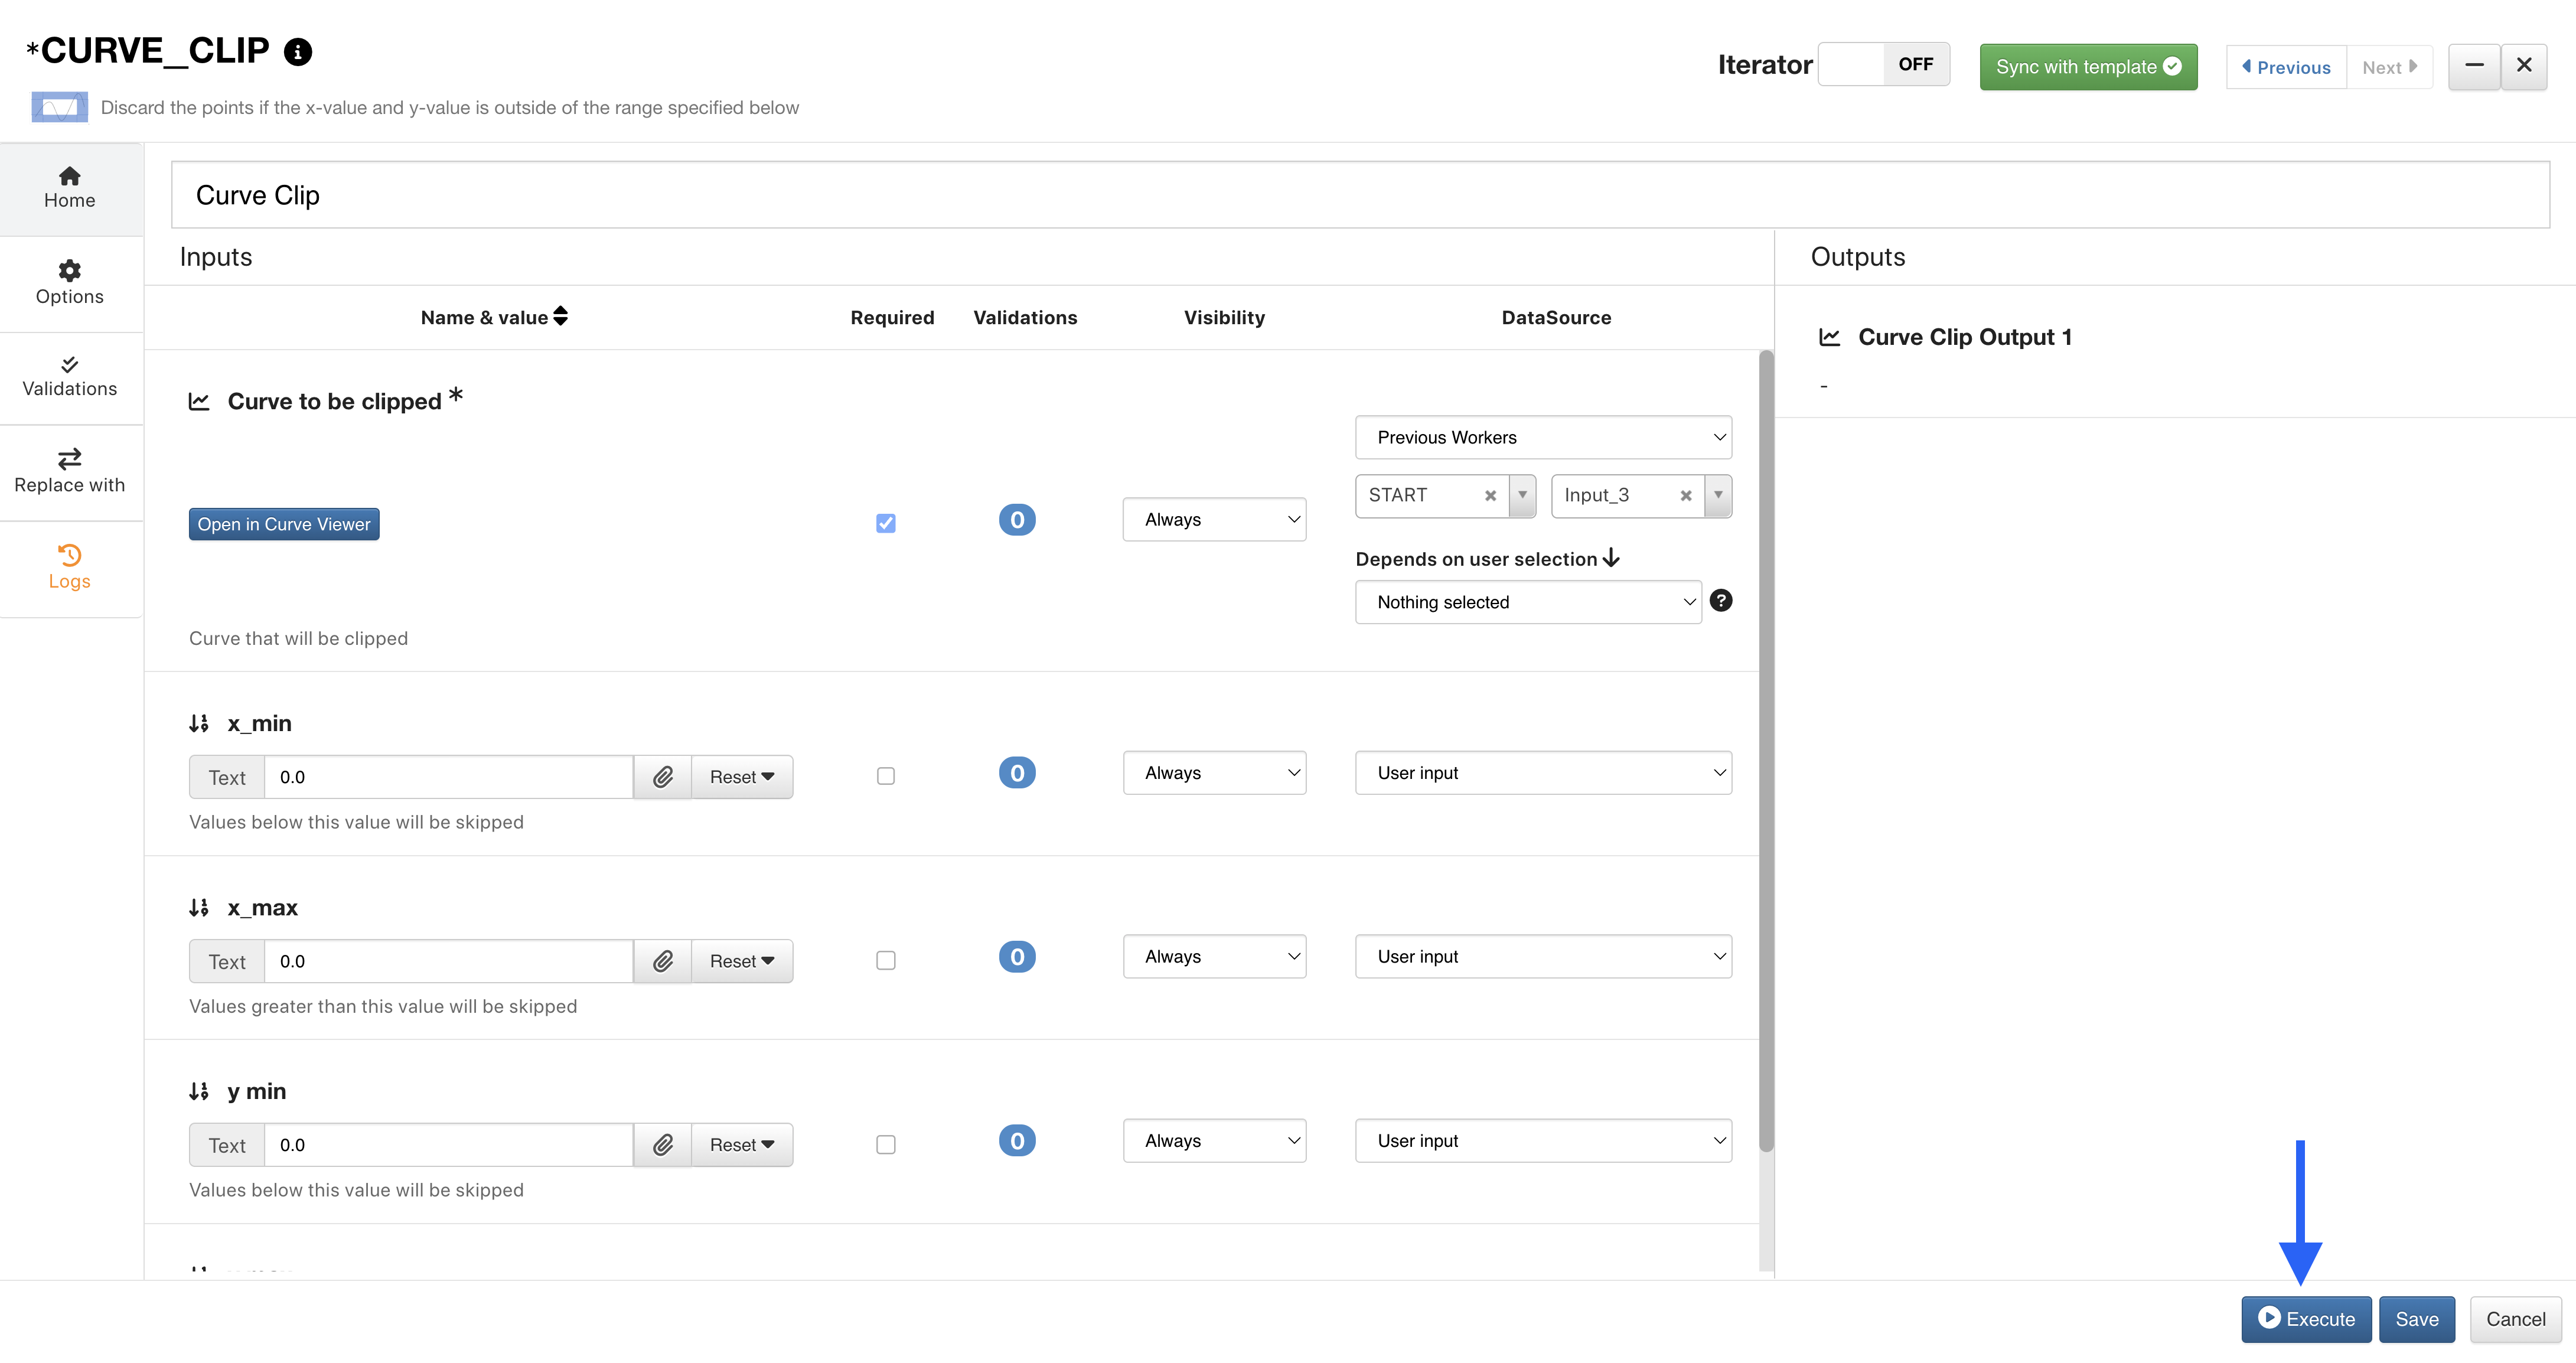
Figure 11: Test Execution
Docking the Configuration Window
New as of September, 2022, we can dock our worker configuration window to the right side so we can see our workflow.
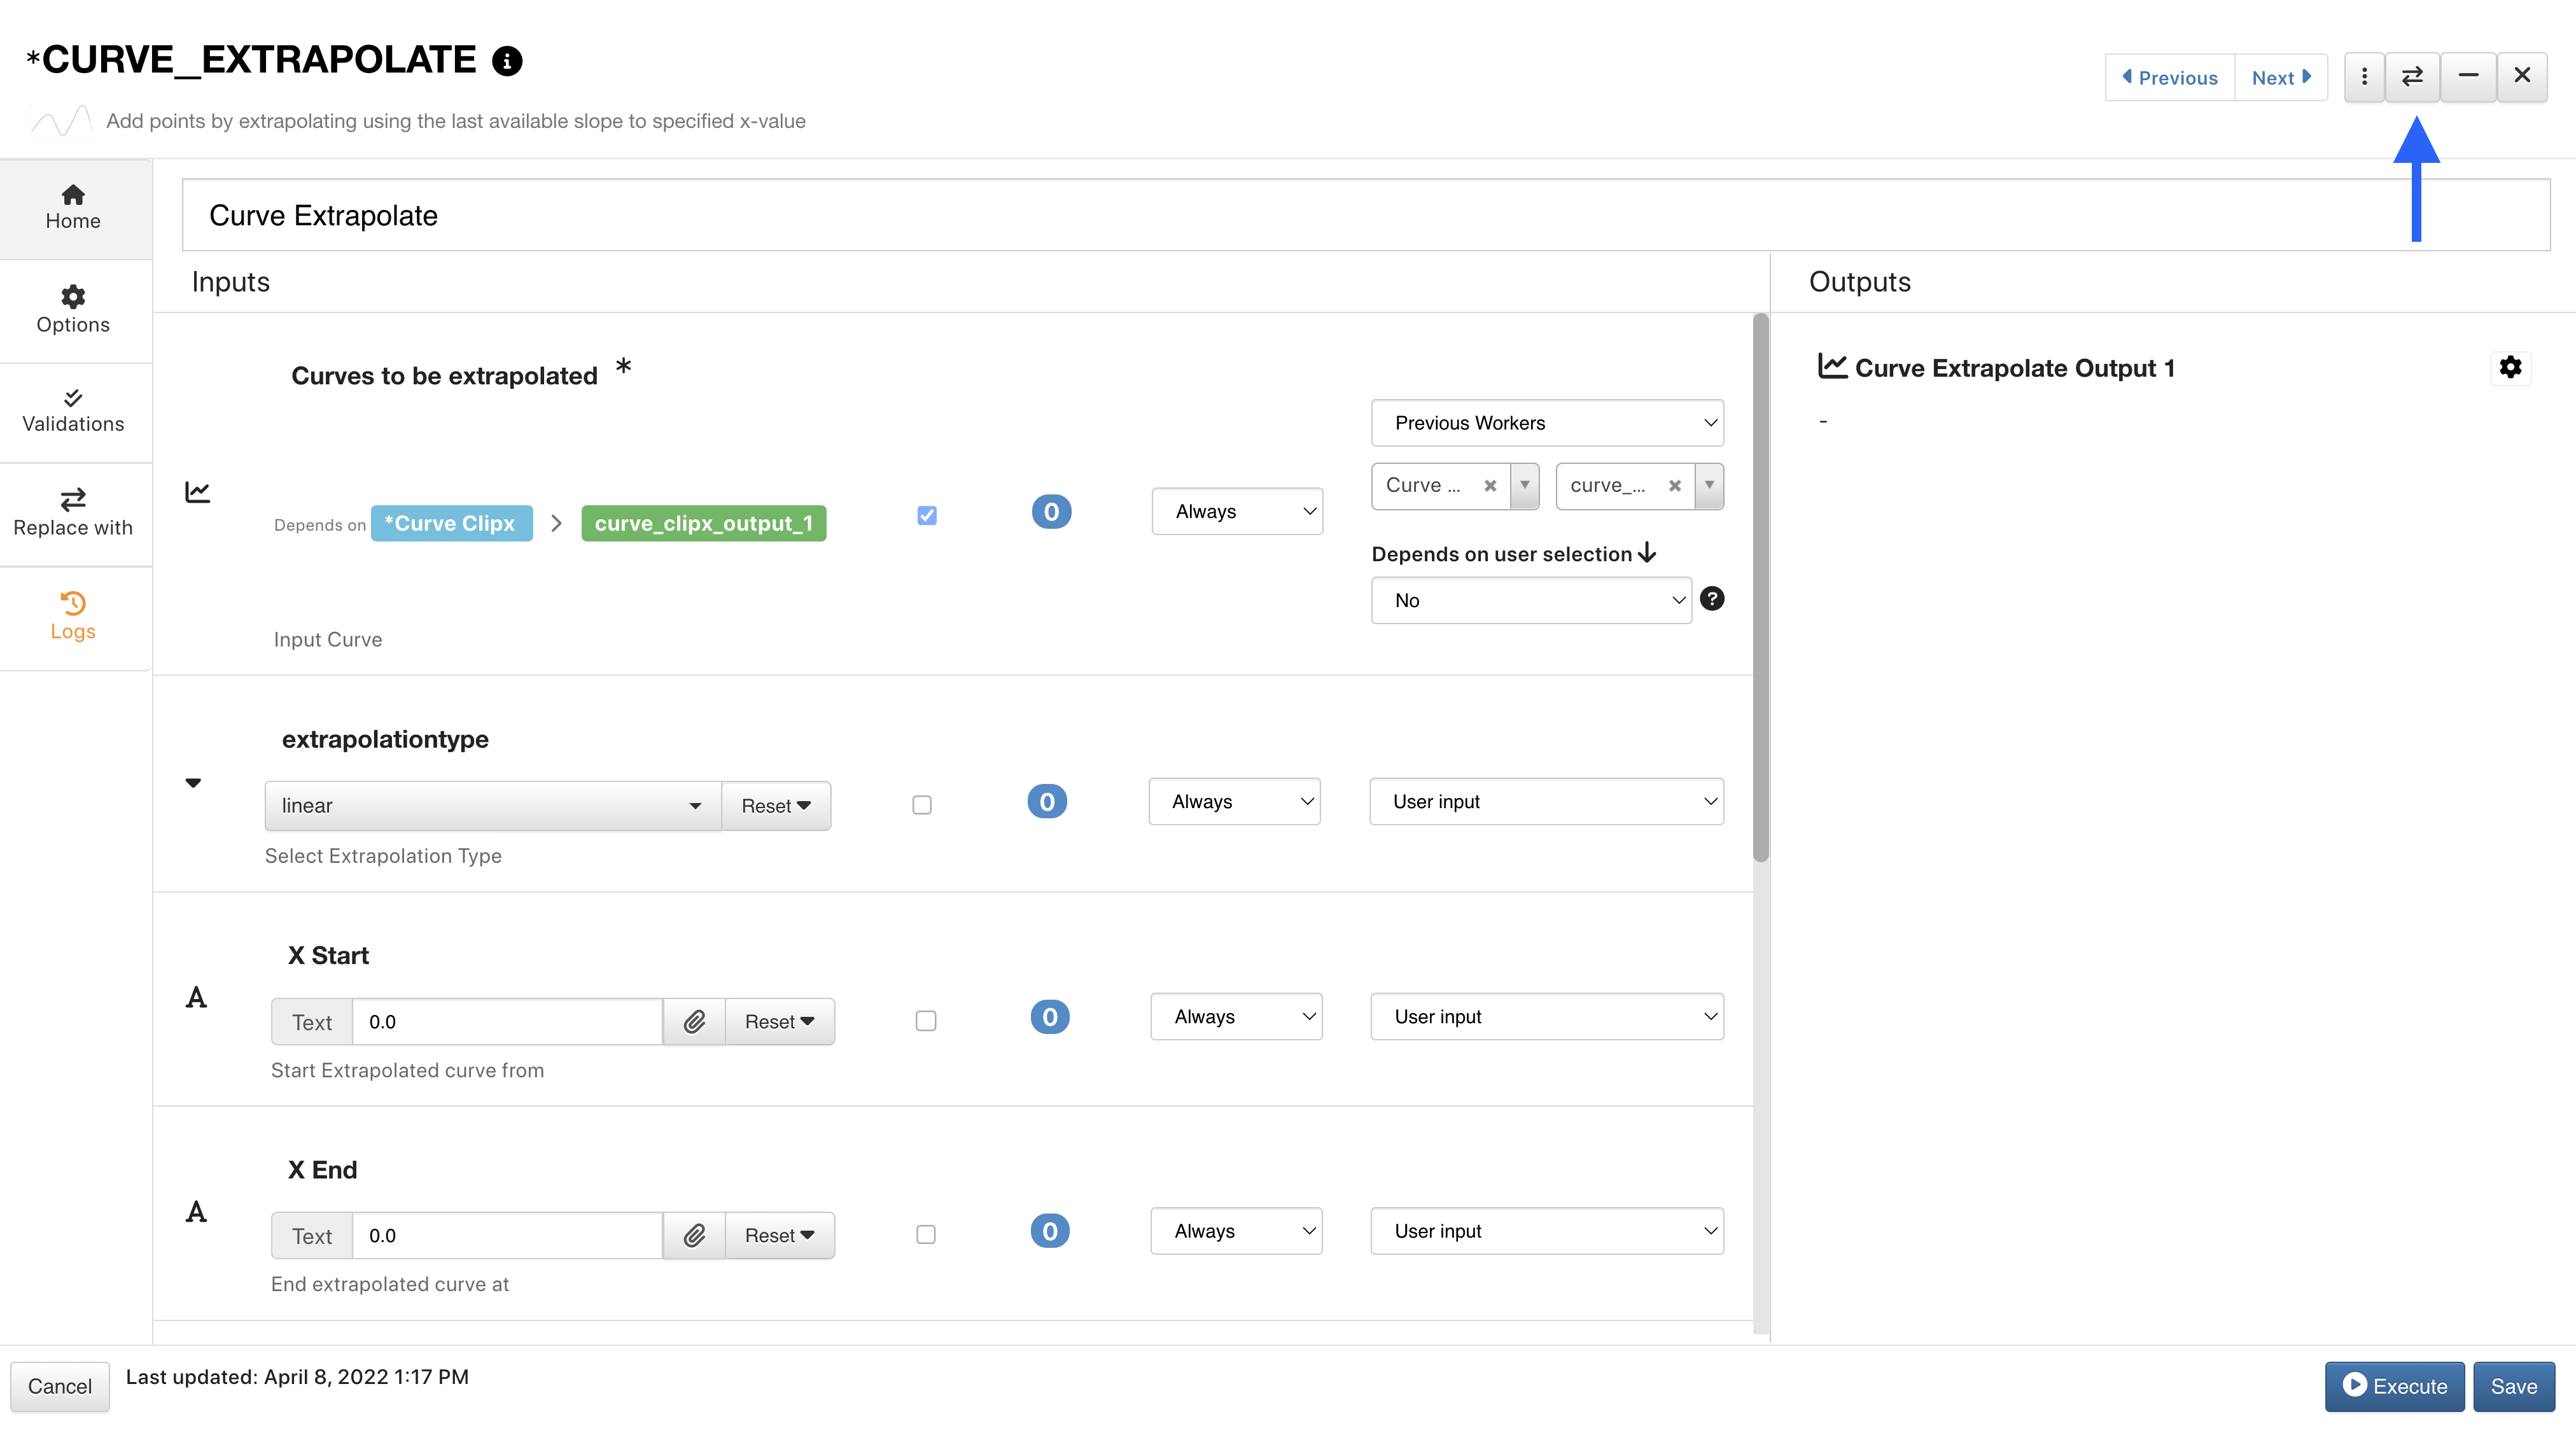
Figure 12: Dock the Worker Configuration Window
This is helpful for when we want to (re)configure a few different workers in a row. Especially in large workflows, docking can help us stay on track.
8.3. |wrench| Building Options and Tools
Let’s go over some capabilities for building the structure.
|arrows-h| Adding and Editing Connections
To connect workers together, click on a node (or side) of one worker and drag the line to one node of another worker. Click on the ending node to fully close the connection.
Right-click on a worker connection to delete it.
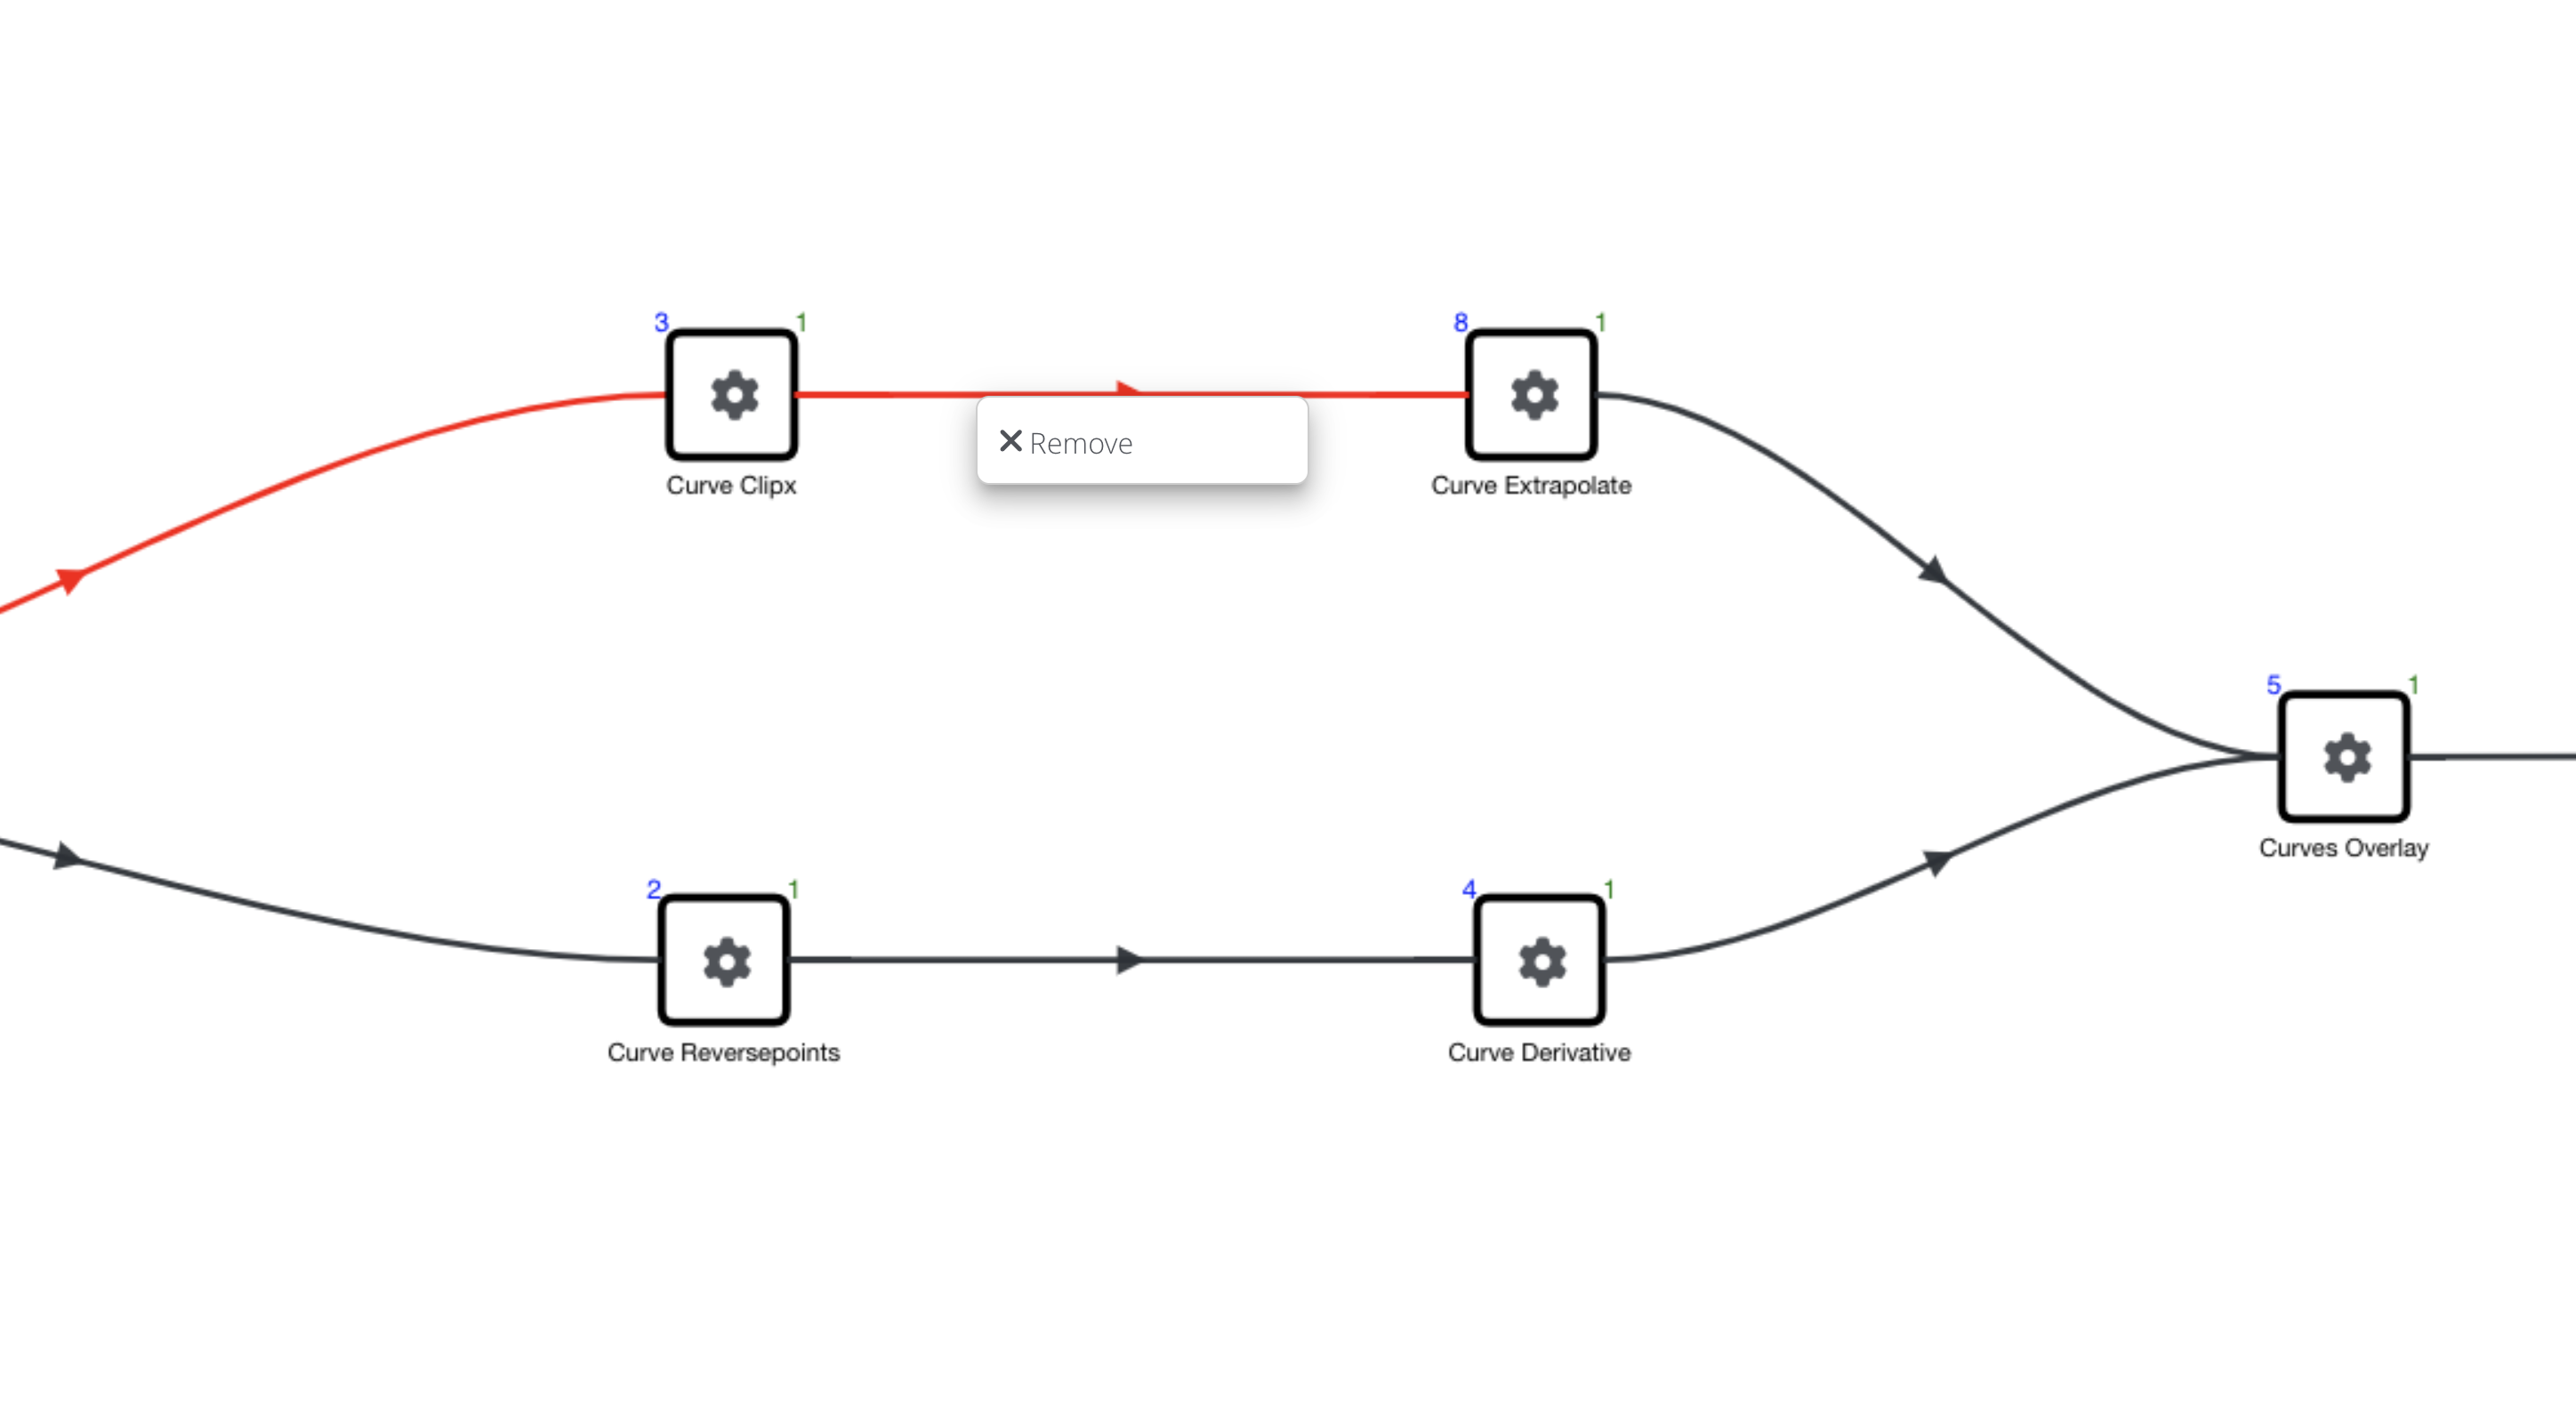
Figure 13: Delete Worker Line
Here is a video showing it in action:
|cog| Worker Options
View all worker options by right-clicking on it. Editing option will be under the pencil tab (bottom of menu). Here, we can perform actions like cloning the worker, editing it, unlinking its lines or deleting it.
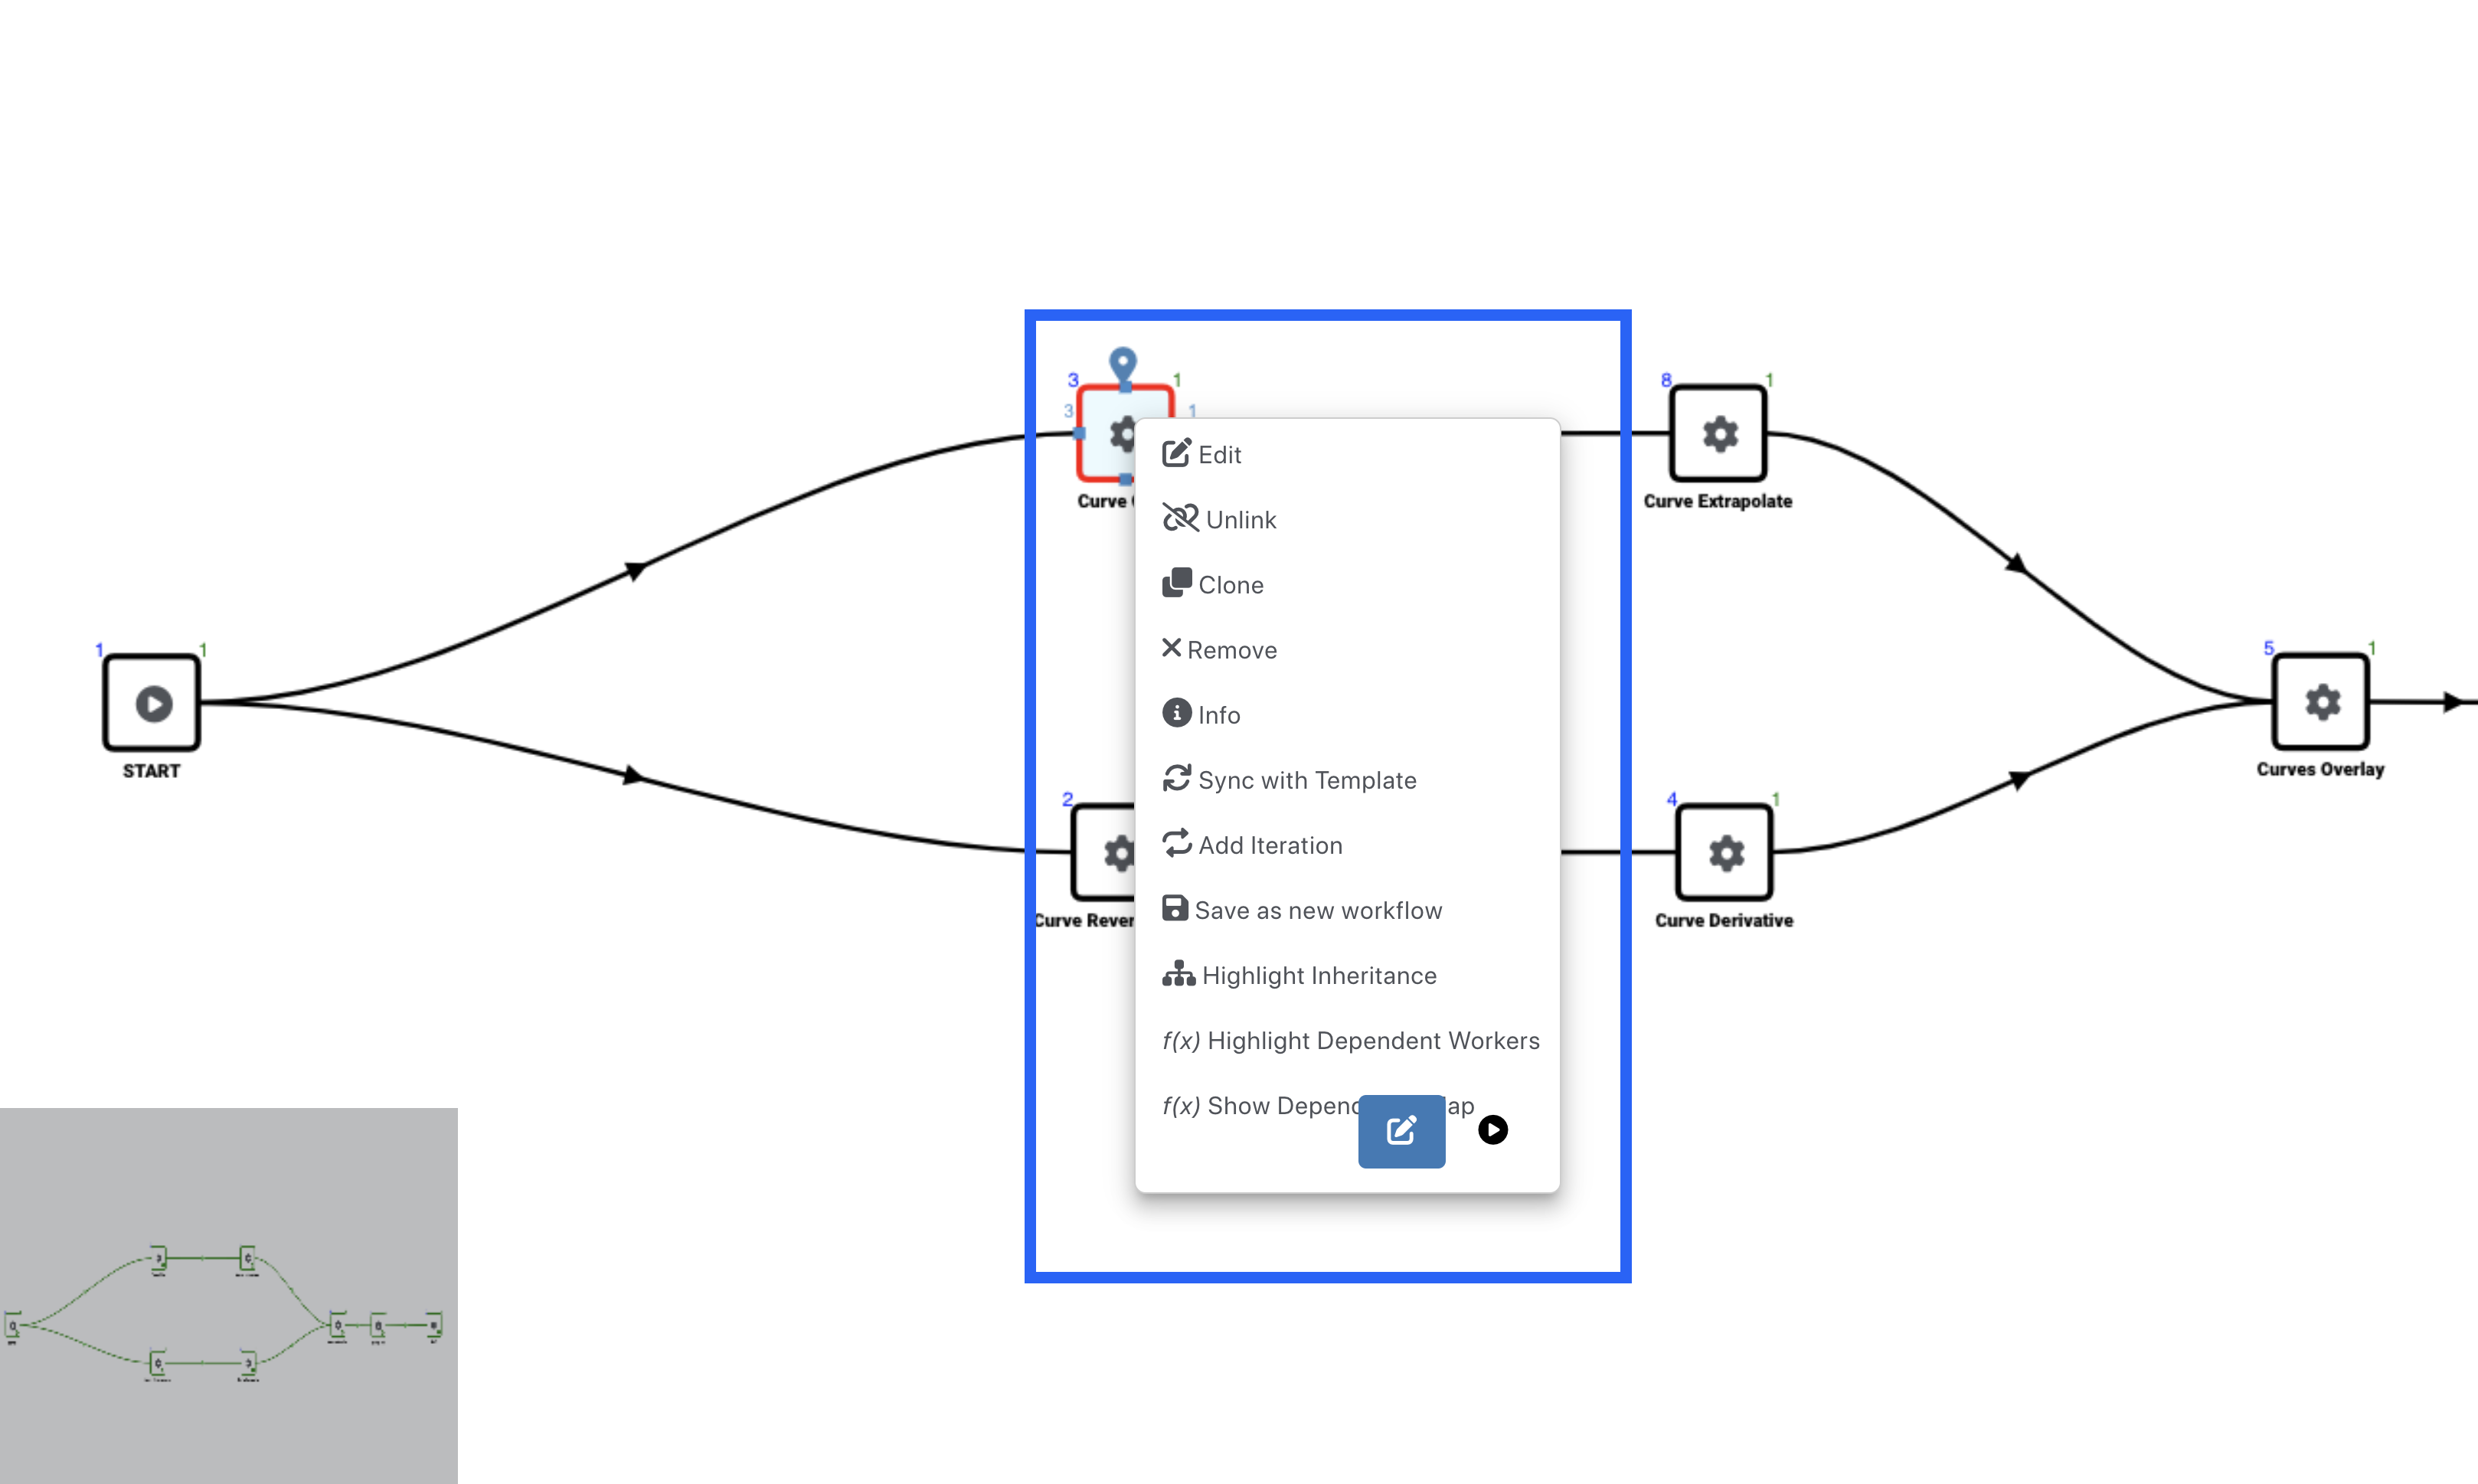
Figure 14: Worker Right-Click Options
|mouse-pointer| Multi-Select
With the bottom-left multi-select button turned on, we can select more than worker. Now when we right-click, we can remove or clone all selected workers, save them as a new workflow and even sync them with a template.
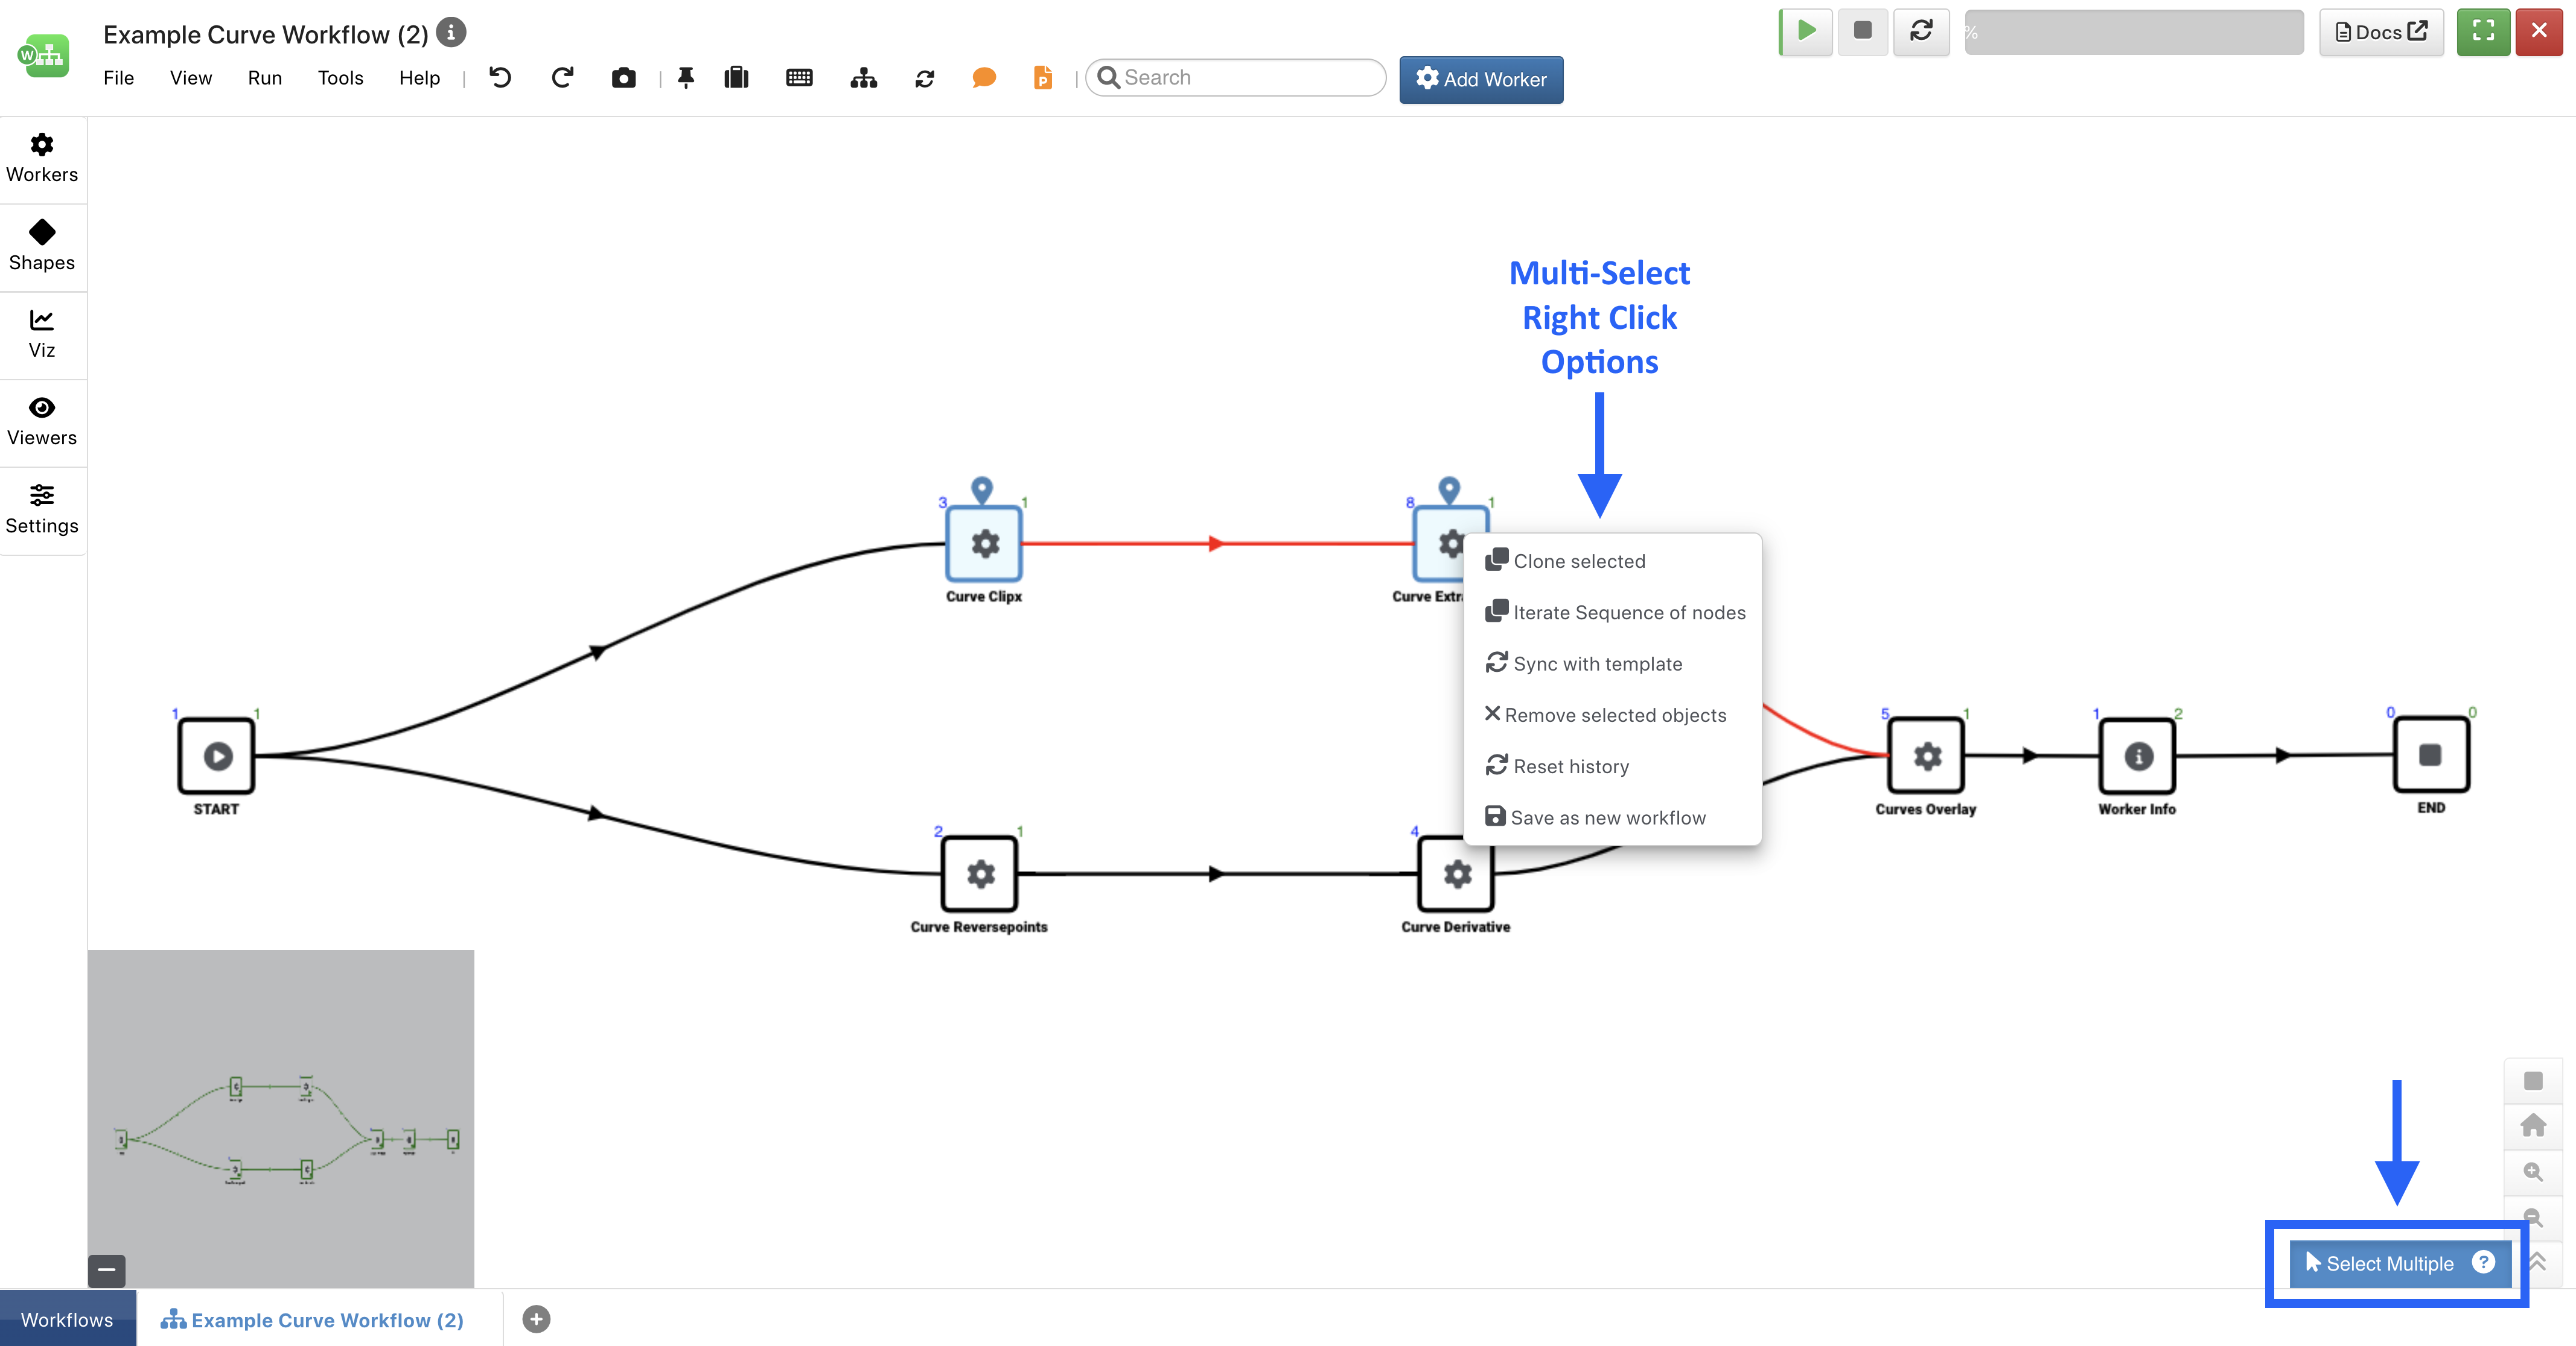
Figure 15: Multi-Select Right-Click
8.4. |question| Decision Workers
We use decision workers to simply make decisions on how to further execute a workflow. We set up validations that continue the workflow based on if a previous worker met a certain requirement.
Decision Worker
To set up a basic decision worker, open the shapes menu and click and drag the decision worker on the workflow. Click on the worker to configure it. Add a row and set up the scope of the validation based on previous worker outputs, operation type and value. Under the options tab, make any desired setting adjustments. Hit save to finish. Watch the following video to see it in action.
New as of October, 2022, decision workers have an option to detect for null numerical values as shown in the following image:
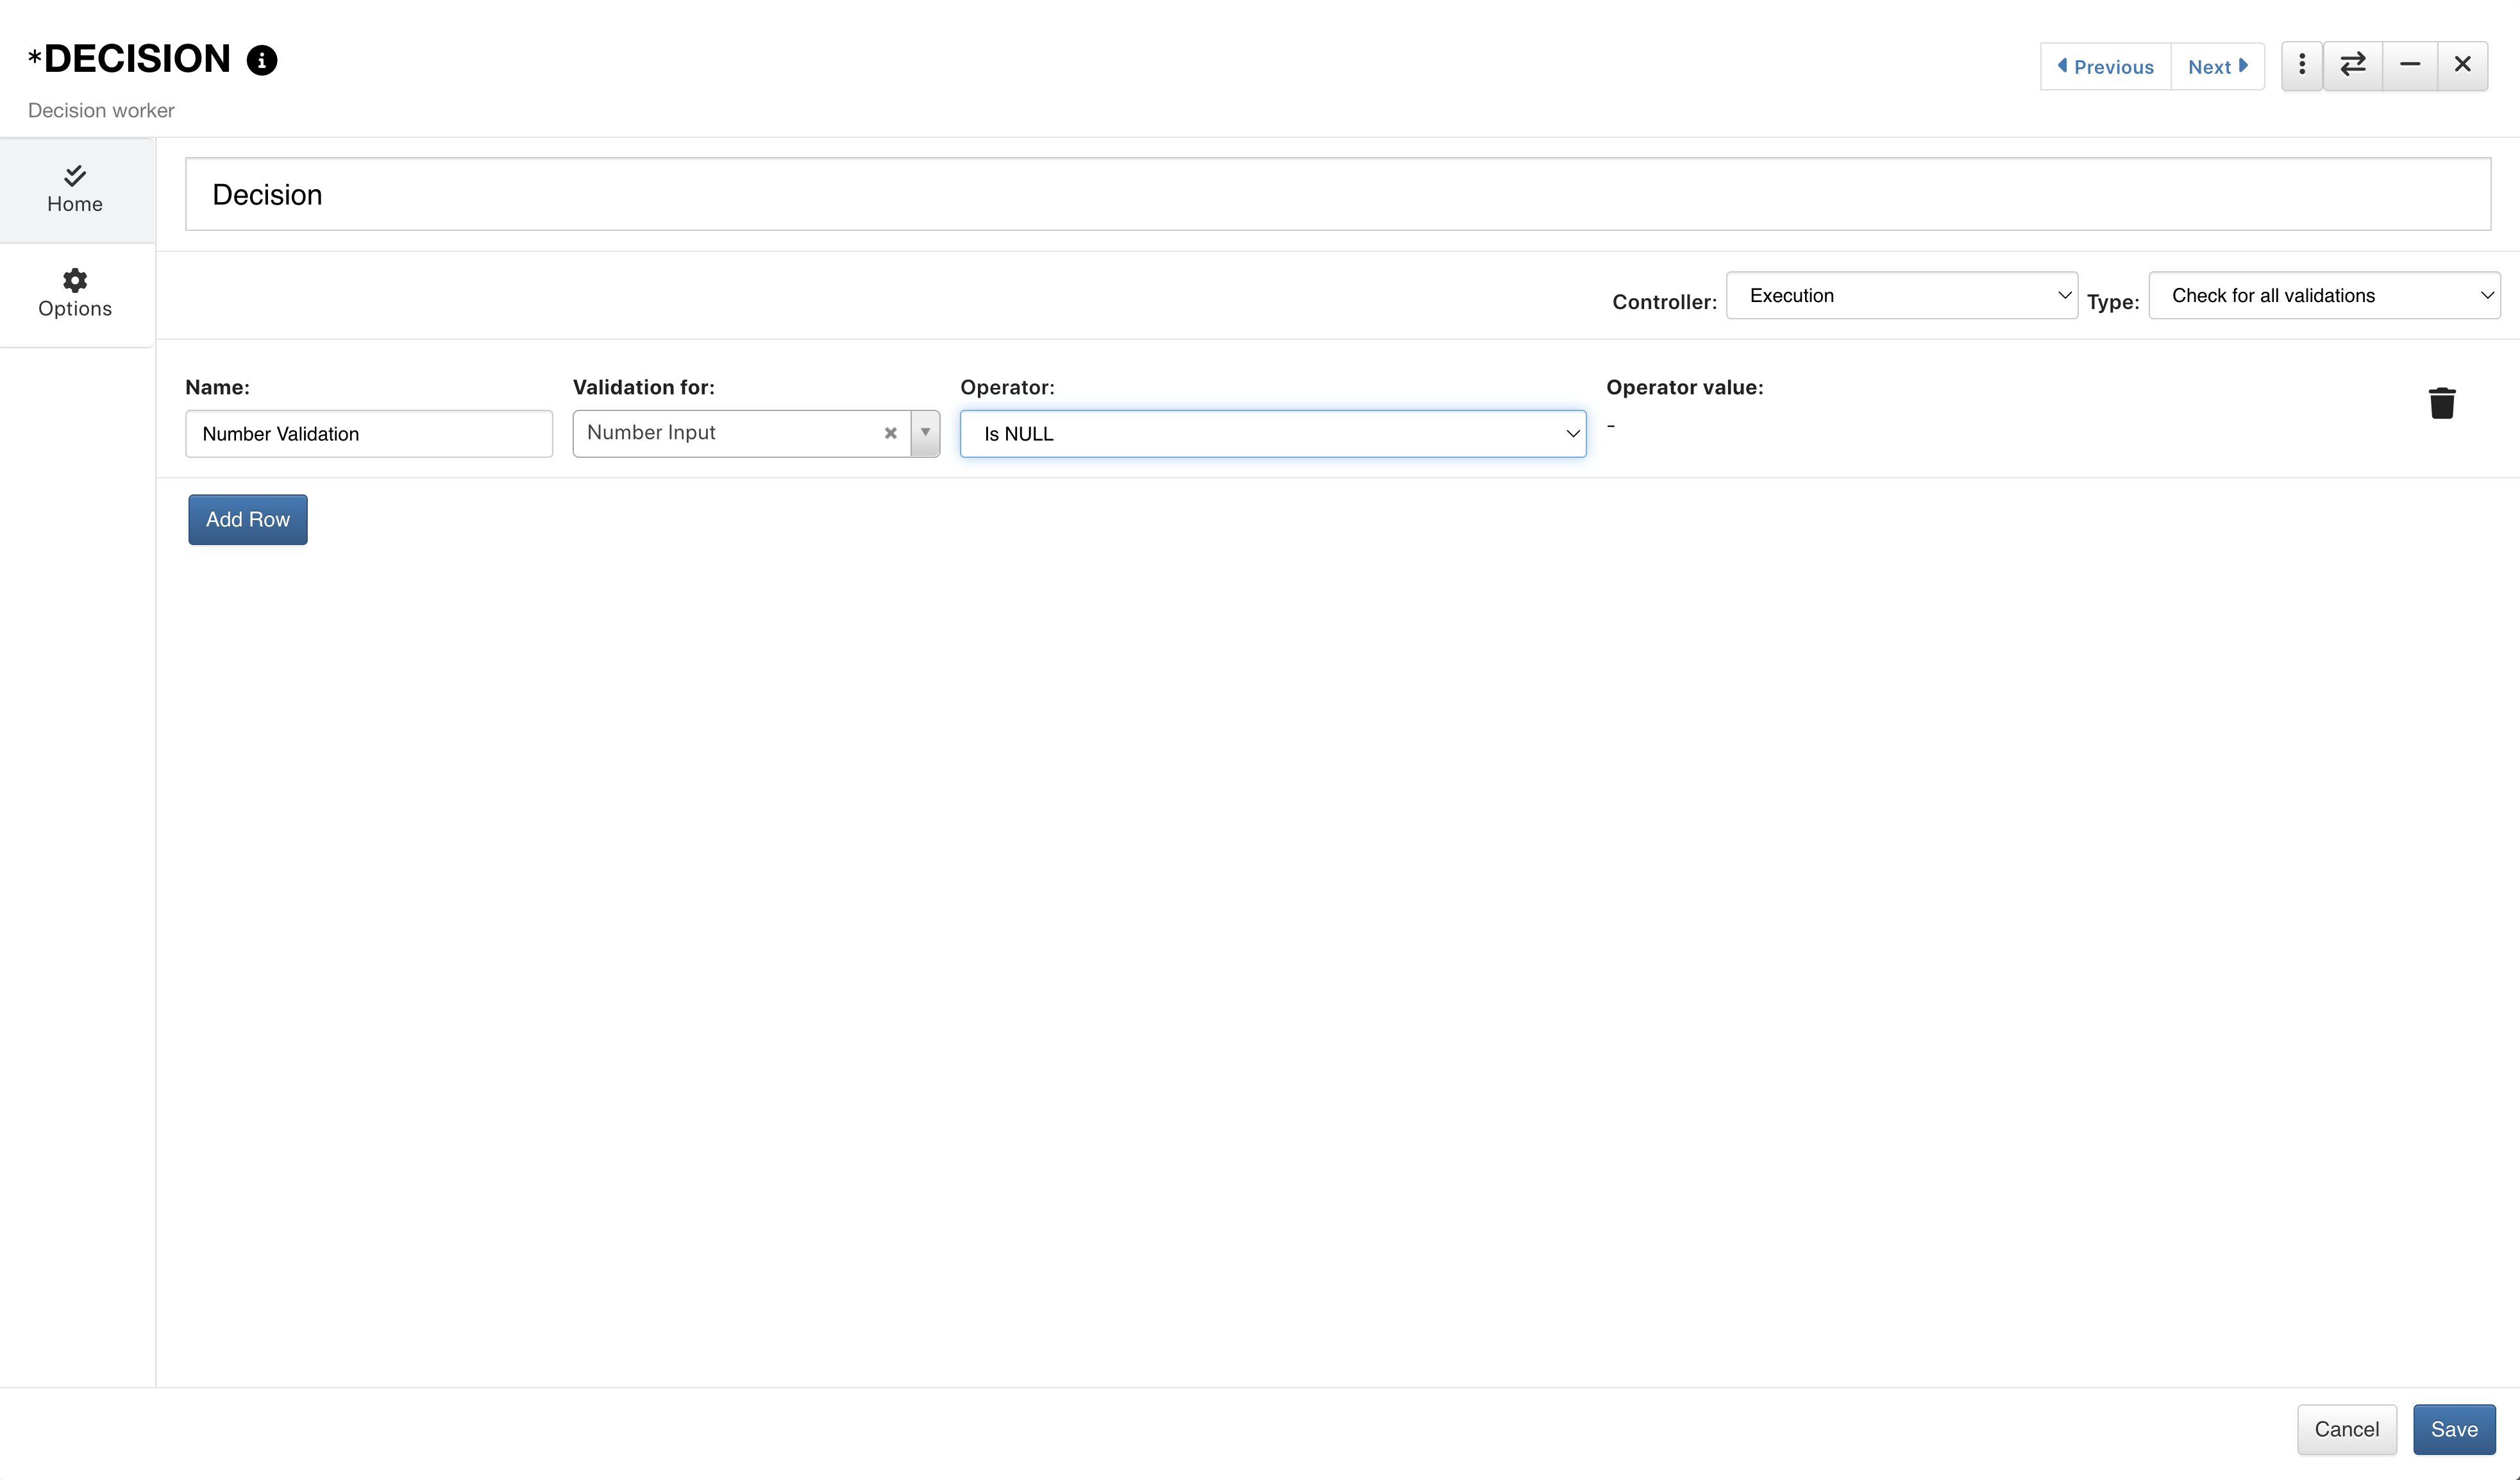
Figure 16: NULL Value Option for Decision
Decision Hub
Decision Hubs allow for multiple lines of decisions, working great for integrate workflows that execute multiple data loops.
Add a decision hub from the Shapes menu in the left side panel options.
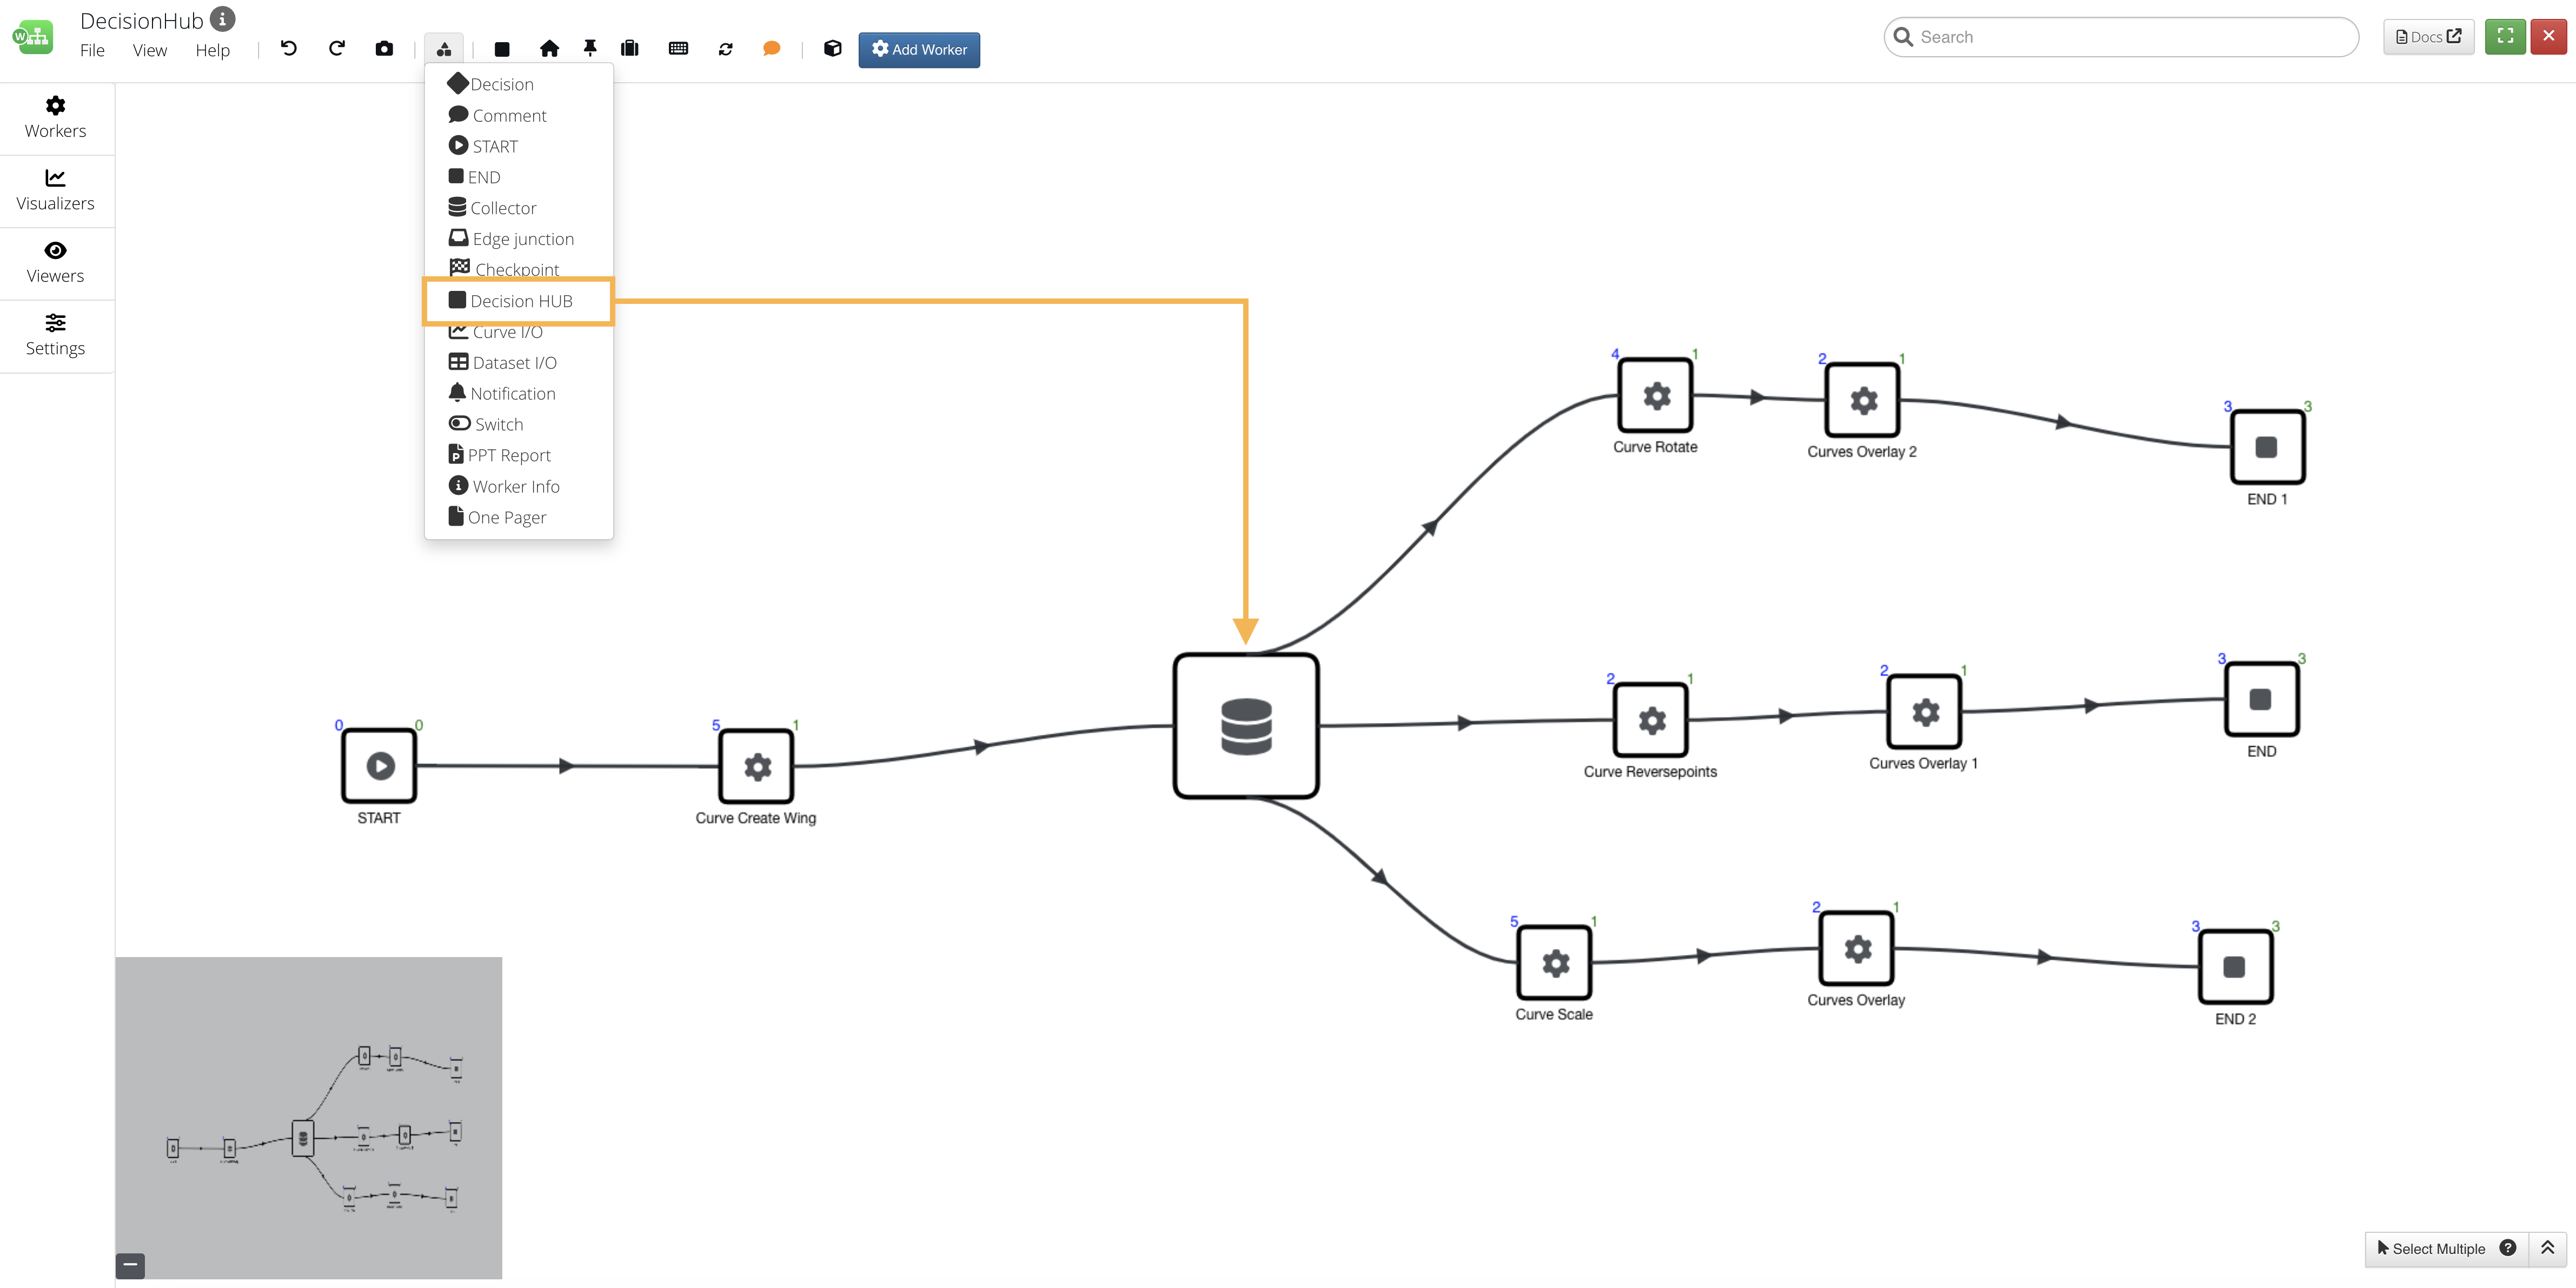
Figure 17: Add Decision Hub
|check| Configuring
Click on the decision hub to start configuring it. From here, we’ll make sure to choose the max amount of iterations in the input tab.
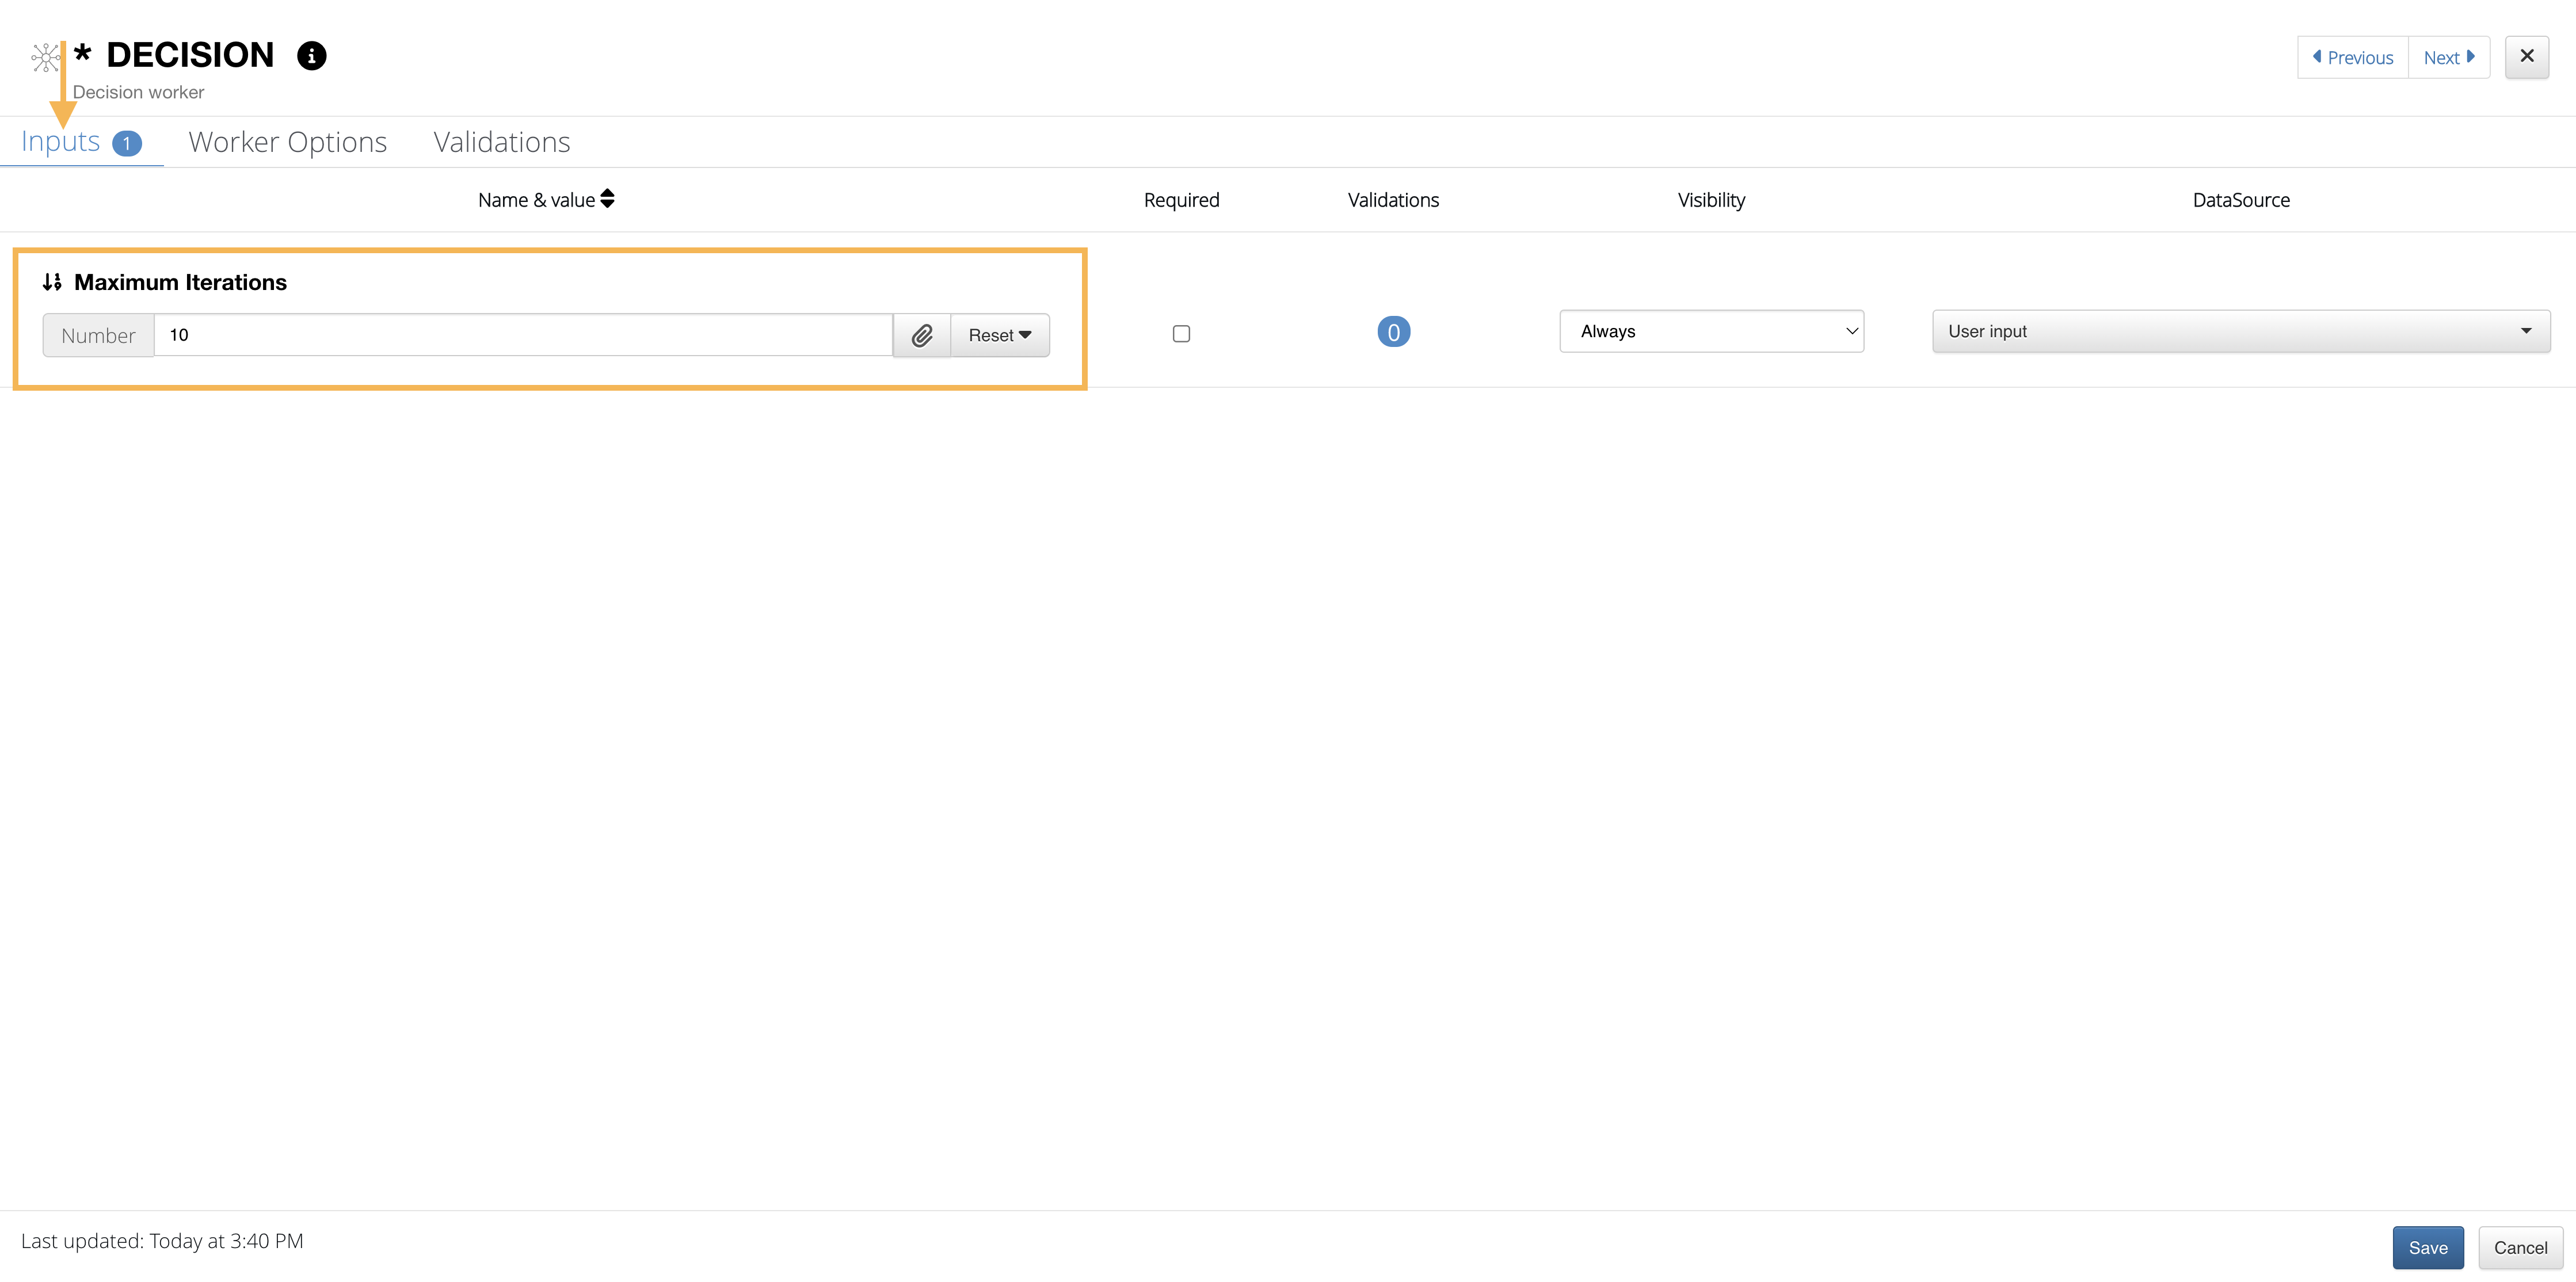
Figure 18: Input Tab
Then, we’ll click over to the validations tab to tell the decision worker how to continue the worker execution. At the top, we’ll make sure to choose a worker if the workflow does not meet any of the validation requirements. Then, we’ll add rows to populate our validations.
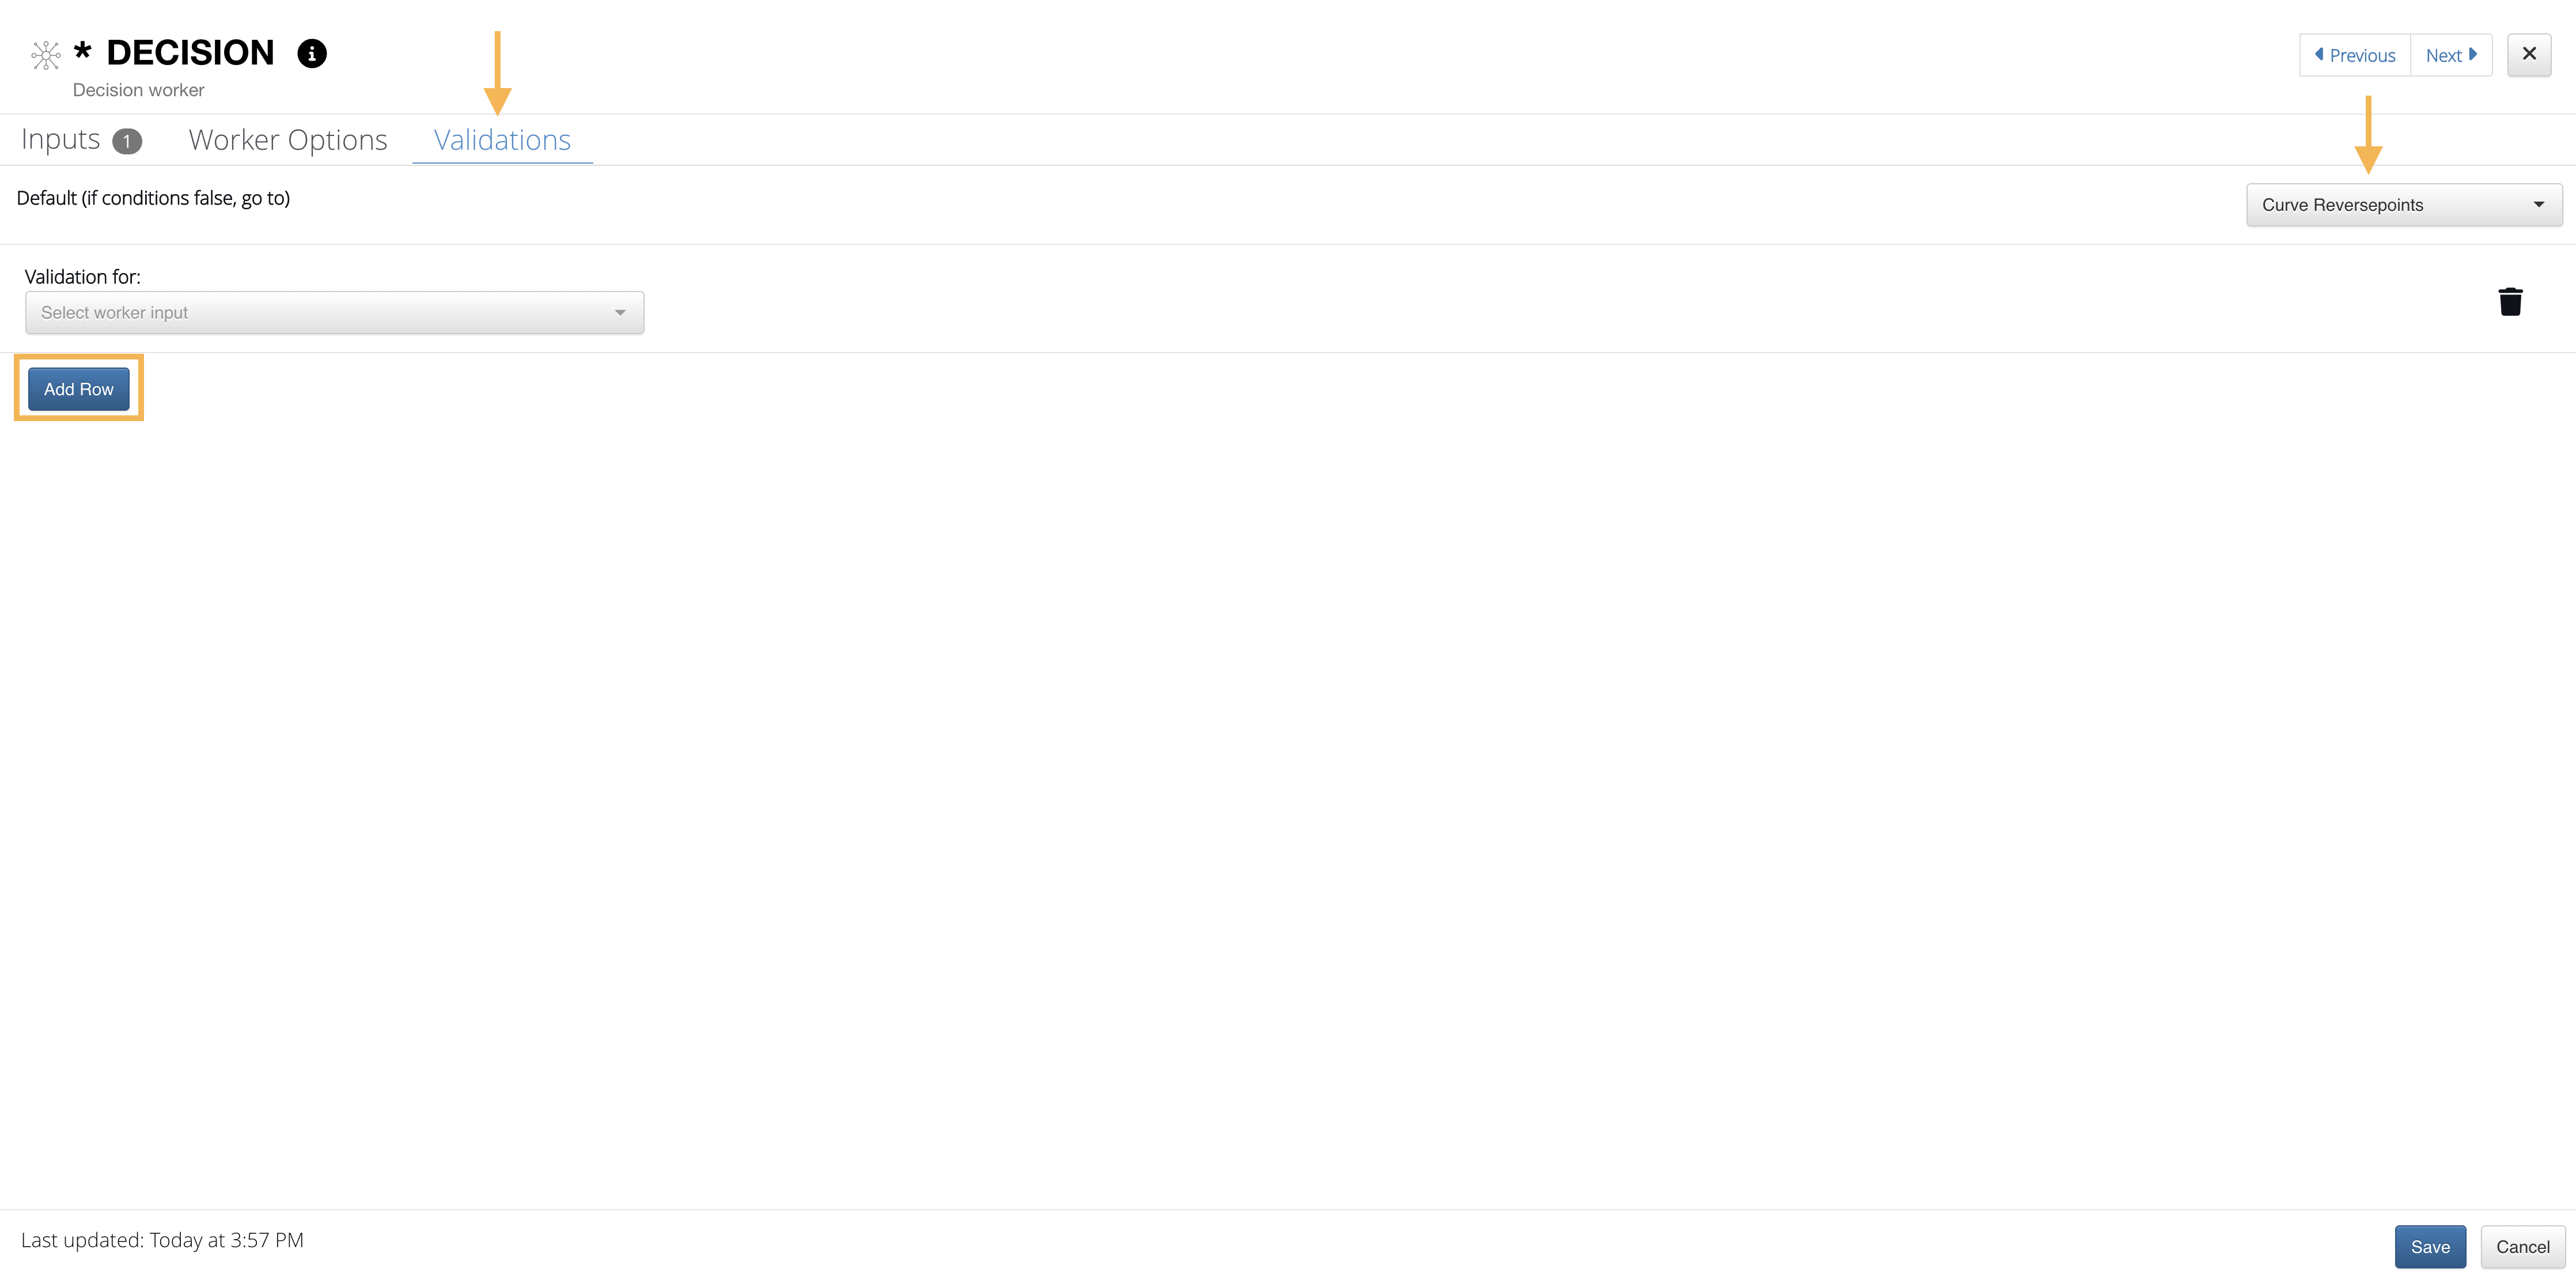
Figure 19: Add Rows
Here is how we’ve set up the validations for our decision hub. We’ve chosen different qualifications for Y max and specified the next worker if the previous worker output meets these requirements. This is how the decision hub will decide which worker to execute next in the workflow.
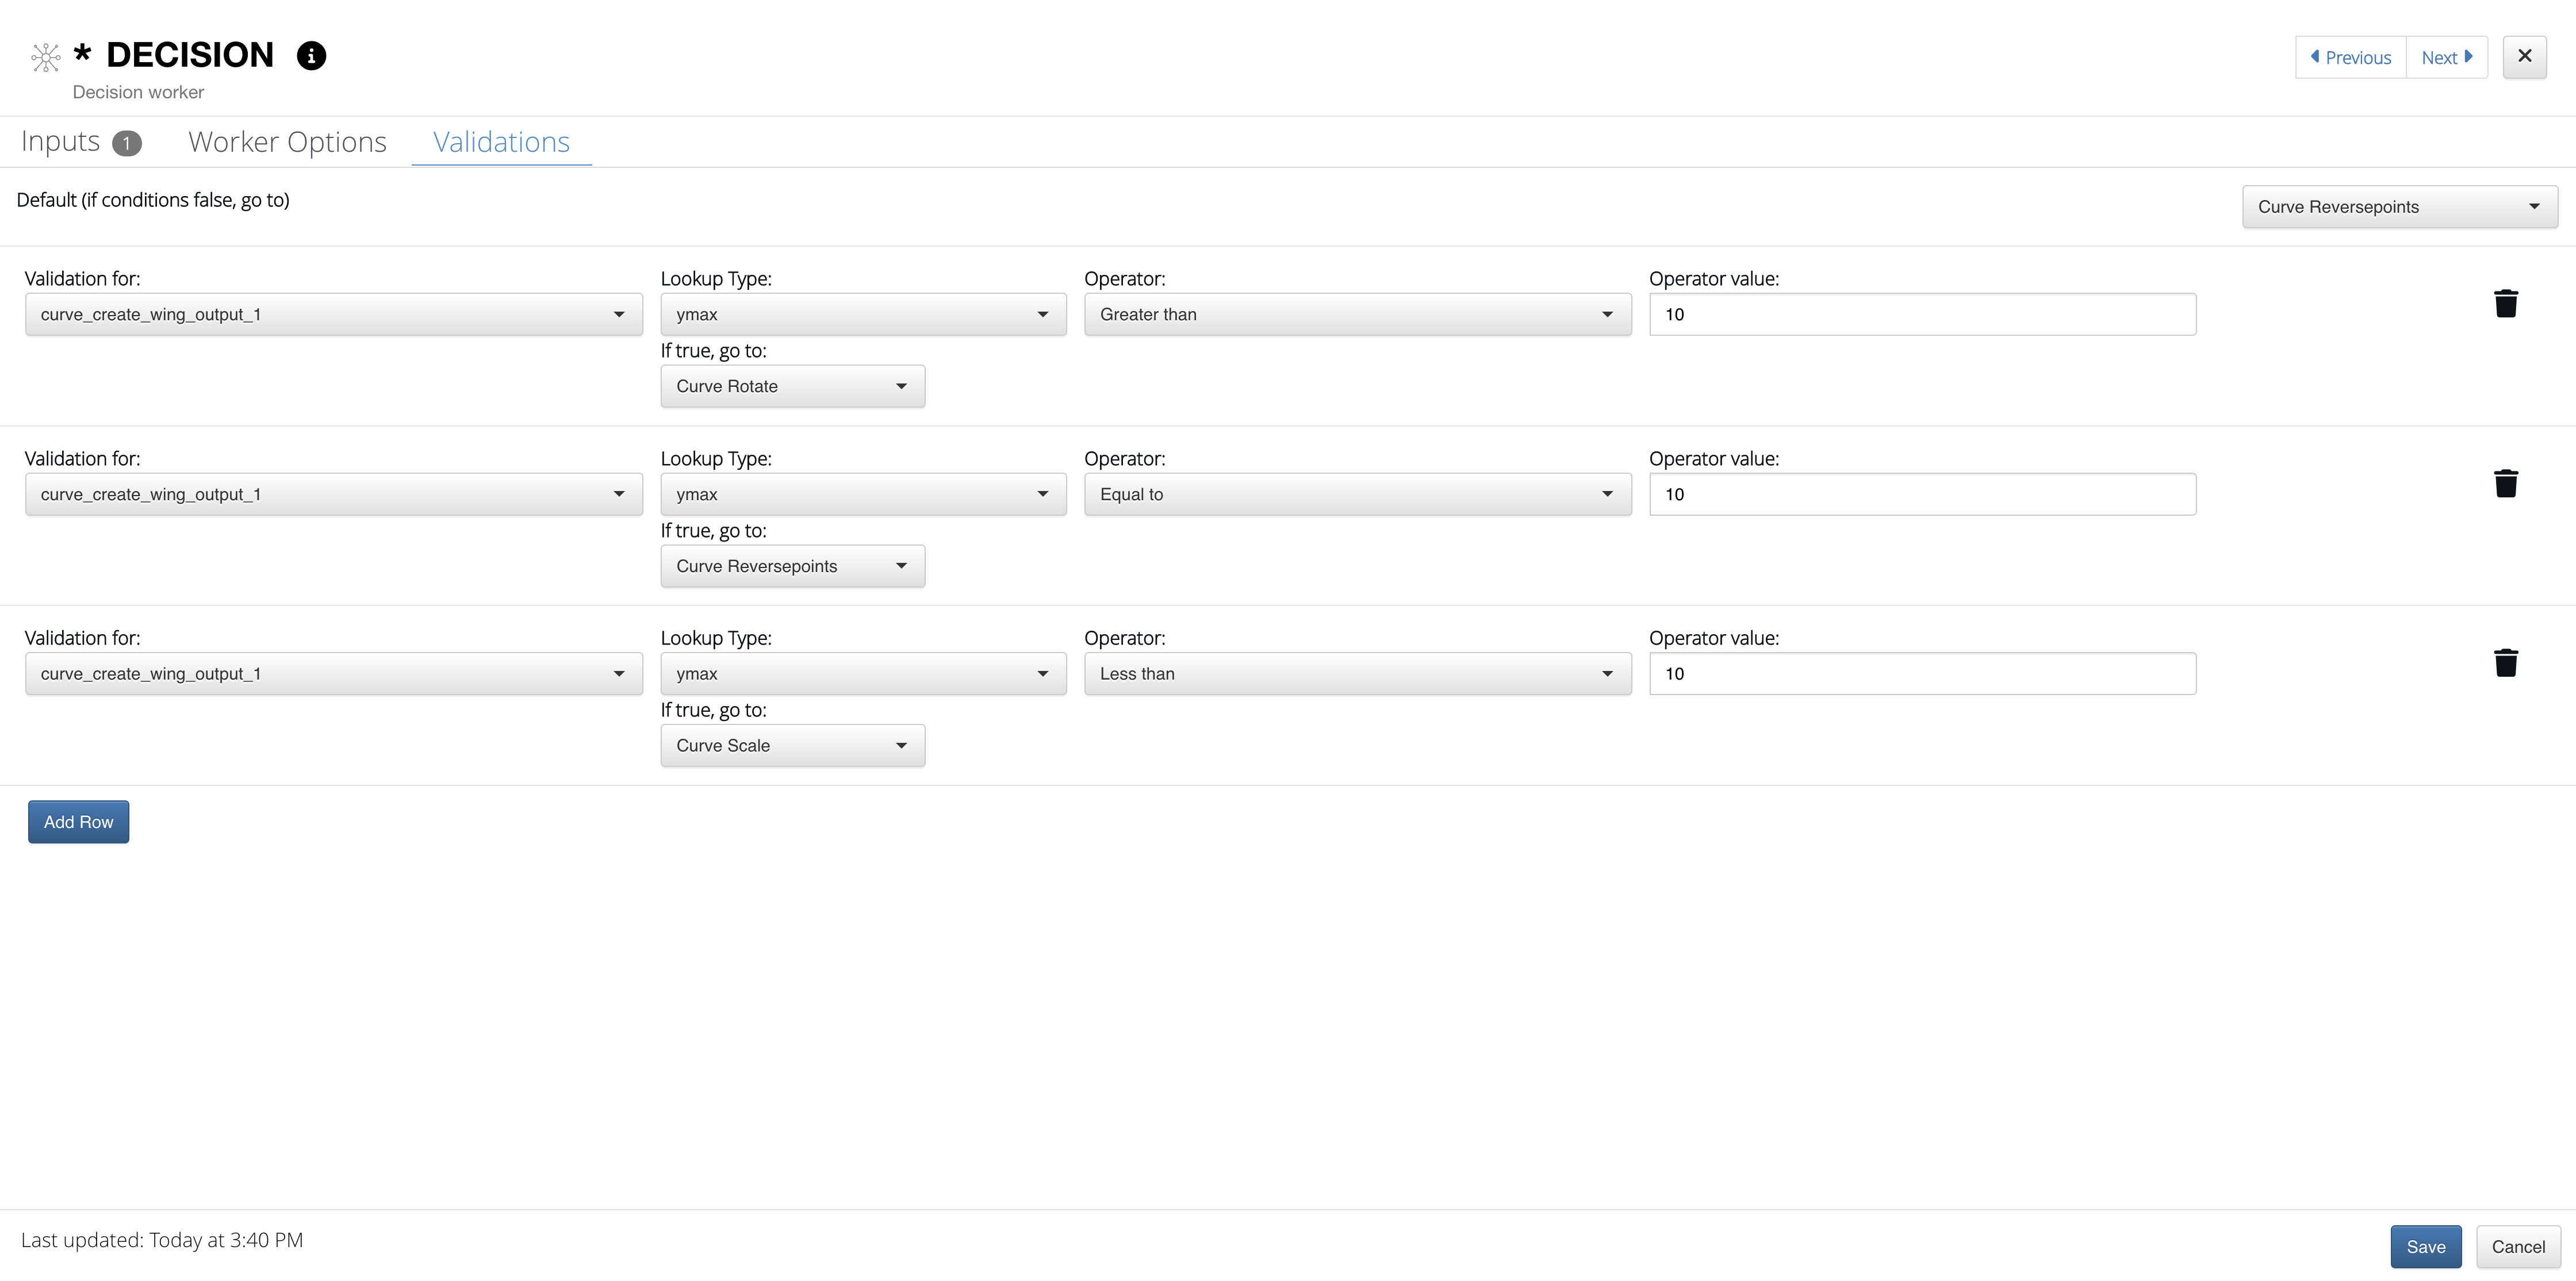
Figure 20: Worker Validations
Here is how the workflow may execute with a decision hub. The hub choose Curve Reverse Points to execute which resulted in a full execution of the middle path only.
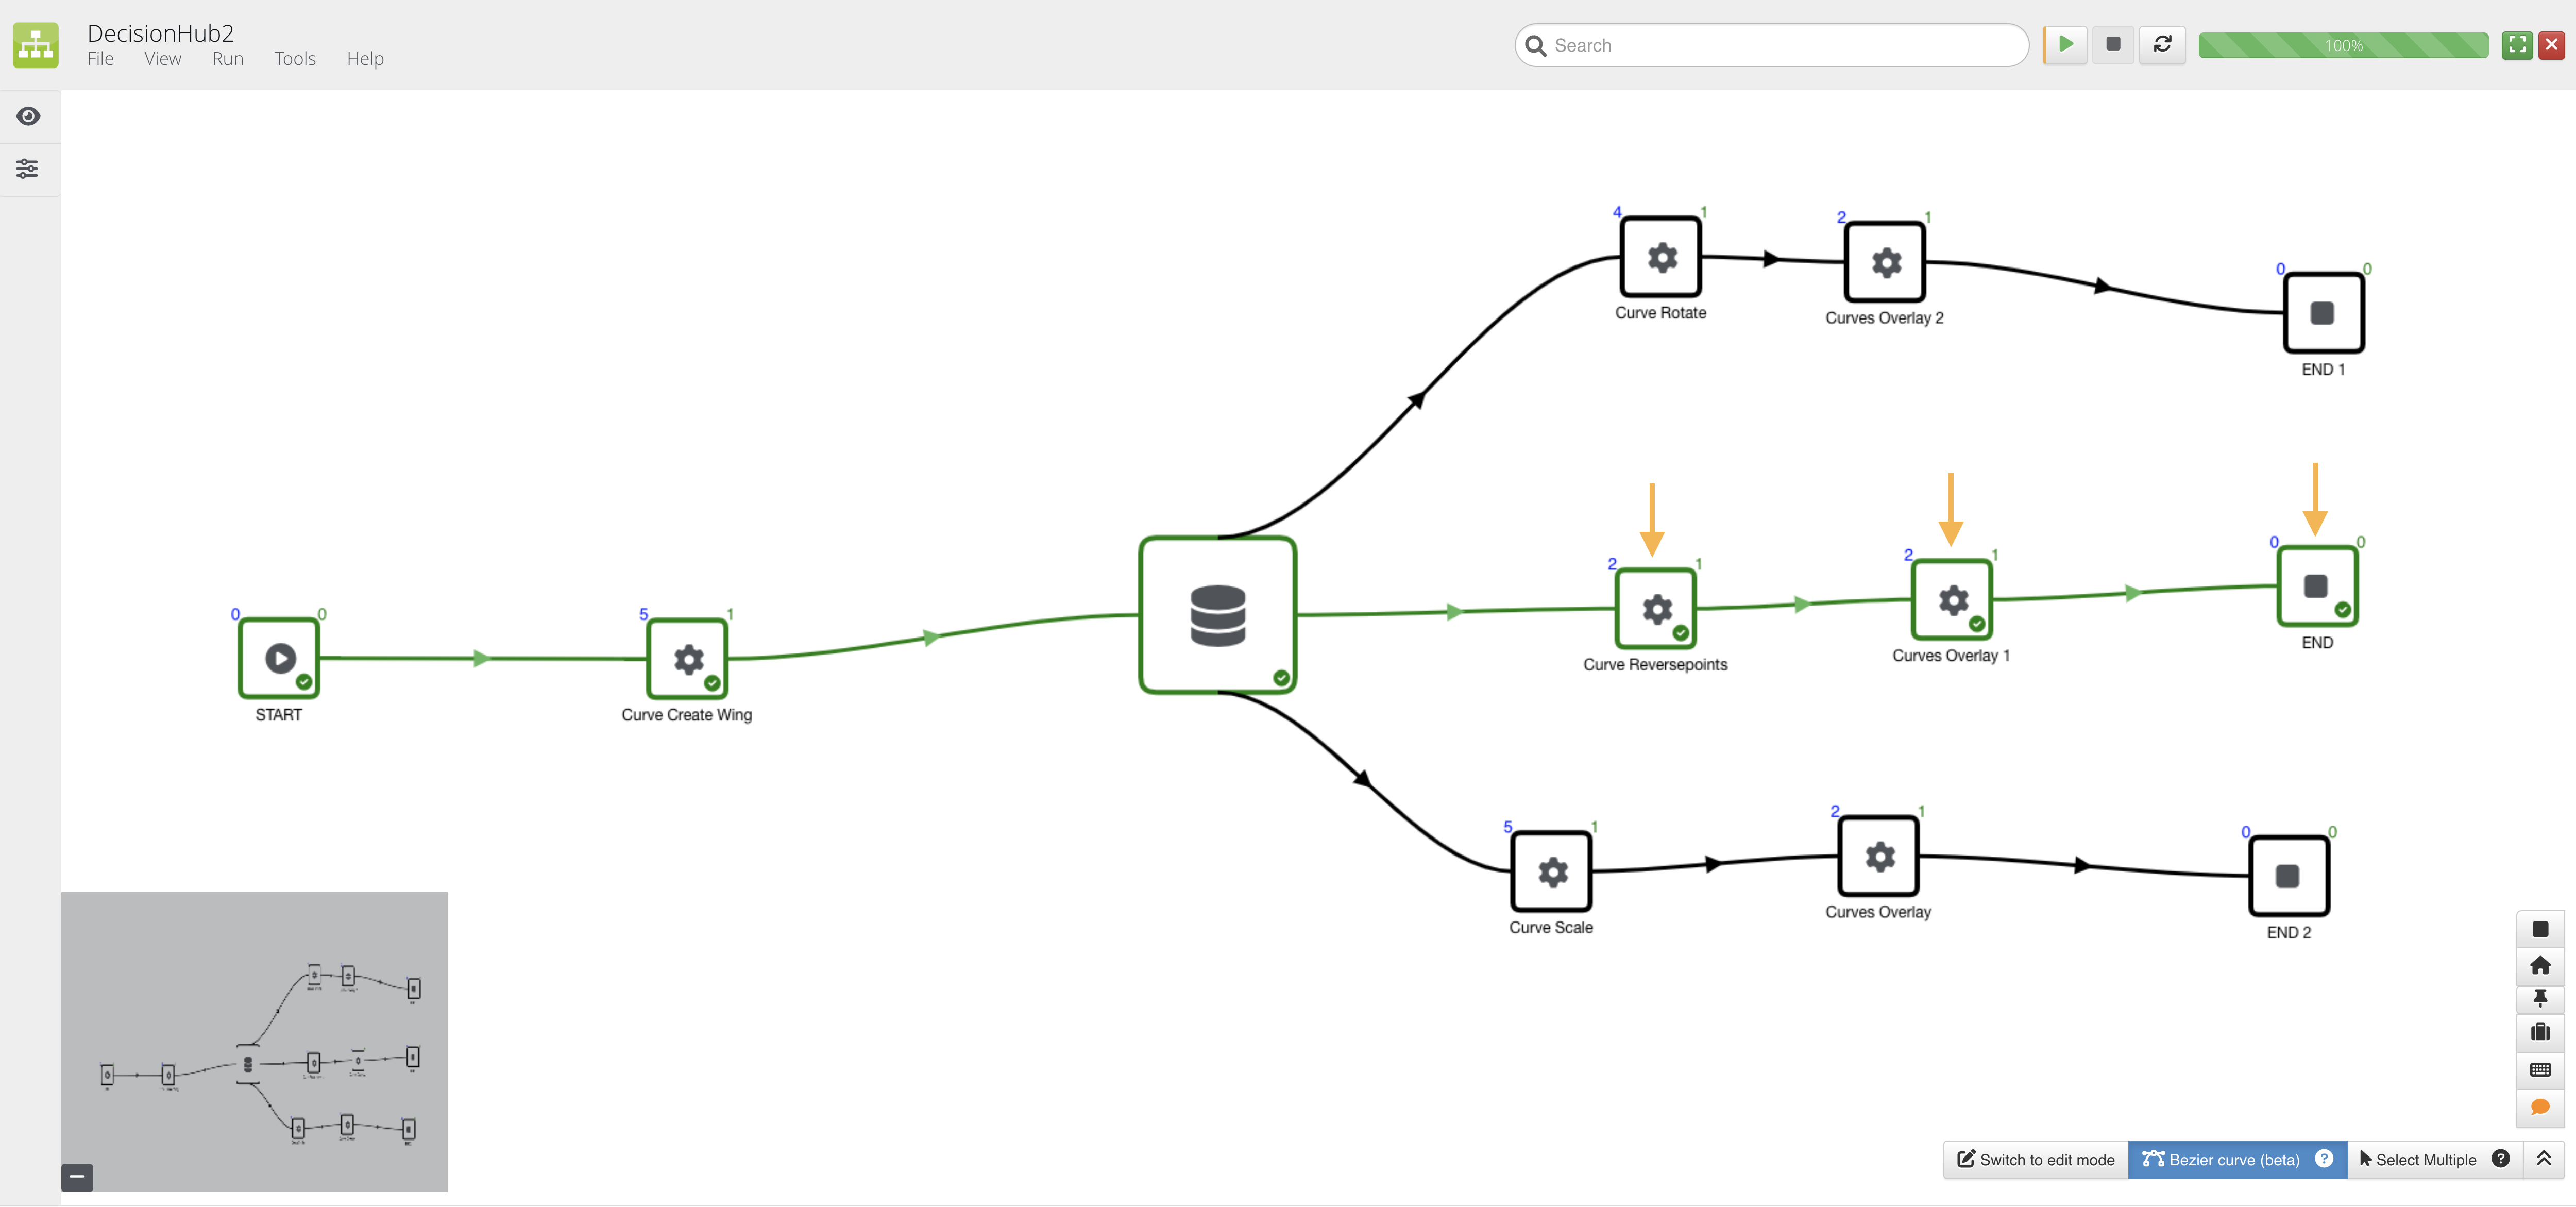
Figure 21: Decision Hub Execution
Data Provider
Add a decision worker from under the Shapes menu on the left. We’ve also added a curve scale worker before and a curve clip worker after the decision.
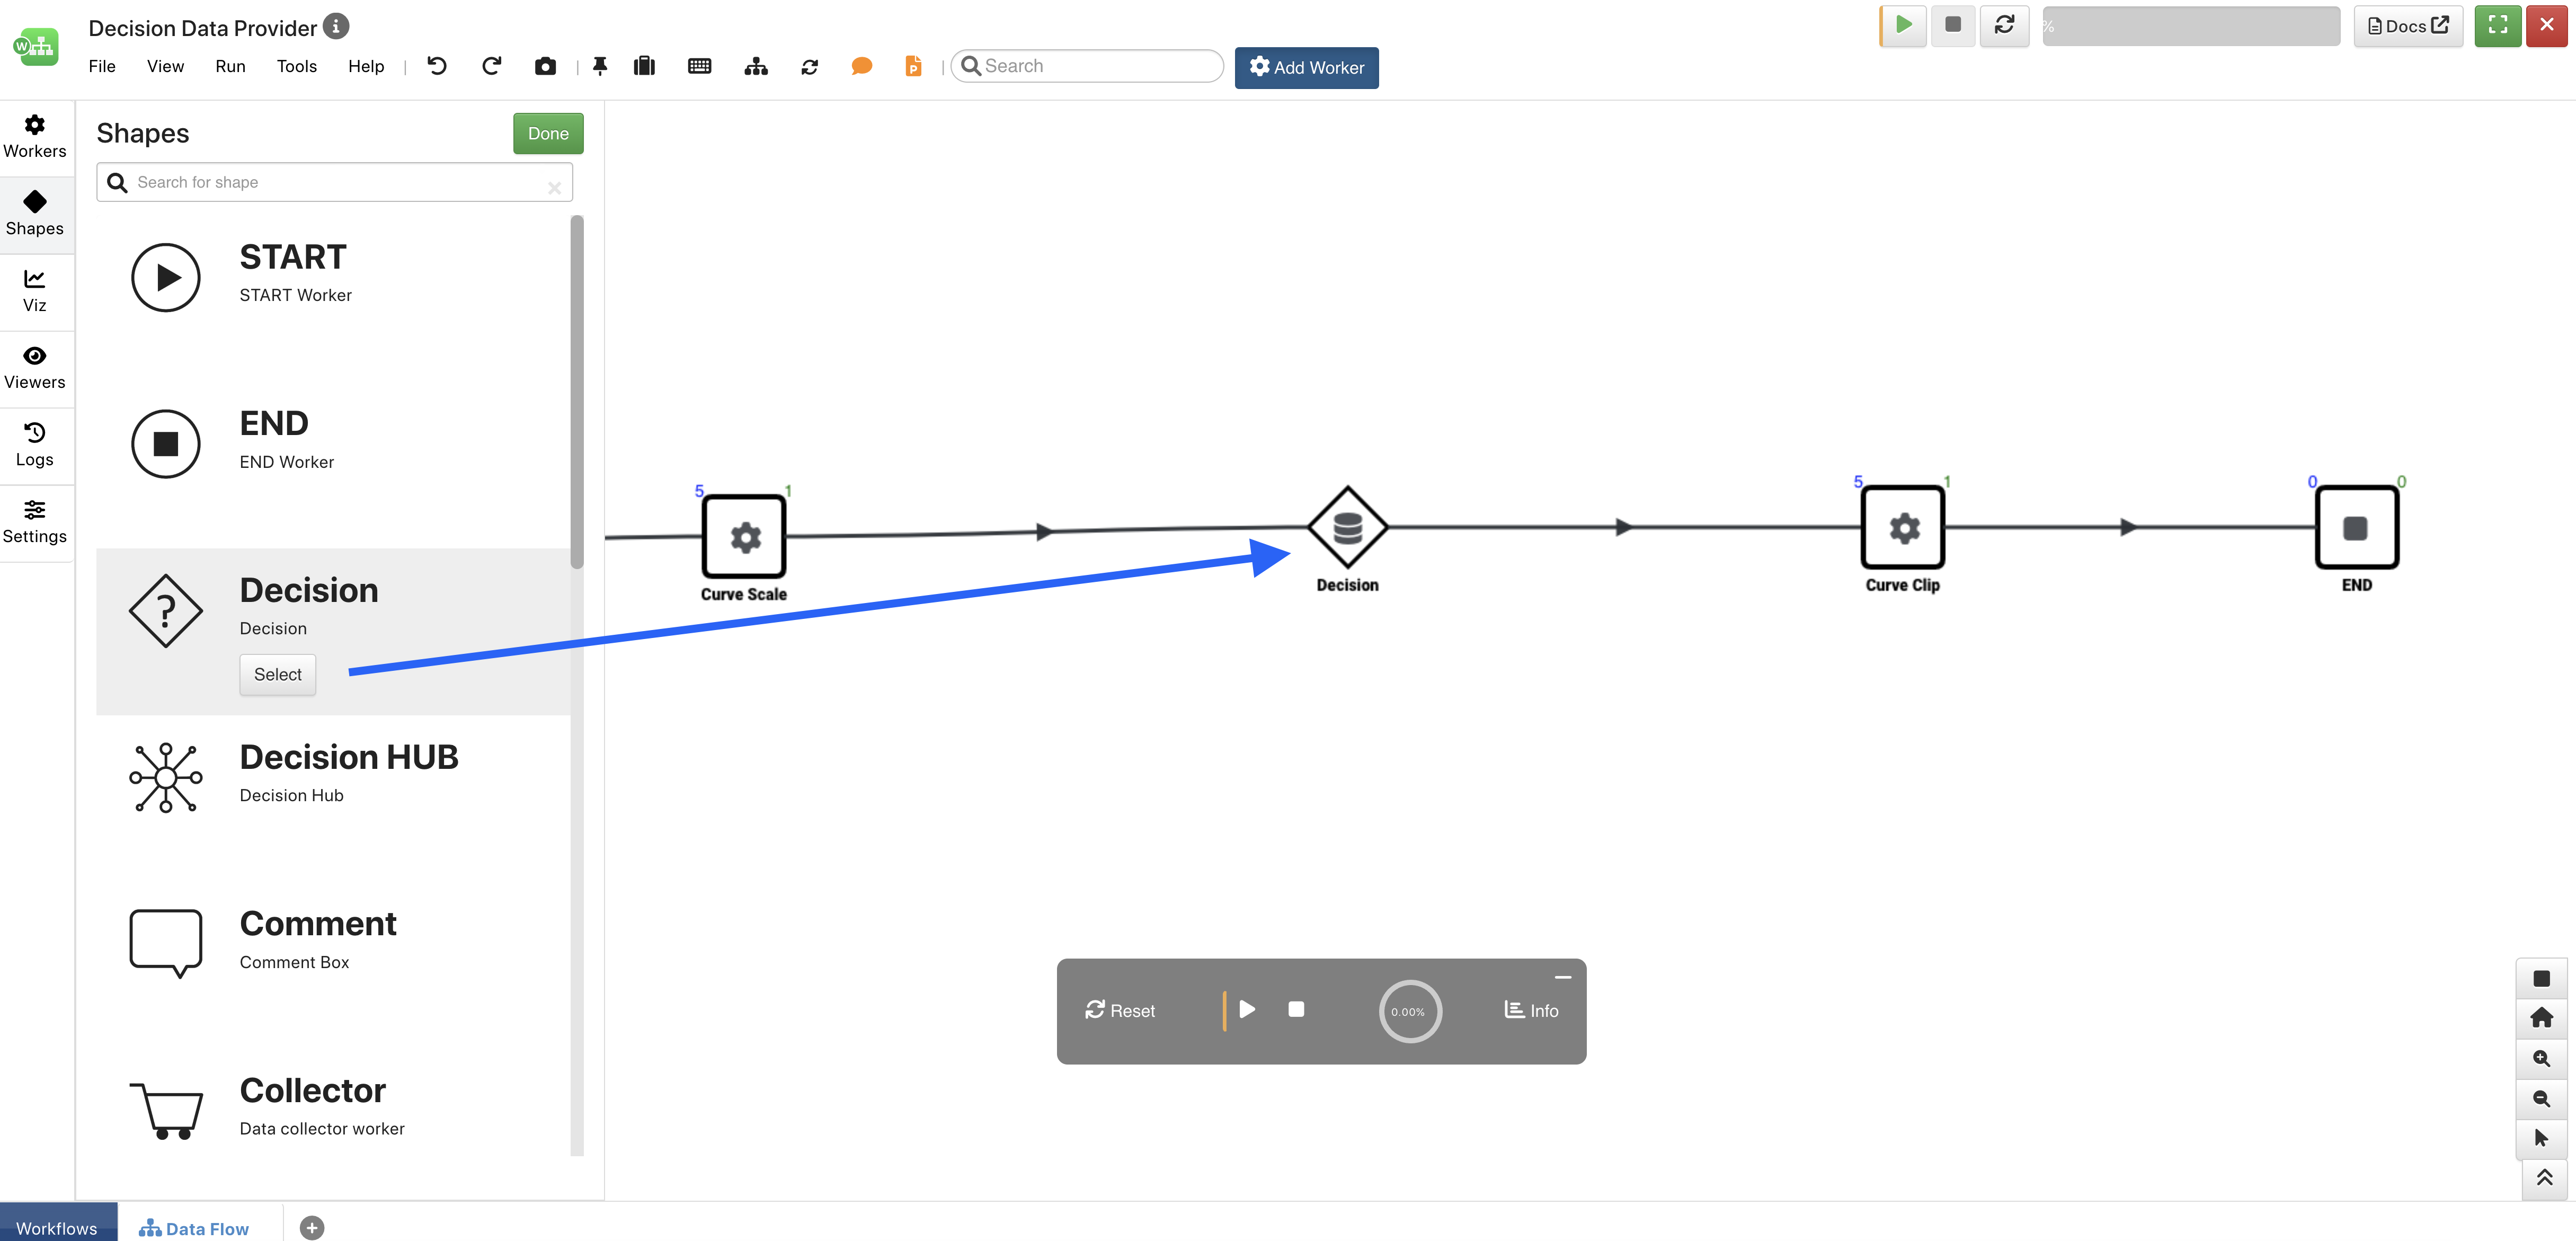
Figure 22: Add Decision Worker
Set up the START worker and following worker as you would normally. For this example, we’ve added a curve input to the start worker to use as the input for the curve scale worker.
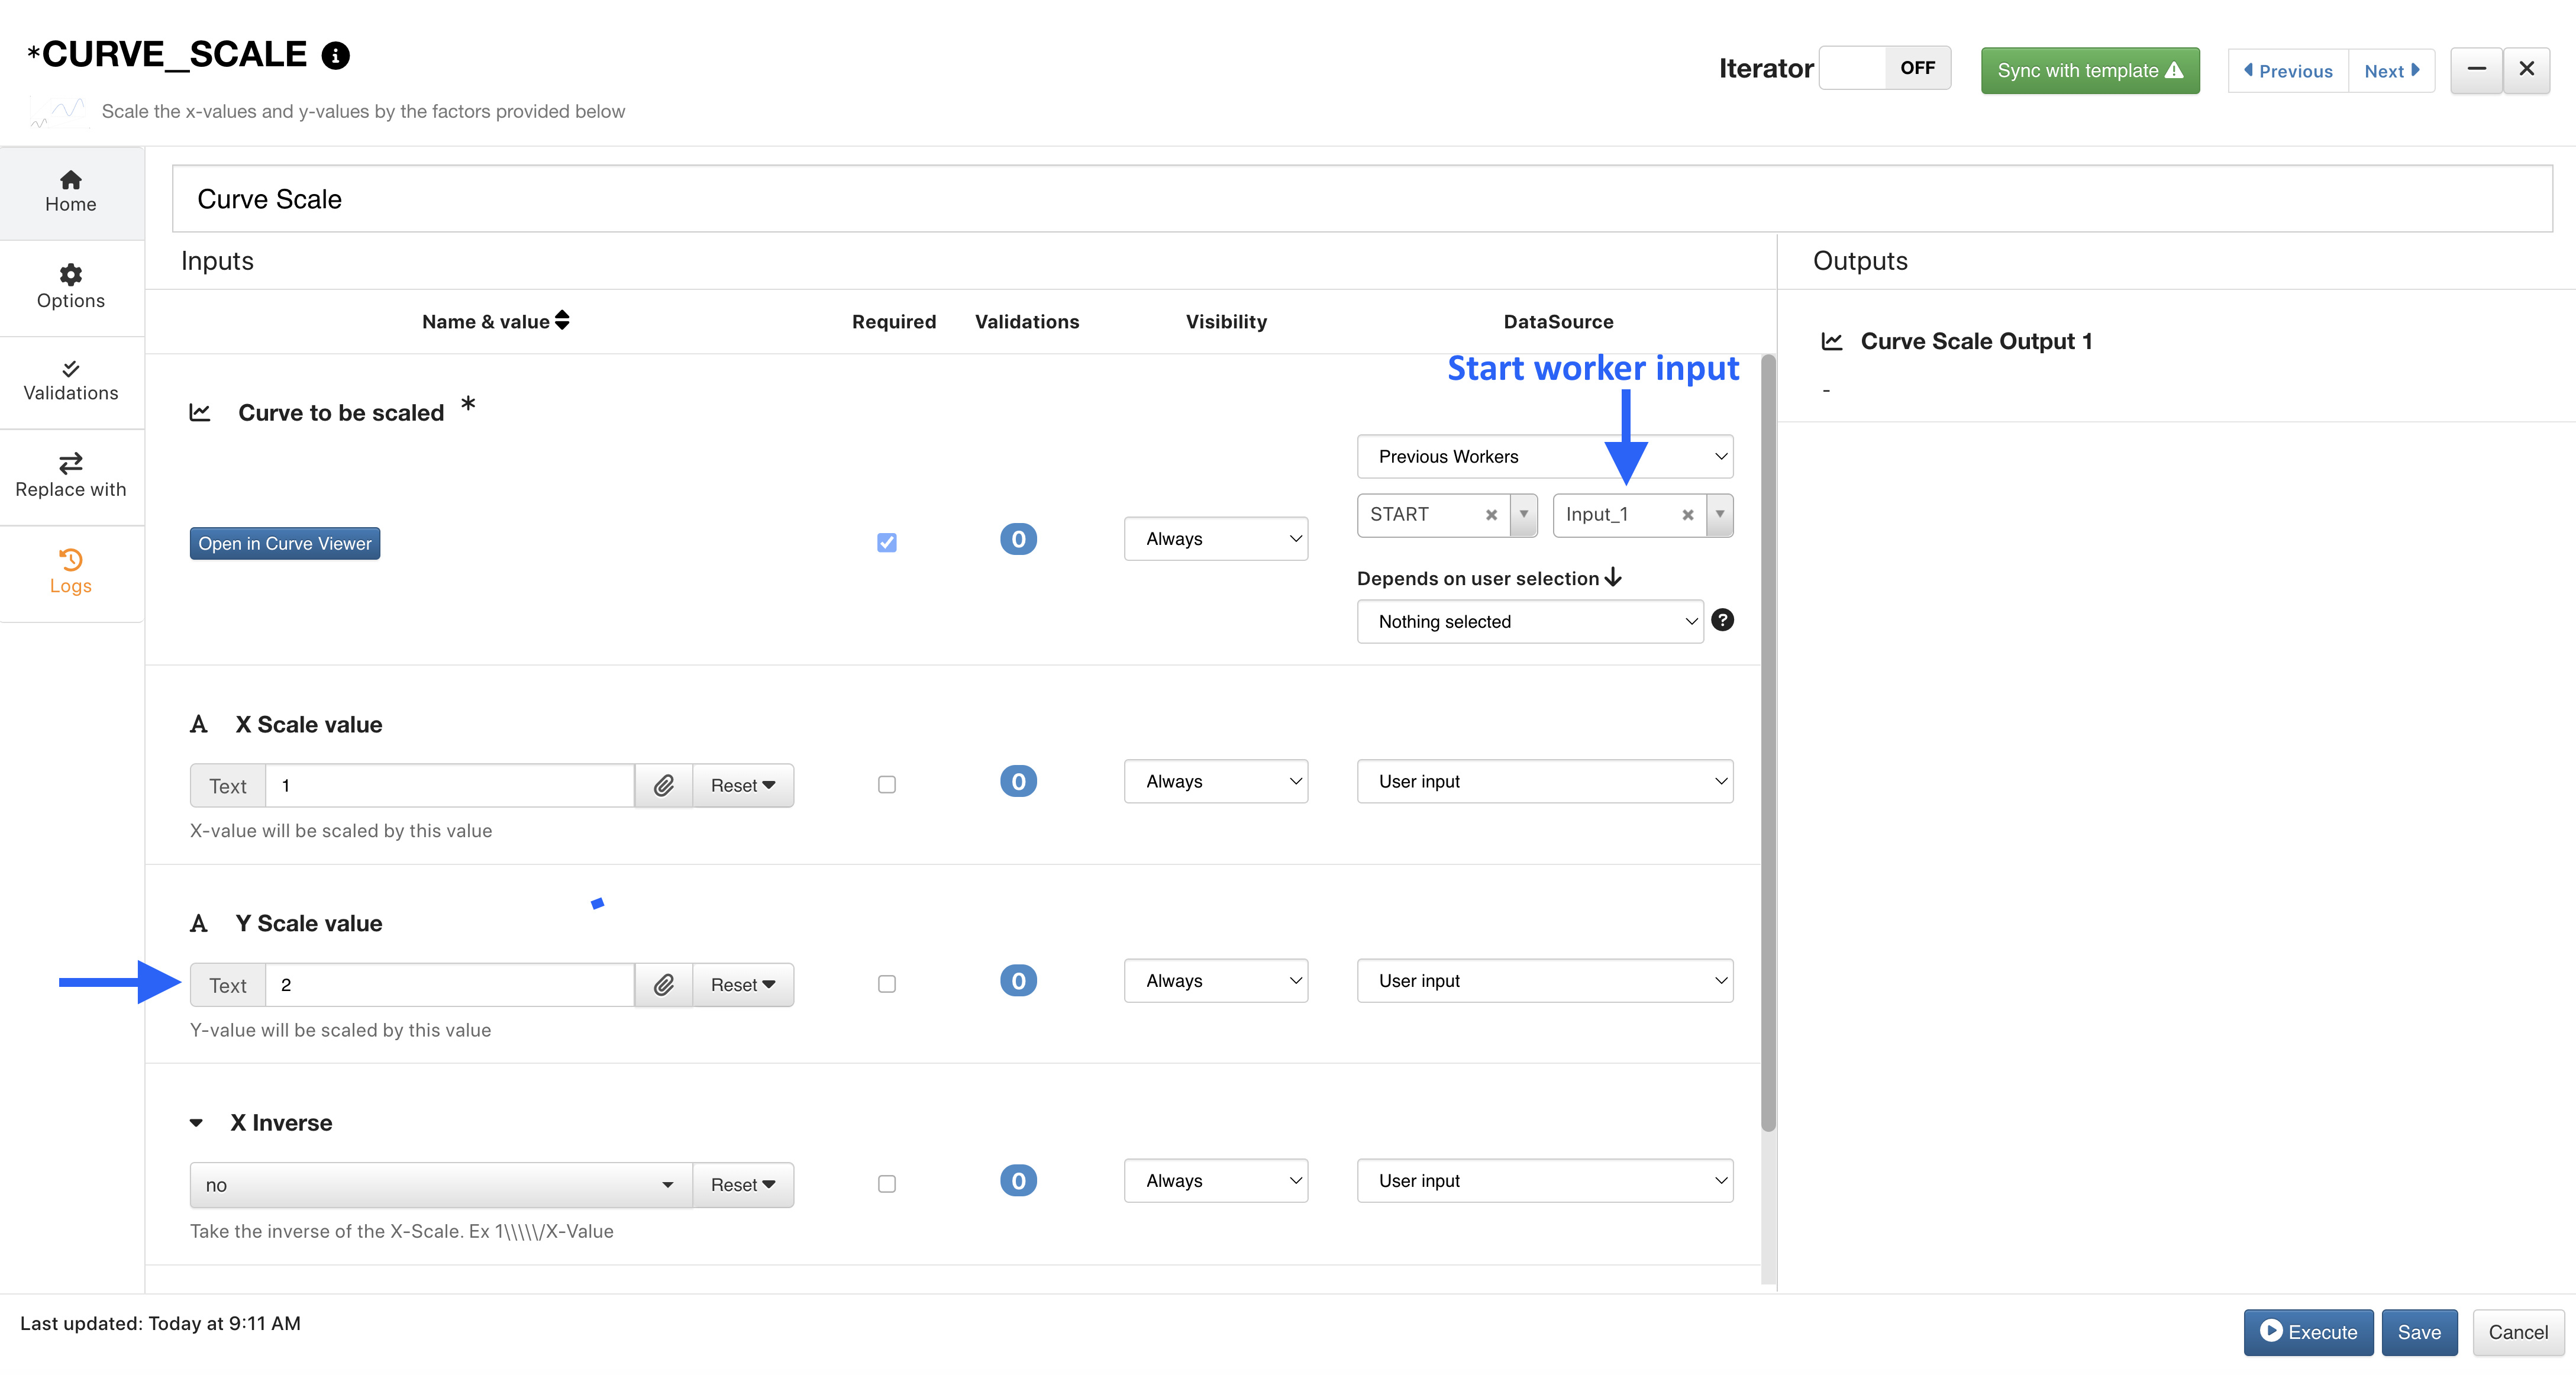
Figure 23: Curve Scale Worker Set-up
Next, we’ll open our decision worker and add a validation. Here, we’ve chosen y max to be less than 10. Under the controller option at the top (1), we’ll choose Data Provider and pick our curve_scale_output (2) to pass to our next worker.
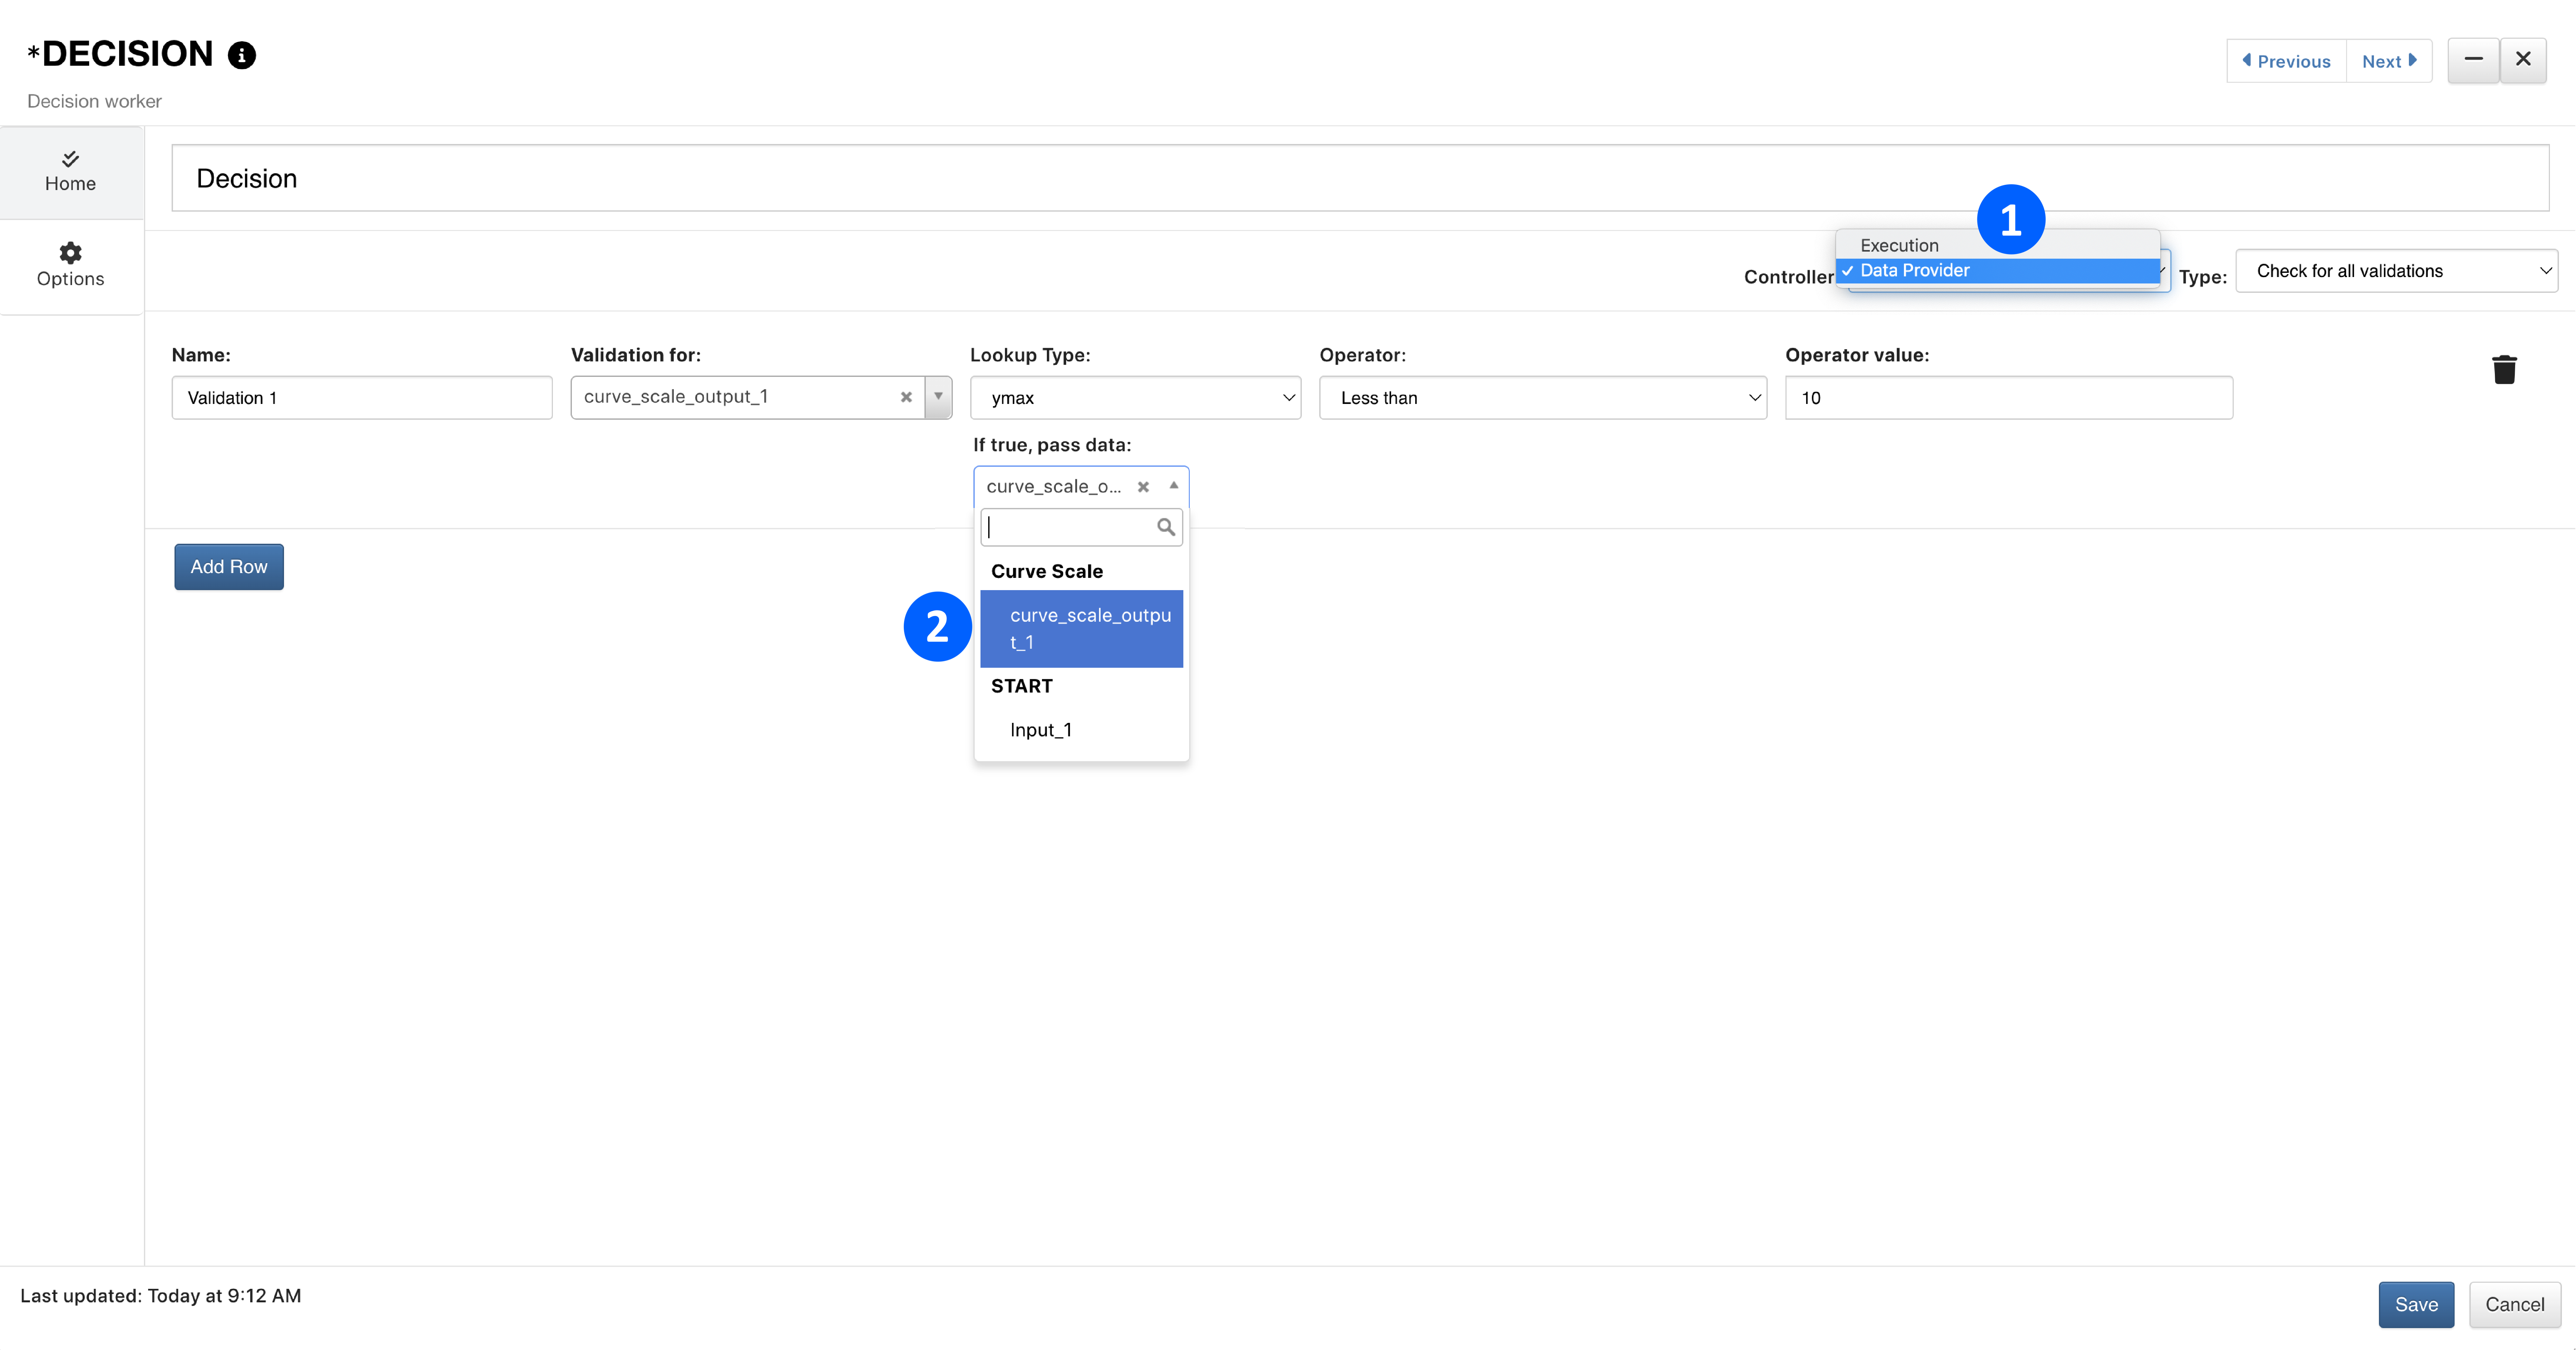
Figure 24: Decision Worker Set-up
For our next worker, we’ll Previous Workers > Decisions (1) as our data source. We’ll see under the Name/Value that the input depends on Decision > Data Provided Based On Validation (2).
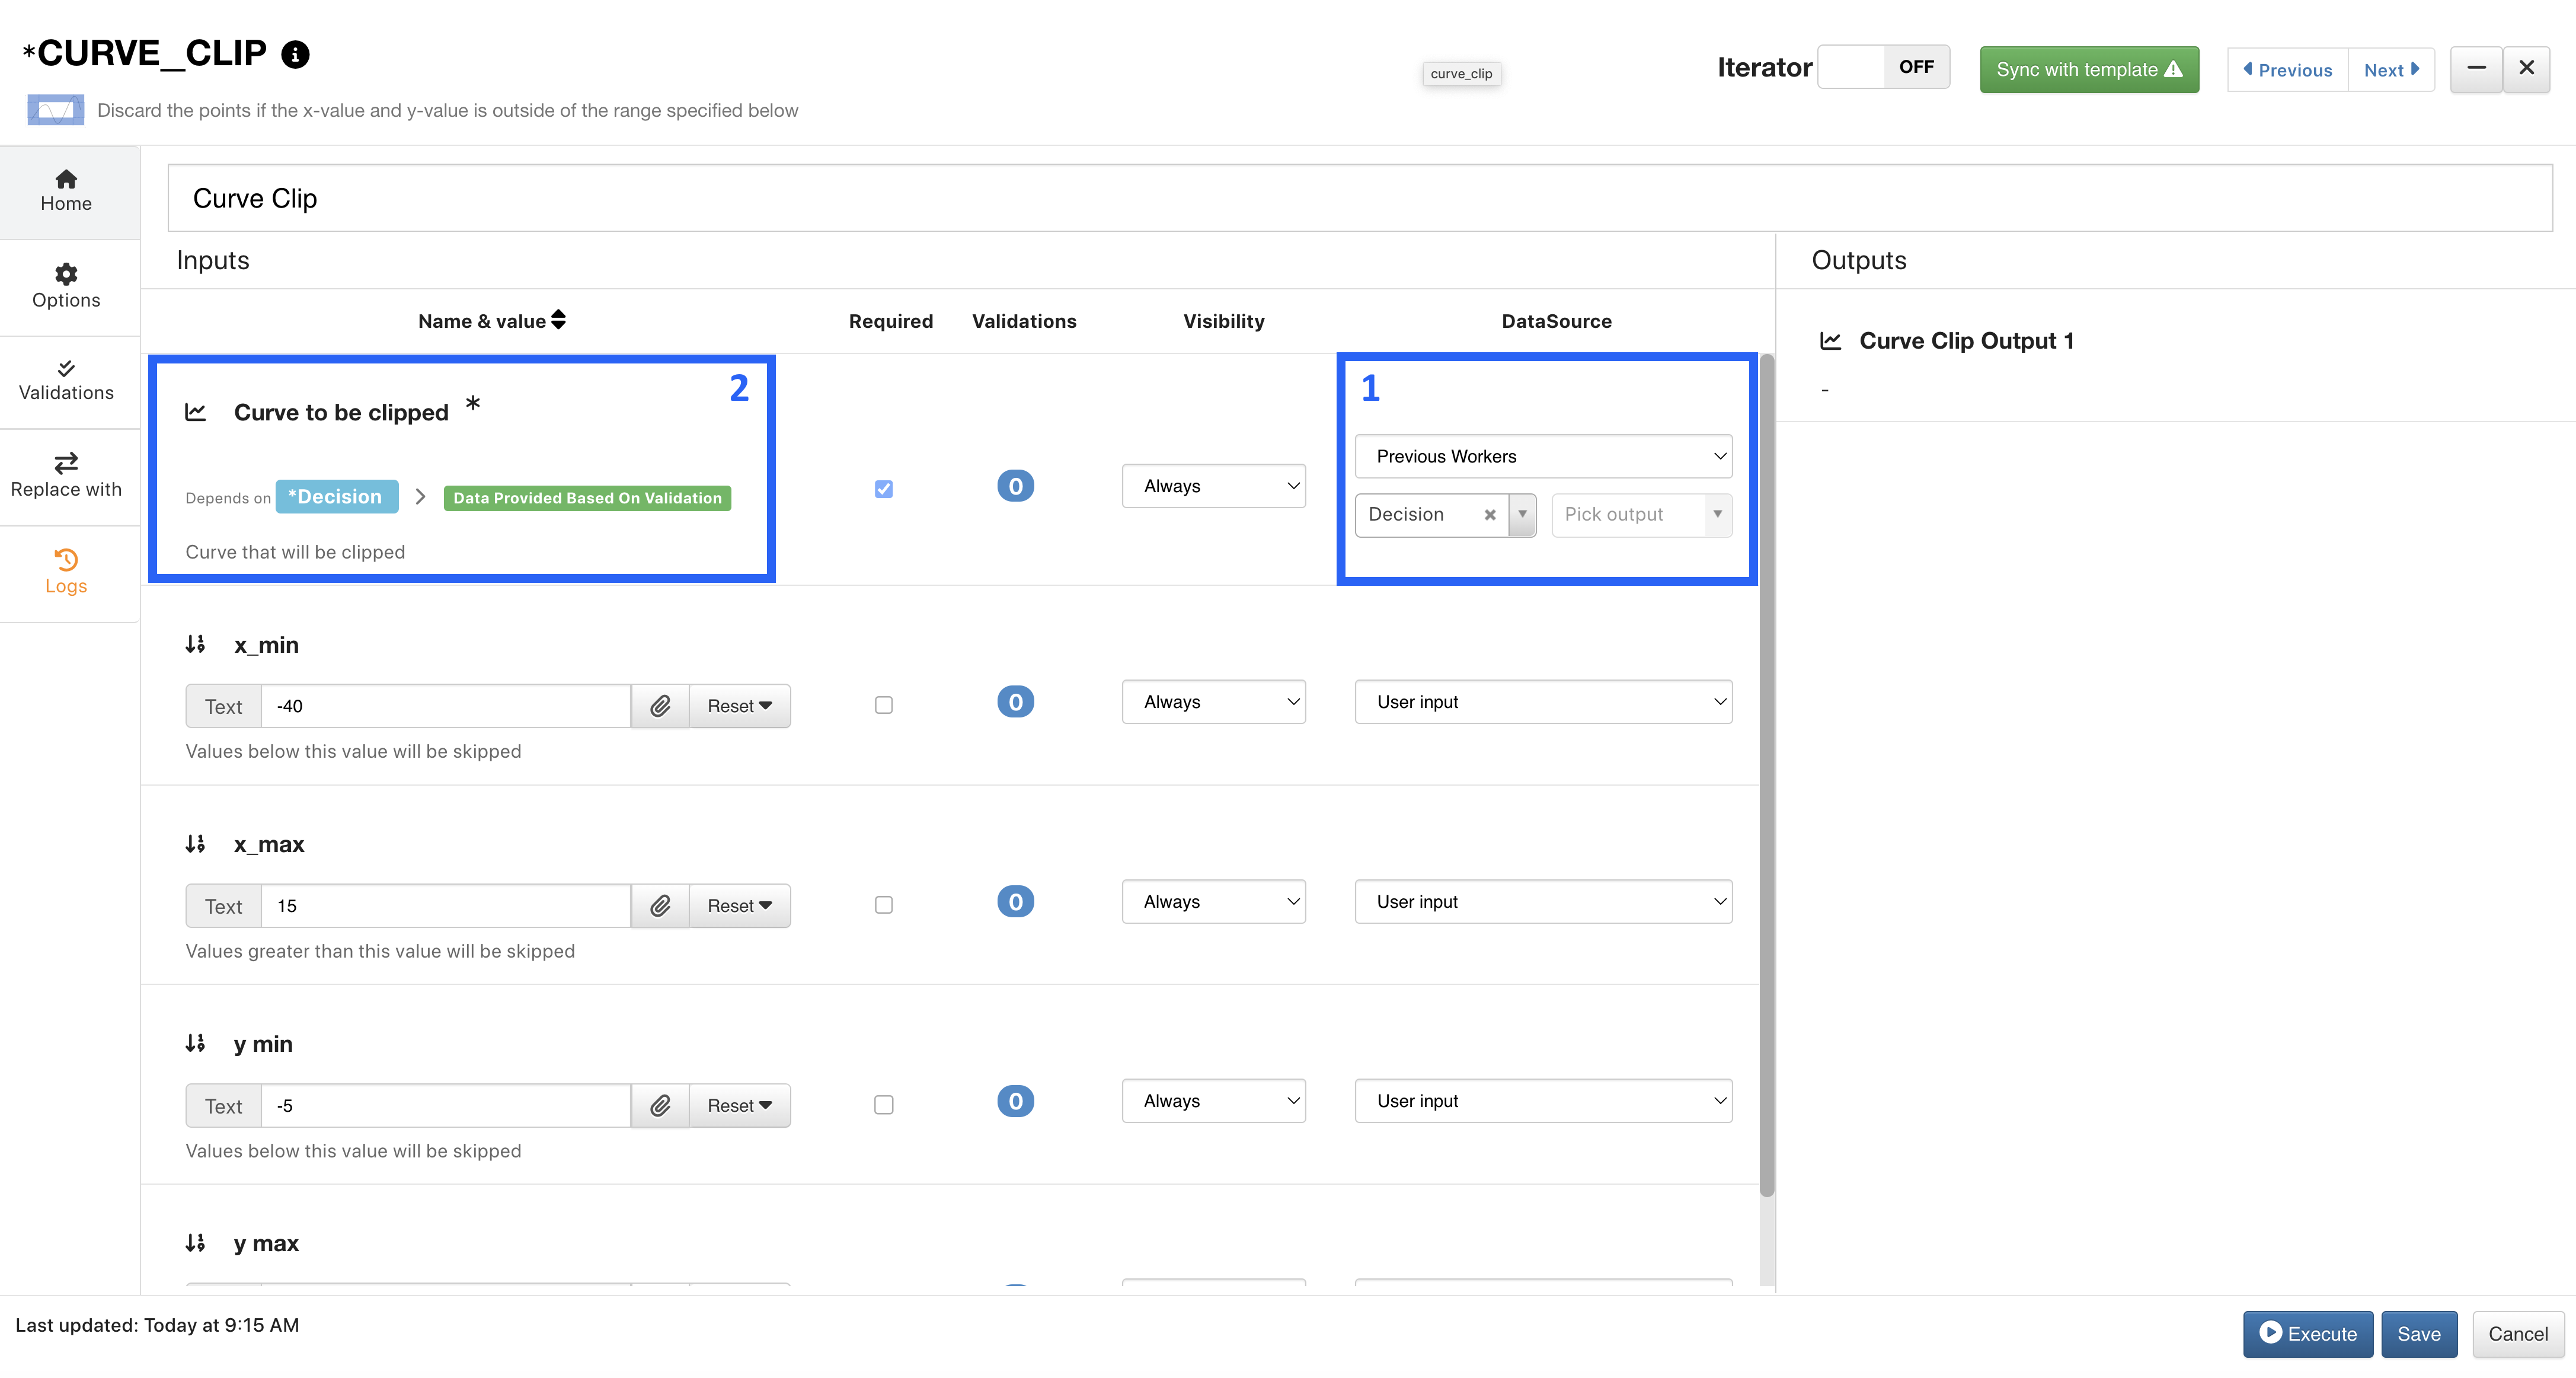
Figure 25: Curve Clip Worker Set-up
Now, when we execute the workflow, our curve clip worker will only execute if the data from the curve scale worker passes the decision.
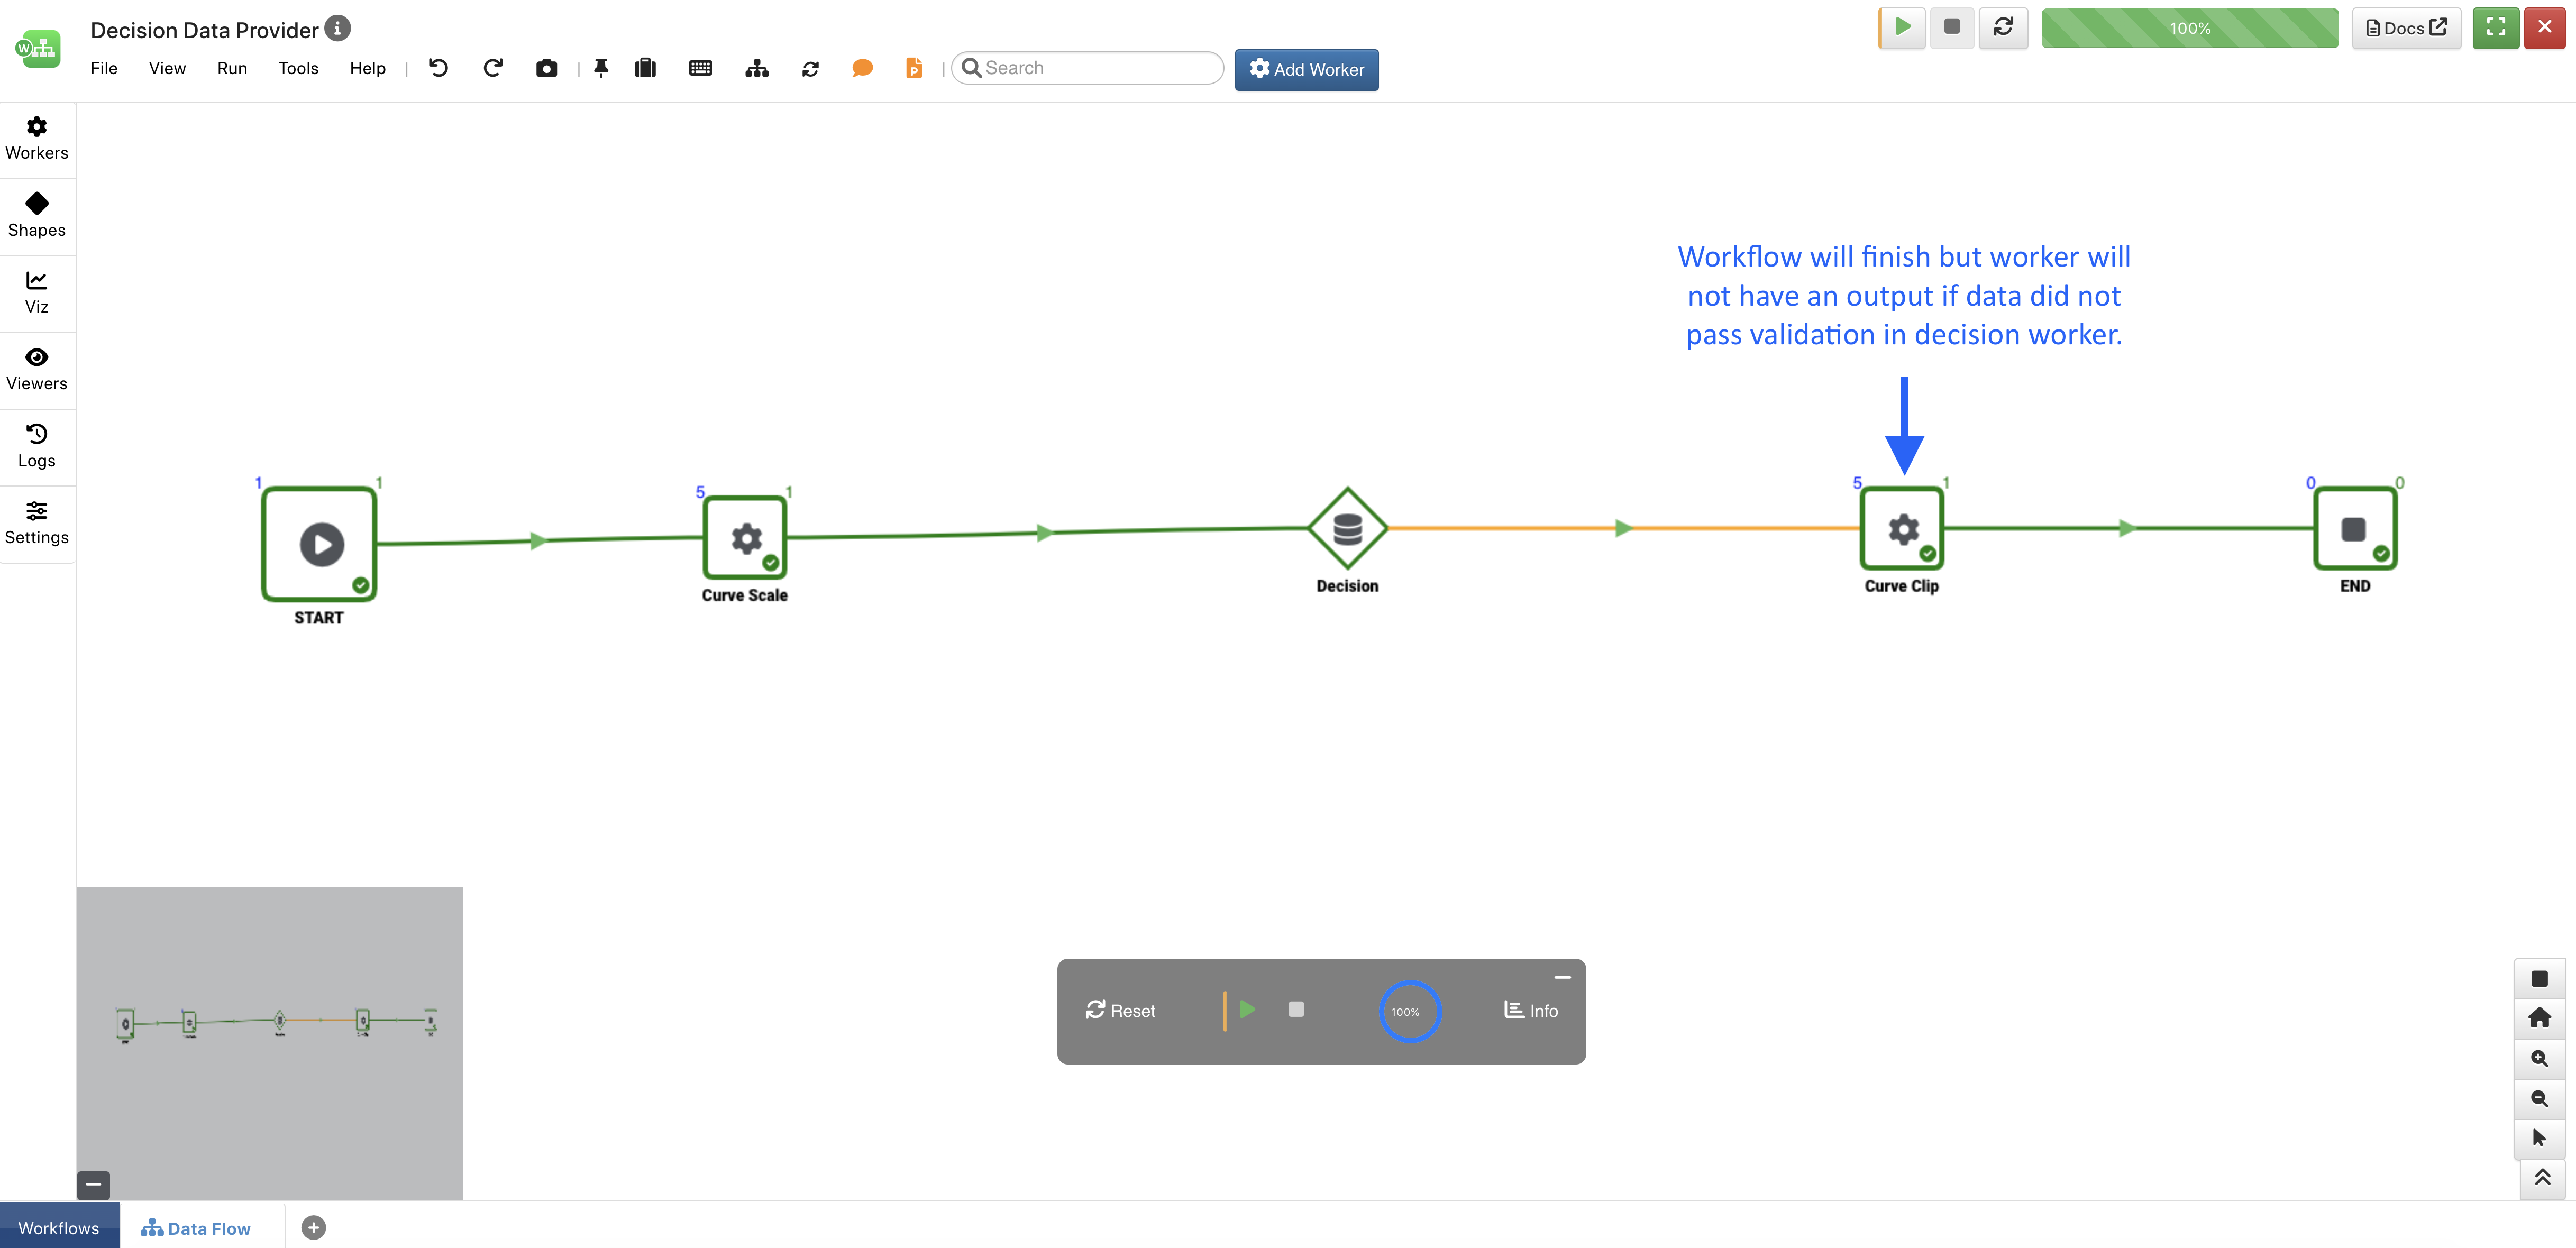
Figure 26: Executed Data Provider Workflow
8.5. |file-powerpoint-o| Report Generator
There is a specified worker we can use for generating reports directly from our workflow. Let’s go over how to set it up.
Under the shapes menu, click and drag the PPT Report onto the workflow right before the end worker. Then, click on the worker to configure it.
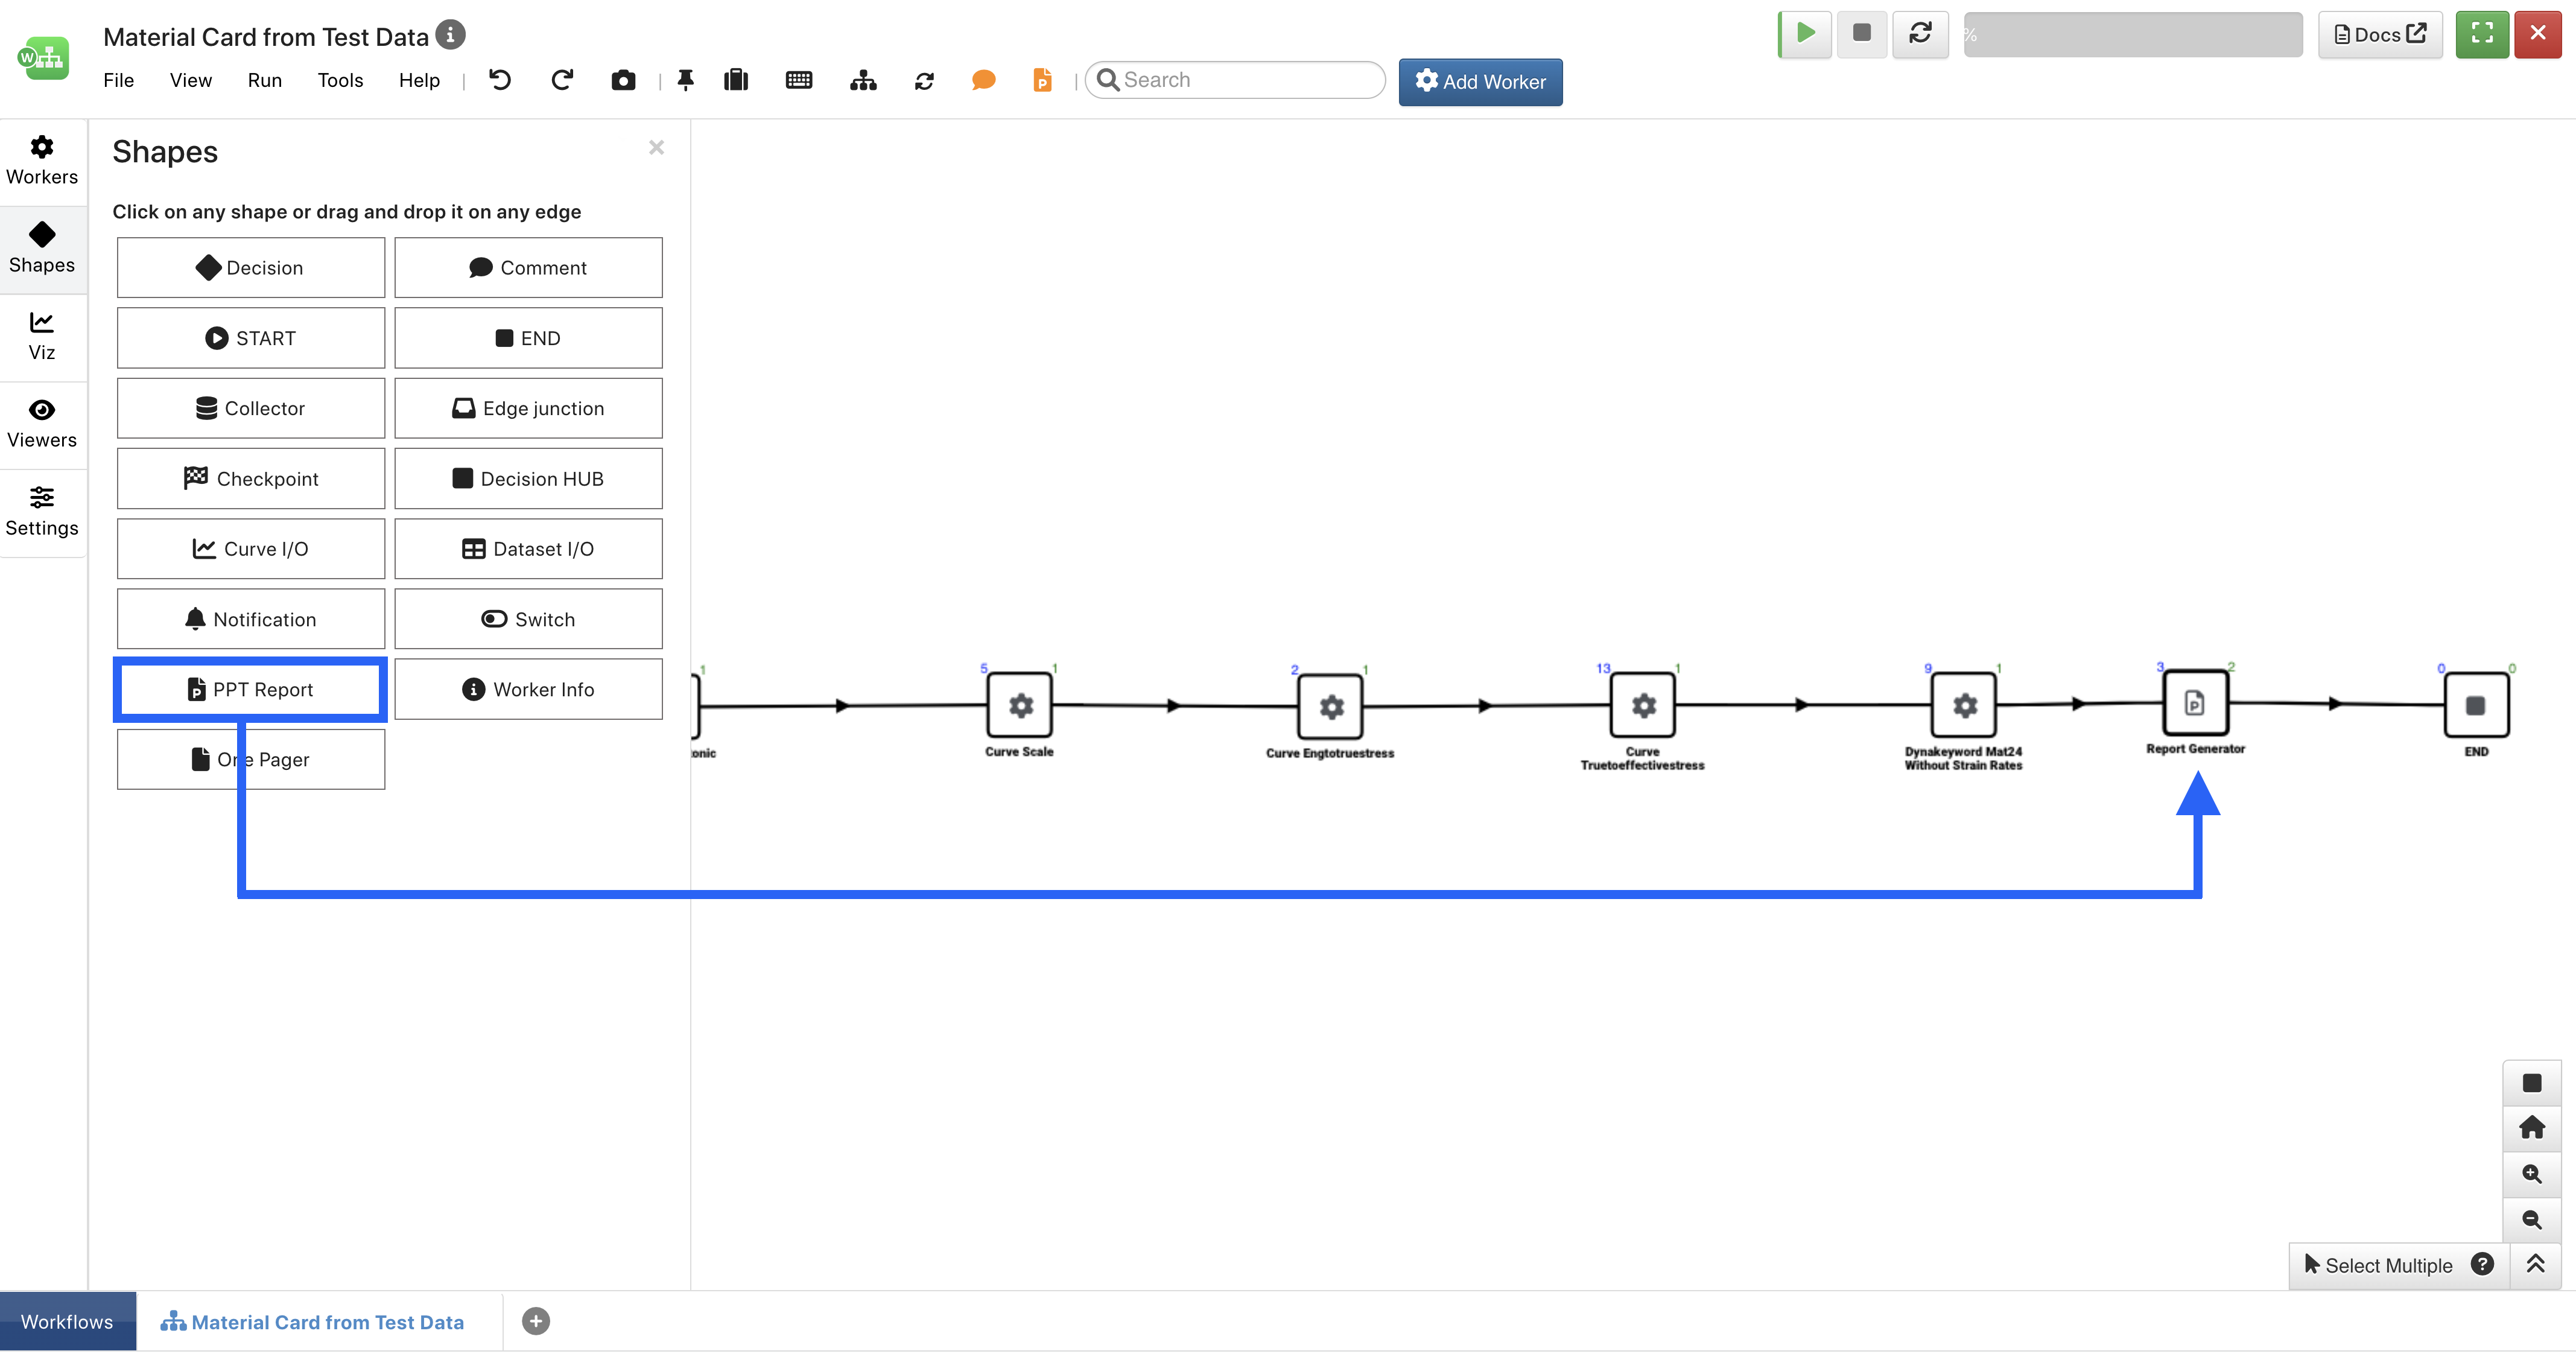
Figure 27: Add PPT Report Shape to Workflow
Here, we’ll configure our report manually by clicking on this button under Template Layout.
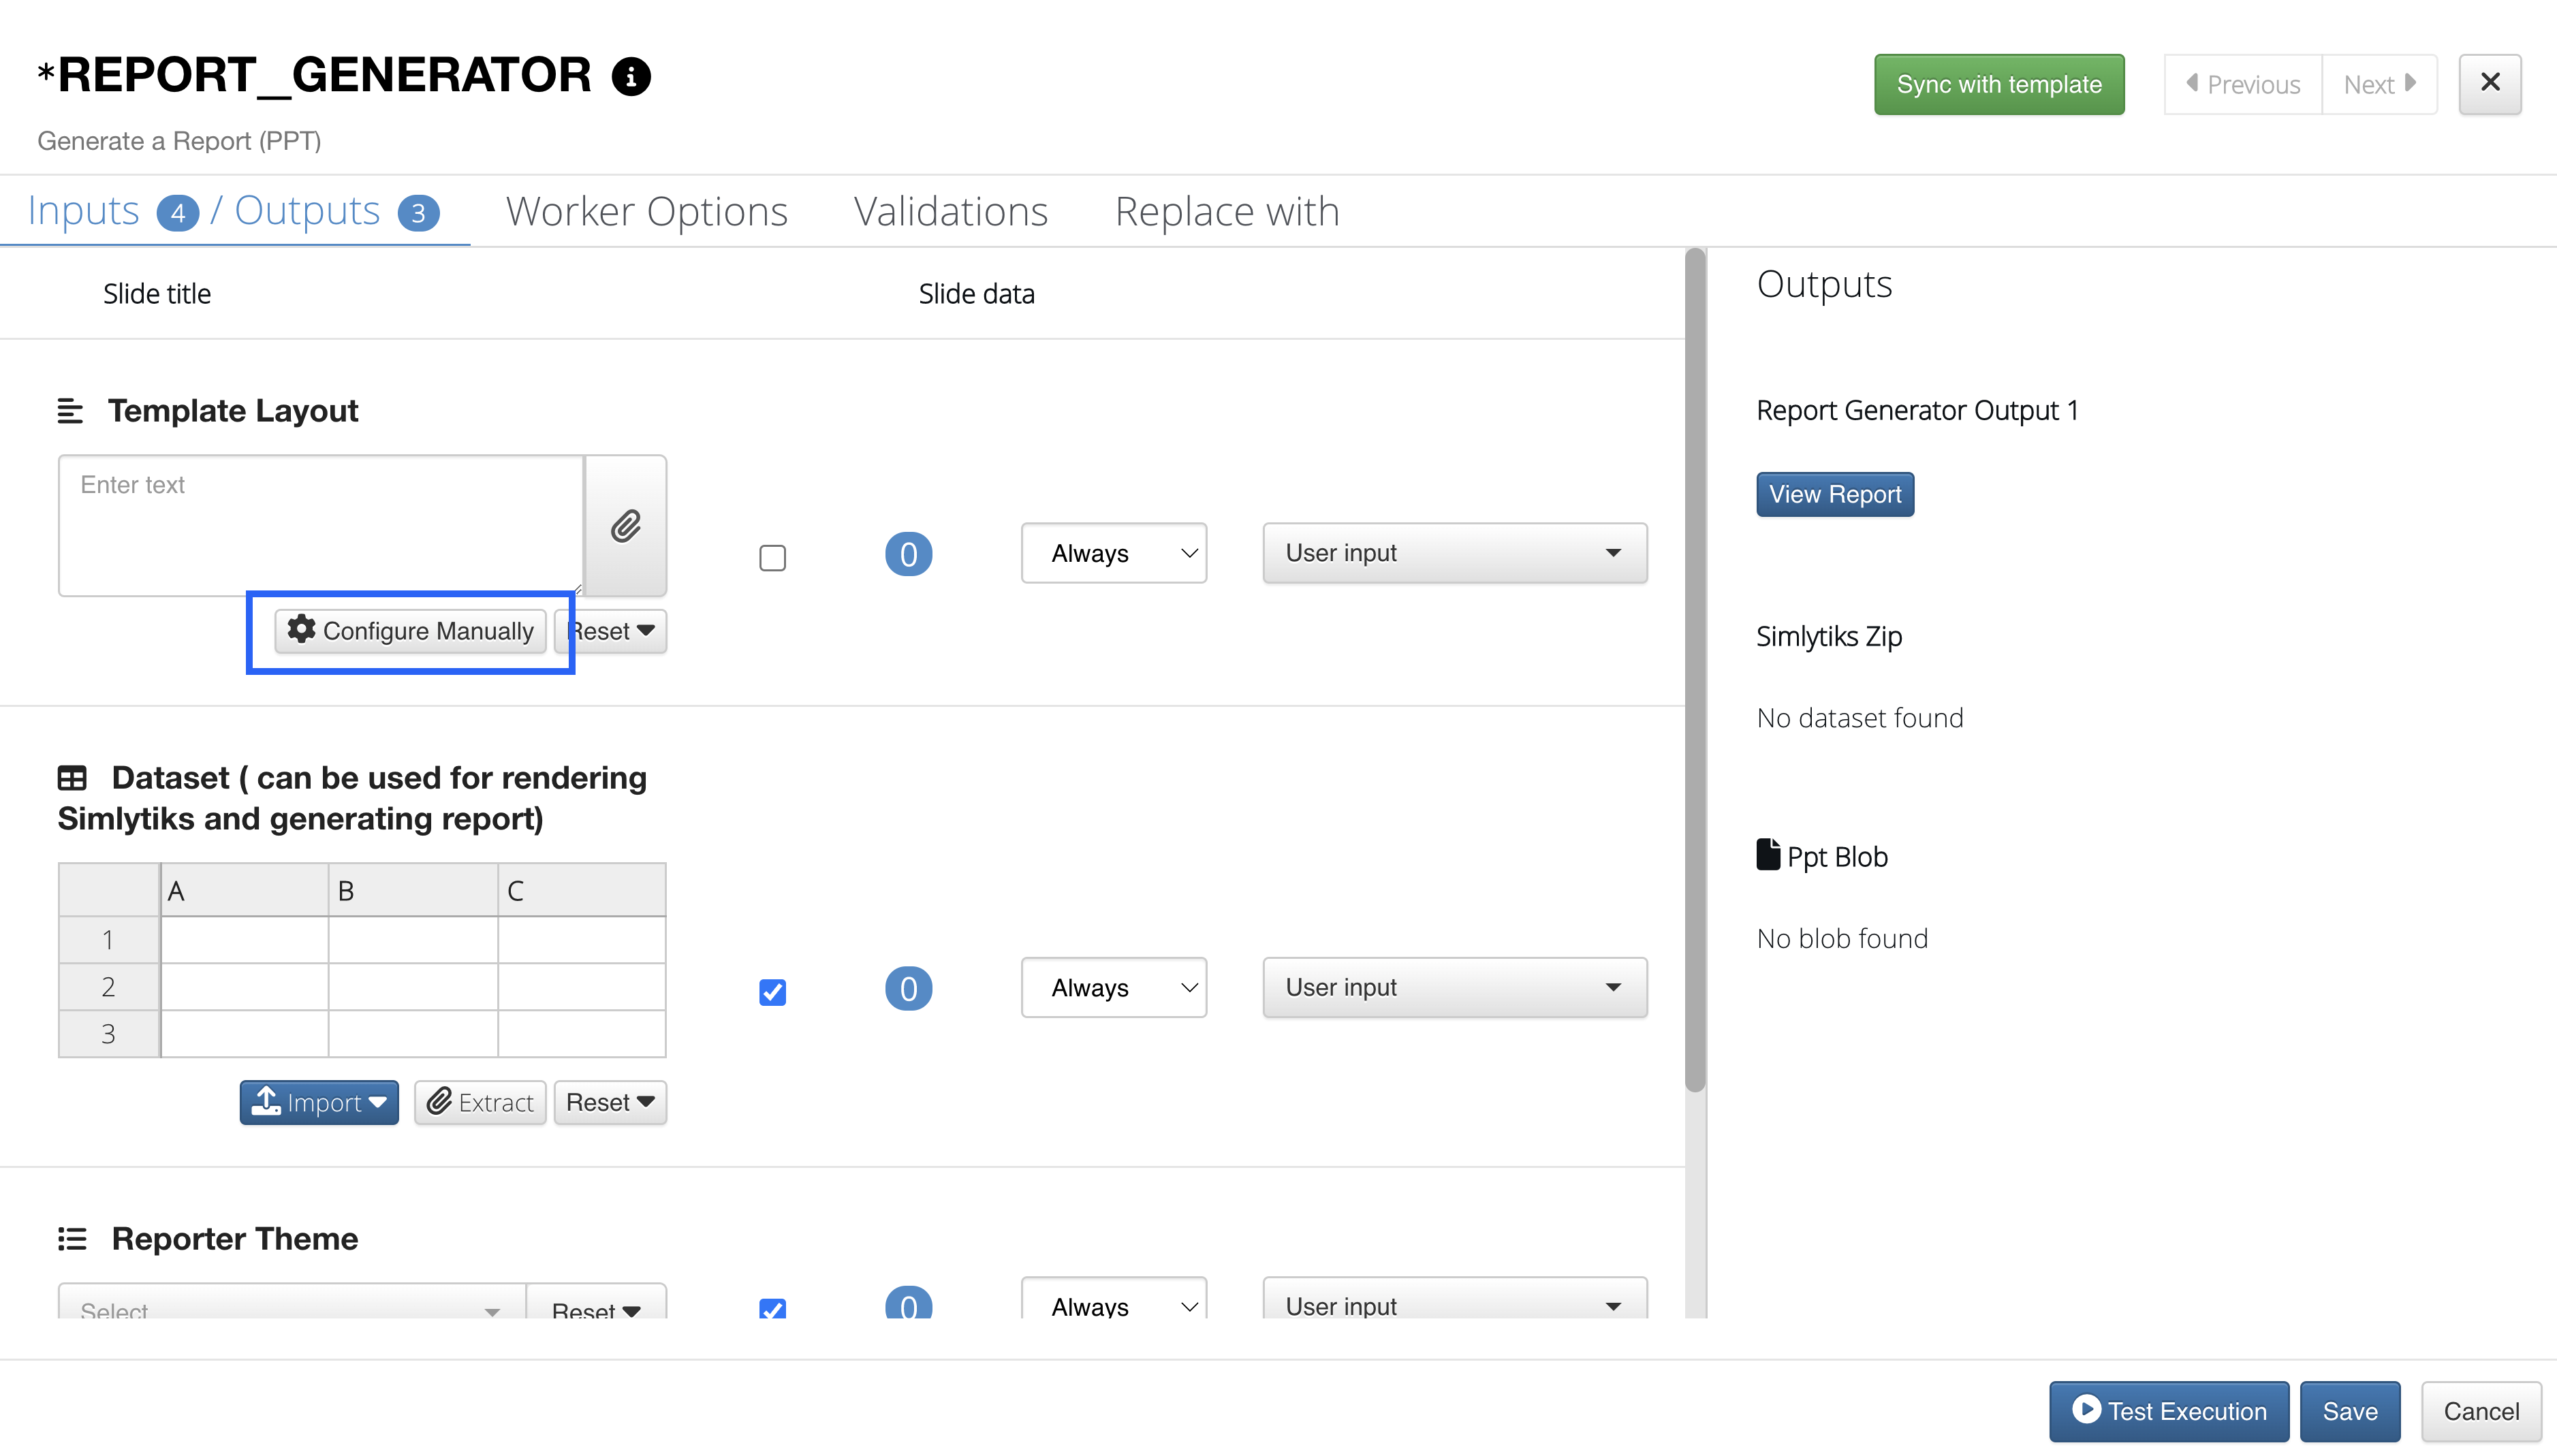
Figure 28: Configure Report Manually
This gives us a preview of our Simlytiks Report layout. We can drag-and-drop inputs or outputs onto page sections to create our desired layout. Use the search bar at the top to find a particular input or output. Here, we’ve added all the outputs to their own page section as shown with Curve Digitizer. Finish by clicking Apply and saving the worker.
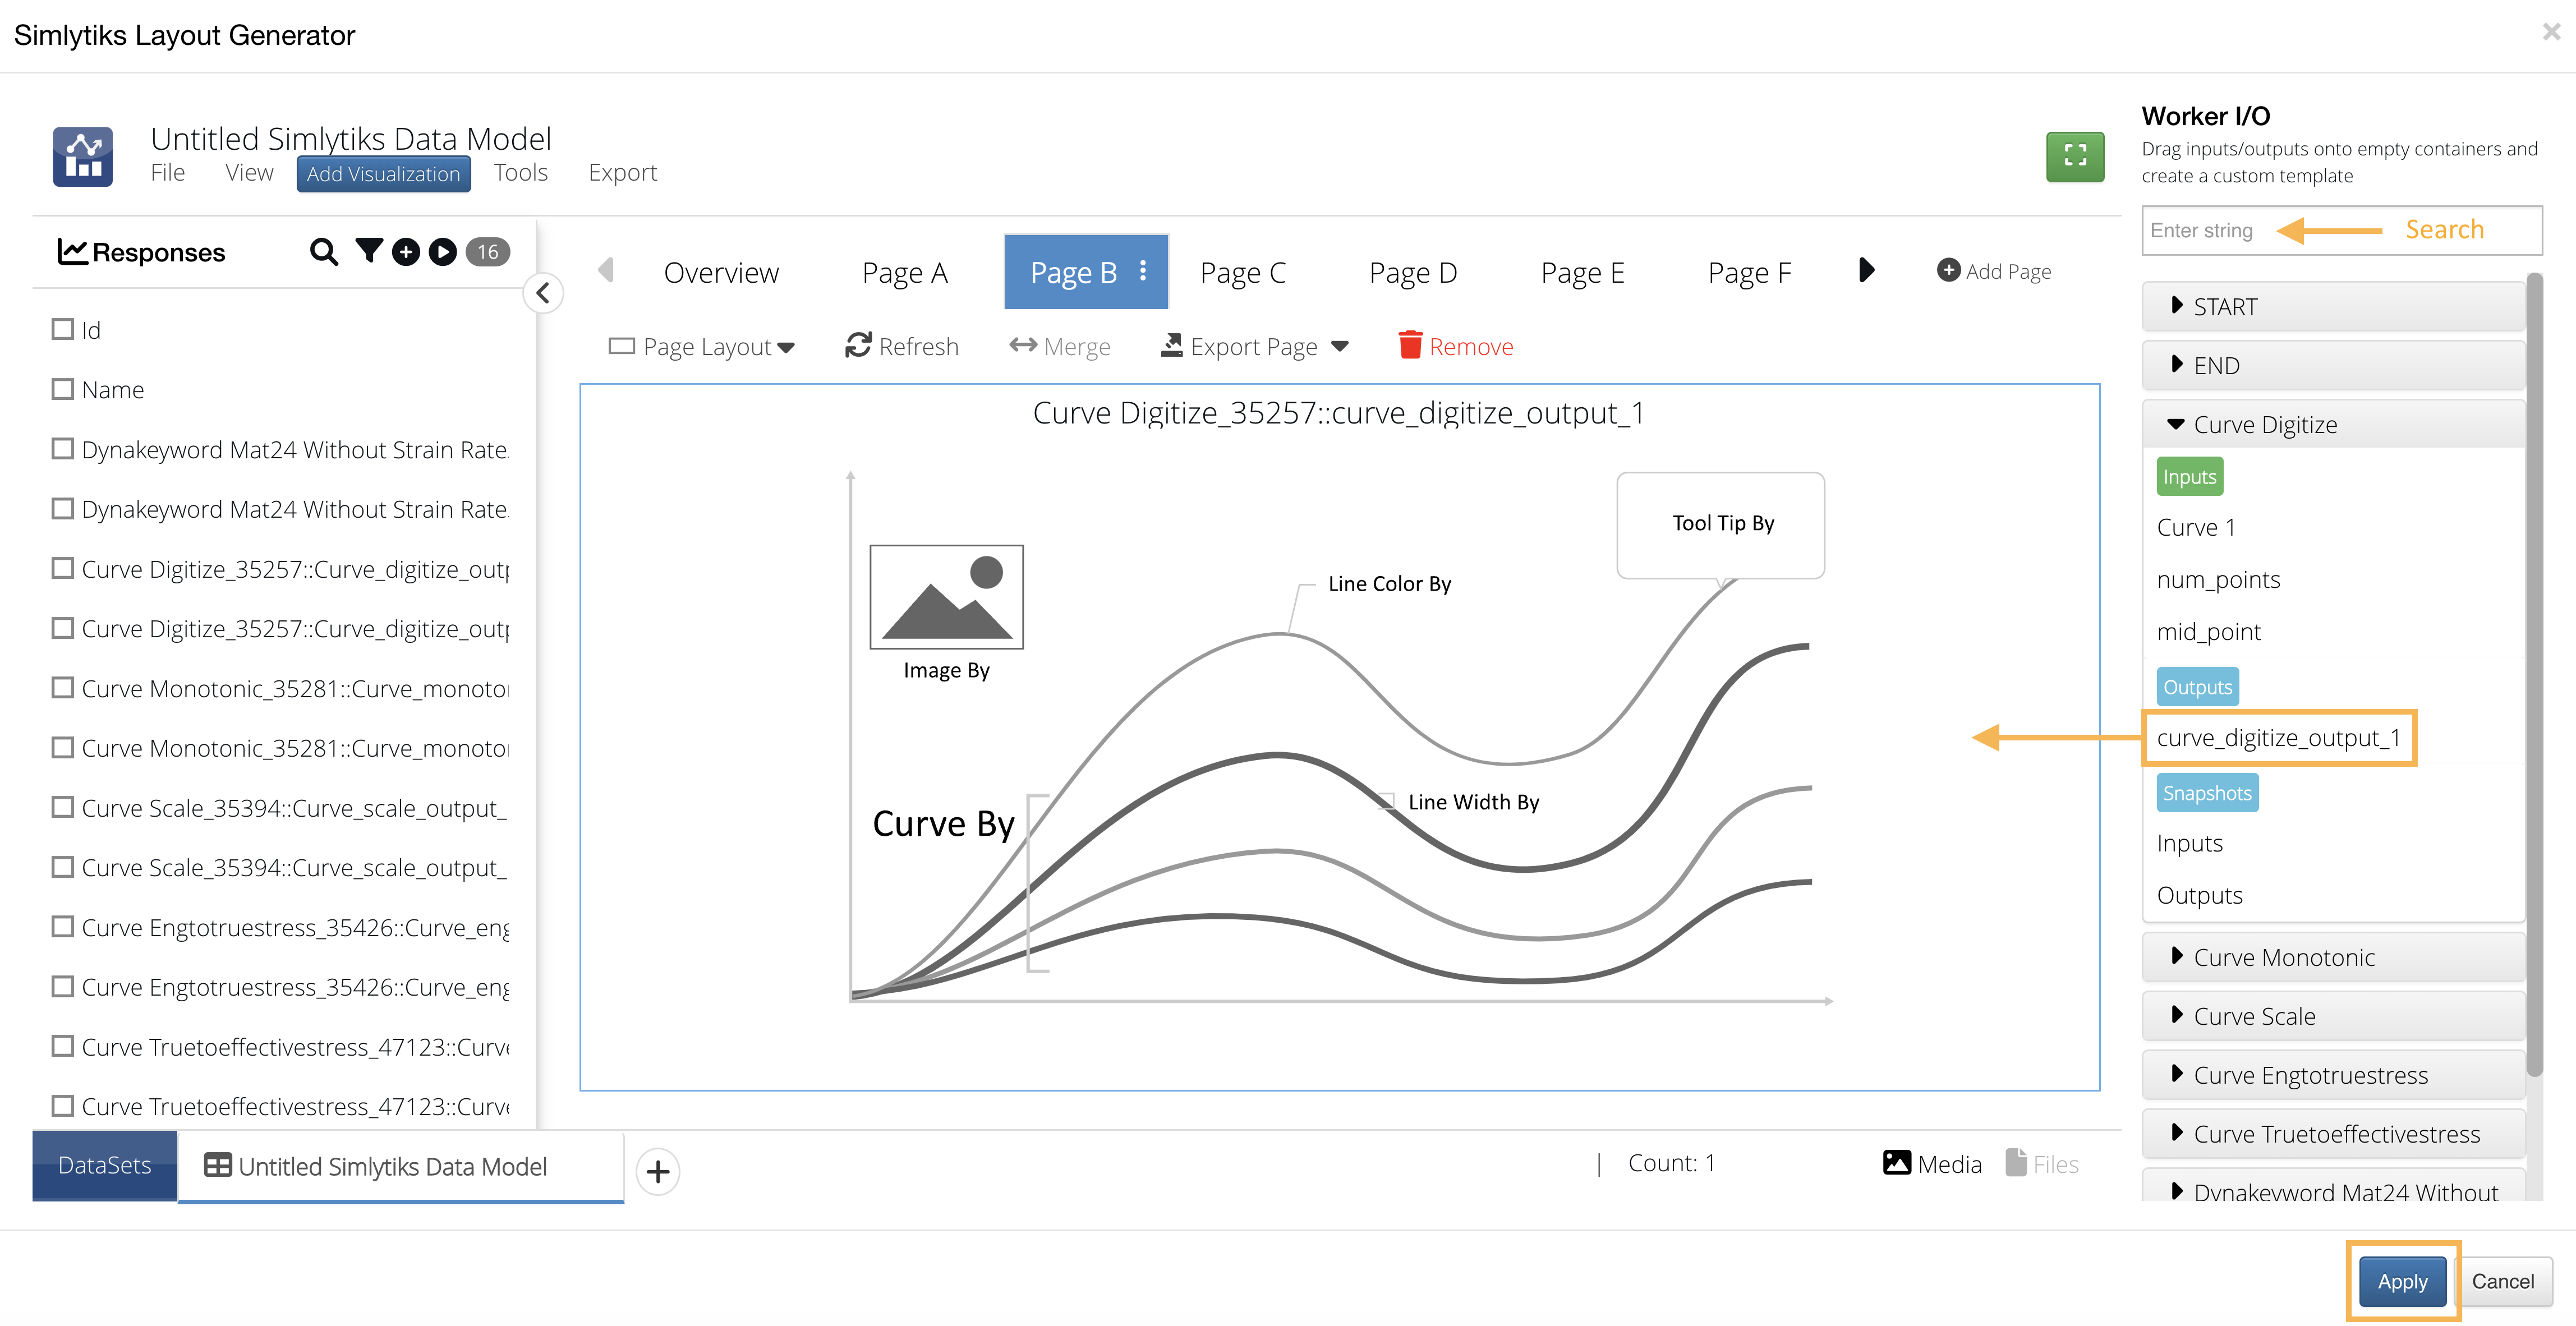
Figure 29: Simlytiks Layout Generator
Another way to add inputs to the report generator is directly from a worker modal.
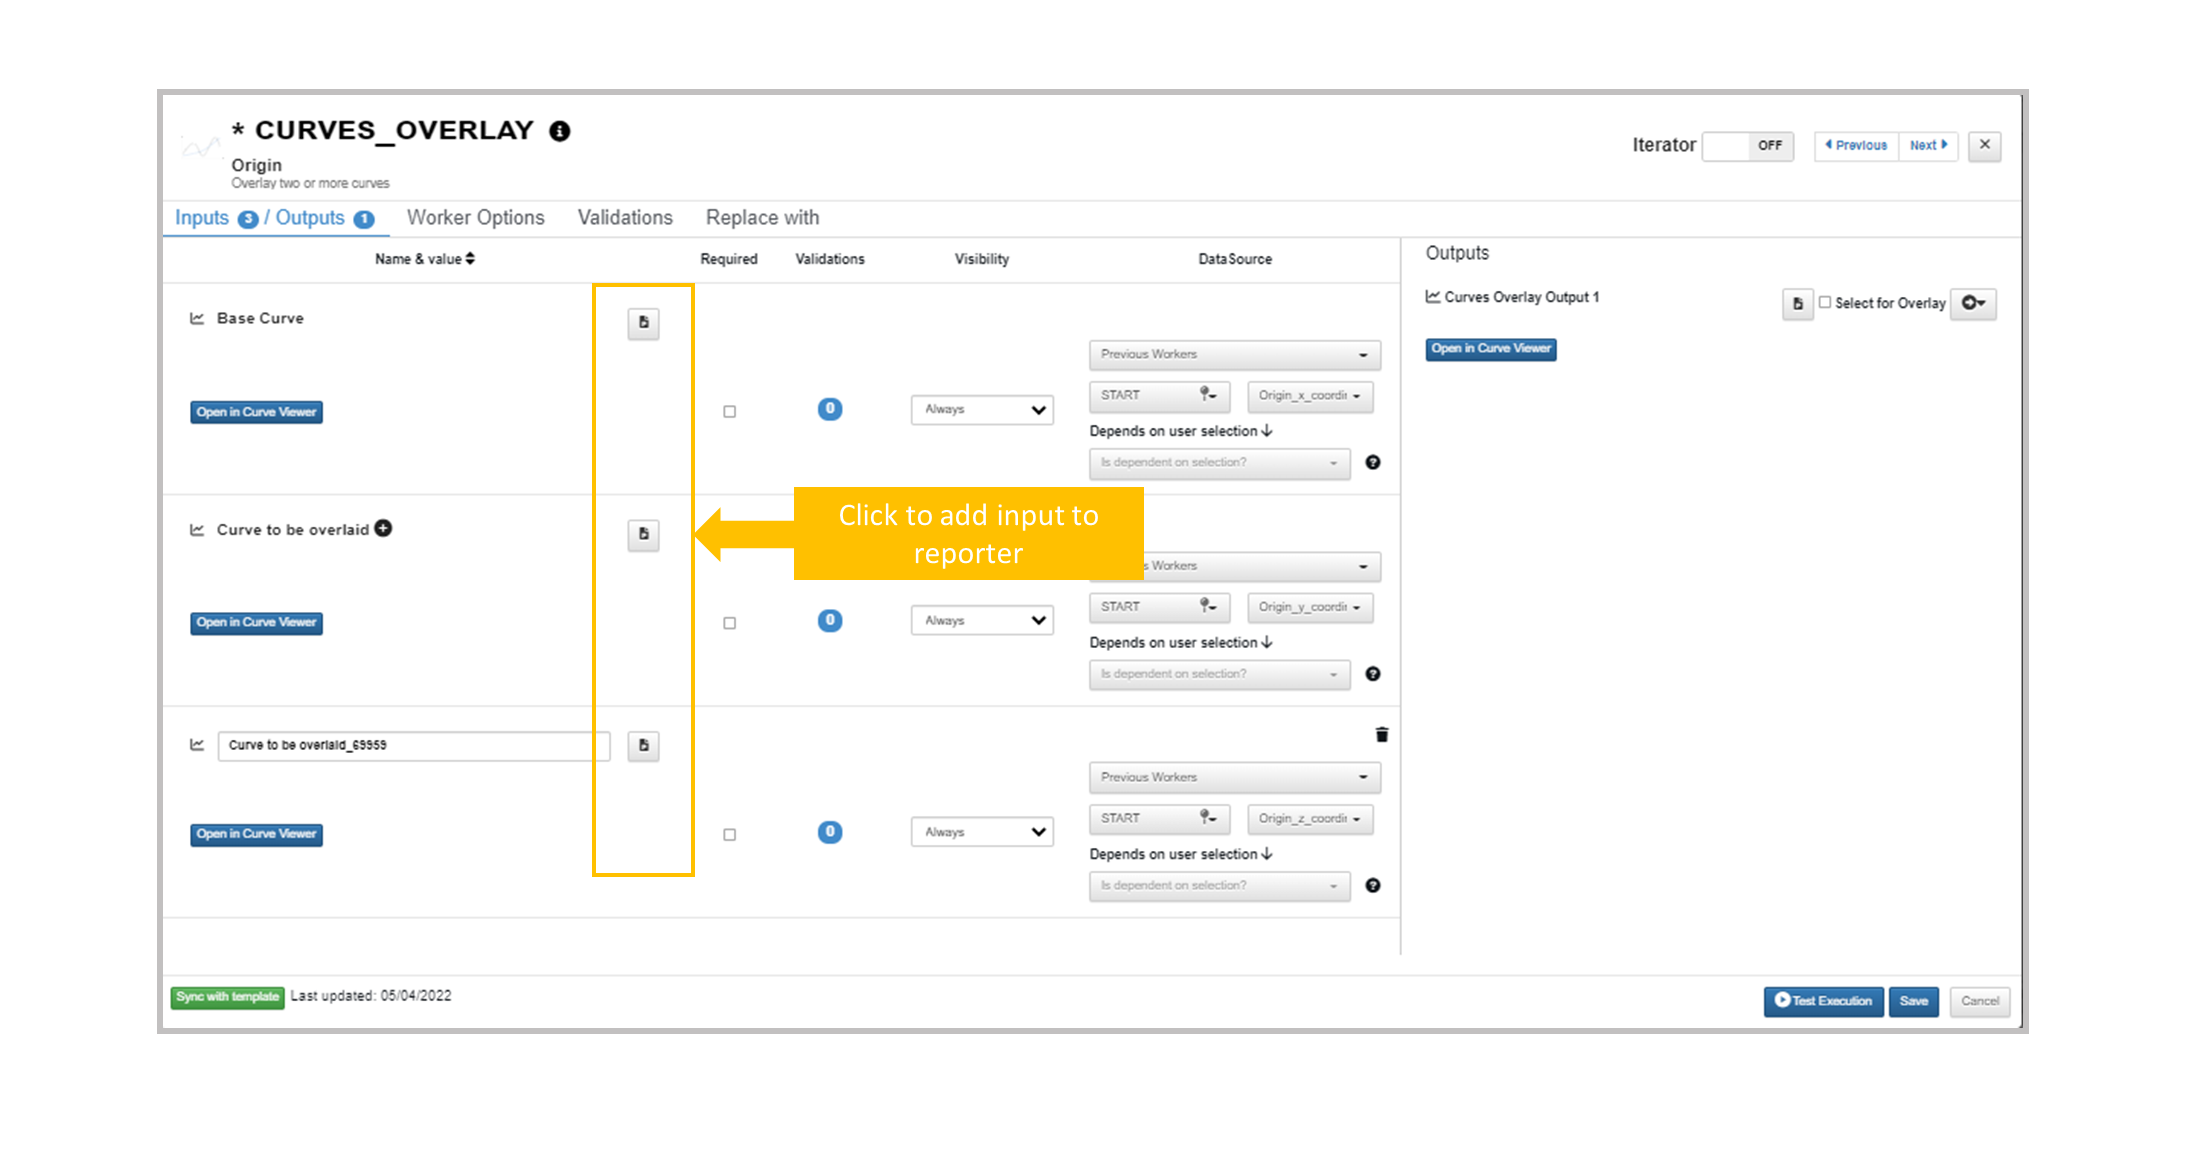
Figure 30: Add Worker Inputs to Report Generator
The Report Generator also has a new option (June 3, 2022) to include editable tables in the report.
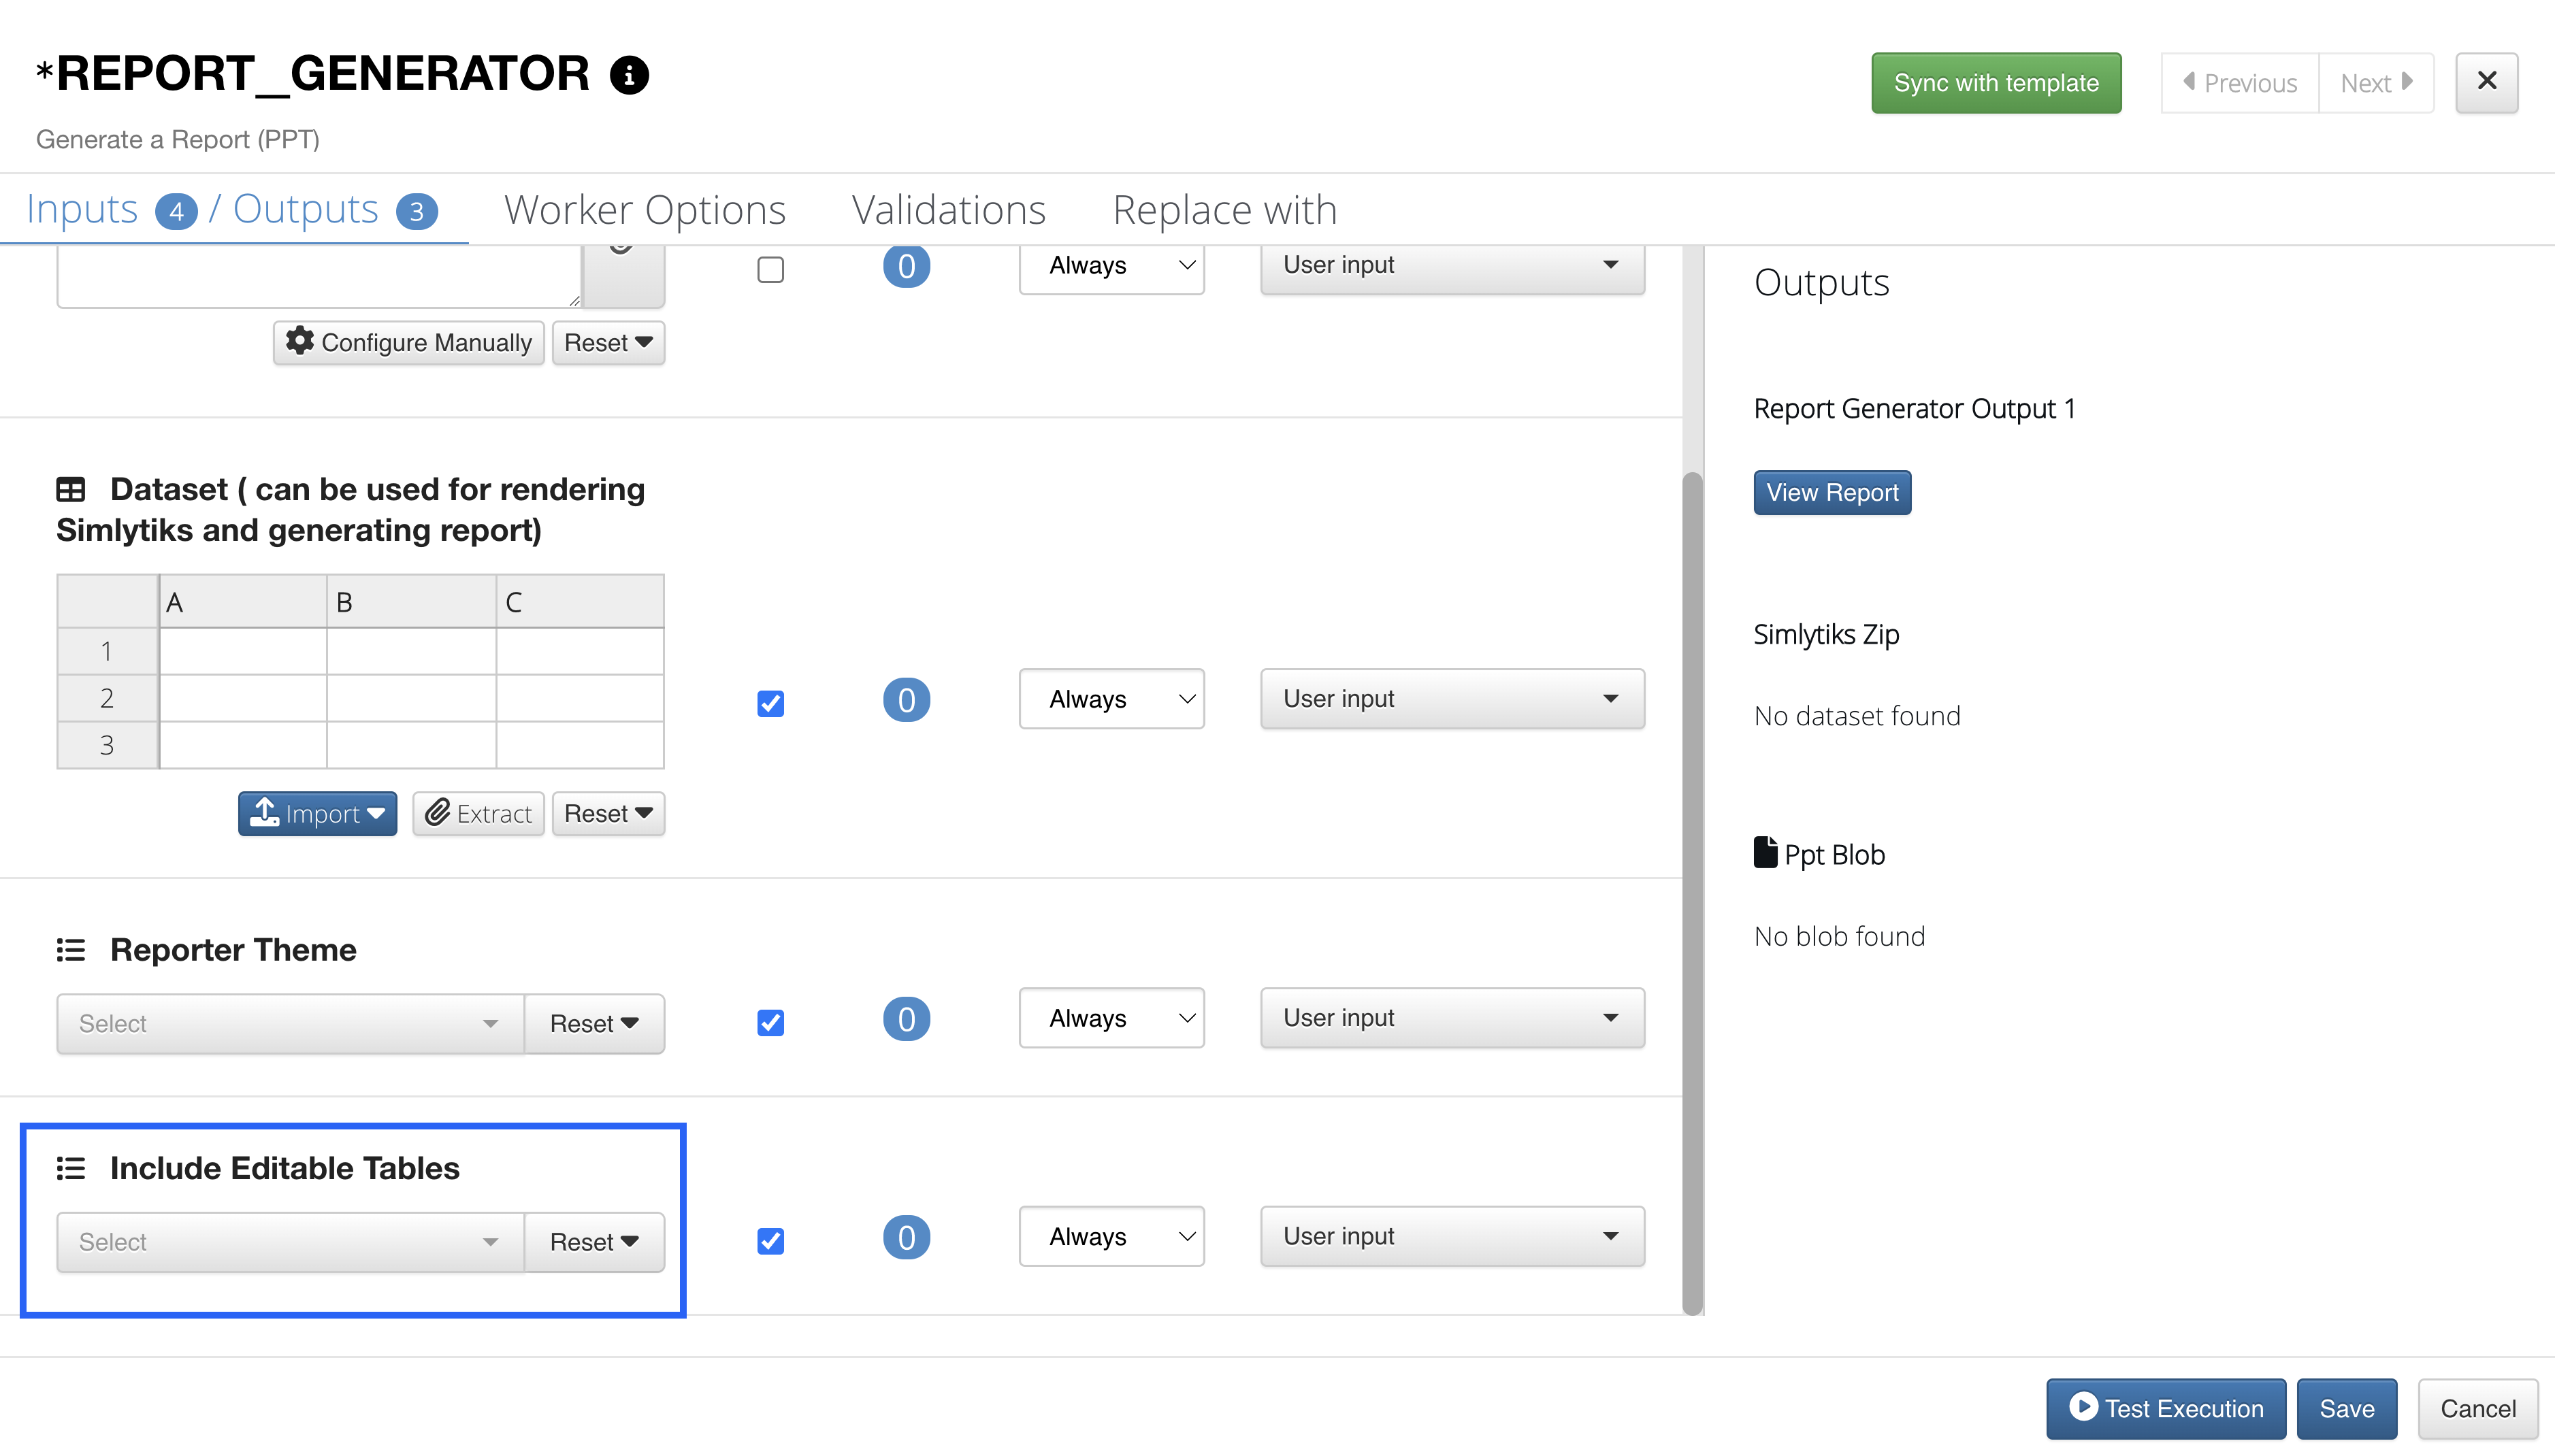
Figure 31: Add Worker Inputs to Report Generator
Check out the following video to see the full set-up in action:
Multiple Datasets
Report Generator has the option to use and configure multiple datasets.
First, we’ll want to work with a workflow that has multiple dataset outputs for us to visualize. In this example, we are using a simple material excel parser workflow for test data.
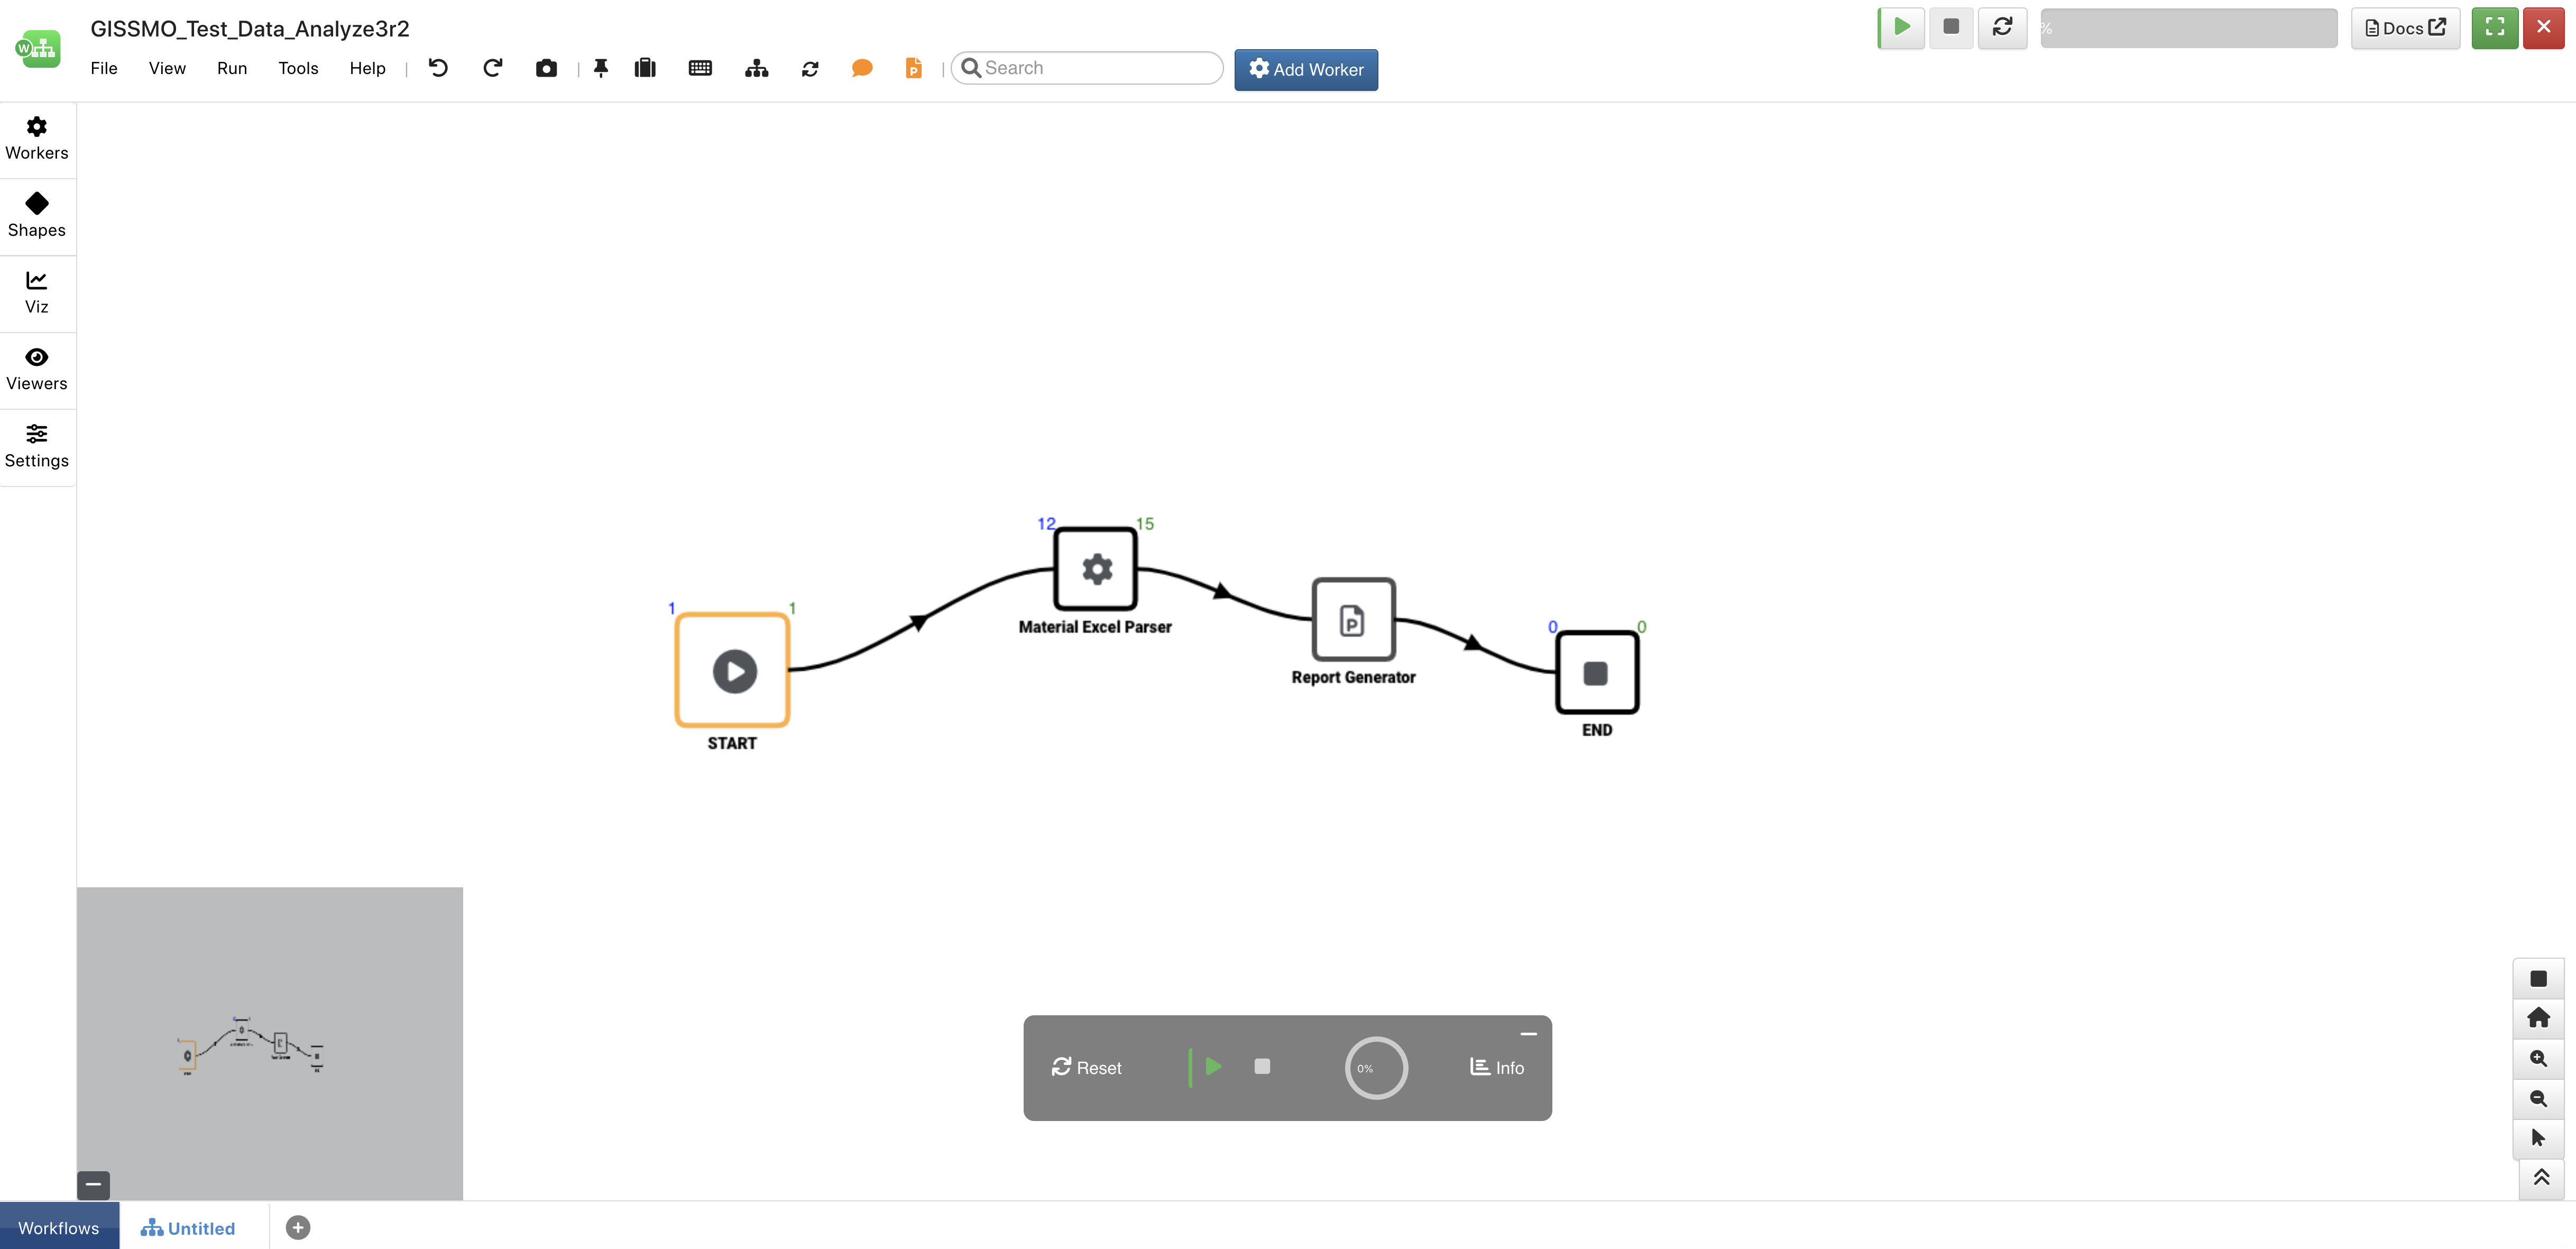
Figure 32: Material Excel Parser Workflow
If we click on the material excel parser worker, we’ll notice the multiple dataset outputs available for viewing.
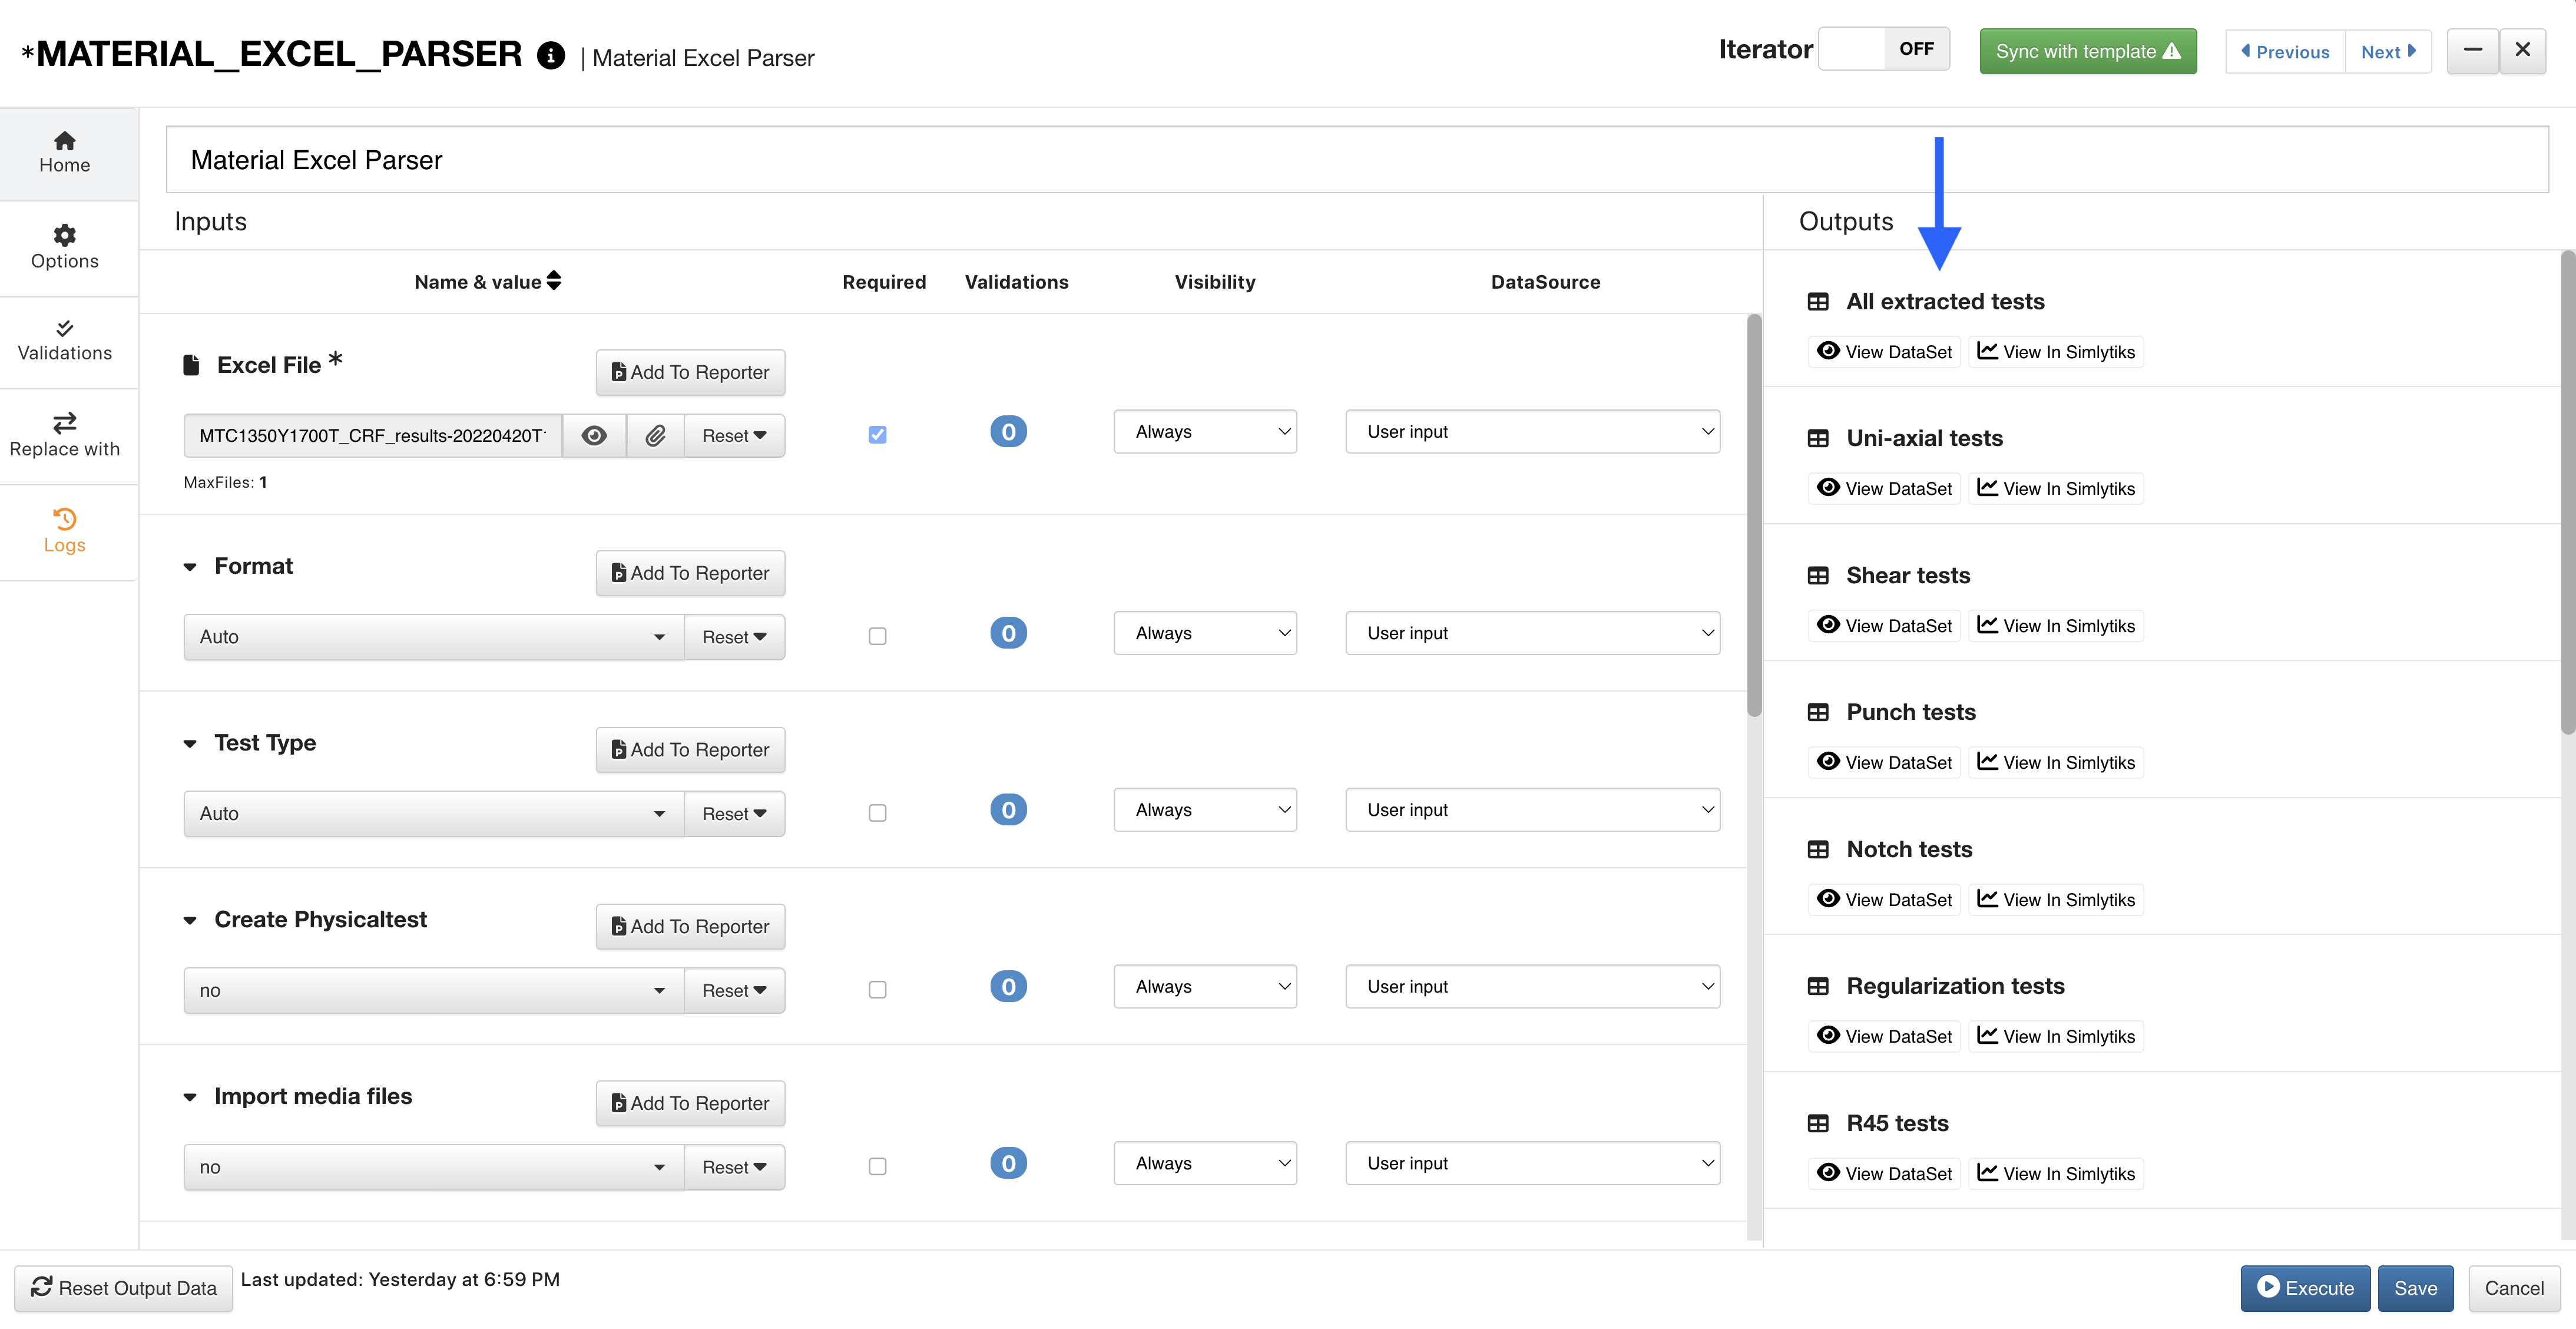
Figure 33: Material Excel Parser Outputs
Let’s open our Report Generator worker, and in the dataset option, we’ll choose Previous Workers.
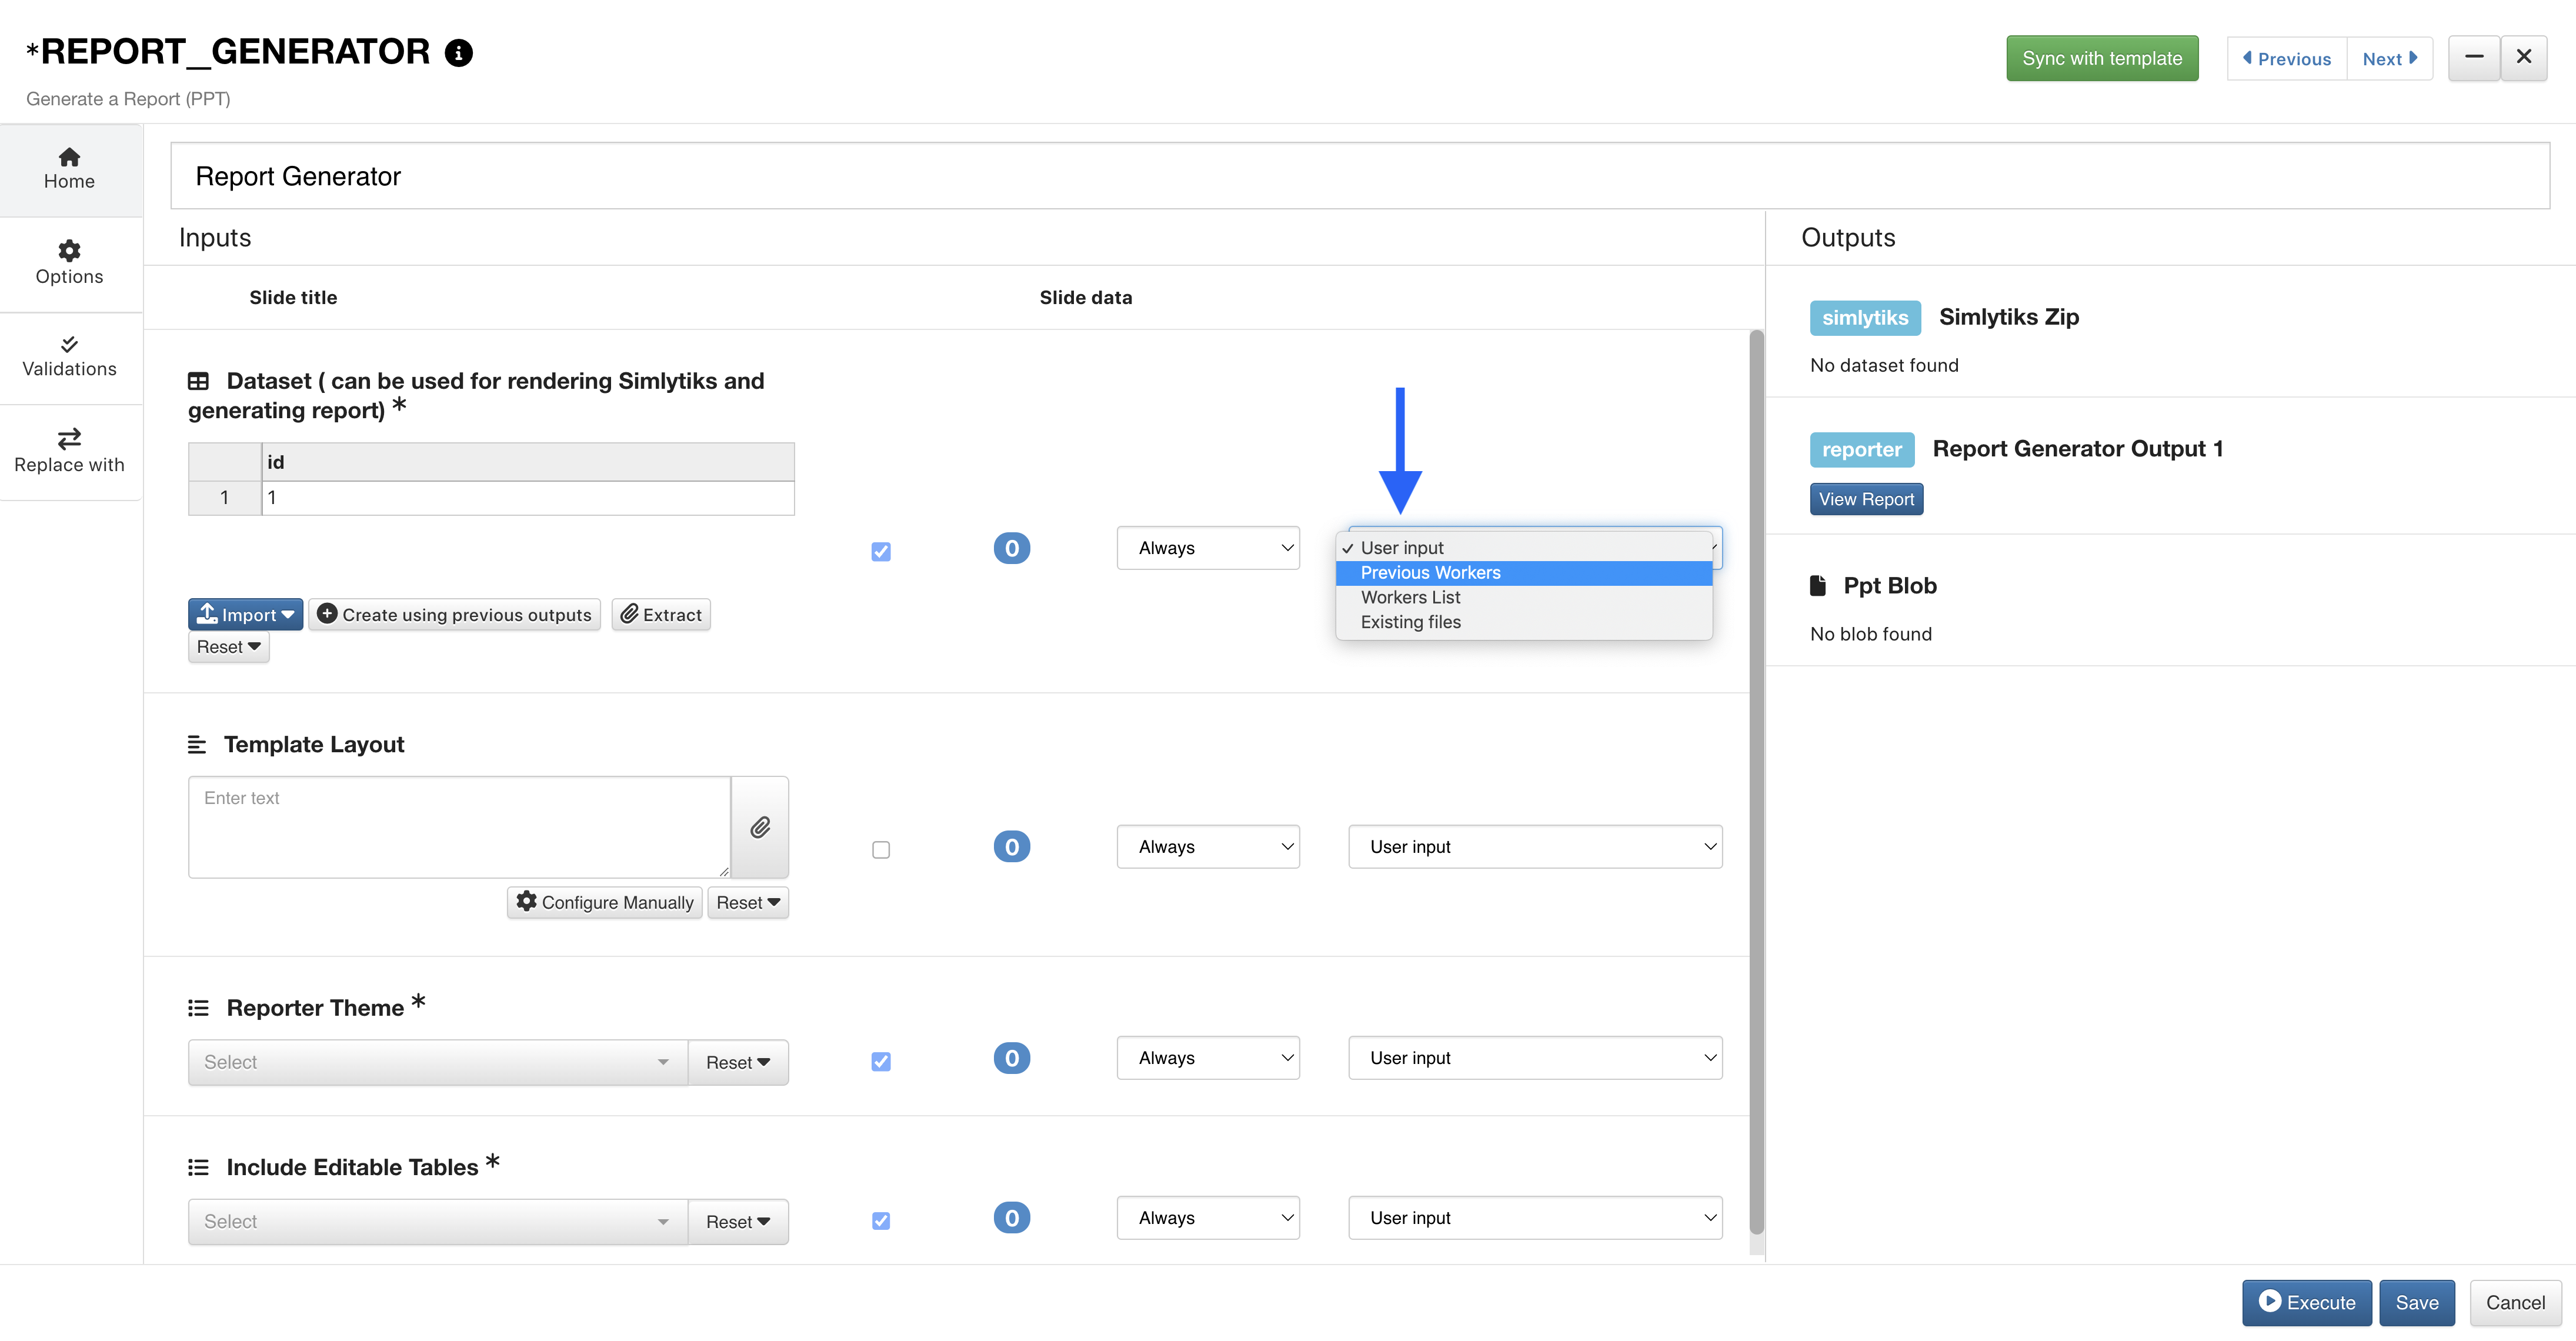
Figure 34: Report Generator Previous Workers
Next, we’ll choose the material data parser worker.
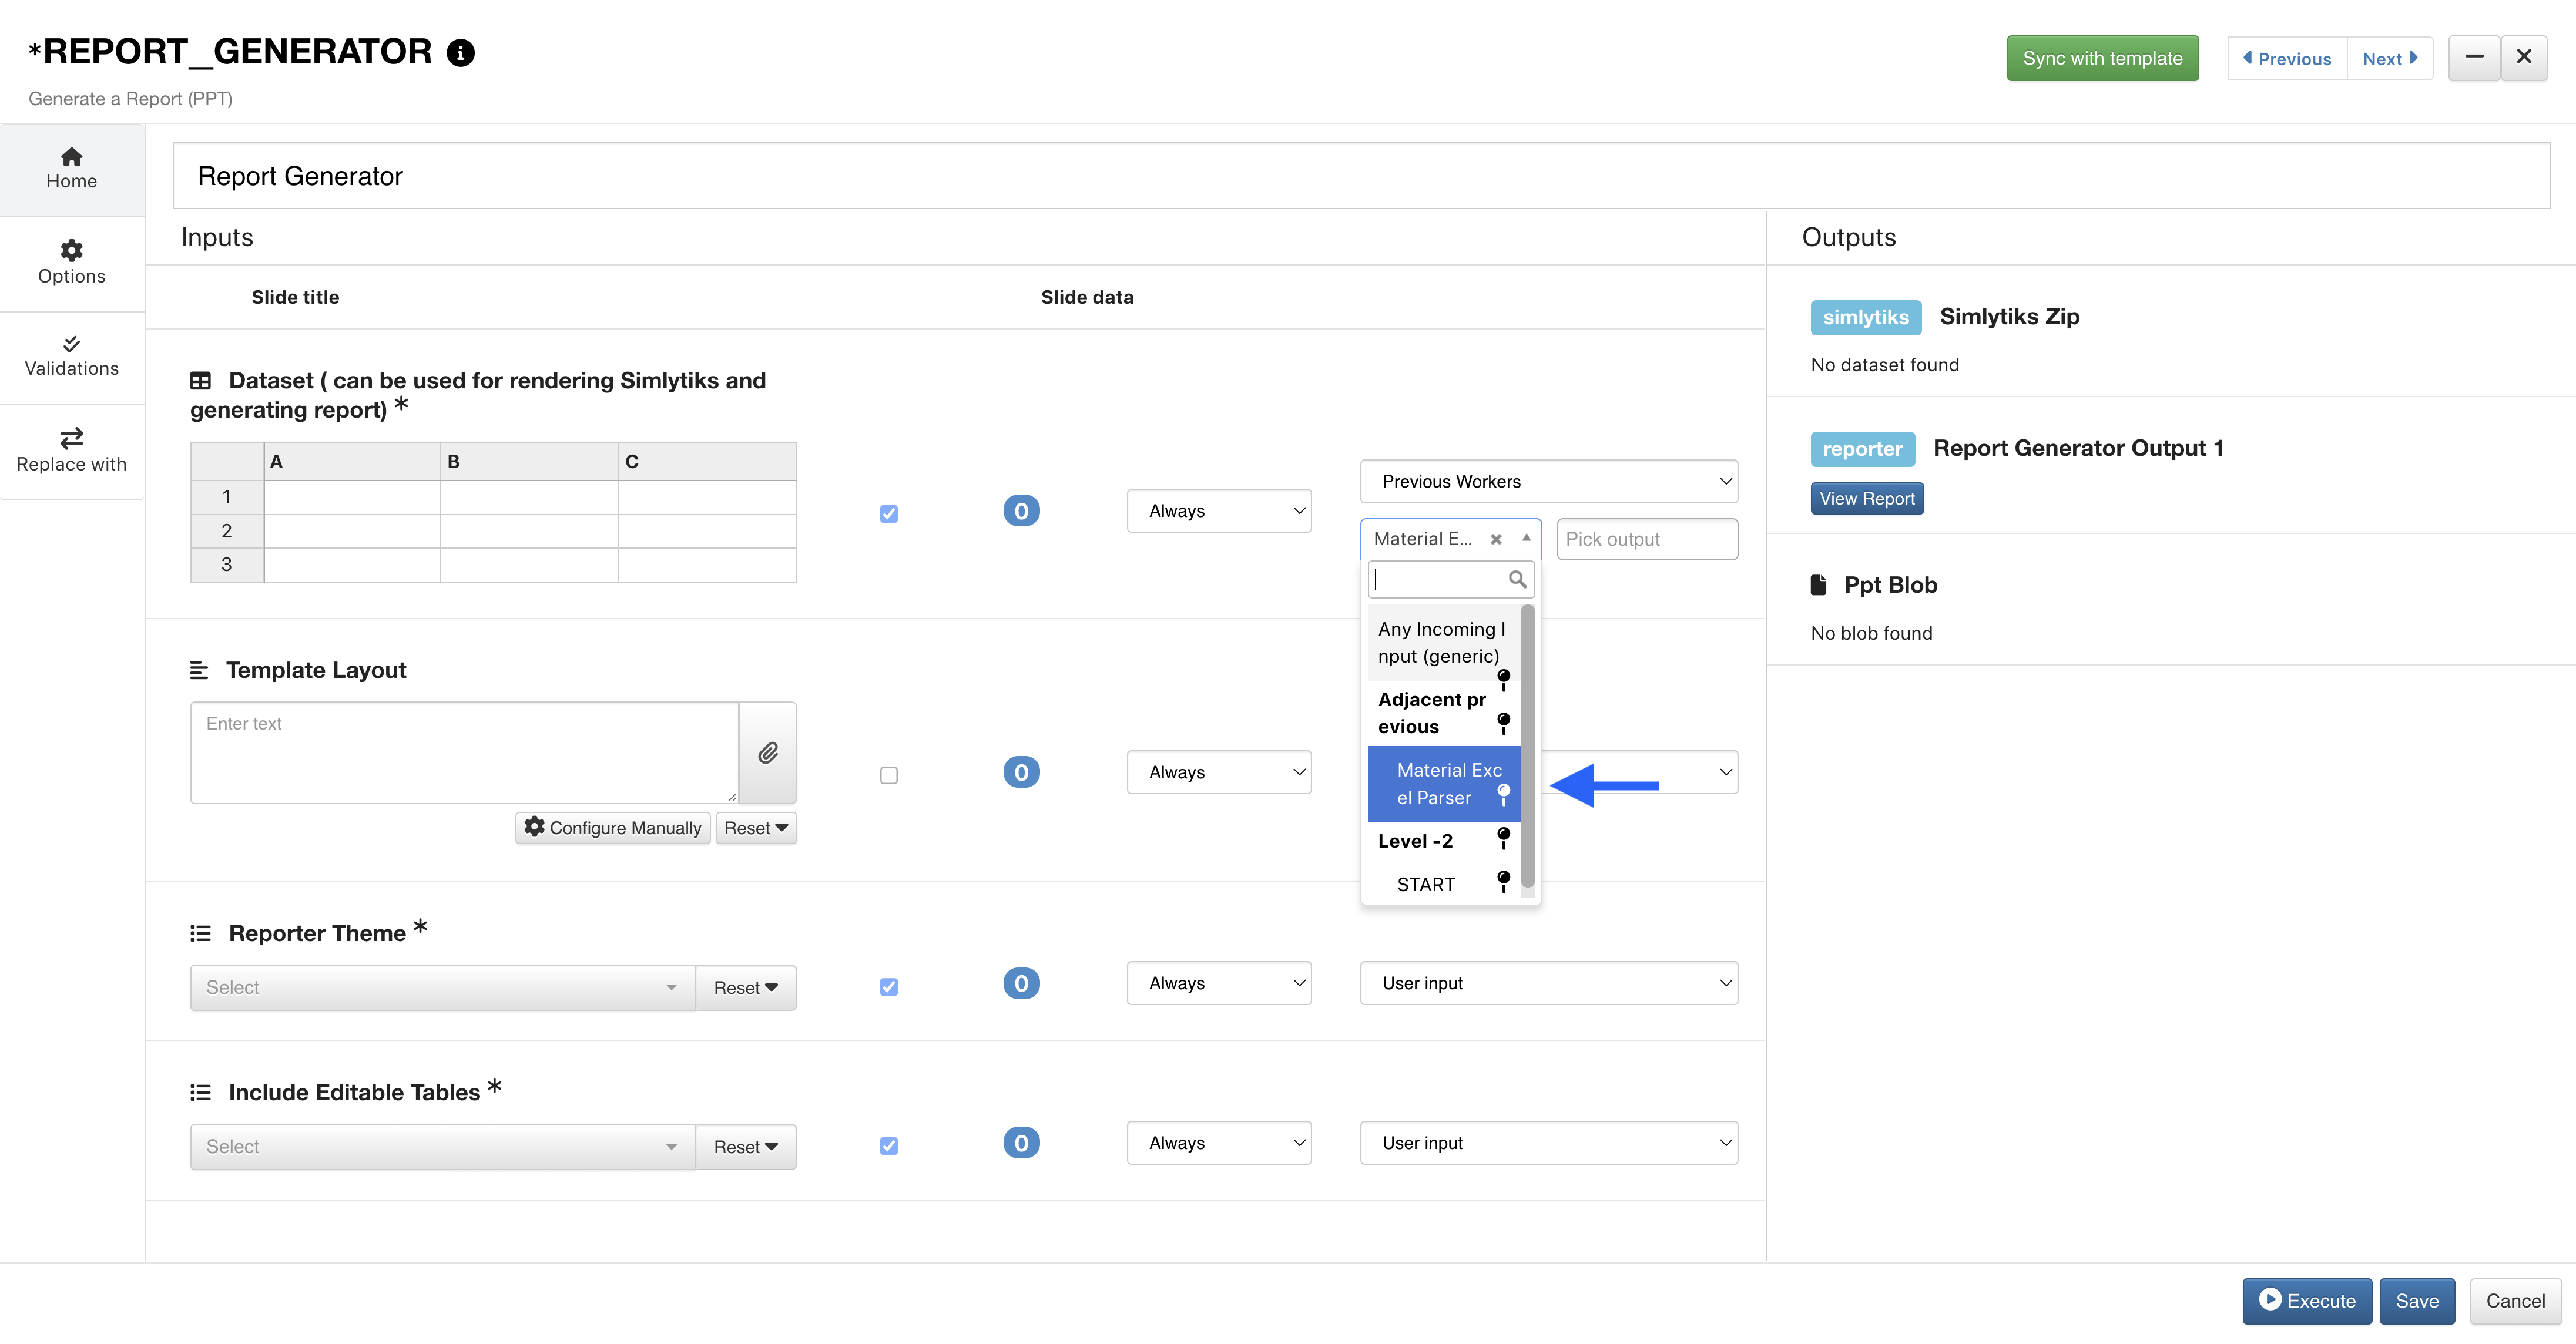
Figure 35: Choose Material Excel Parser
Then, add multiple outputs as our datasets.
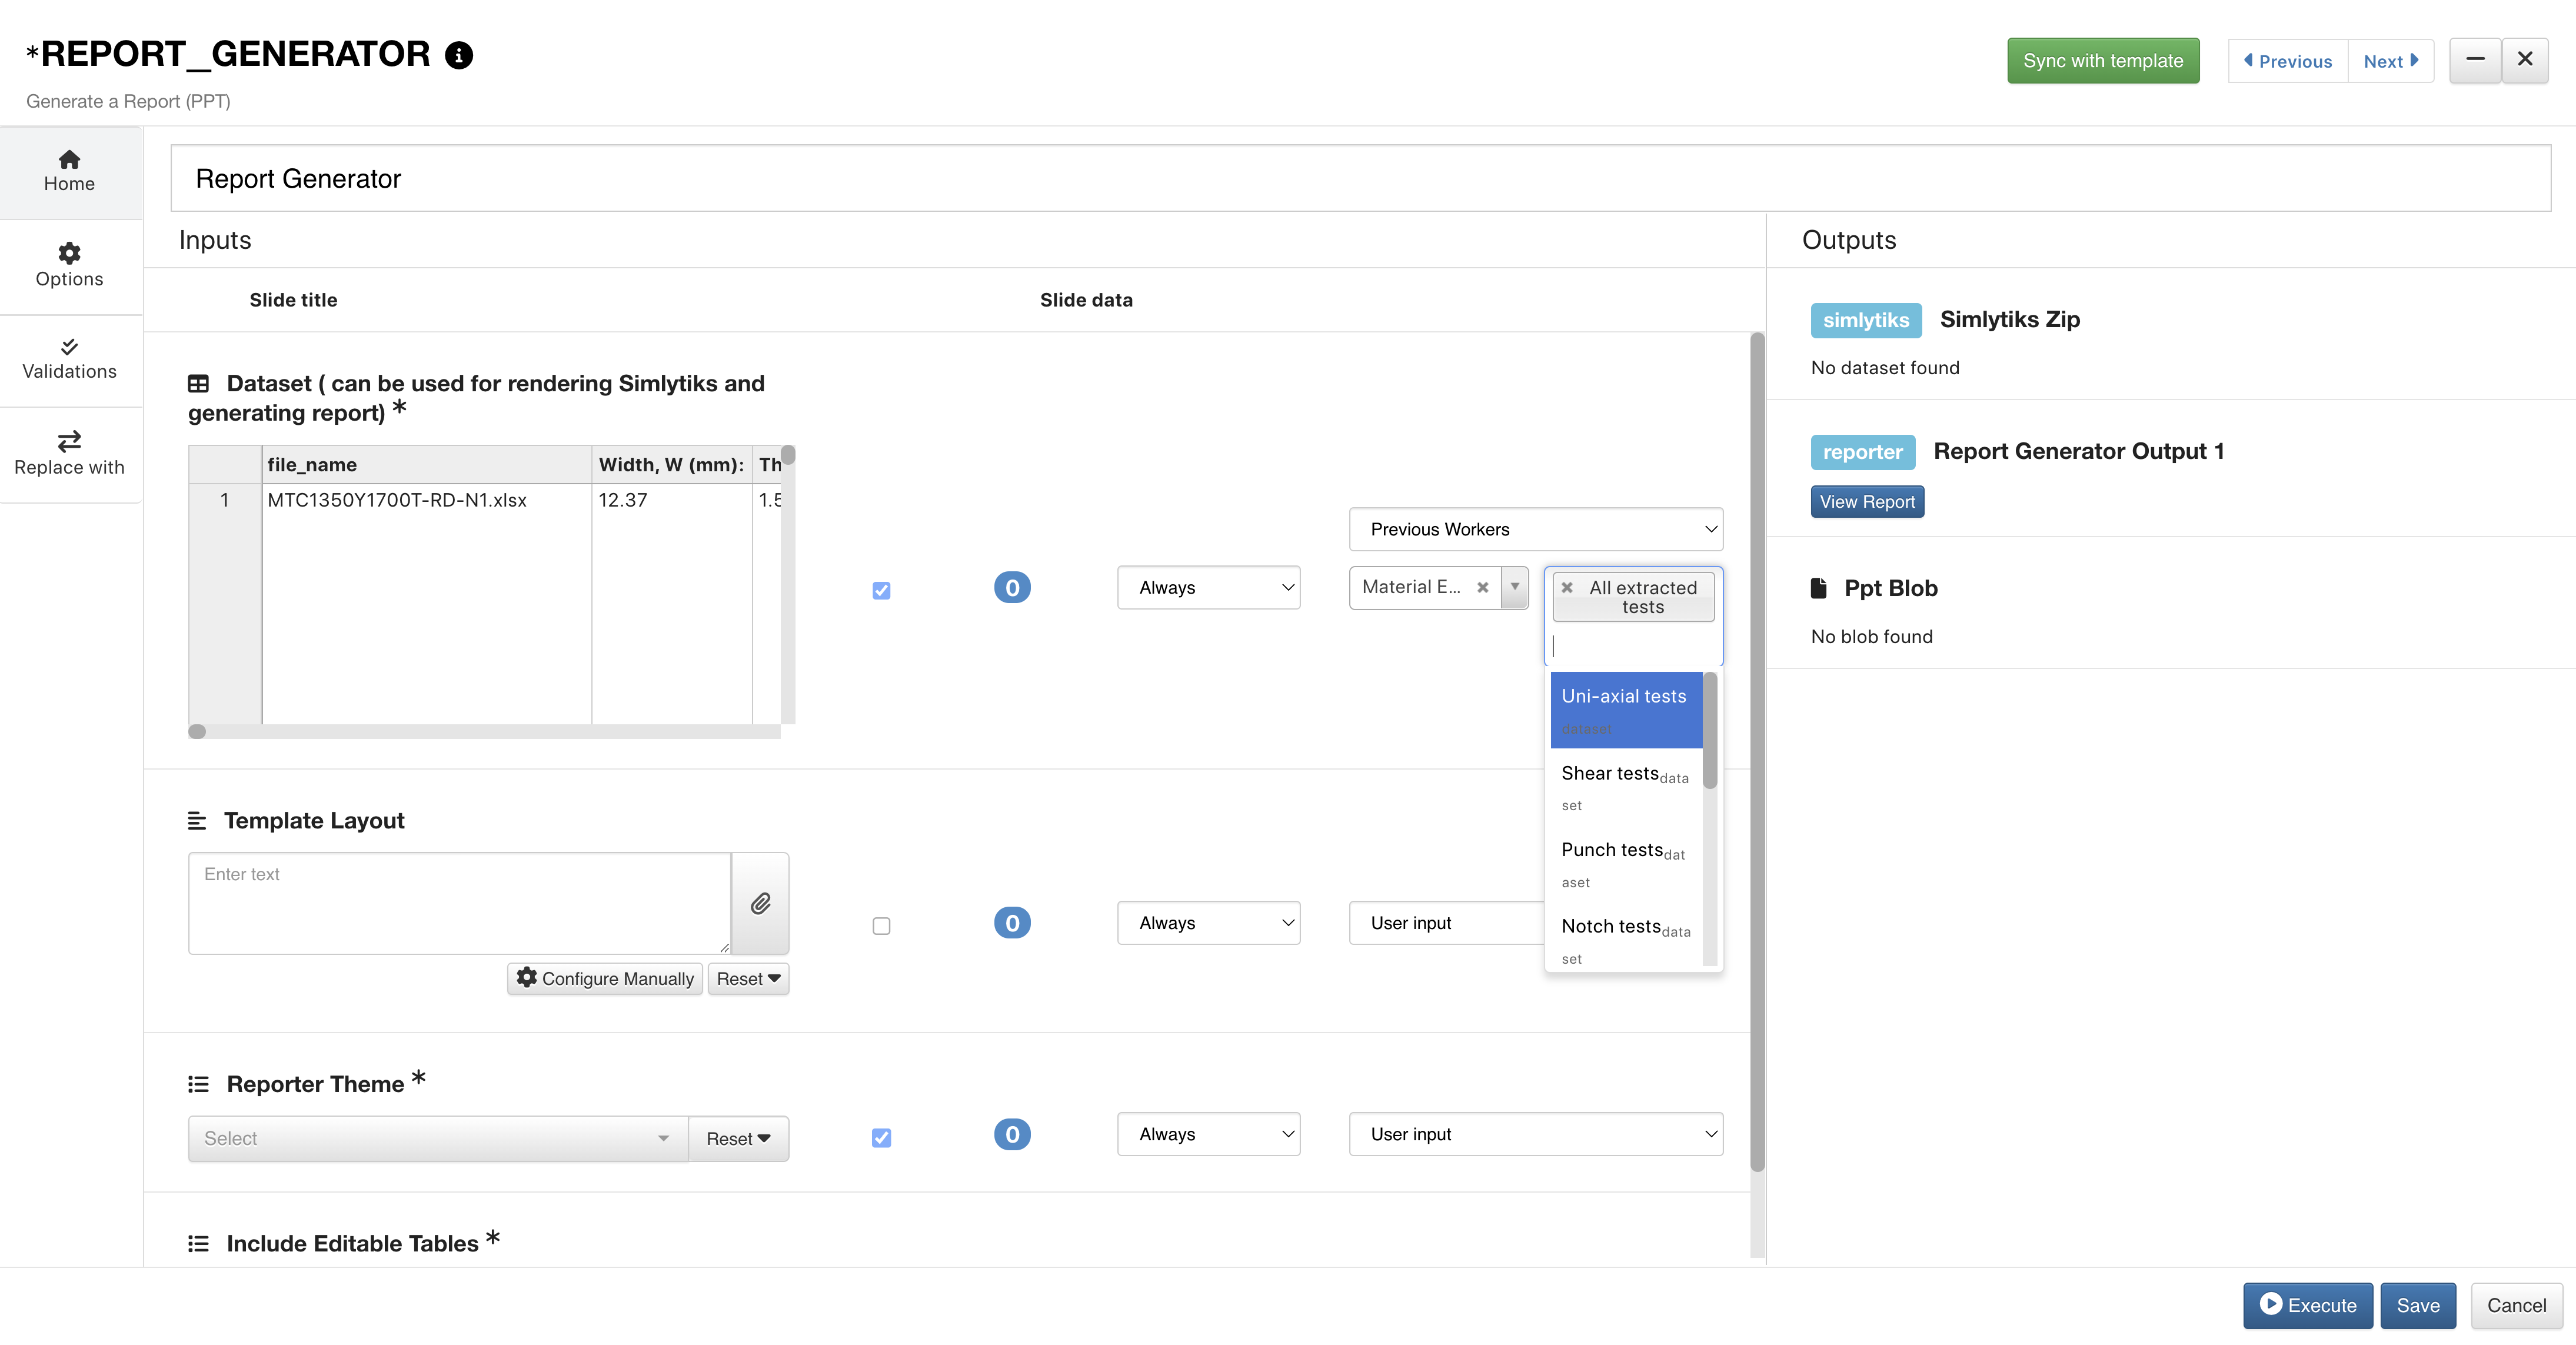
Figure 36: Add Multiple Dataset Outputs
Once we’ve added what we want to generate a report from, we’ll click on the Configure Manually button to update our Simlytiks layout.
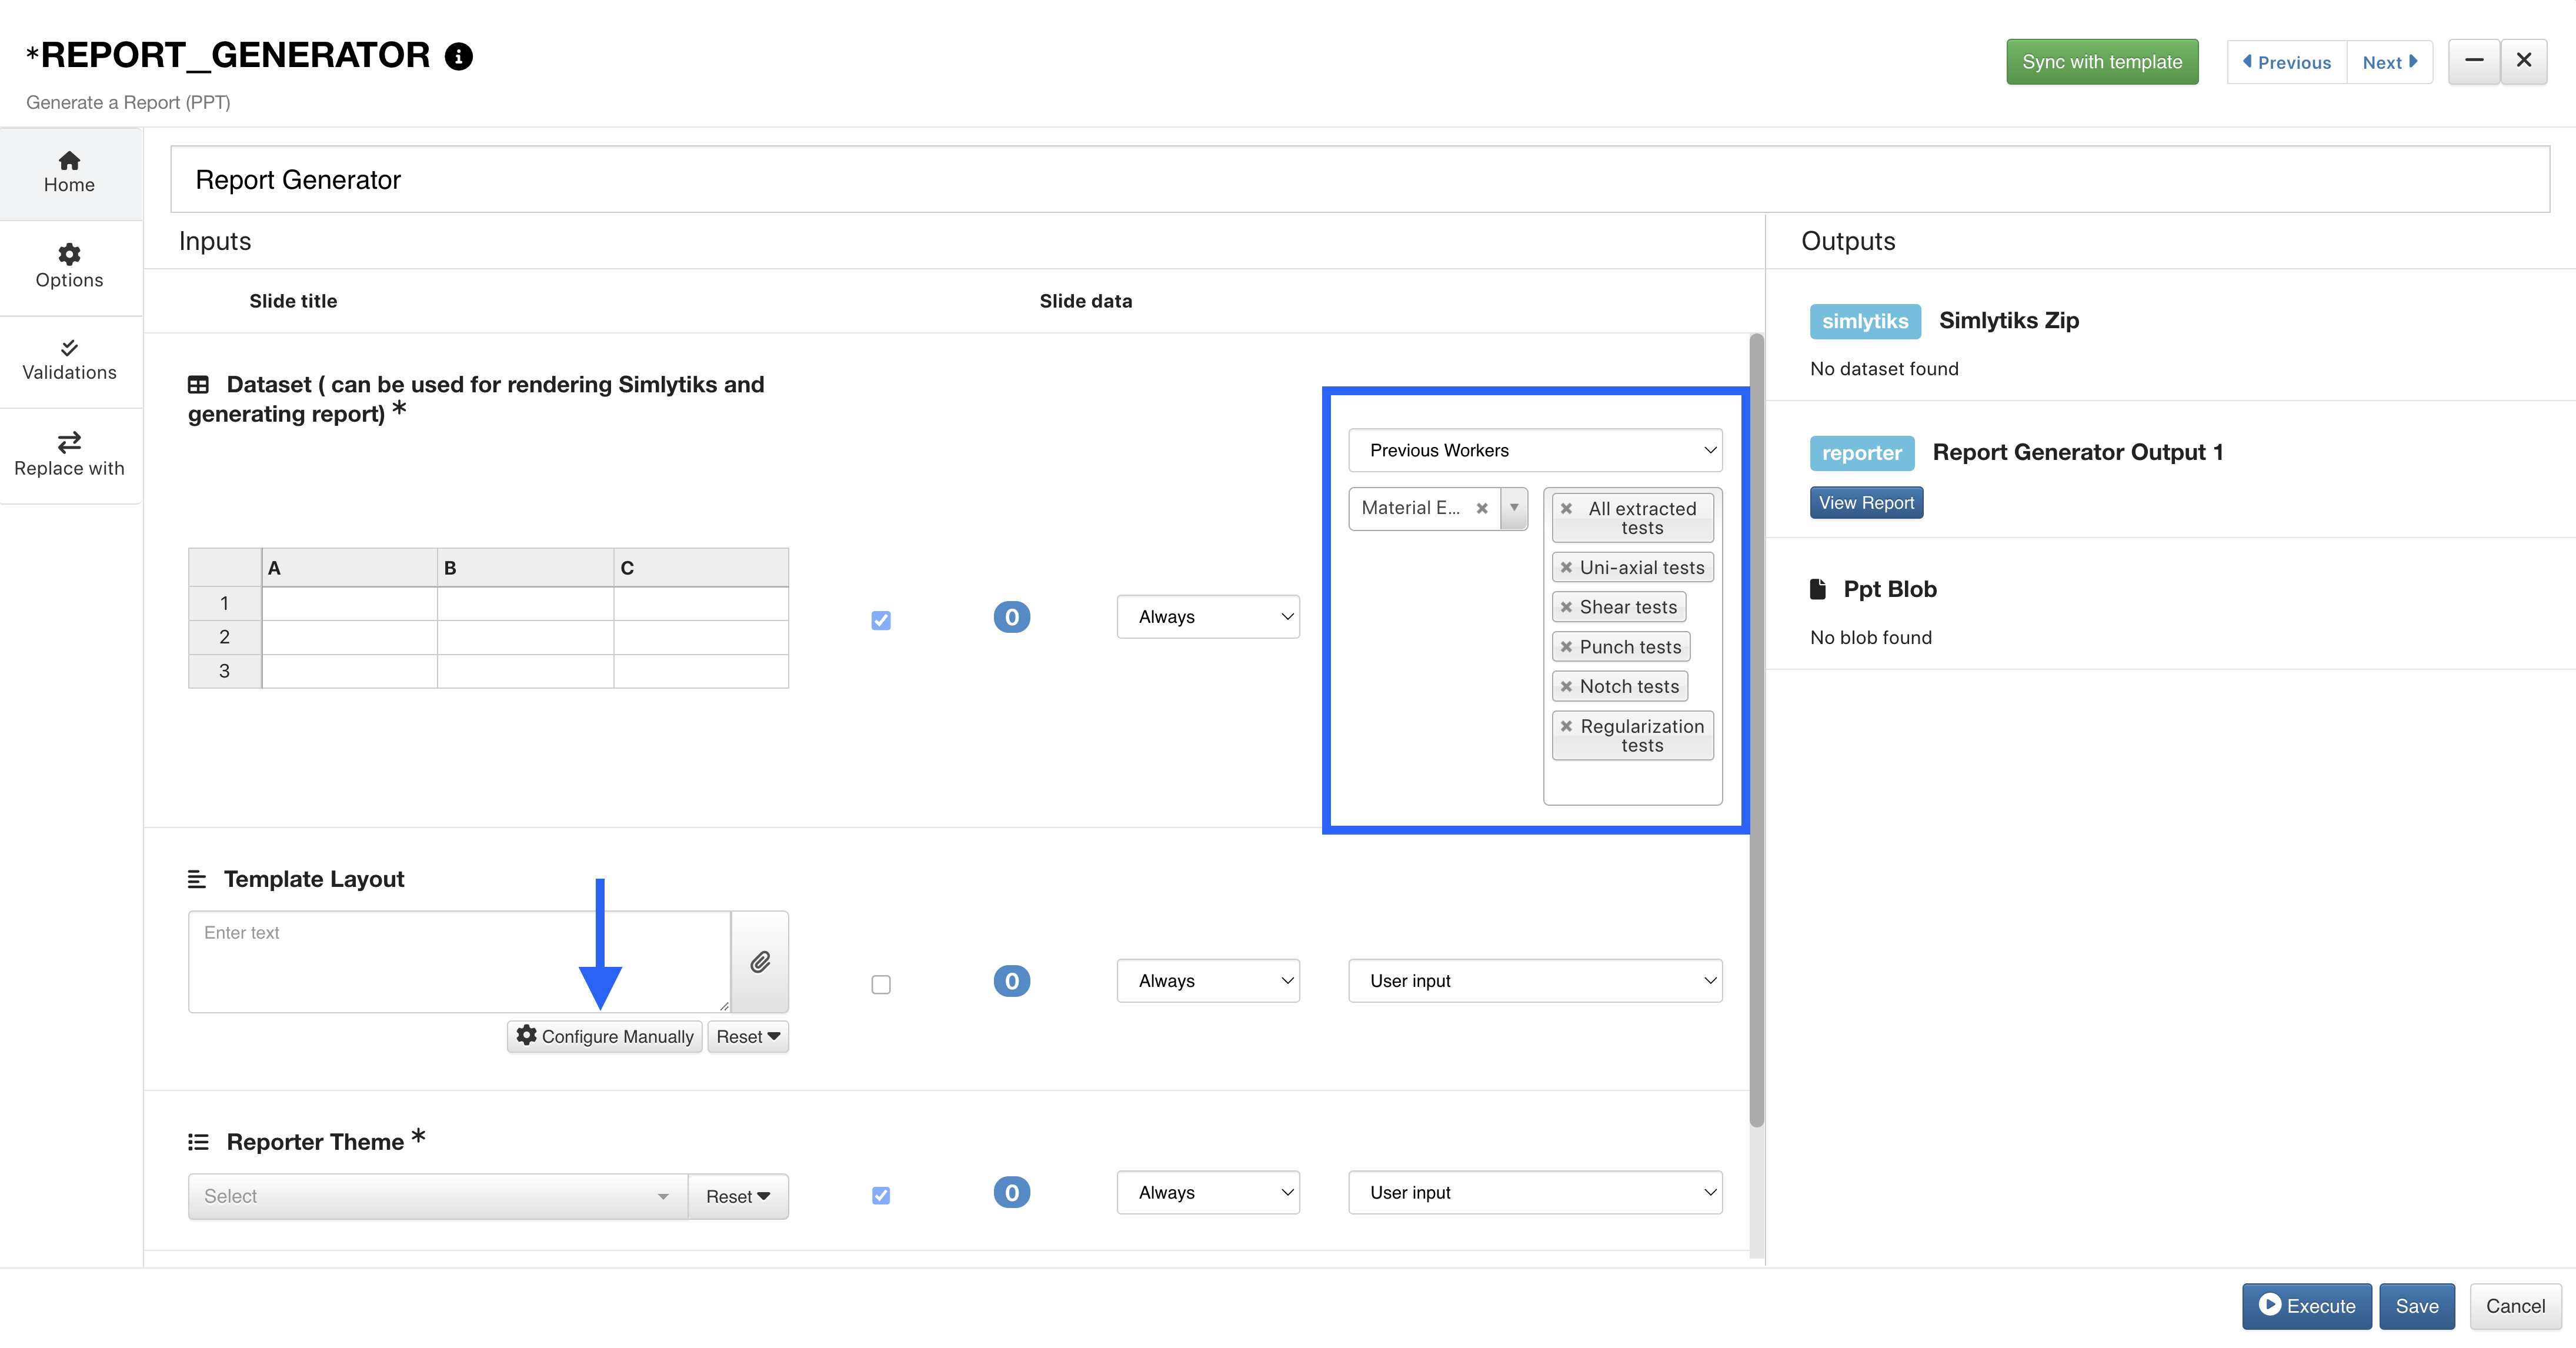
Figure 37: Chosen Datasets and Configure Manually
Here, we’ll see multiple dataset tabs at the bottom of the window indicating each output from the material data parser worker.
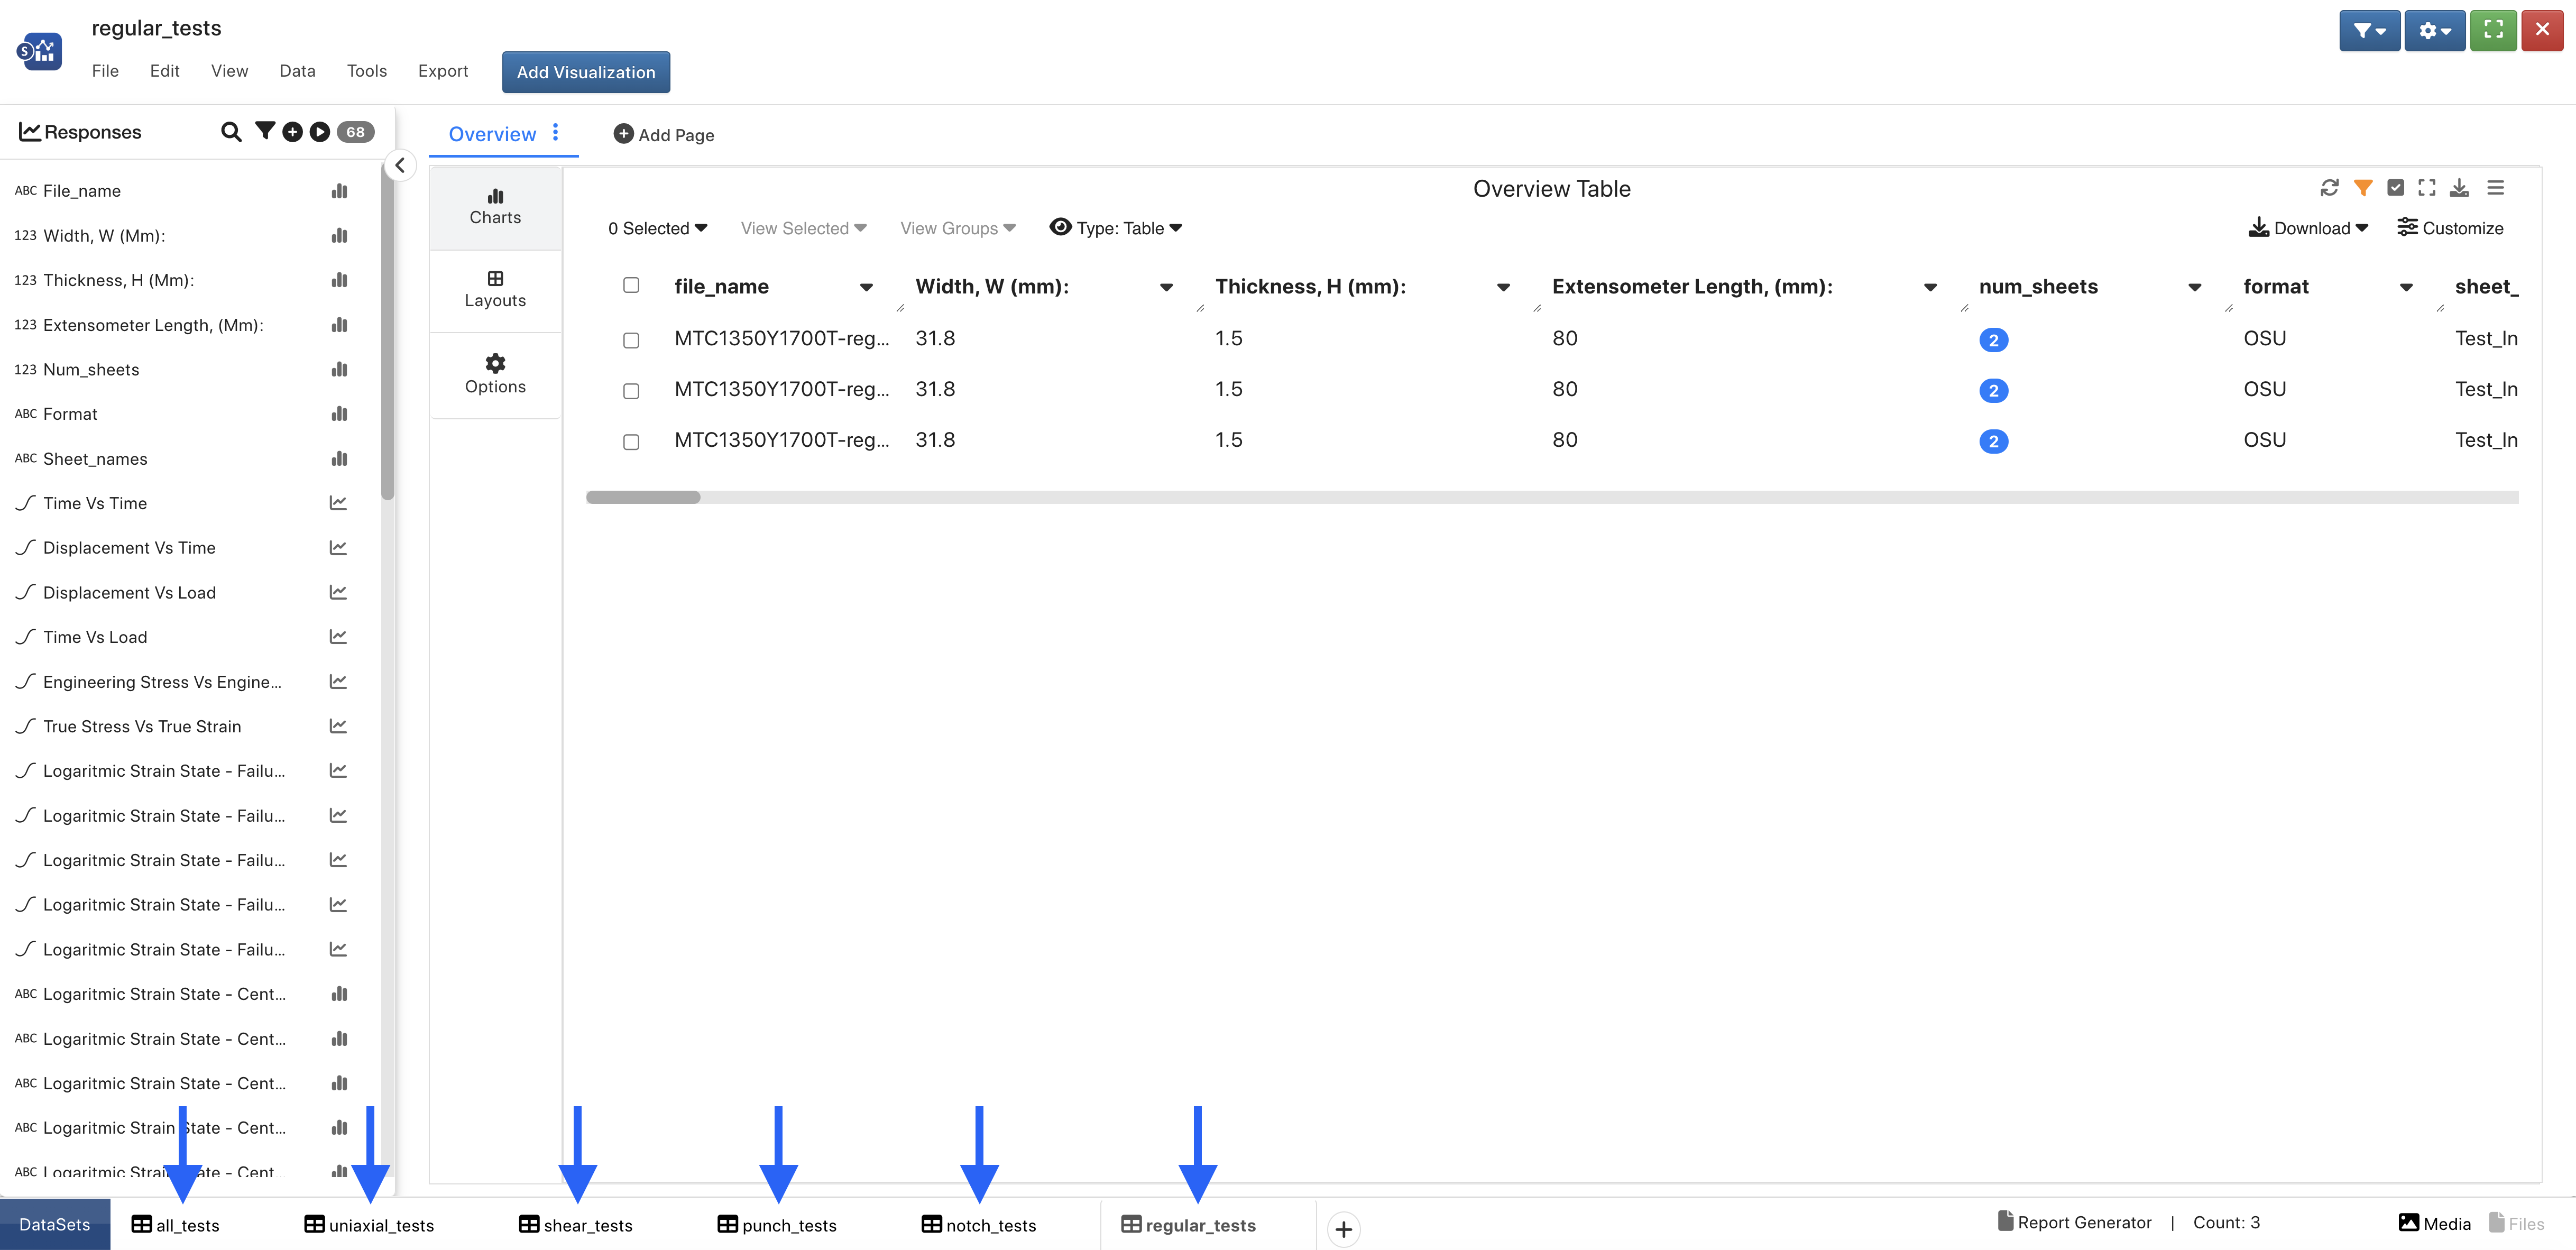
Figure 38: Multiple Dataset Tabs
Add pages and charts as you wish and then click on Save under the File menu to implement the configuration. (We’ll close out to finish).
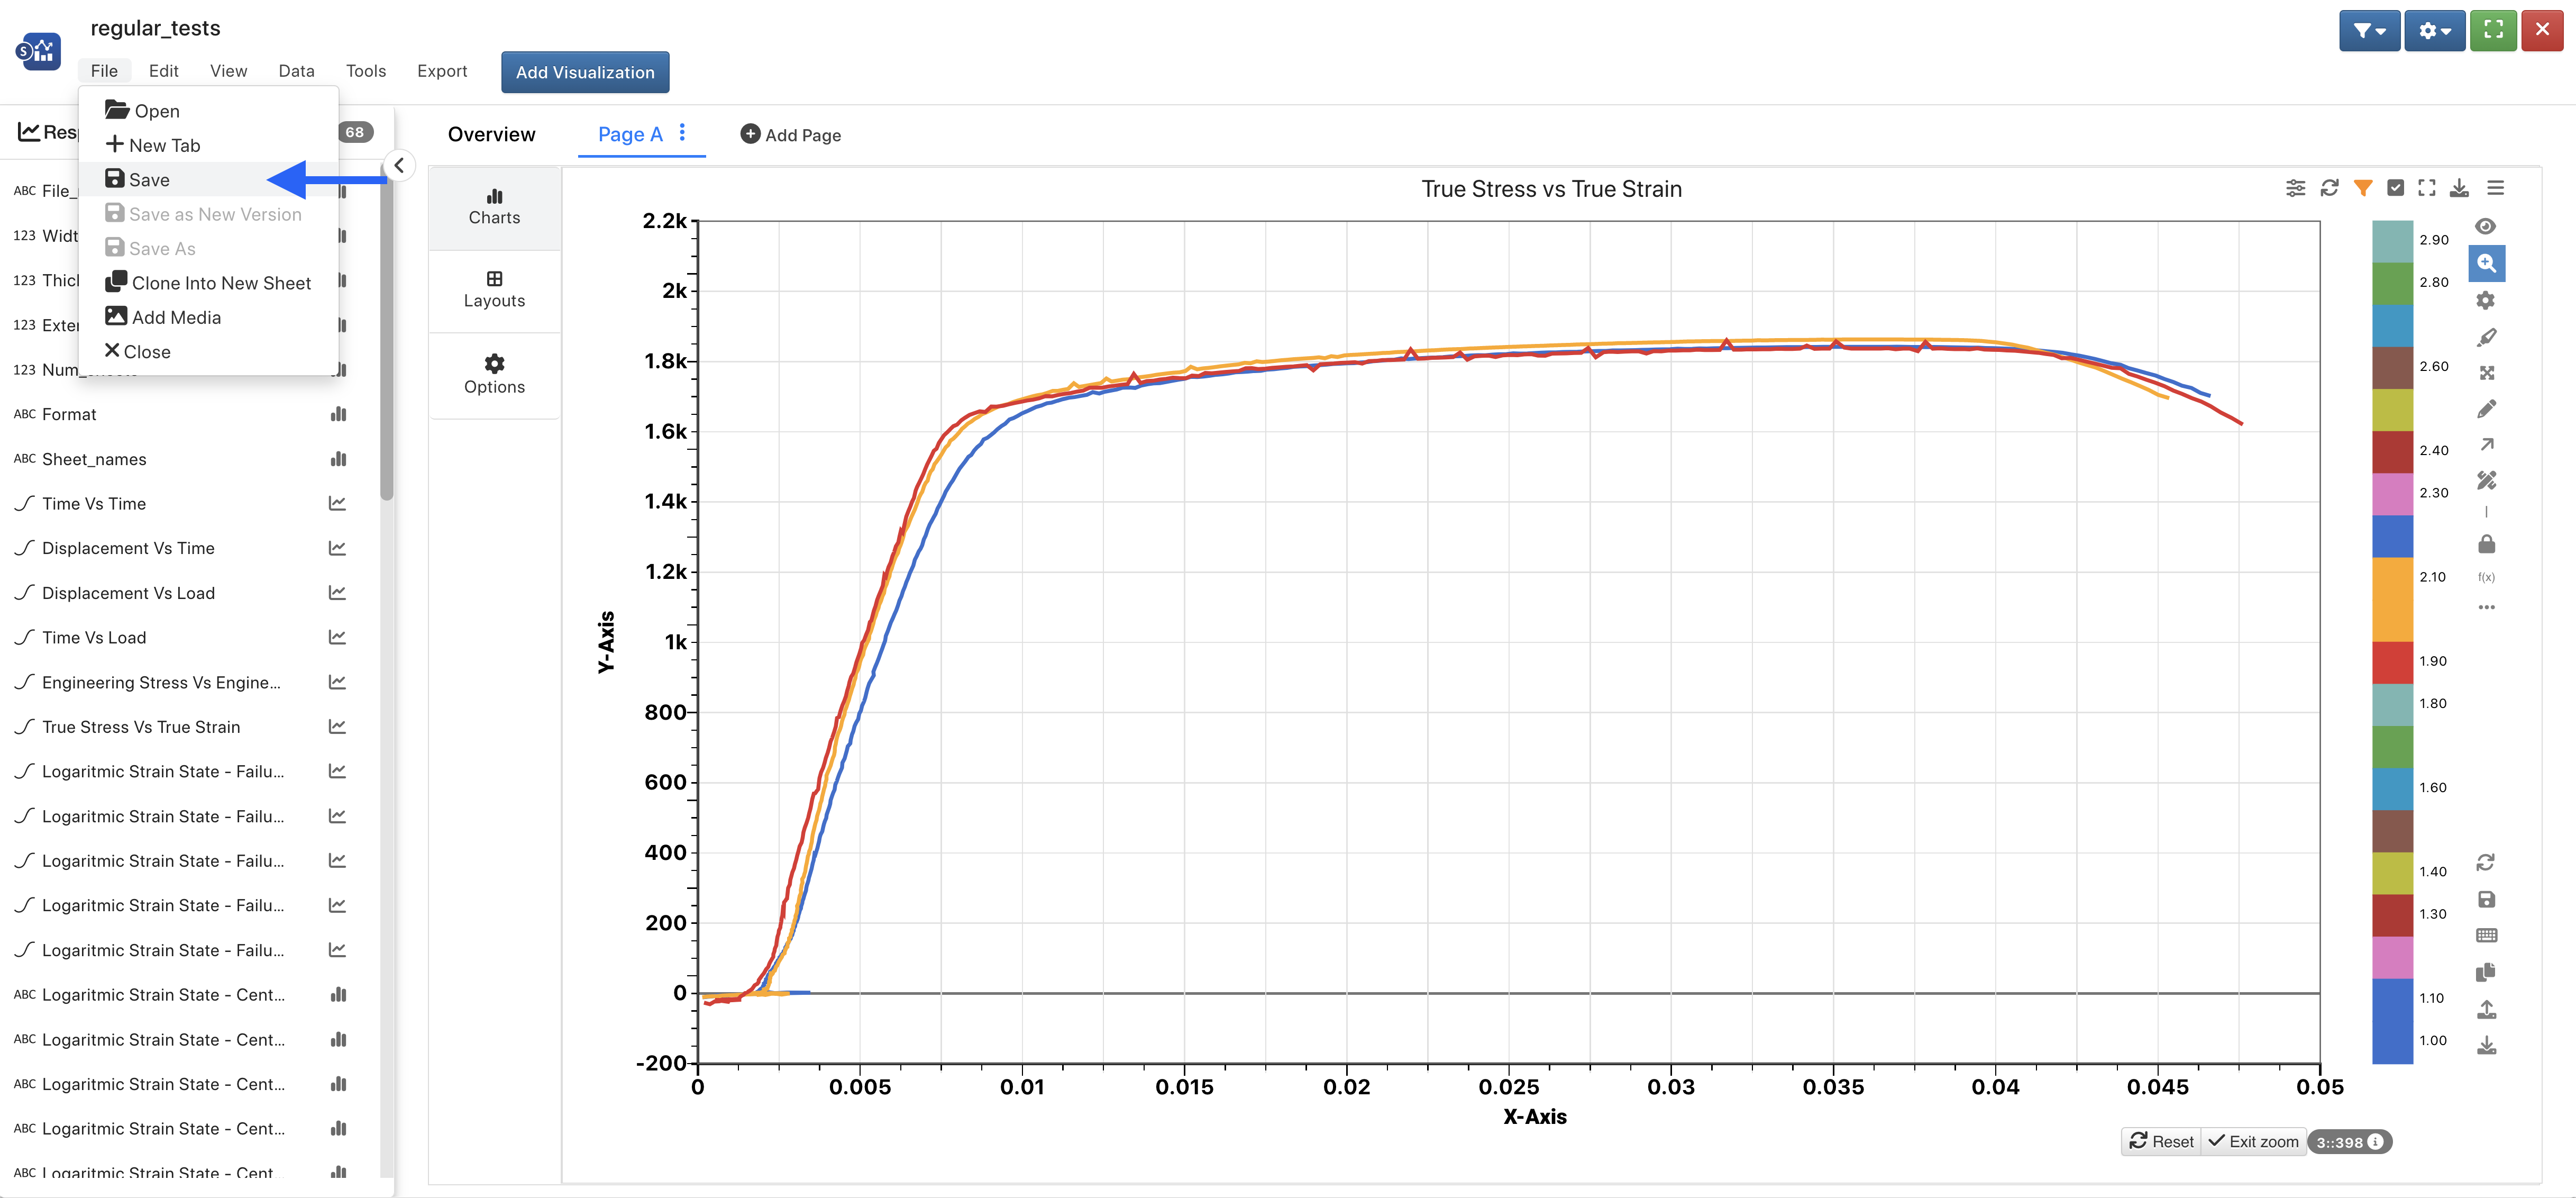
Figure 39: Add Charts and Save
Now, if we execute our Report Generator worker, we can click on View Simlytiks to explore our datasets and charts.
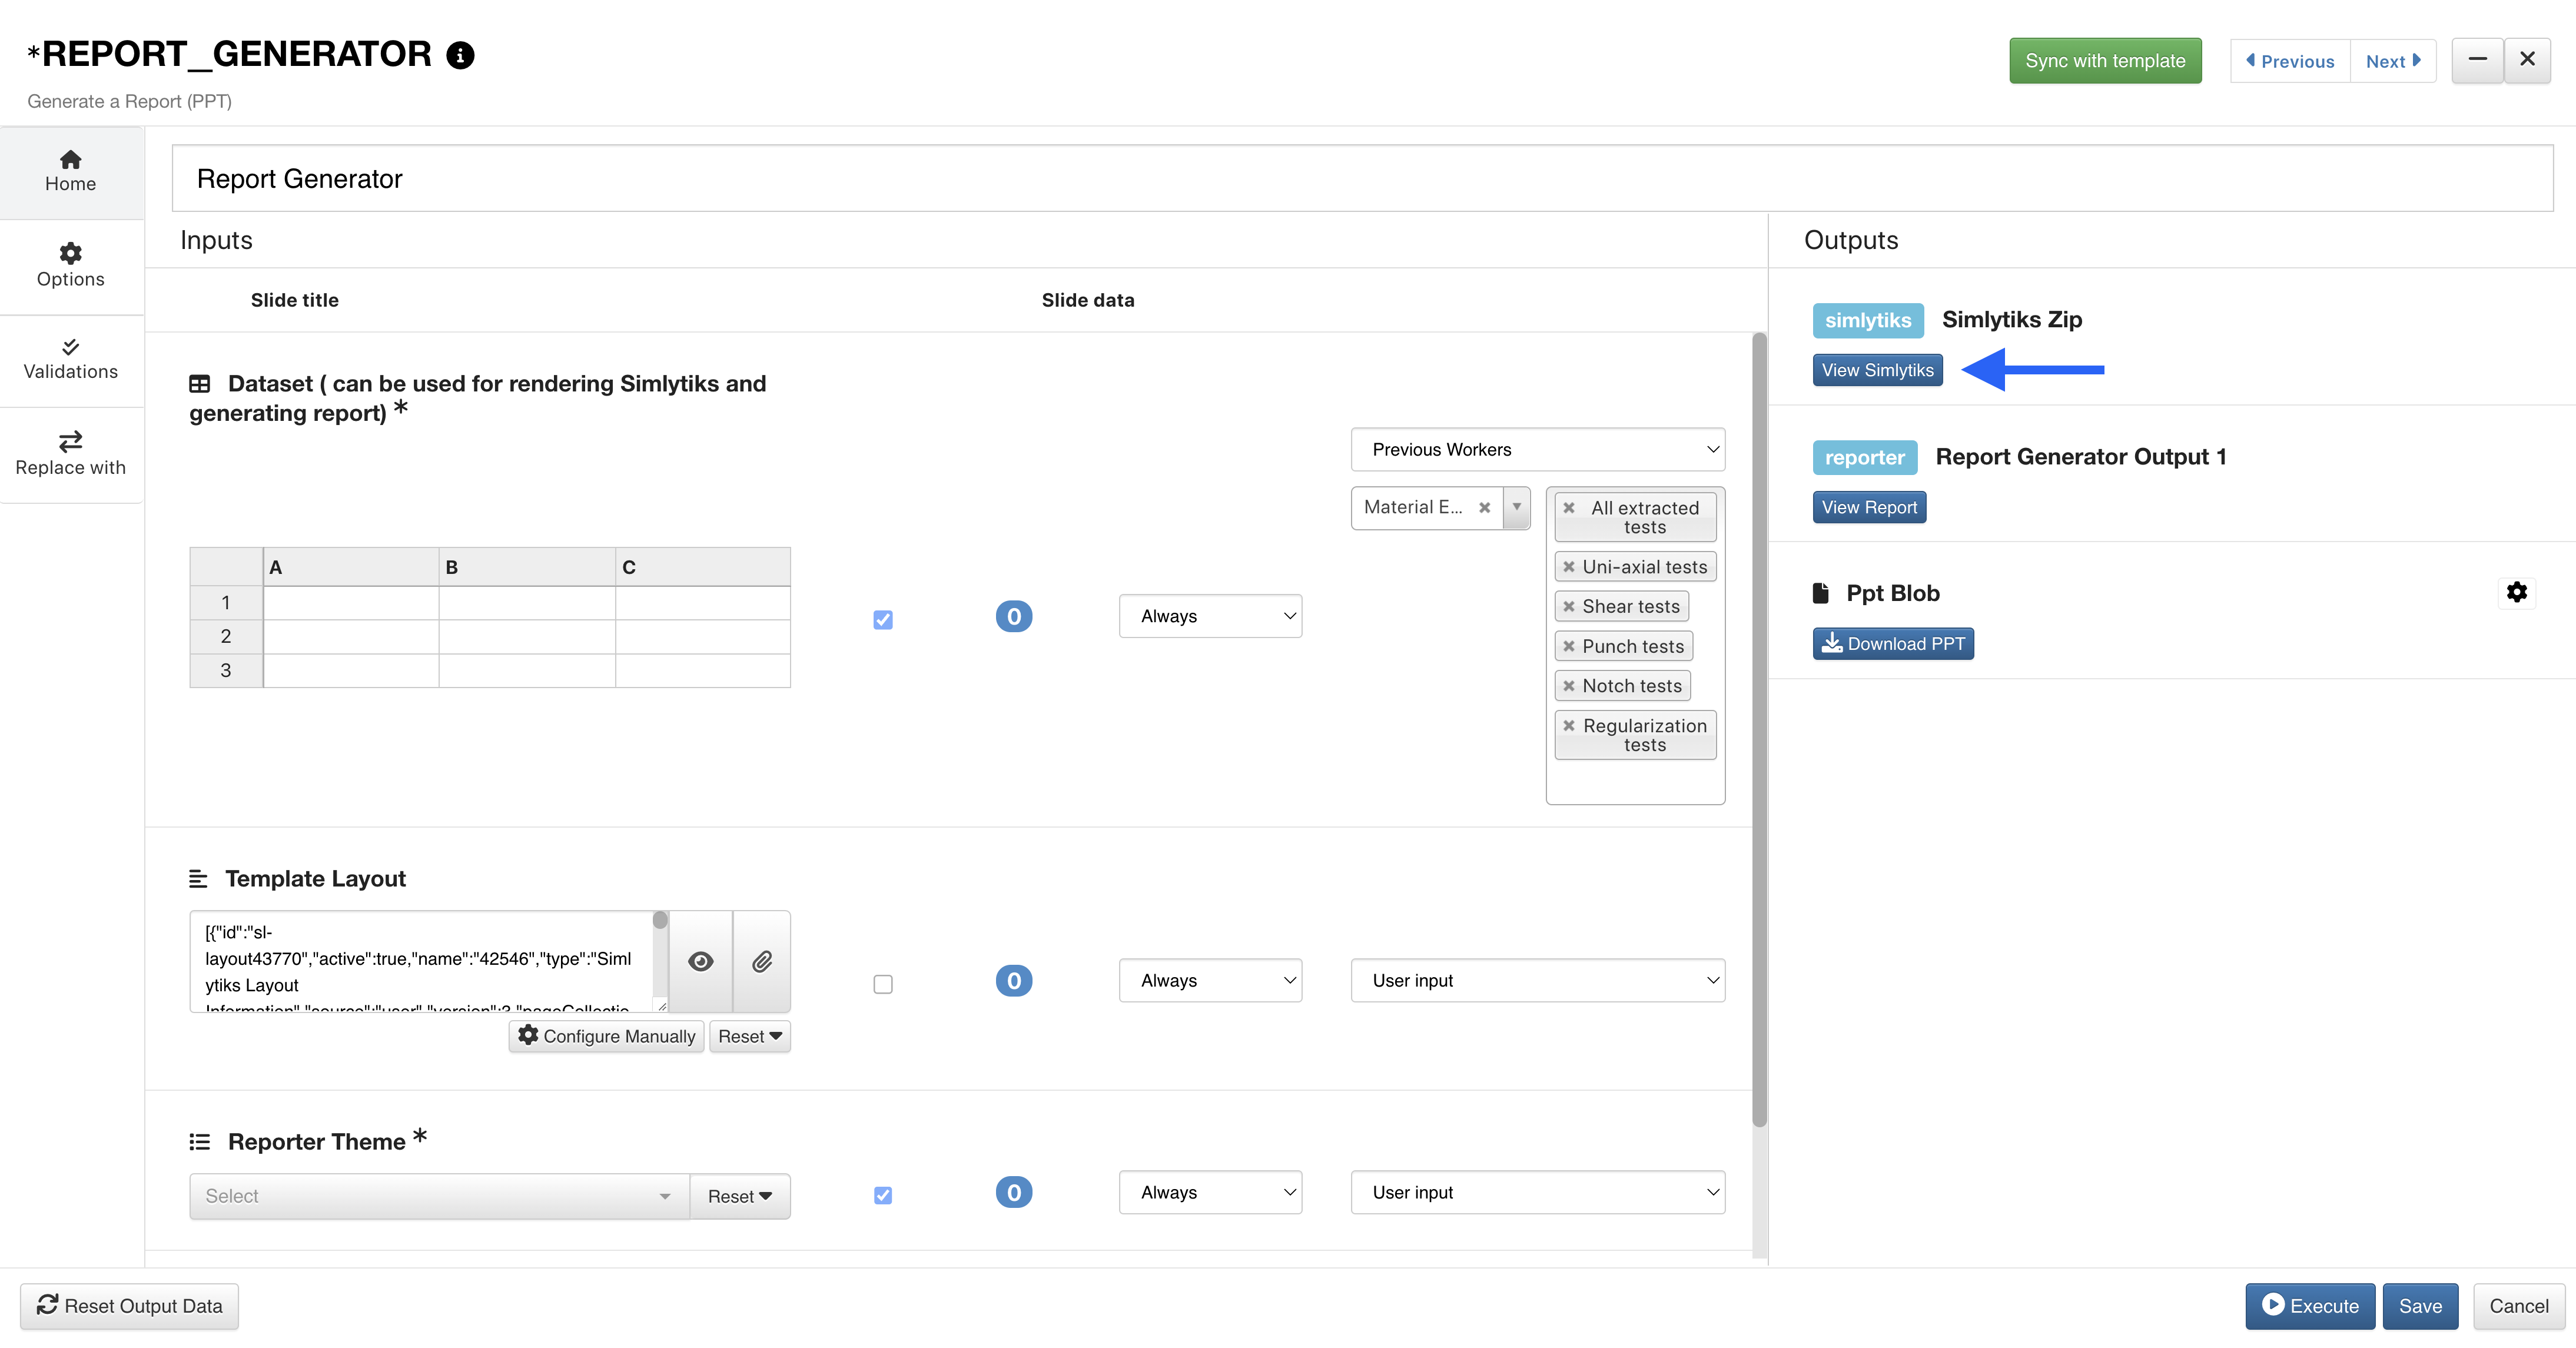
Figure 40: View Simlytiks
From here, we can download all the datasets under one PPT, first by clicking on PowerPoint under the Export menu.
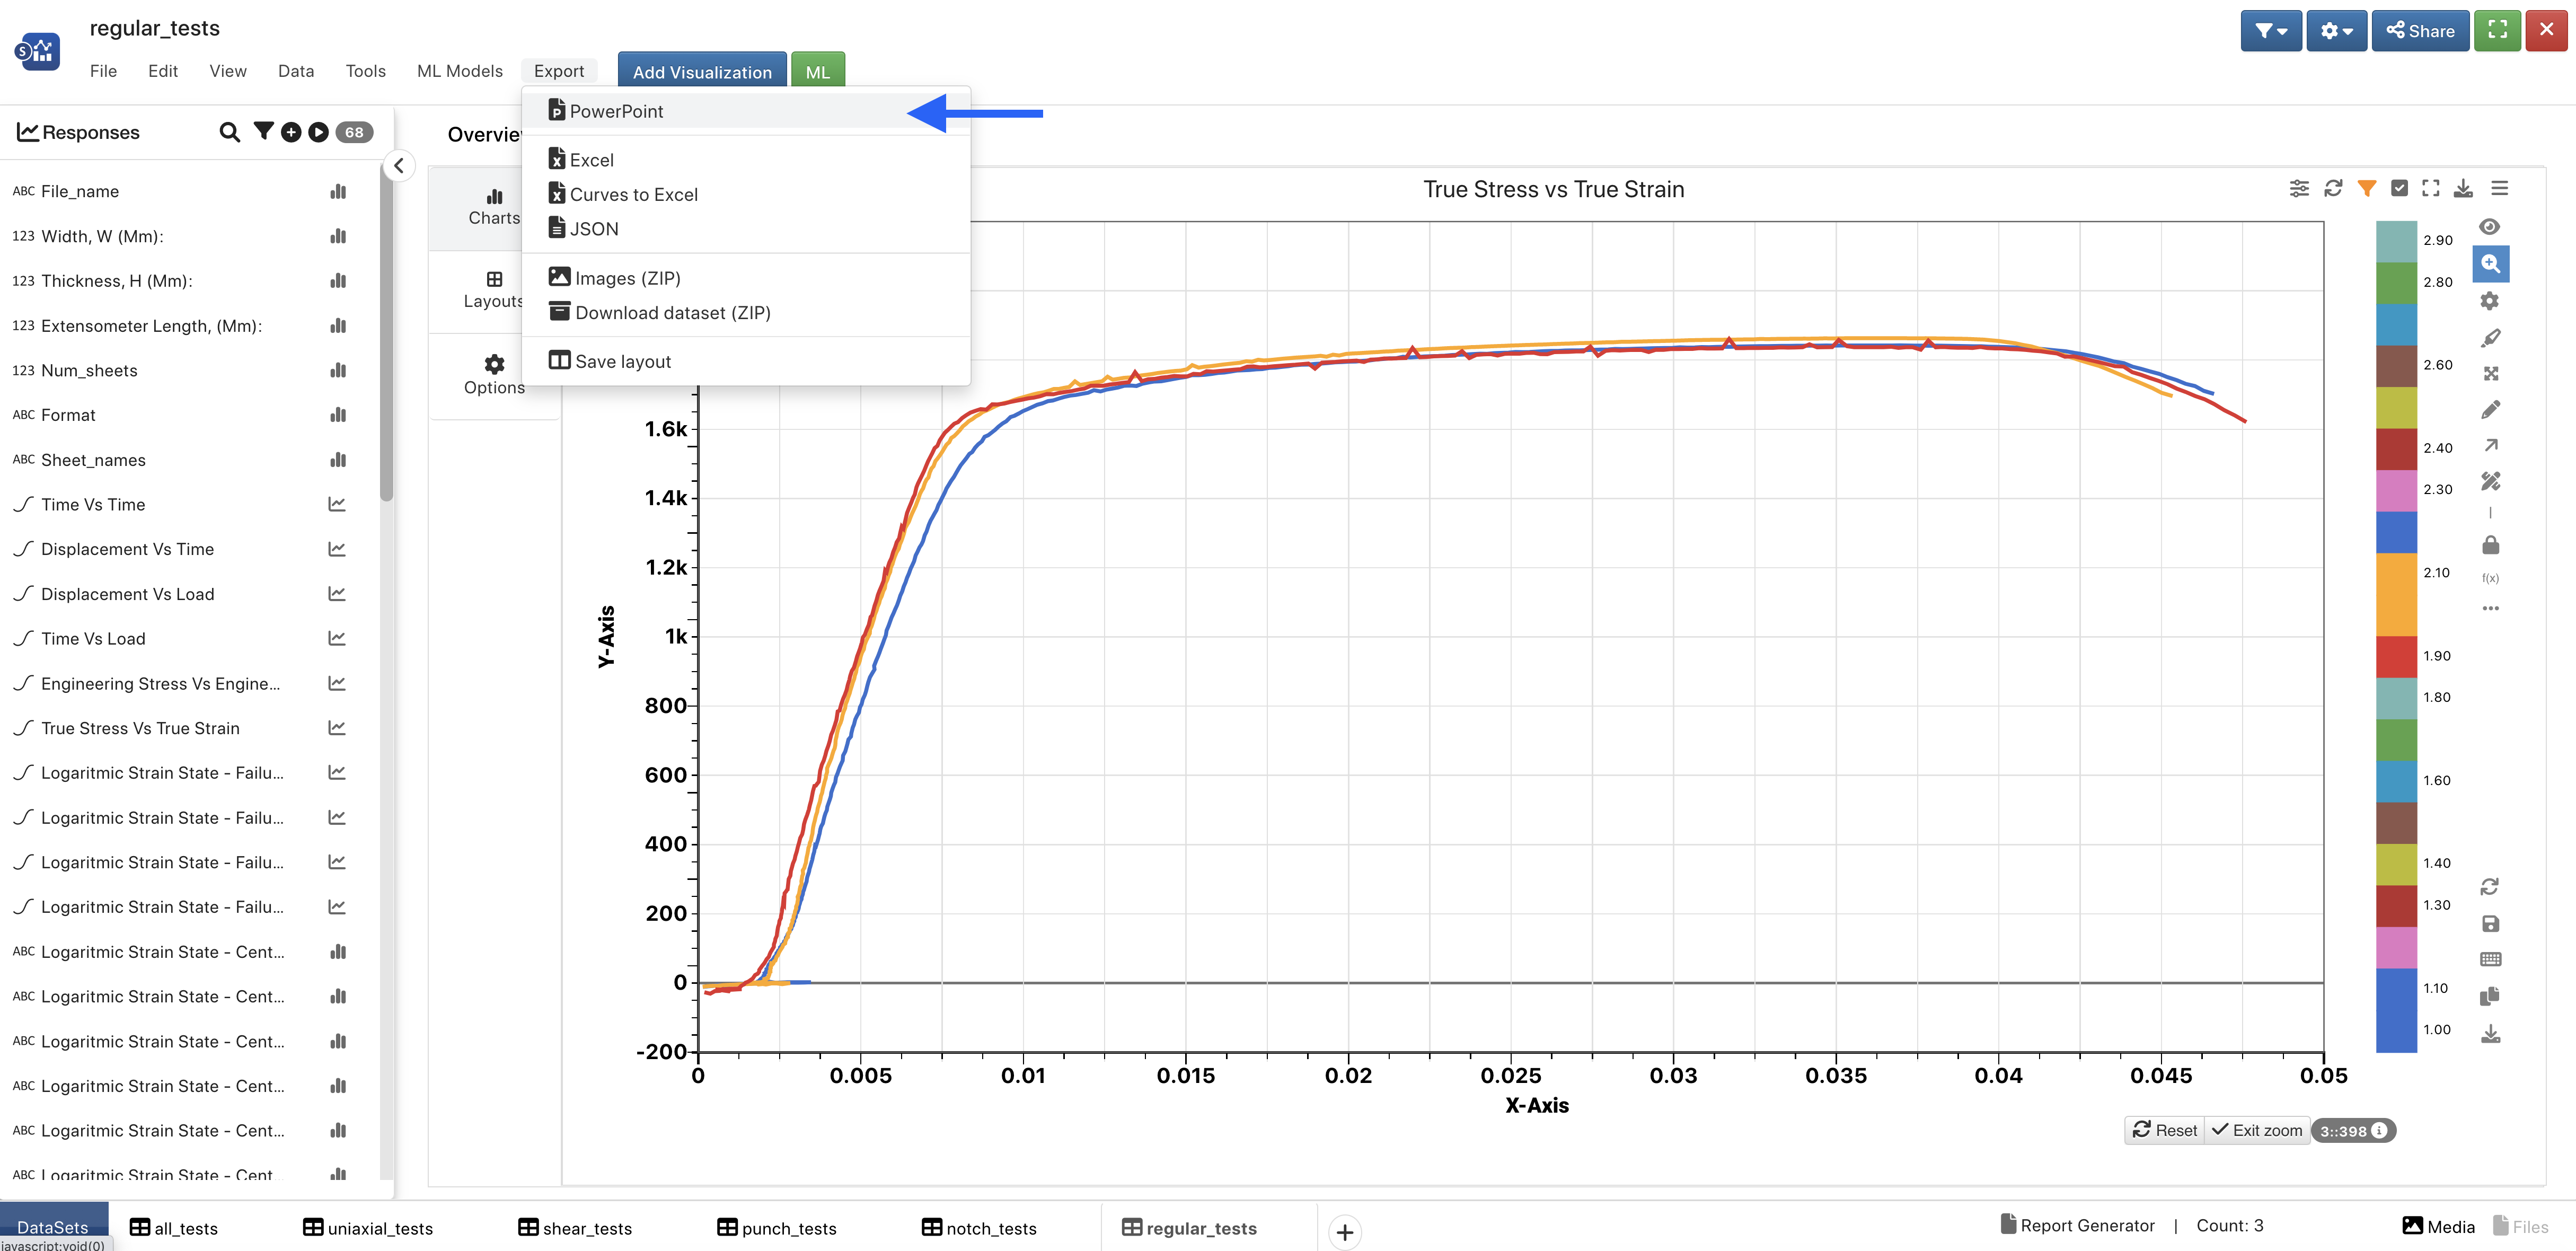
Figure 41: Download Dataset PPT
In the next window, we can choose which pages from which datasets to include in our PPT, and then Export to start the download.
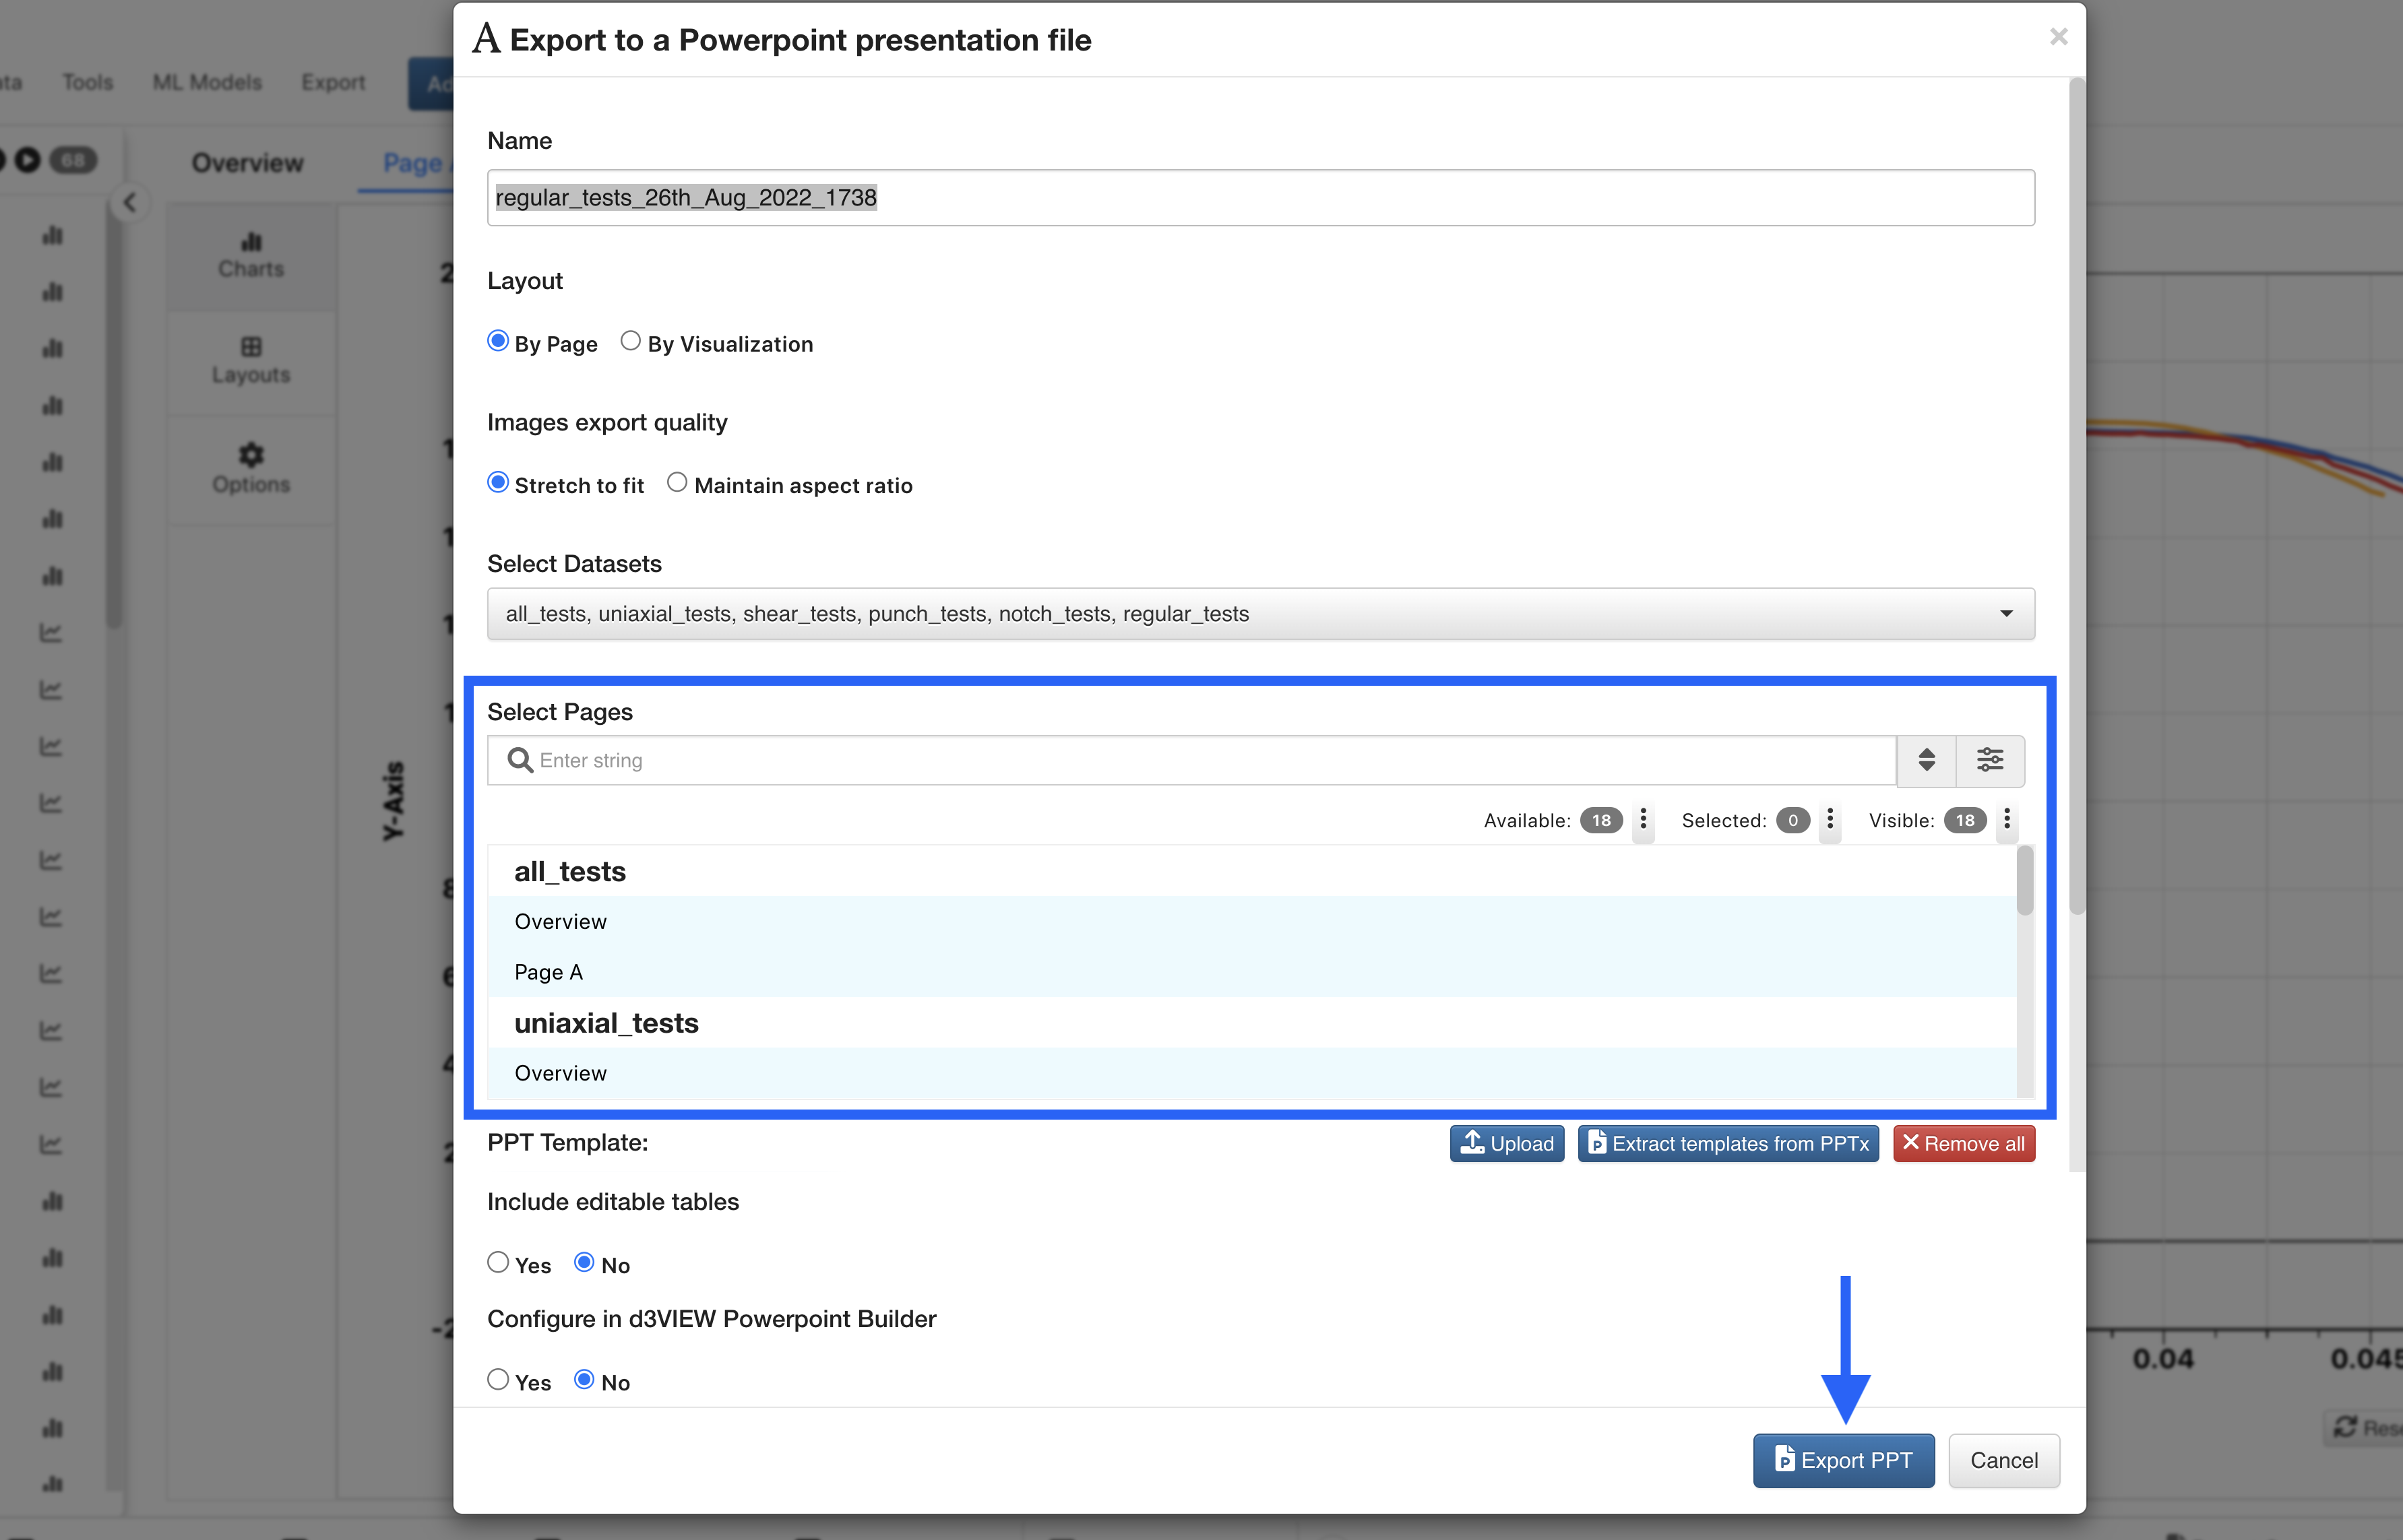
Figure 42: Select Pages and Export
Collaborated Report
Report Generator has an option for collaboration when a workflow has multiple reports. The different reports can be fused together in the last report generator worker of the workflow. This report generator has indicated in the collaborated option the previous report generator worker.
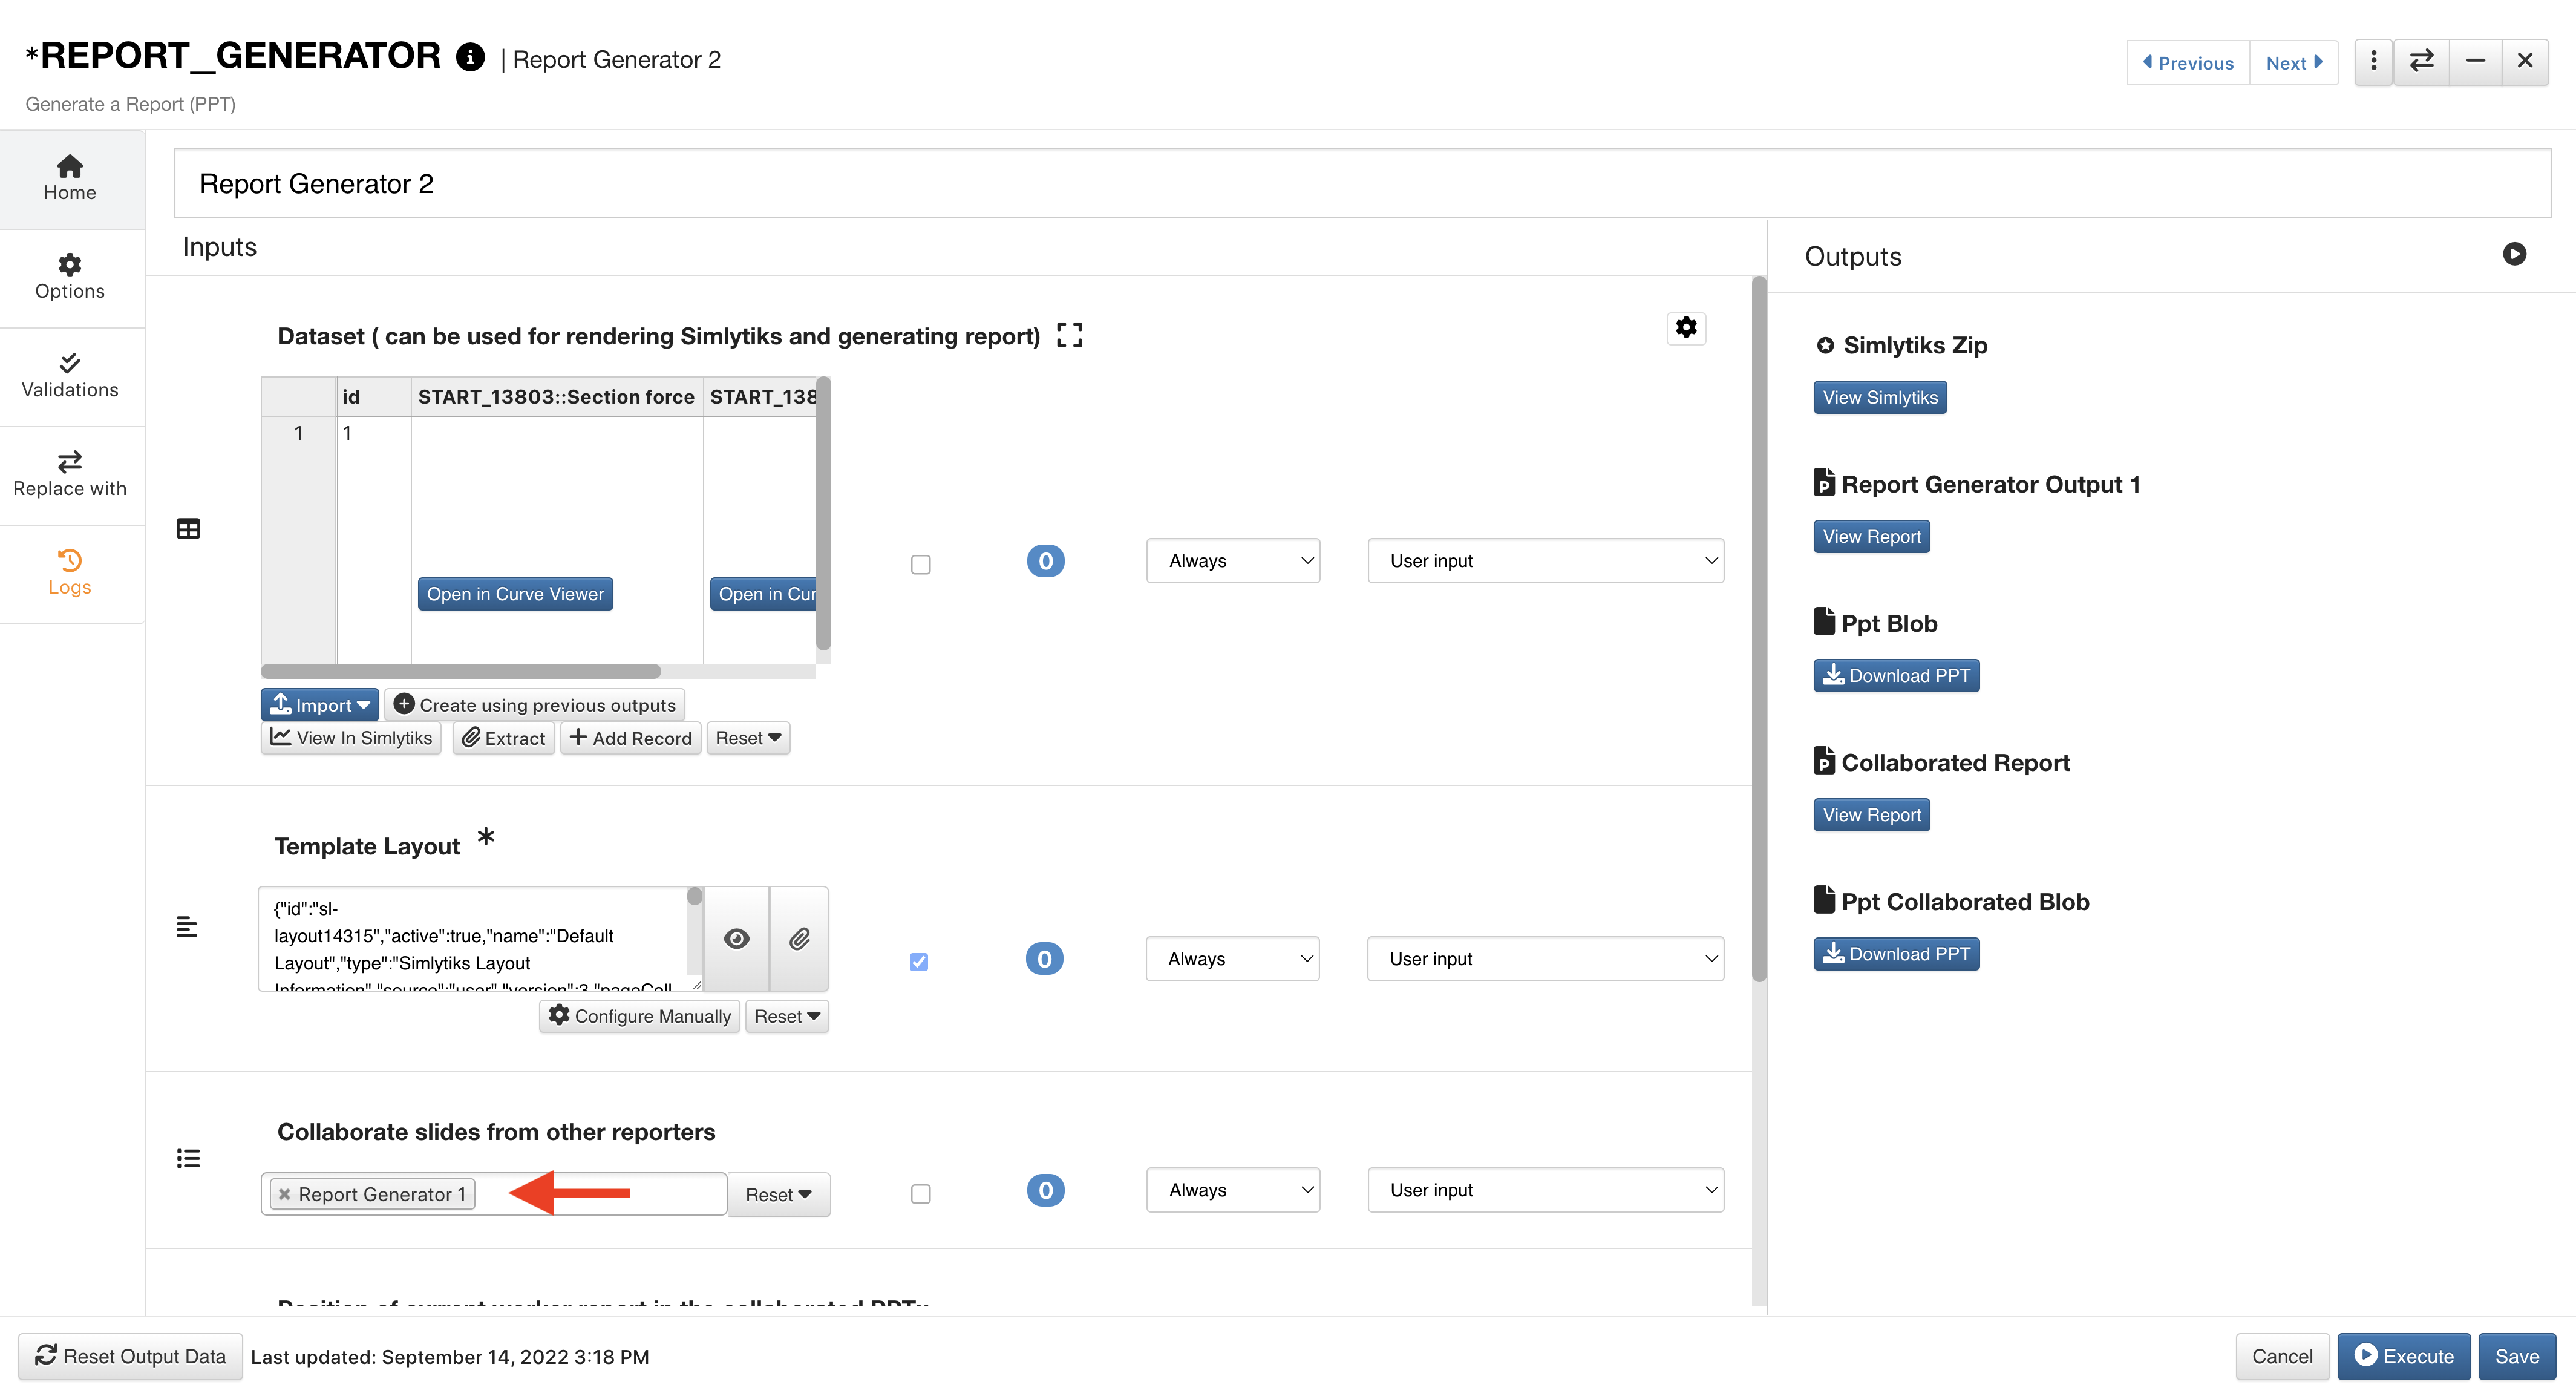
Figure 43: Collaborated Report Configuration
Now, when we open the collaborate report, we’ll see pages for both reports into one.
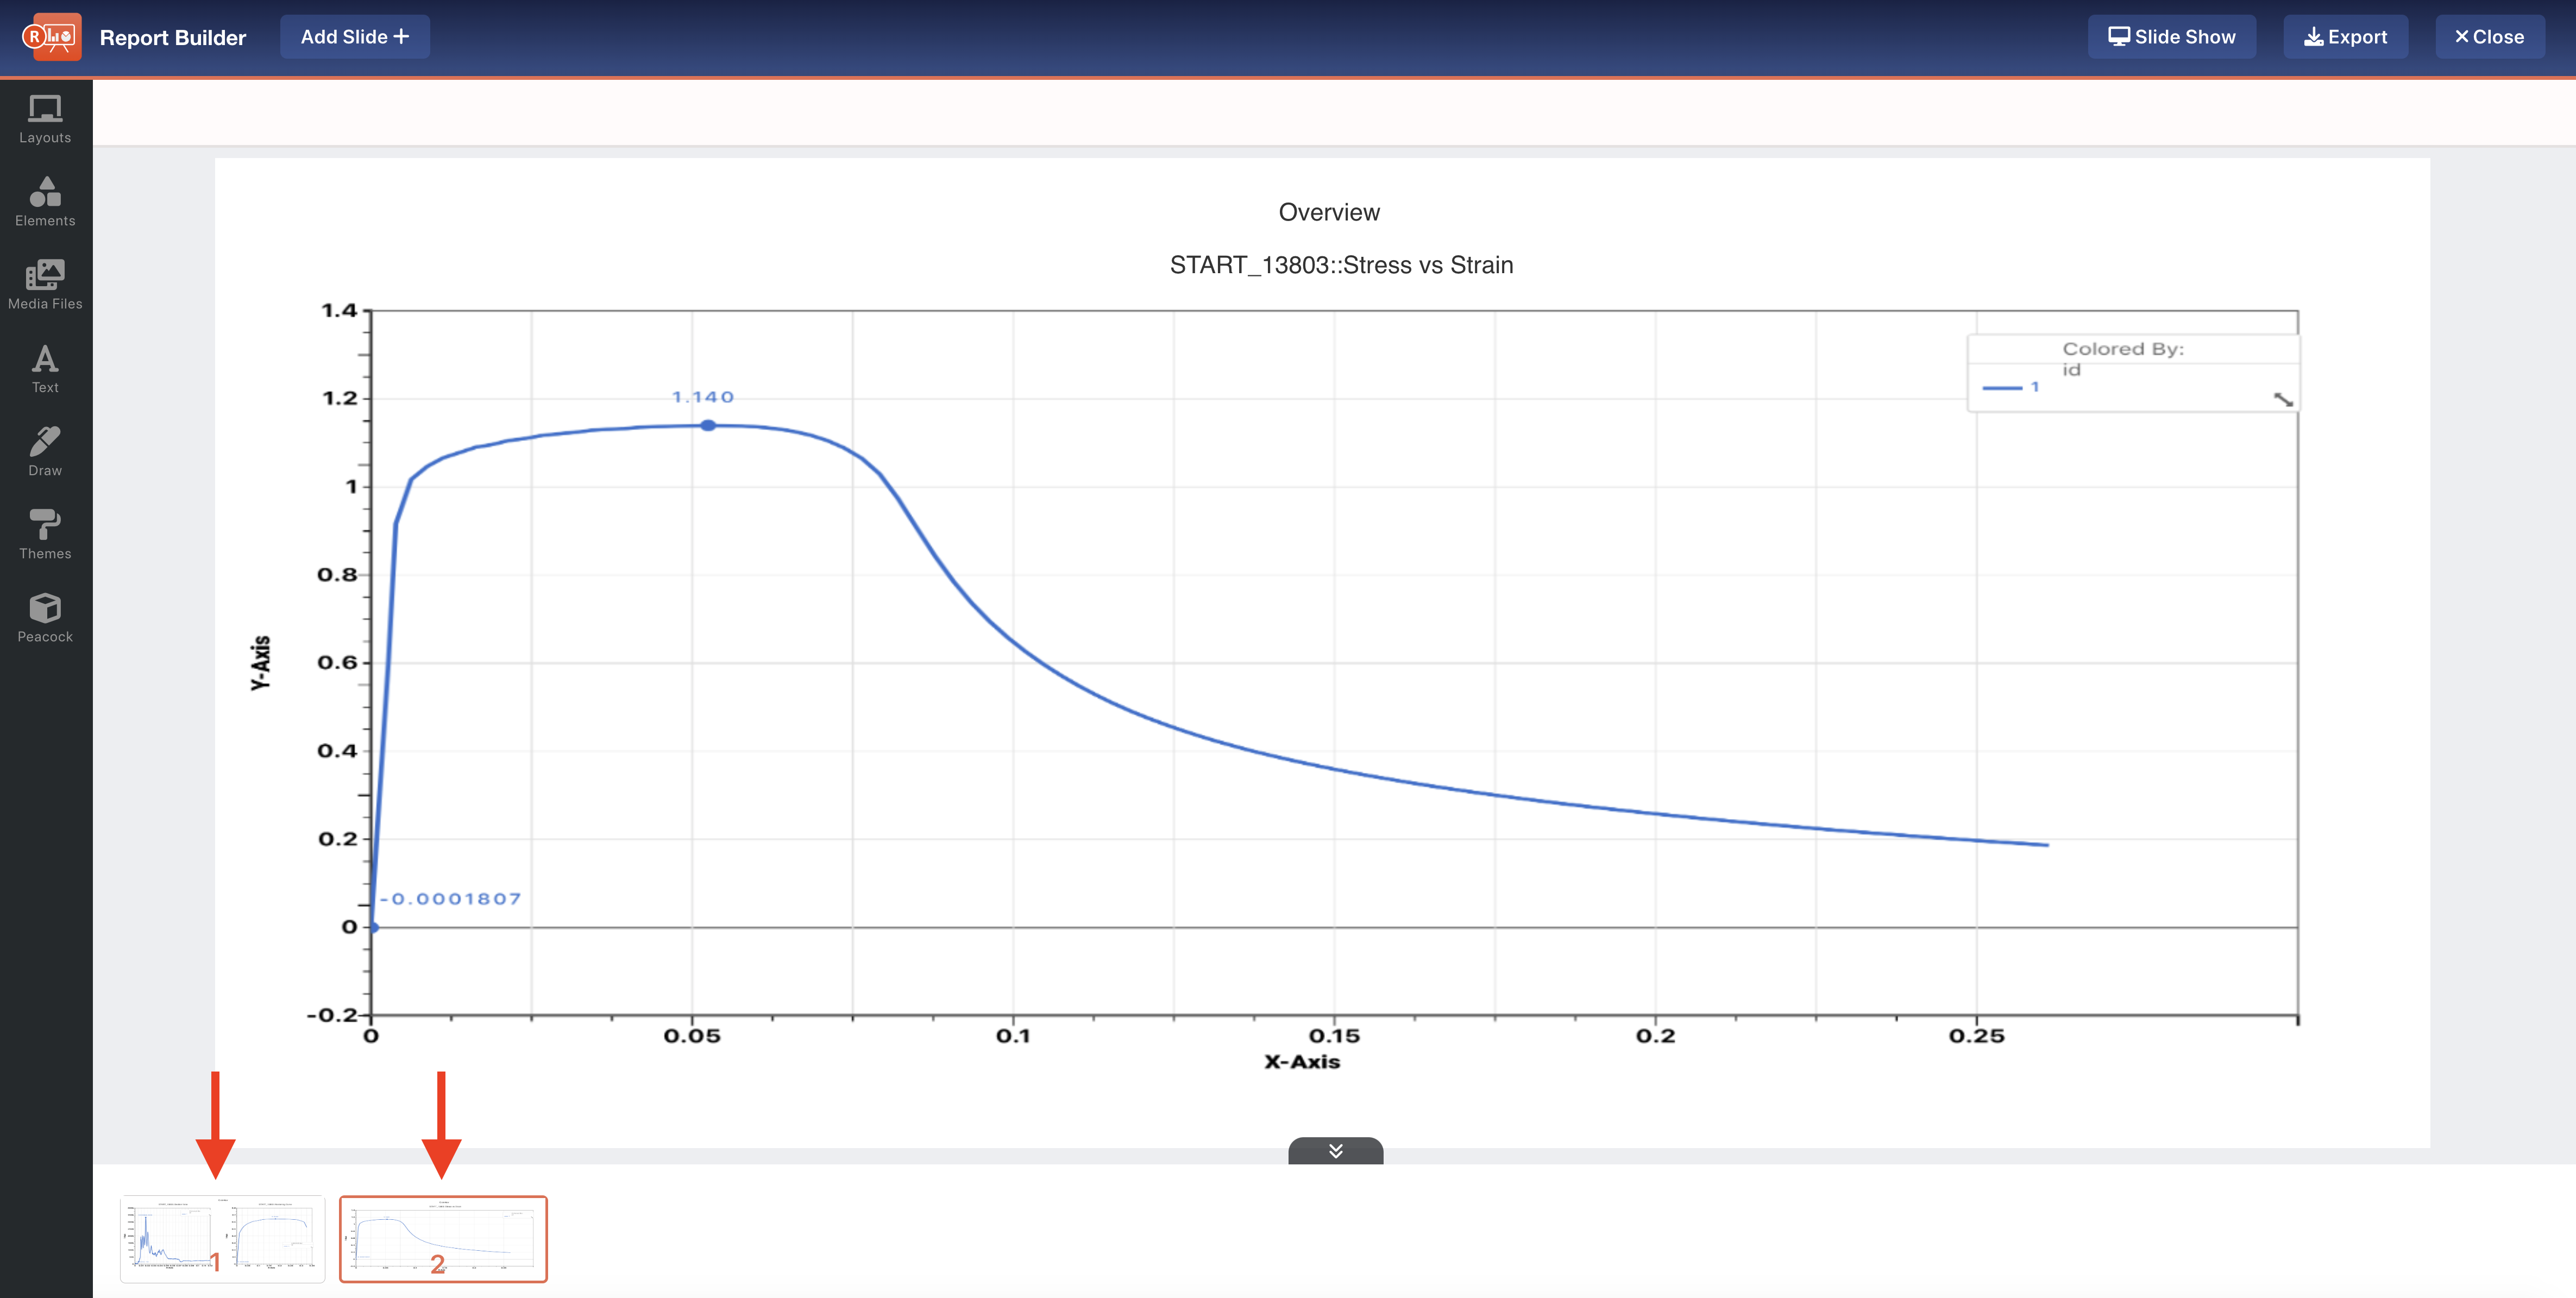
Figure 44: Collaborated Report in Builder
8.6. |square| Shapes Menu
The Shapes Menu (now located at the top of the workflow canvas) hosts a variety of common workers used to support the workflow for easy sharing and importing, and general efficiency. Aside from Decision and Report Generator reviewed above, here are overviews of a few other useful shape workers.
|comment| Comment
Add a comment anywhere on the workflow to note important information. Hover the comment over a worker to link them.
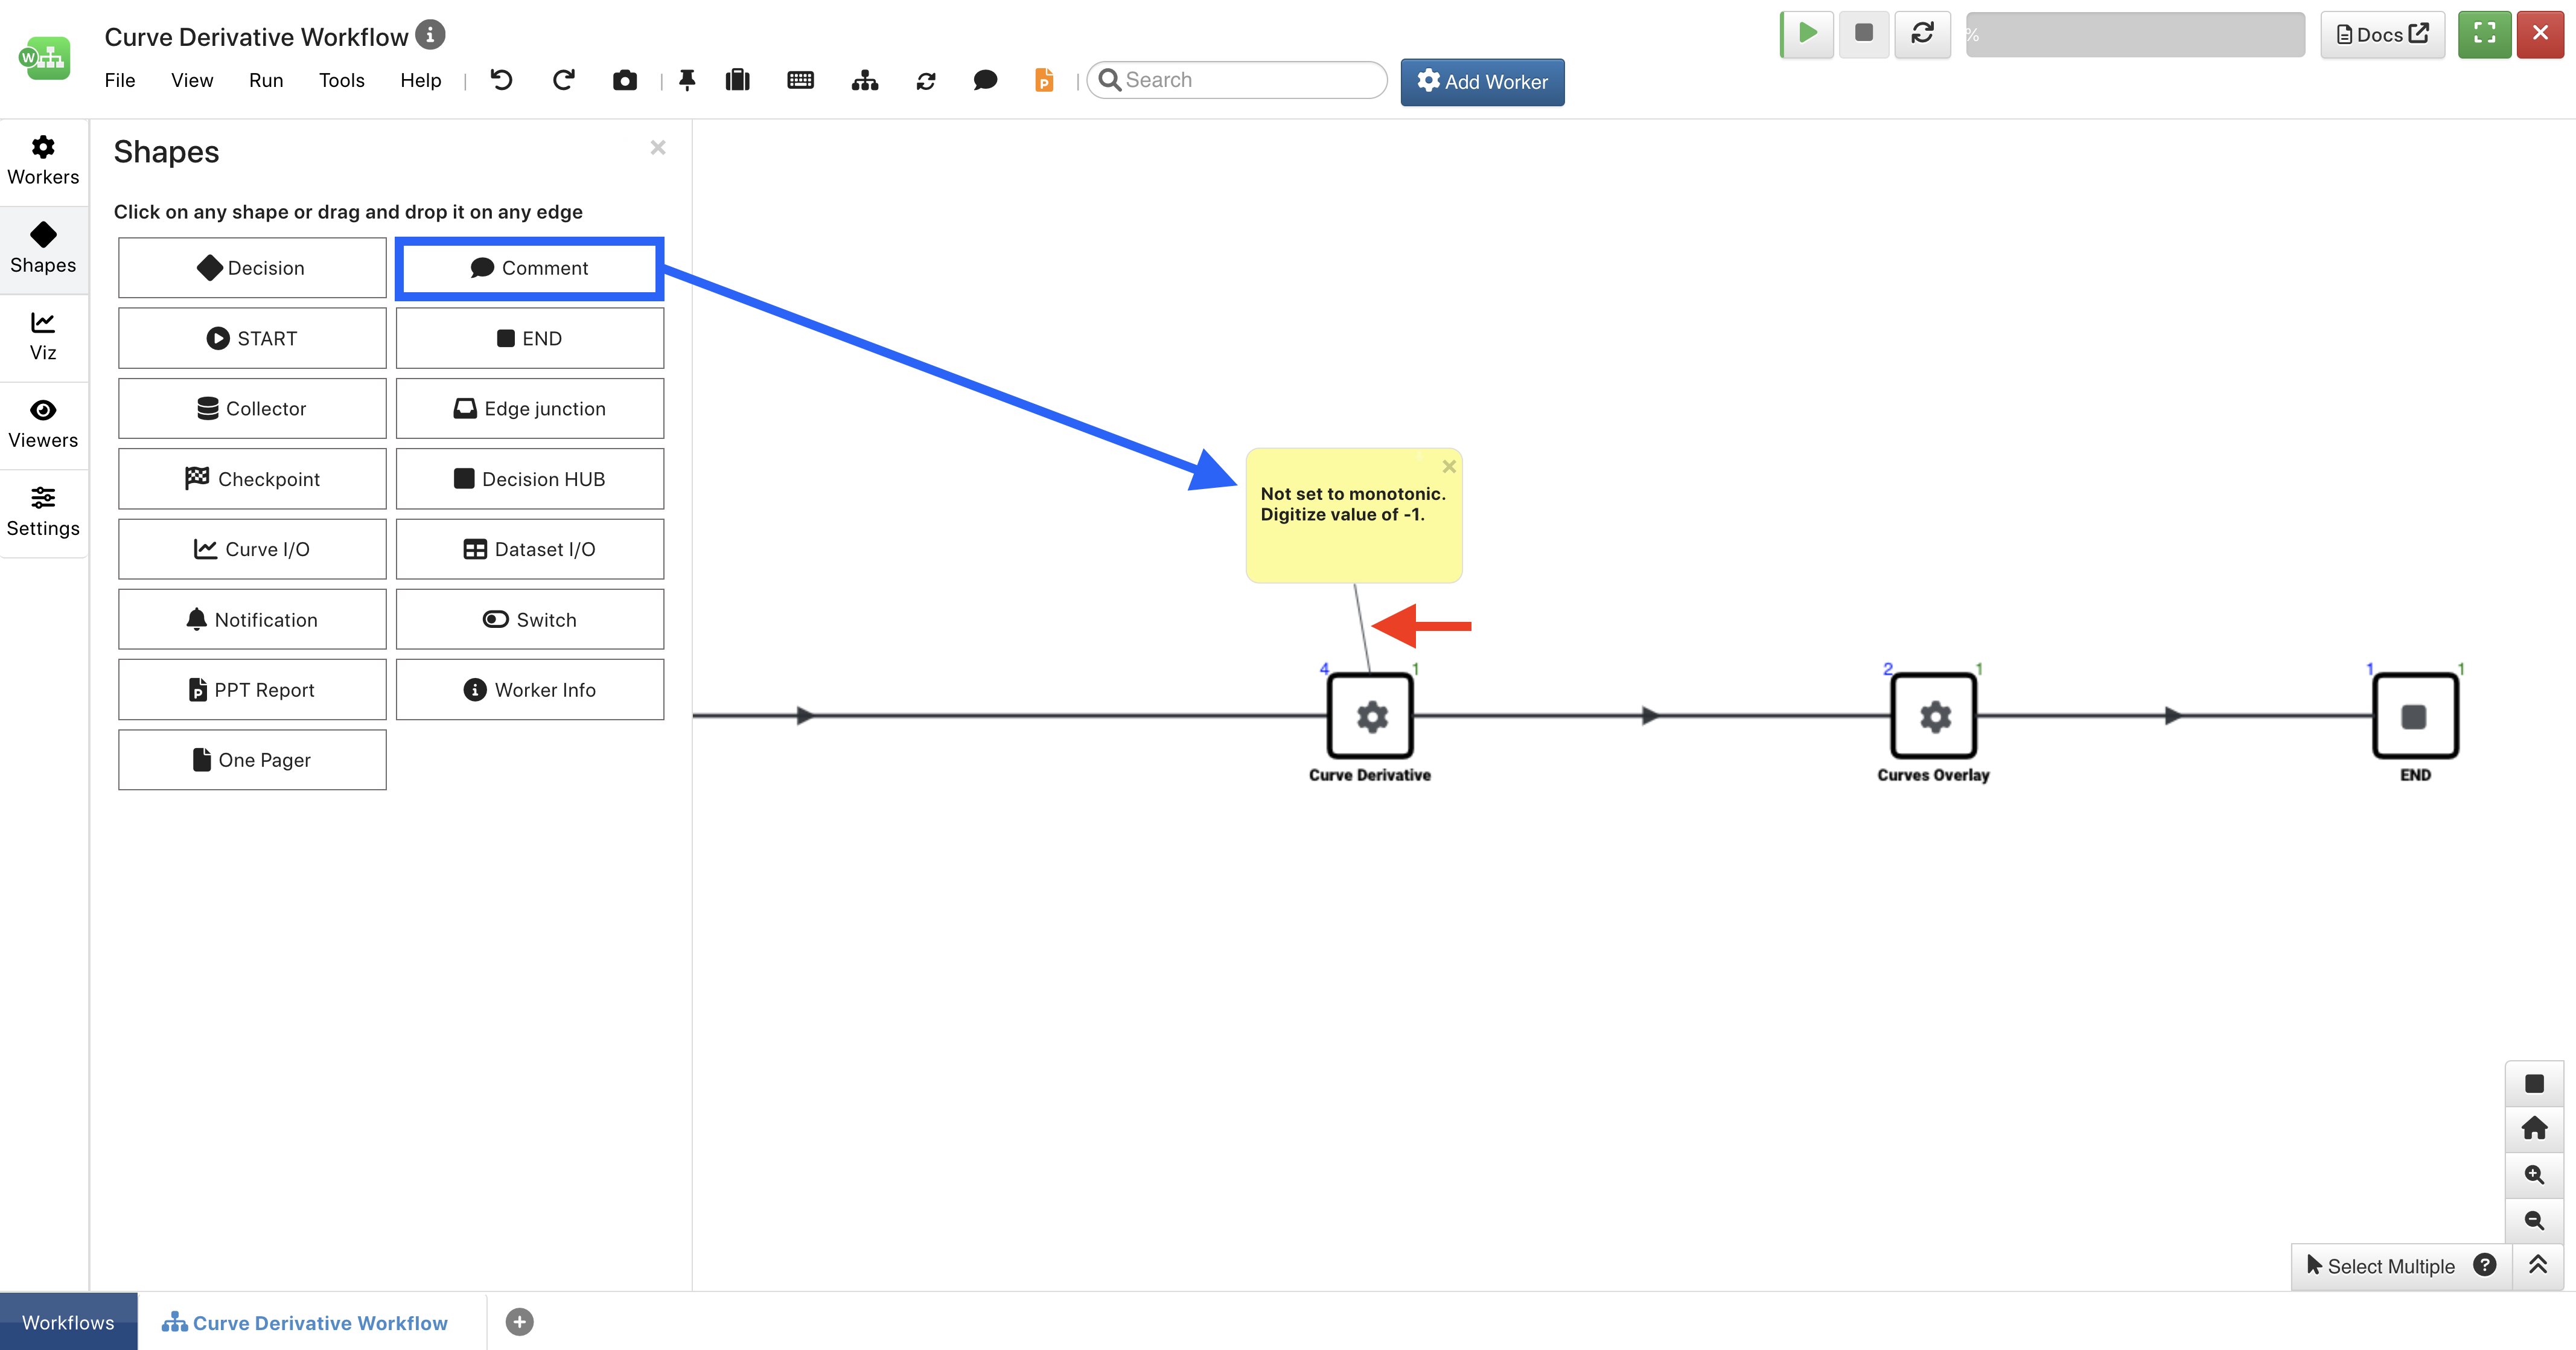
Figure 43: Add a Comment
Right-click on the comment to edit, delete, detach (from the worker) or collapse (hide) it.
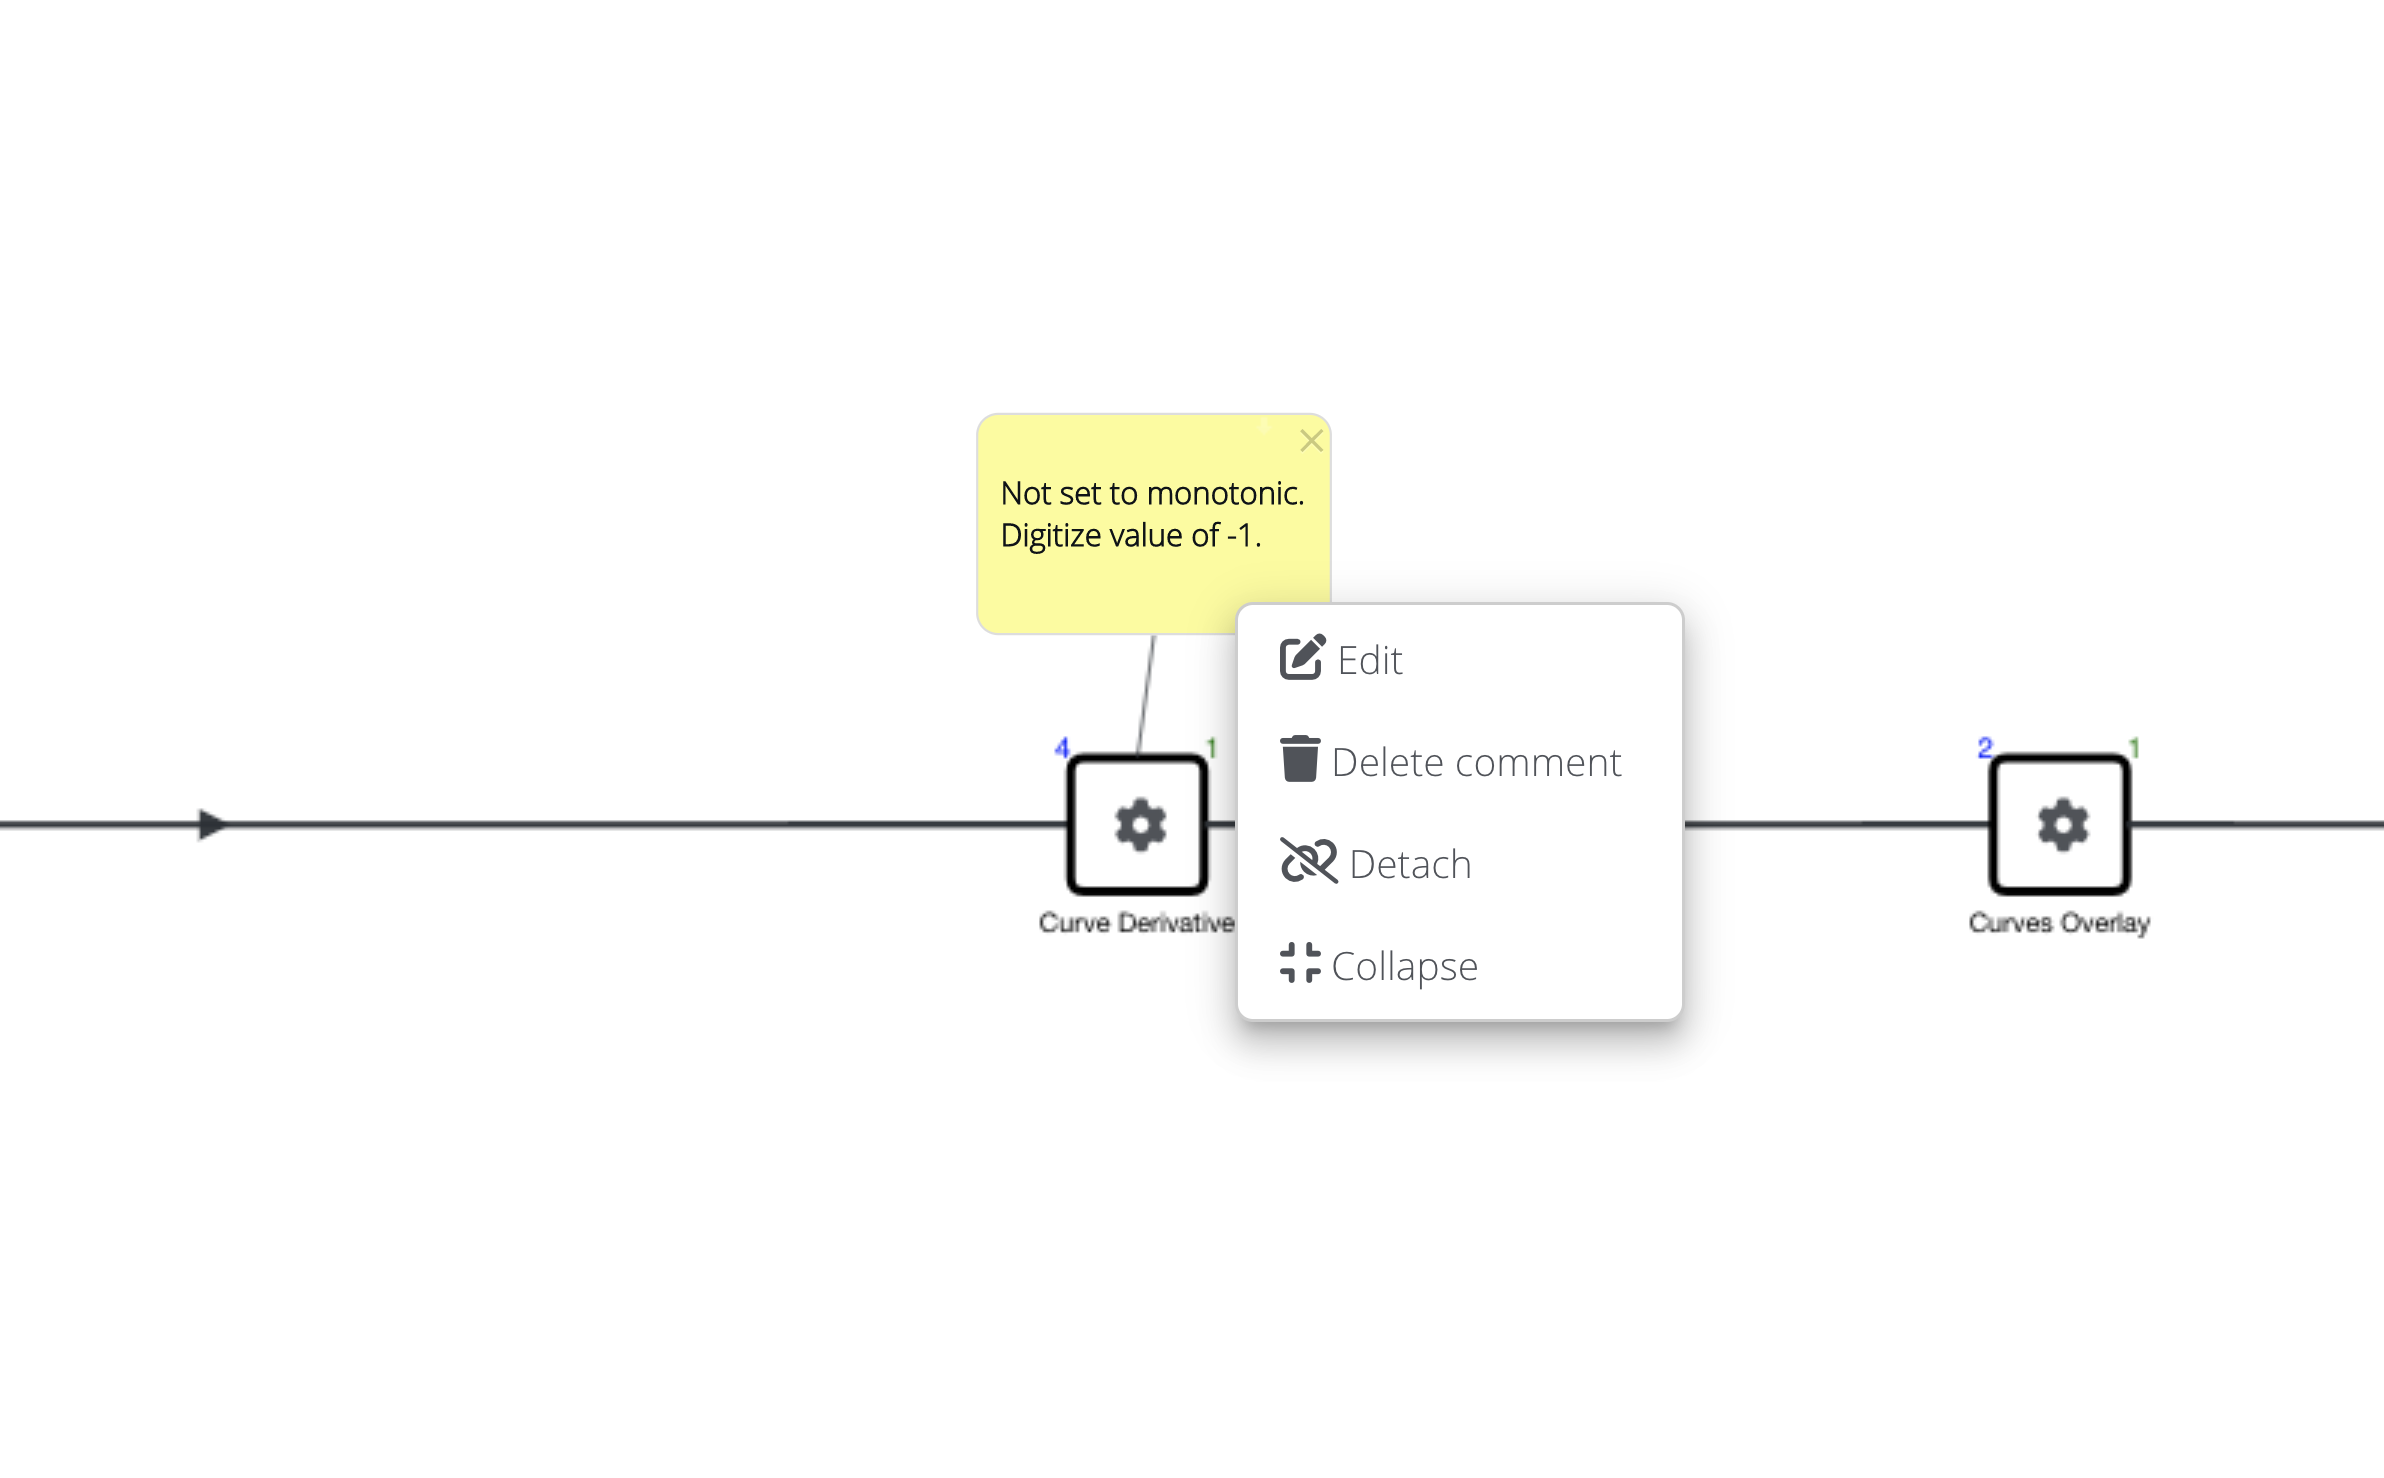
Figure 44: Comment Right-Click Options
After hiding the comment, right-click again on the corner of the worker to uncollapse the comment.
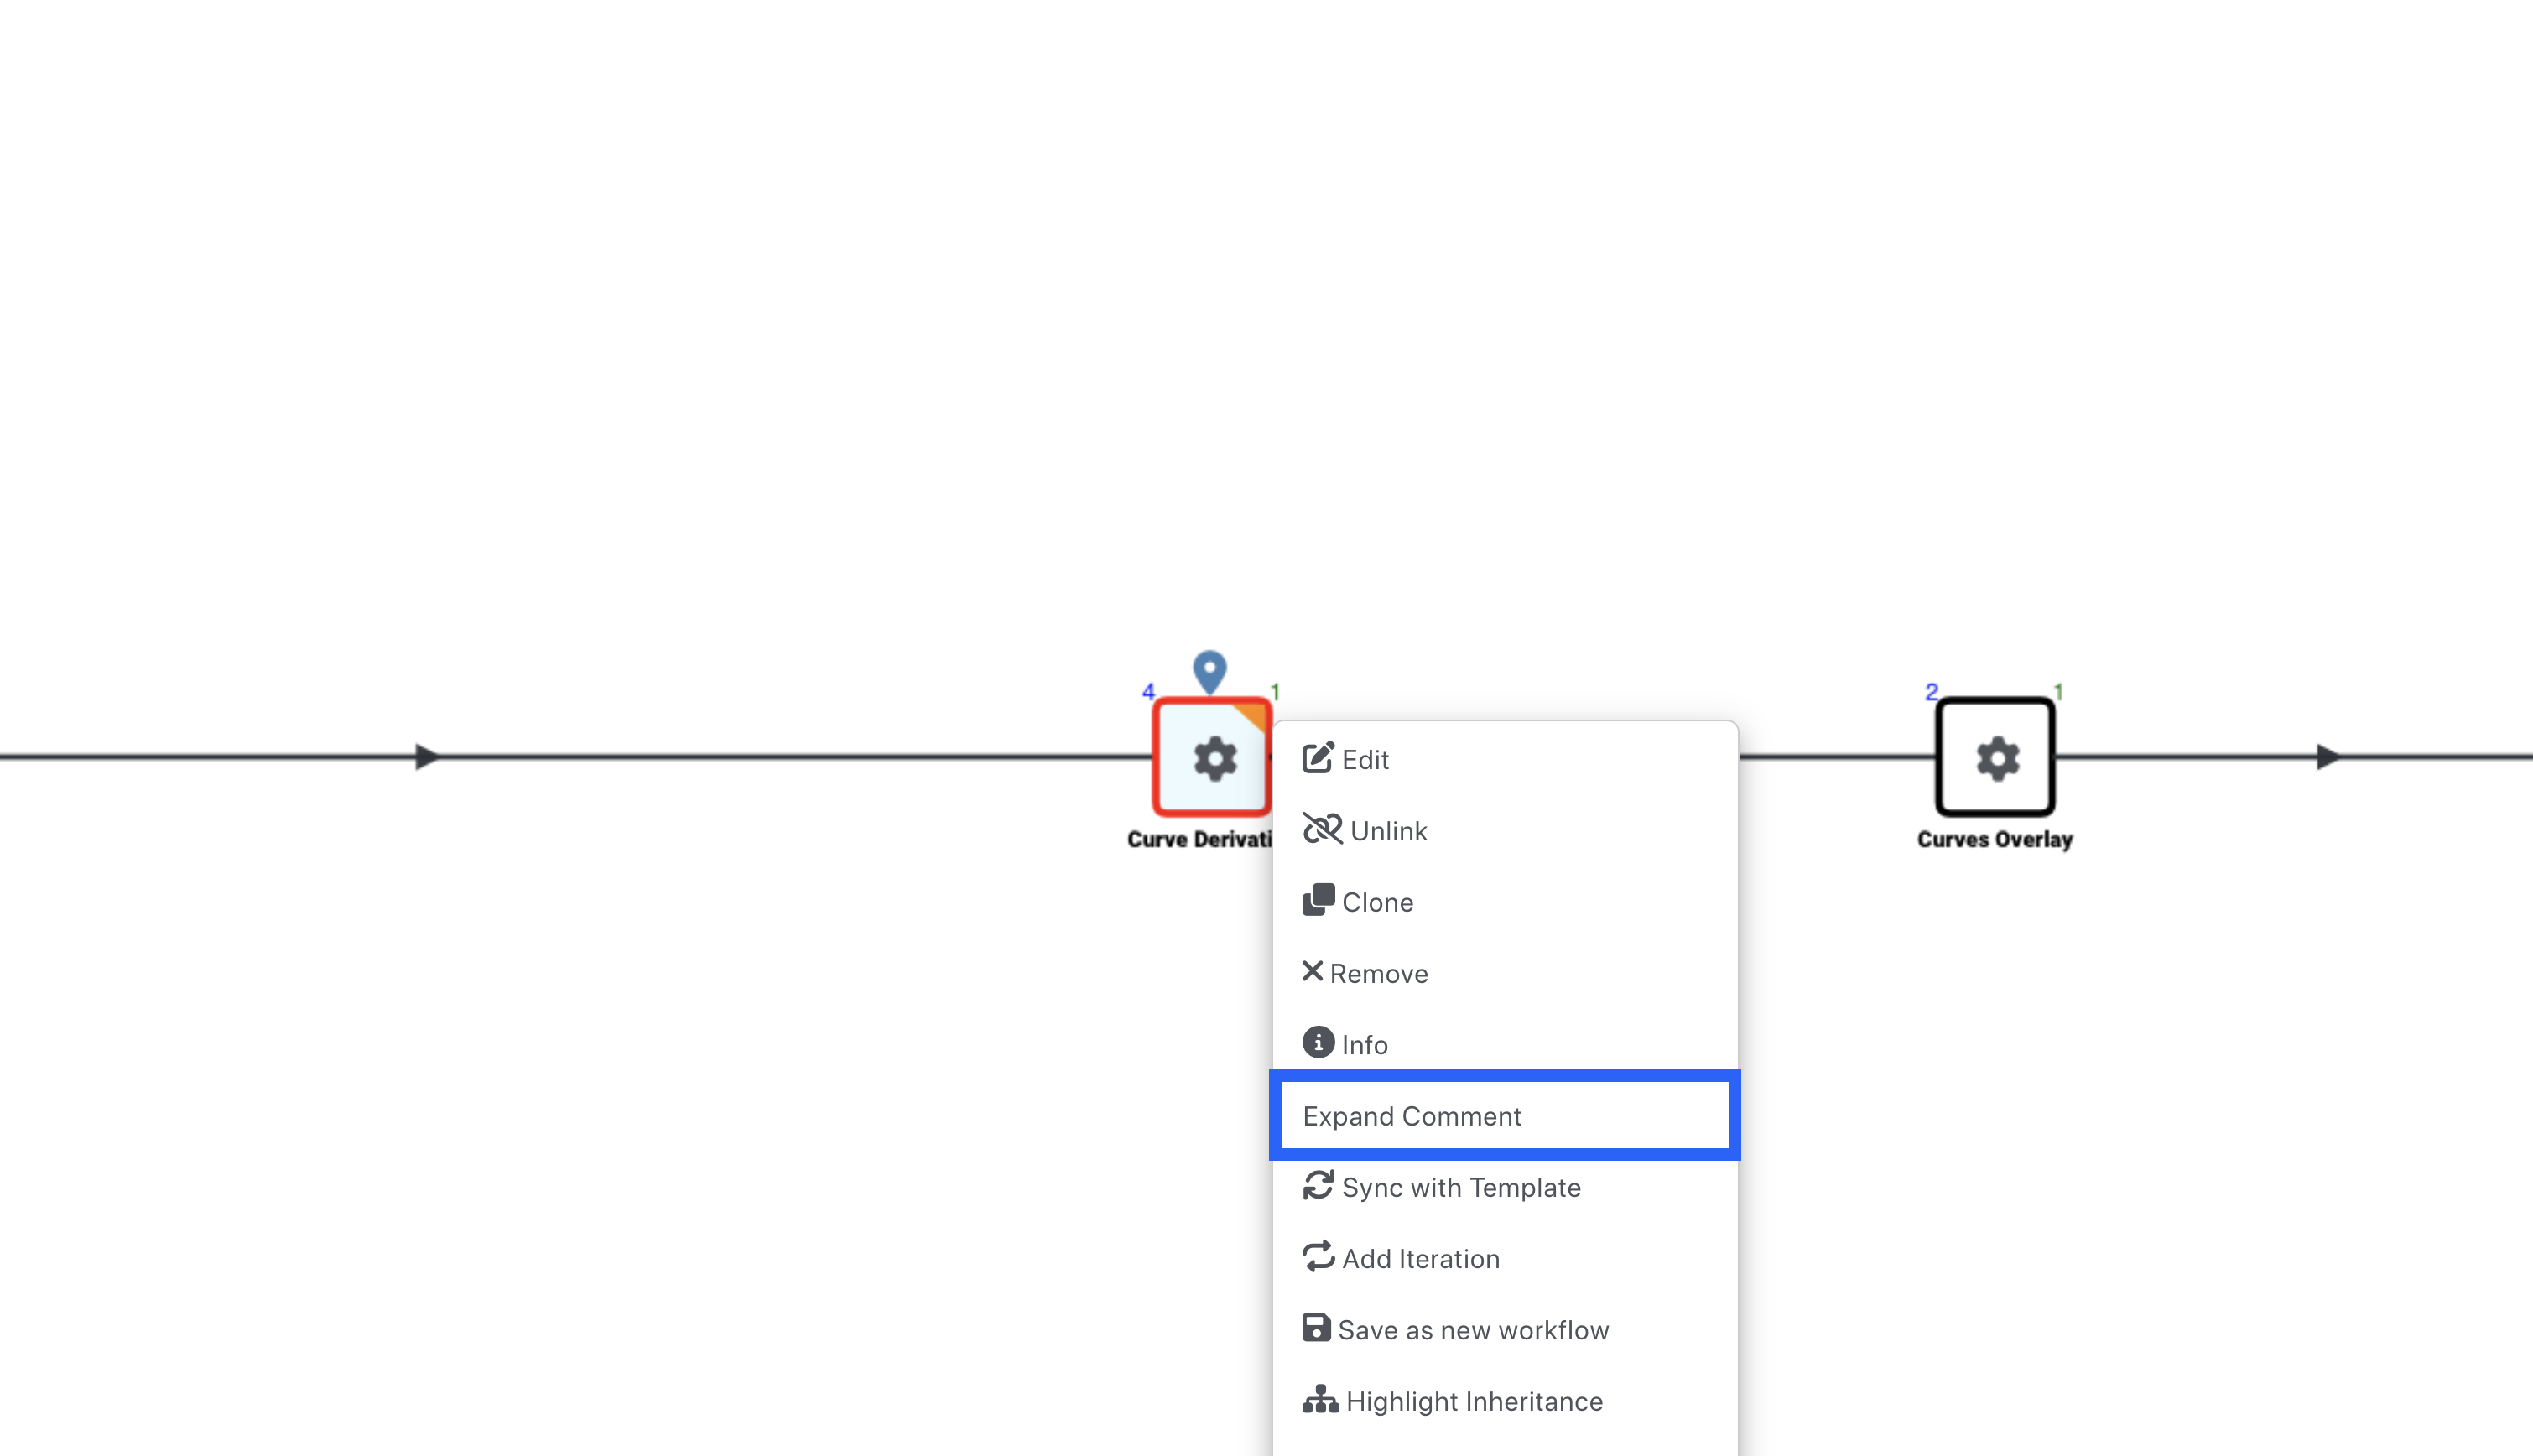
Figure 45: Uncollapse Comment
New as of September, 2022, we can hide and expand all comments under the right context menu as shown in the following video:
|info| Worker Info
Add Worker Info under shapes to show validity, execution time, etc. for selected parent workers.
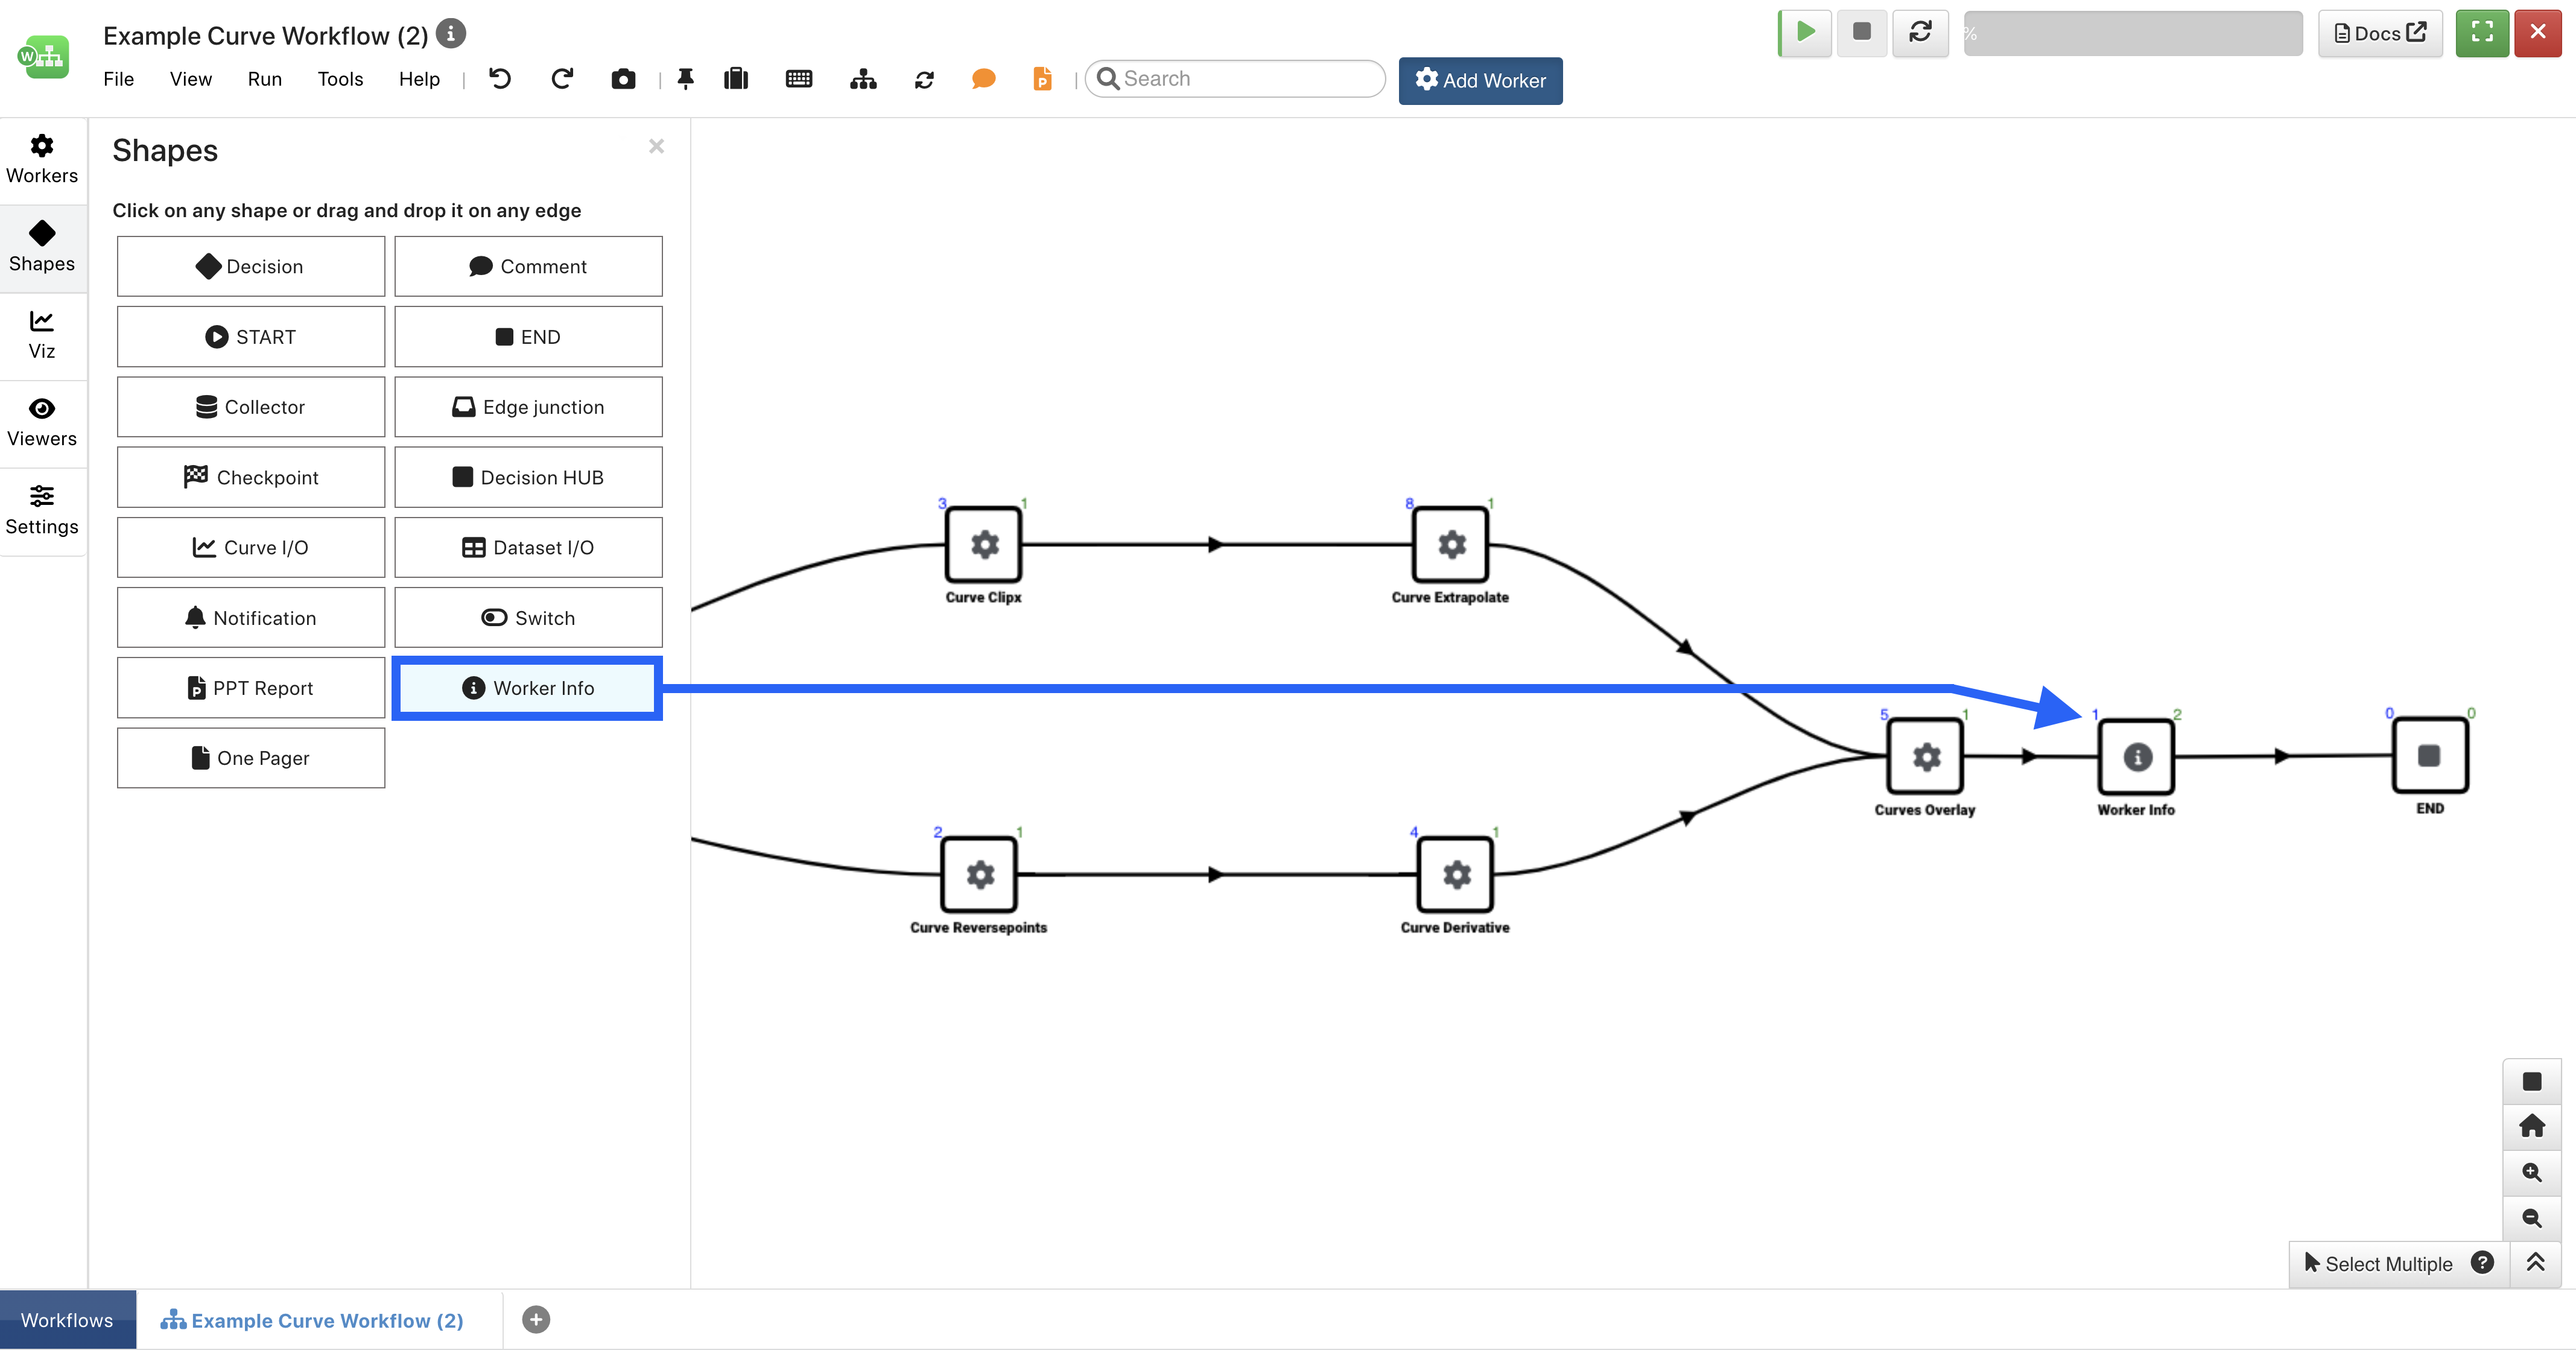
Figure 46: Add Worker Info
Choose from any of your previous workers in the workflow. You can view the worker information via a dataset or in Simlytiks (shown in following image via Test Execution).
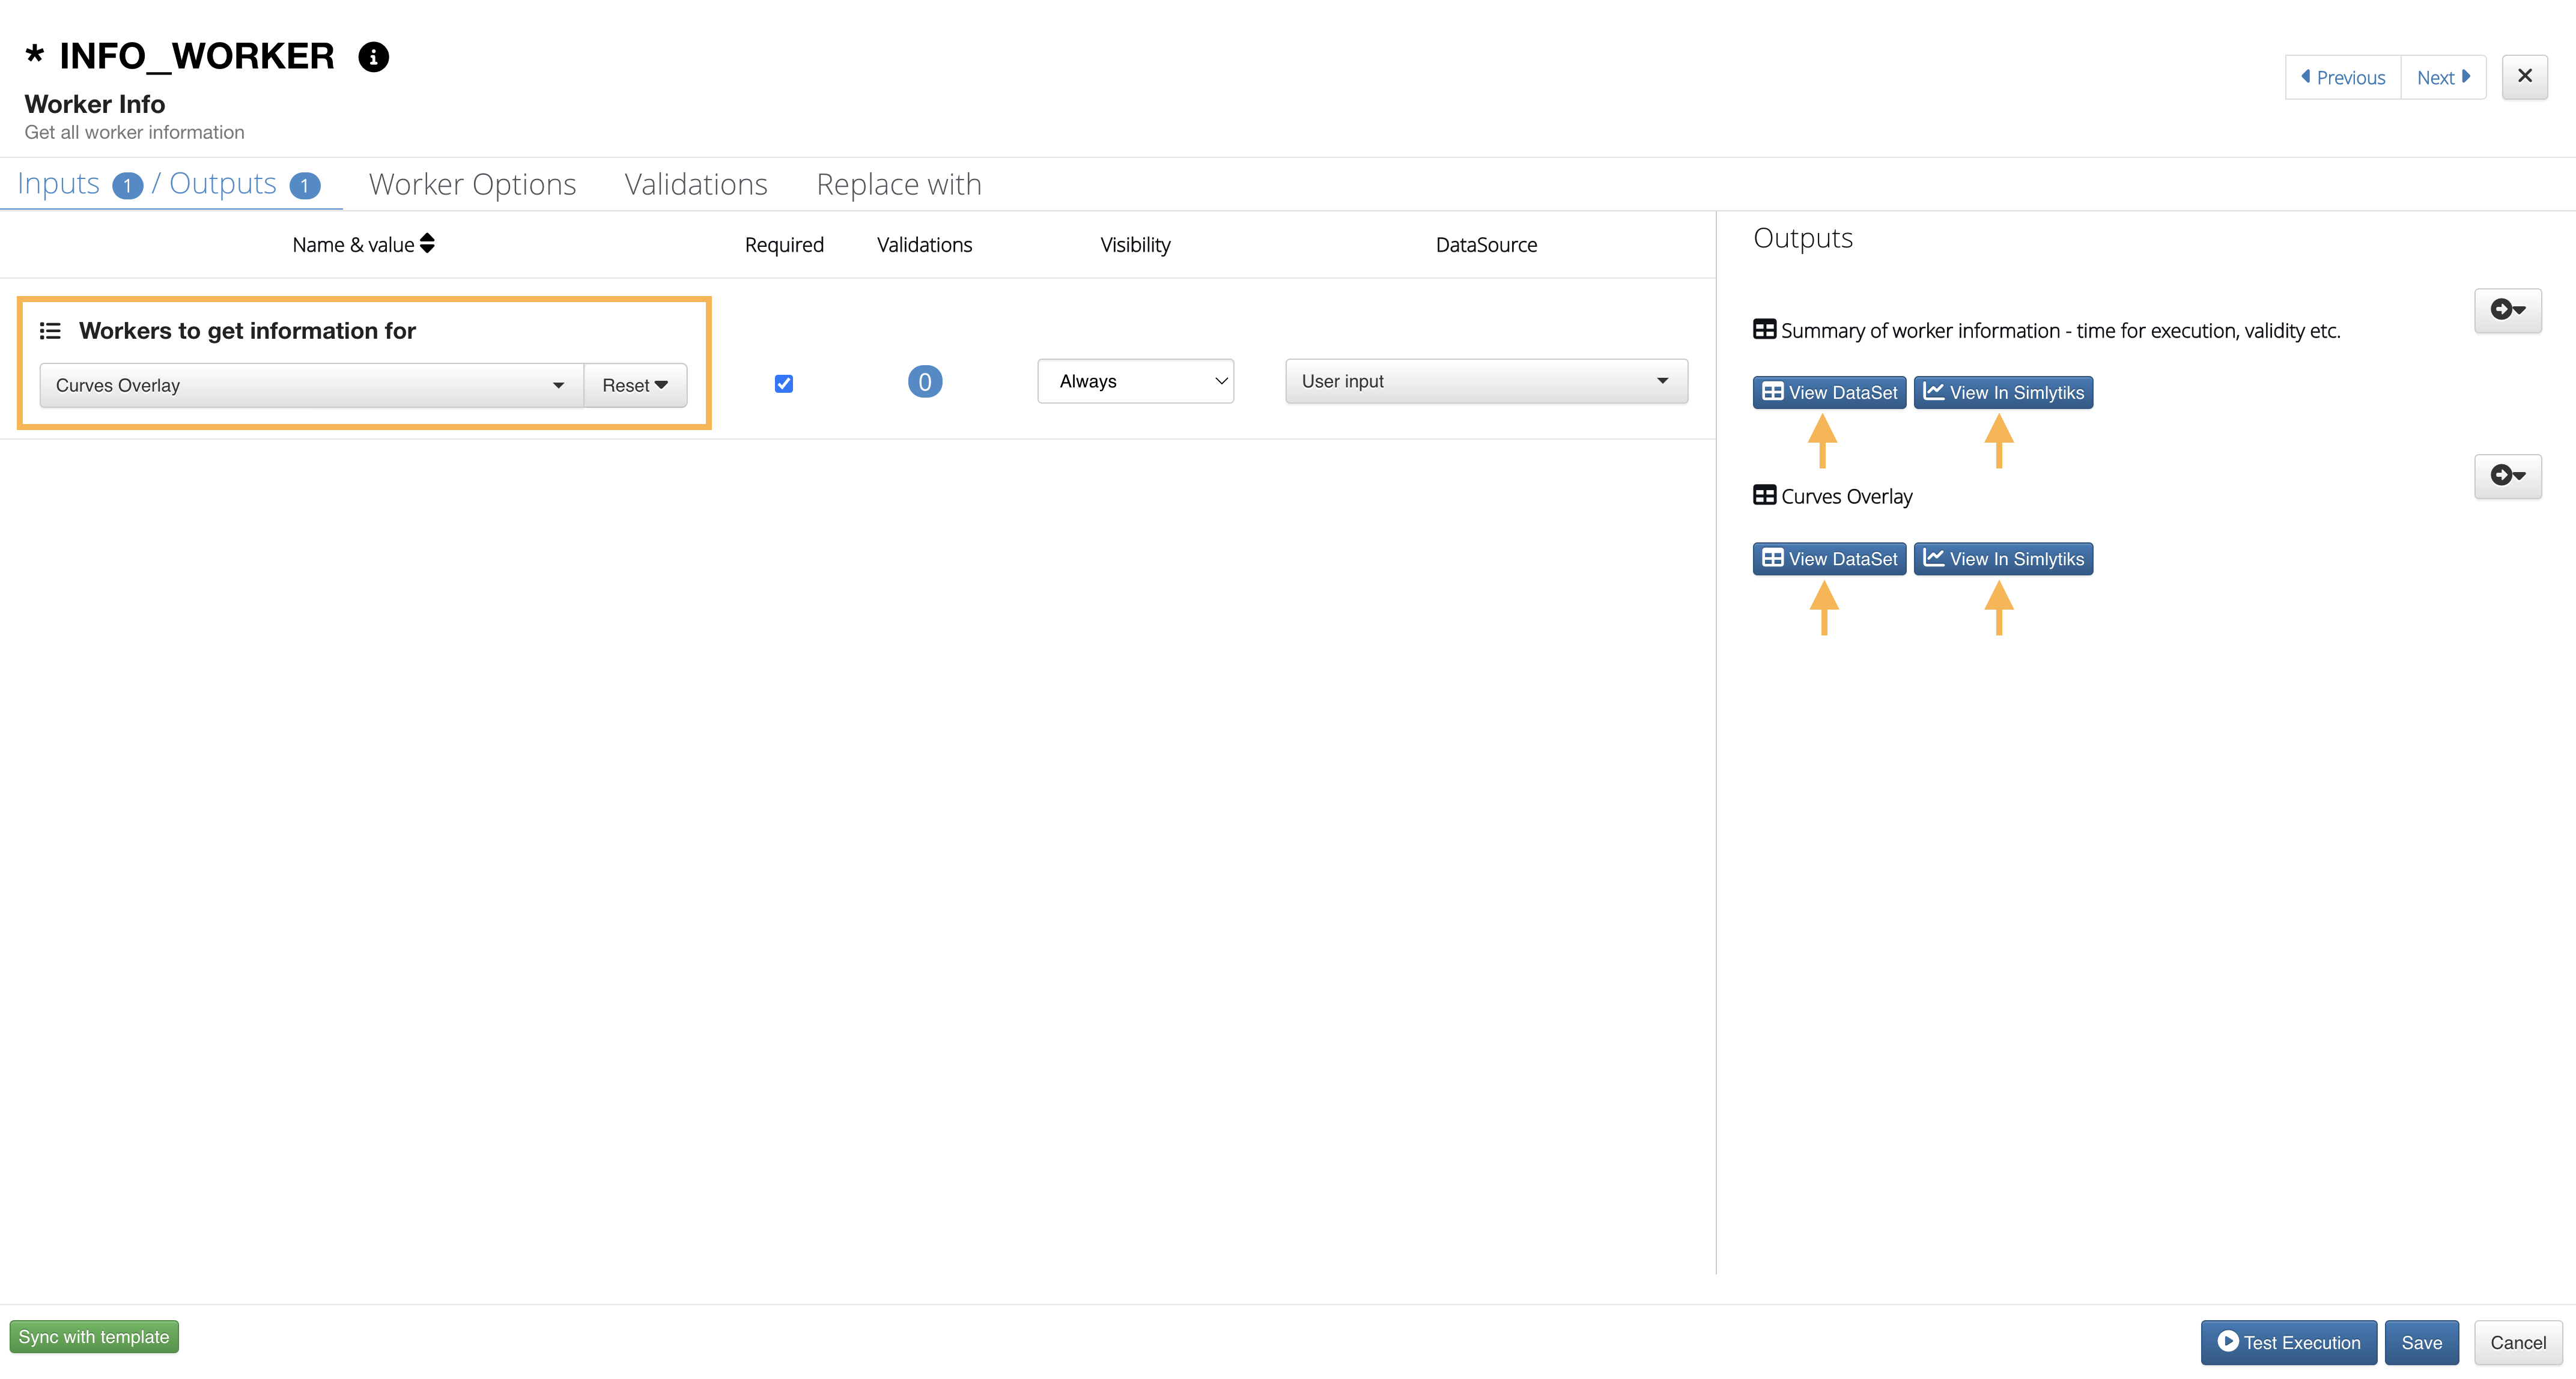
Figure 47: View Worker Information
|file| One Pager
The One Pager worker under the Shapes menu is used to create a one page template layout for the workflow.
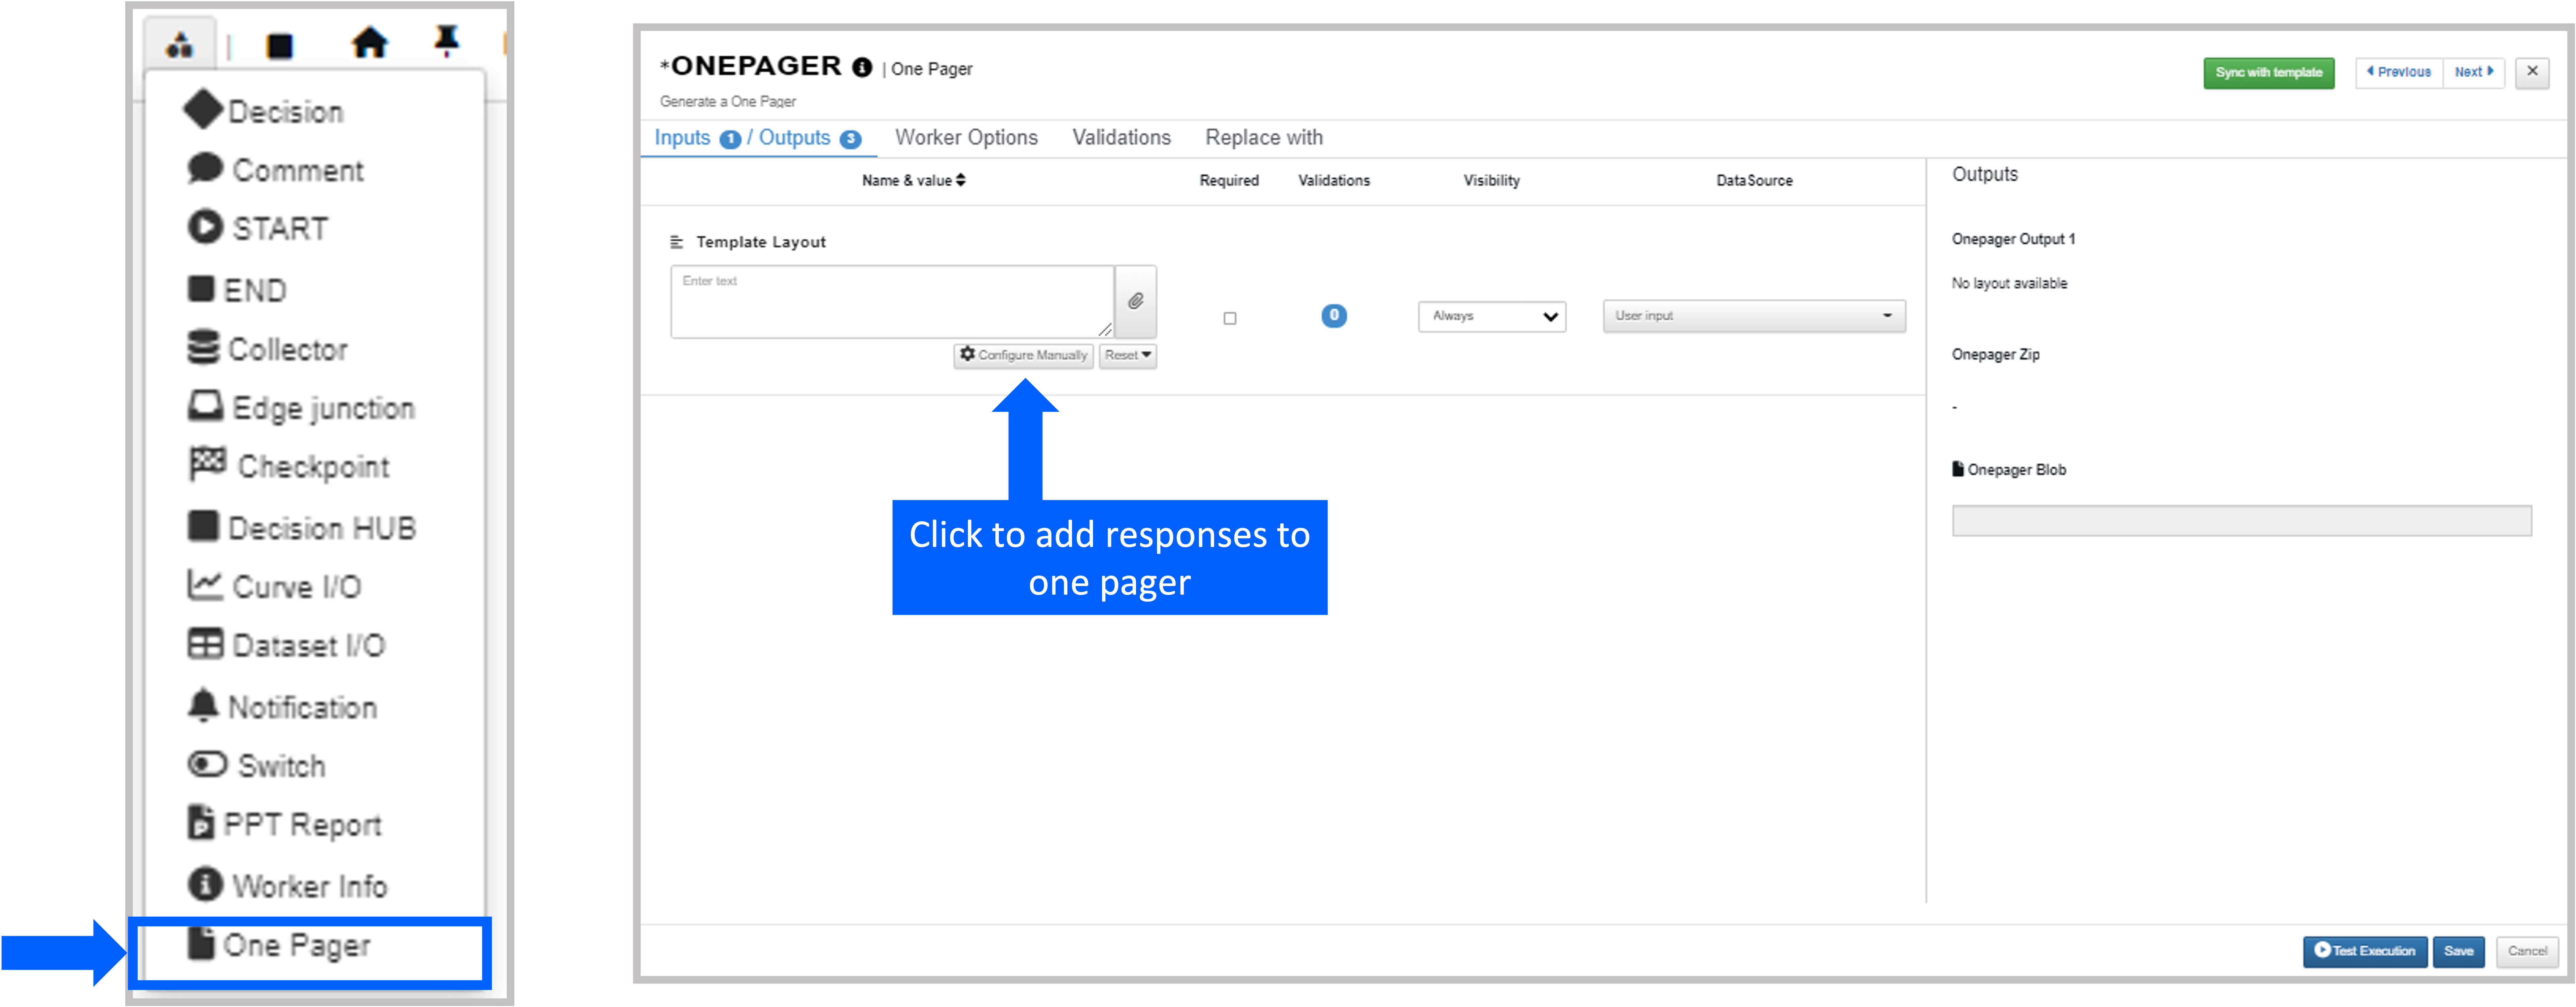
Figure 48: One Pager Worker
|align-justify| Text Parameterize GUI
The Text Parameterize GUI worker under the Shapes menu is used to manually input parameters for text files, usually keyword, so it can be used for multiple workers. Let’s go over an example of how to configure it.
Start by adding it to the canvas.
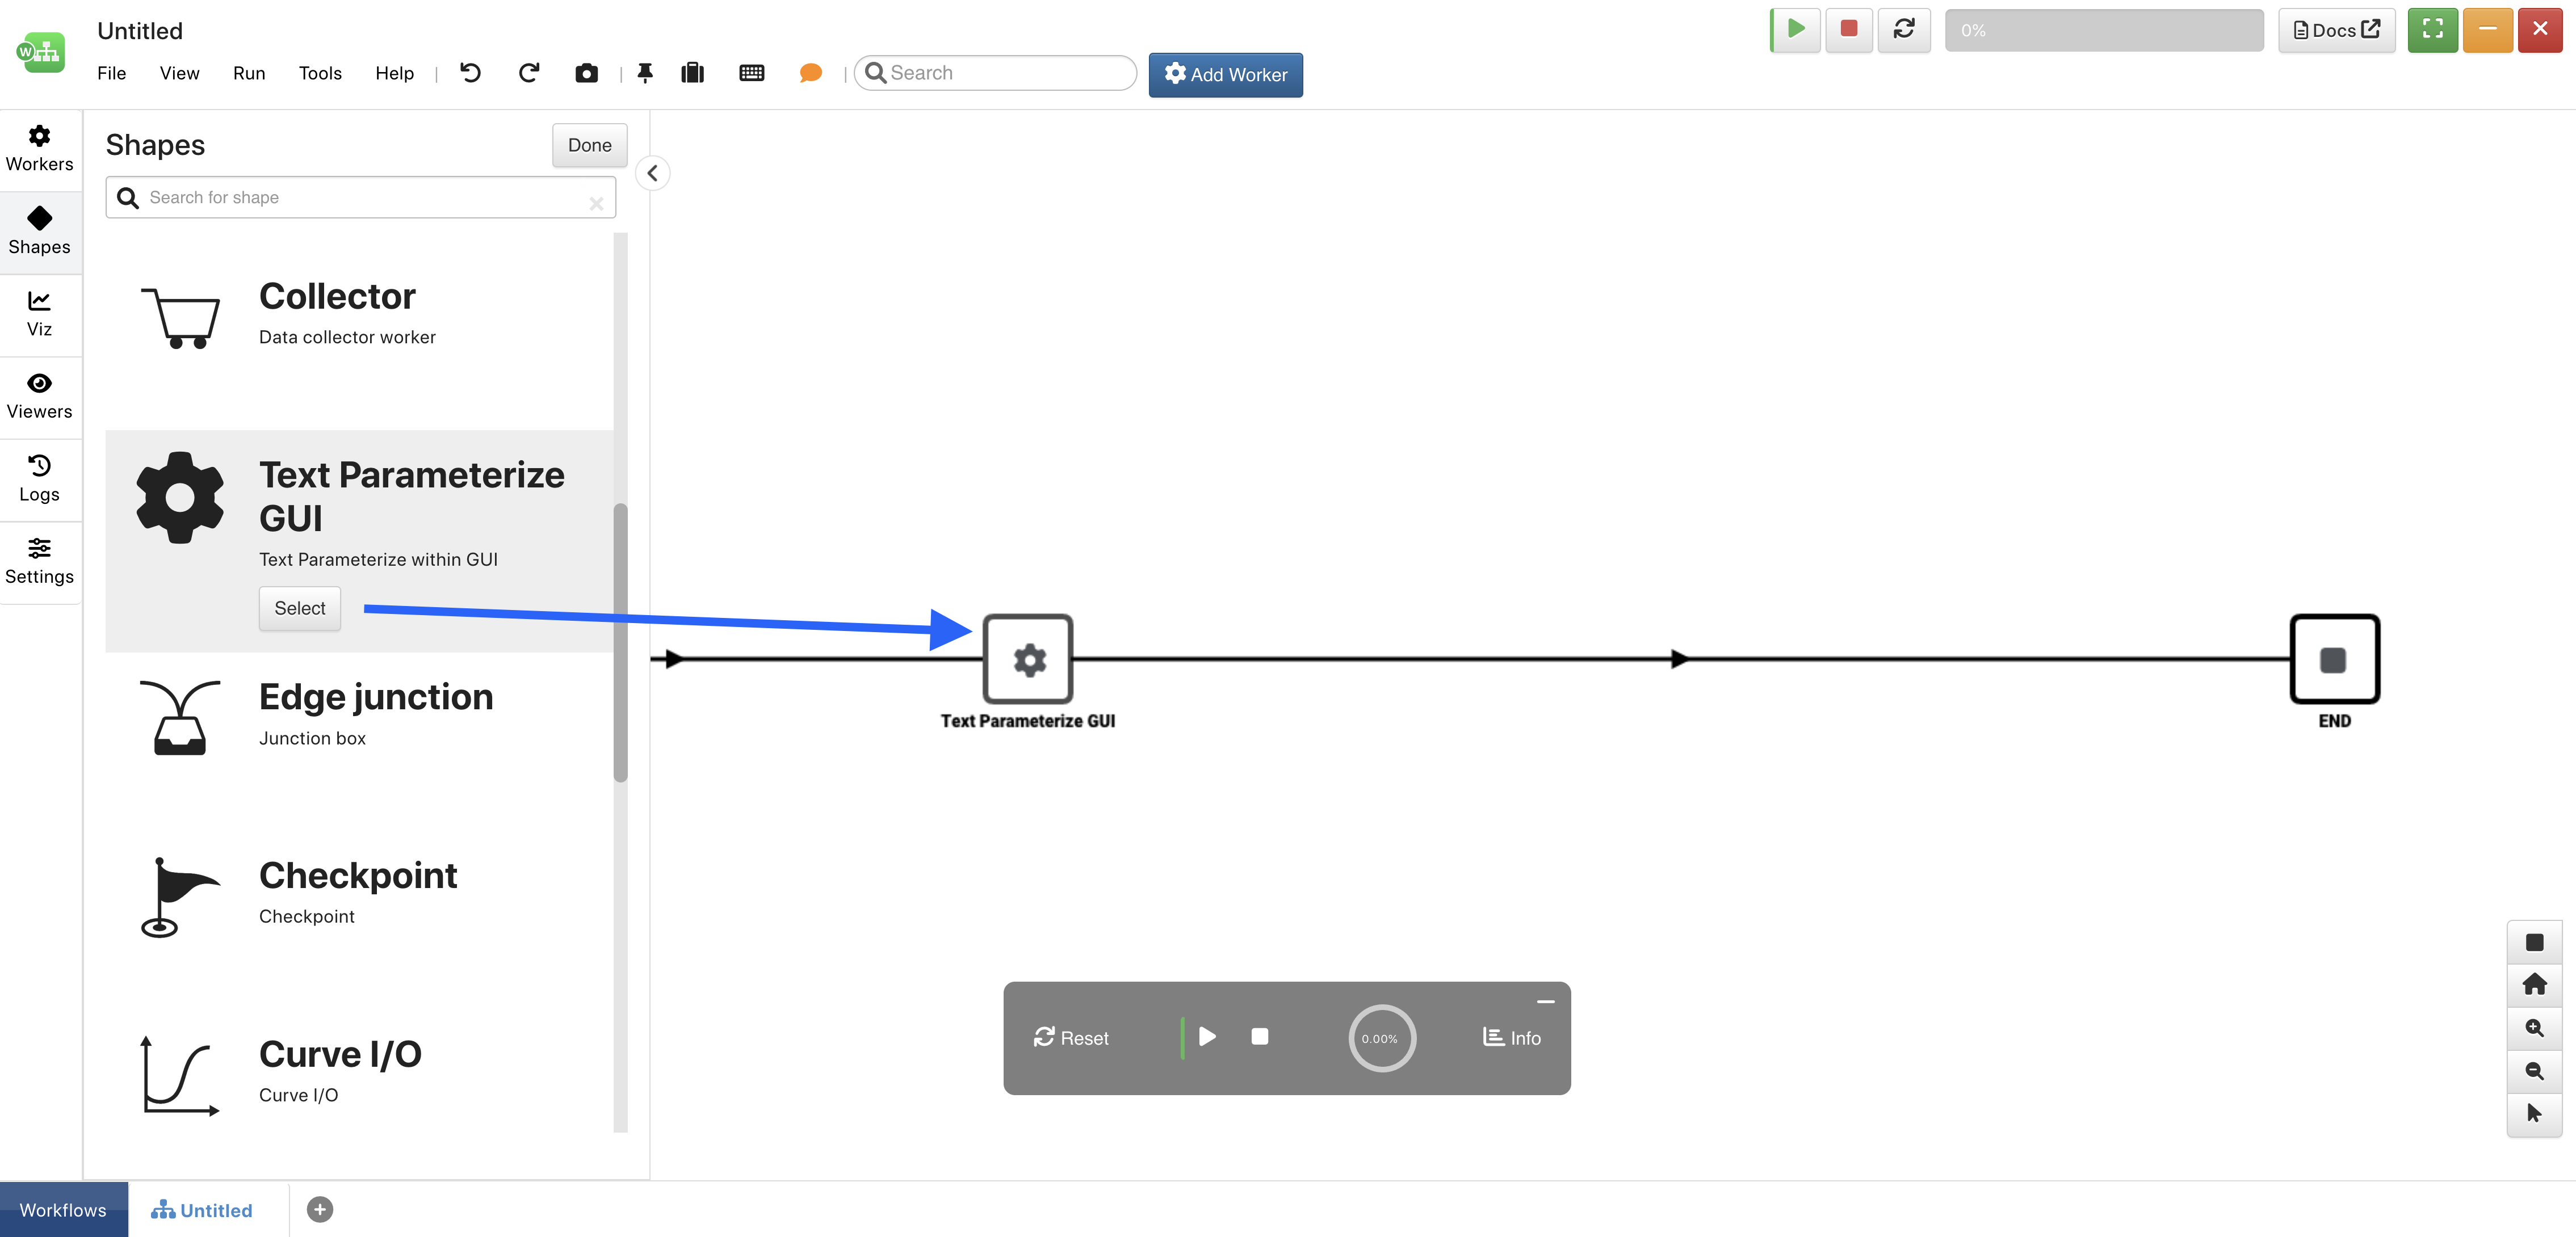
Figure 49: Add Text Parameterize GUI
Open the worker and add your text file by clicking on the paper clip icon.
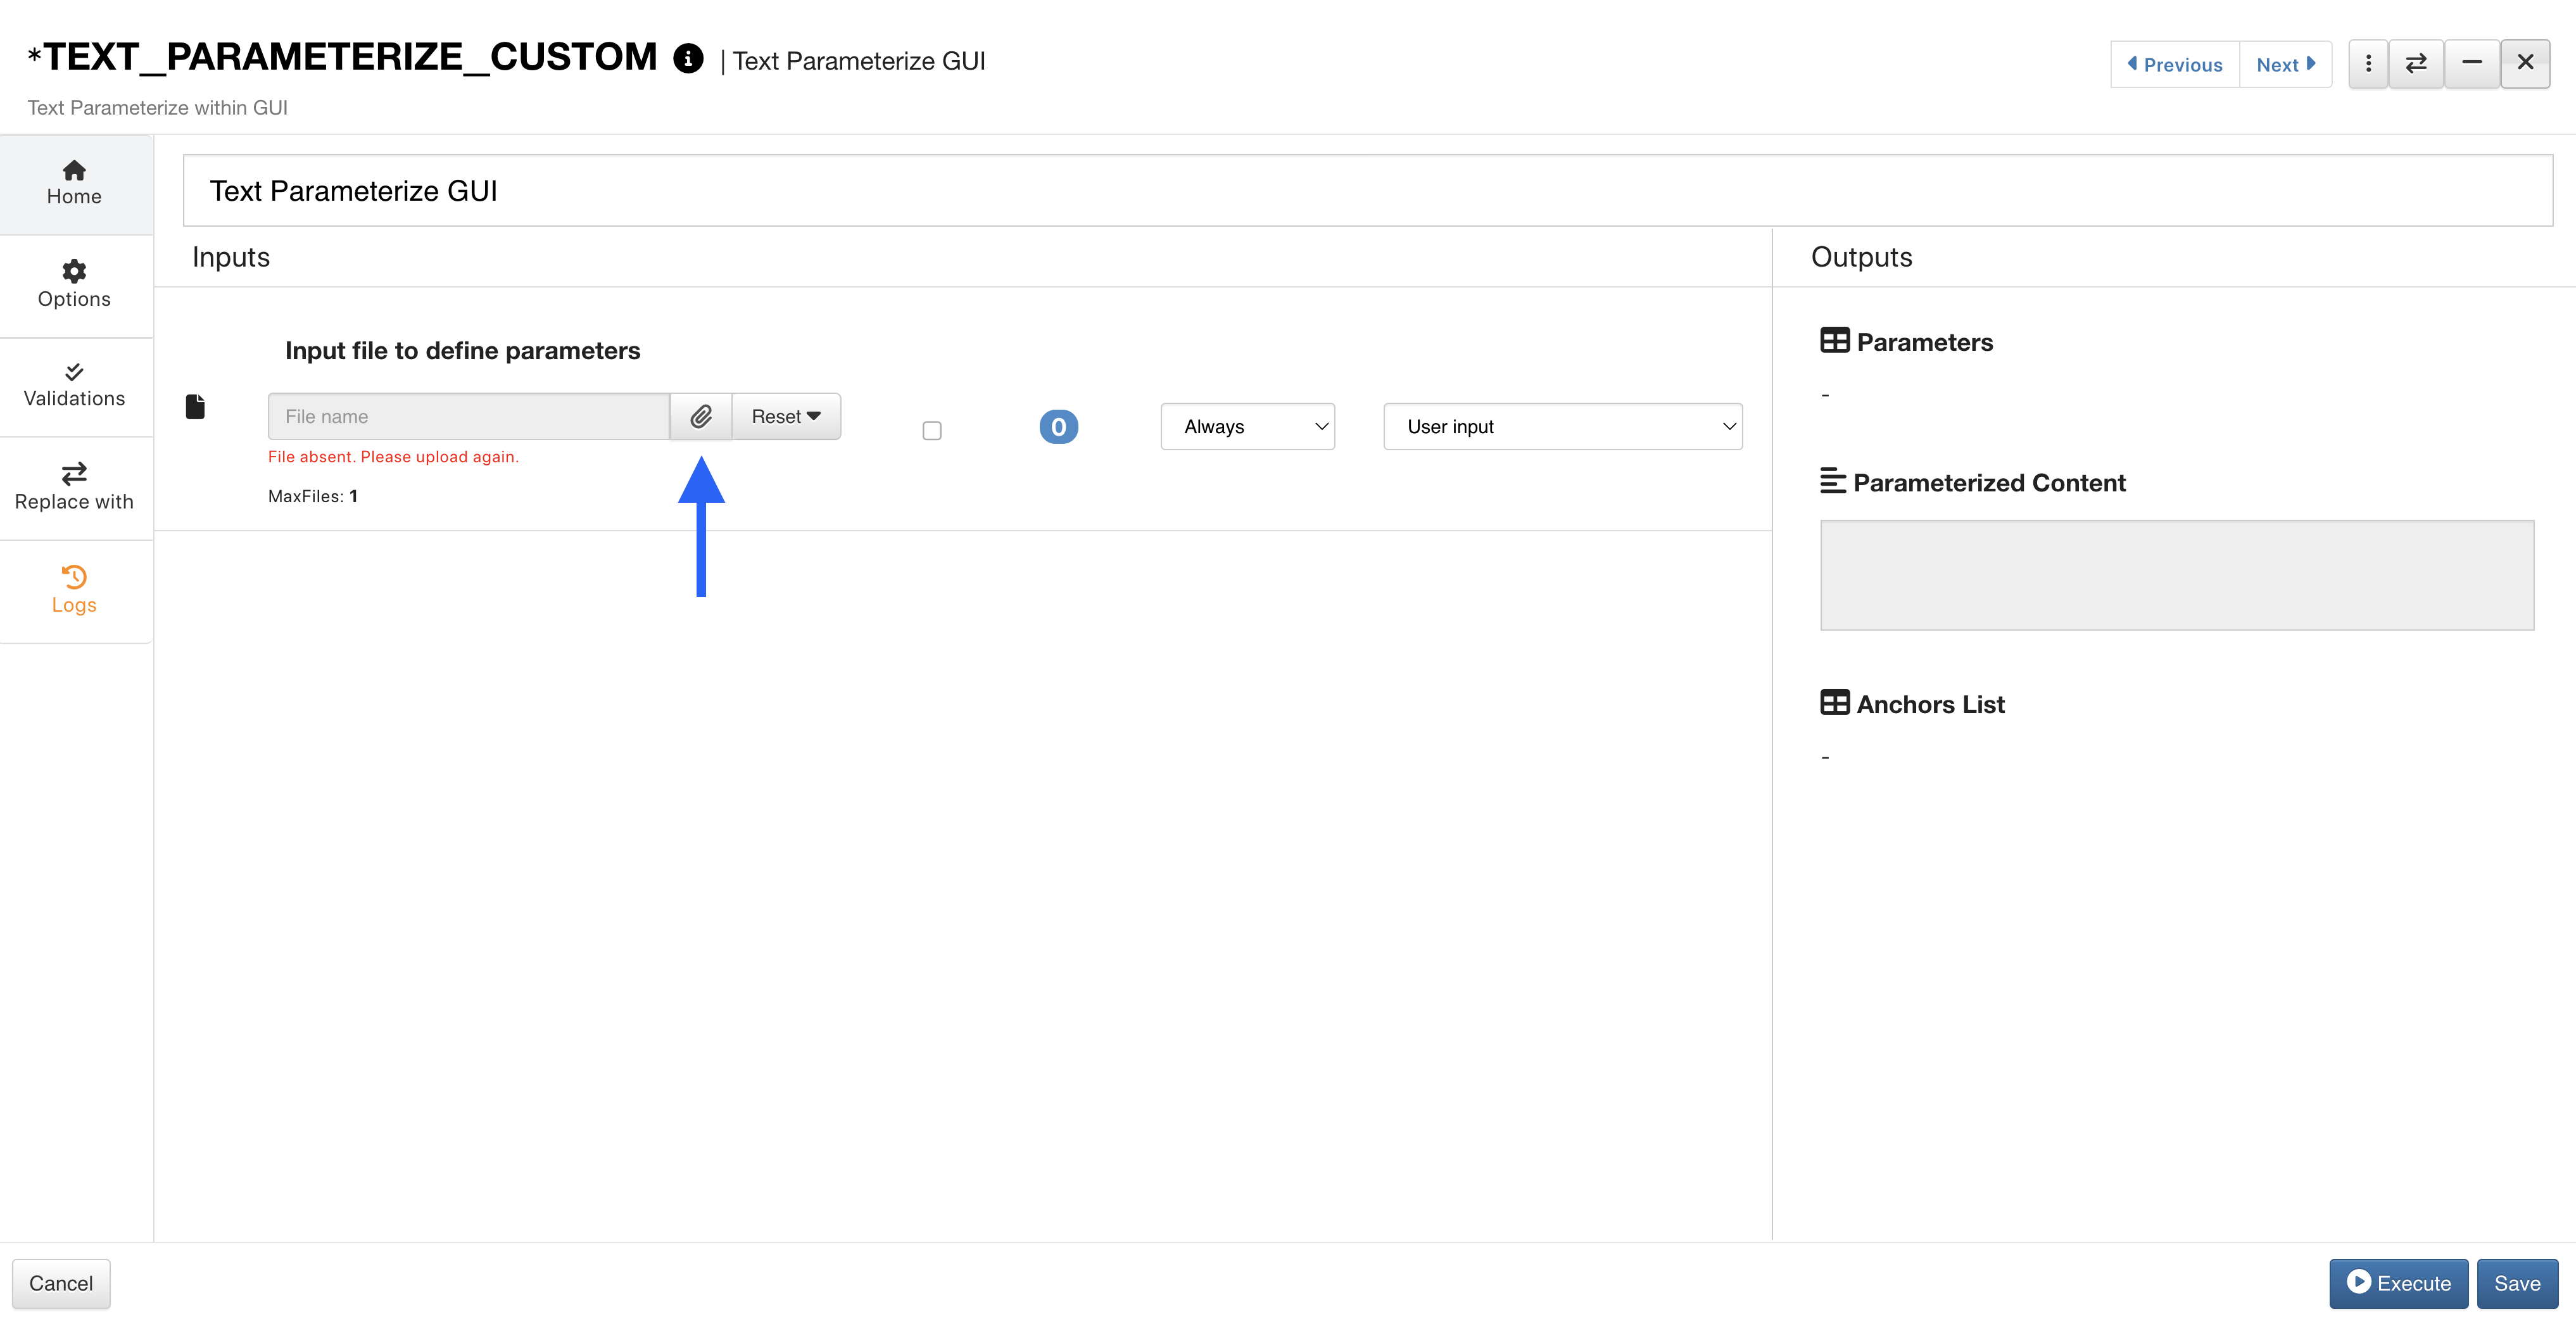
Figure 50: Add Text File
The text parser will automatically open for us to add more parameters. Highlight an area to parameterize and right-click to select Create Parameter.
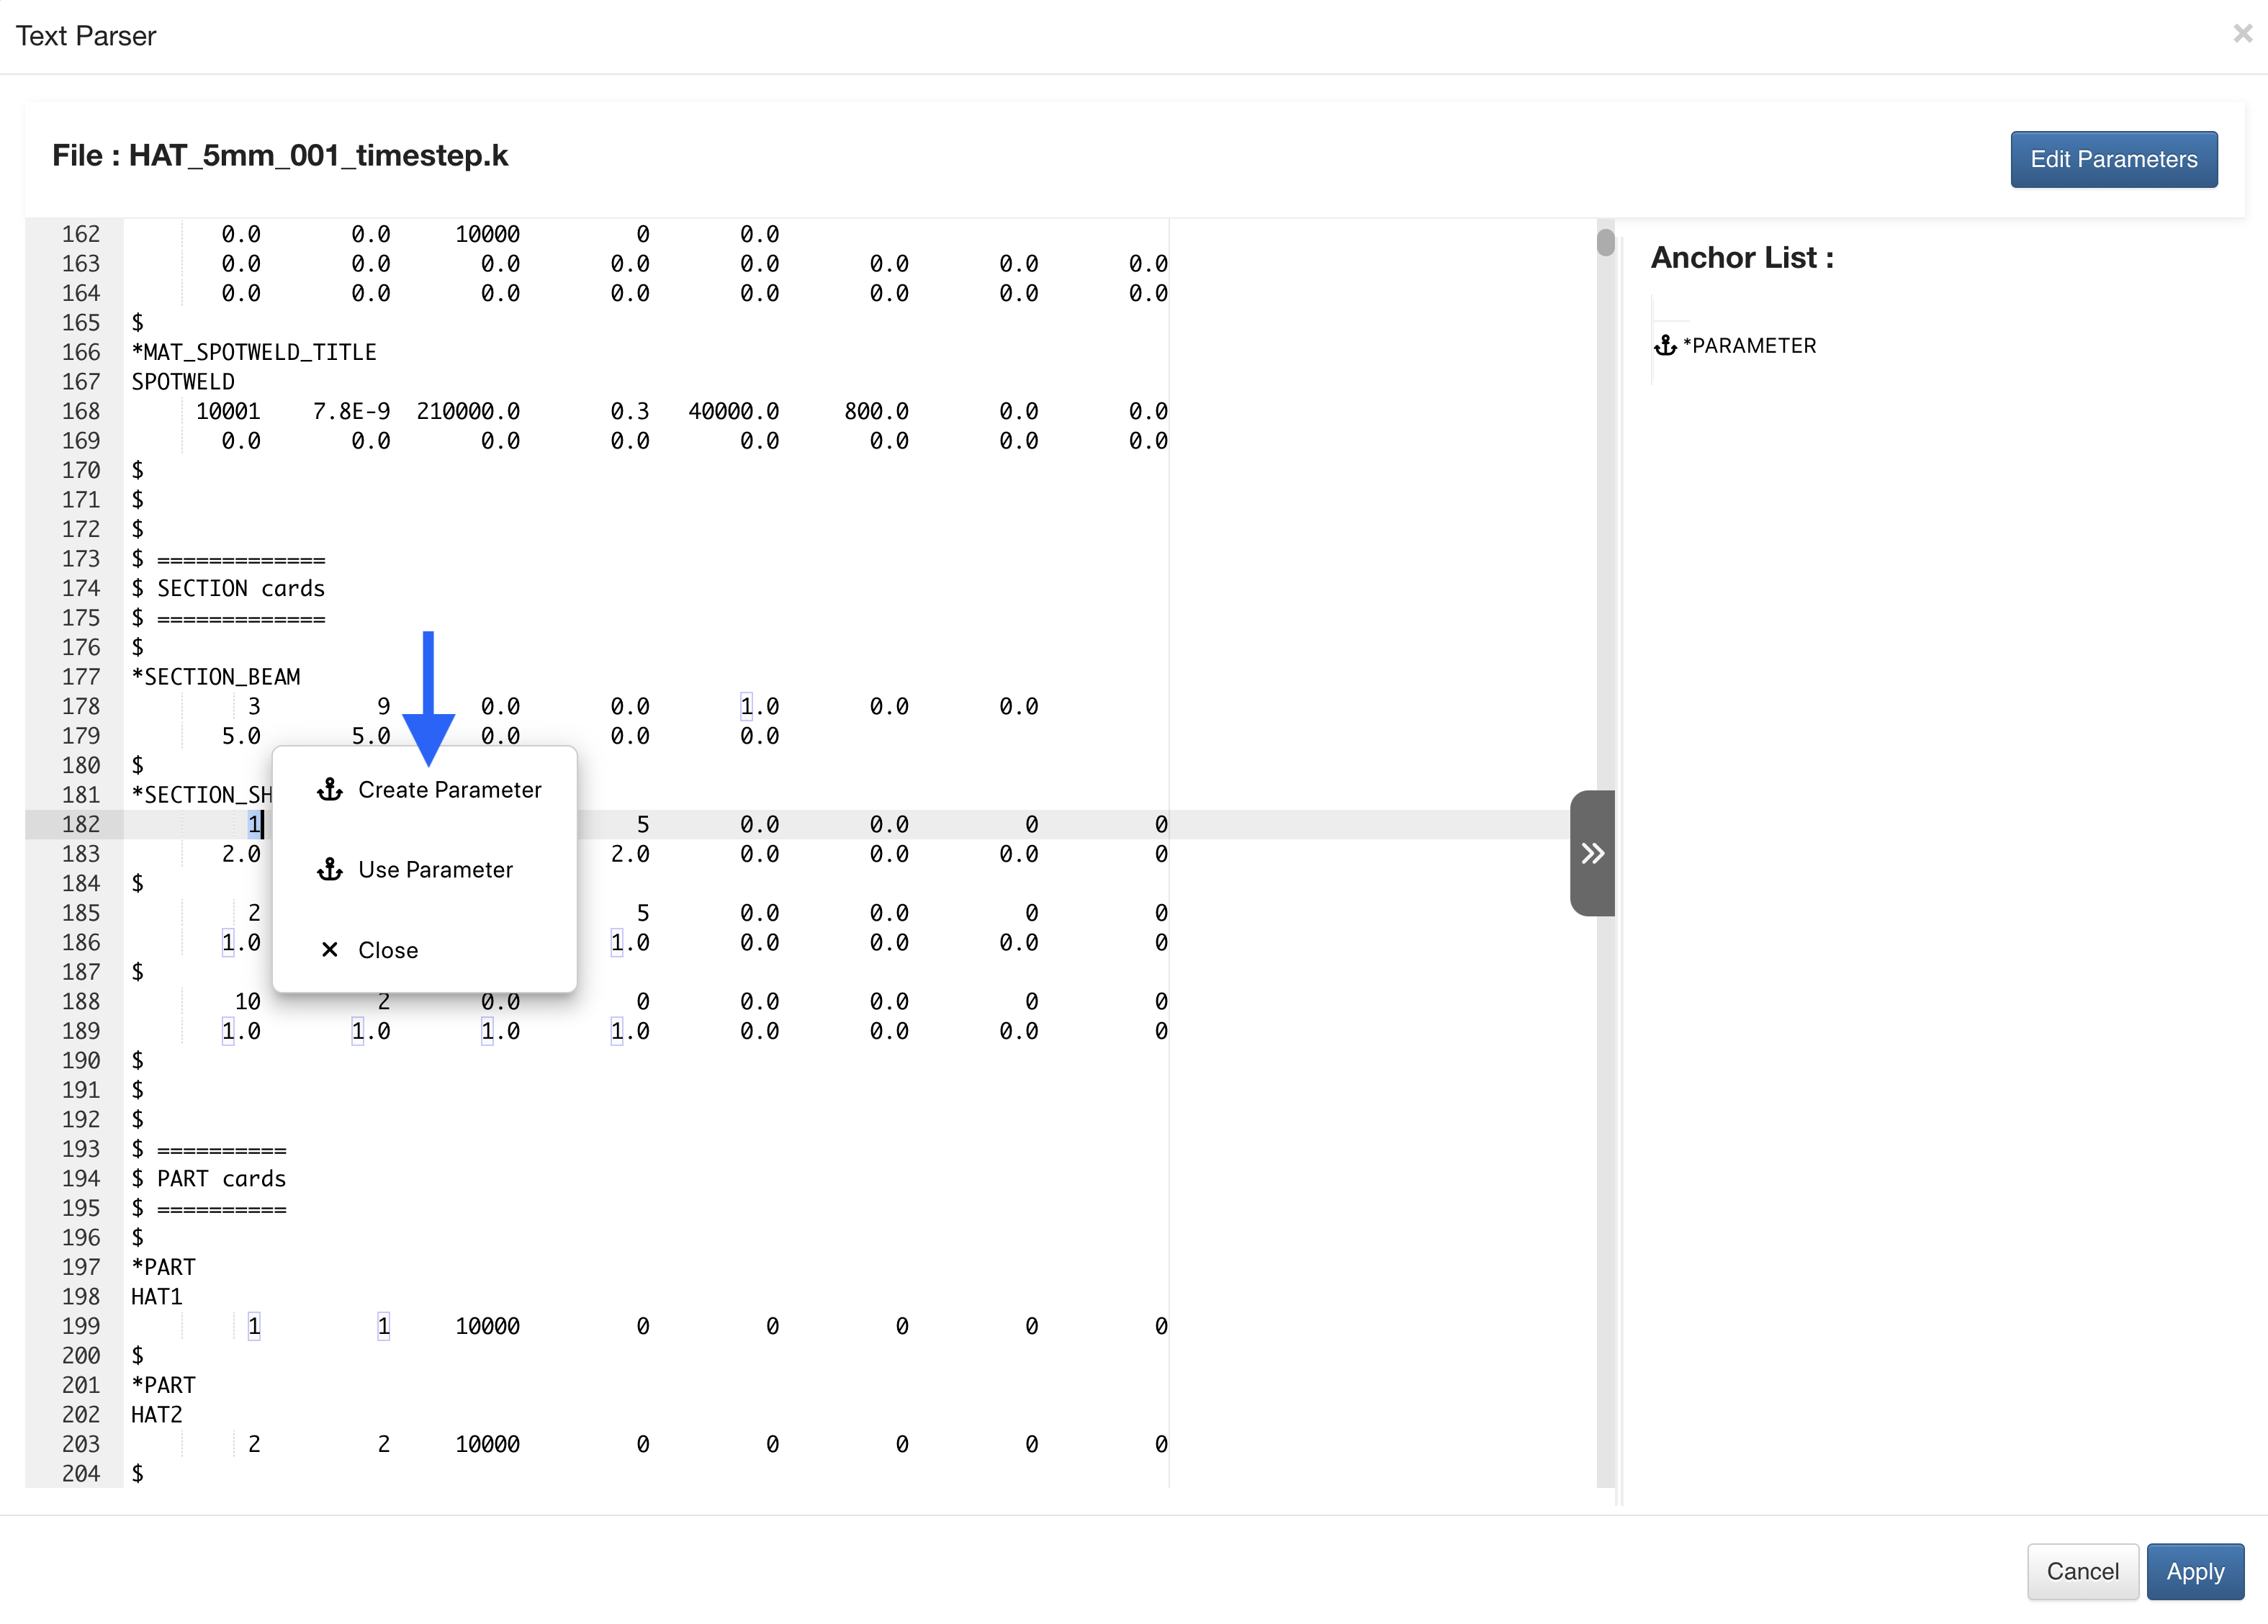
Figure 51: Text Parser Create Parameter
In the next window, we’ll set our parameter specs and link it to the parameter anchor.
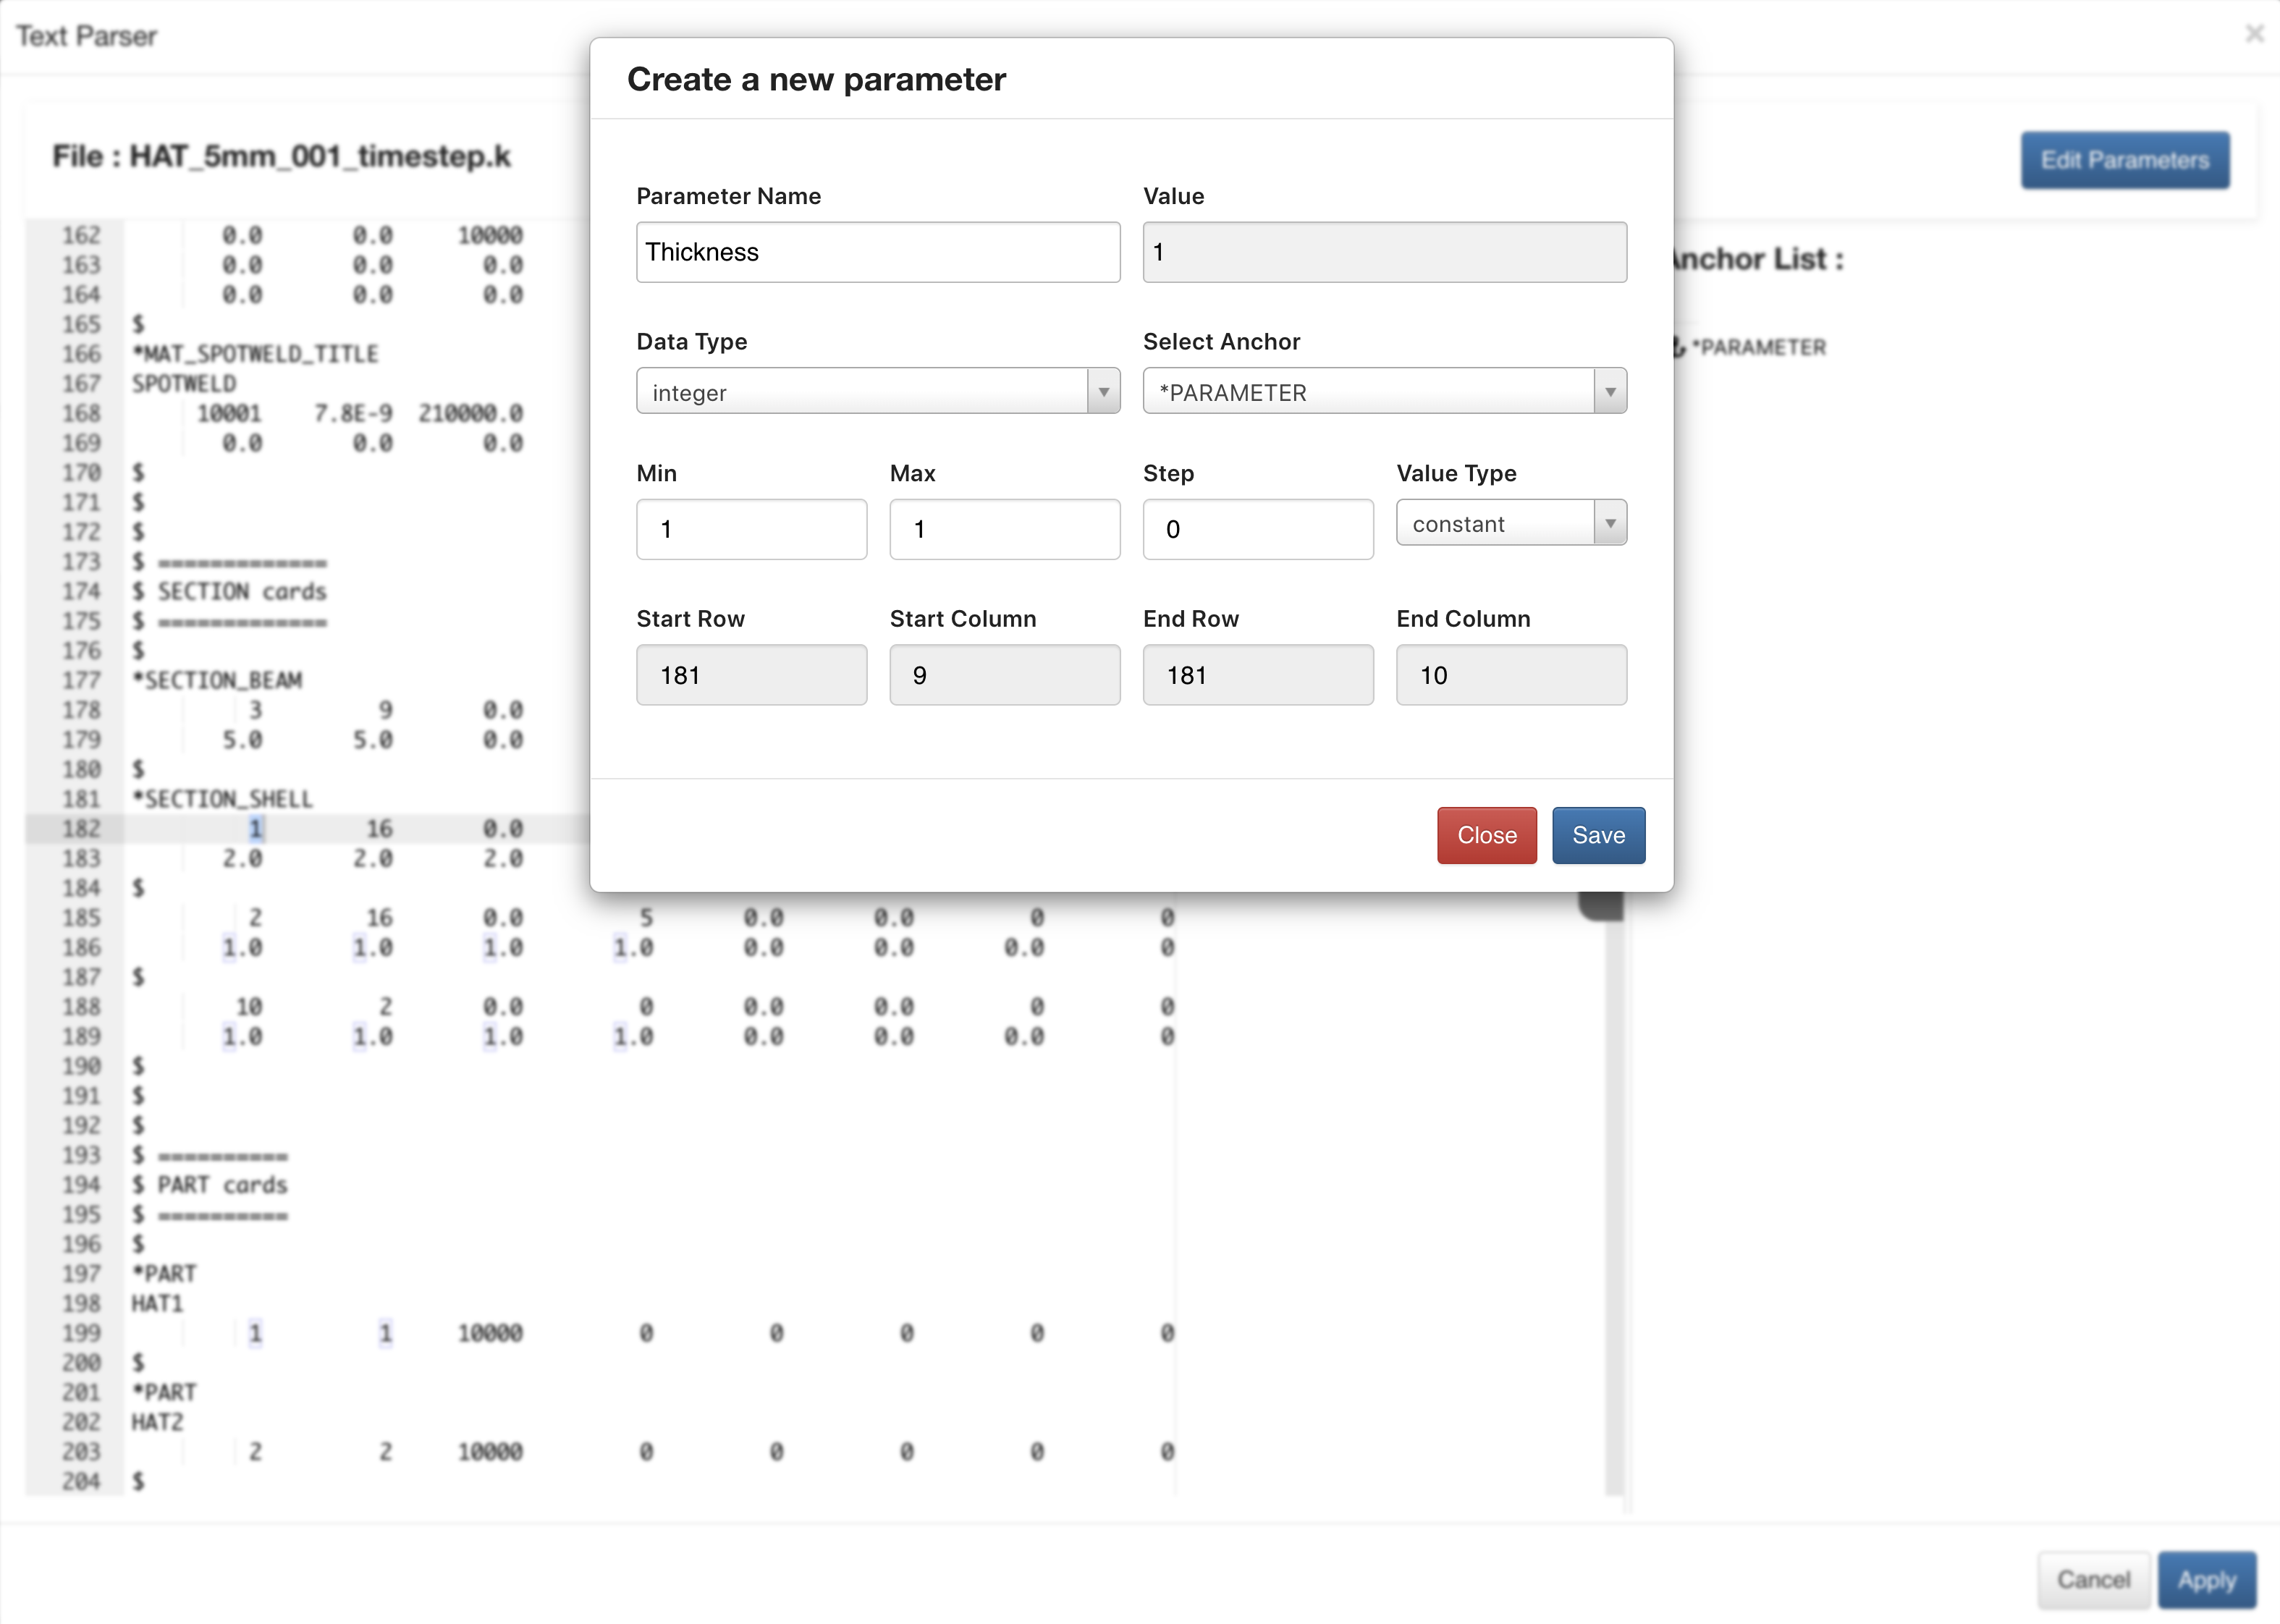
Figure 52: Create Parameter Specifications
We can then highlight another value, right-click and choose Use Parameter.
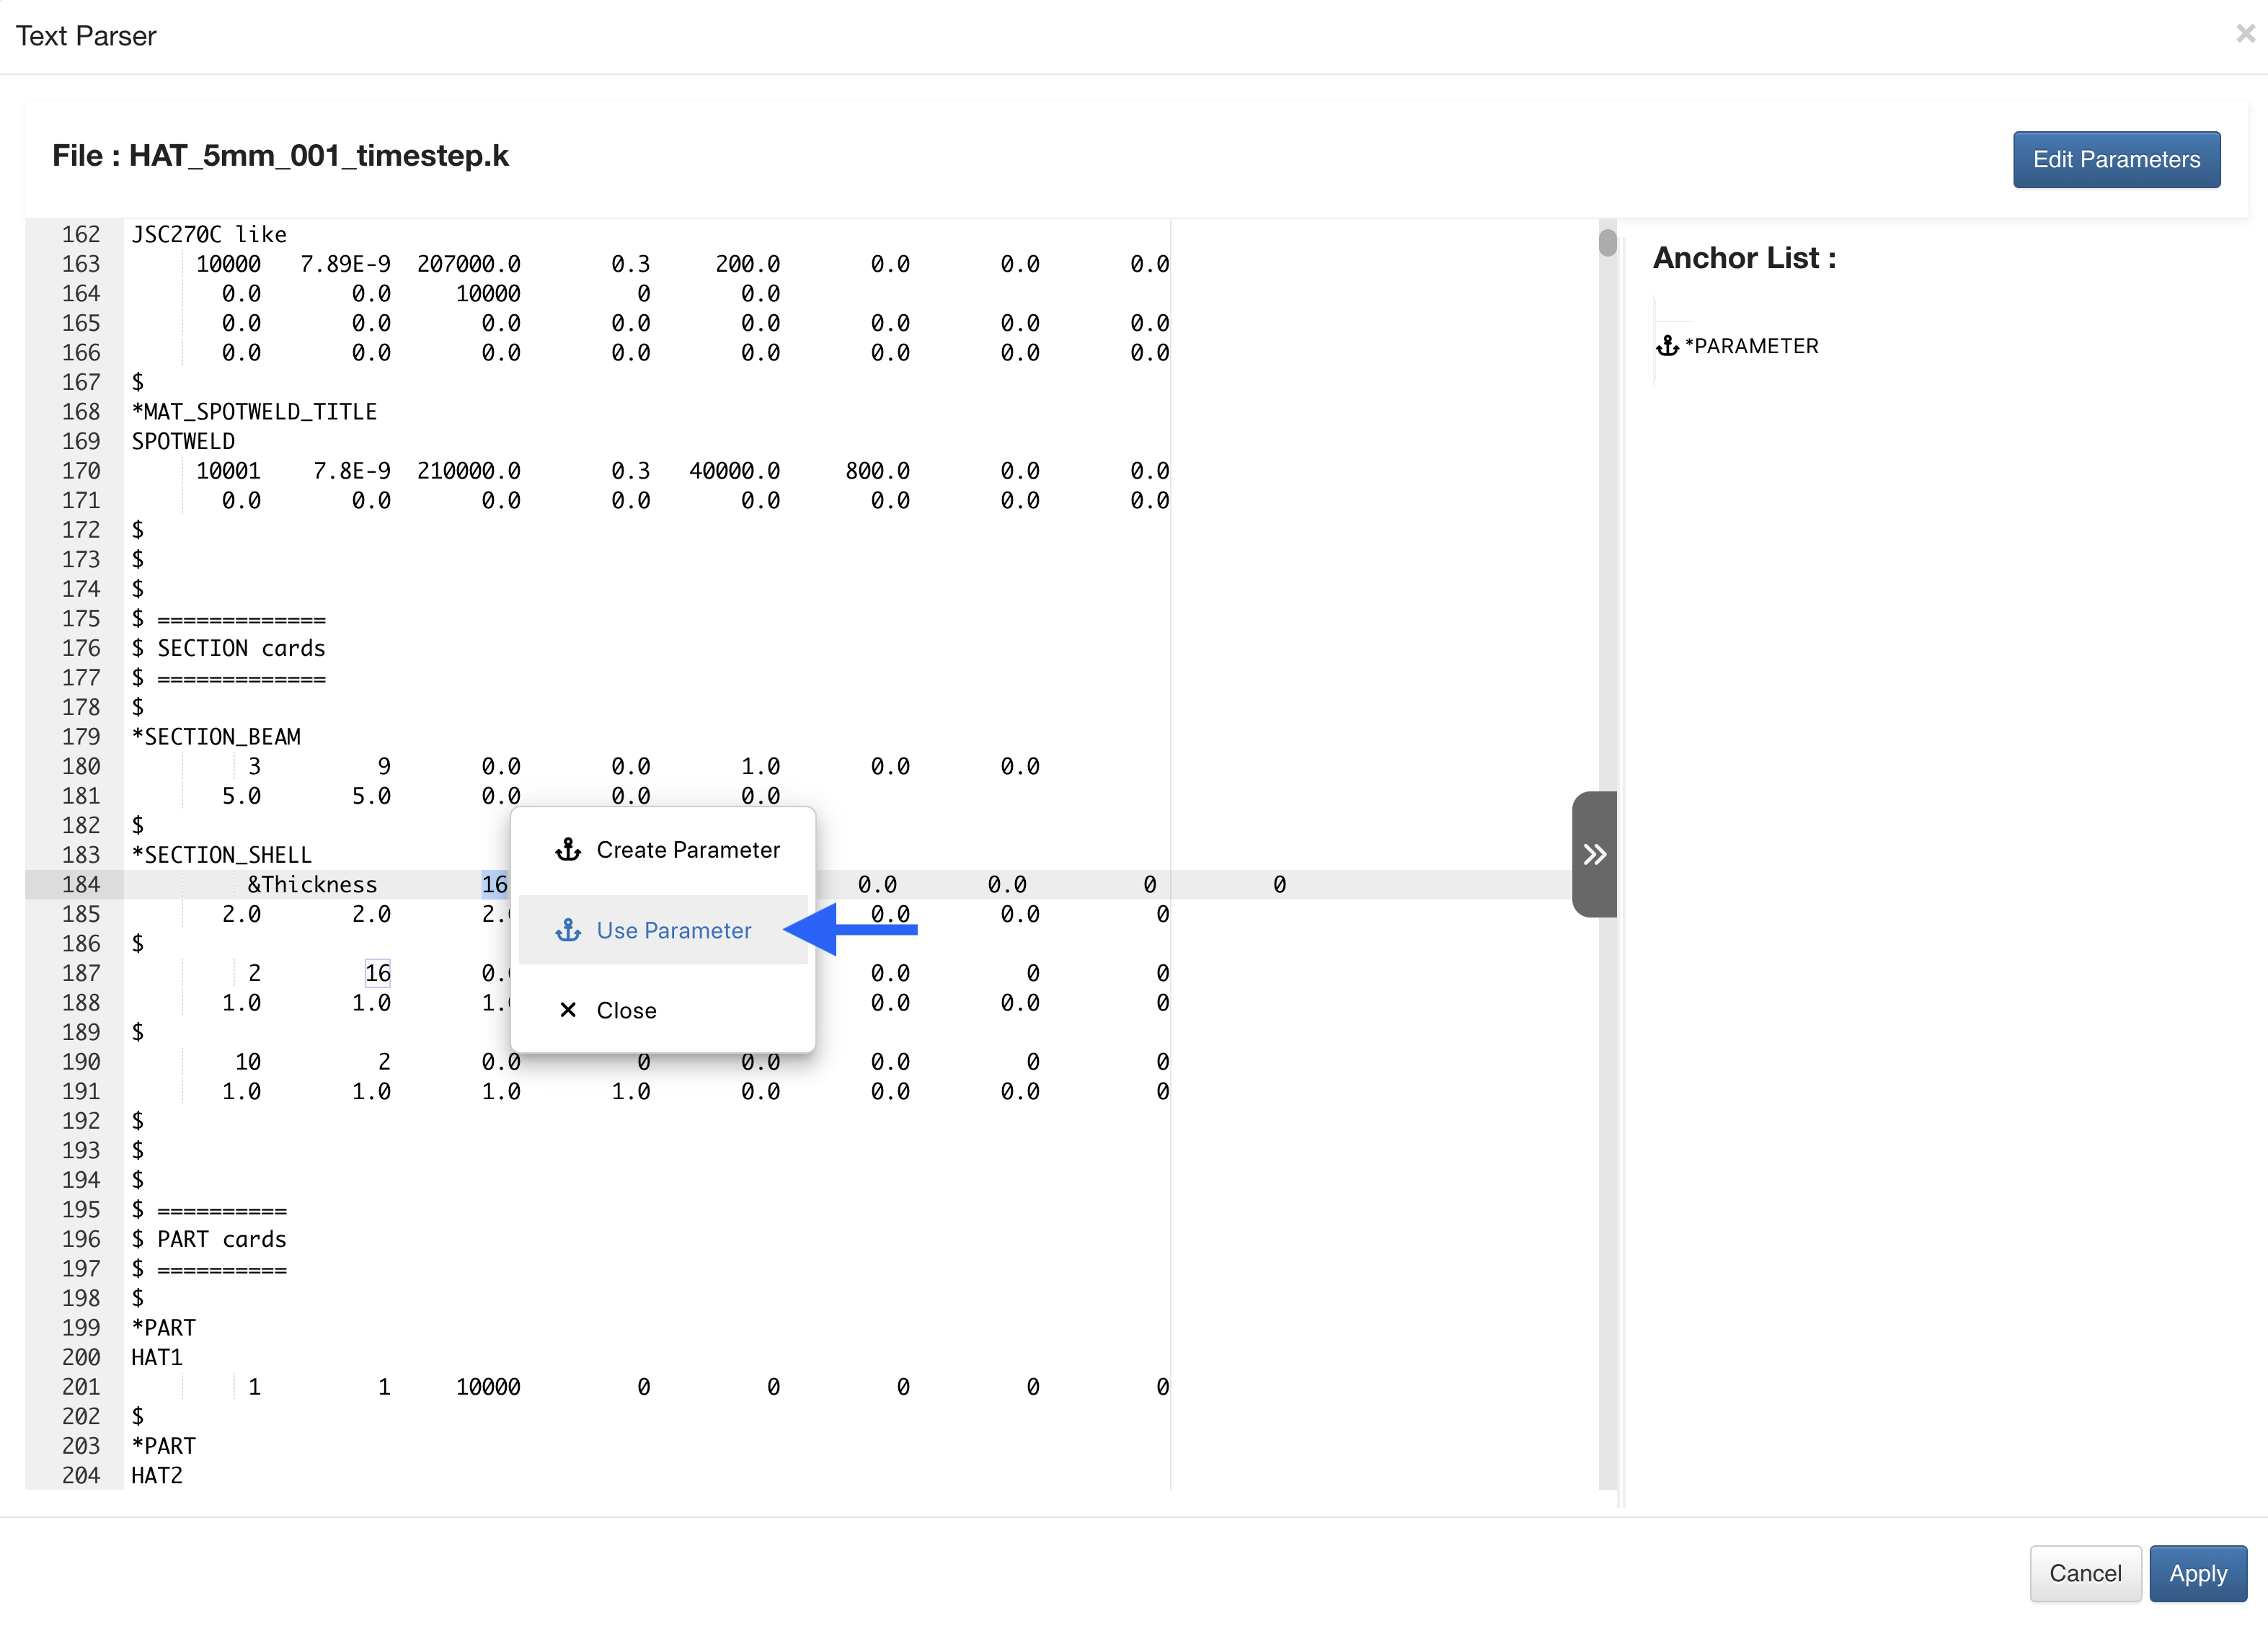
Figure 53: Use Parameter
In this window, we’ll choose to assign it to our recently created parameter.
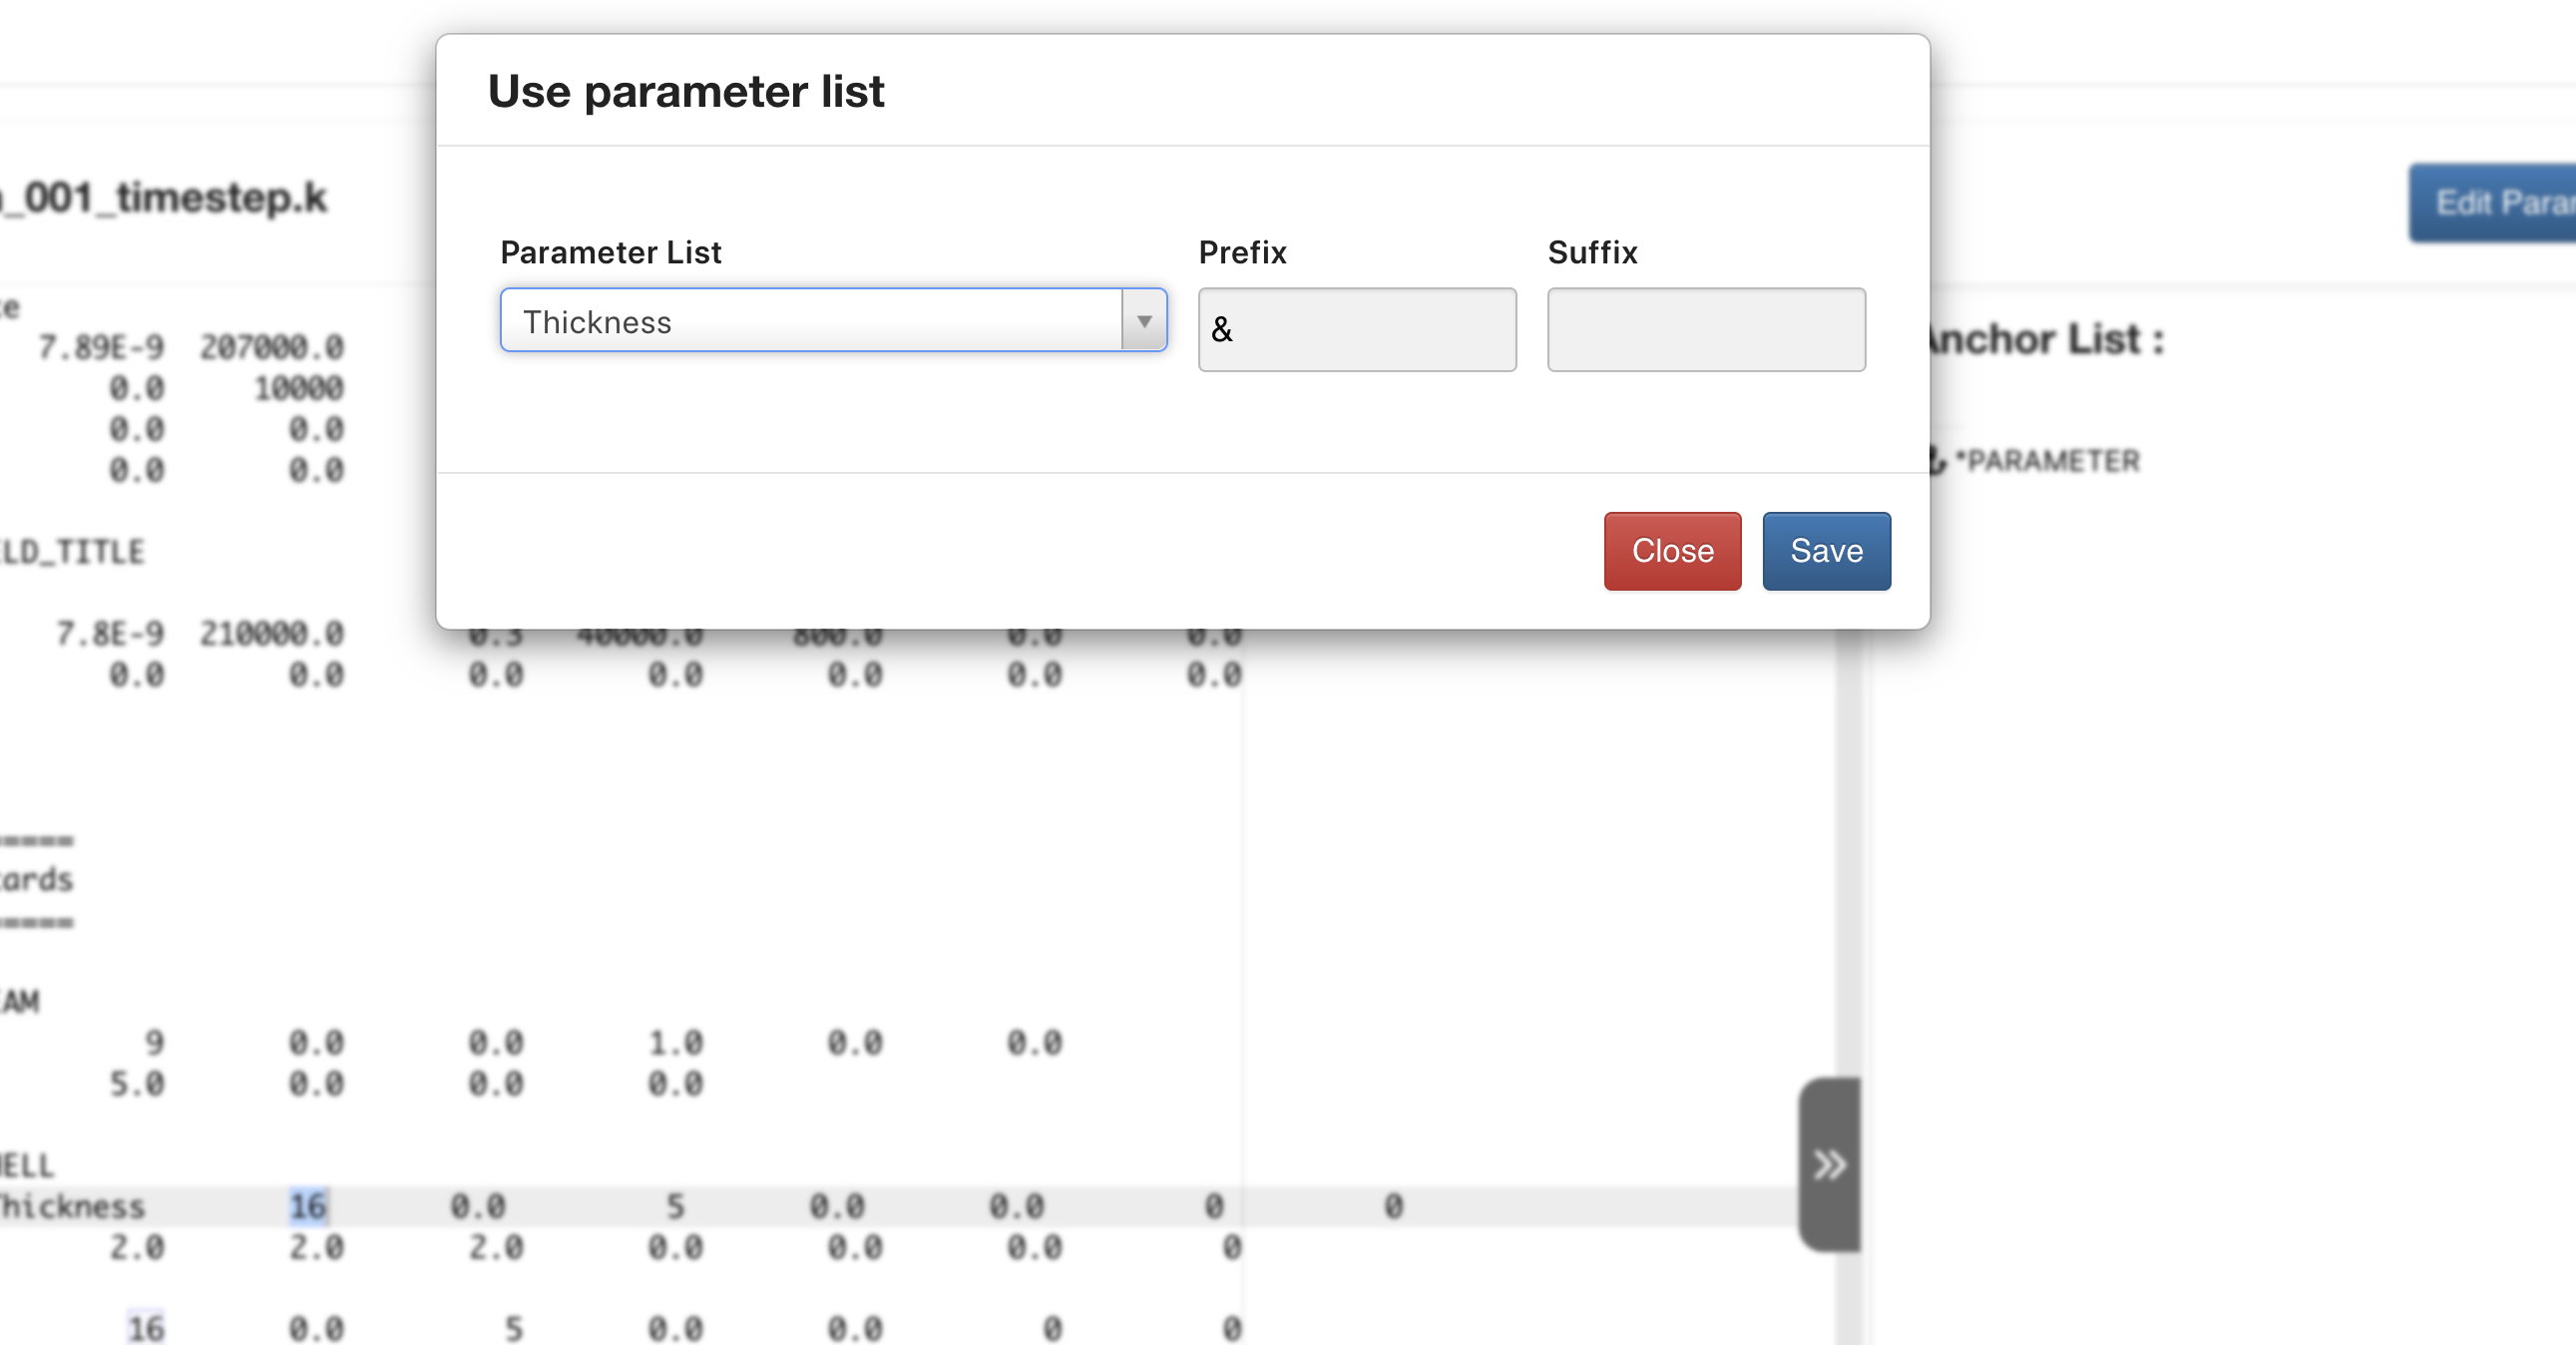
Figure 54: Use Parameter Specifications
Once we’ve finished creating and assigning parameters, we can hit apply to save.
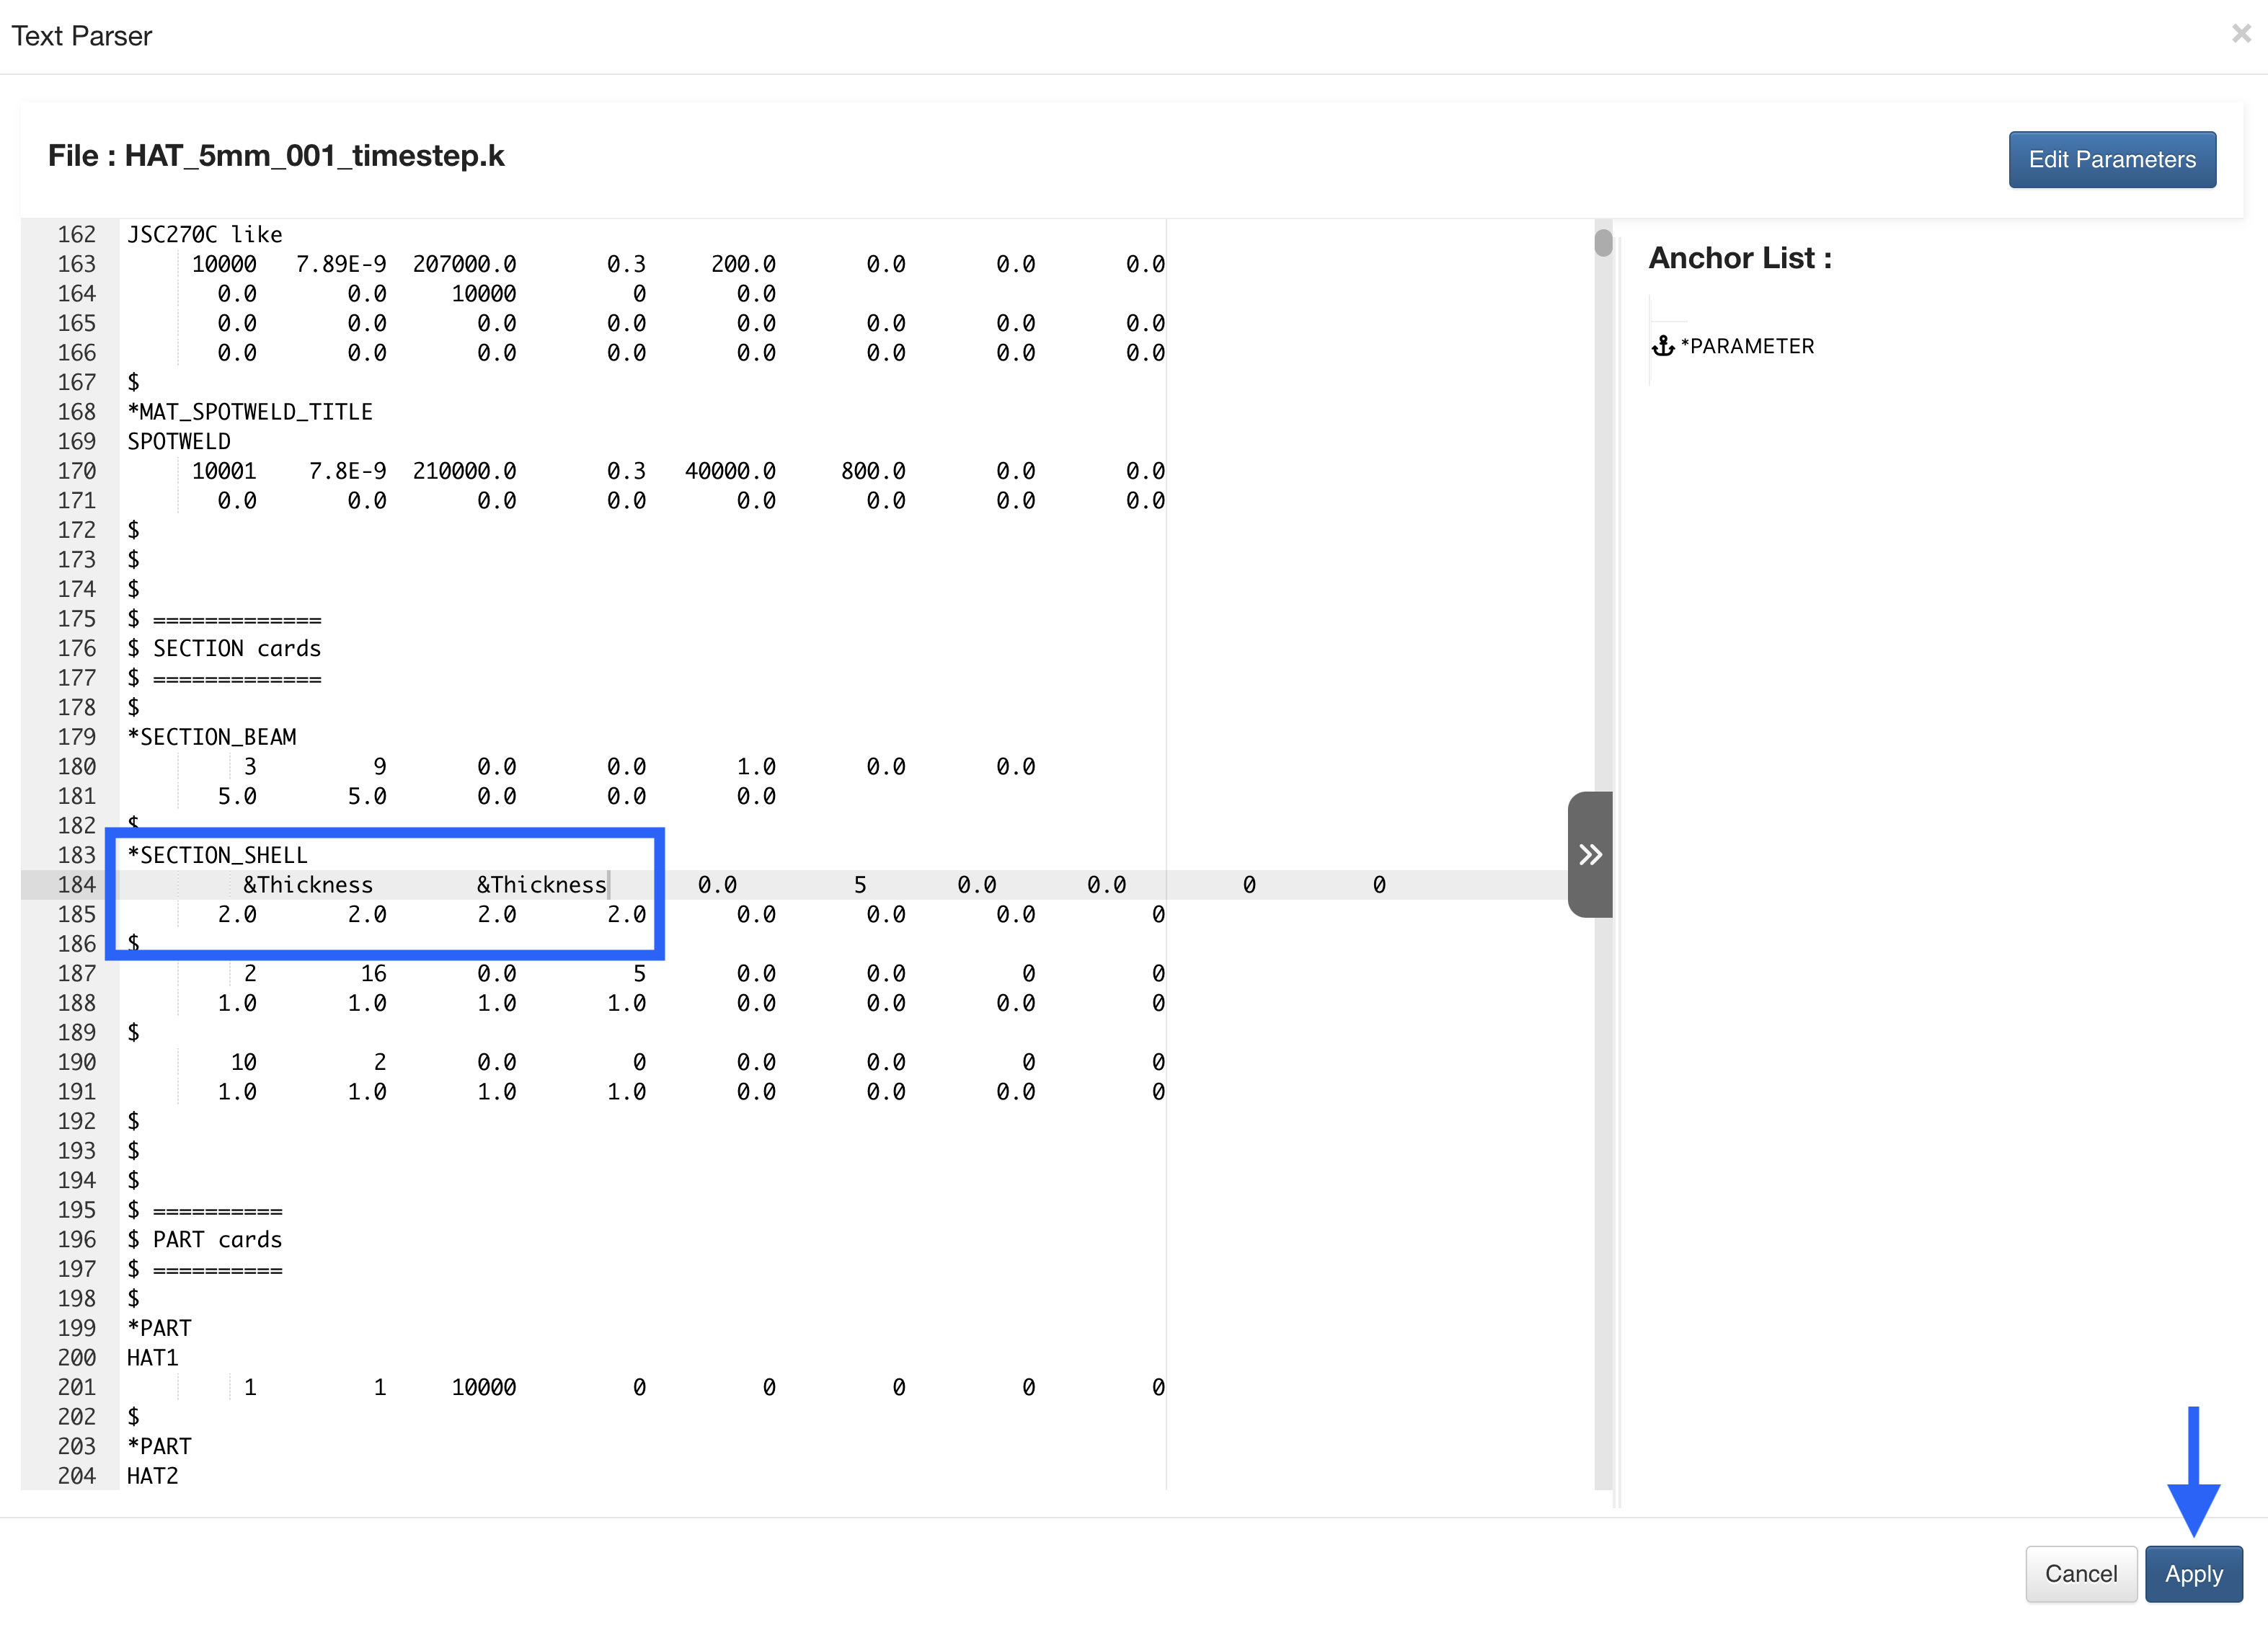
Figure 55: Apply Parameters
If we need to parameterize again, we can hit the file with an arrow icon. Otherwise, we can execute.
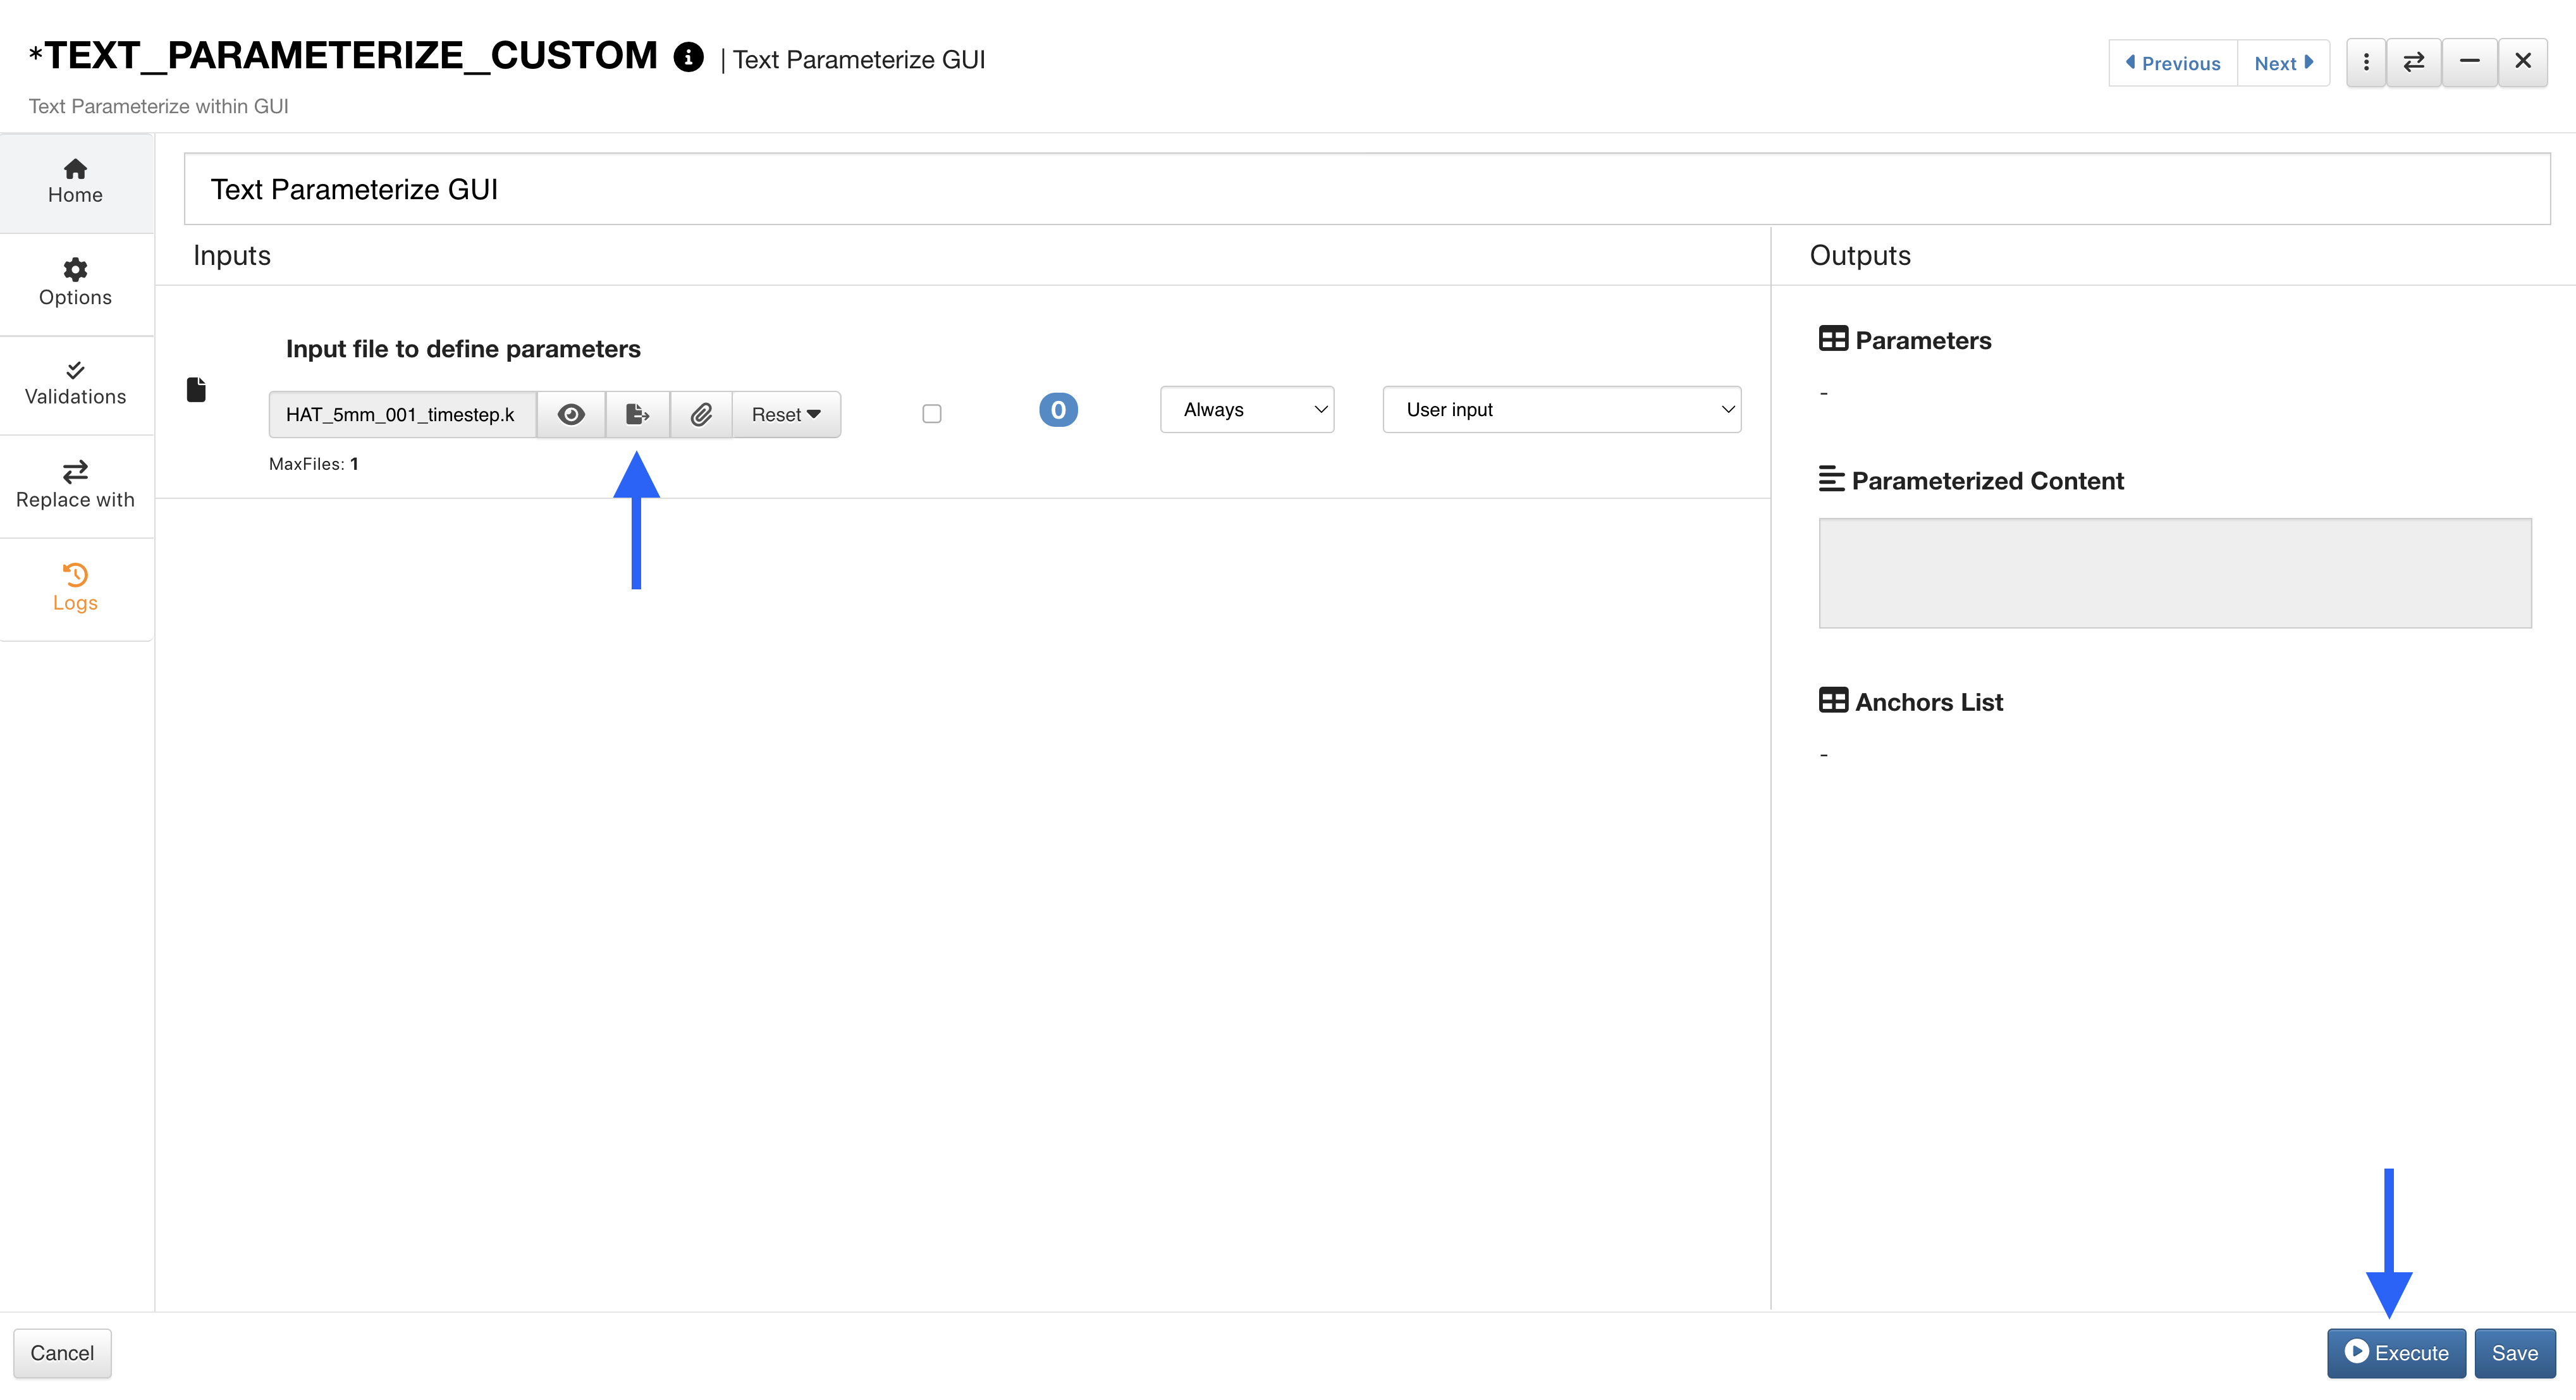
Figure 56: Parameterize Again or Execute
We’ll have our parameters, updated text file and anchors as our outputs for this worker.
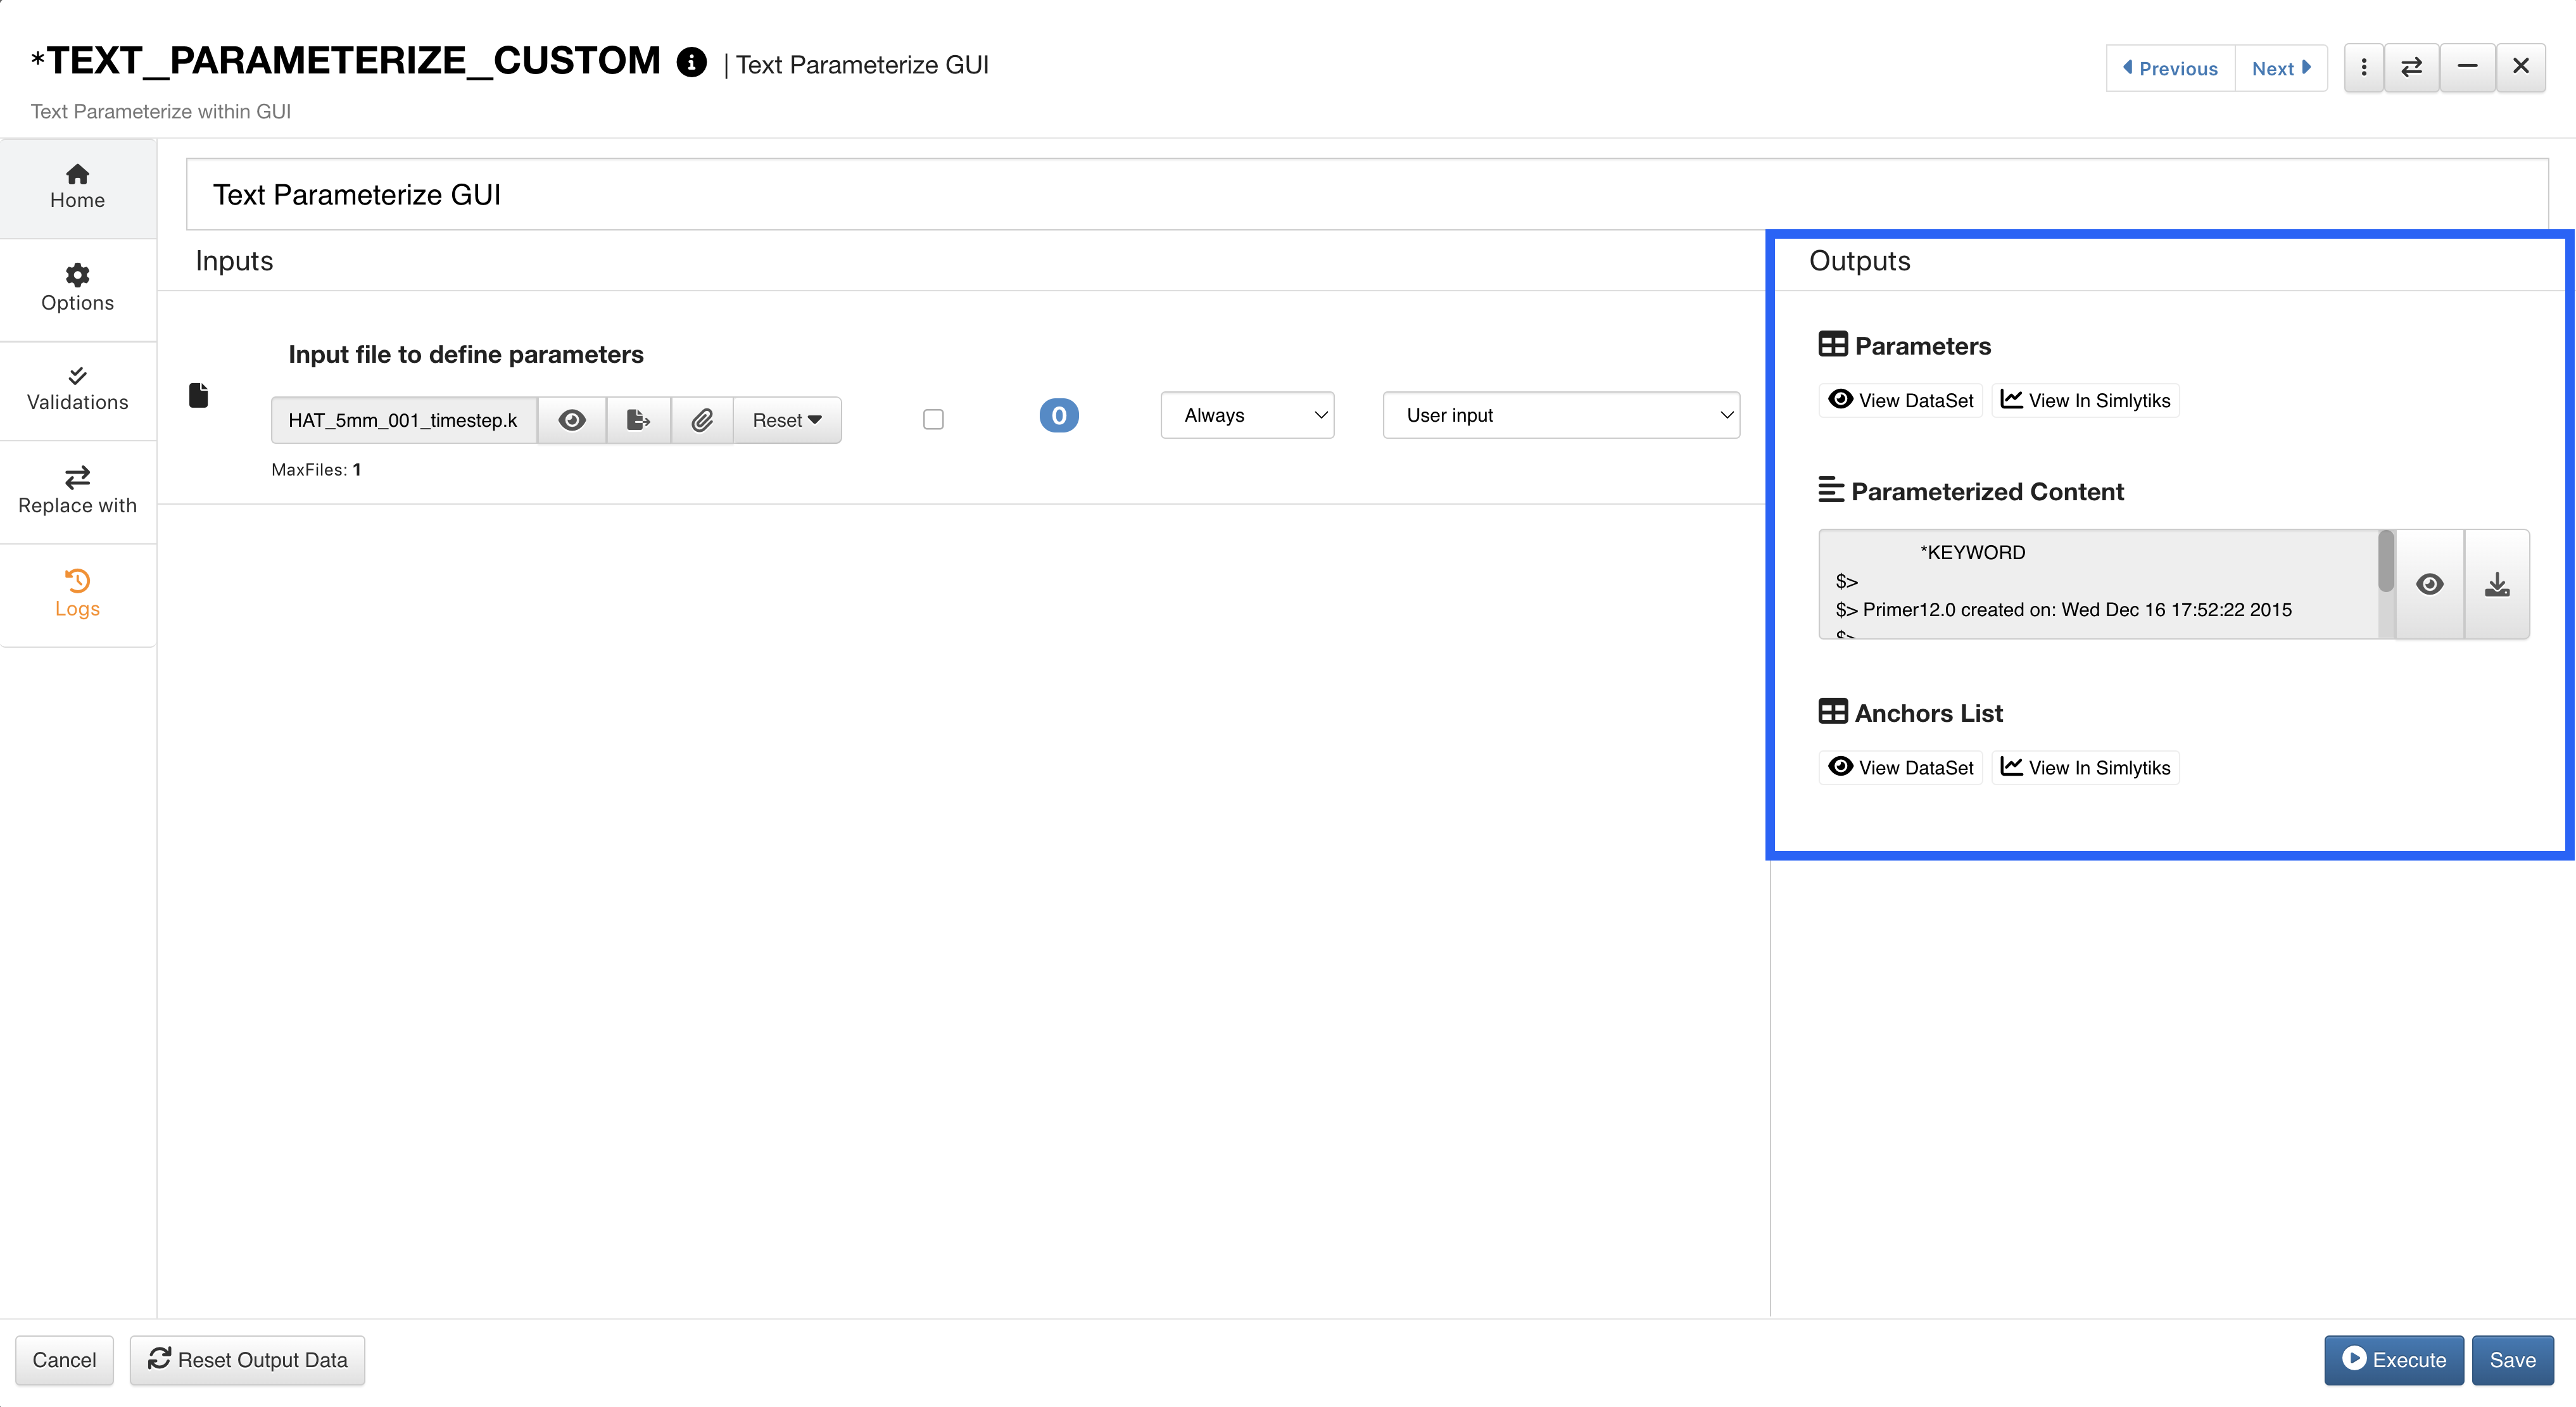
Figure 57: Text Parameterize Outputs
8.7. |table| Template Sync
When configuring a worker, sync templates directly by choosing this option at the bottom left corner of the modal. You will receive an automated notification about out-dated linked templates for workers.
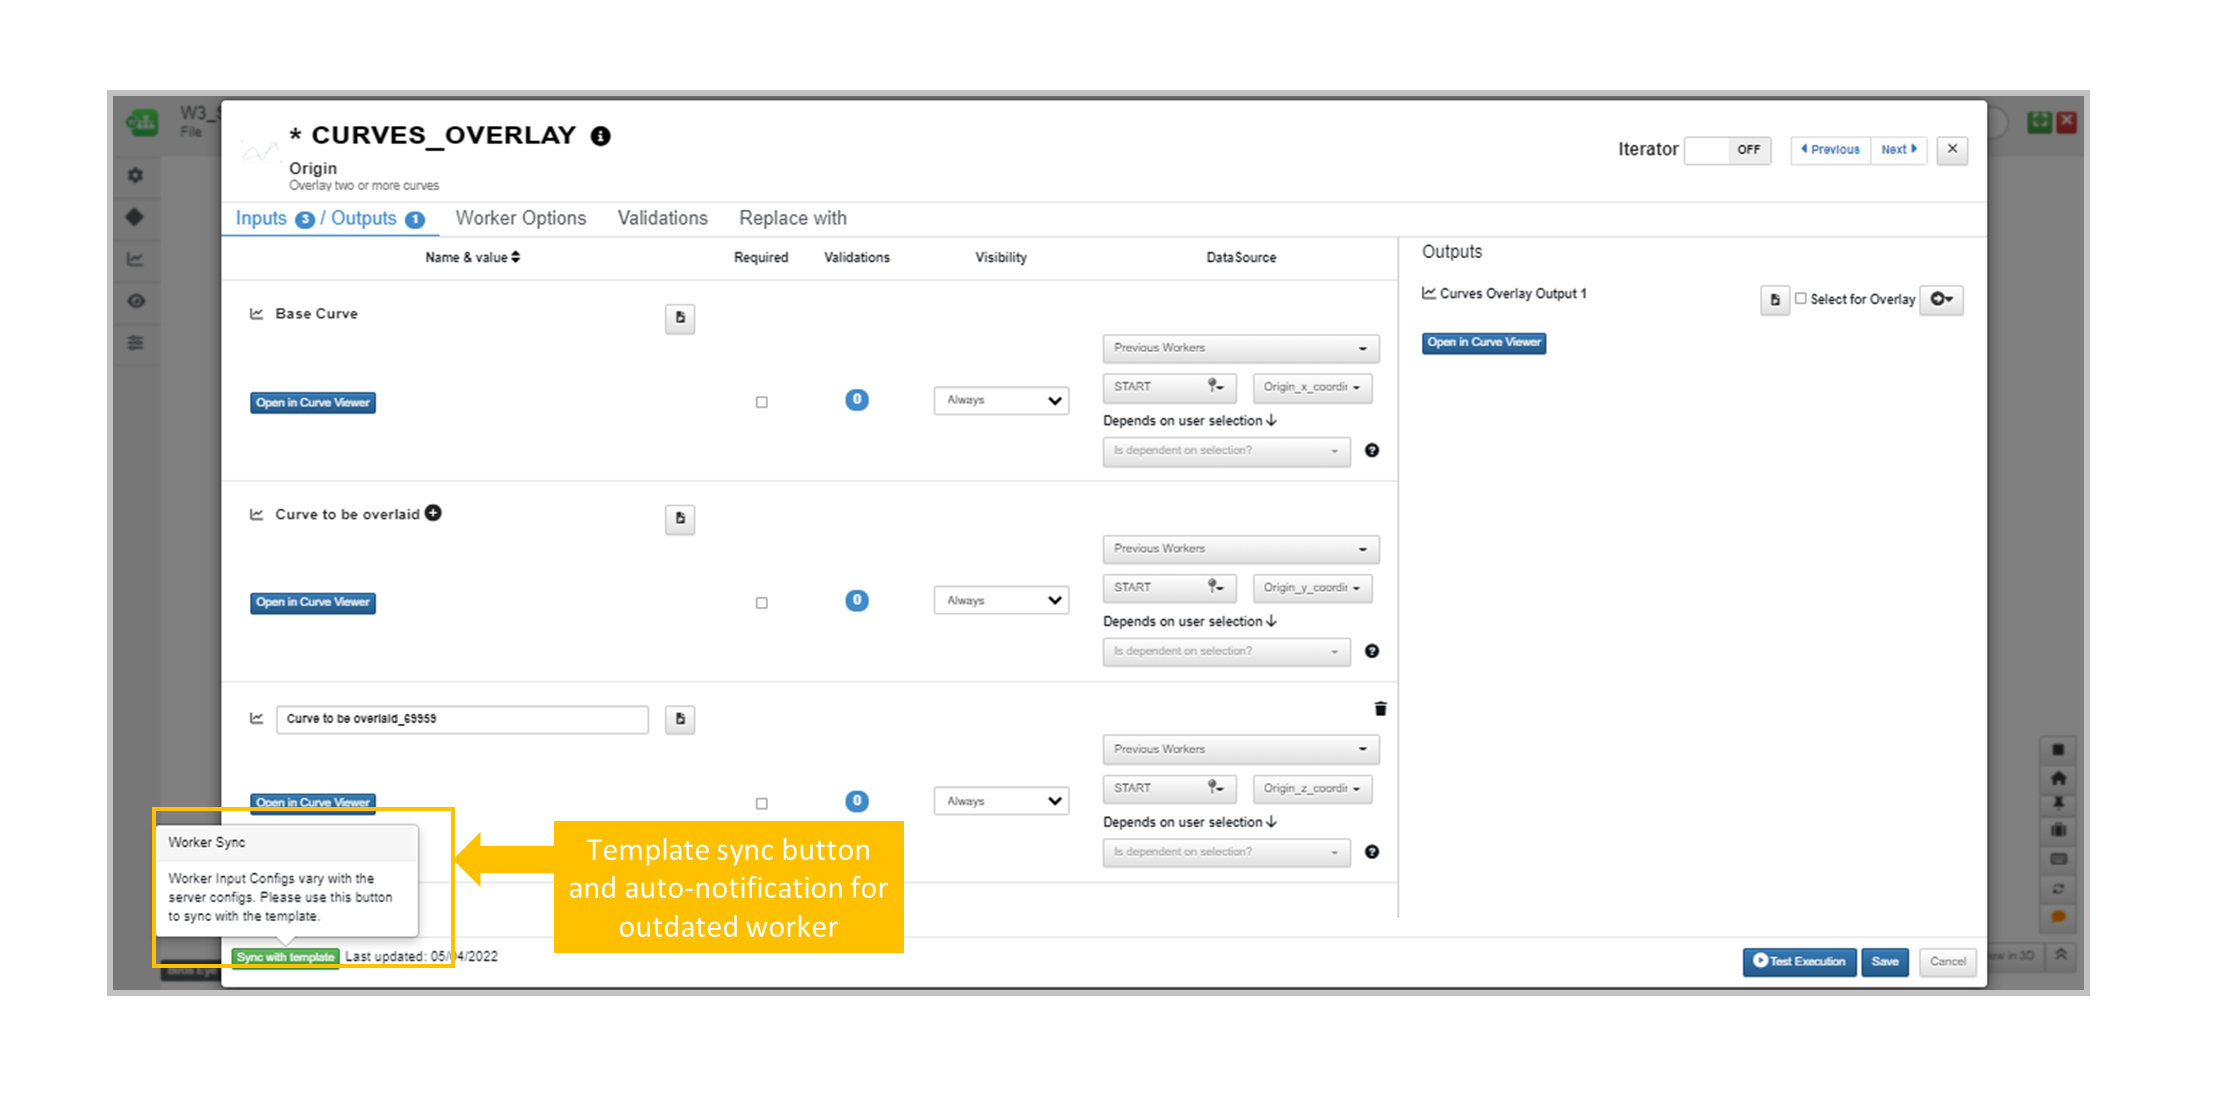
Figure 58: Template Sync
8.8. Simlytiks Visualizers
You can set up and incorporate any Simlytiks Visualizer into a workflow. Go to this section under the Filter icon in the workers list to see all available visualizers.
Create Charts from a Dataset
We can use Workflows to create charts from a dataset like we do in Simlytiks. We may use this feature instead of creating charts in Simlytiks if we know exactly which charts we want to visualize but plan on switching out the input data.
We’ll start by adding the dataset under the START worker. Drag-and-drop the dataset input (1) into the input fields area, and click Extract (2) to upload the data. Here, we’ve added a CSV to the input.
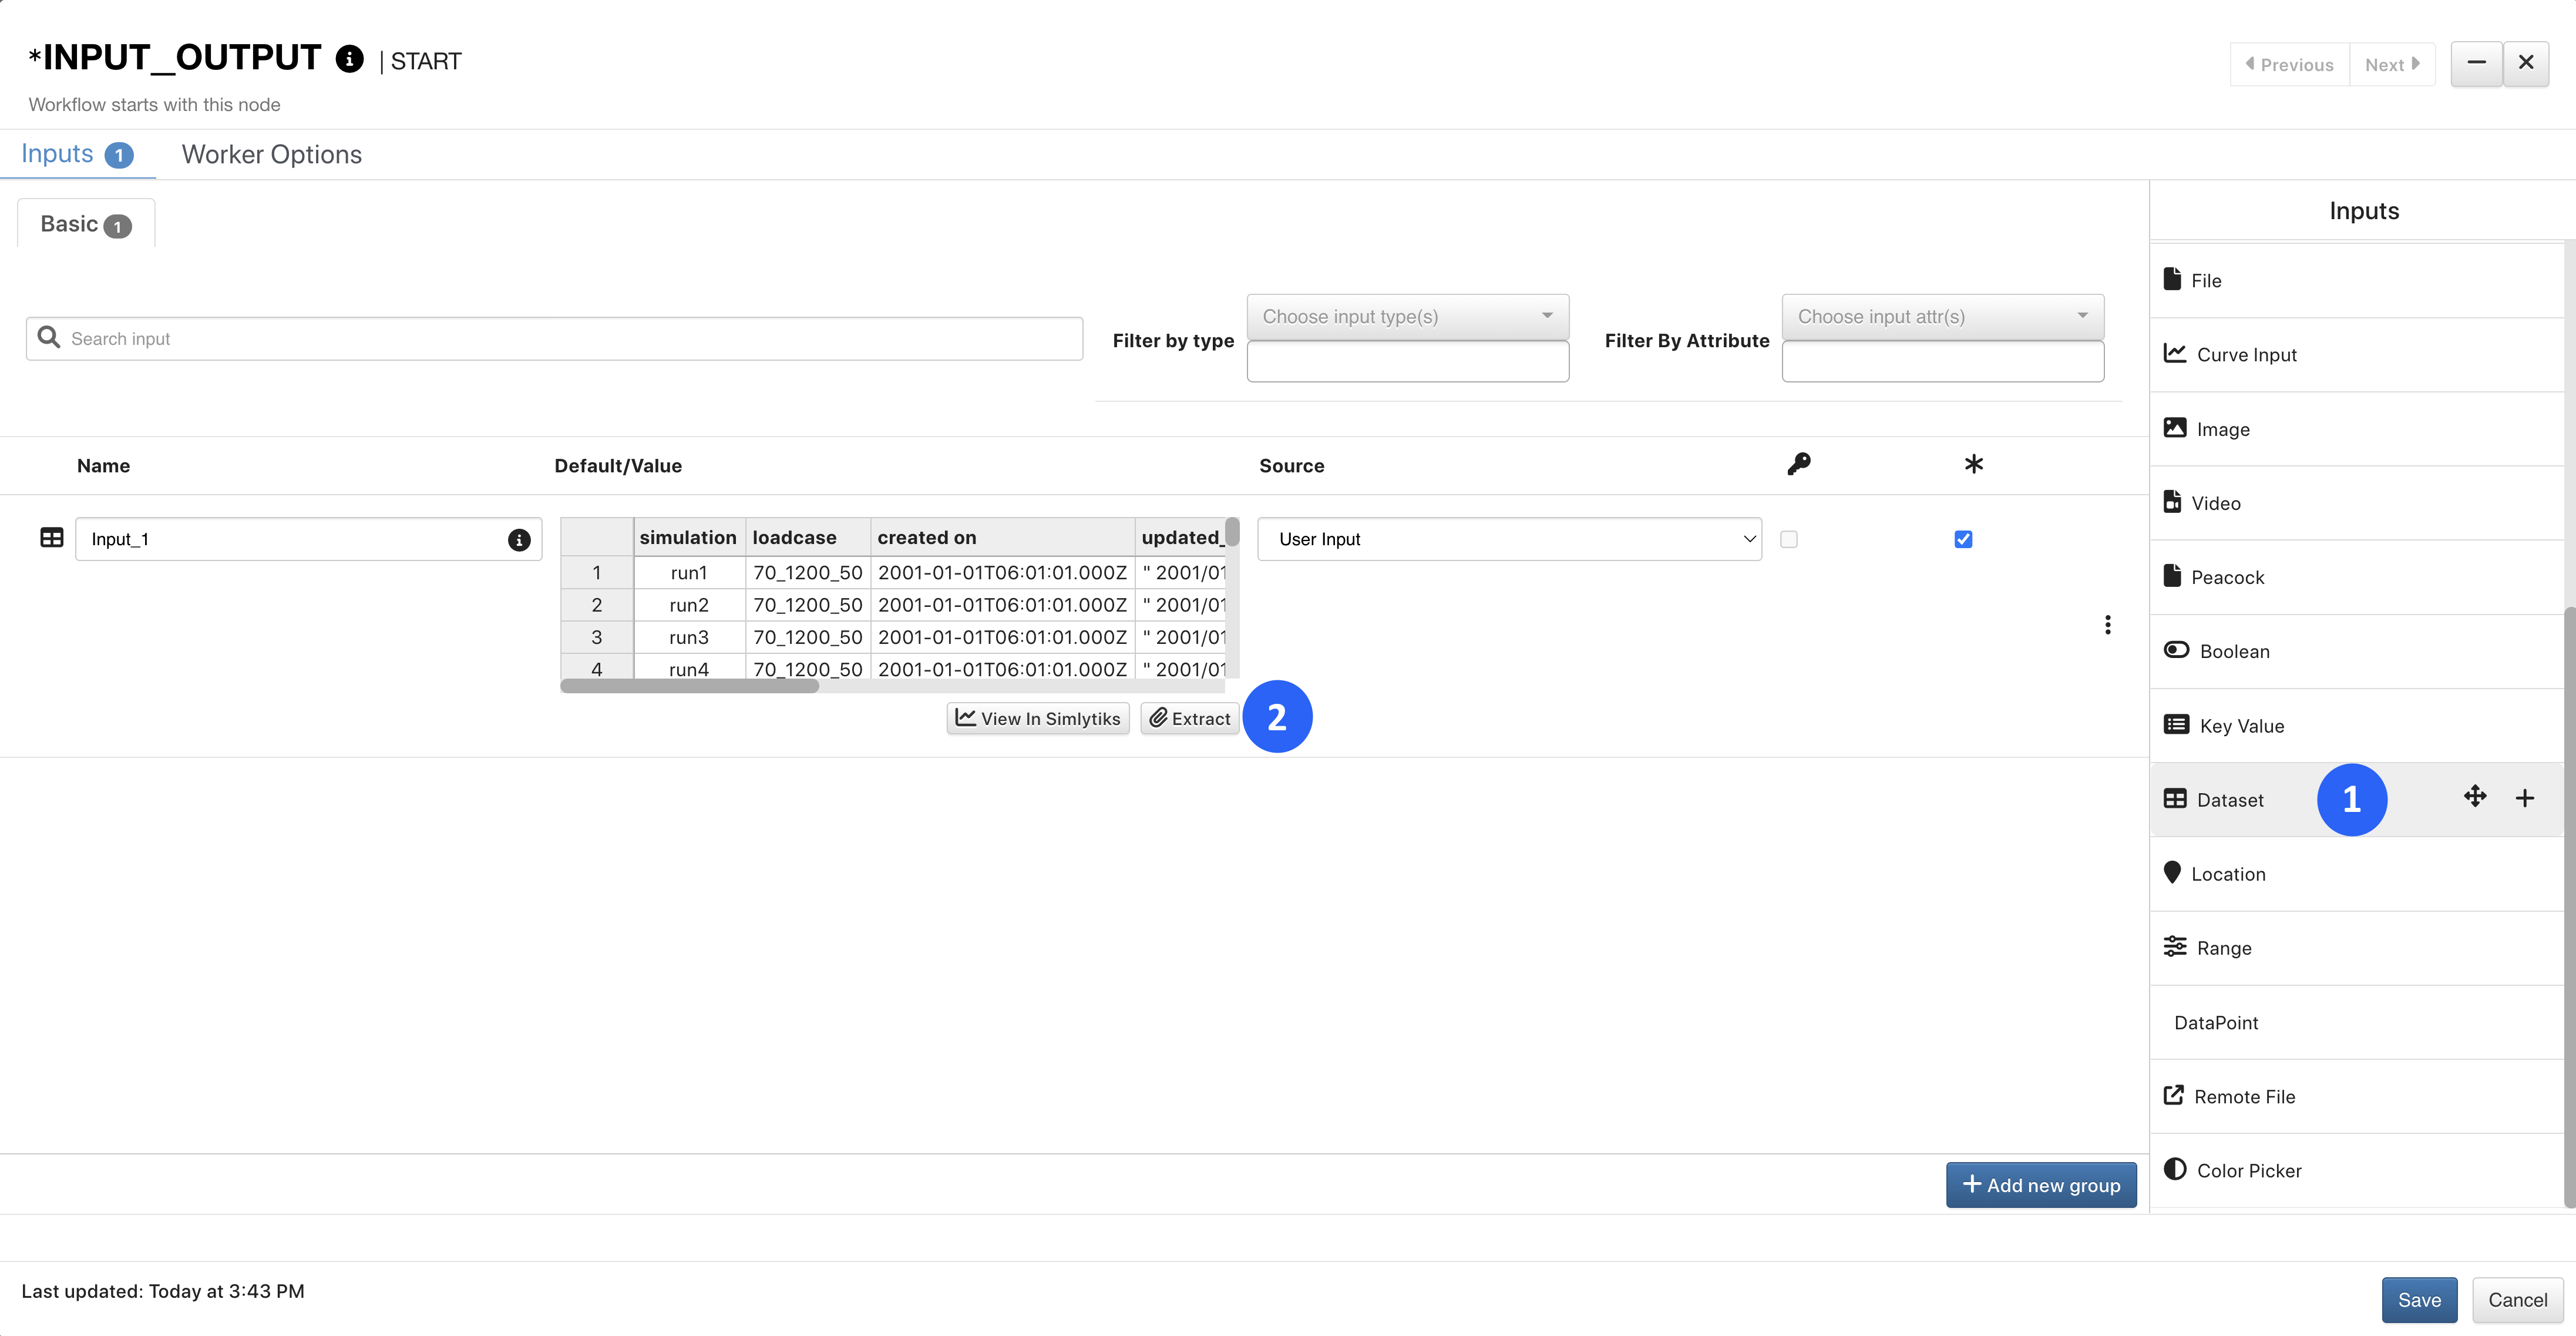
Figure 59: Dataset Input
Next, we’ll add visualization worker(s) onto the canvas. We’ve chosen to include a bubble chart.
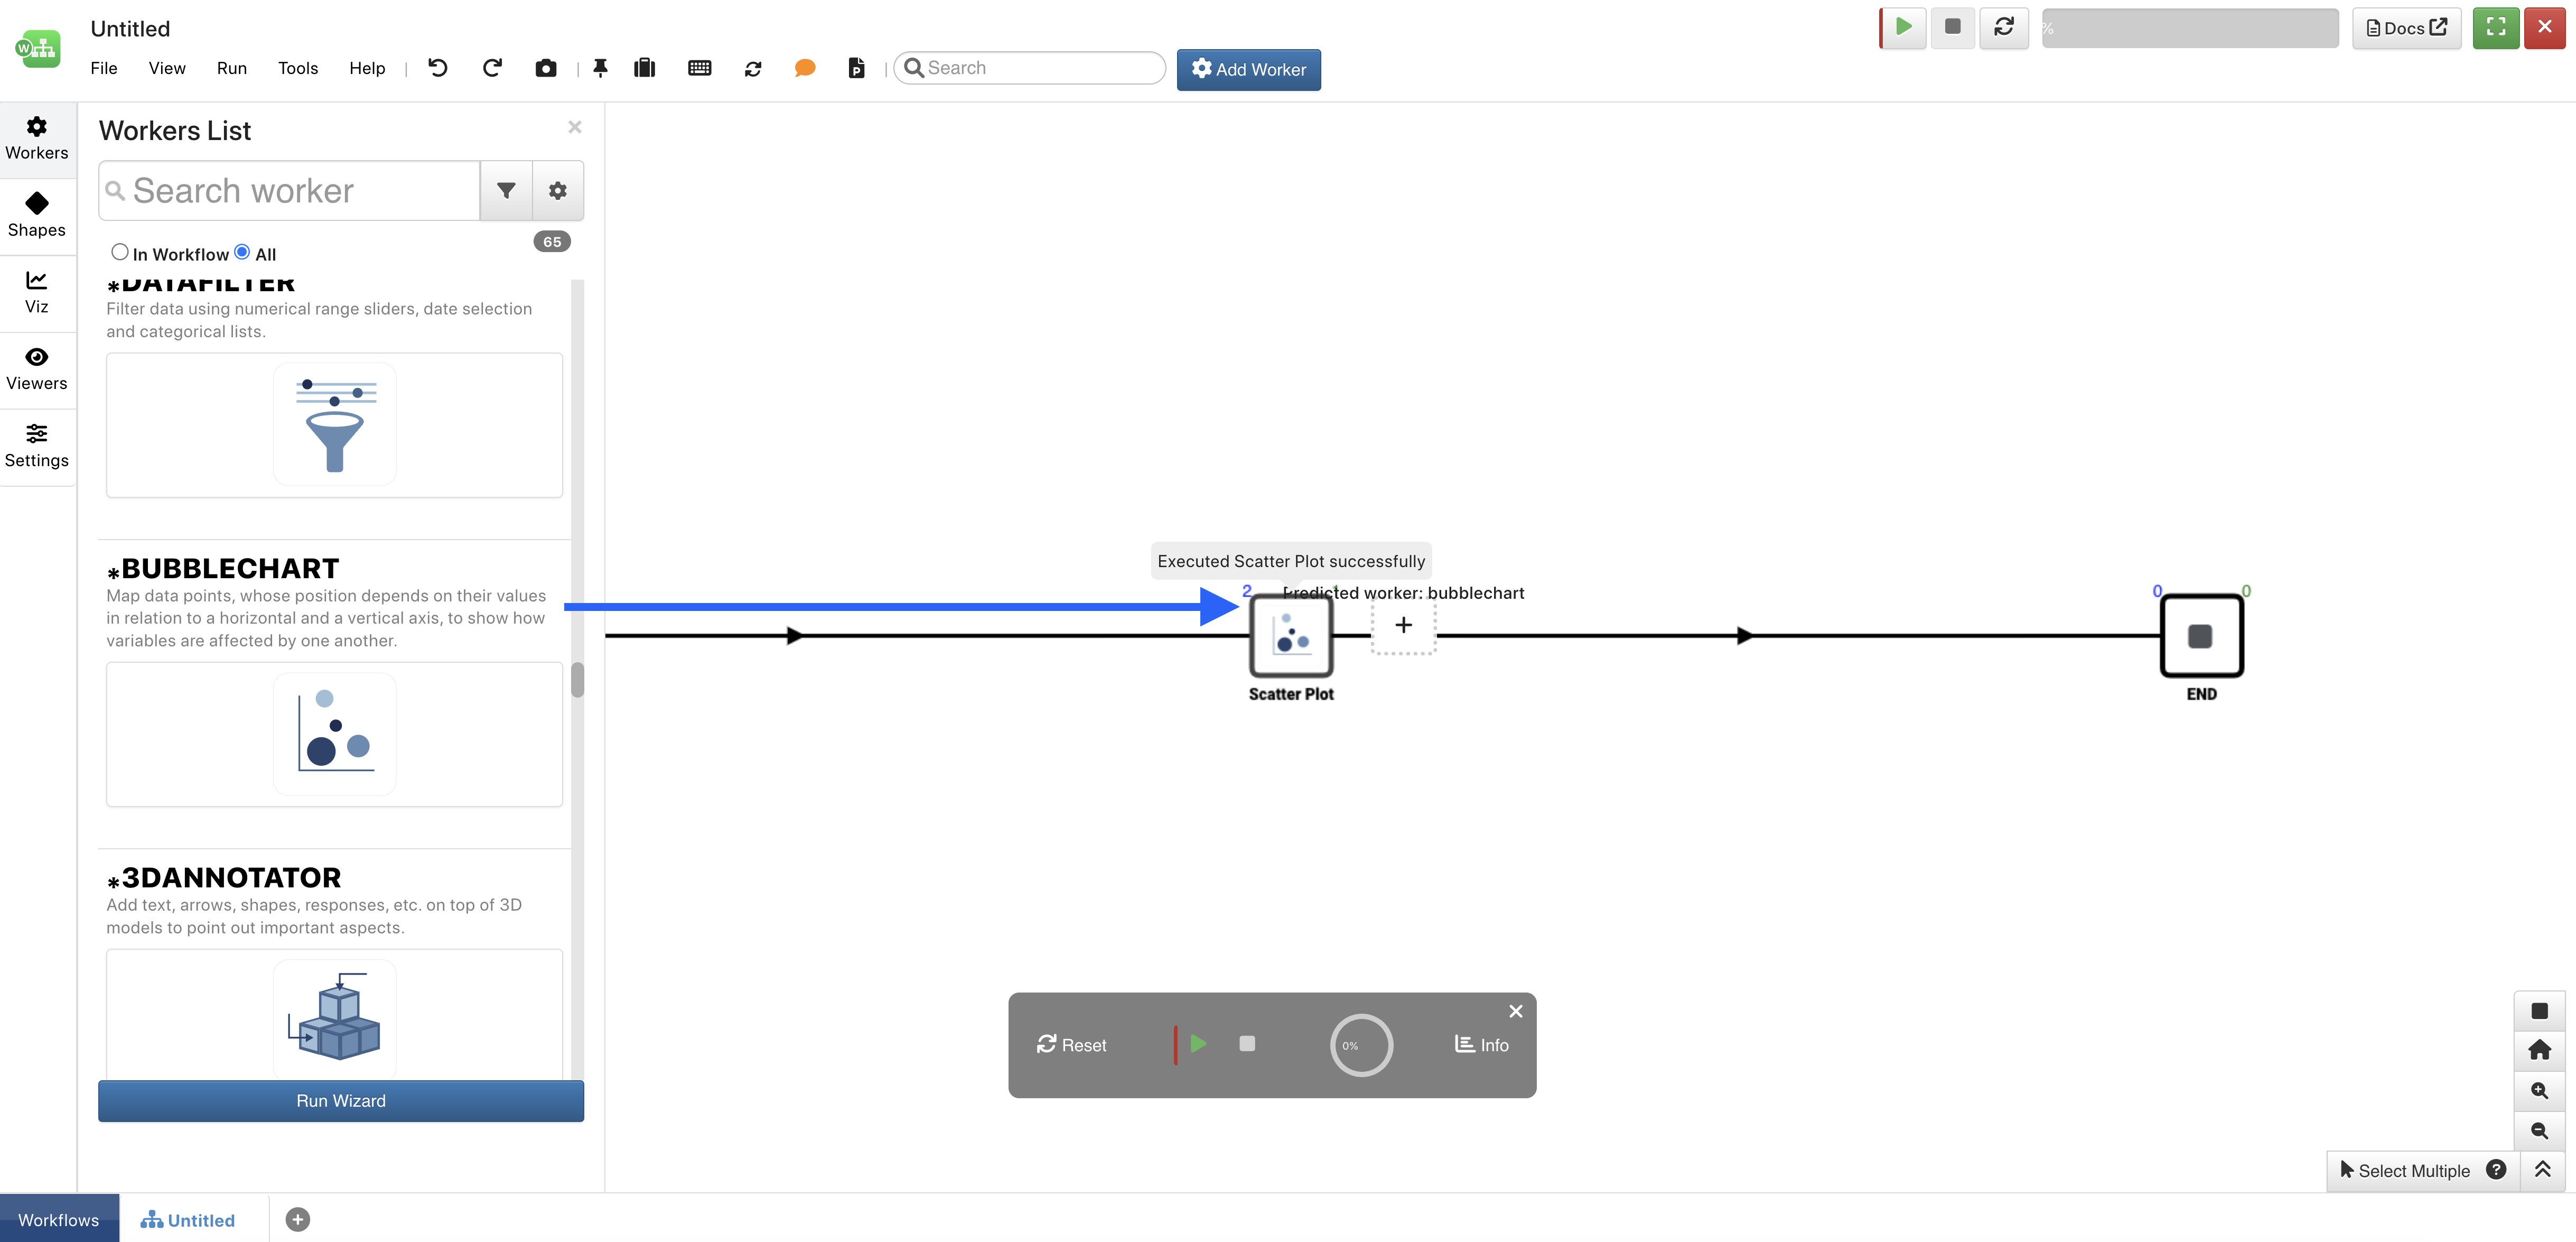
Figure 60: Add Visualization Worker
We’ll configure the visualization similarly to how we configure it in Simlytiks (check out creating charts in Simlytiks here). The dataset from the START work should automatically be chosen as our first input.
We can then execute the worker (1) and click View Chart (2) to see our bubble chart.
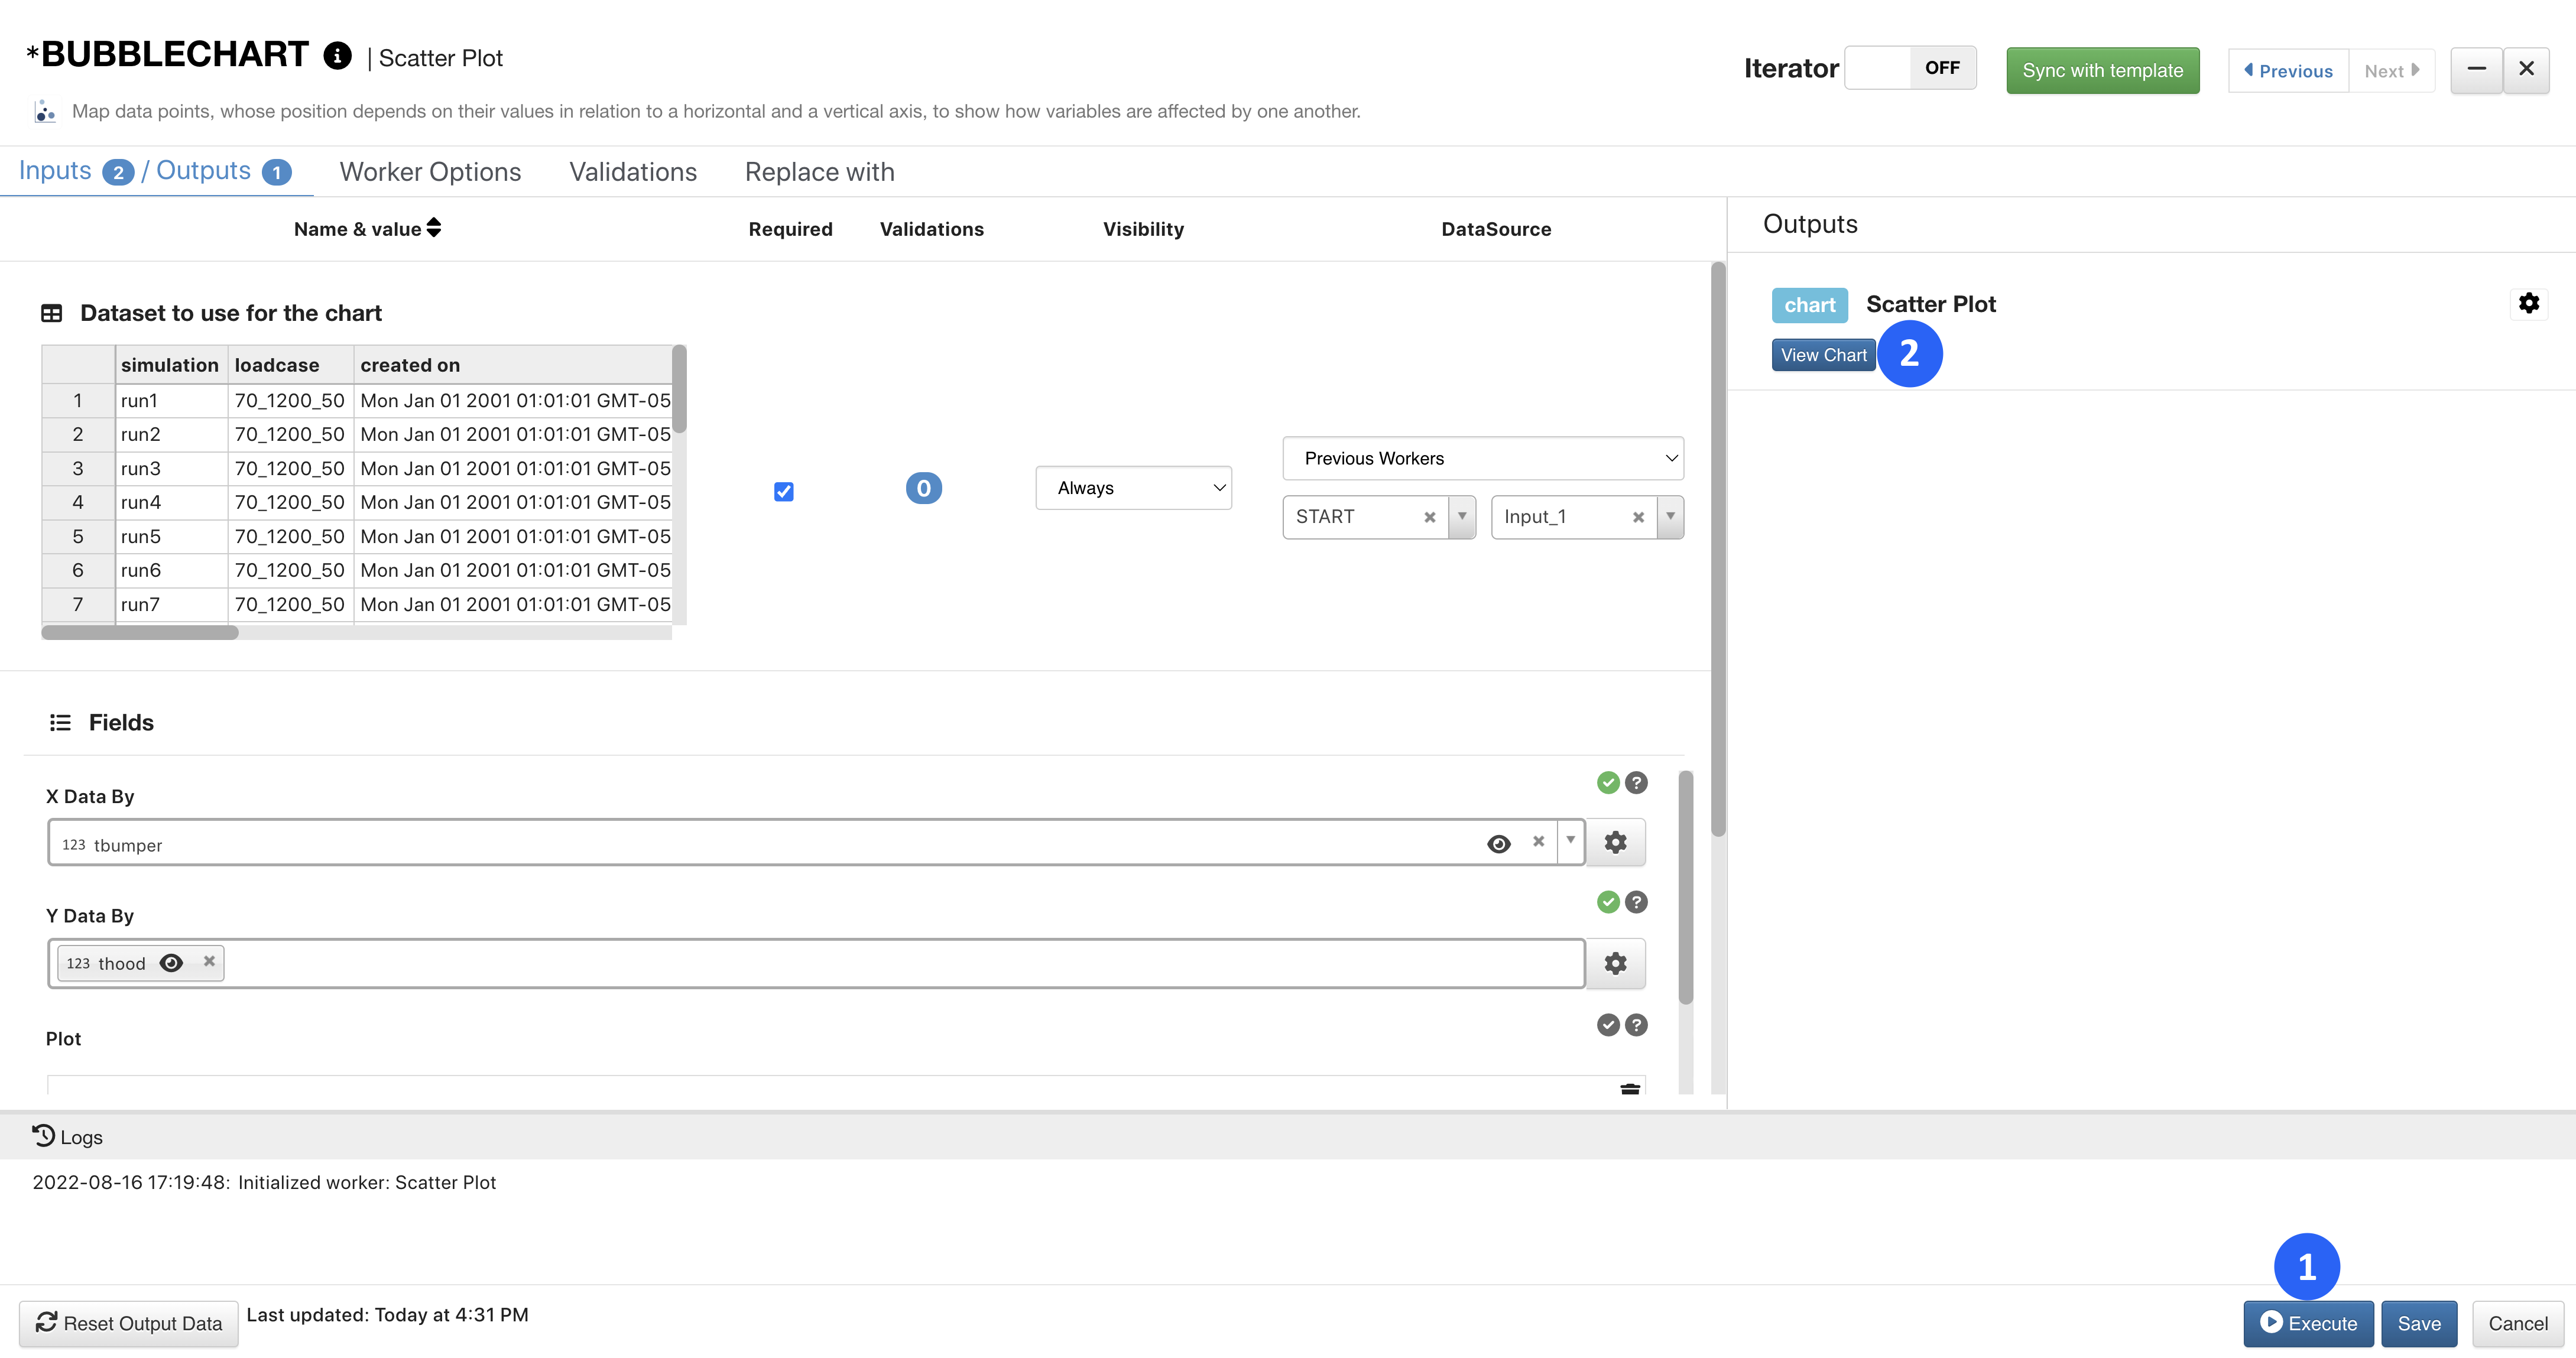
Figure 61: Execute Chart
Here is how our bubble chart looks!
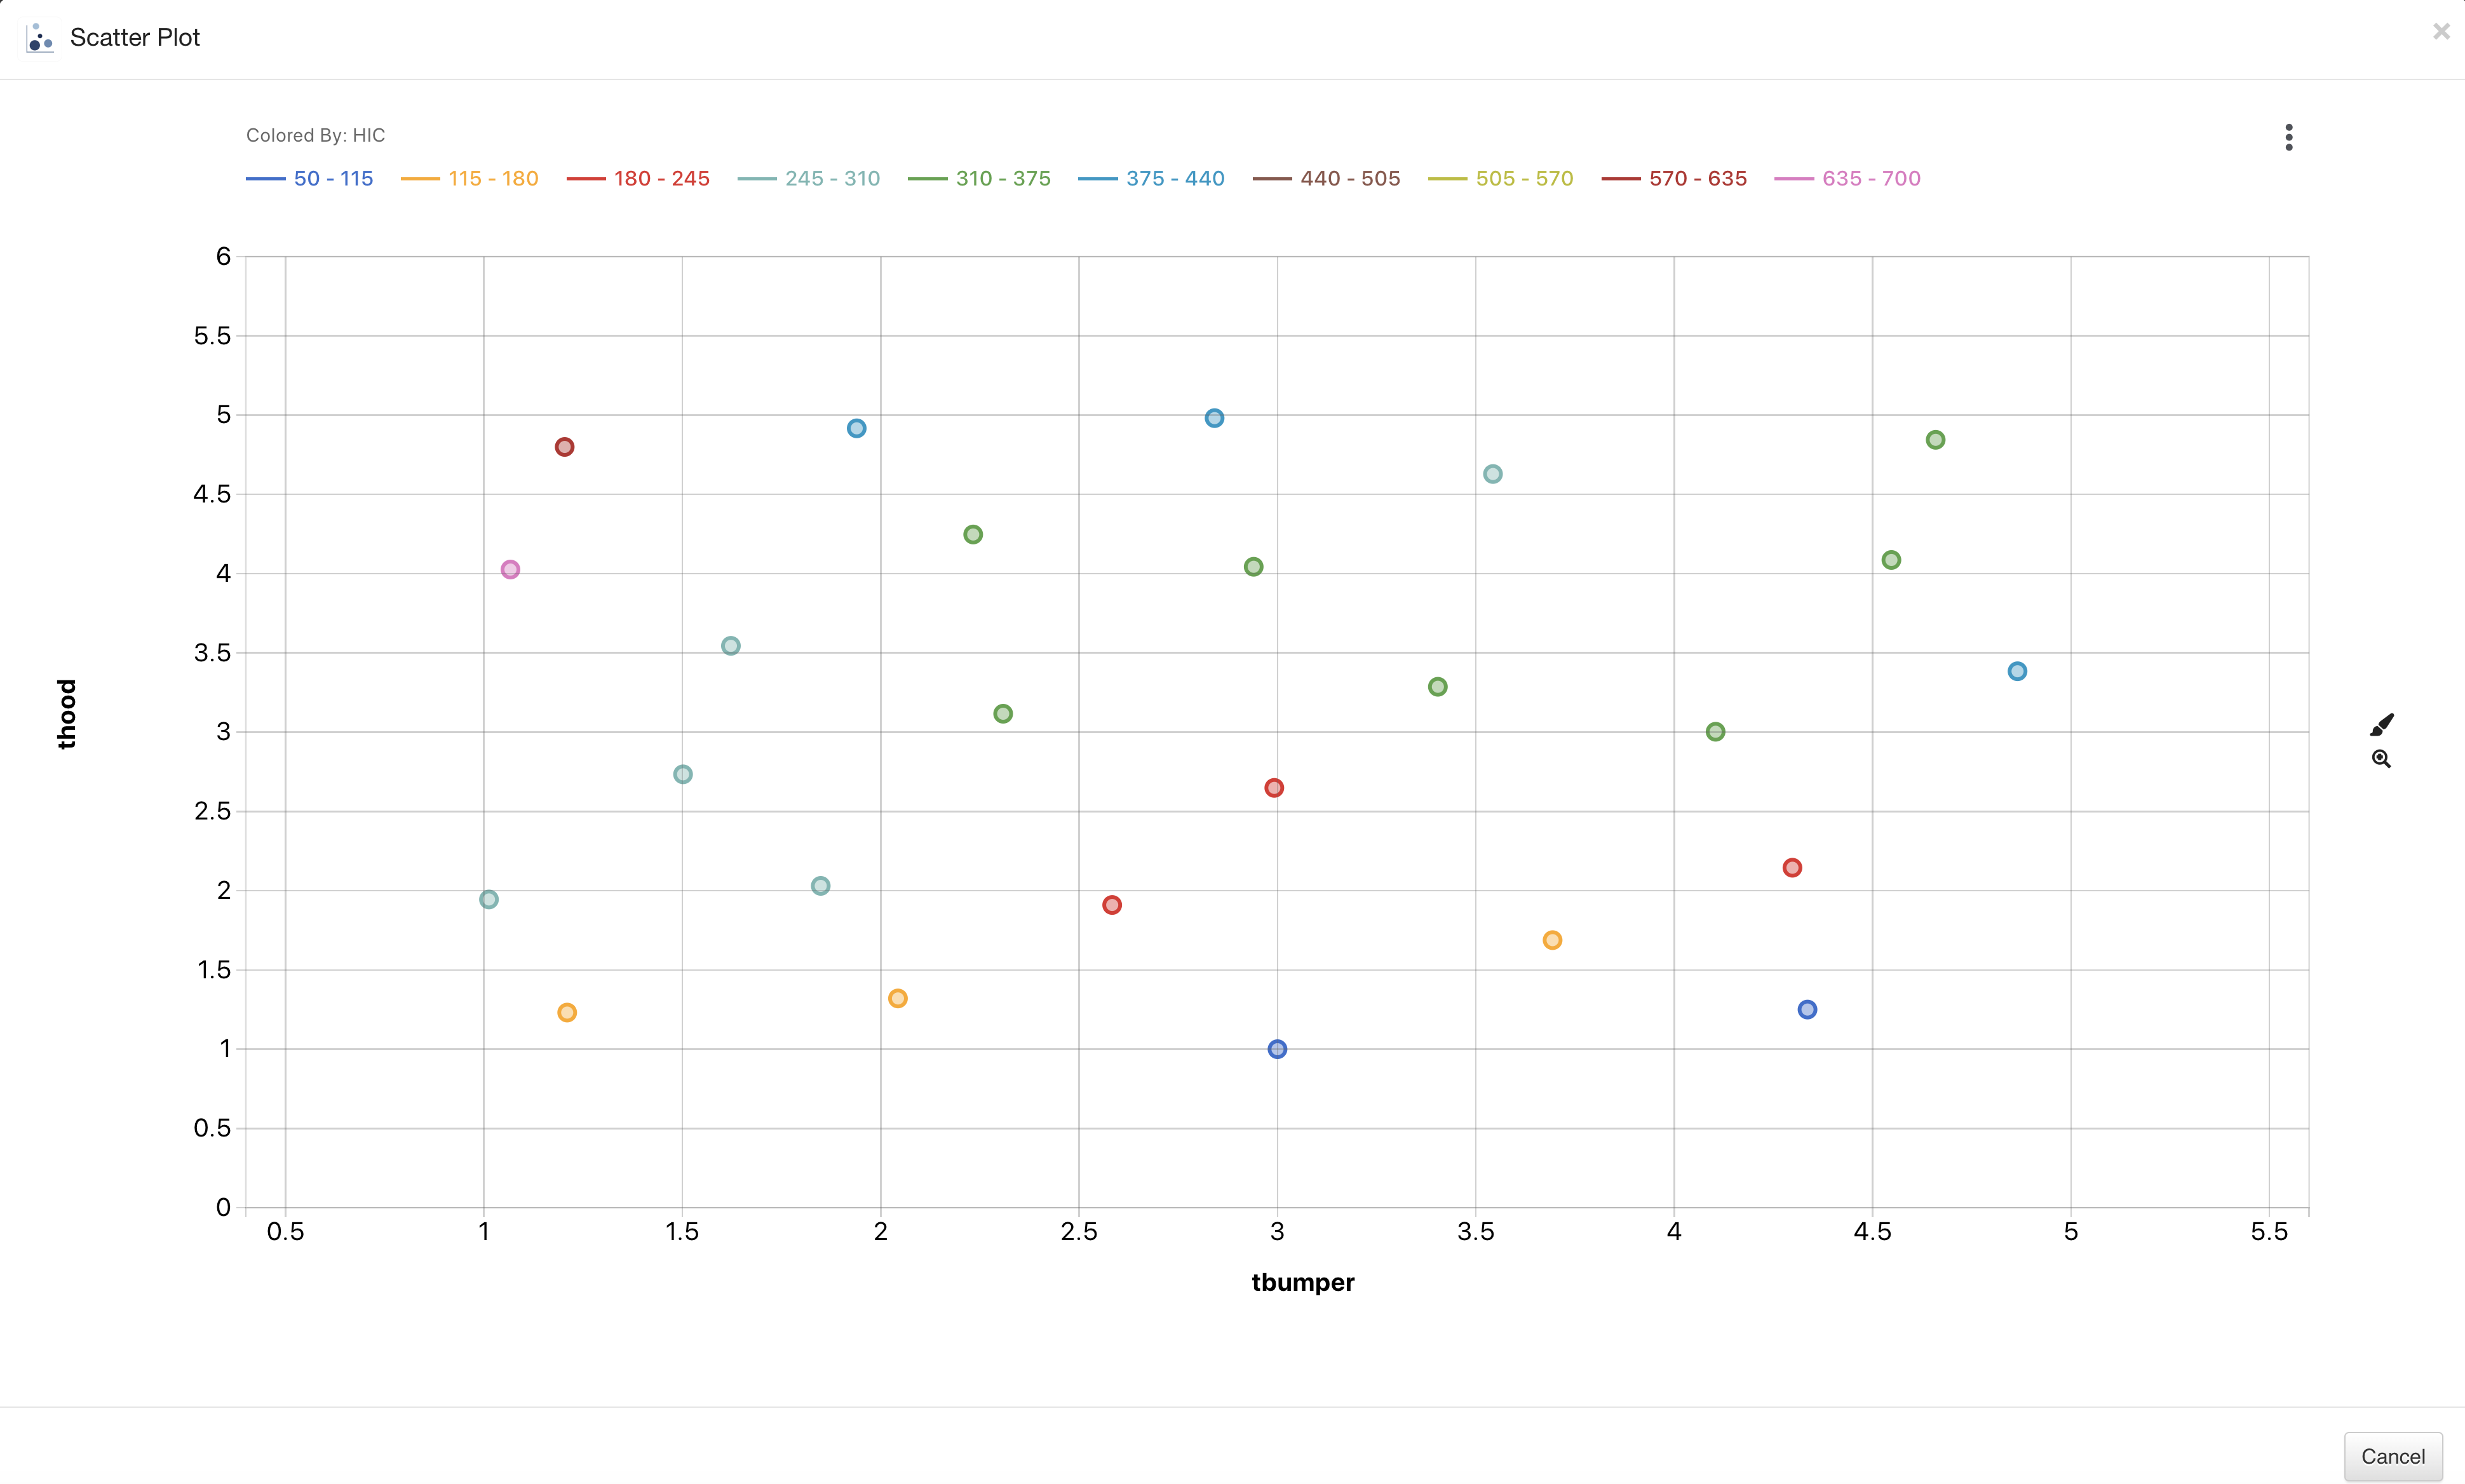
Figure 62: Bubble Chart Output
8.9. Workflow Provider
The Shapes menu has an option called Workflow Provider which allows us to execute an entire workflow via a worker in our current workflow. Watch the following video to see how it’s done:
Check out this Workflow Provide Example <WFProviderEx> in the examples section for a step-by-step of creating a workflow with Workflow Provider
Please also refer to this blog post on Workflow Provider for more information.
Sample datasets can be selected as an input for dataset related workers in the options dropdown.
Figure : Choose Sample Datasets
A library of workflows is available in the File dropdown to import it to a new workflow canvas and replace it with an existing one.
Figure : Workflows Library
8.10. Docs in Workflows
Added support for Docs in Workflows to document notes in it. Docs can be found in left side bar. Depending on our needs, this can be expanded to a full-screen view or minimized to the default view.
Figure : Workflows Docs and Enlarged View
Static inputs from executed workers in the current workflow can be imported and added to Docs. Right-click on the Documentation area and choose “Worker Output” (1) then, in the popup, choose the desired worker output from the dropdown and implement (2) to see the output in Docs (3).
Figure : Import Worker Static Output to Docs
Images can be imported into Docs and edited in Paint board or Drawing board. Click on the image icon to import the desired image (1), right-click on the image and select “Edit image” (2), now in the paint board, edit the image using the available tools (3), and save to implement it (4).
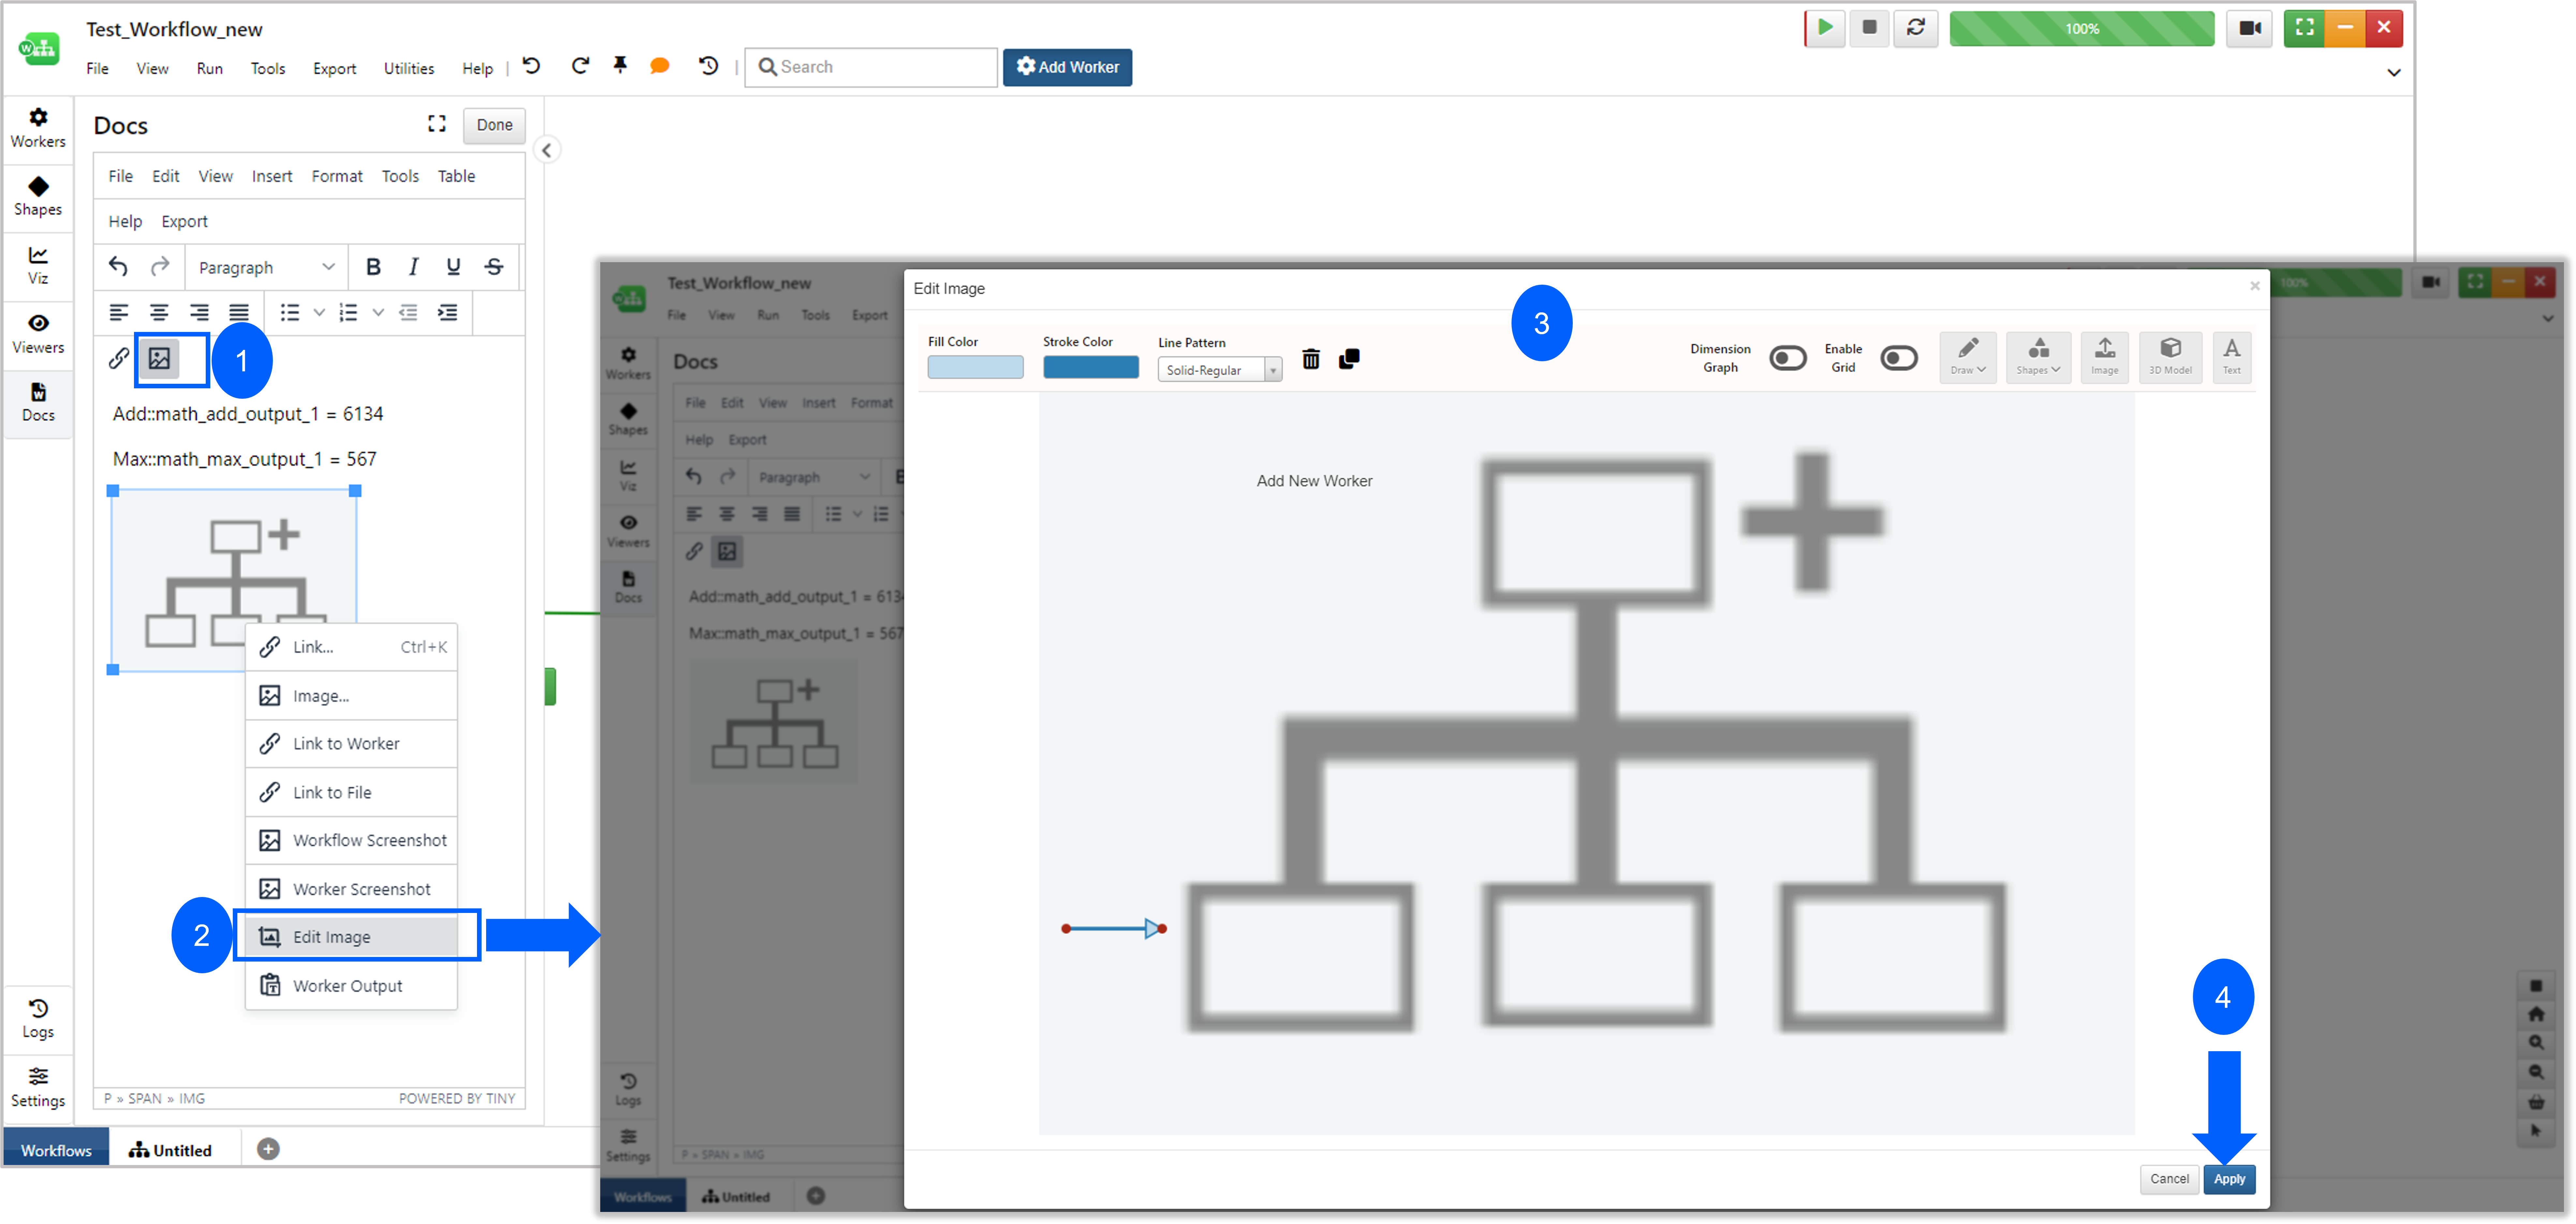
Figure : Edit Image in Paint Board