13. Datasets in Simlytiks
NHTSA Dataset
Nhtsa dataset features
The datatable in NHTSA dataset will show the filter options on the bottom of the page in Simlytiks.
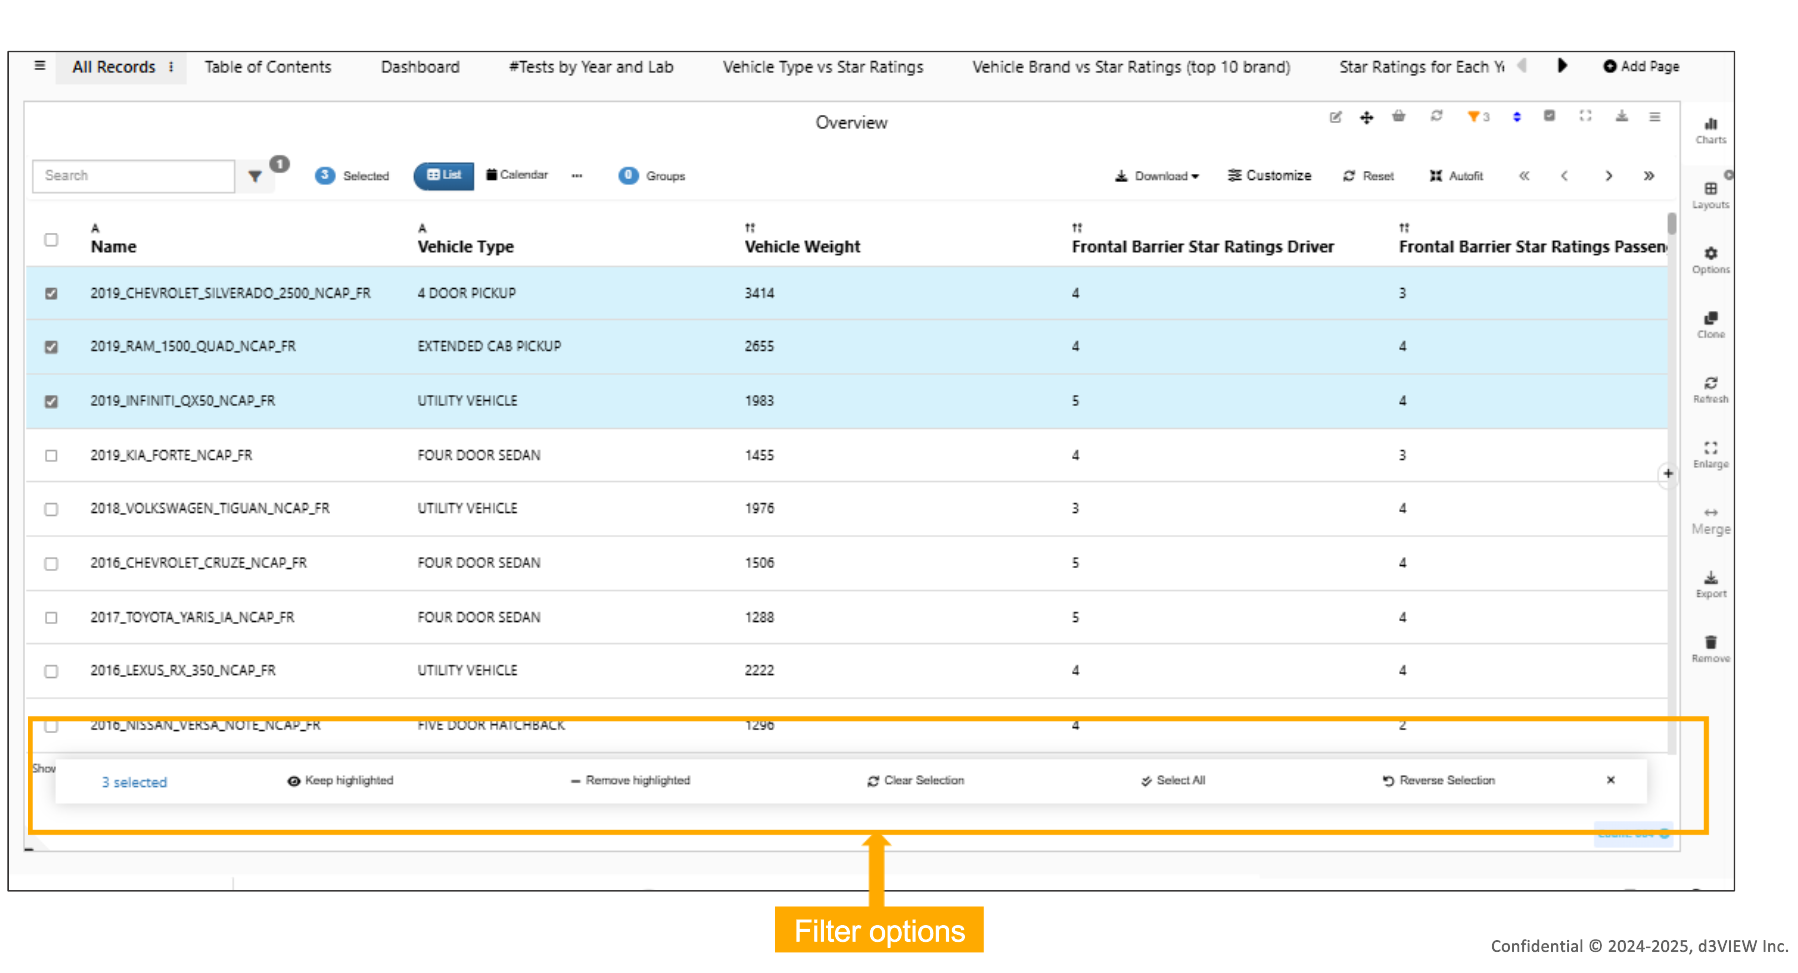
Filters
The Pagelink table visualization in NHTSA dataset will show ‘Go Back’ and ‘Close’ option when we navigate to other pages by clicking on the visualization types/name.
The description column in Pagelink table visualization in NHTSA dataset is now editable in Simlytiks.
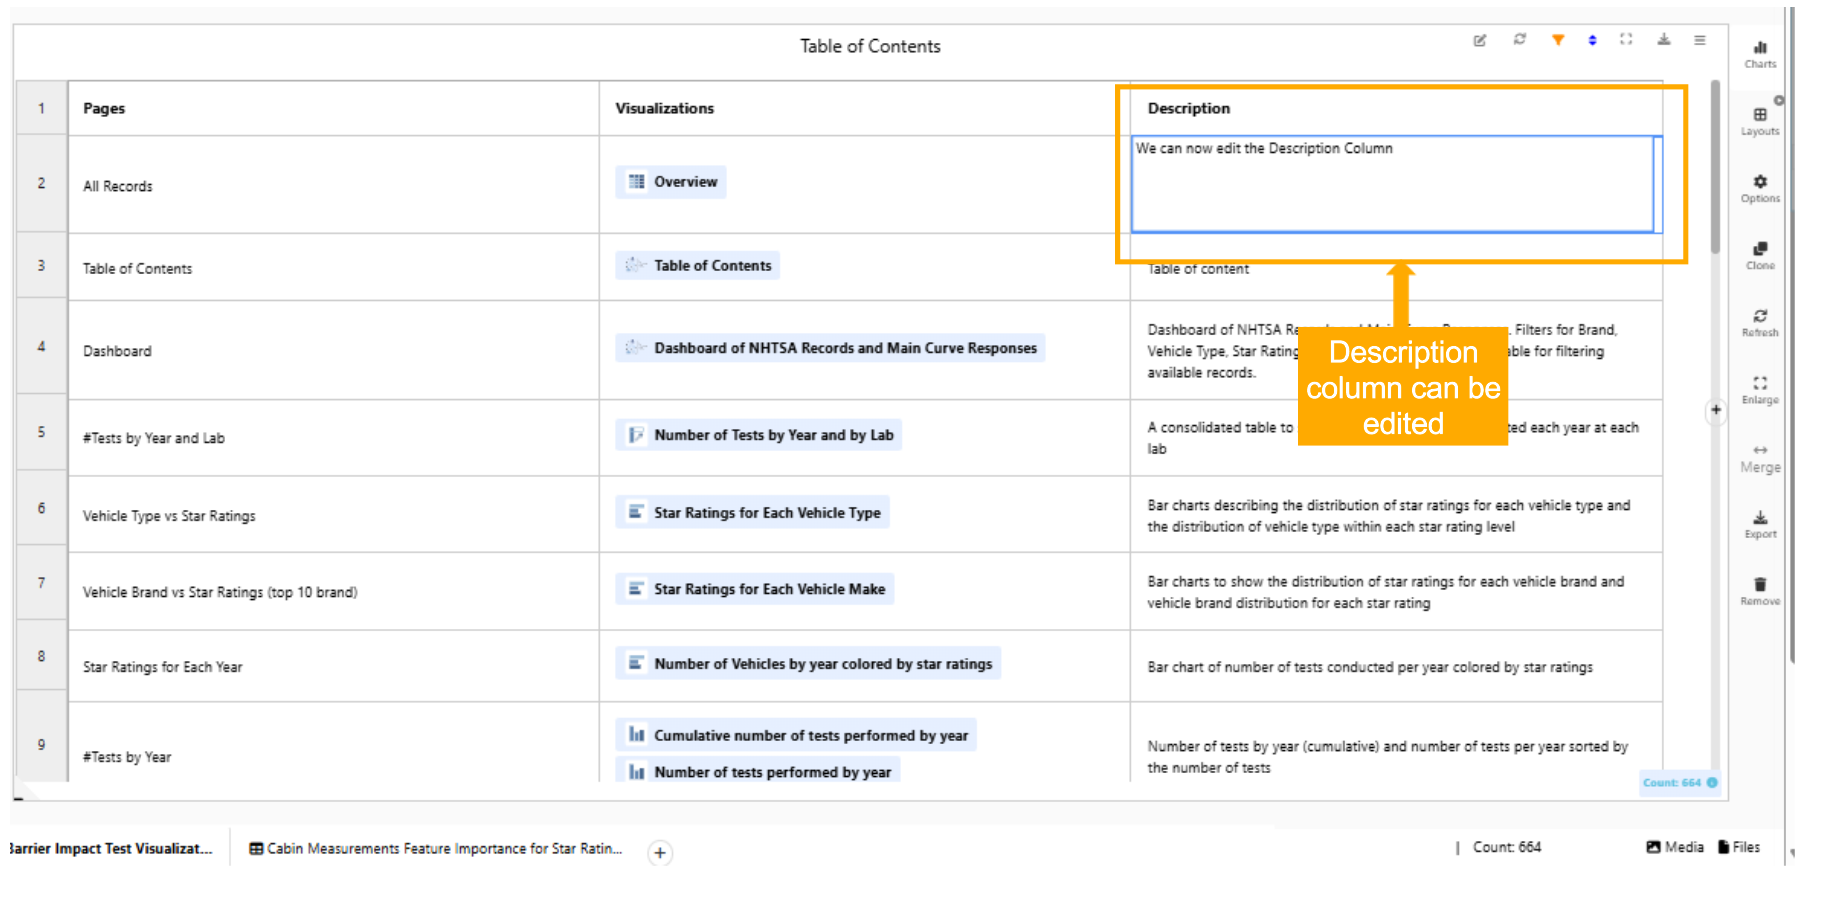
Description column
New input fields ‘Start_By’ and ‘End_by’ are now available for table visualization in NHTSA dataset.
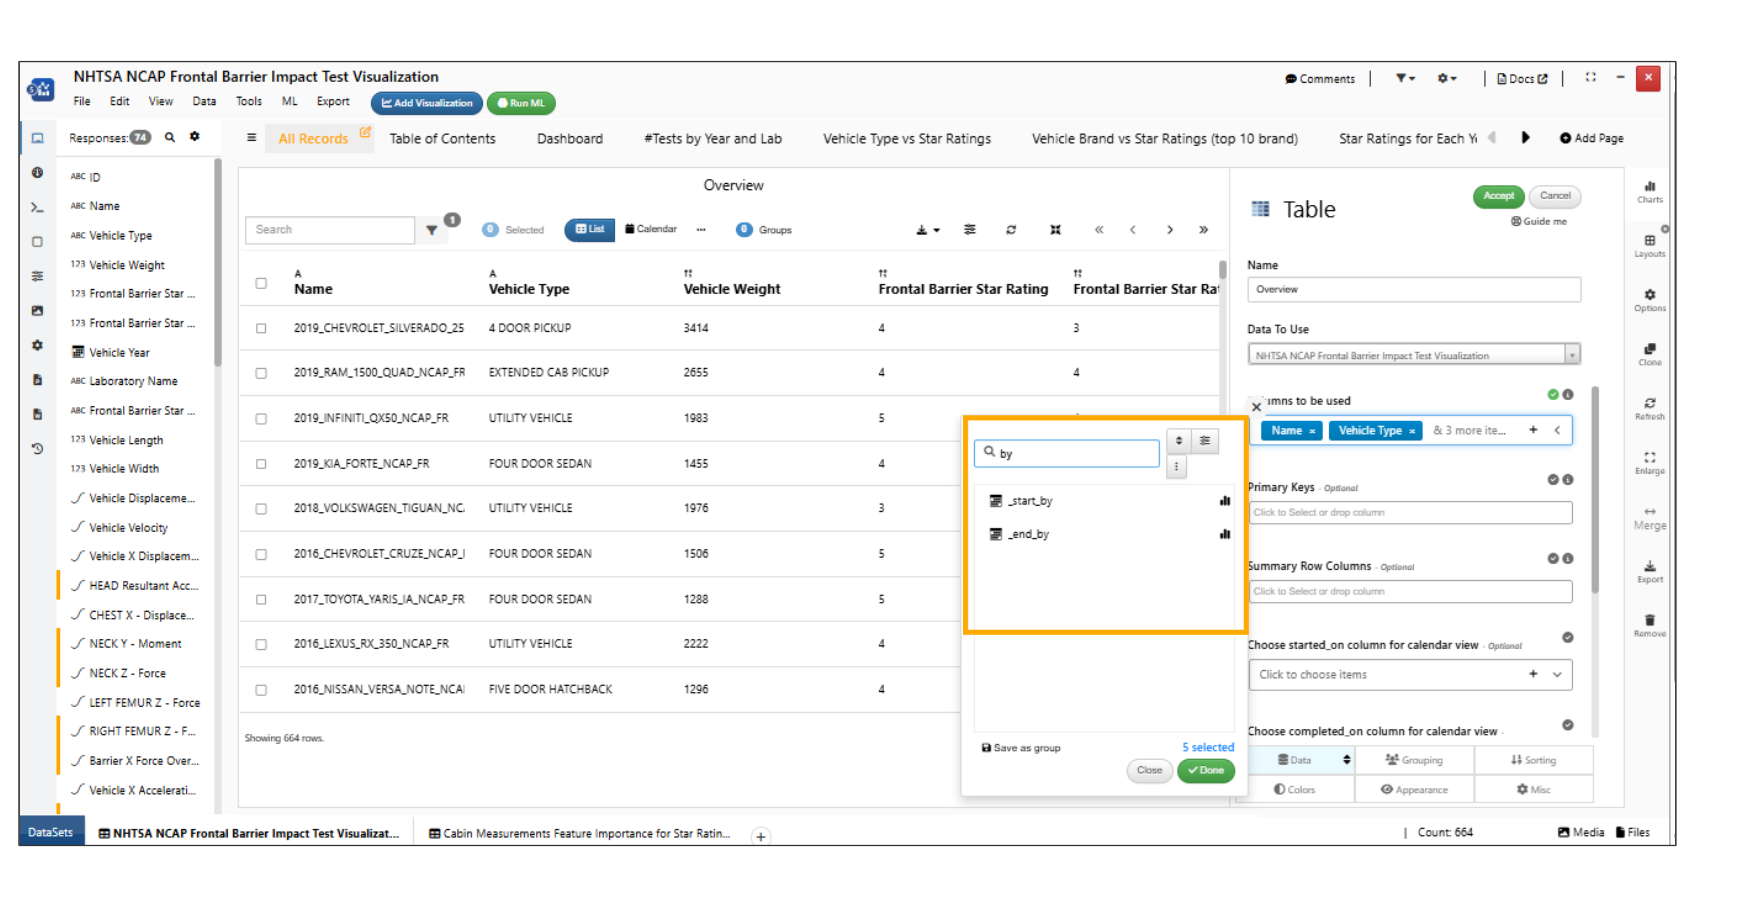
Start_By and End_by
Dashboard visualization page in NHTSA dataset is updated and will show all the Filters in page.
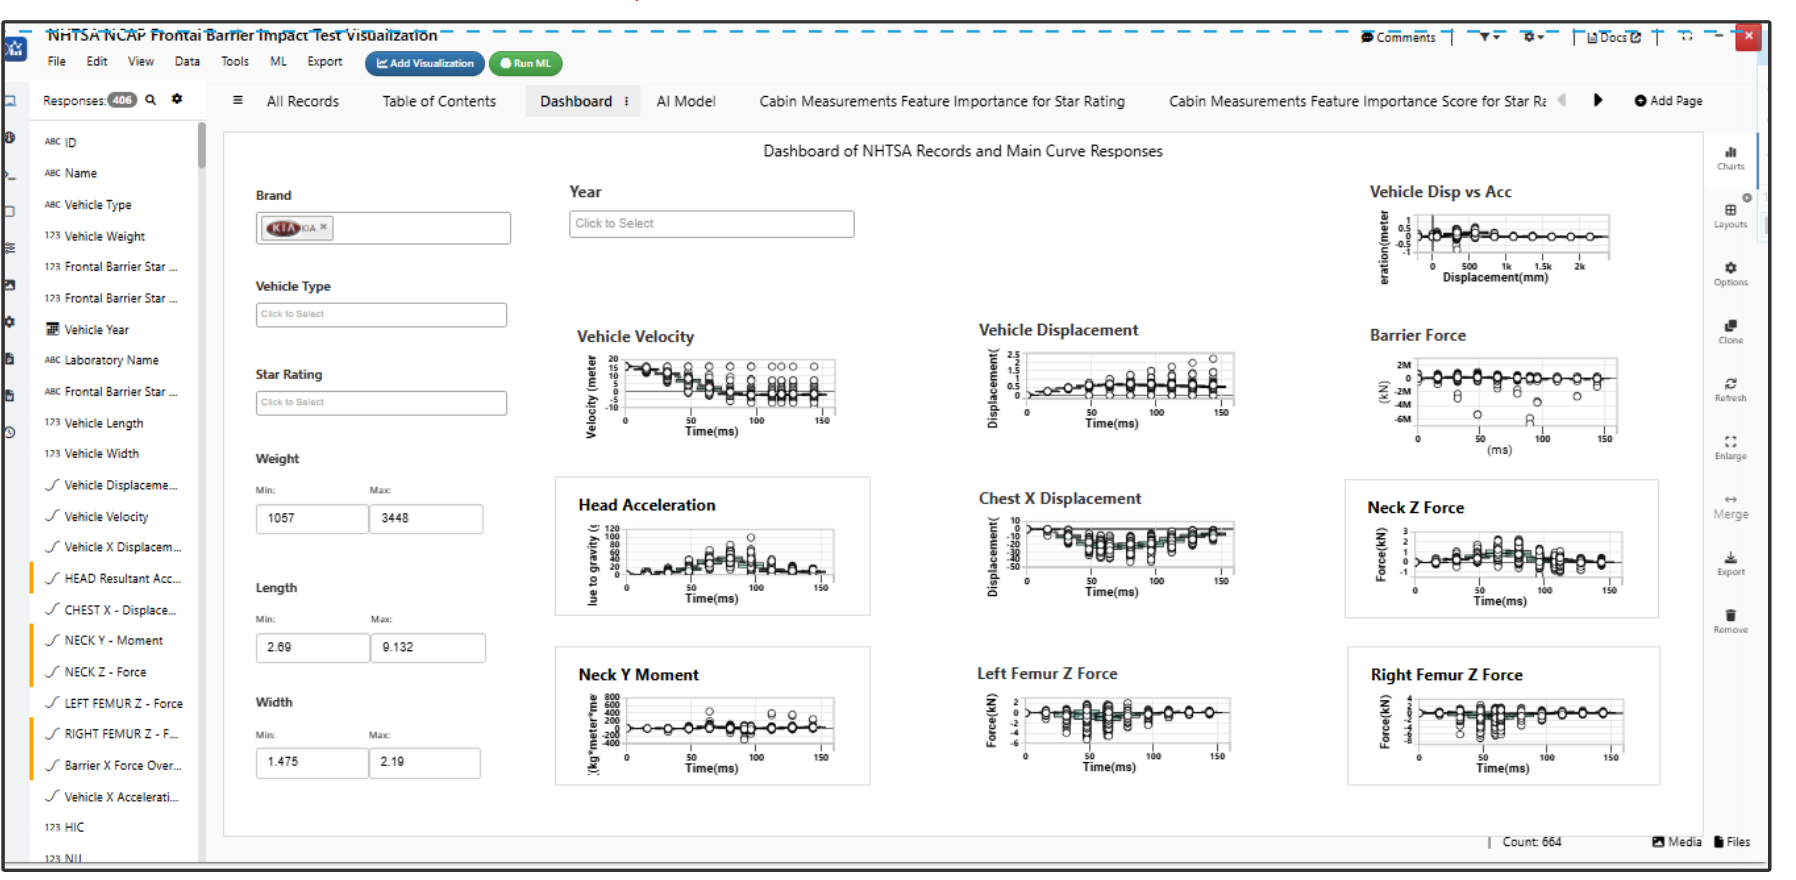
Dashboard Filters in Page
The Dashboard visualization in NHTSA dataset allows selection of curves in enlarged view.
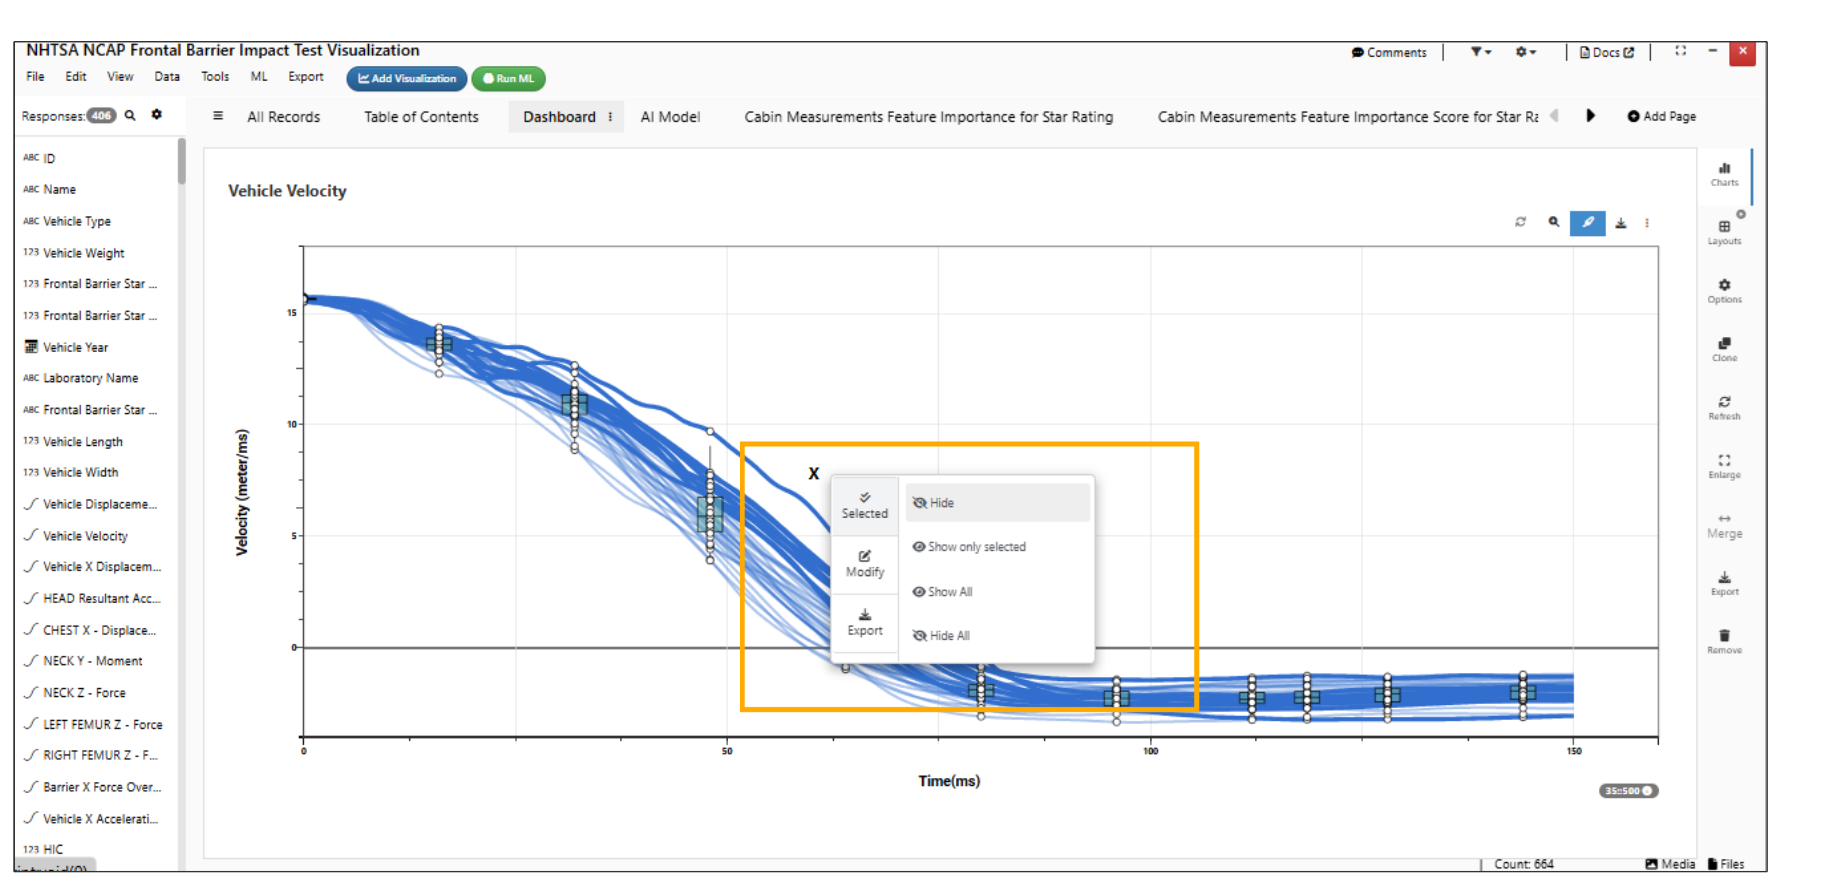
Curves selection
Numerical values can be added to the filters in Dashboard visualization under NHTSA dataset.
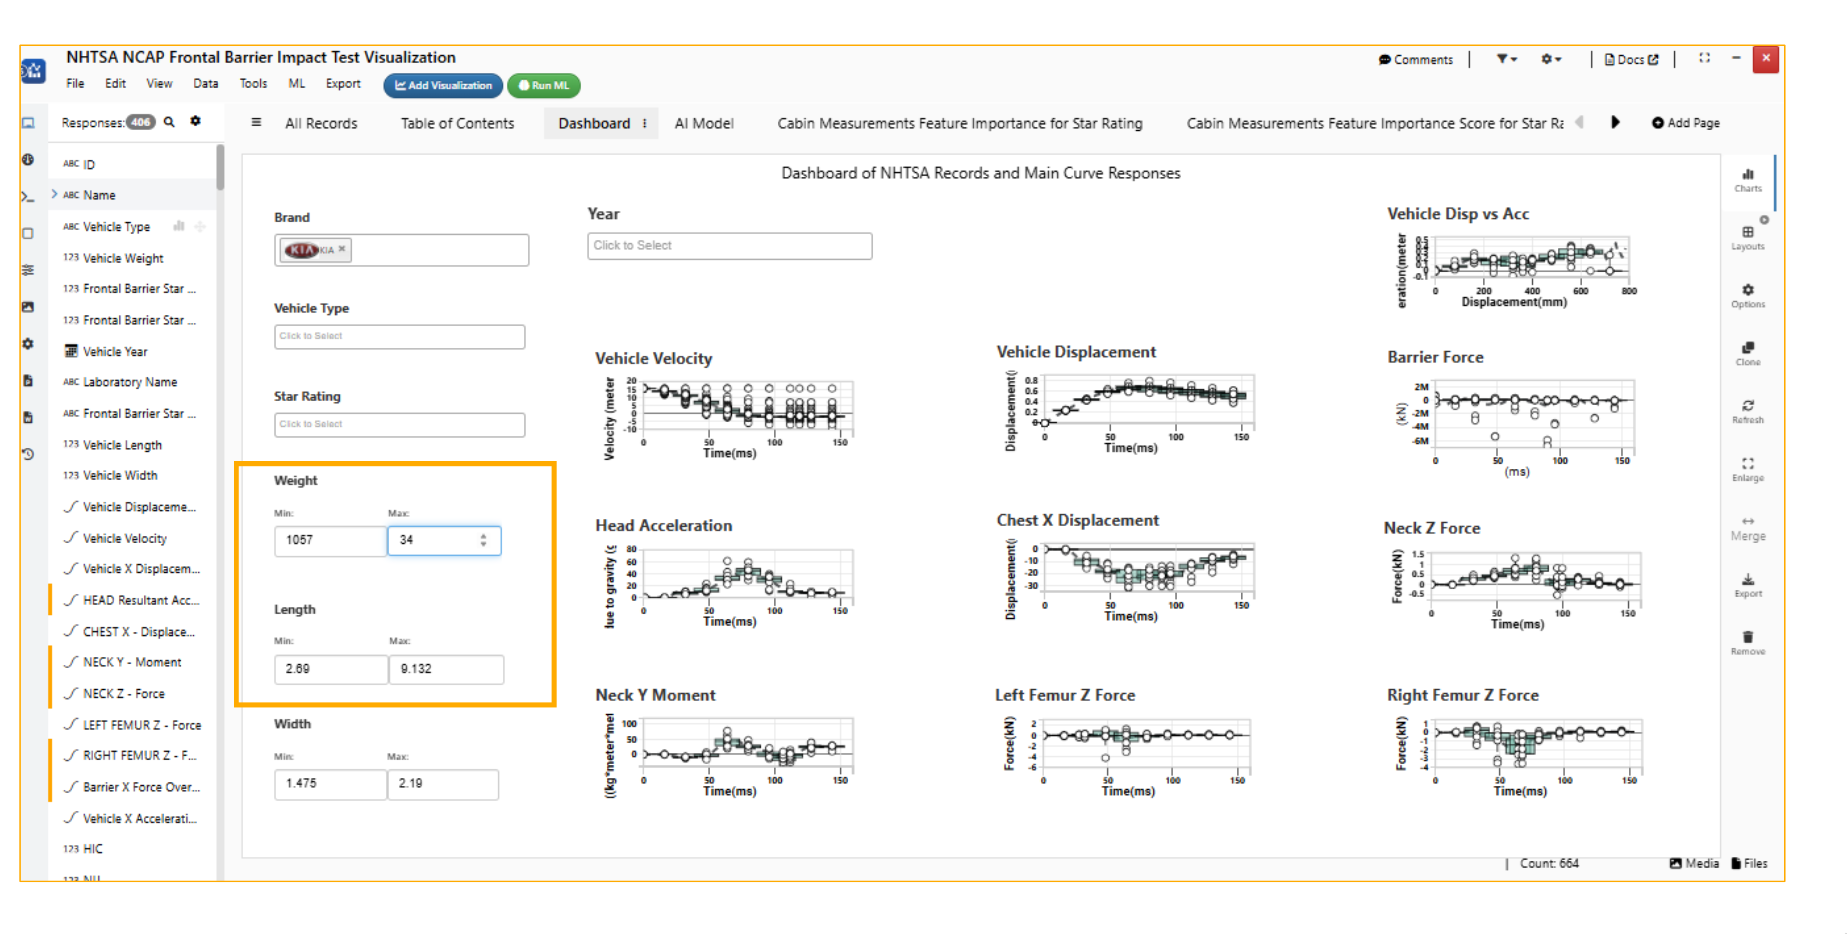
Filters range
In NHTSA dataset, highlighting the curves and filtering them in enlarged view of Dashboard visualization will also update and add filters to all the other curves in the Dashboard.
Images
In NHTSA dataset the Images are available in the Image gallery visualization pages and are rendered smoothly.
Images in Bubble Chart
Bubble Chart now supports images available in the dataset to replace the bubble plots for large data in the Visualization. The Images will be rendered and shown in the plot.
Dashboard Curves
Newton charts in Dashboard visualization now has a new ‘Colors’ tab to provide colorby options to the visualizations in Dashboard. This option is available in edit view of Dashboard visualization.
Footer
In NHTSA dataset, the footer options are now available for all the visualizations.
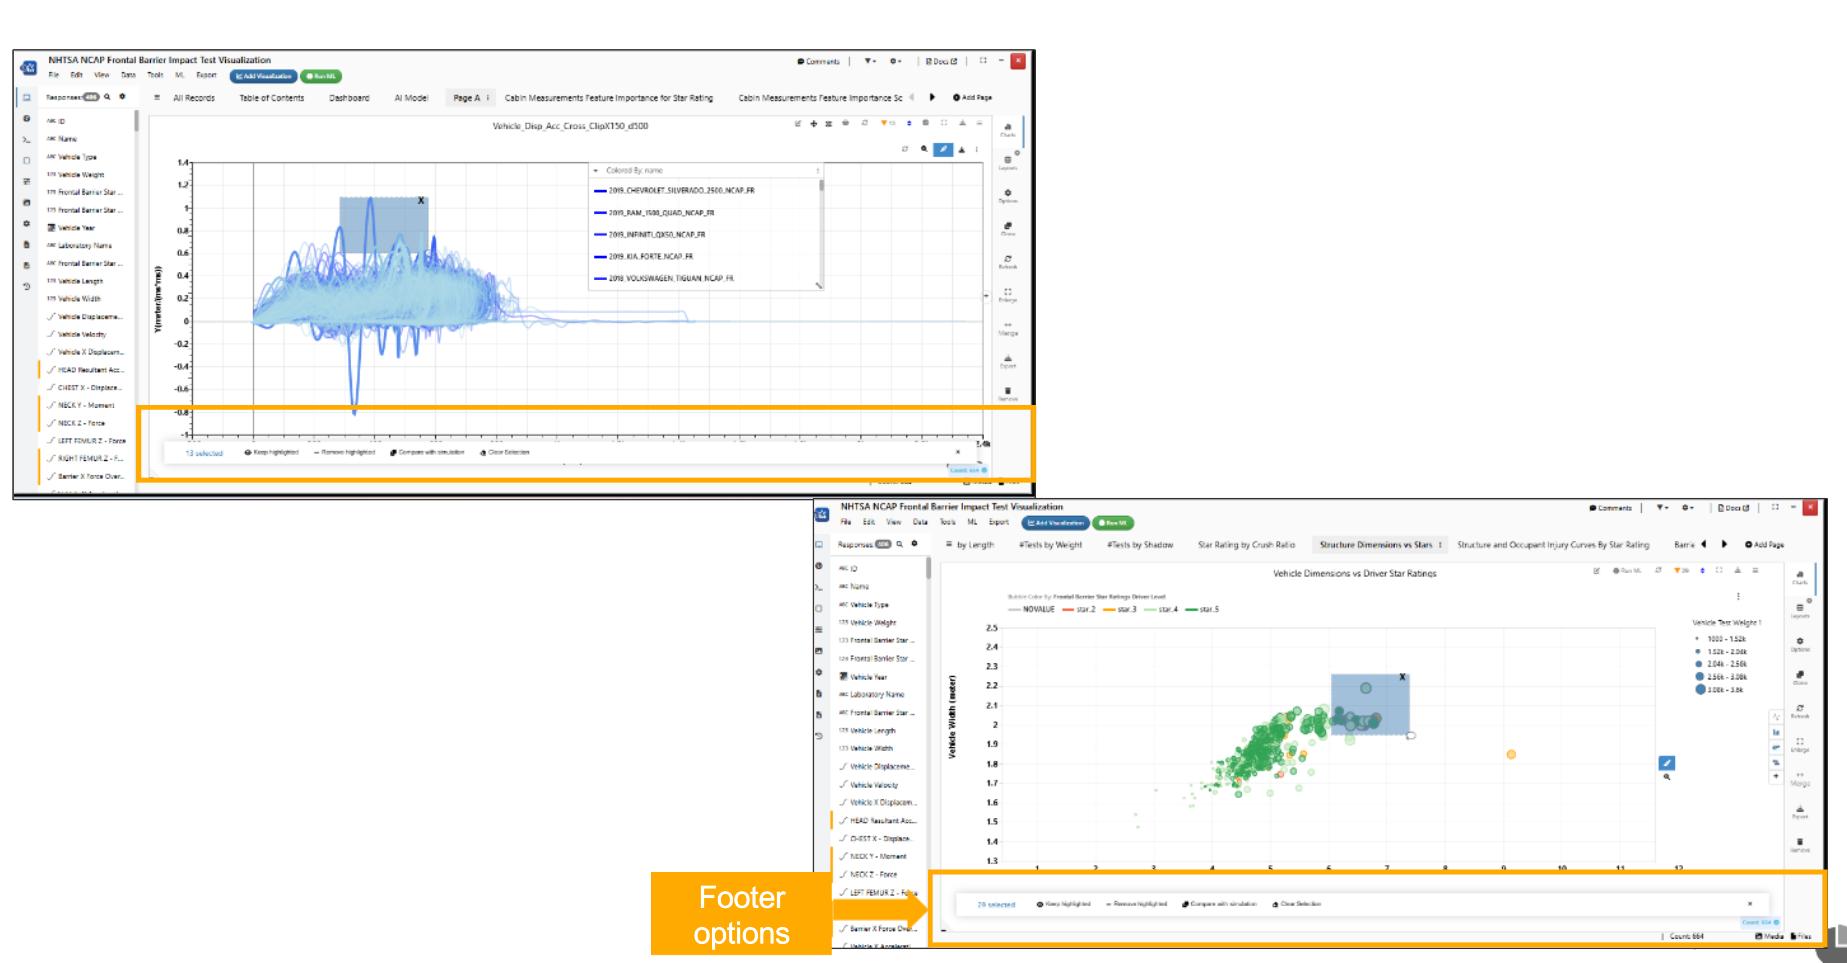
Footer options
The table visualization in NHTSA dataset will show the count of the filtered records to the bottom of the page.
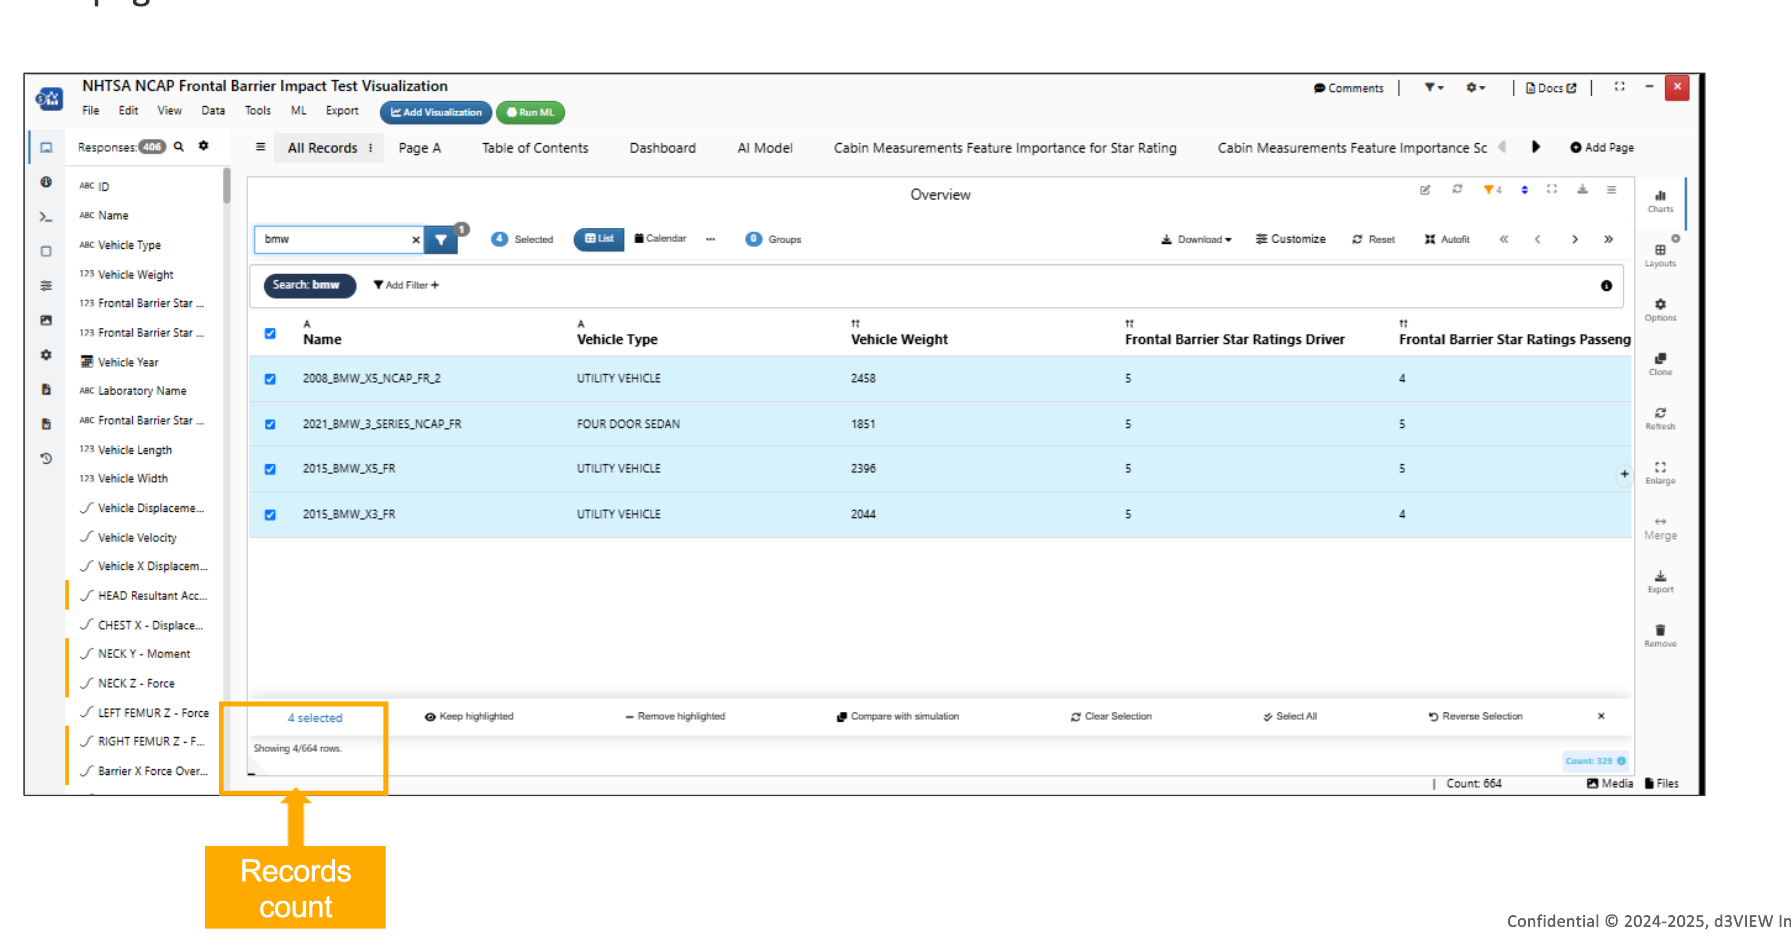
Table count
In Simlytiks, the filters added in the overview table will also show footer options for the records to keep/remove highlighted.
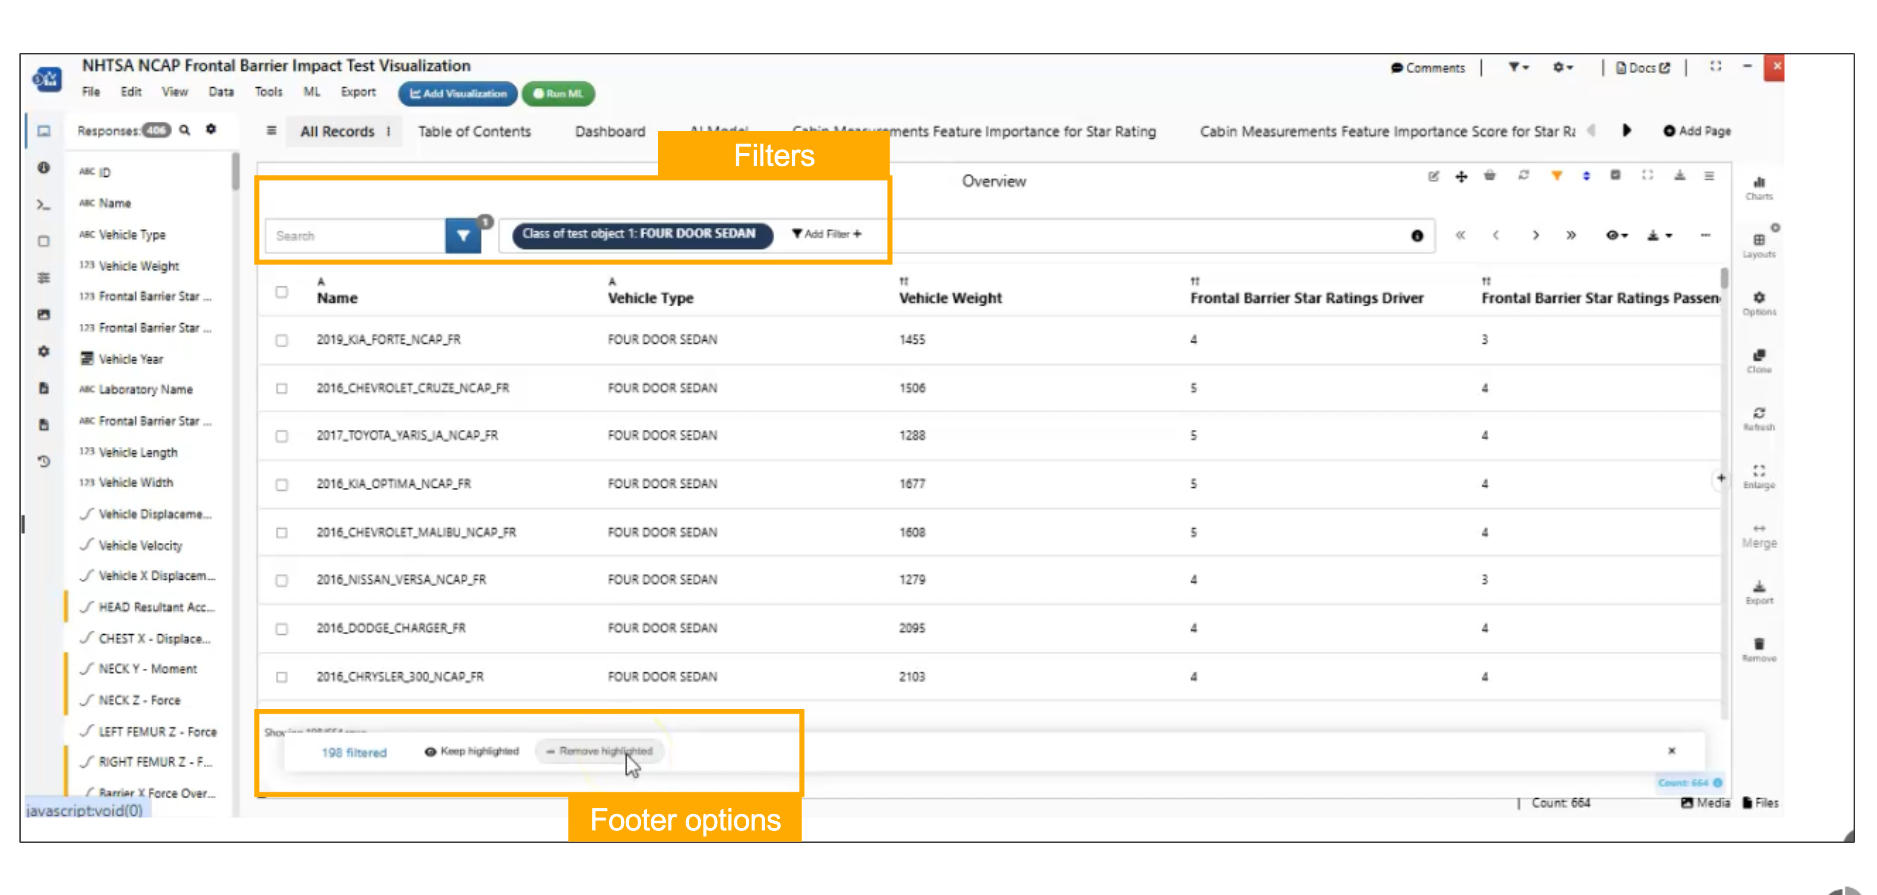
Filter footer options
IIHS Small Overlap Ratings
New dataset called ‘IIHS Small Overlap Ratings’ is added to the Simlytiks sample dataset library.
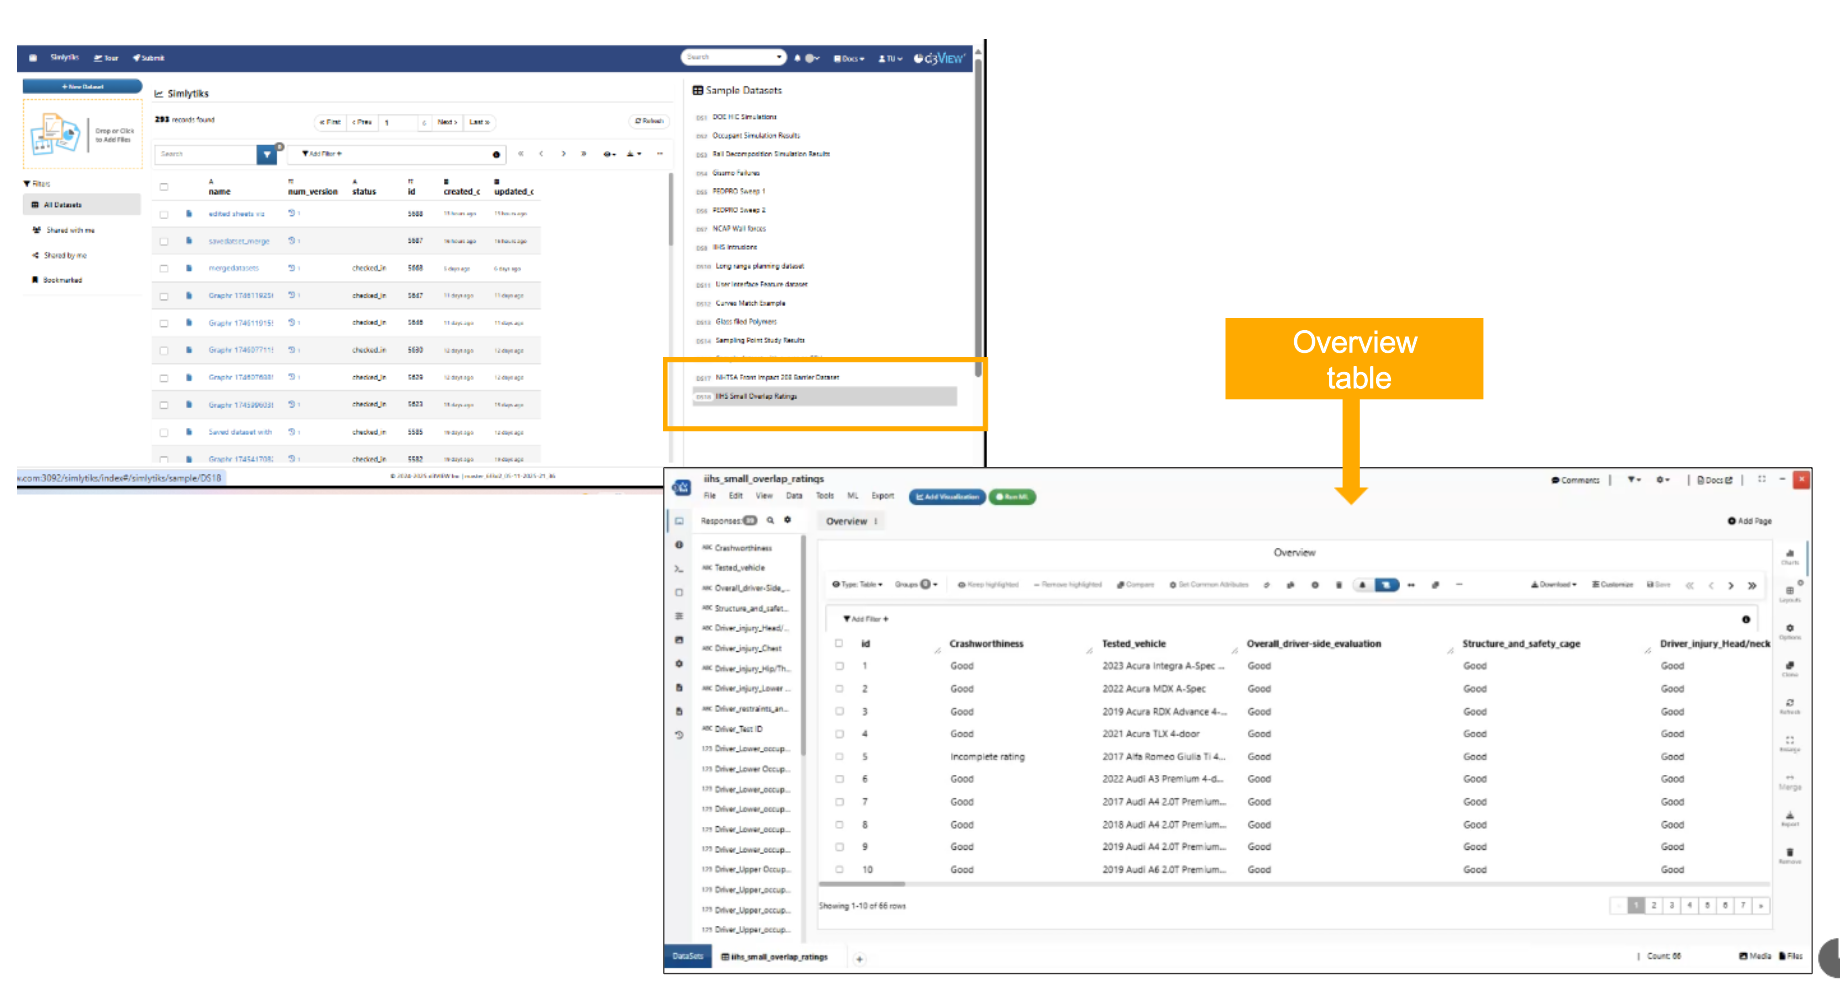
IIHS Small Overlap Ratings
IIHS Small Overlap Ratings with Visualizations dataset is added to sample library datasets in Simlytiks.
IIHS Small overlap Simlytiks database with visualizations is updated with all 1219 records.
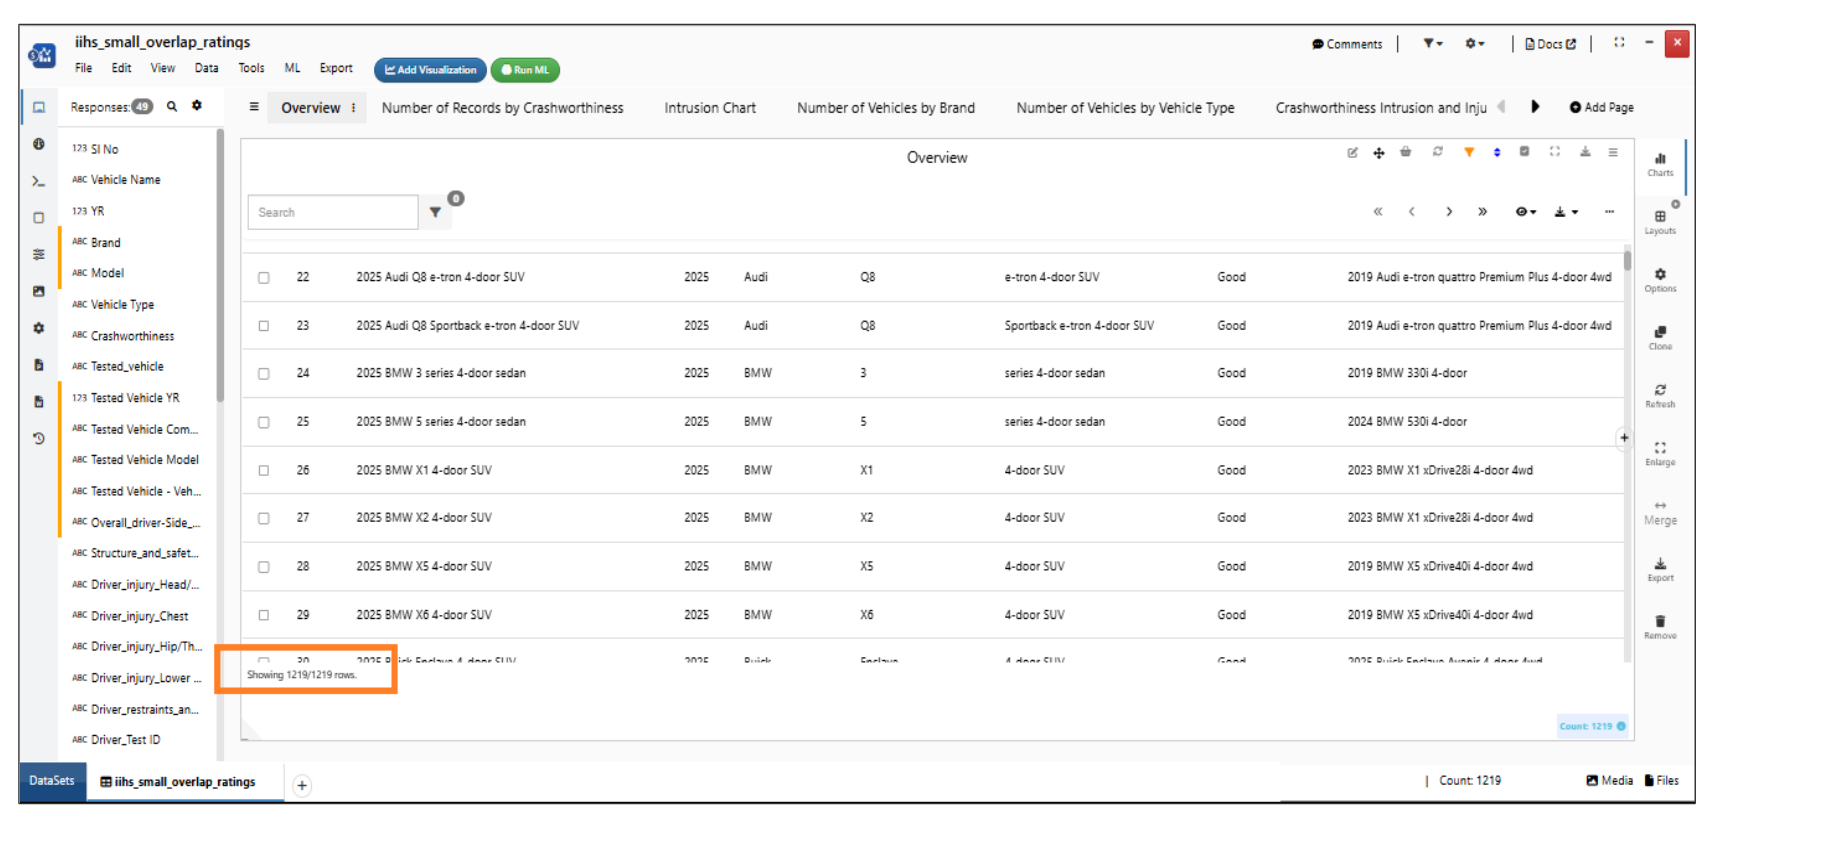
IIHS Small Overlap Ratings