
8.  Adding Media
Simlytiks now supports media for enhancing our data exploration experience.
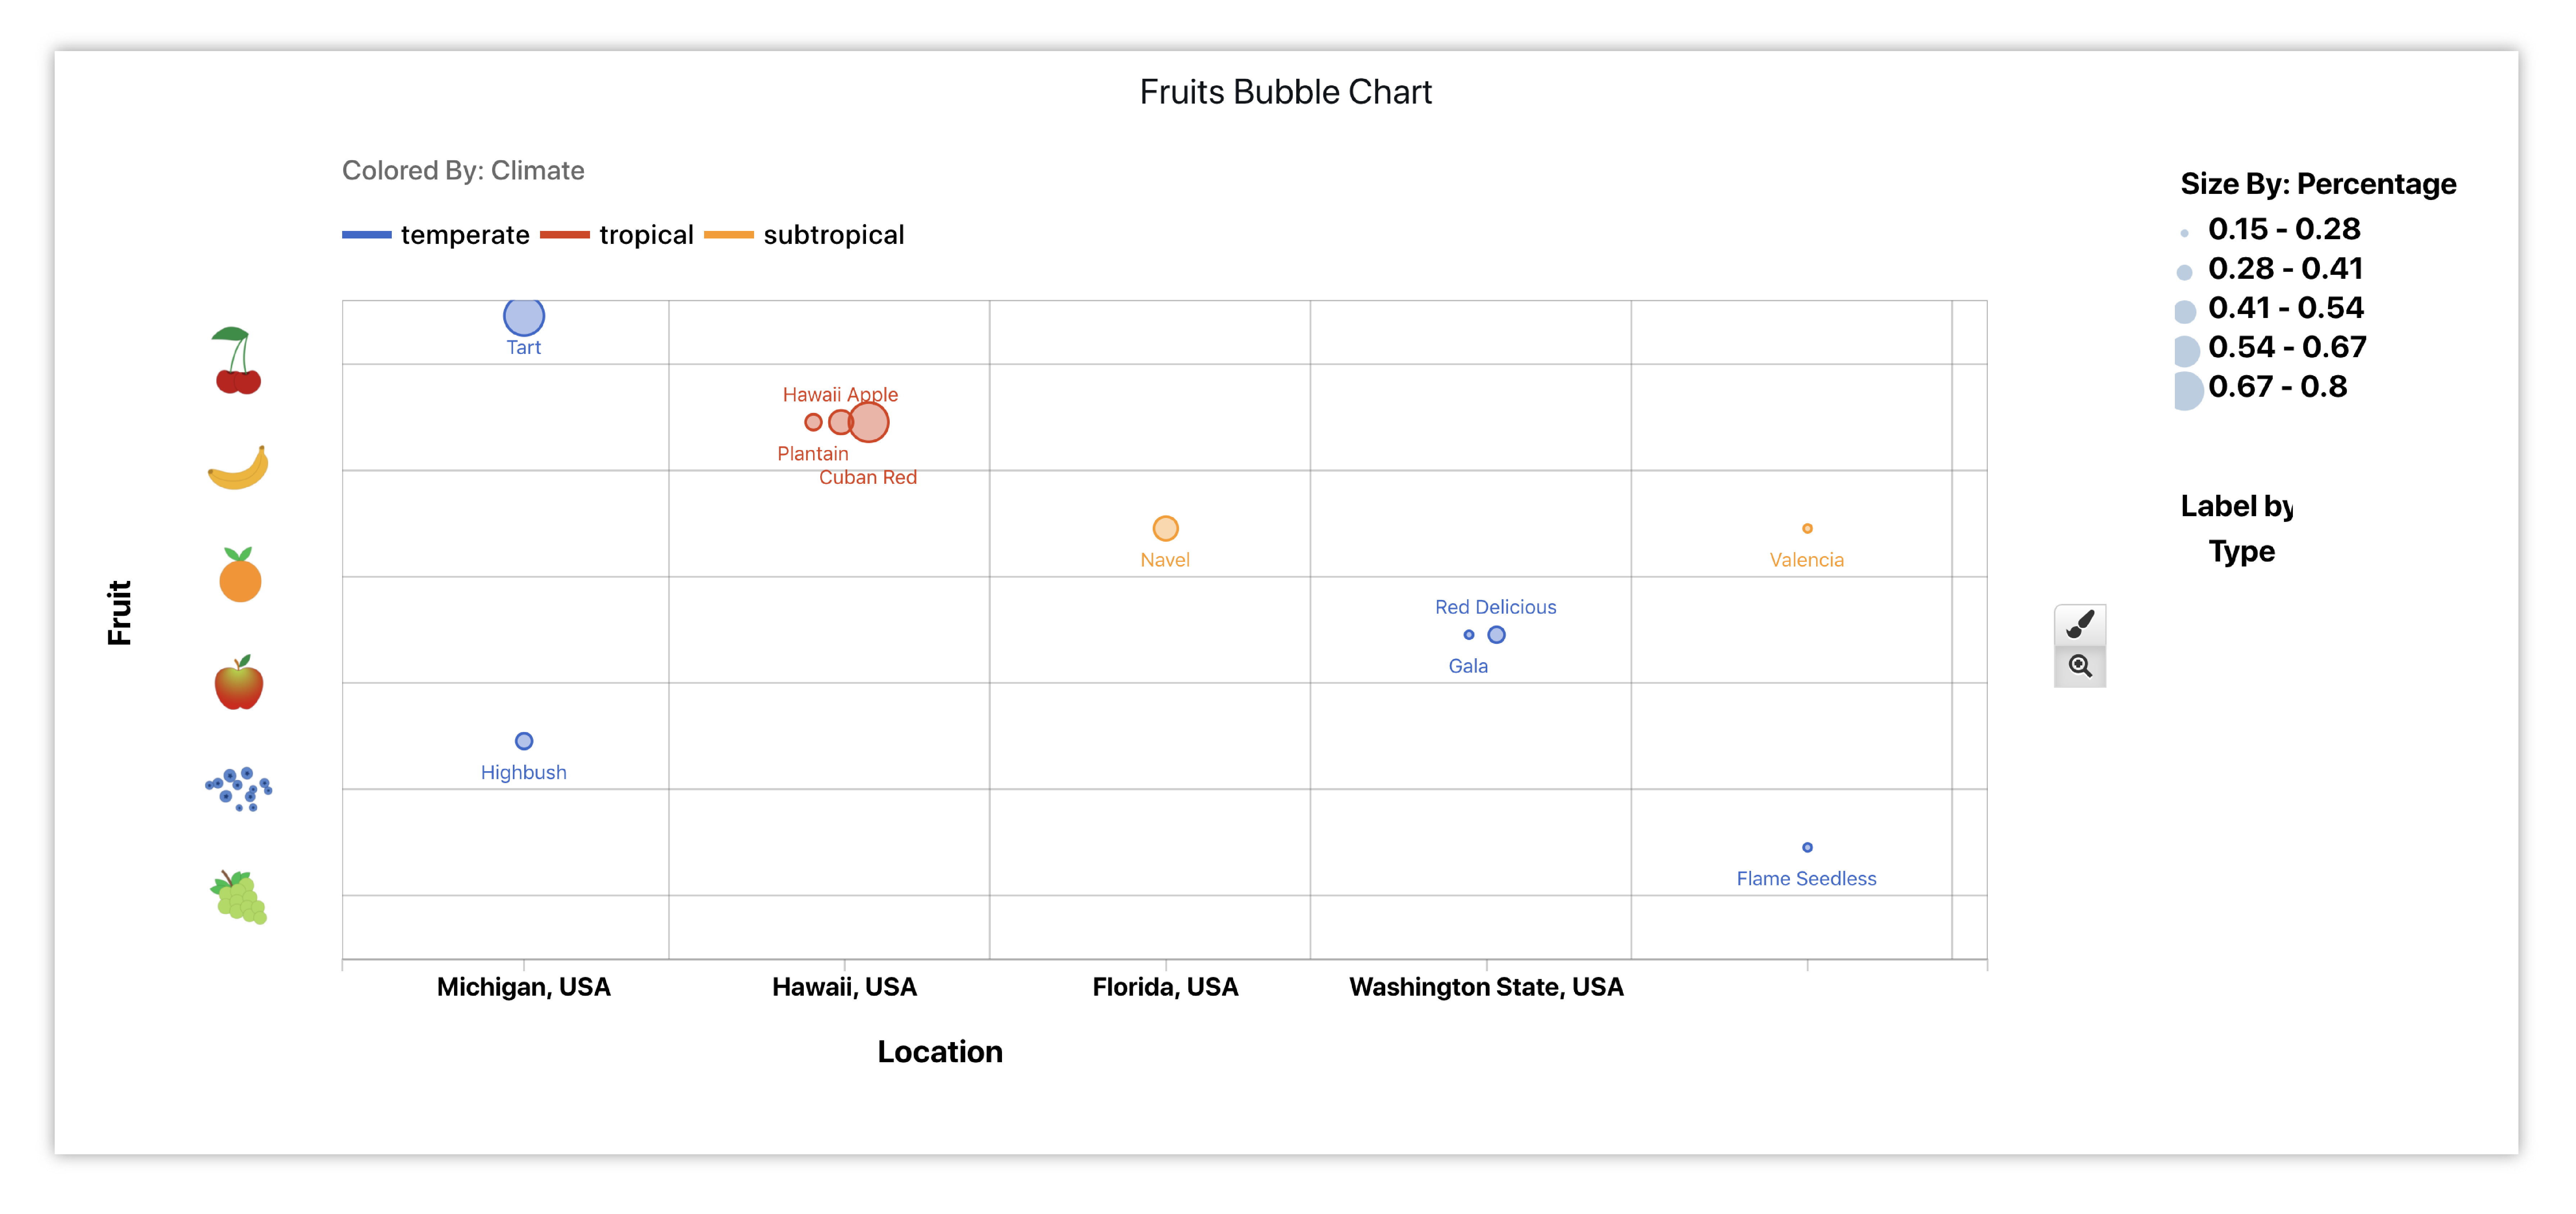
Added Fruit Graphics Shown in Axis
This new feature allows us to assign graphics or images to our data. We can use the built-in graphics provided in the application or upload our own from our local machine. Let’s go over how it’s done.
Available Media
We can choose to either upload media under the File menu or edit media under Customize in the Tools Menu.
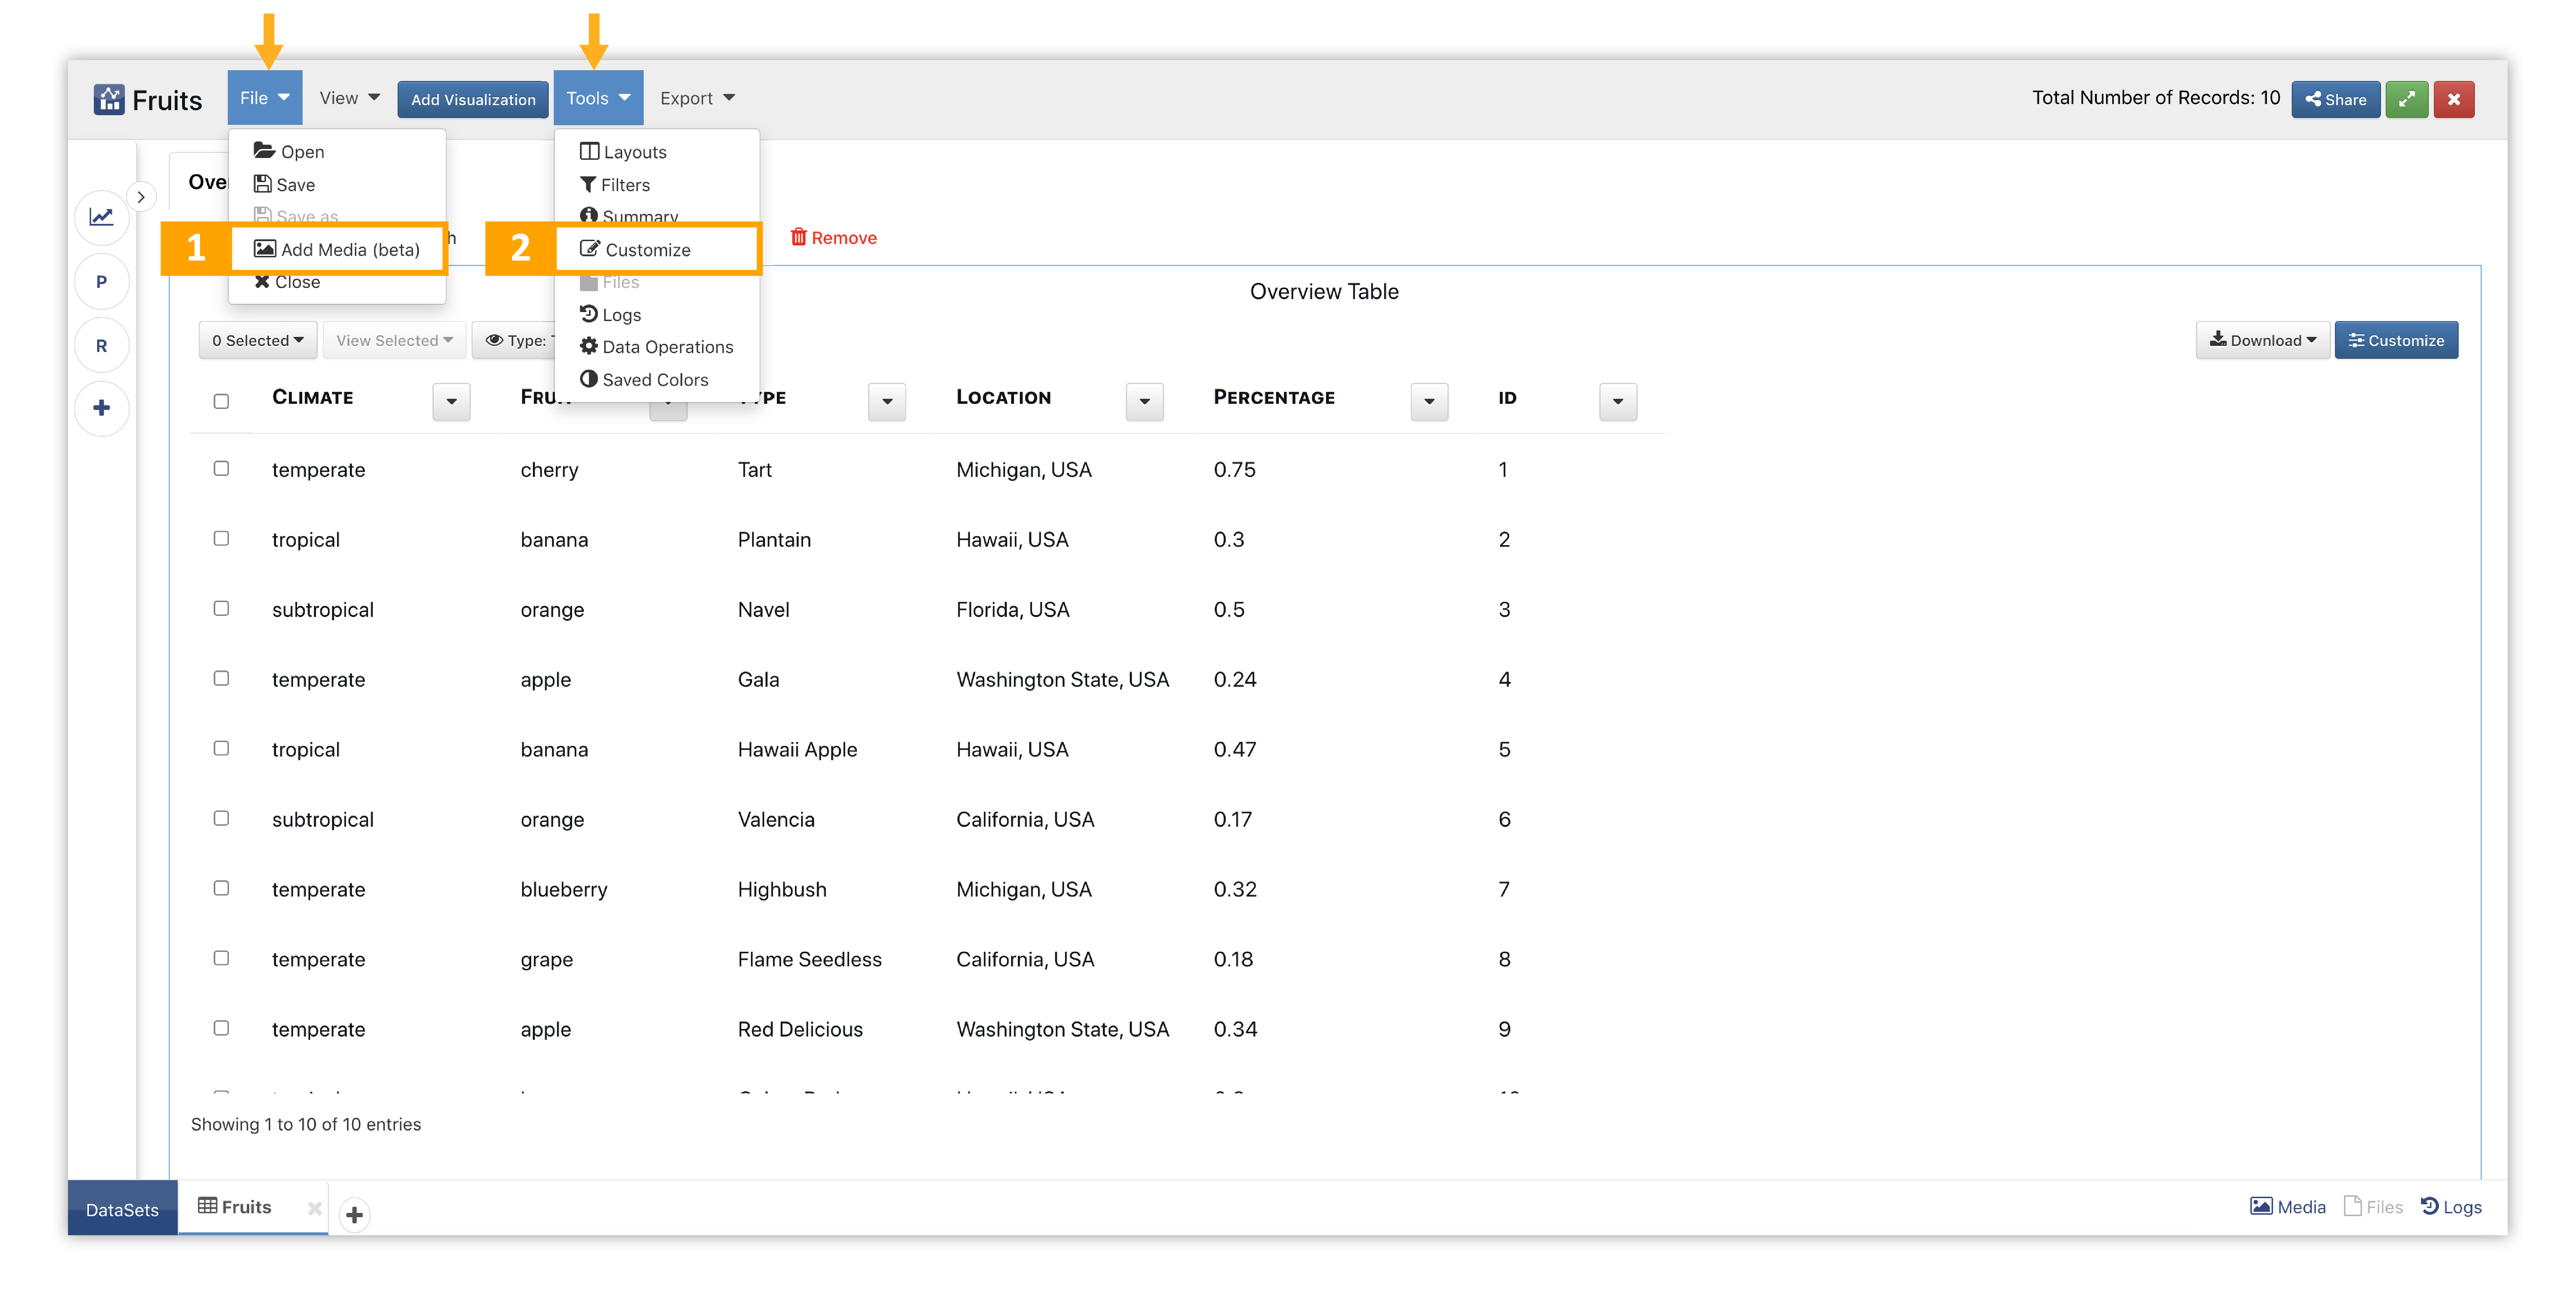
Figure 1: Media Options
- Add Media from the File Menu
- Edit Media under Customize in the Tools Menu
Let’s start by choosing Customize so we explore and configure the available media.
In the next window, click over to the Media tab and click on the library option to review the built-in images provided by Simlytiks.
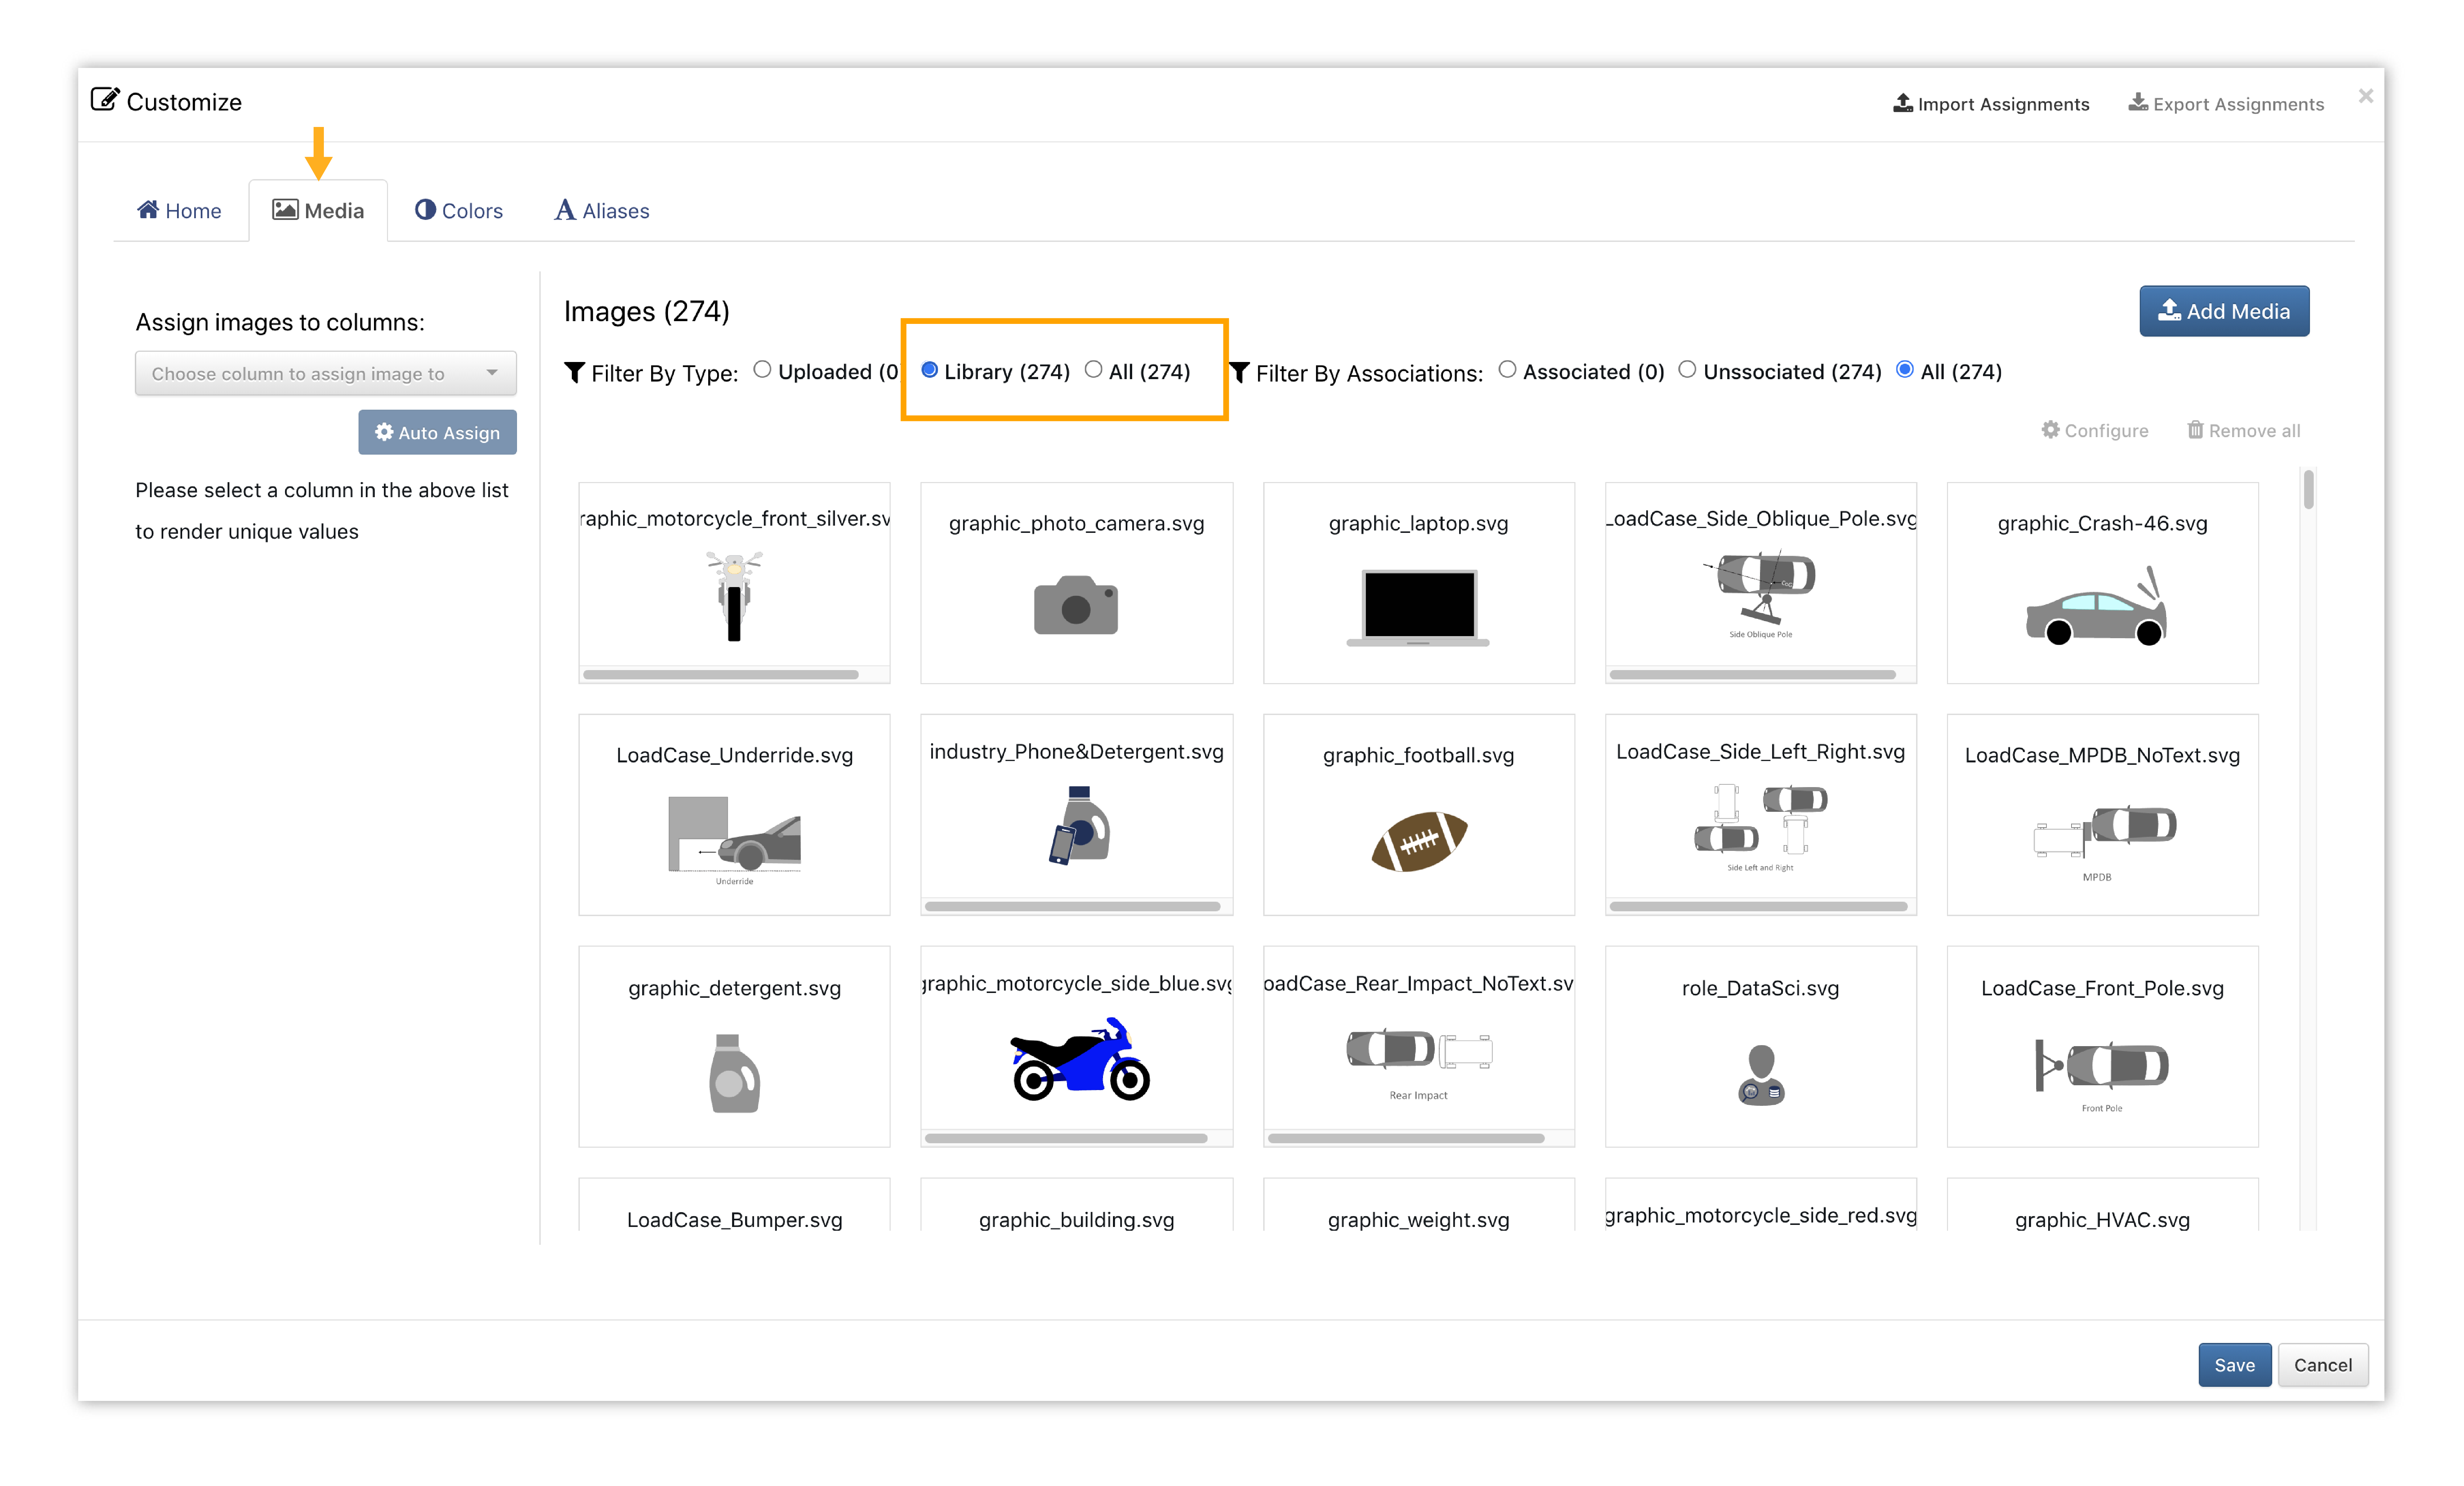
Figure 2: Reviewing Available Menu
NEW as of March 23, 2022, you can view available media in 360 degrees.
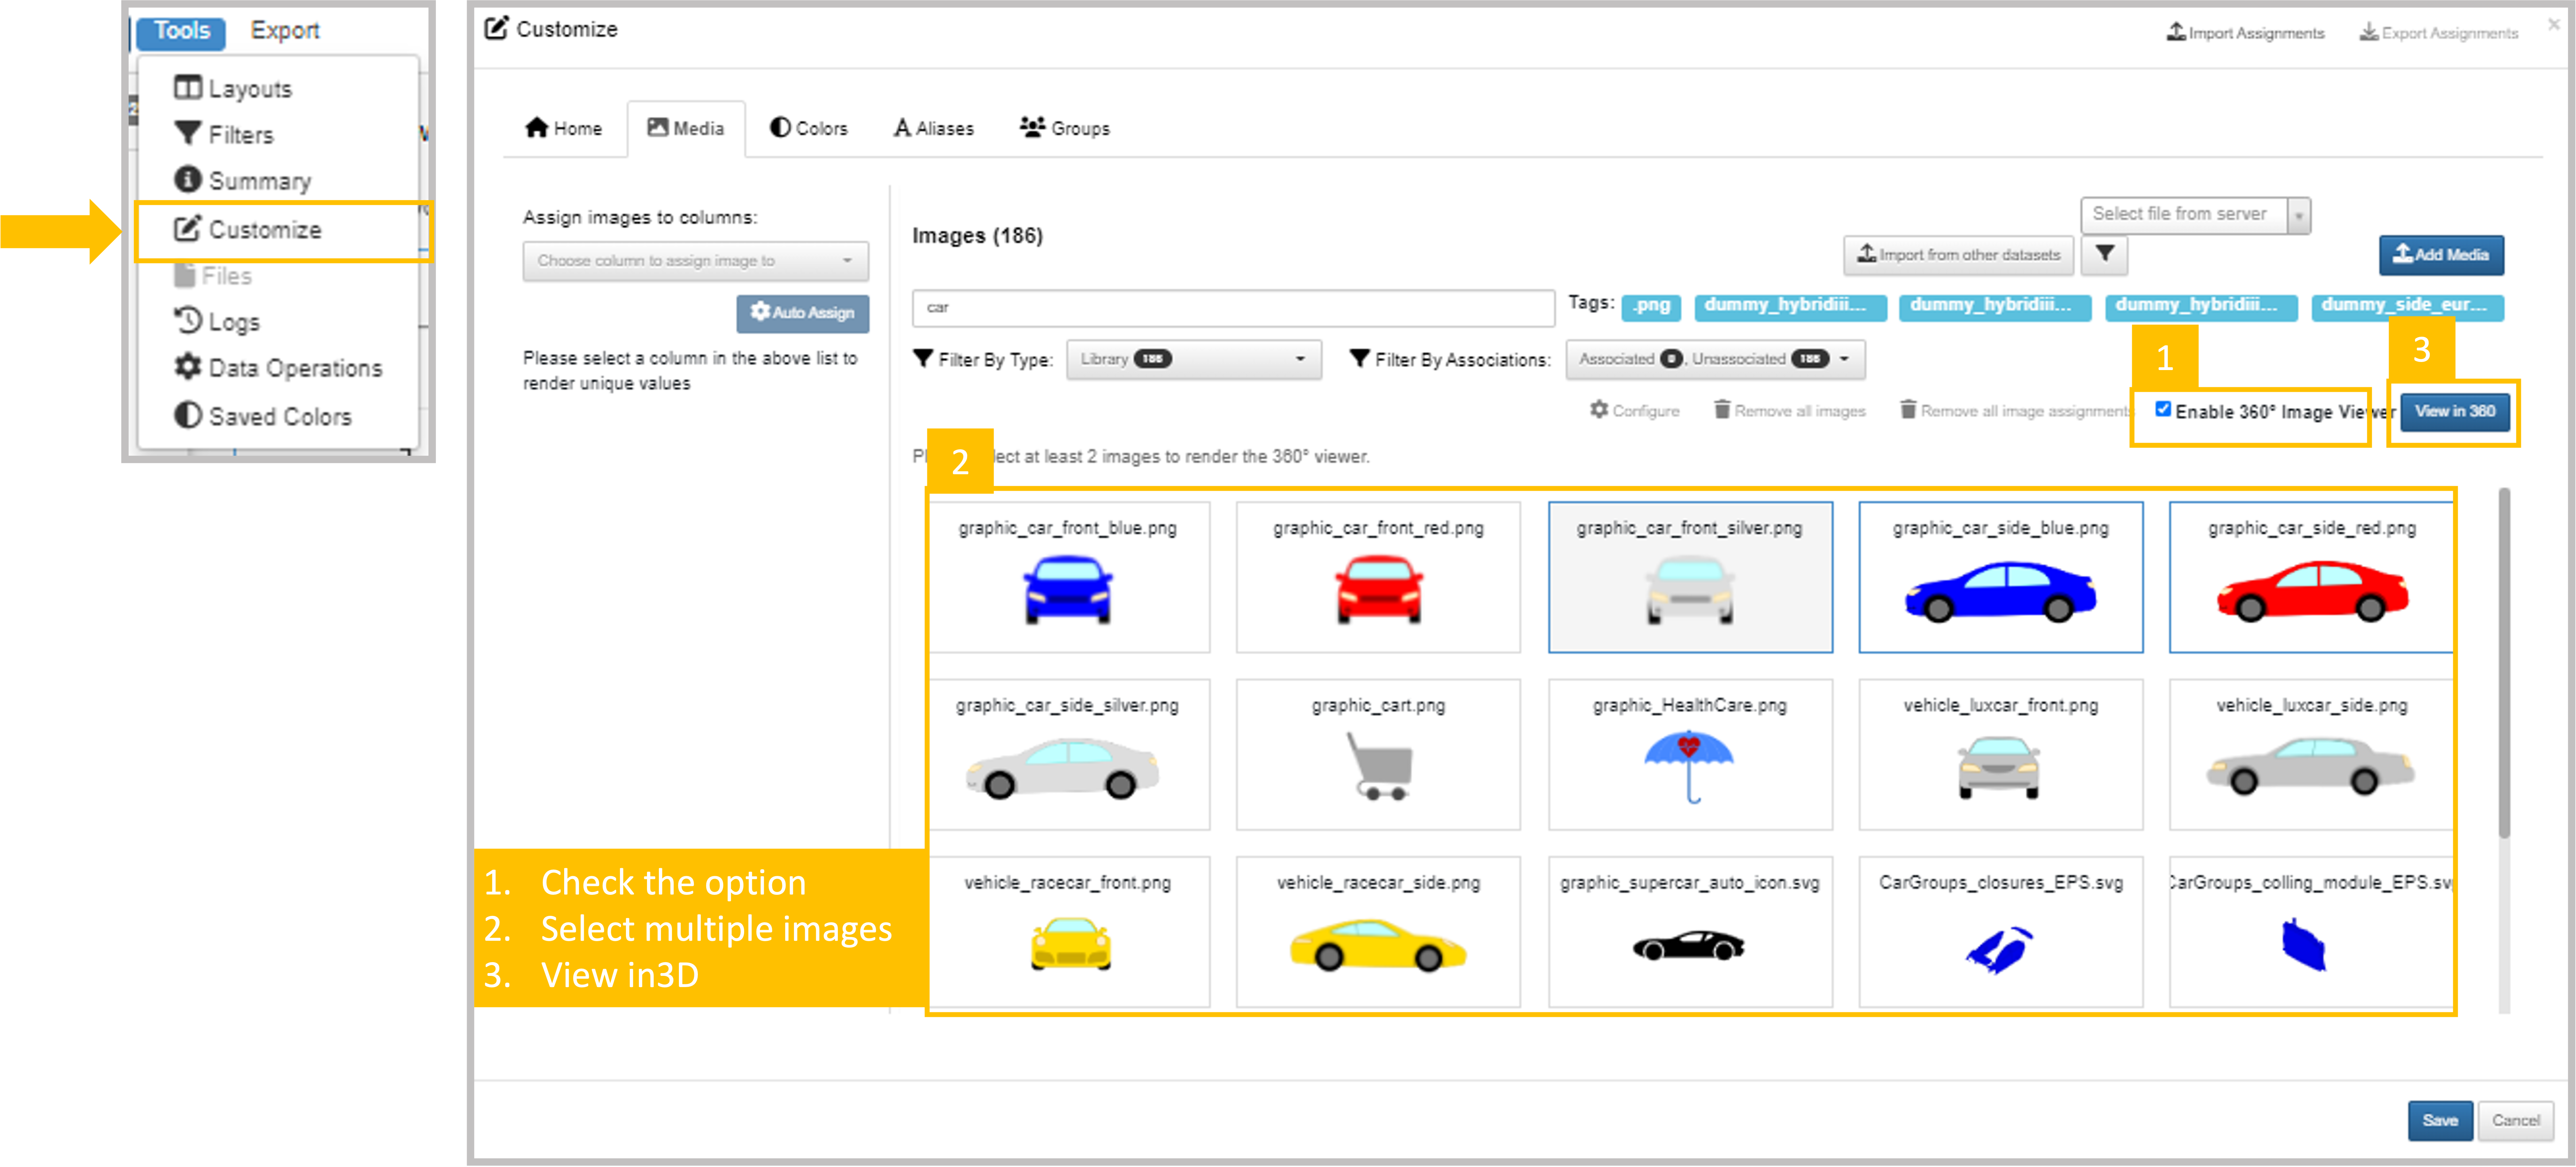
Figure 3: View Media in 360
The Simlytiks media library sometimes receives updates with new images, so make sure to check back for more options!
Uploading & Assigning Media
Now that we’ve taken a look at what media we have, we can add our own by clicking on this option at the top left.
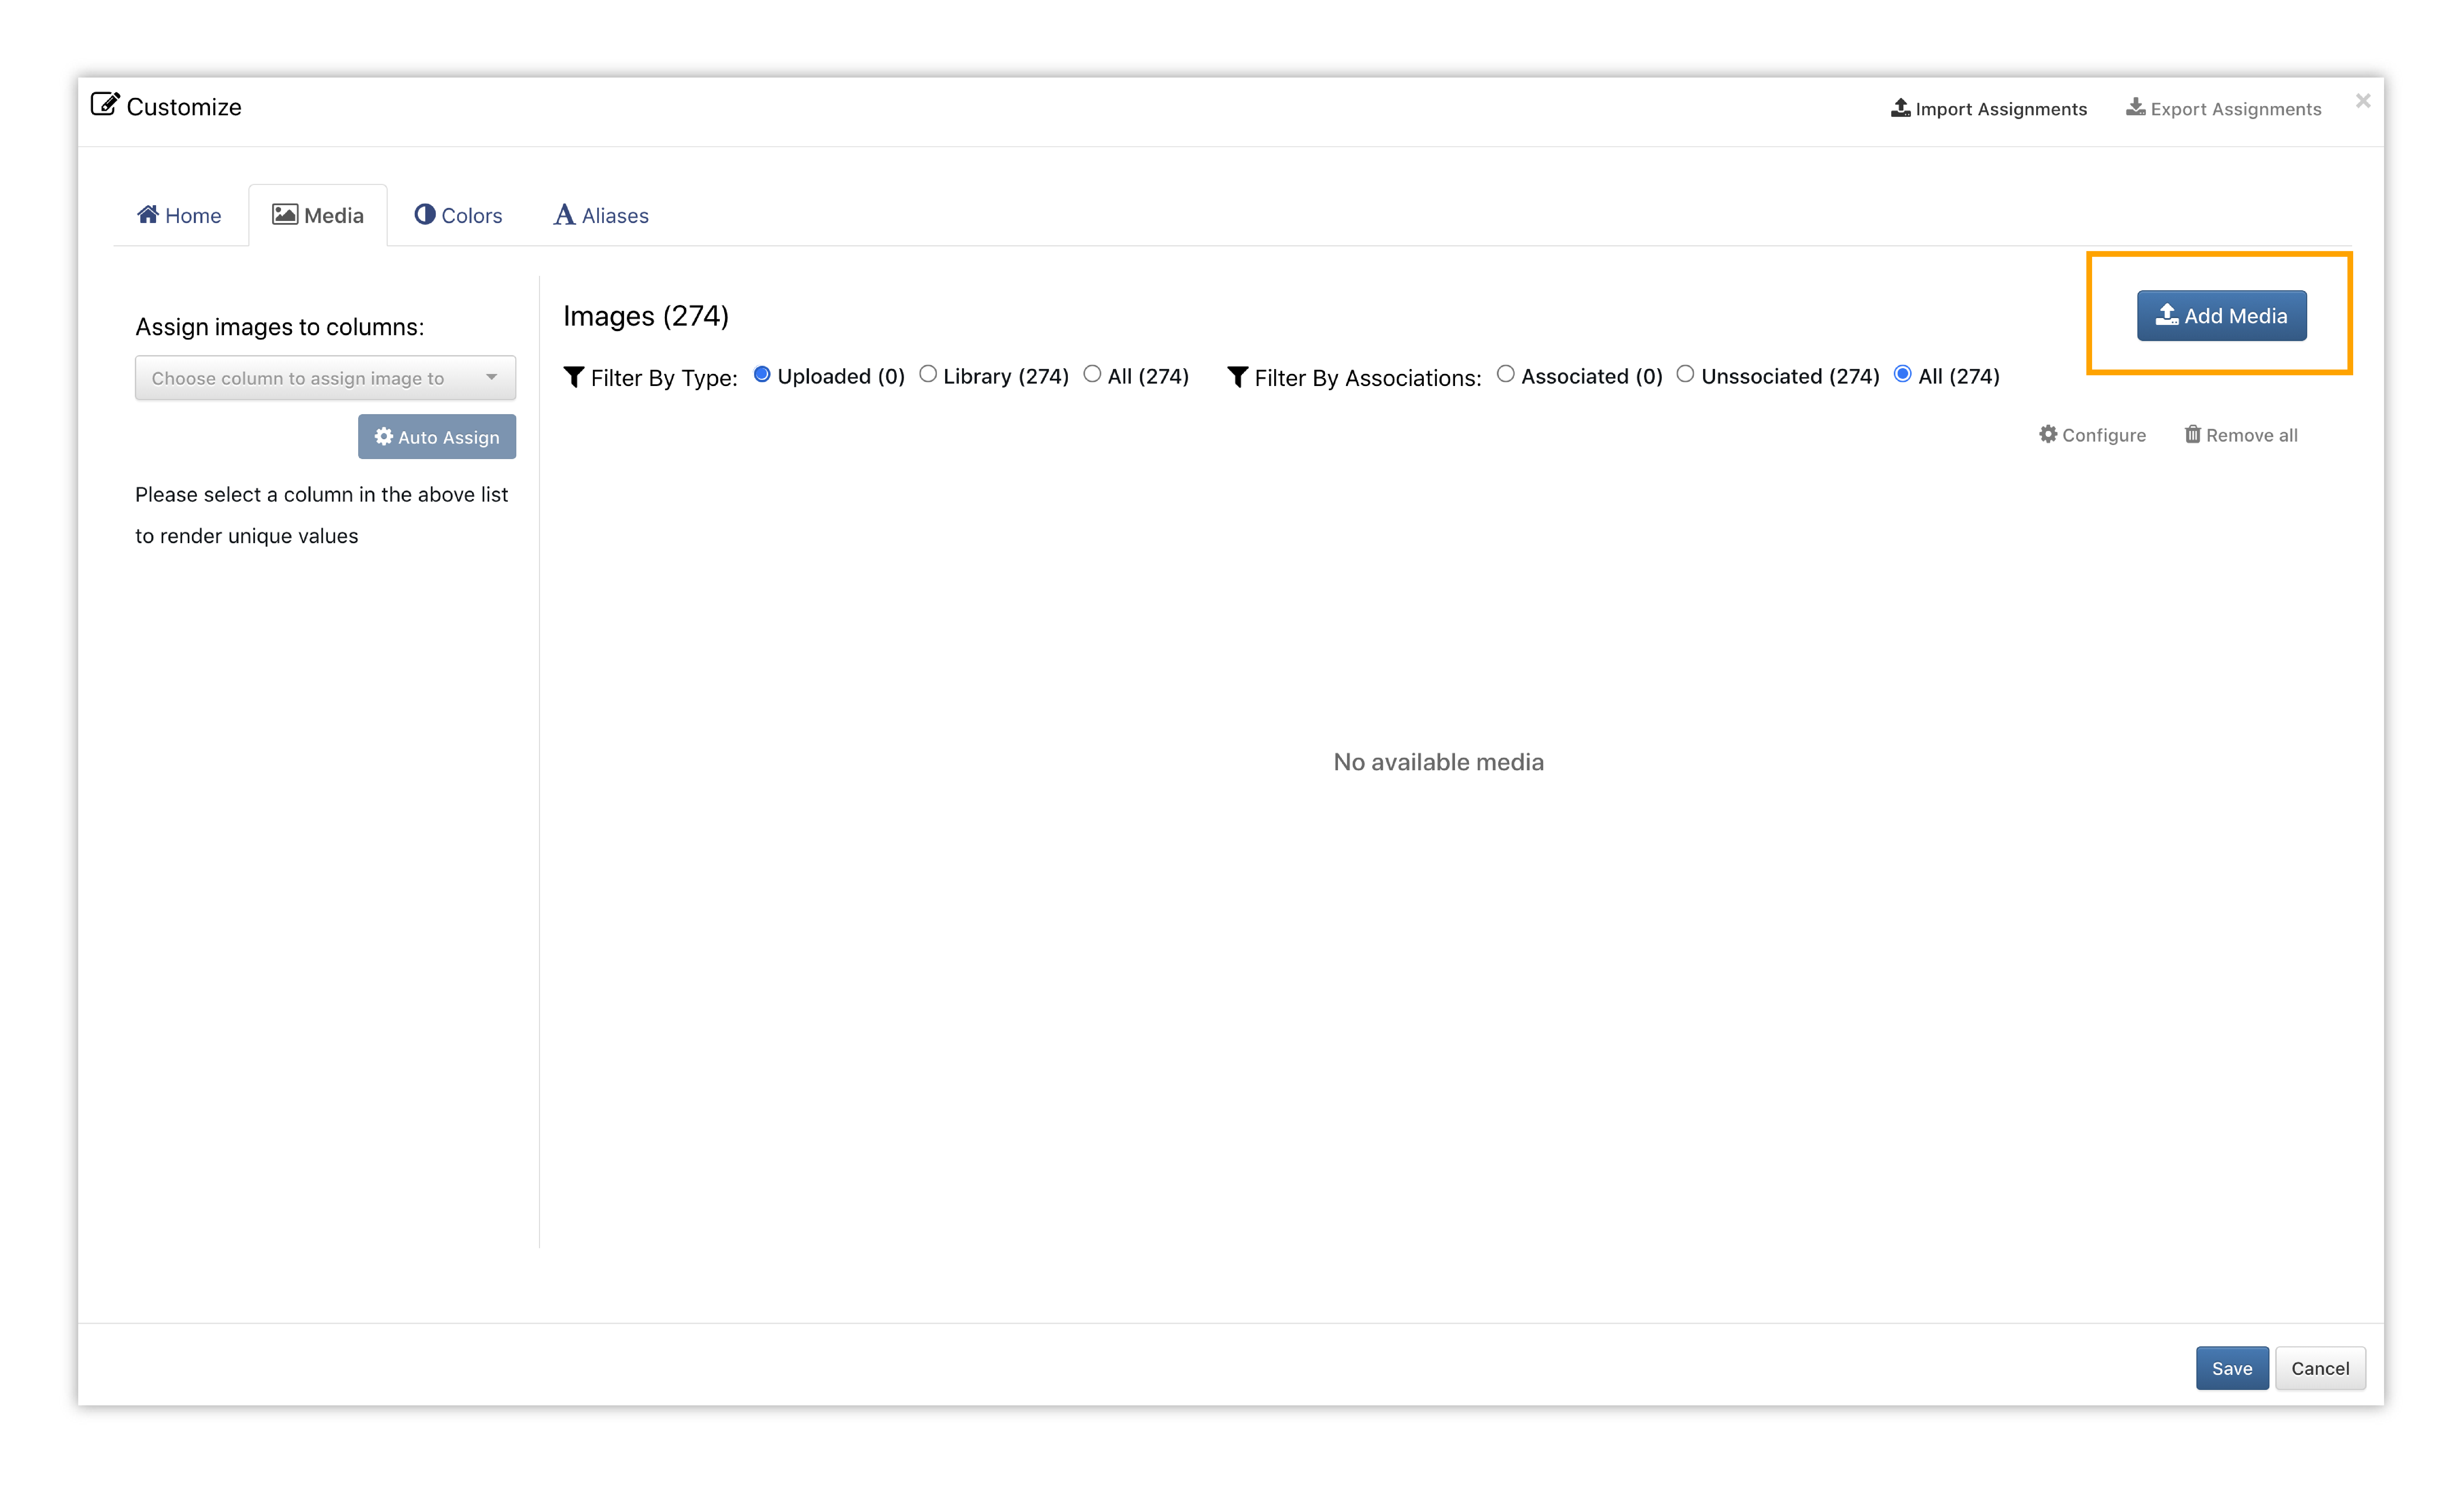
Figure 4: Upload Media
Uploaded images will be added to the Upload section of the Media tab. We’ll then choose a data column in the drop-down from which to assign our newly uploaded media.
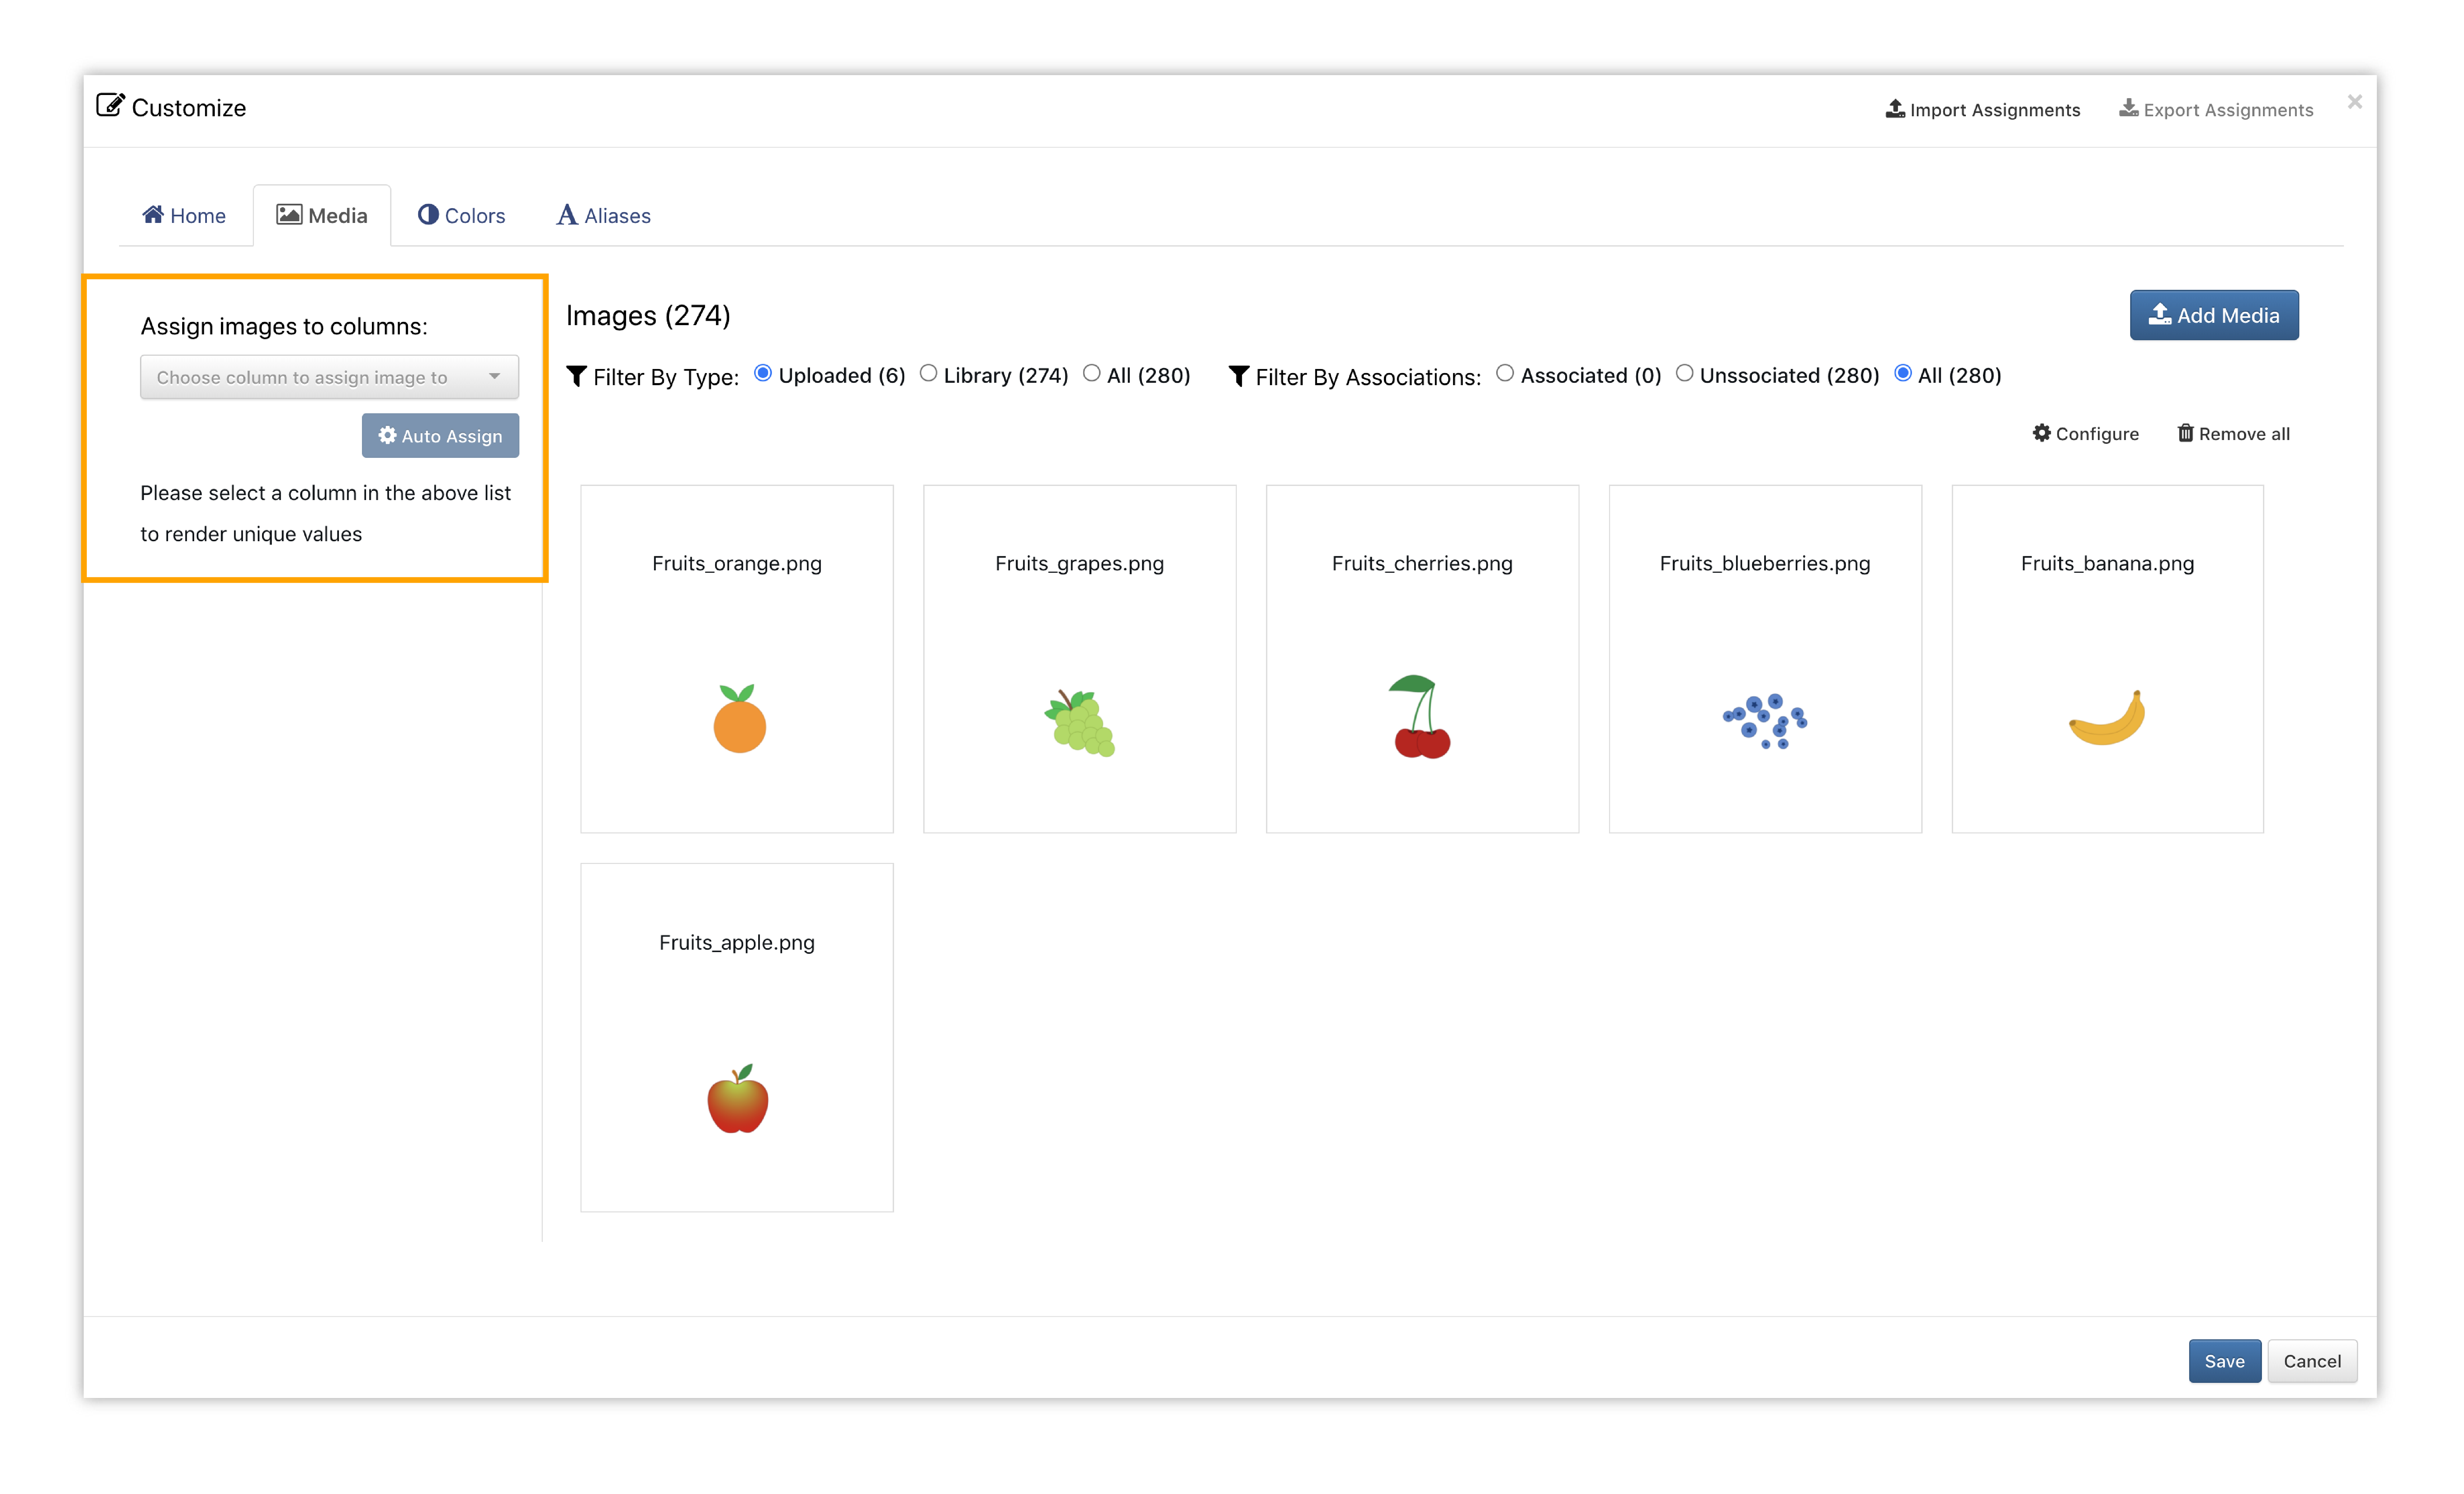
Figure 5: Choose Data Column
This will bring up the data entries for that column for us to drag-and-drop onto the images. If our media has the same names as our data column entries, we can also choose to have Simlytiks automatically assign them by clicking on Auto Assign.
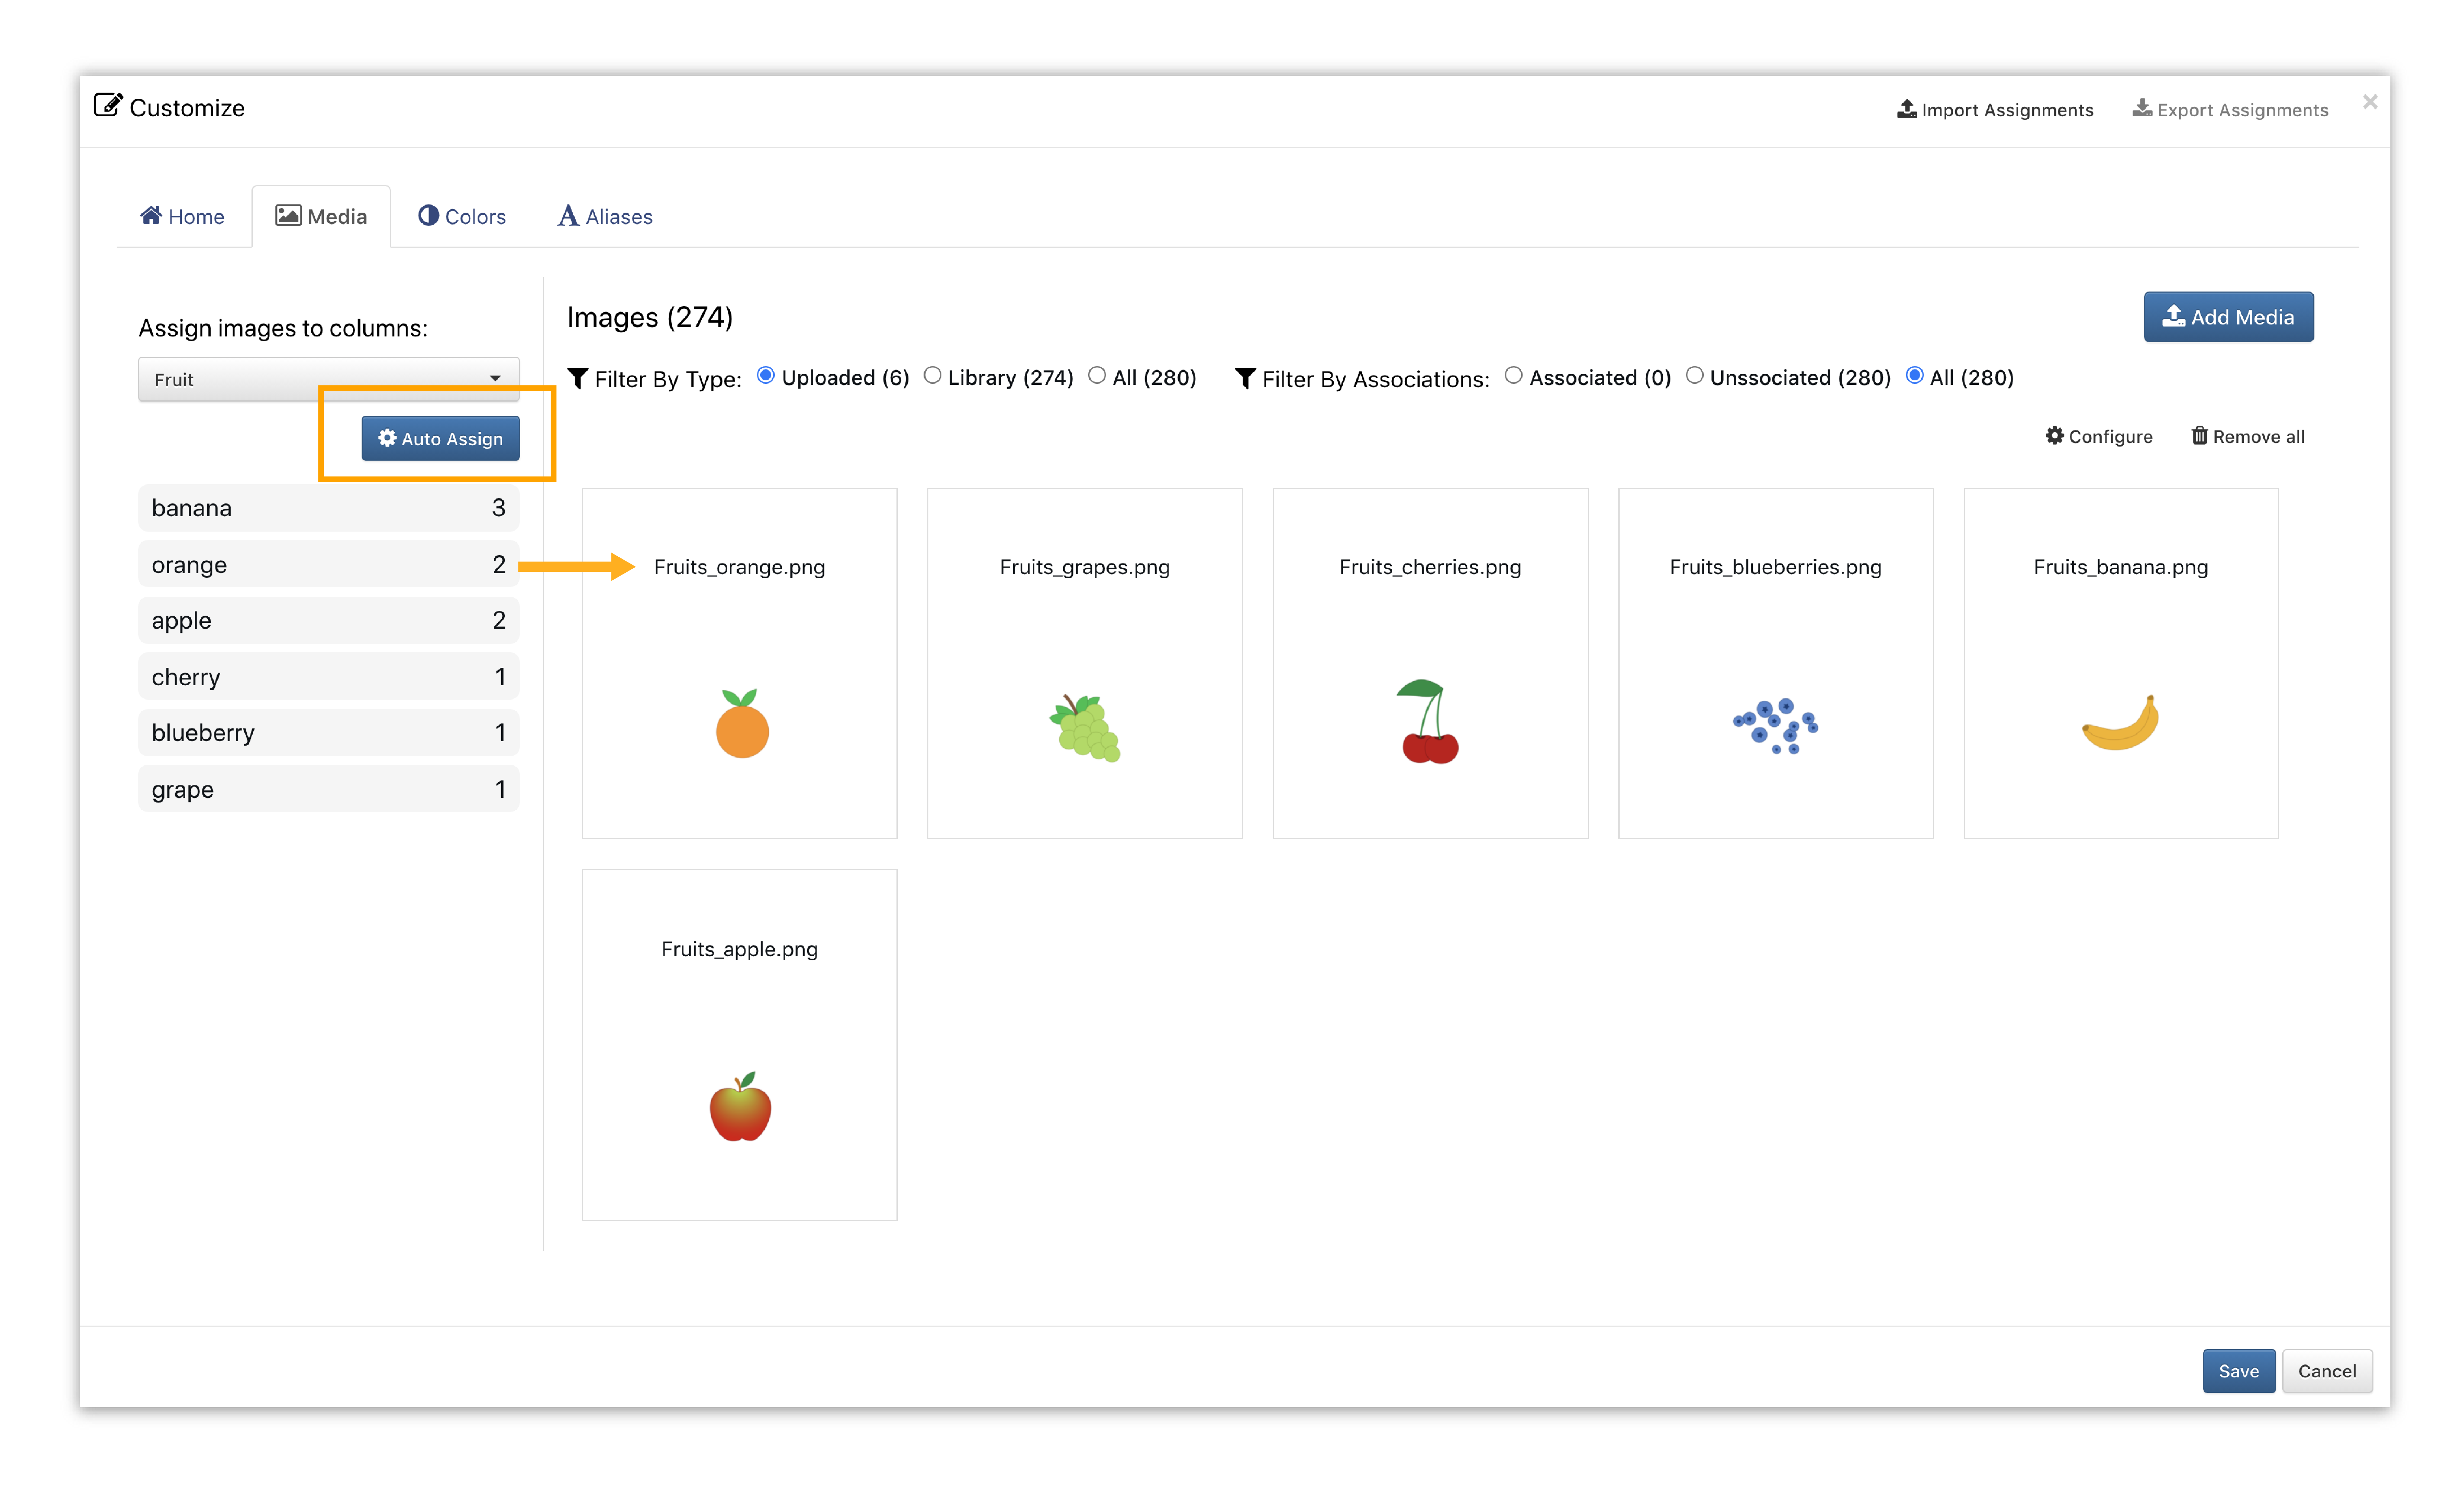
Figure 6: Data Values to Drag-and-Drop
Here is how we assign data values onto the fruit images.
Make sure to finish by clicking Save.
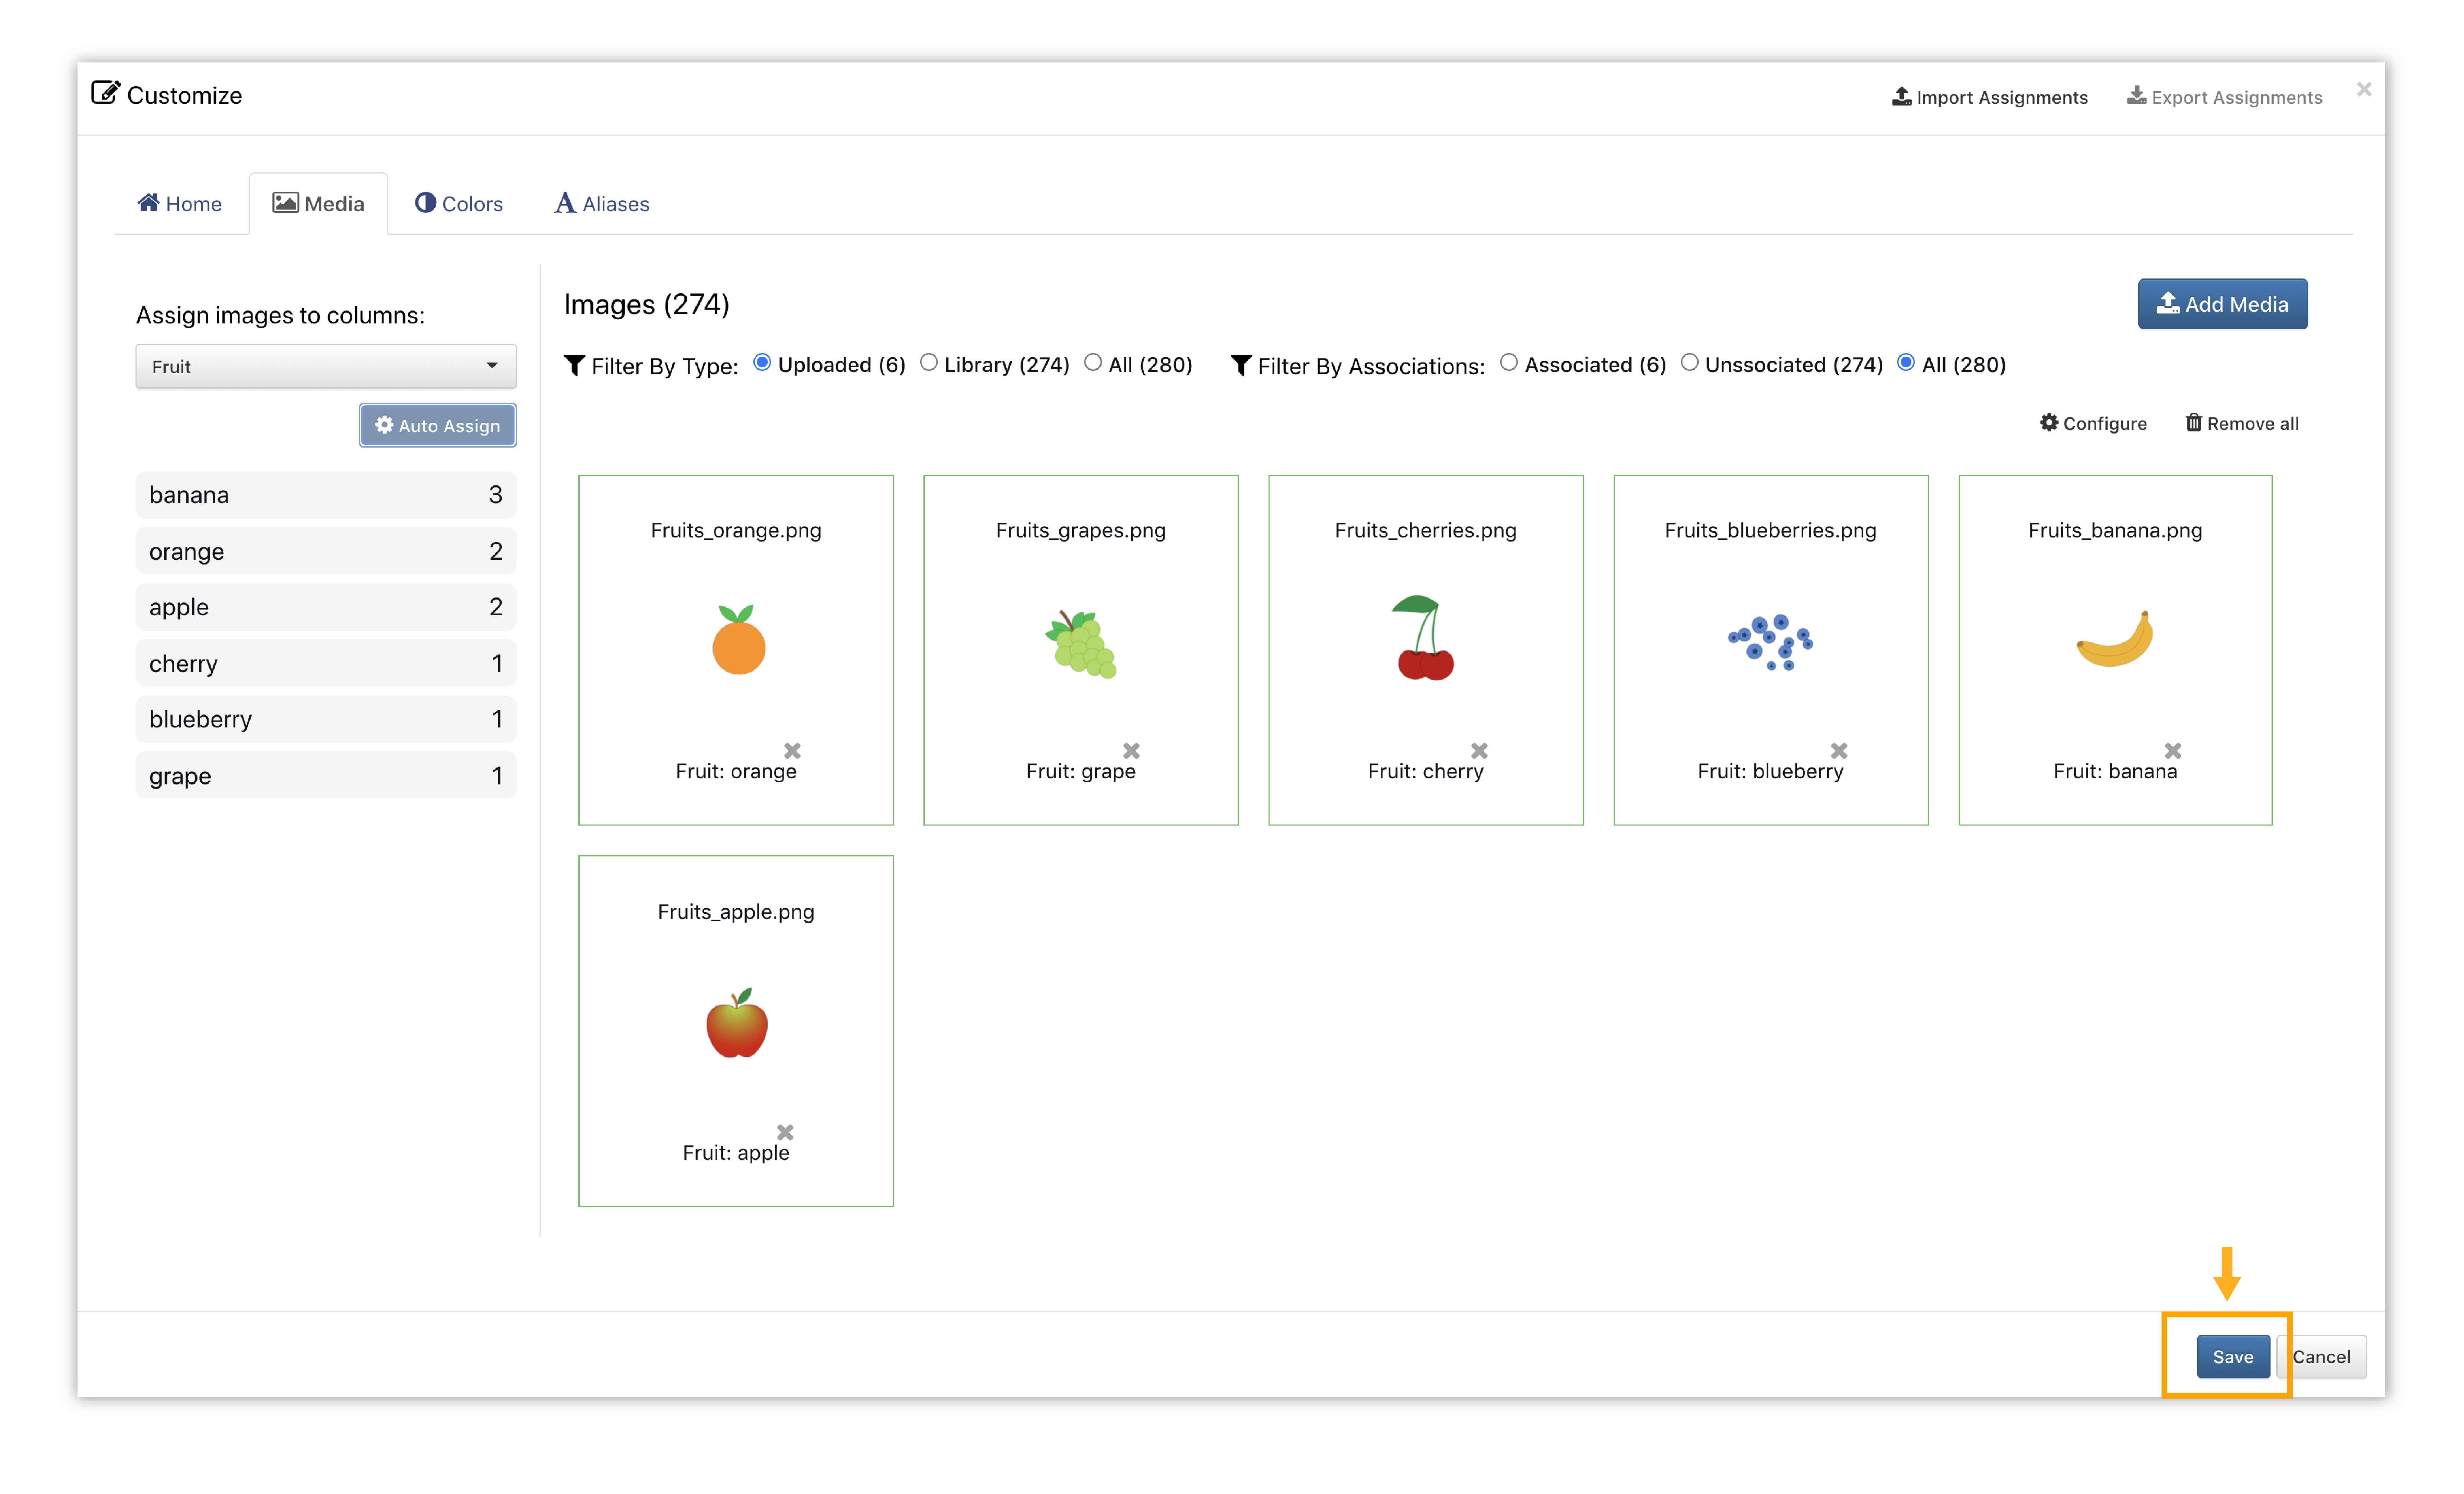
Figure 7: Click Save to Finish
Search Bar
NEW as of January, 2022: You can now use tags or the search bar to find particular media files in the media library.
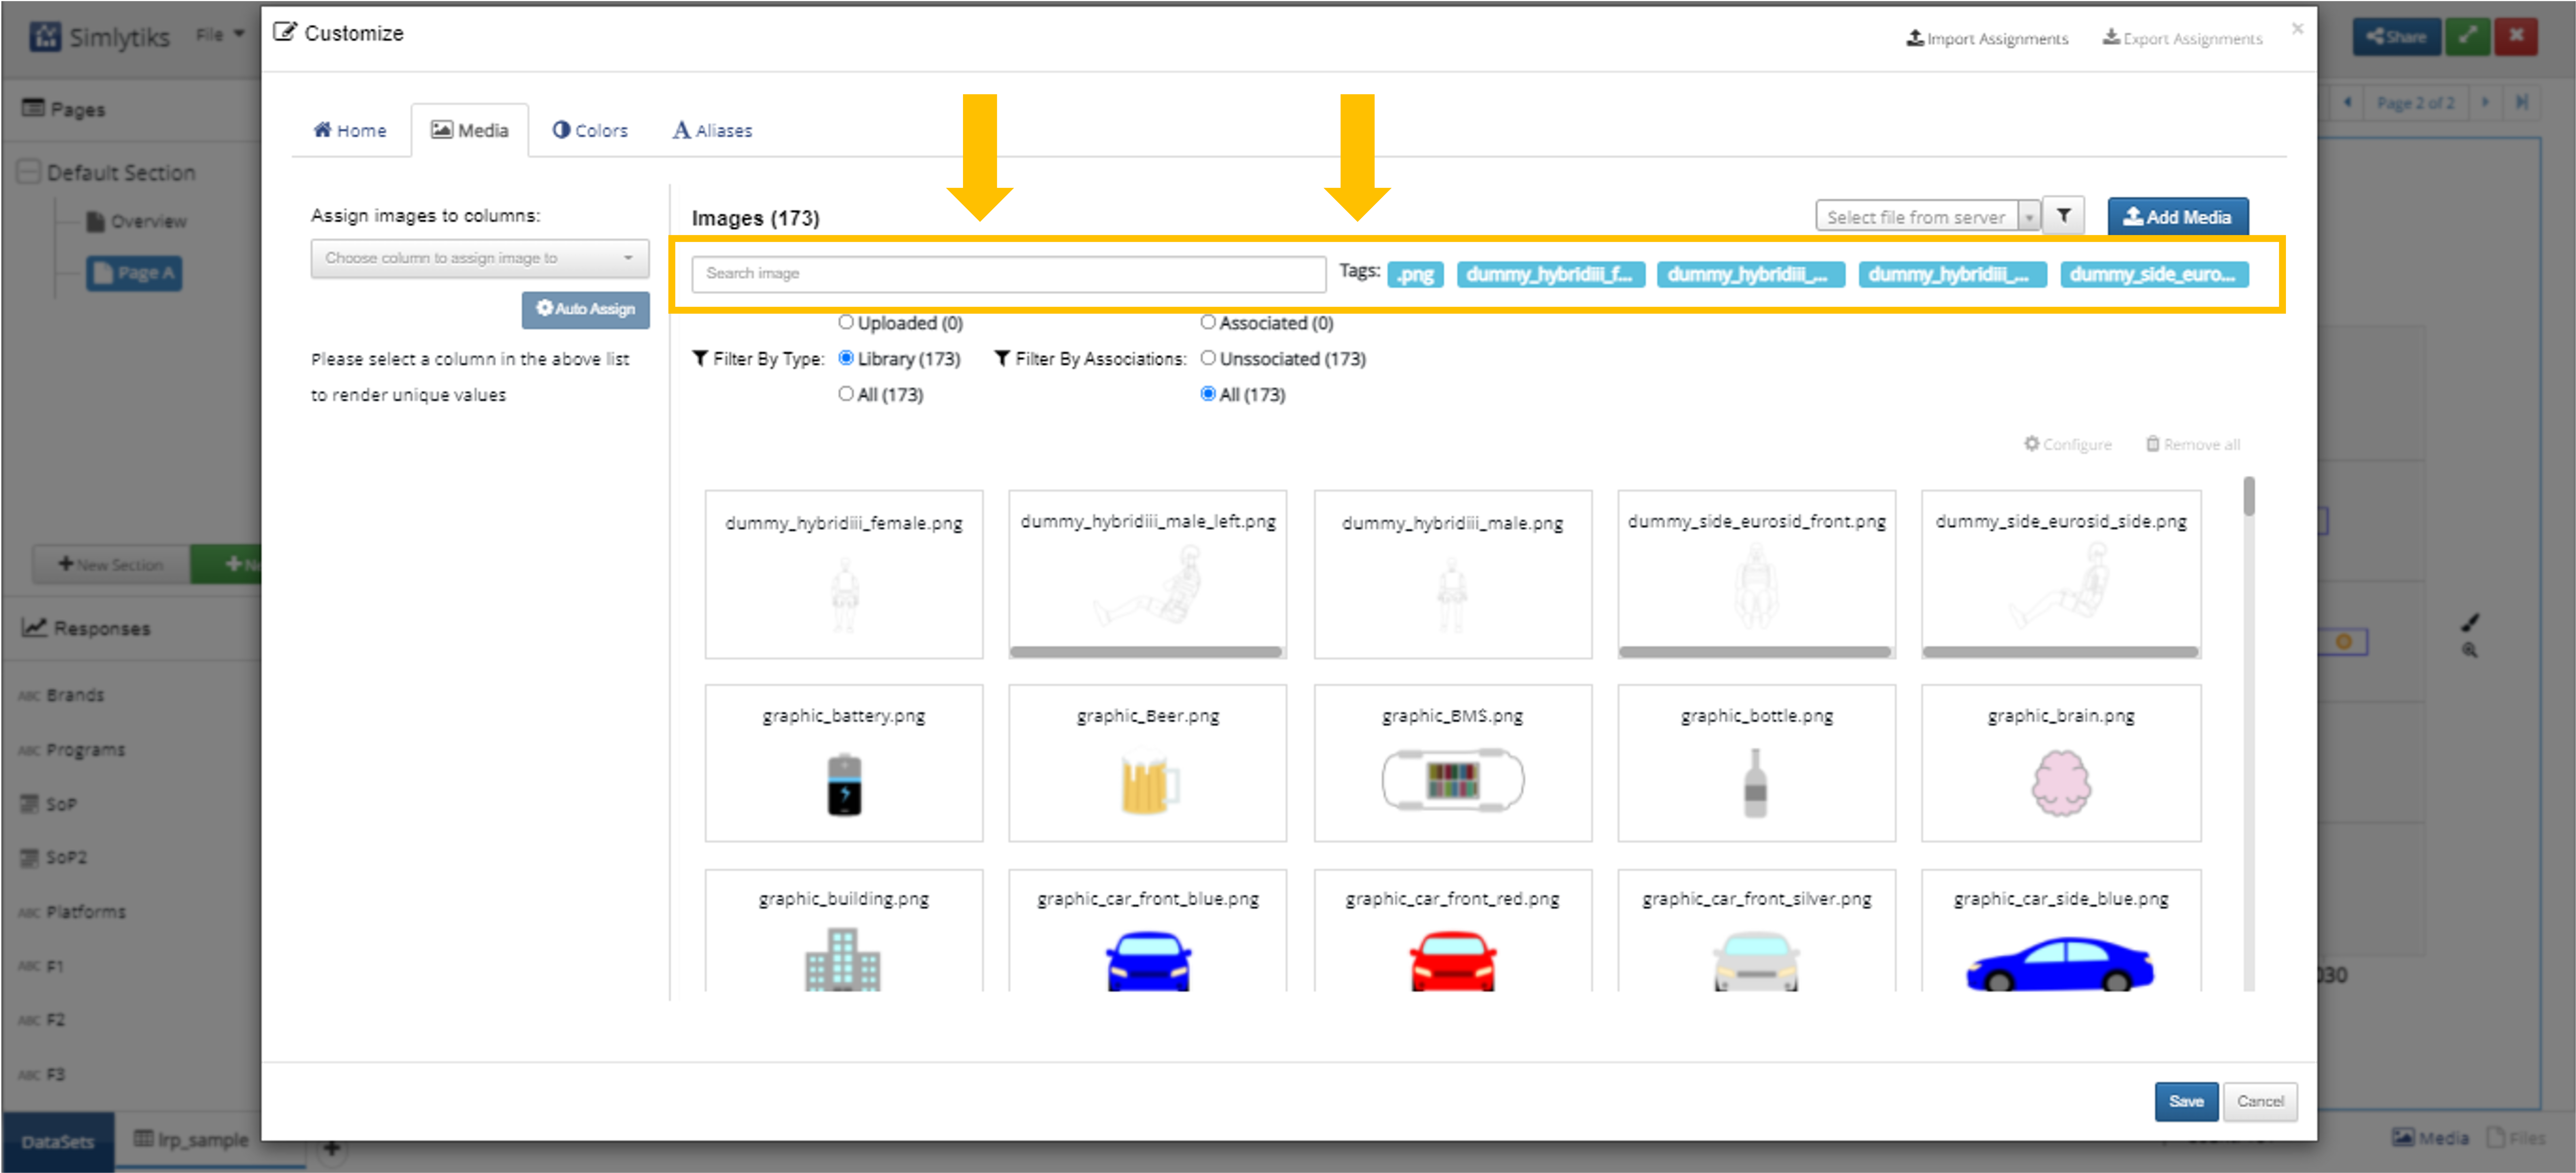
Figure 8: Search in Media with Tags
Delimiter
NEW as of September, 2022: You can use a delimiter to separate records that may be grouped together via a space, comma or semi-colon. Choose which delimiter to employ under the chosen data column. In this example, we will choose a comma since our records have data separated by them.
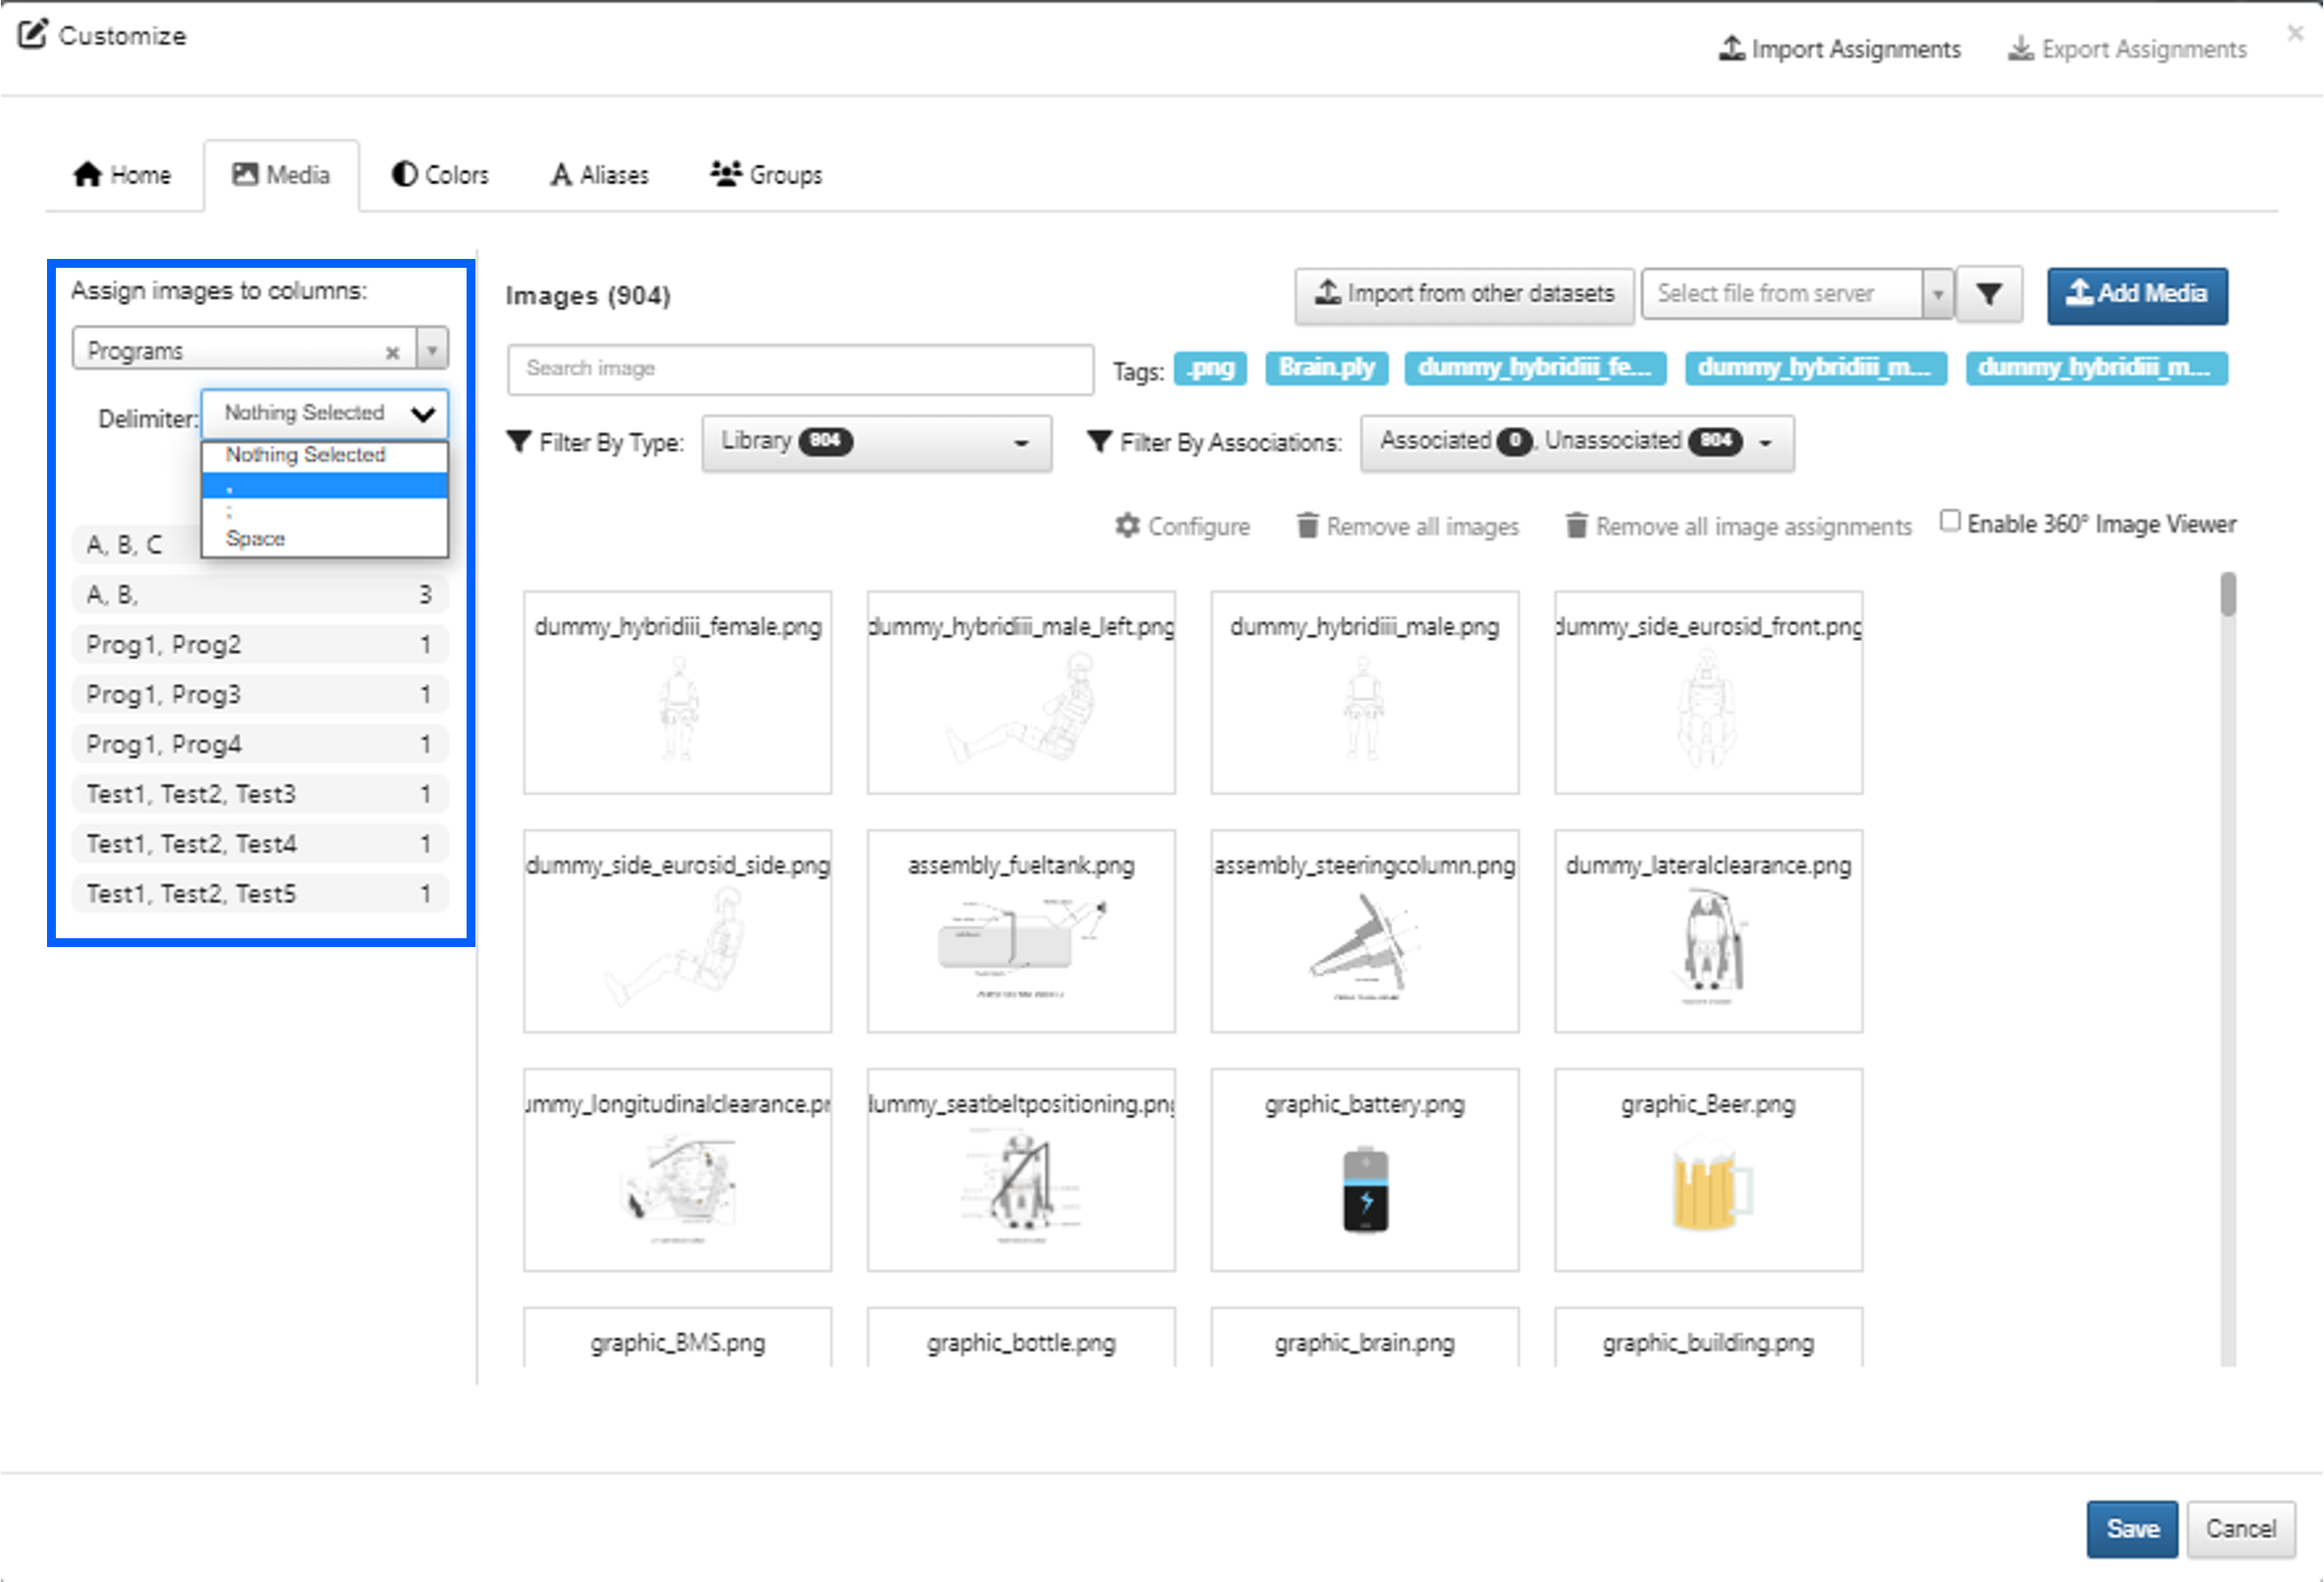
Figure 9: Media Delimiter Options
After choosing the comma delimiter, we can see we have expanded our data into separate records to be assigned to media individually.
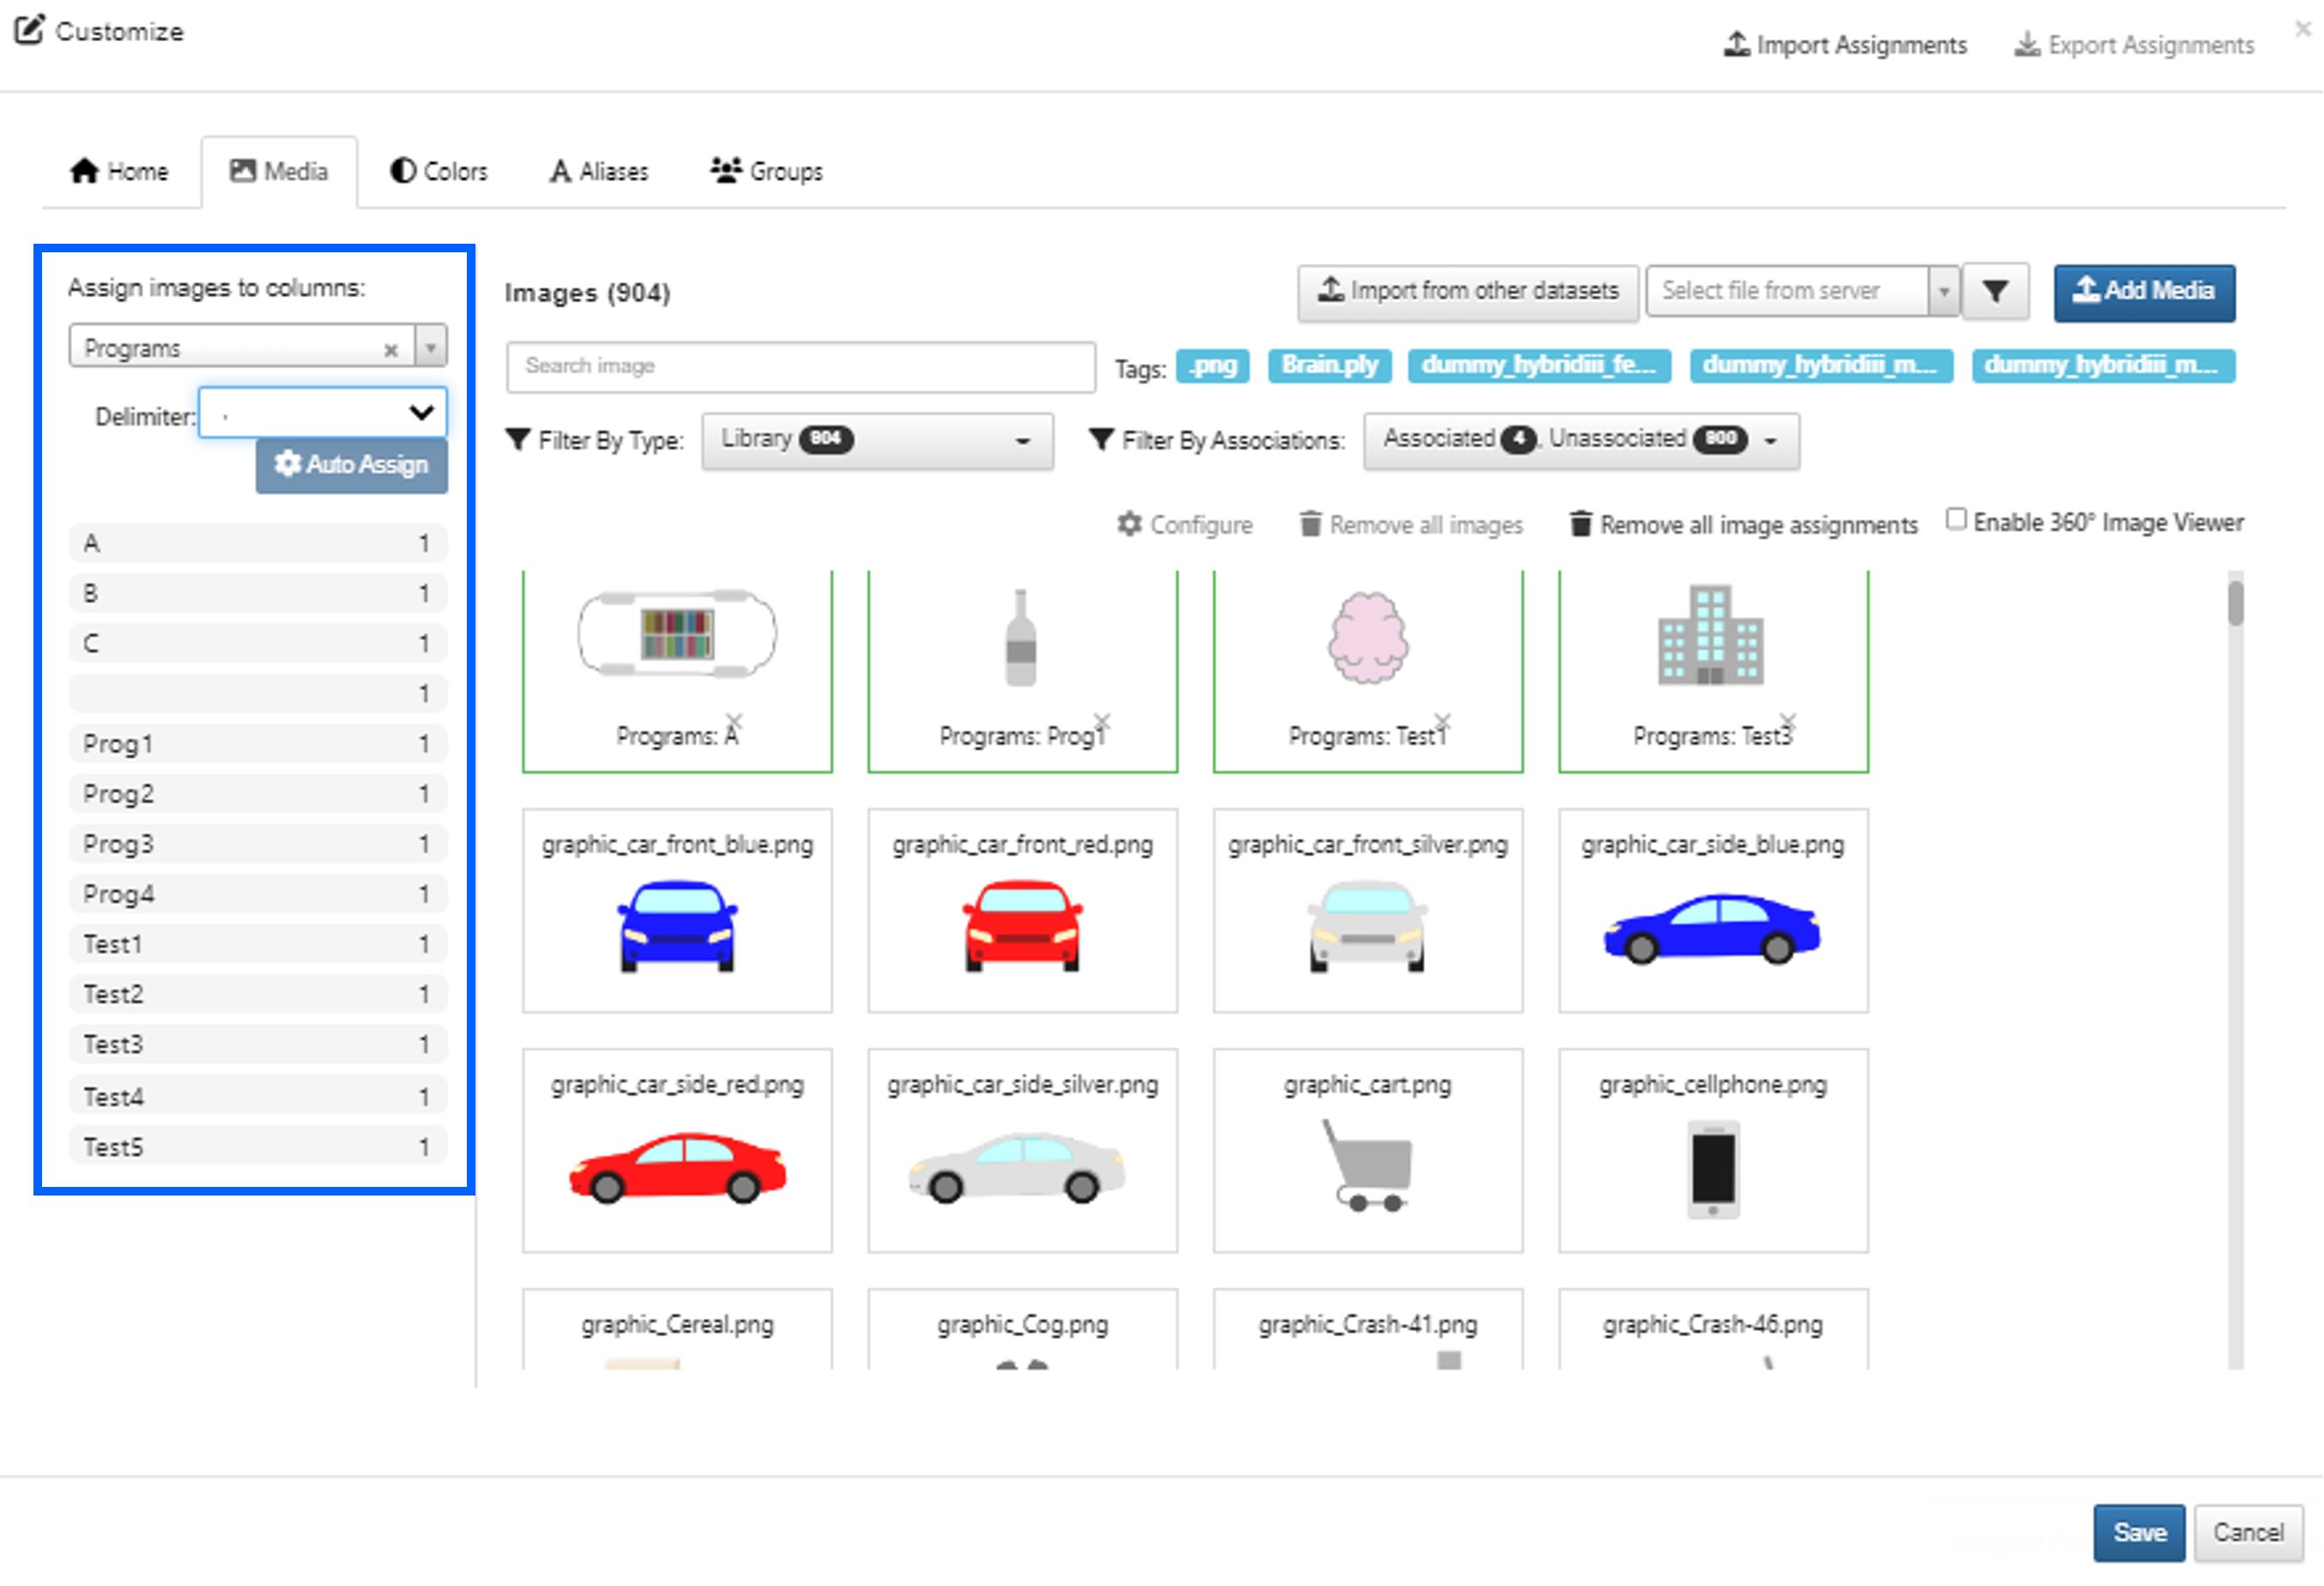
Figure 10: Separate Records Created via Comma Delimiter
Adding Media to Charts
Now that we’ve assigned our media to data, let’s see how this enhances our charts.
This example of the bubble chart shows the fruit images as the Y axis ticks since we chose Fruit as our Y data.
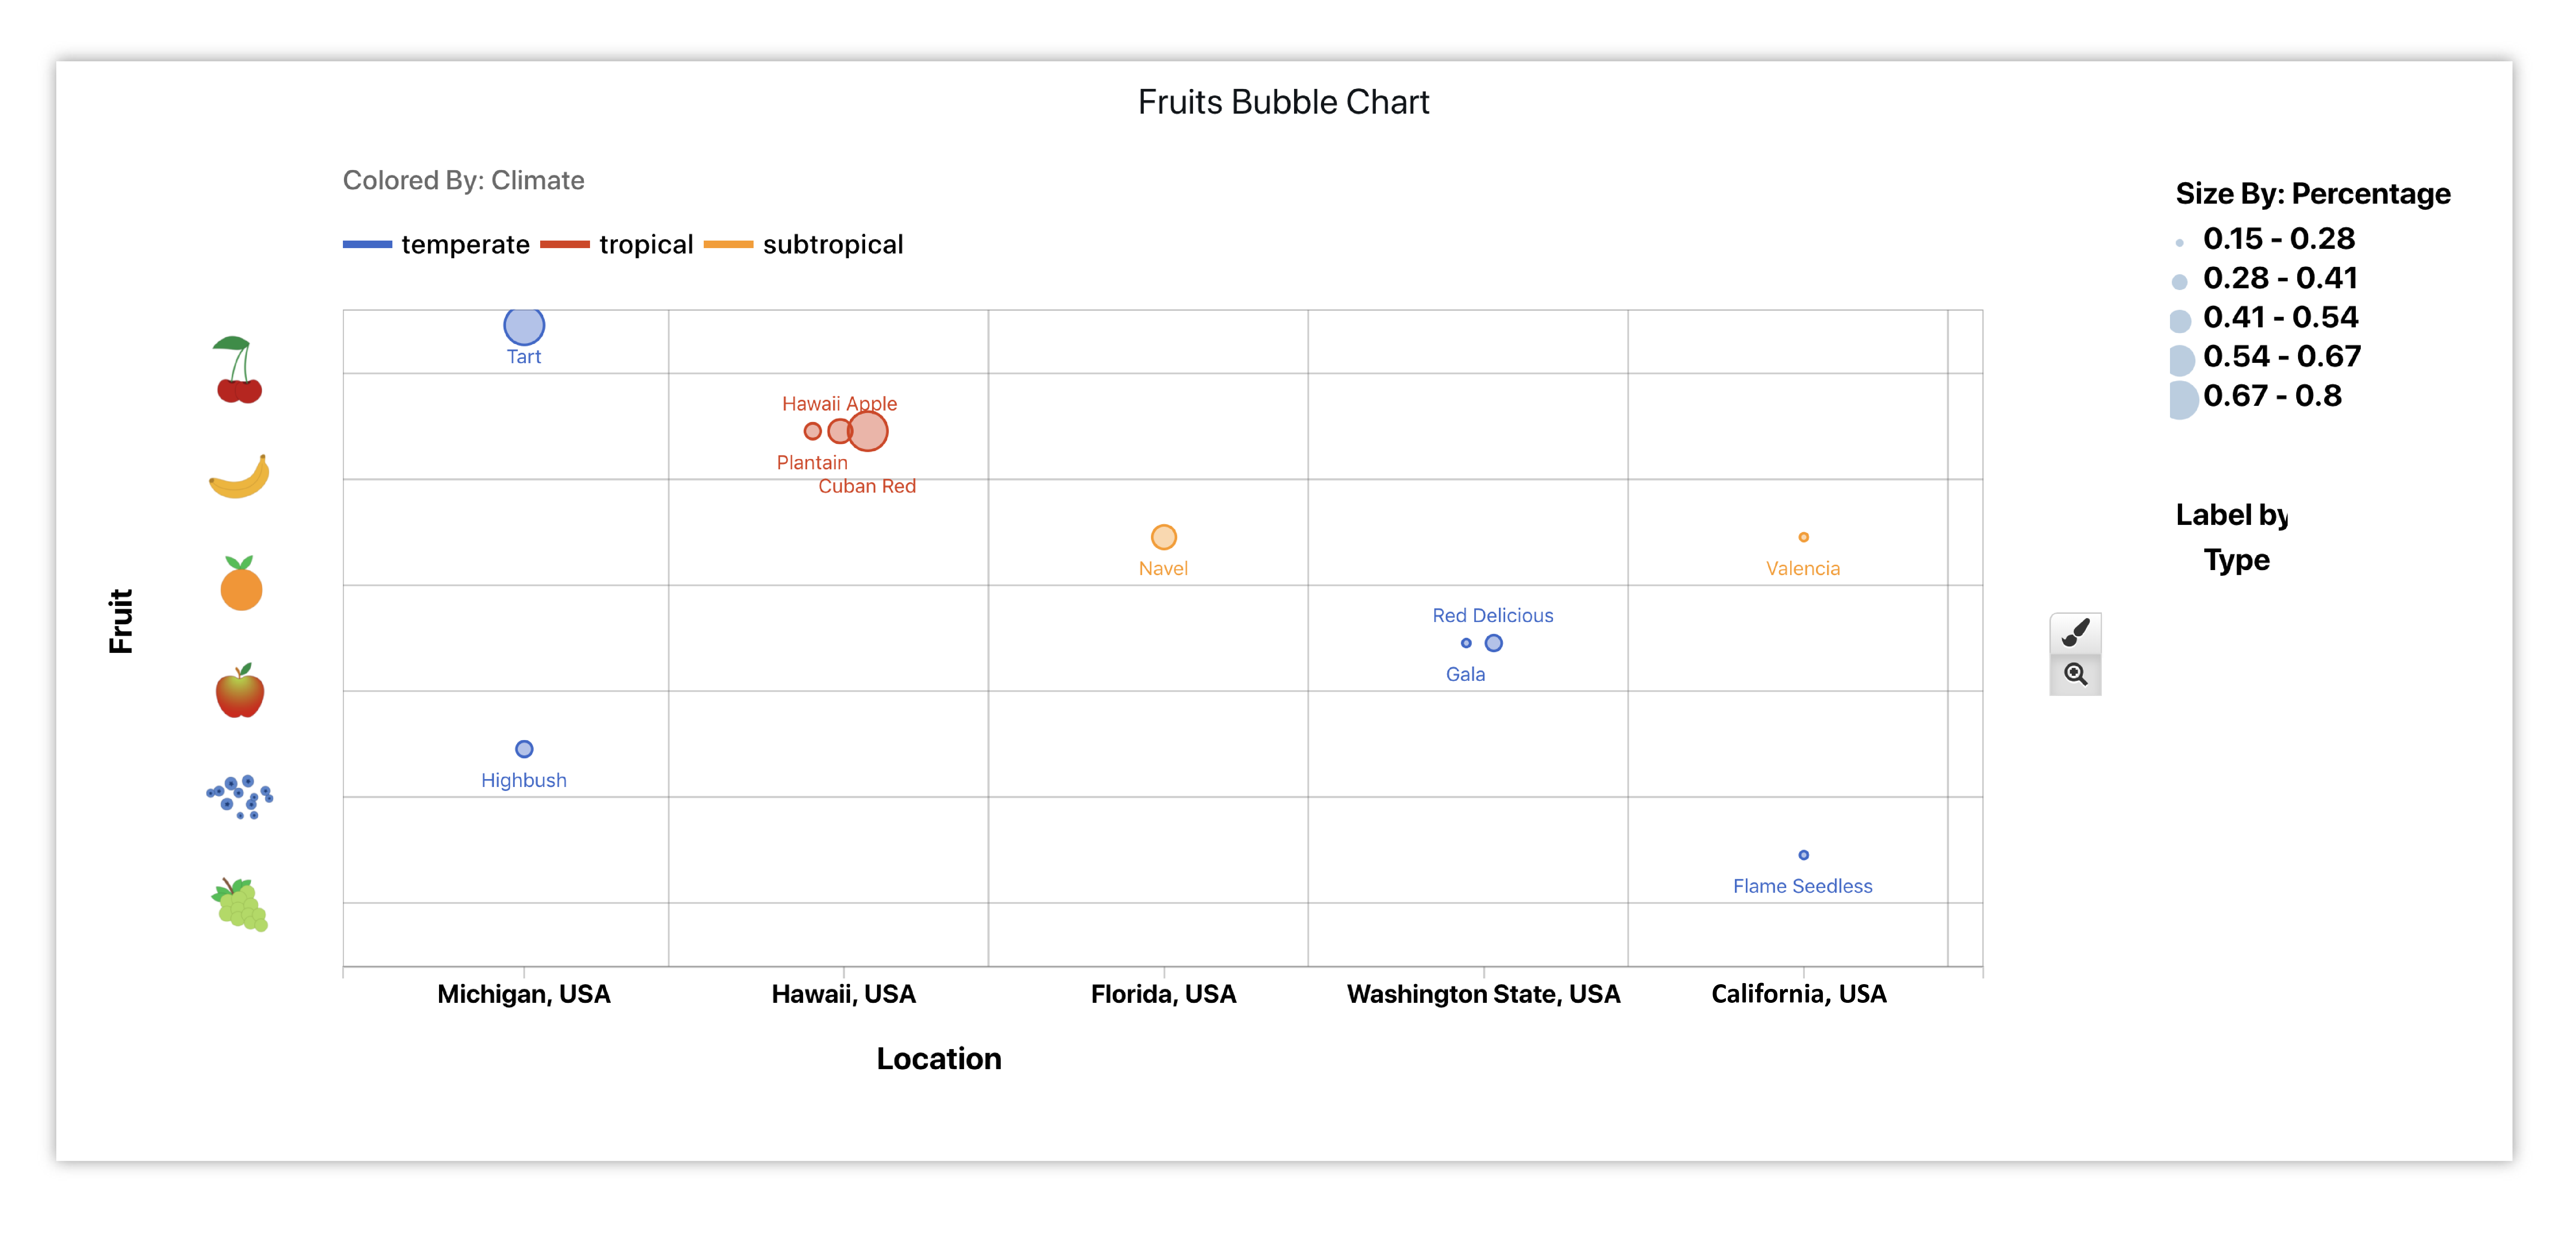
Figure 11: Fruit Bubble Chart with Media
Some charts have options to choose an image for aspects of the visualization. This can be implemented under visualization options when setting up or editing them. We can choose from images already included in a dataset column, the already built-in images, or we can upload our own.
This example of the bubble chart shows the assigned fruit images as the nodes.
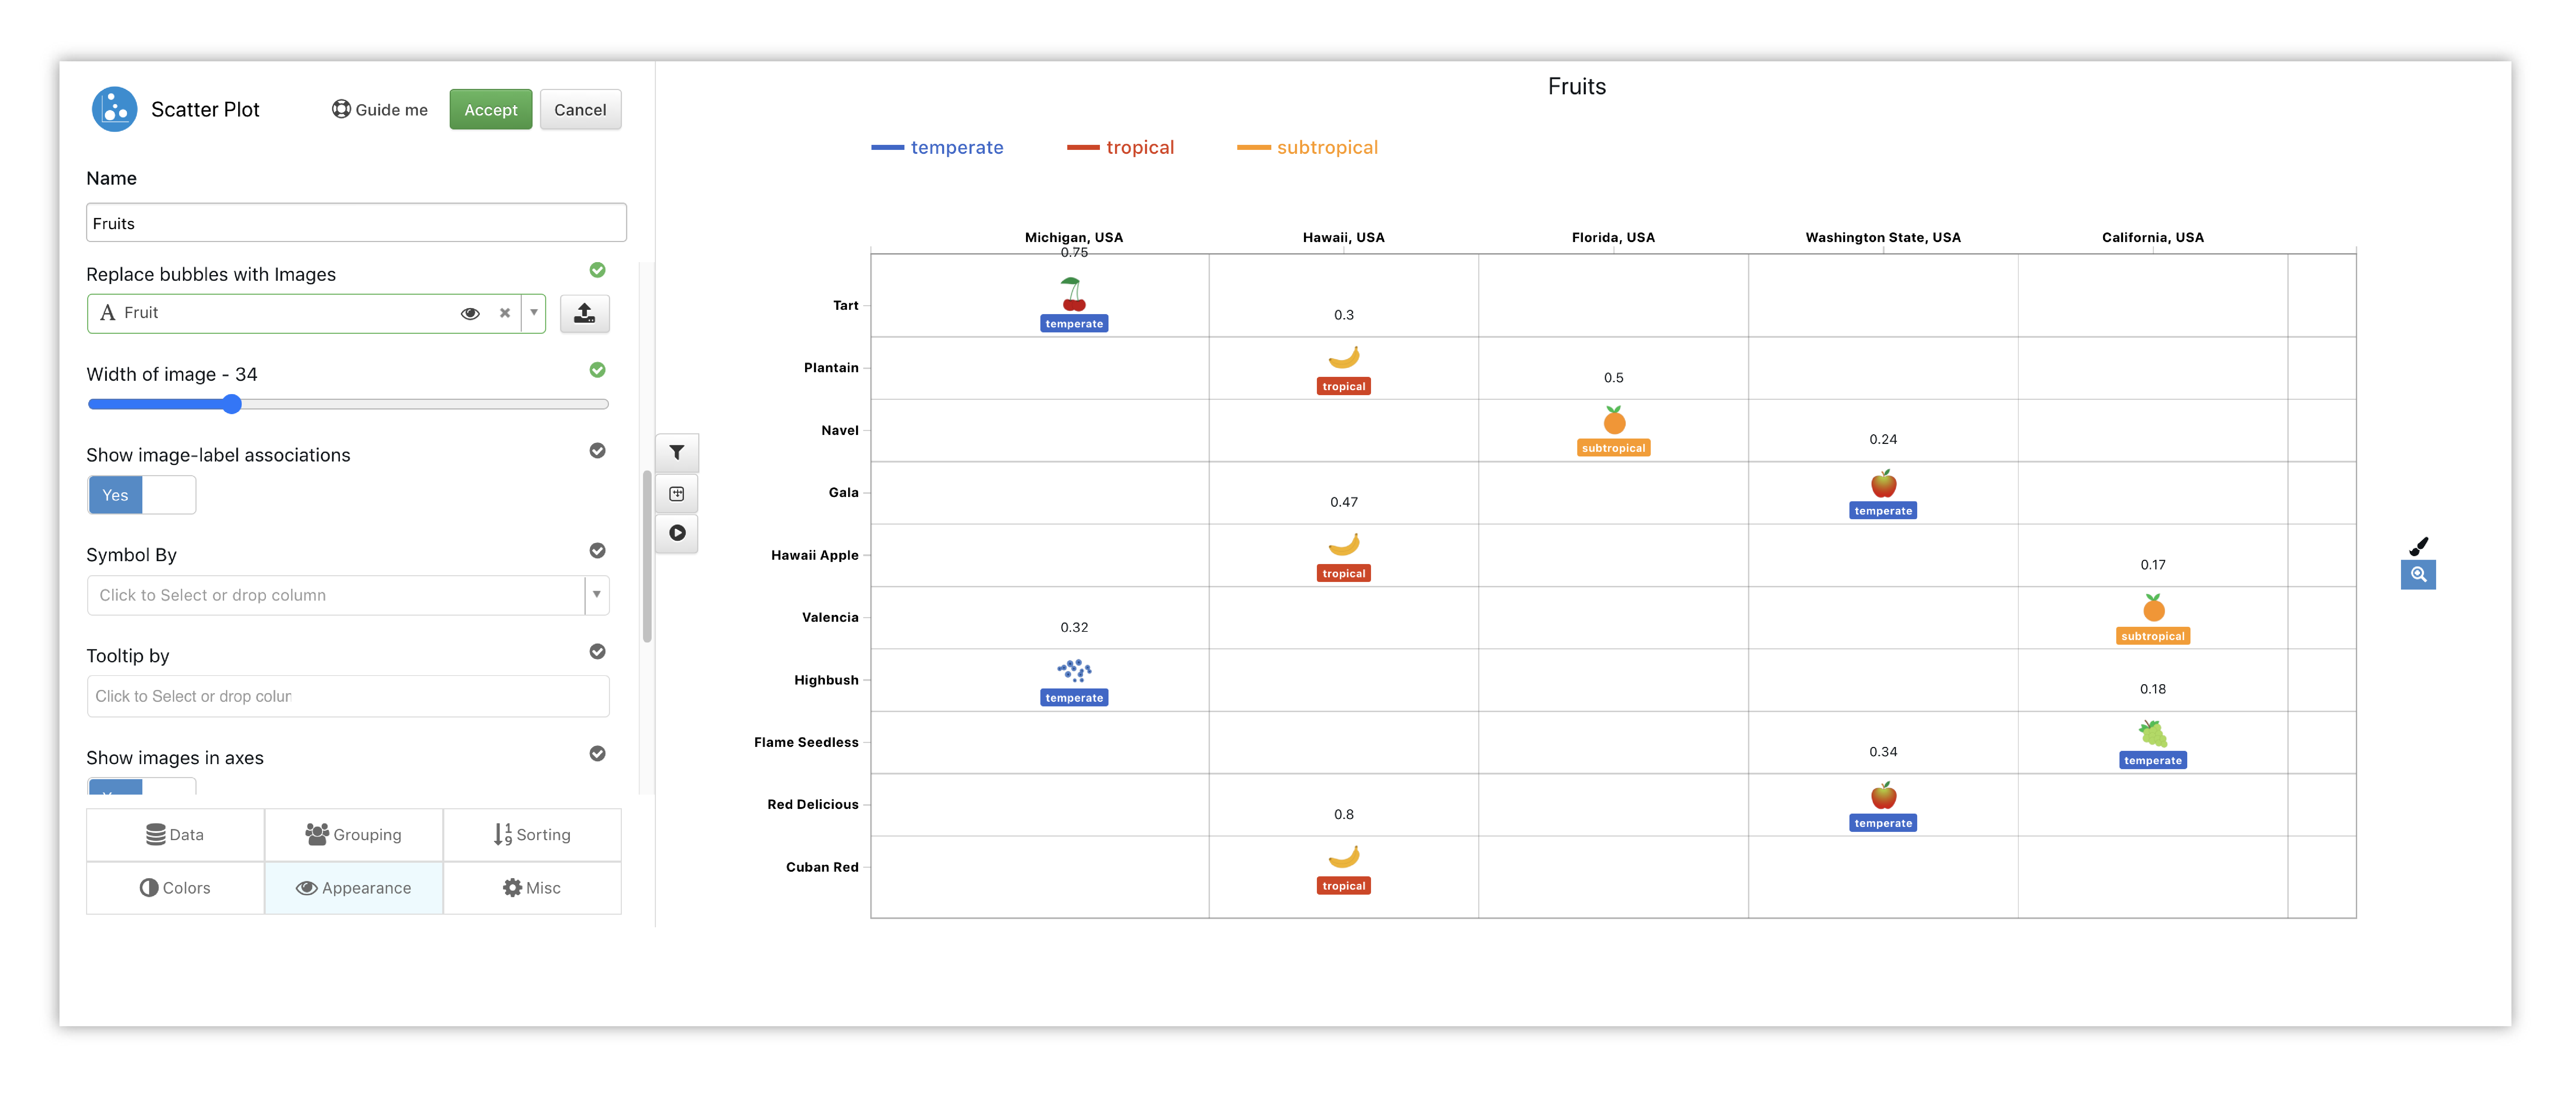
Figure 12: Image Option in Bubble Chart
Assign Media to Data Column Schema
Under Tools -> Customize -> Home, assign an image to a data column by clicking or dragging onto the drop box for the desired column.
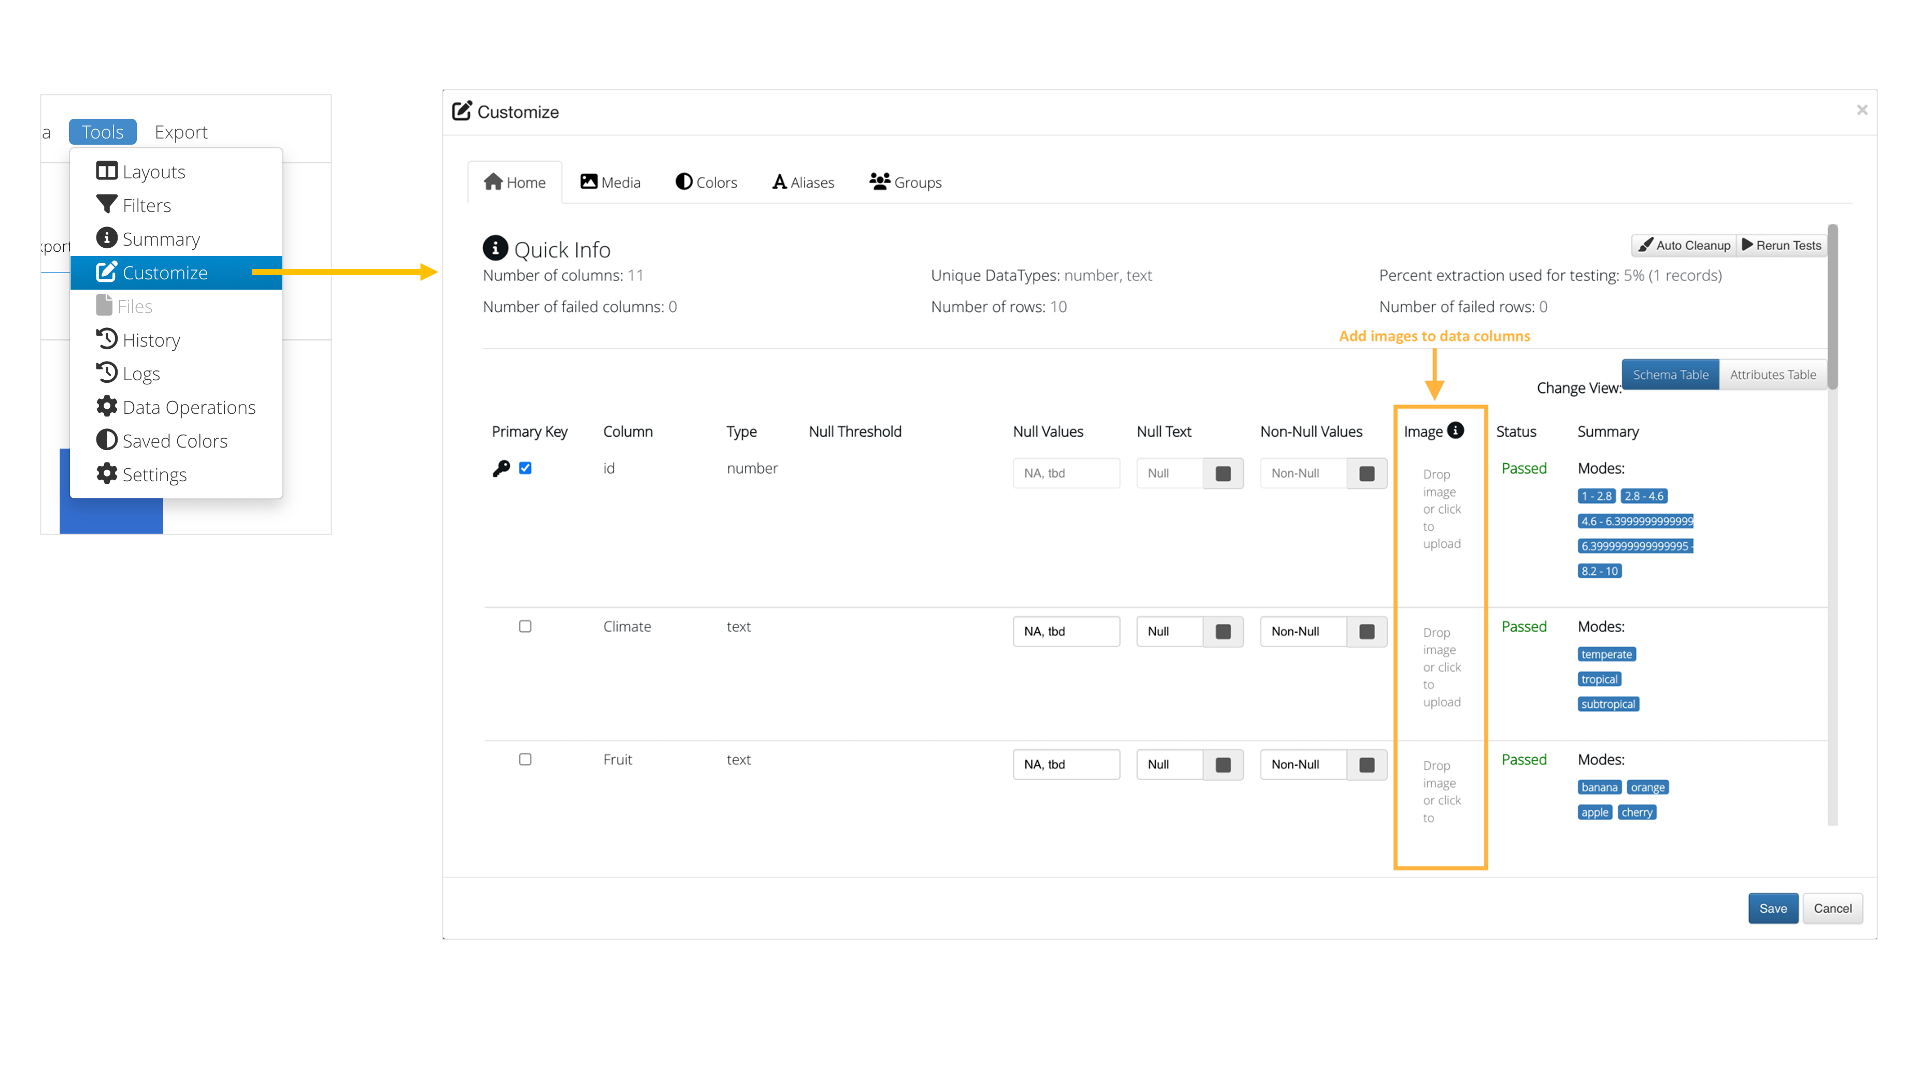
Figure 13: Assign Media to Data Column Schema
To learn how to add charts for implementing the above, please move on to the next section, Charts.