23.  Saving
In this section, we’ll review how to save an explorations and how to access and manage our saved dashboards.
Saving the Fruits Dataset
Saving Dashboards
After we’ve finished exploring, downloading and sharing our dashboard, we’ll probably want to save it so we can come back to it later. We can do this by choosing Save under the File Menu.
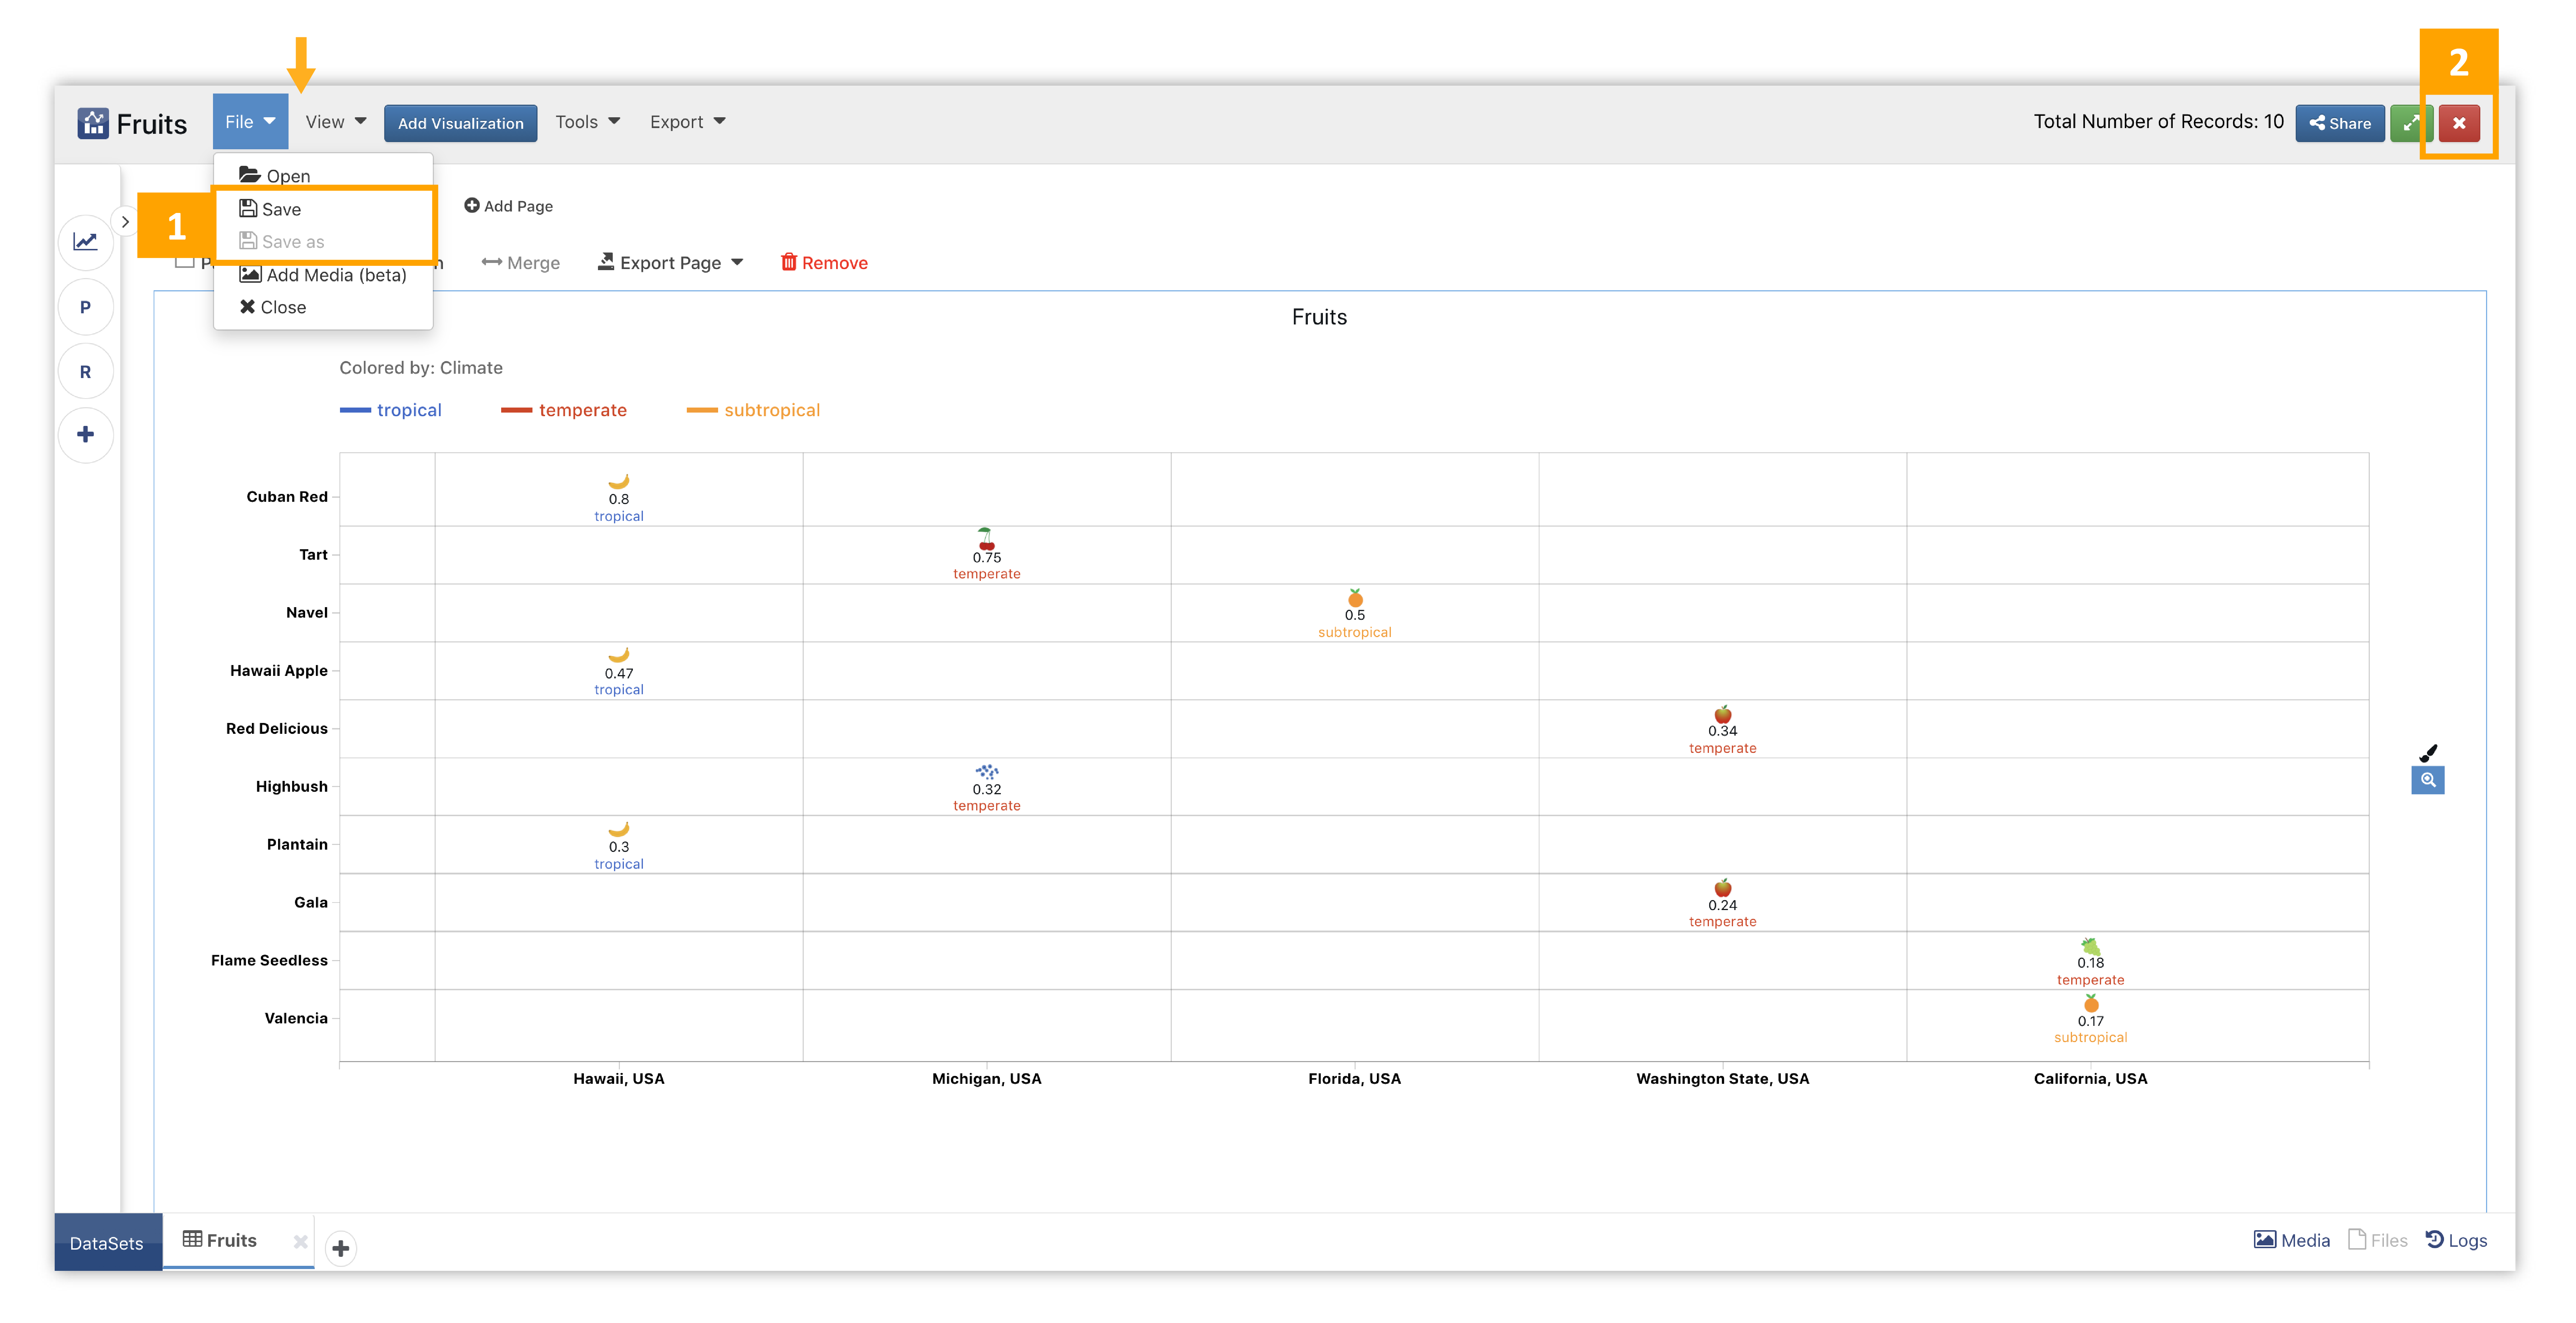
Figure 8: Dashboard Saving
- File Menu: Choose Save here. The Save option will become Update and Save As will be clickable when reopening an already saved dashboard.
- Closing the Dashboard: Clicking the close button will also ask us if we’d like to save.
When we click Save under the File Menu, we’ll be prompted to include specifications for our dataset. After we click Save again, we’ll also receive a shareable public link for the dataset. The following video example shows how this is done:
Updating a Dataset:
When updating a reopened dataset, we’ll be prompted to specify the name, description and tags again to keep the dataset full up-to-date!
Here is a video showing how it’s done:
Accessing Saved & Shared Dashboards
After we’ve successful saved our dashboard, we can access it anytime in the Simlytiks front page data table. We can use the basic filters on the left of the table to sift through our saved and shared dashboards, as well as use data table commands to share our dashboards with teammates.
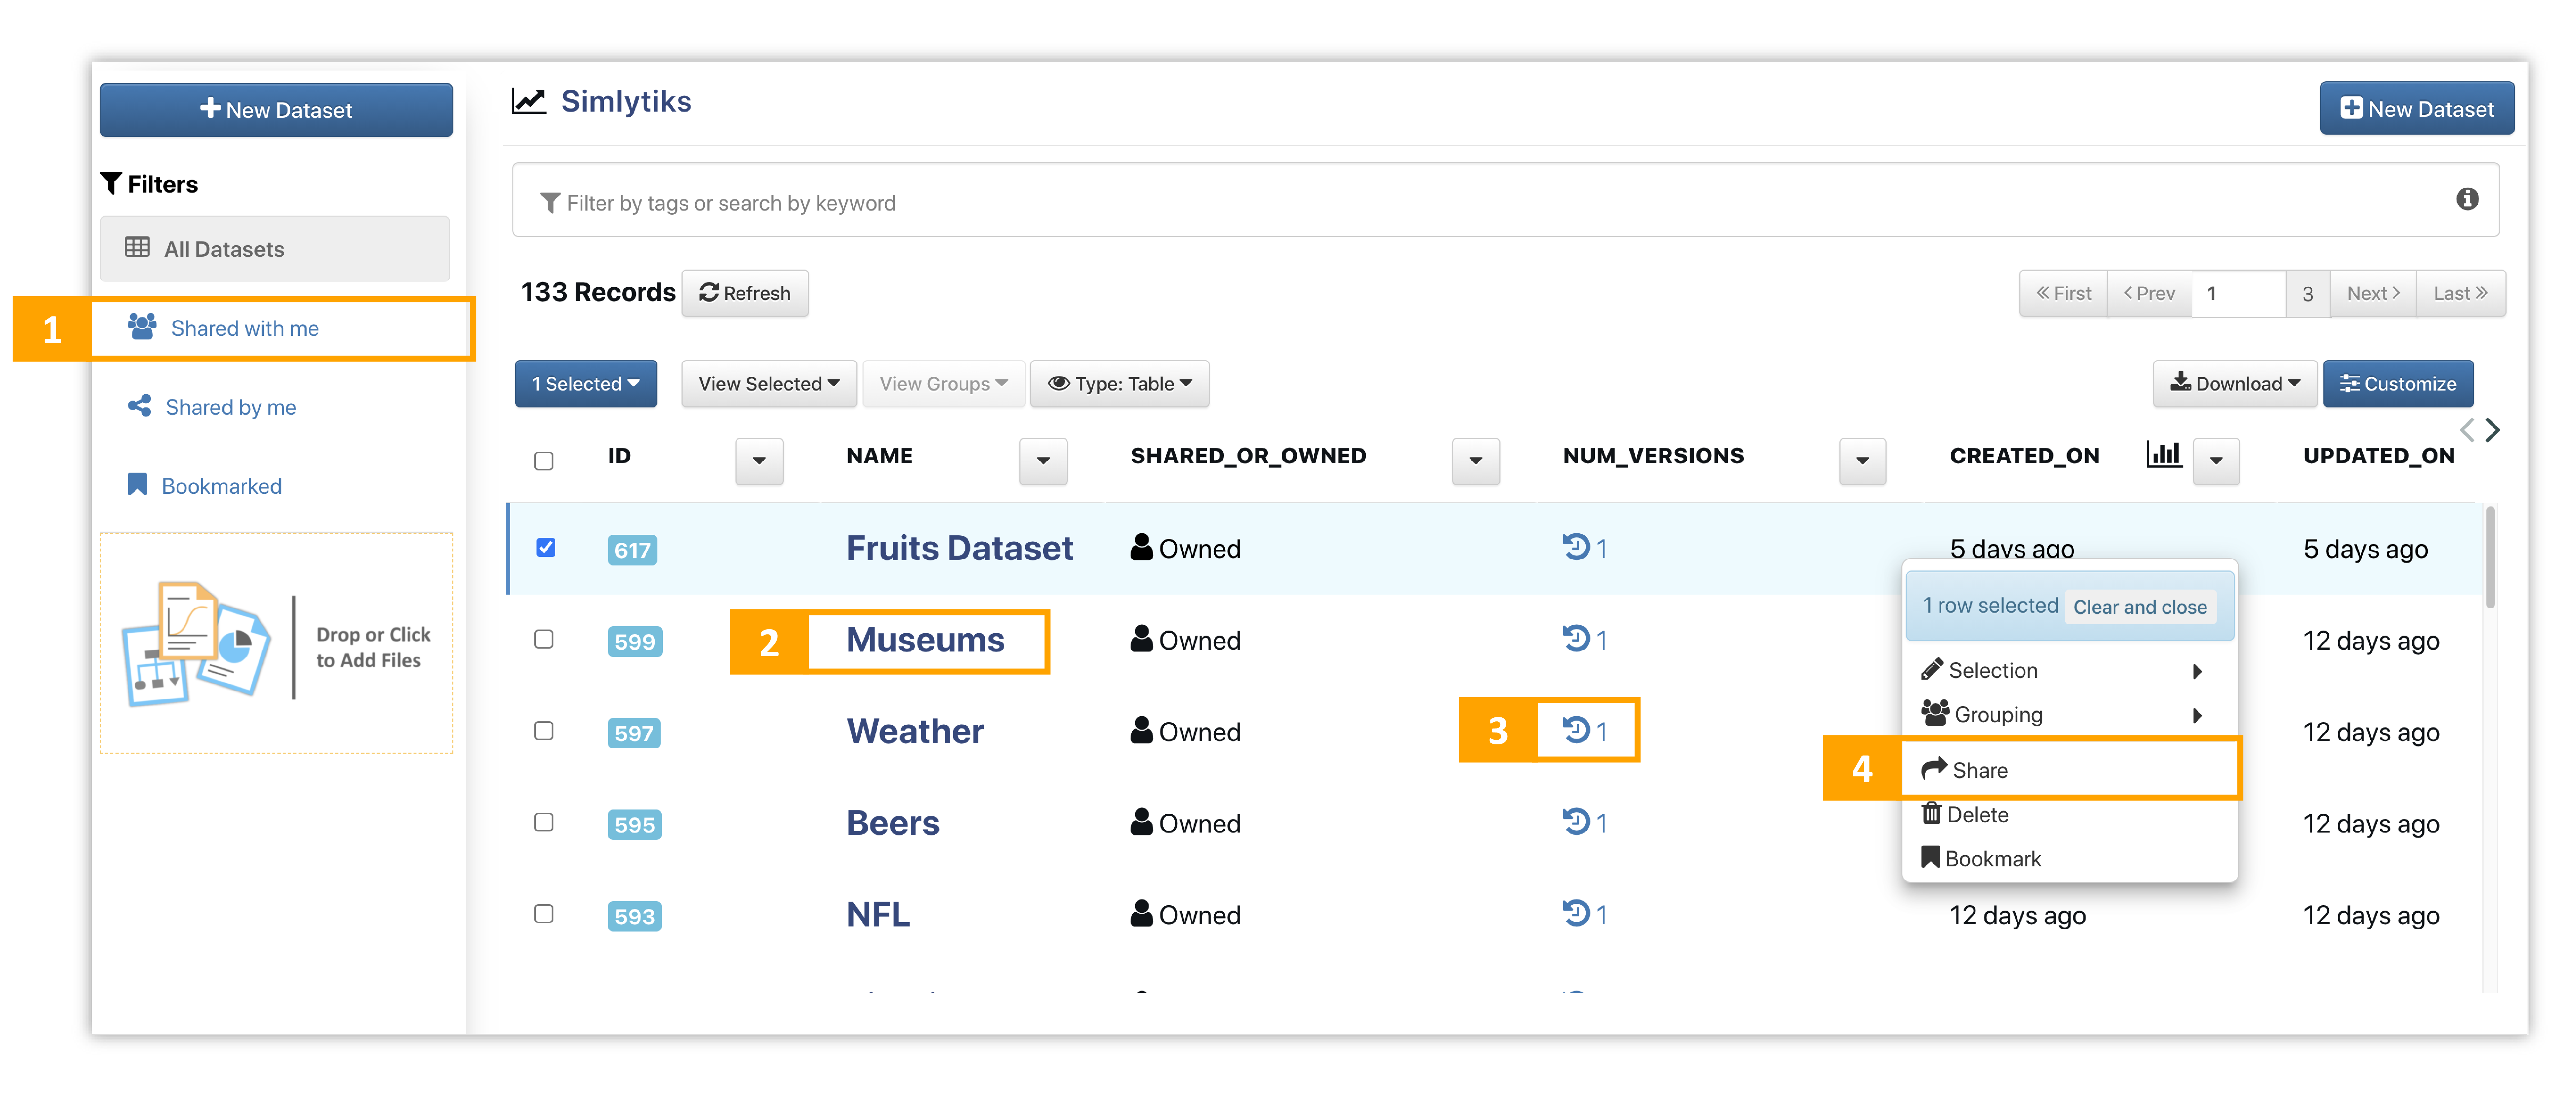
Figure 9: Accessing Saved and Shared Dashboards
- Shared with Me: Use this filter to see all the Dashboards that have been shared with you by other users.
- Open Dashboard: Click on a dashboard name in the data table to open and explore it again in Simlytiks.
- Version Control: Click on the icon to view all versions and activate them.
- Share Dashboard: Right click on a dashboard in the data table to share it with another user.
Version Control
Let’s go over version control with this sample dataset on car brands. We’ll open the dataset, create an exploration by adding a basic bubble chart, and then choose to save it as a dashboard by clicking on the close button and following the prompts. This video shows how we’ll create our first exploration and save it.
Once our dashboard has been saved to our Simlytiks data table, we can reopen it to make more updates and save it under the File menu by clicking Update. (If the newly saved dashboard isn’t initially showing up on the data table, please refresh the table using the button at the top or refresh the page using the browser). Watch the following video to see how we’ll create another iteration of our bubble chart by adding media and save it as another dashboard version.
We can then continue creating more iterations of our exploration to save to our version history.
For our third iteration, we’ll add a label to our bubble chart and update the dashboard again.
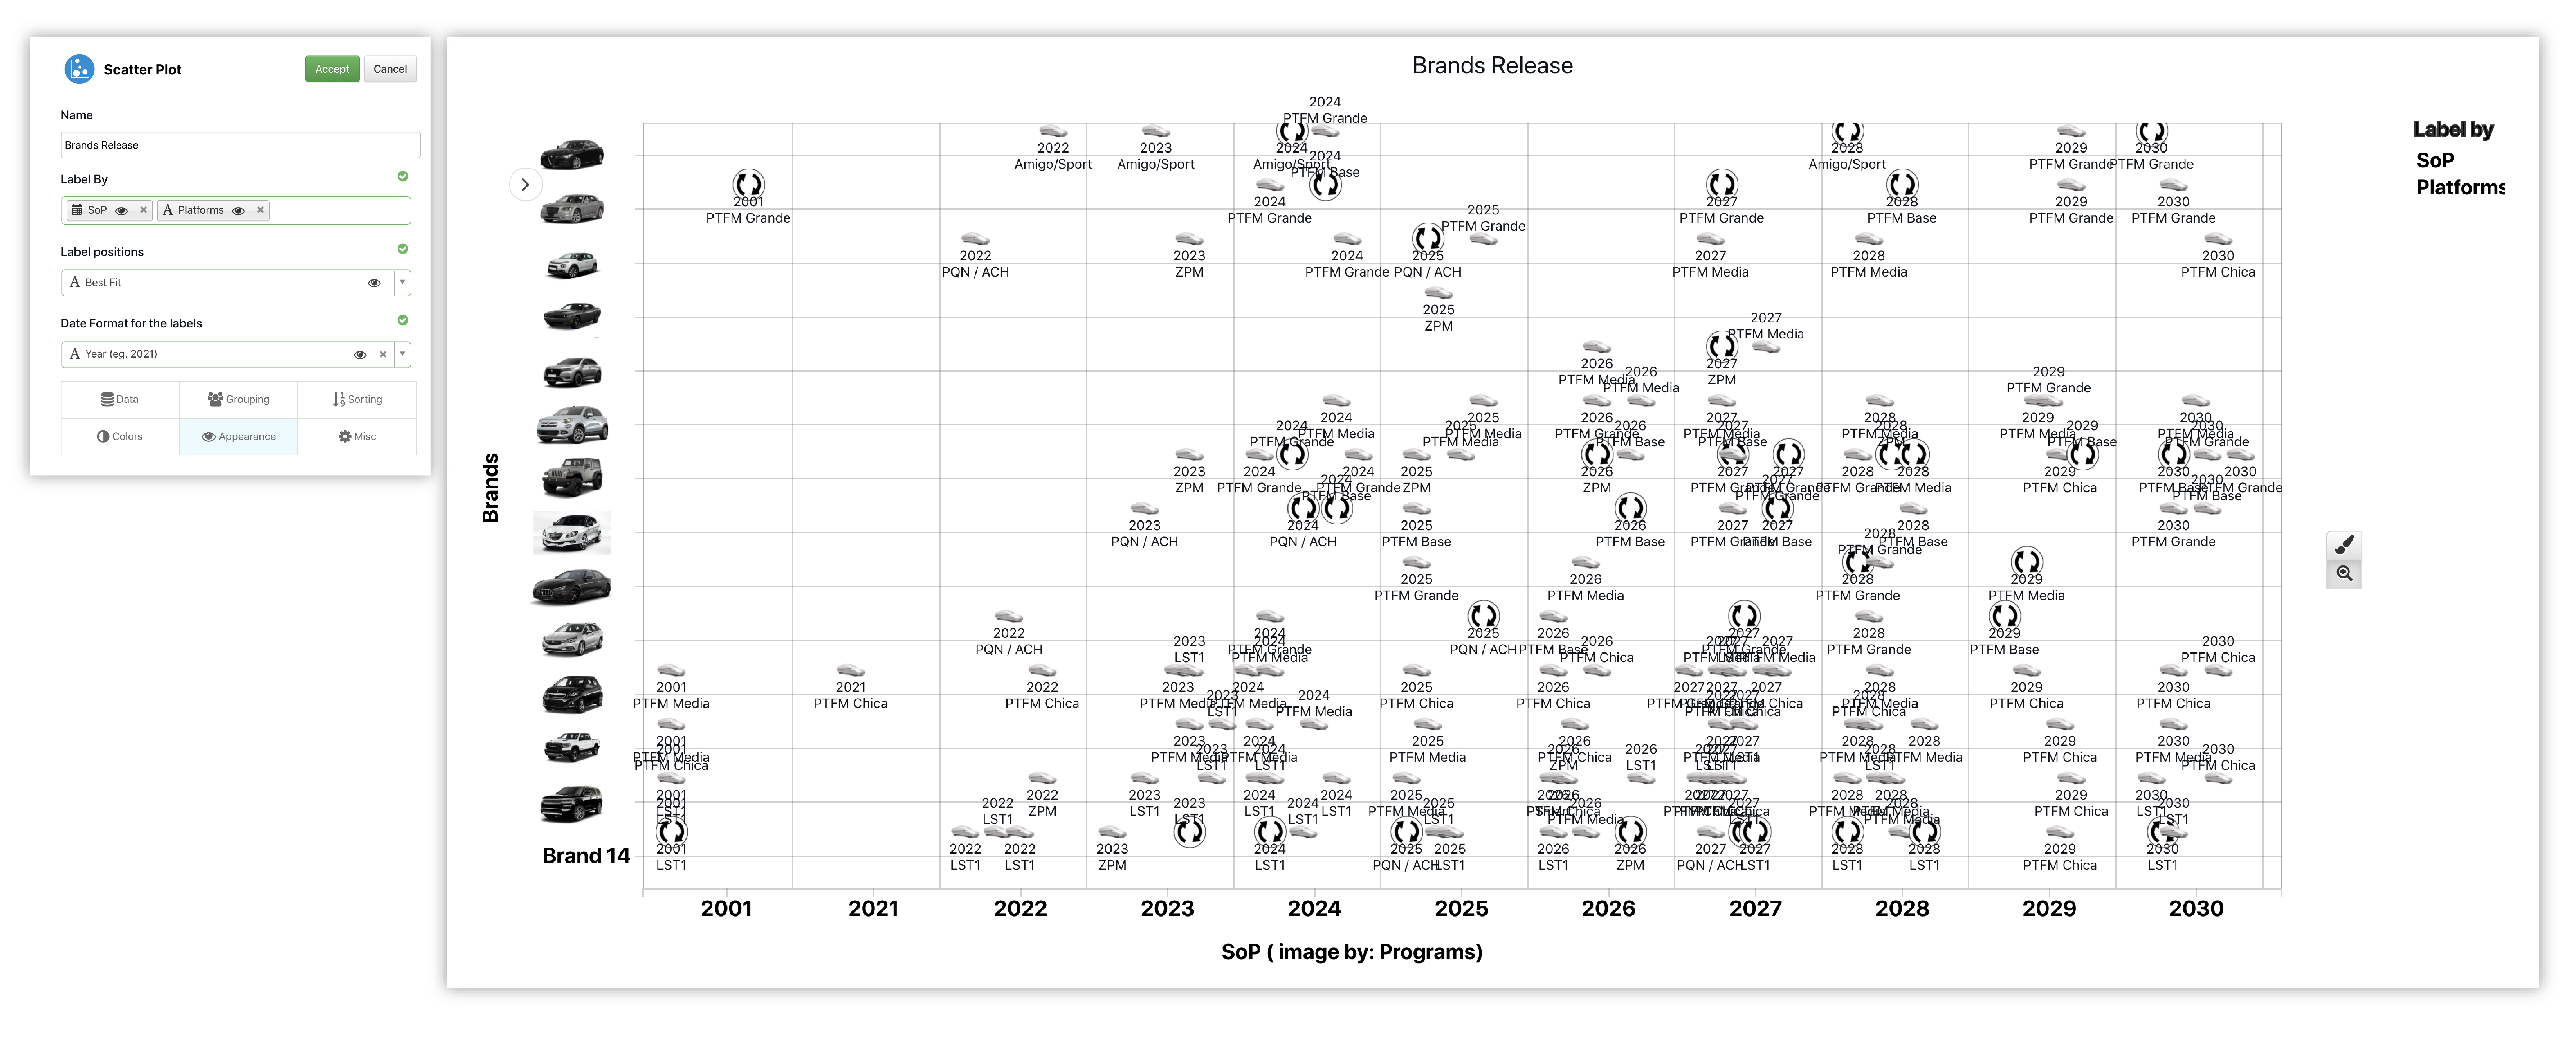
Figure 10: Add Bubble Label
For our forth, we’ll replace our bubbles with the image we set for programs.
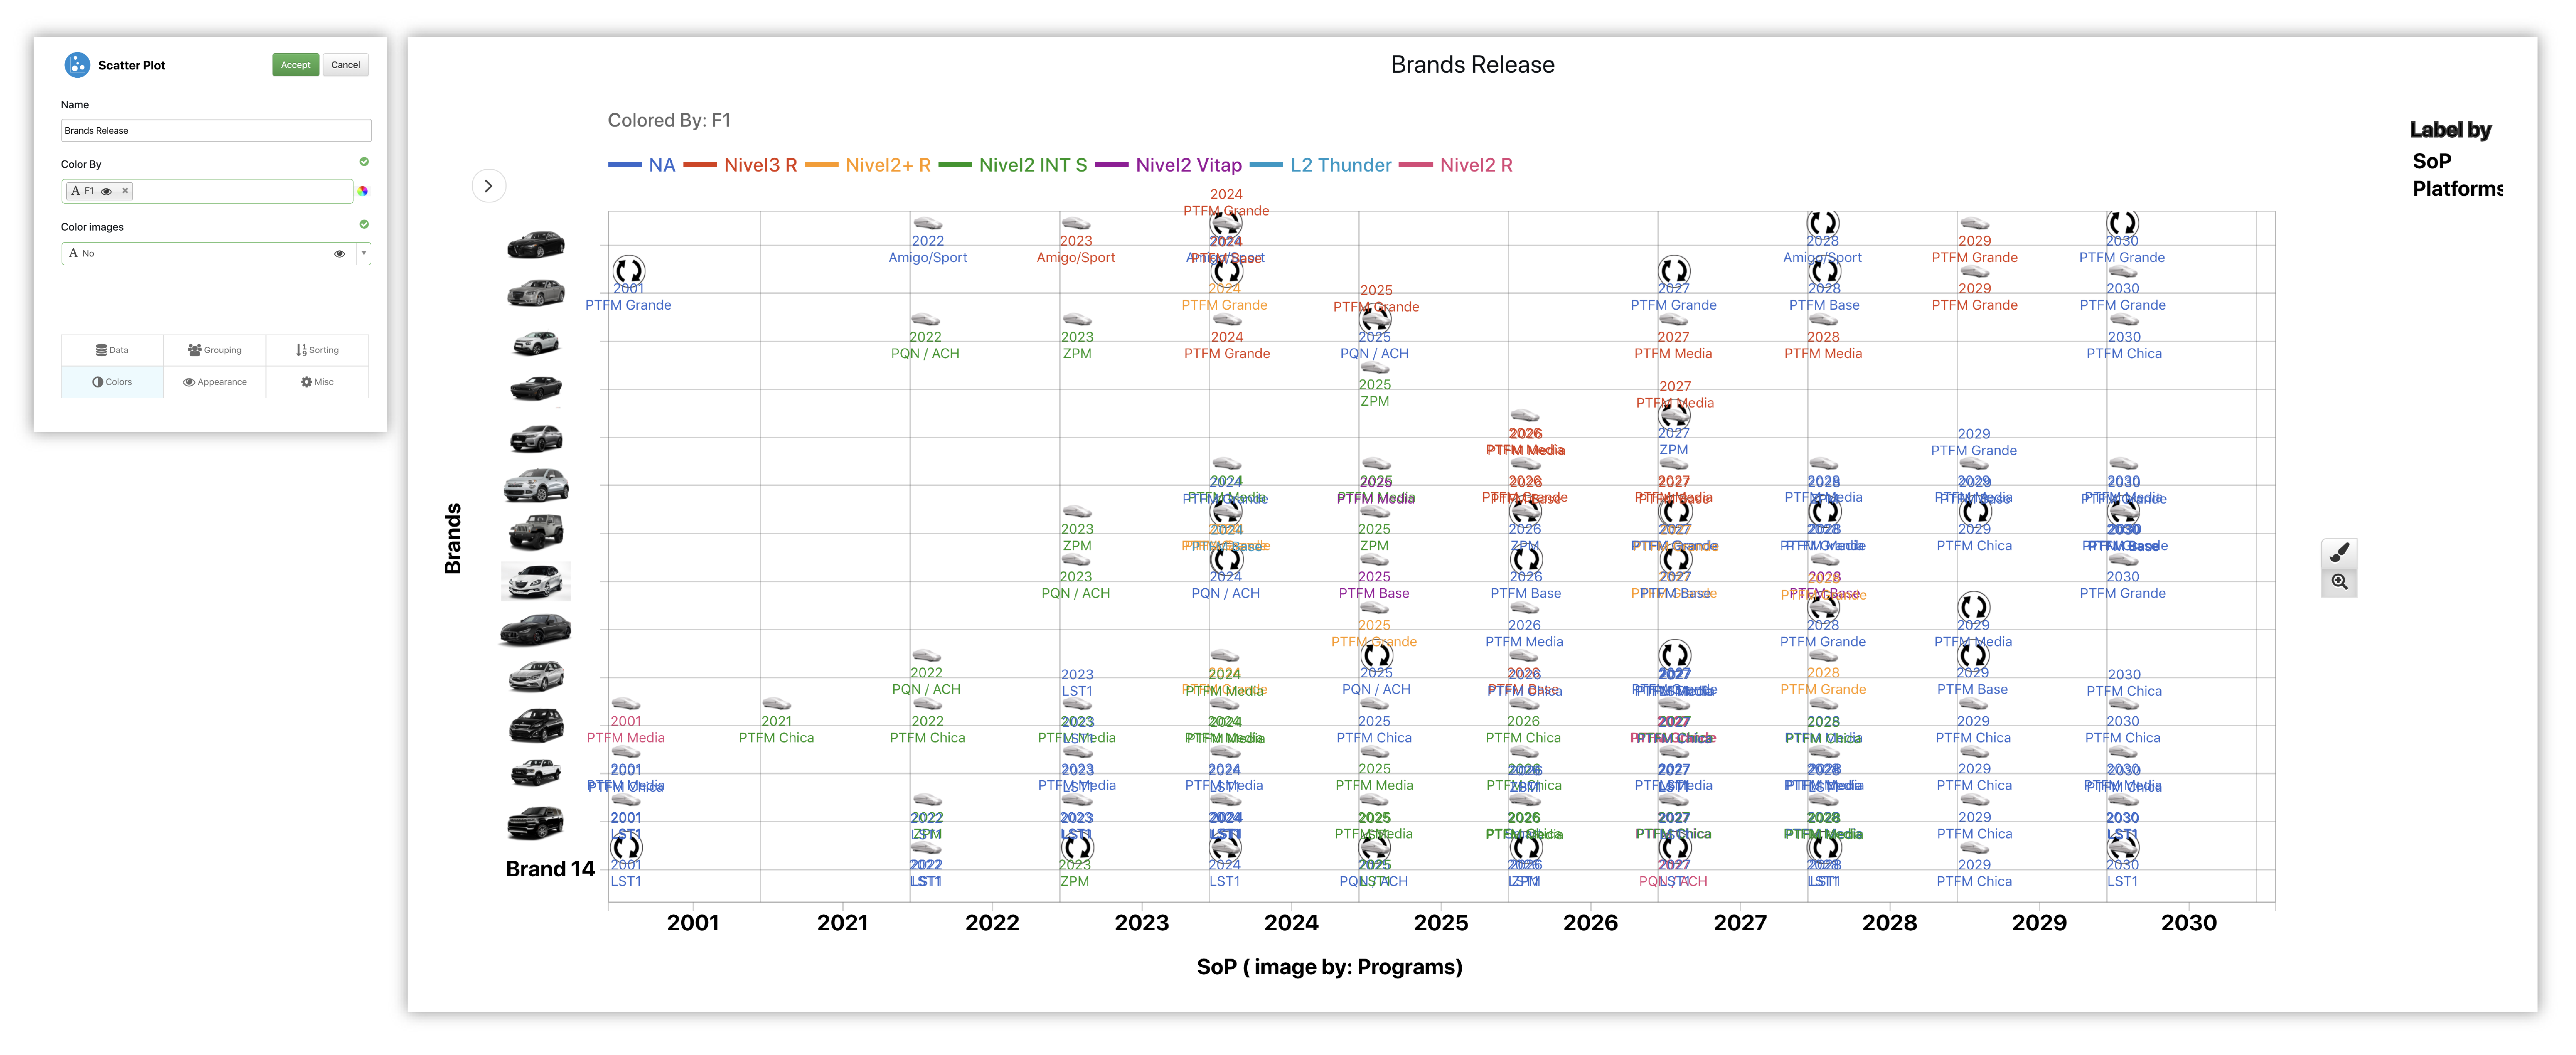
Figure 11: Add Program Bubble Color
For our last modification, we’ll use custom colors to enhance our bubble chart. To add them, go under the Tools Menu, click on Customize and tab over to Colors. Here, we can enter color codes for each column or import colors from an excel file.
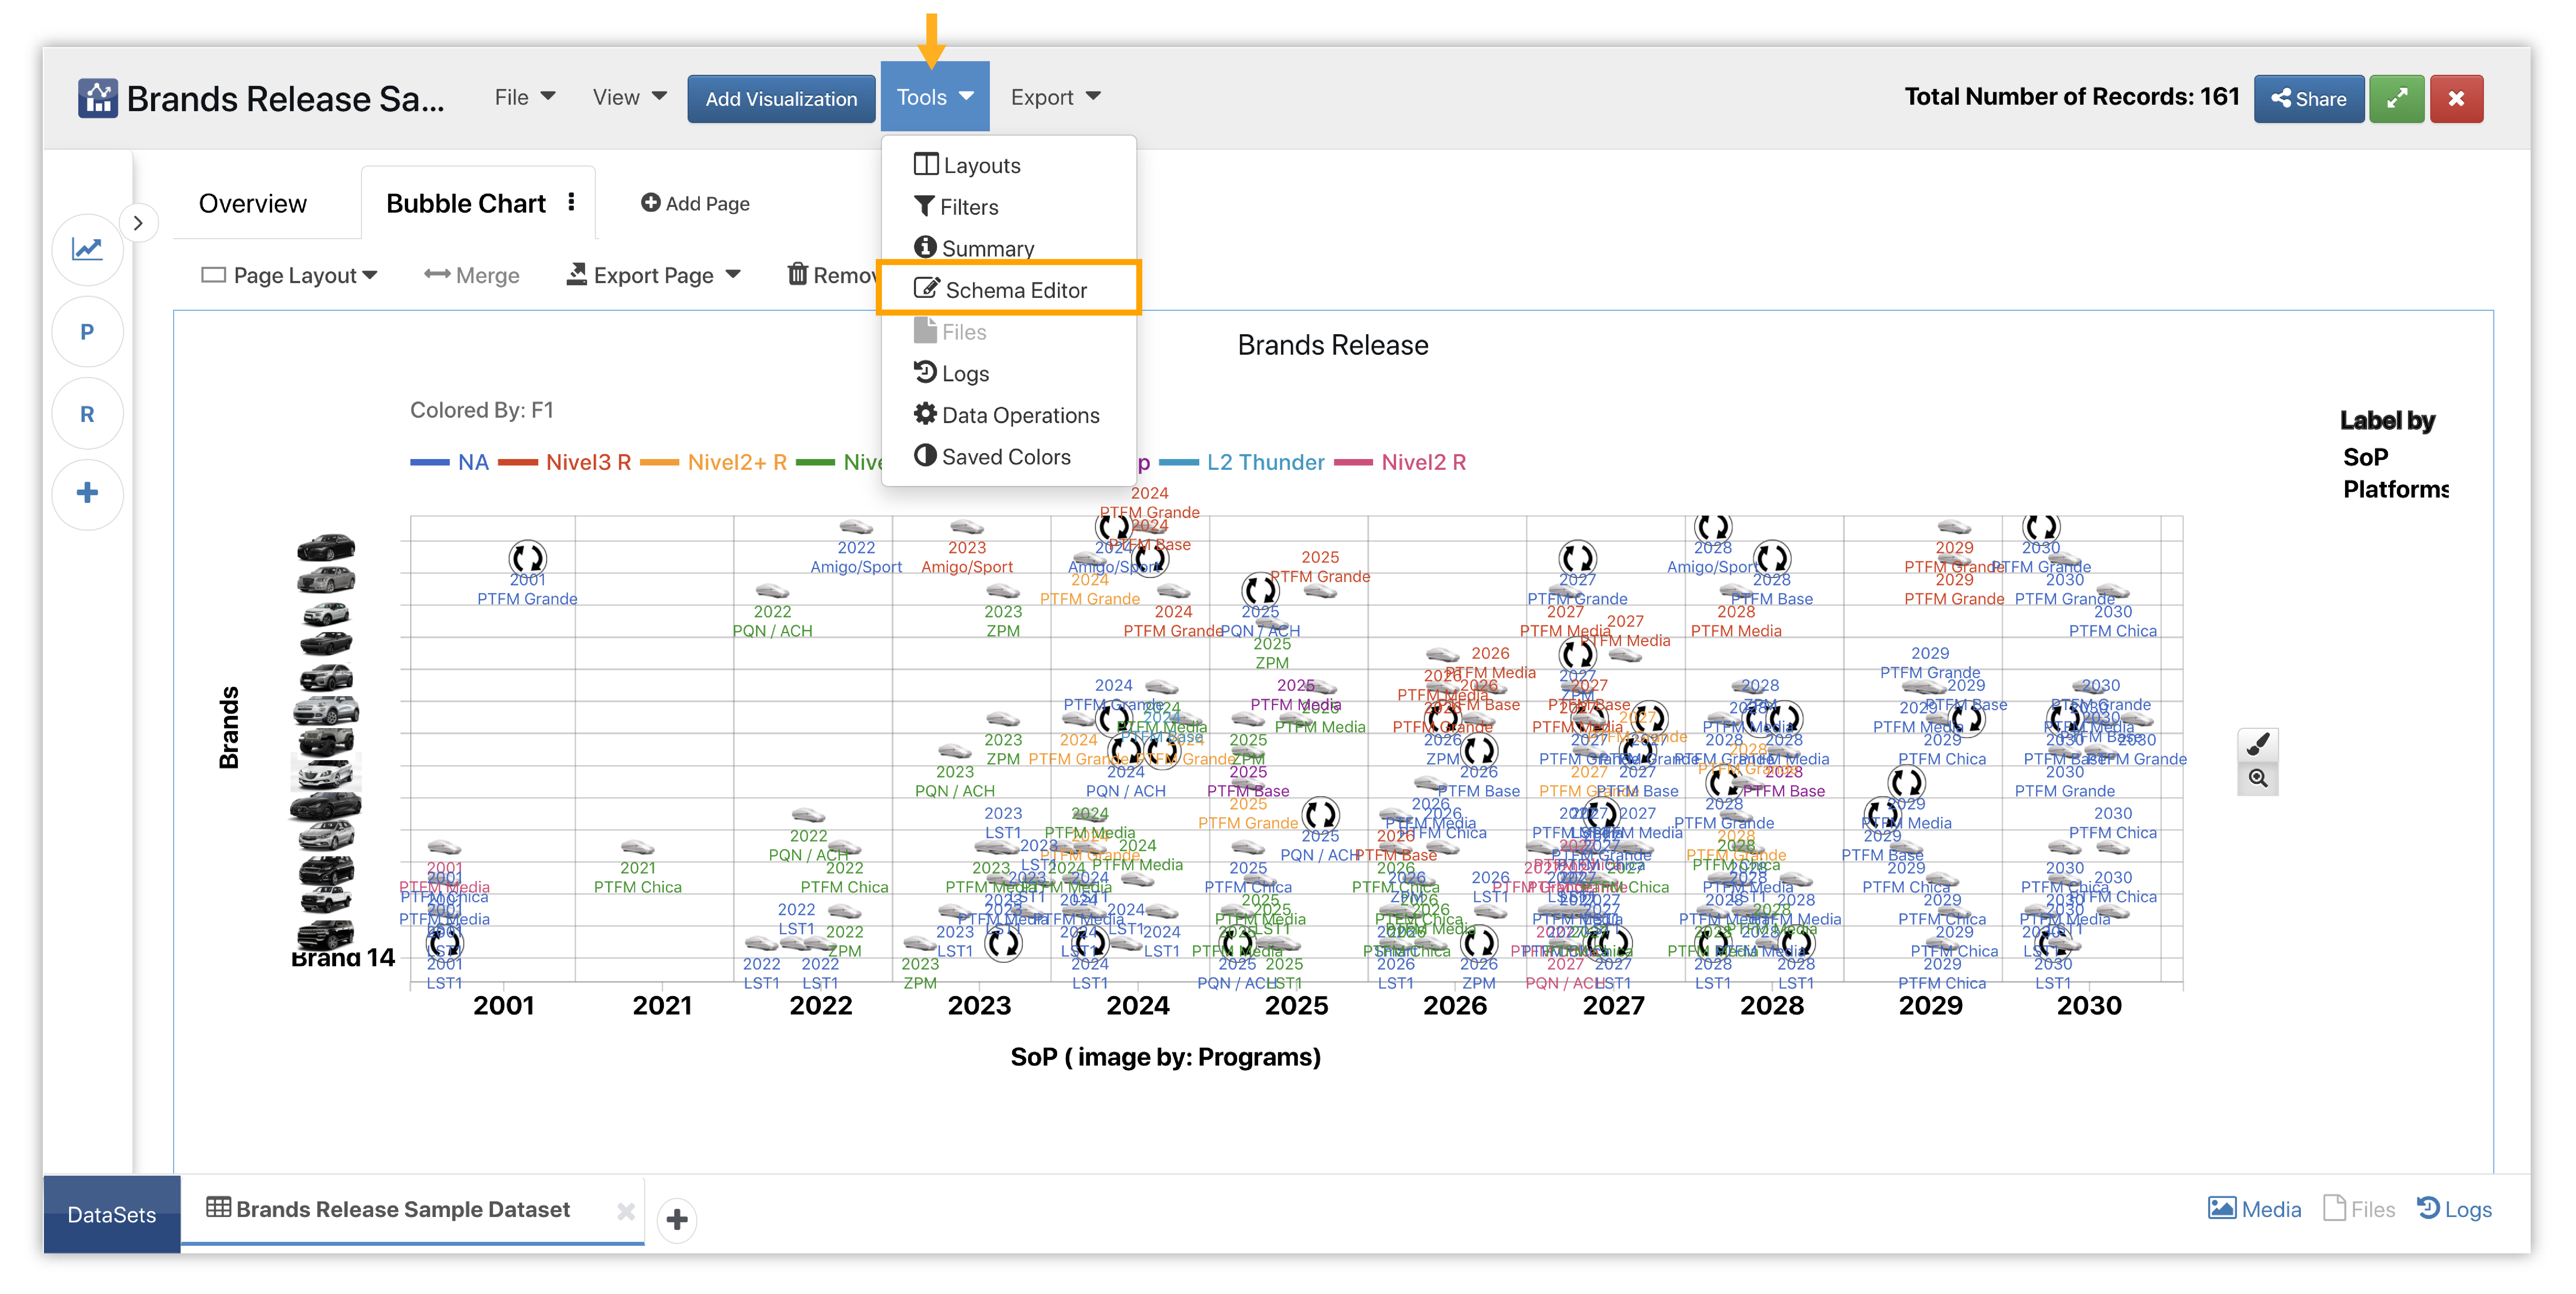
Figure 12: Add Custom Colors
We’ll pick some new colors for some of the programs, then choose to color the bubble chart by programs so we can see these custom colors for the bubble labels.
Now that we’ve explored with this dataset 5 different times, we’ll be able to see all versions in our version control history. Click on the history icon in the version control column for this dataset to access them. In the next window, click on a version to activate it. These versions will always be accessible under this option and can be switch between them and future versions anytime.
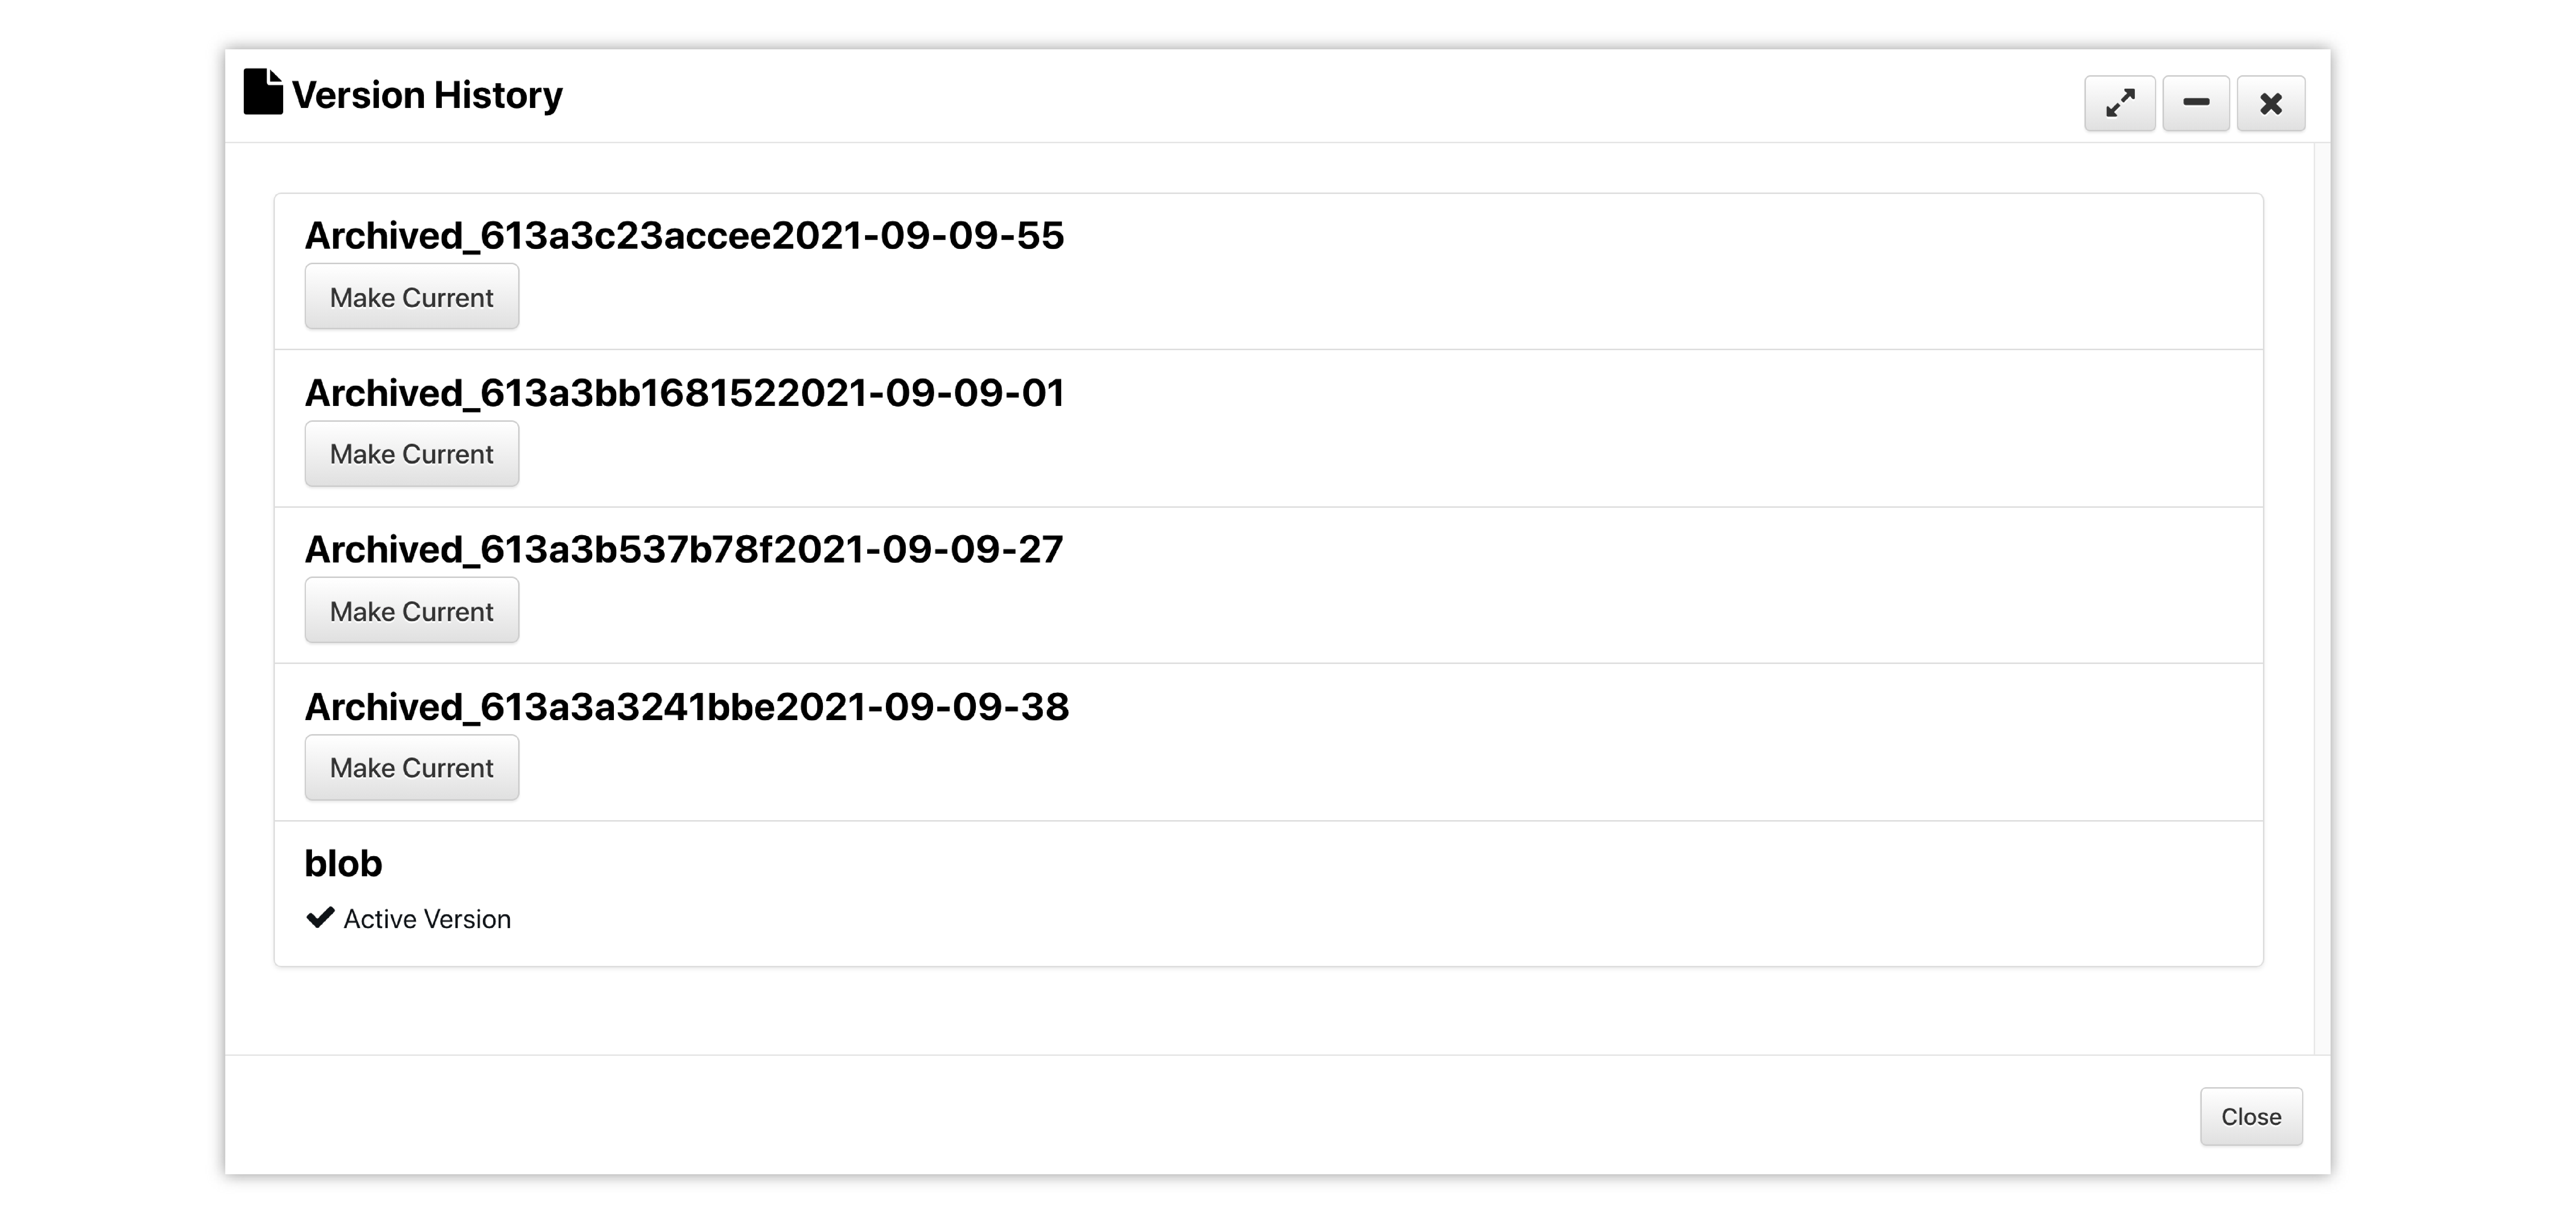
Figure 13: Version History
The following video shows how this is done.
Simlytiks Logs
If you want to review dataset history, you can do so by opening the log viewer under Tools > Logs.
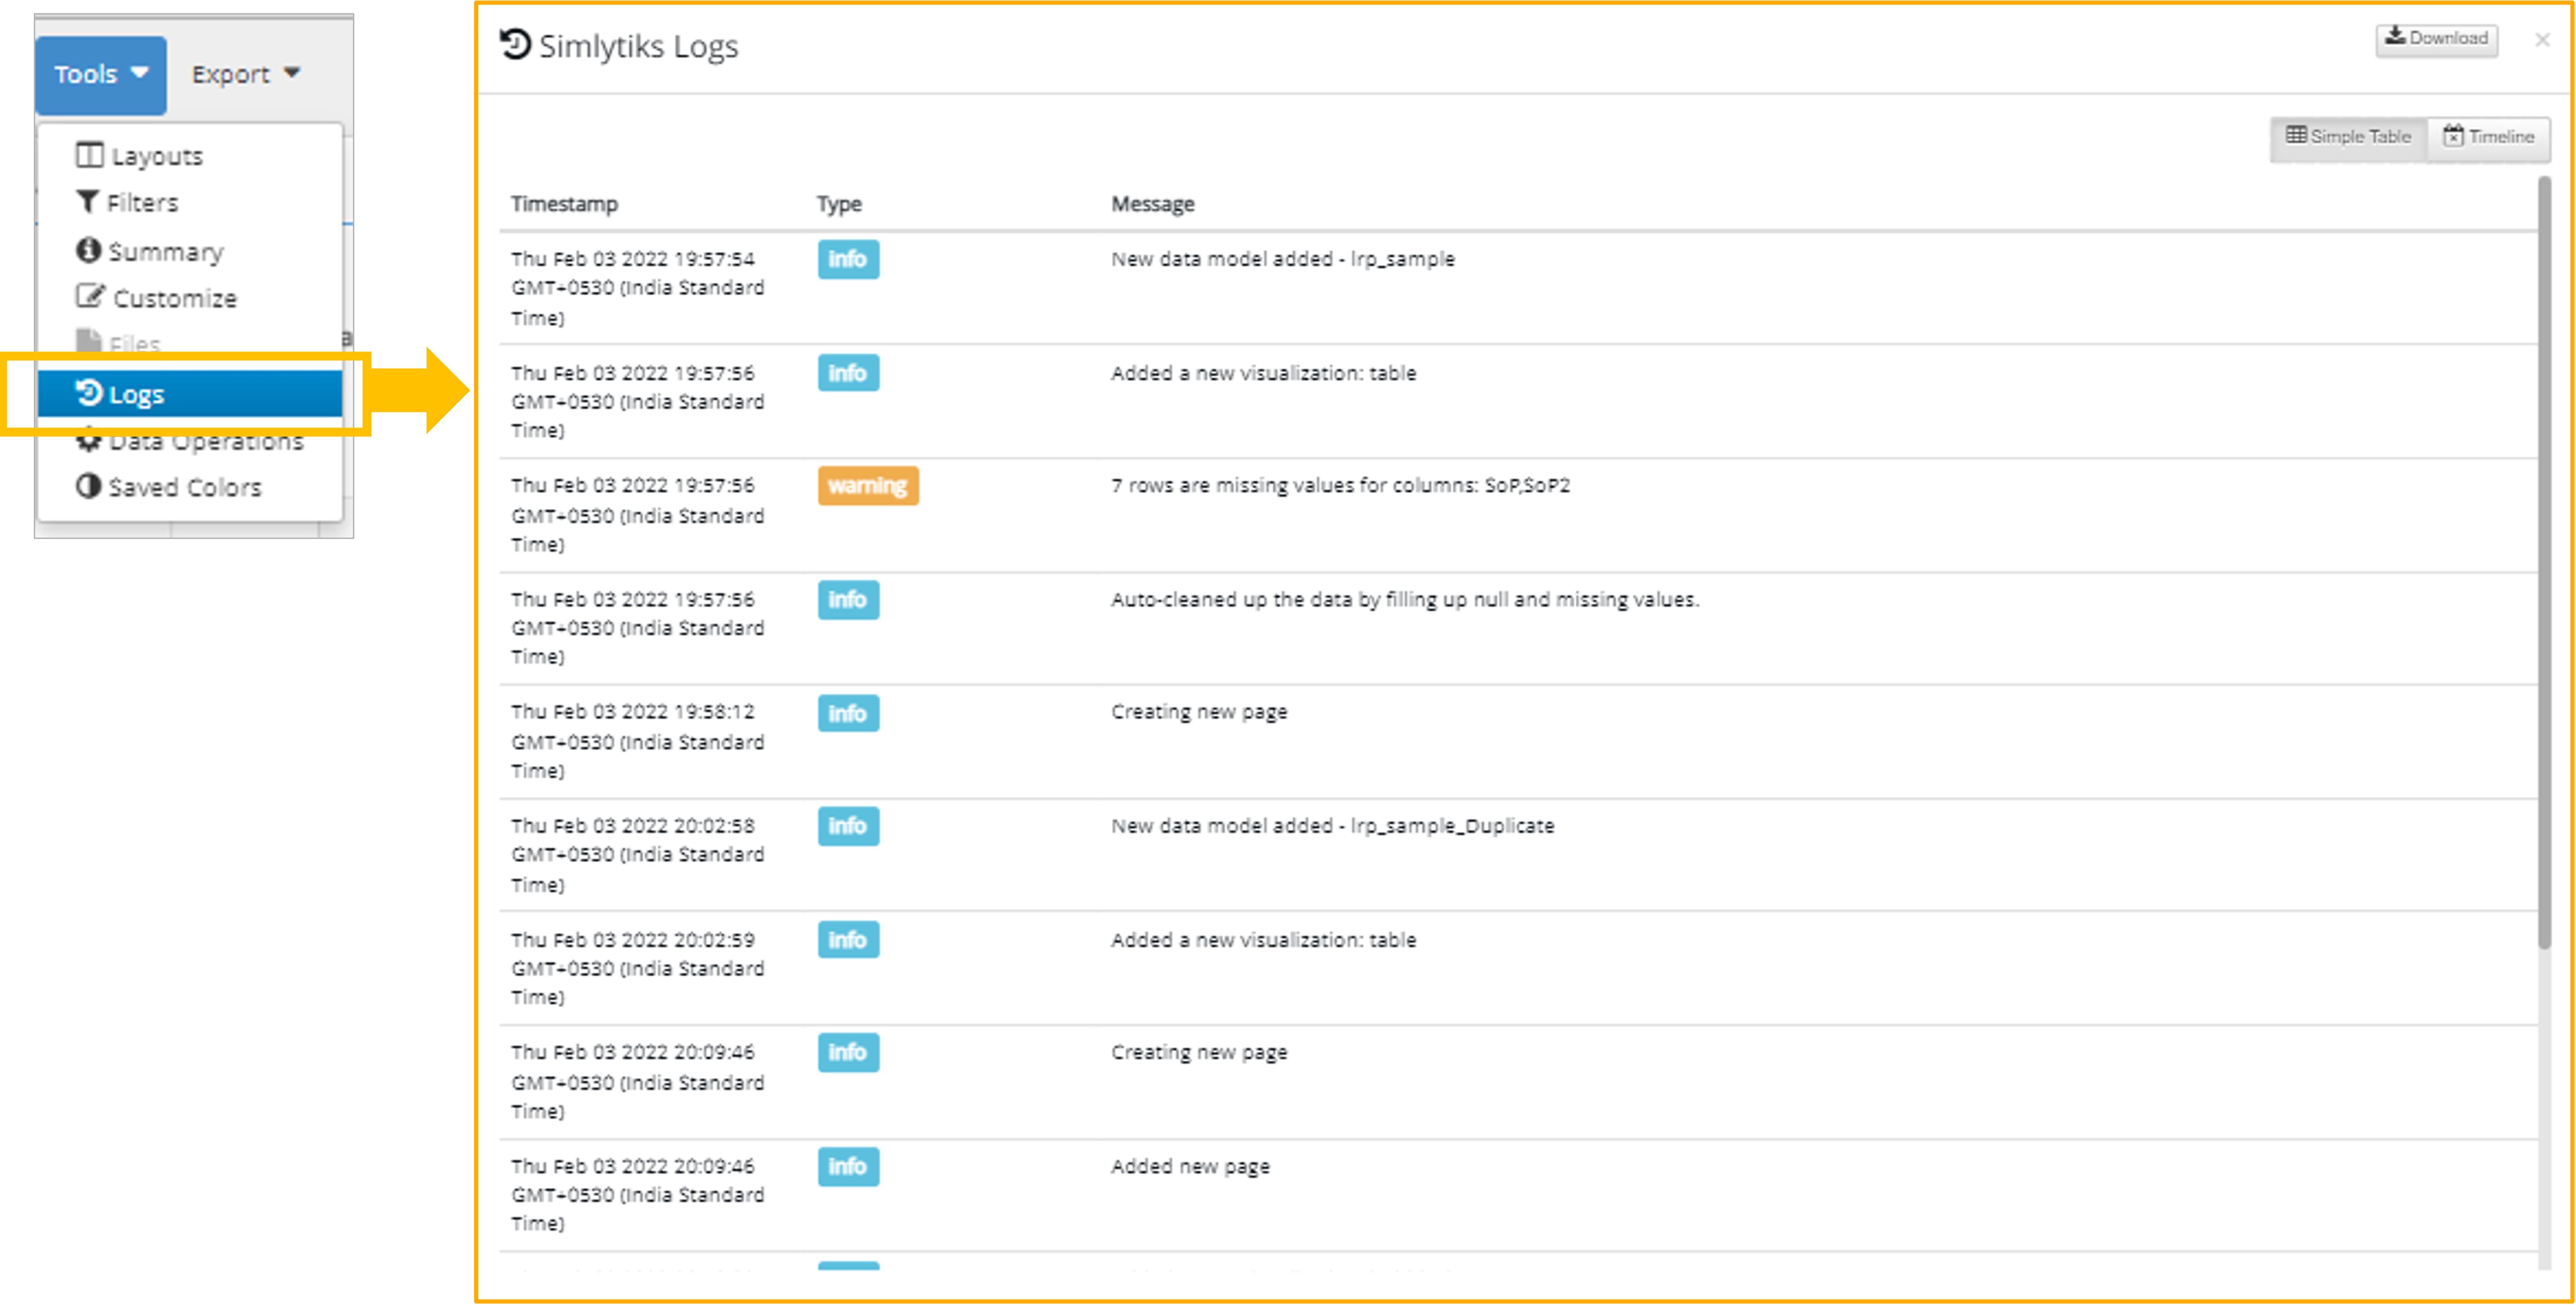
Figure 14: Log Viewer
Simlytiks Save Dataset
Simlytiks Dataset can now be saved without having the need to share it
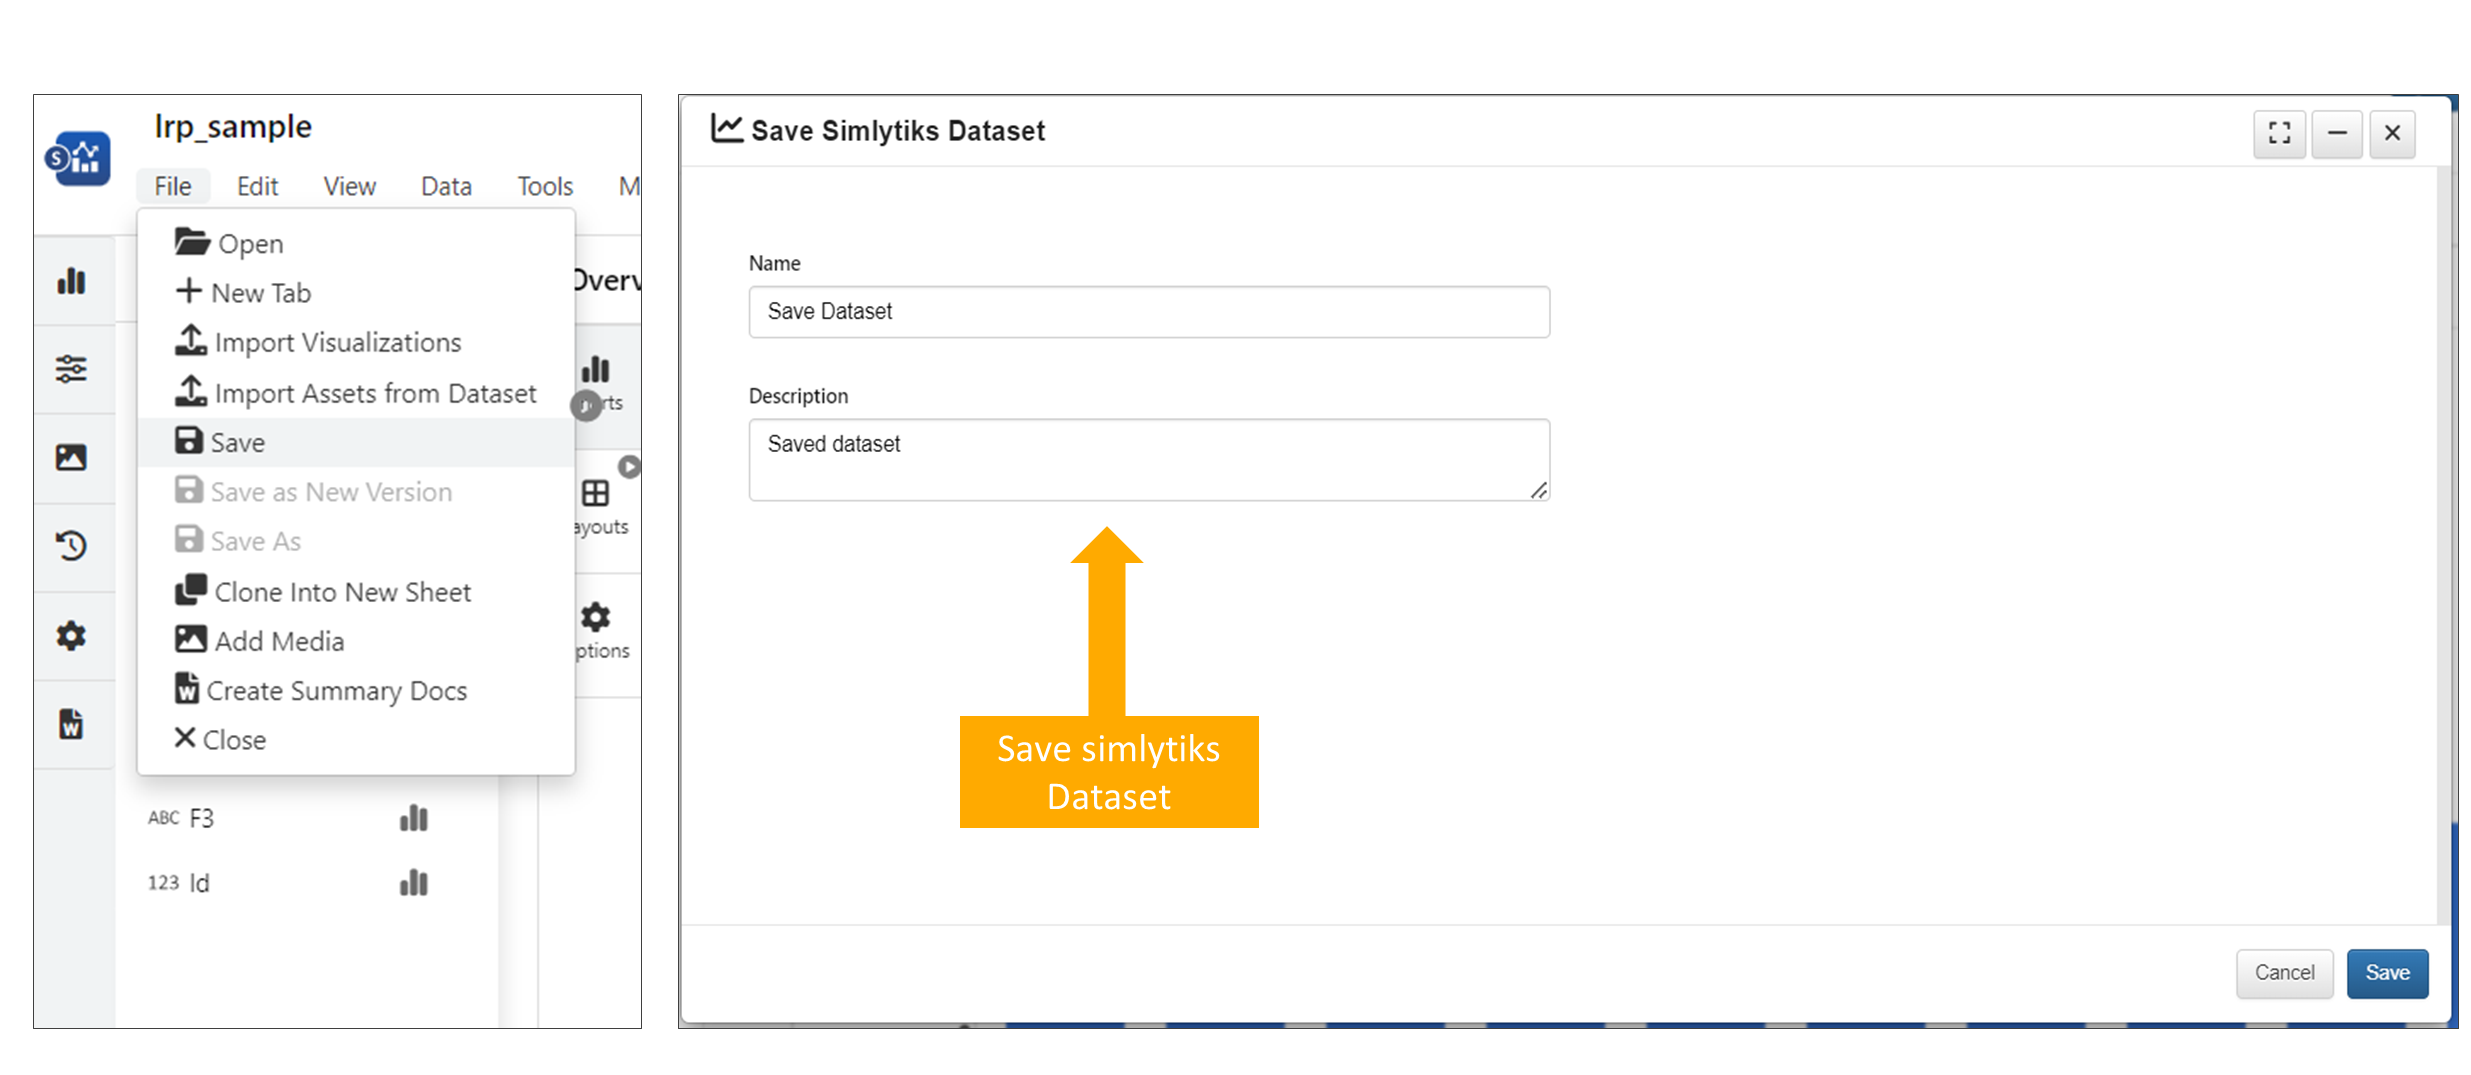
:sup: Save Simlytiks Dataset