30.  Frequently Asked Questions
New Dataset
1. How do I create a New Dataset?
We can create a New dataset from different formats and different sources such as importing a local file, connecting to a database, viewing simulations or experiments, and viewing sample datasets by clicking on the ‘New Dataset’ button on the top left corner of the Simlytiks page. Once the data is imported, we can view the contents and explore them using different chart such as basic table or vertical bar chart. For more information, please read Importing Data.
Tags: New Dataset, Dataset
New Dataset
2. How do I minimize the New Dataset window?
We can minimize the dataset window by clicking on the ‘Minimize’ button on the top right corner of the modal.
Tags: Dataset, minimize
1.png)
Minimize (New Dataset)
3. How do I enlarge the New Dataset window?
We can enlarge the dataset window by clicking on the ‘Enlarge’ button on the top right corner of the modal.
Tags: Dataset, enlarge
1.png)
Enlarge (New Dataset)
4. How do I close the New Dataset window?
We can close the dataset window by clicking on the ‘Close’ button on the top right corner of the modal.
Tags: Dataset, Close
1.png)
Close (New Dataset)
5. How do I cancel creating a New Dataset in the window?
We can cancel creating a dataset by clicking on the ‘Cancel’ button on the bottom right corner of the modal.
Tags: Dataset, Cancel
1.png)
Cancel (New Dataset)
6. How do I open the data I have chosen in the New Dataset window?
After choosing a data source in the New Dataset window, click on ‘View” to open it in Simlytiks and start exploring.
Tags: Dataset, View
1.png)
View (New Dataset)
7. How do I run a query when connecting to a database?
In the New Dataset window under Connect to a Database, we can run a query to connect to a database as a data source for a Simlytiks dataset. Once we choose our database connections by filling out the necessary specifications, we’ll click on ‘Run Query’ to start connecting to the database.
Tags: Dataset, Run Query
1.png)
Run query (New Dataset-Connect to database)
8. How do I reset the query when connecting to a database?
In the New Dataset window under Connect to a Database, we can reset the data provided before saving it to Simlytiks by clicking on ‘Reset Query’ towards the bottom of the modal next to ‘Run Query’.
Tags: Dataset, Reset Query
1.png)
Reset query (New Dataset-Connect to a Database)
9. How do I save the Database connection details when connecting to a database?
In the New Dataset window under Connect to a Database, we can provide database connection details and save them by clicking on ‘Save’ towards the bottom of the modal next to ‘Reset Query’. The saved database connections are then displayed under ‘Saved Connections’ towards the top of the modal next to the layout options. We can select already saved connection to create a dataset from a database.
Tags: Dataset, Save
1.png)
Save(New Dataset-connect to a database)
10. How do I view already saved connections from a database?
In the New Dataset window under Connect to a Database, we can provide database connection details and save them by clicking on ‘Save’ towards the bottom of the modal next to ‘Reset Query’. The saved database connections are then displayed under ‘Saved Connections’ towards the top of the modal next to the layout options. We can select already saved connection to create a dataset from a database.
Tags: Dataset, saved connections
1.png)
Saved connections(New Dataset-connect to a database)
11. How do I add another dataset to my dashboard?
We can more than one dataset to our dashboard by clicking on new dataset button (+) next to the current dataset name at the bottom left of the page. This will bring up the same New Dataset window that was used to add the current dataset. Please refer to question 1 for more information on this window or read .. centered:: Importing Data.
Tags: Add dataset (+), Dataset
1.png)
Add dataset (+)
Dashboard Data
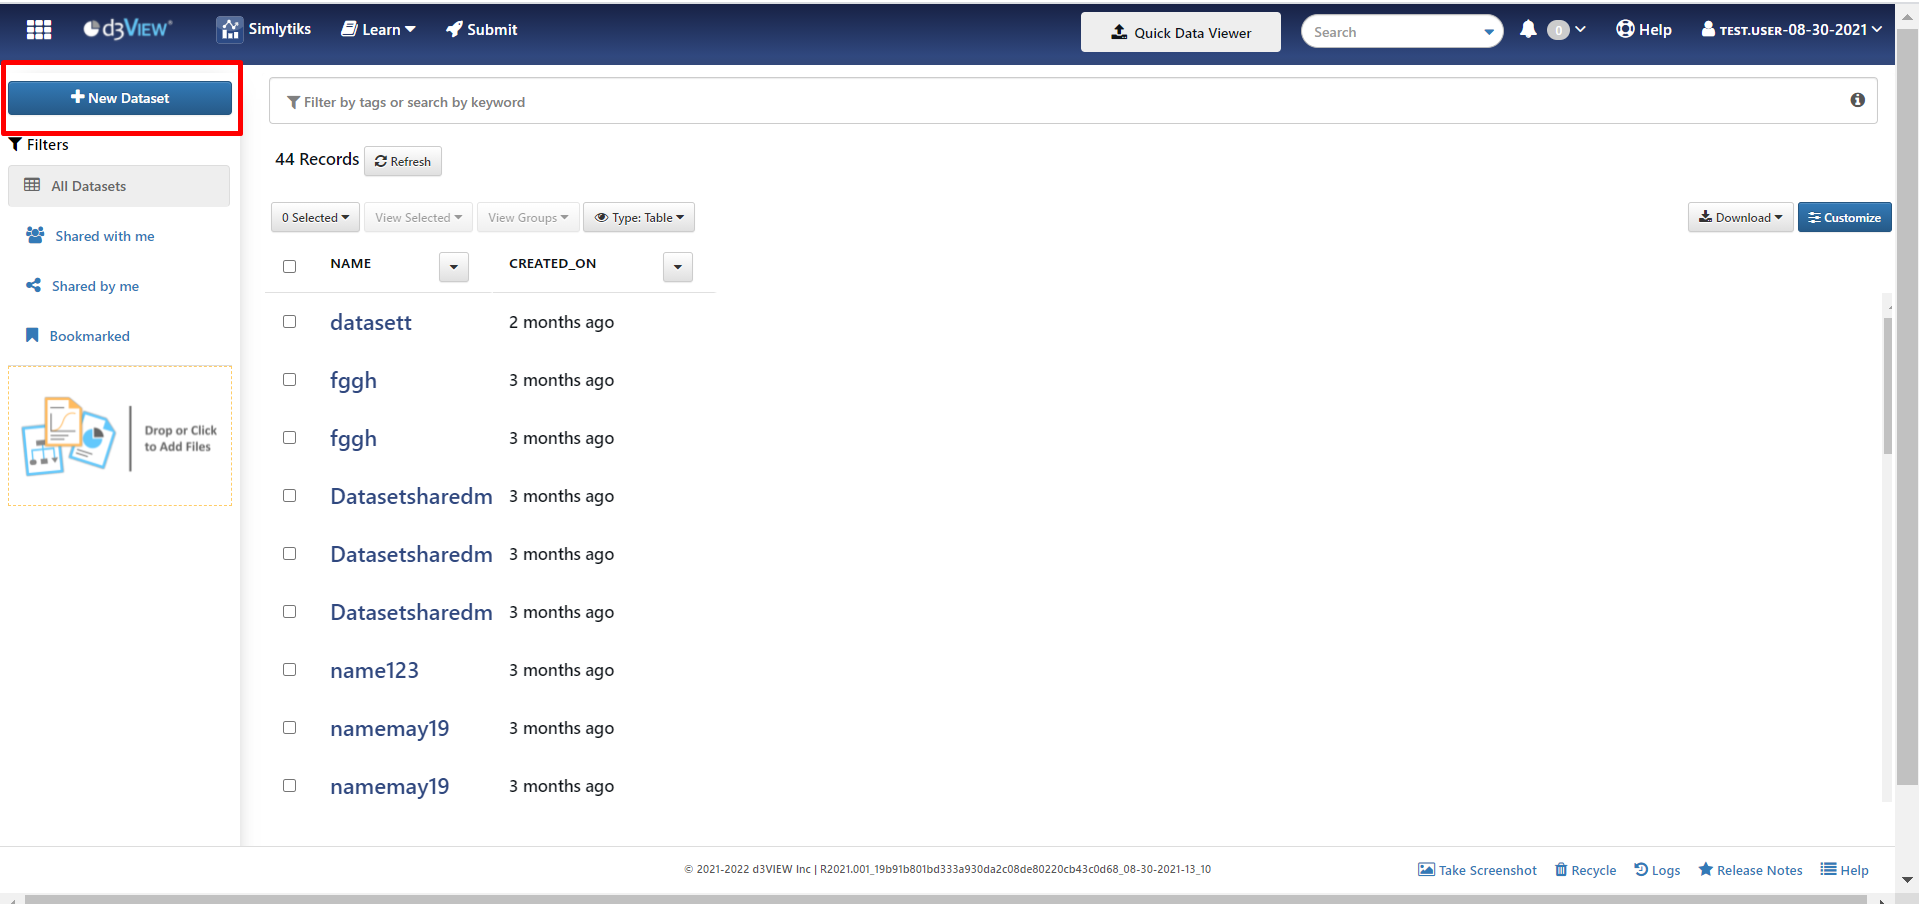
12. How can I refresh the table of my saved dashboards if I am having trouble viewing them?
At the top of the saved dashboards data table, click on the ‘Refresh’ button to refresh the data table without refreshing the whole page.
Tags: Reset, Dataset
Refresh
13. I just saved my dashboard but don’t see it in my table of saved dashboards?
If a newly saved dashboard is not showing up in the table of saved dashboards, refresh the table by clicking on the ‘Refresh’ button at the top of the table, or refresh the page using the browser.
Tags: Reset, Dataset
Refresh
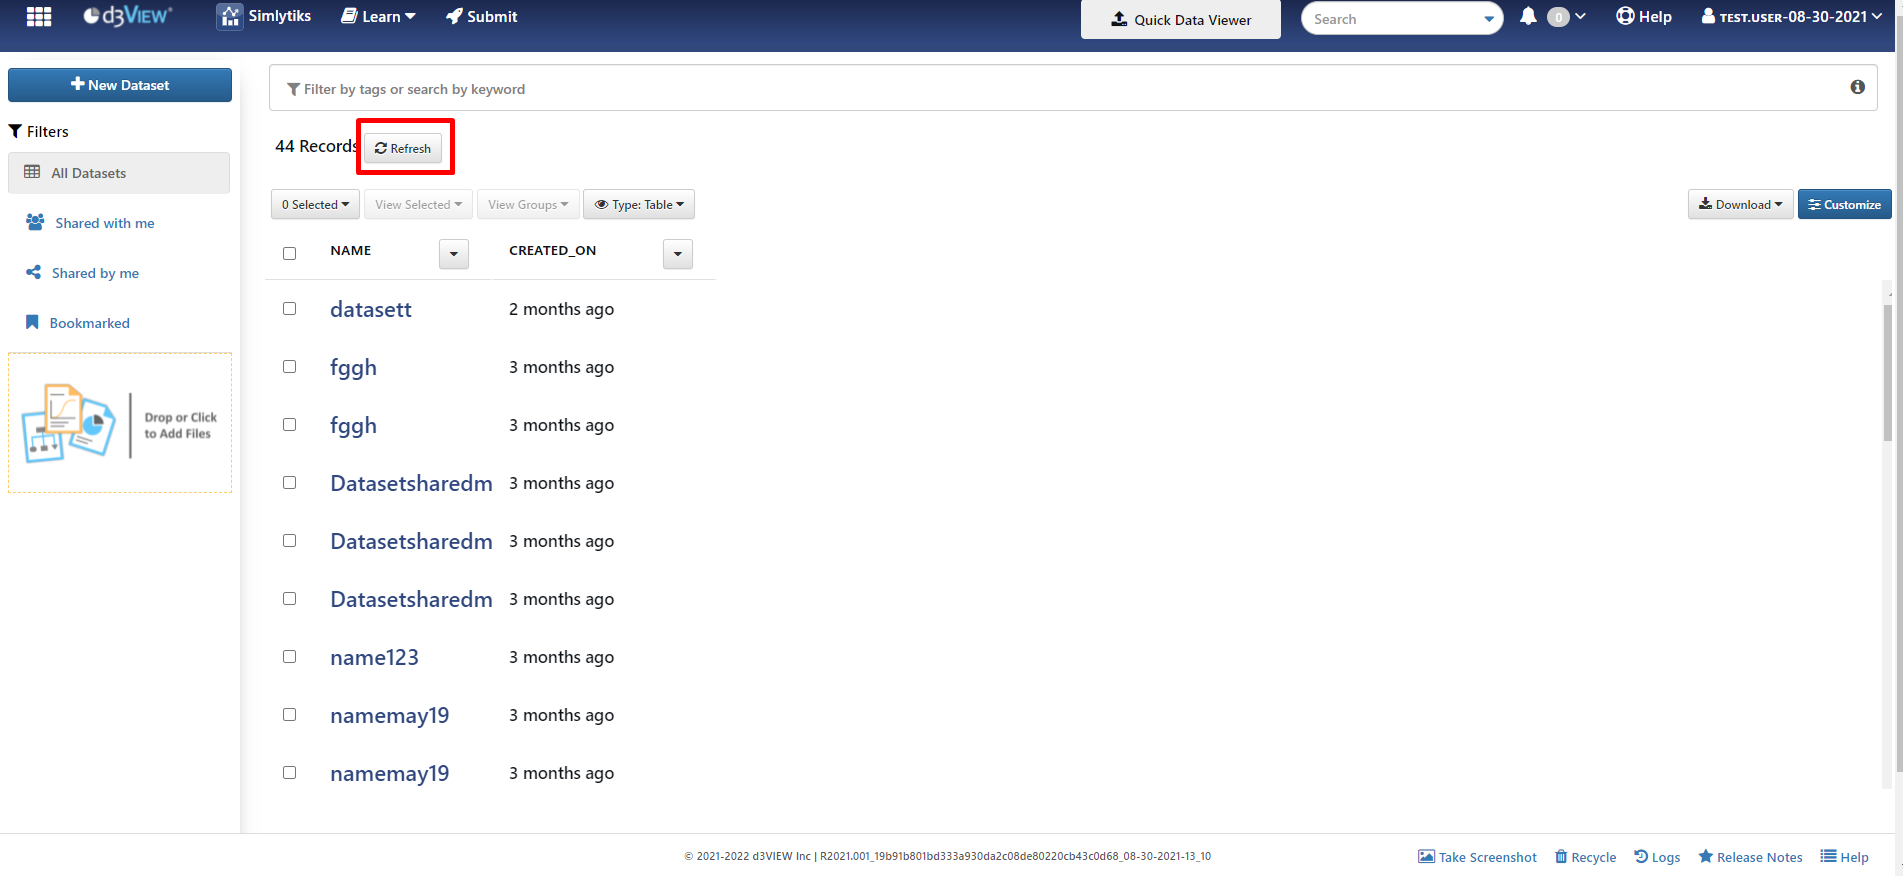
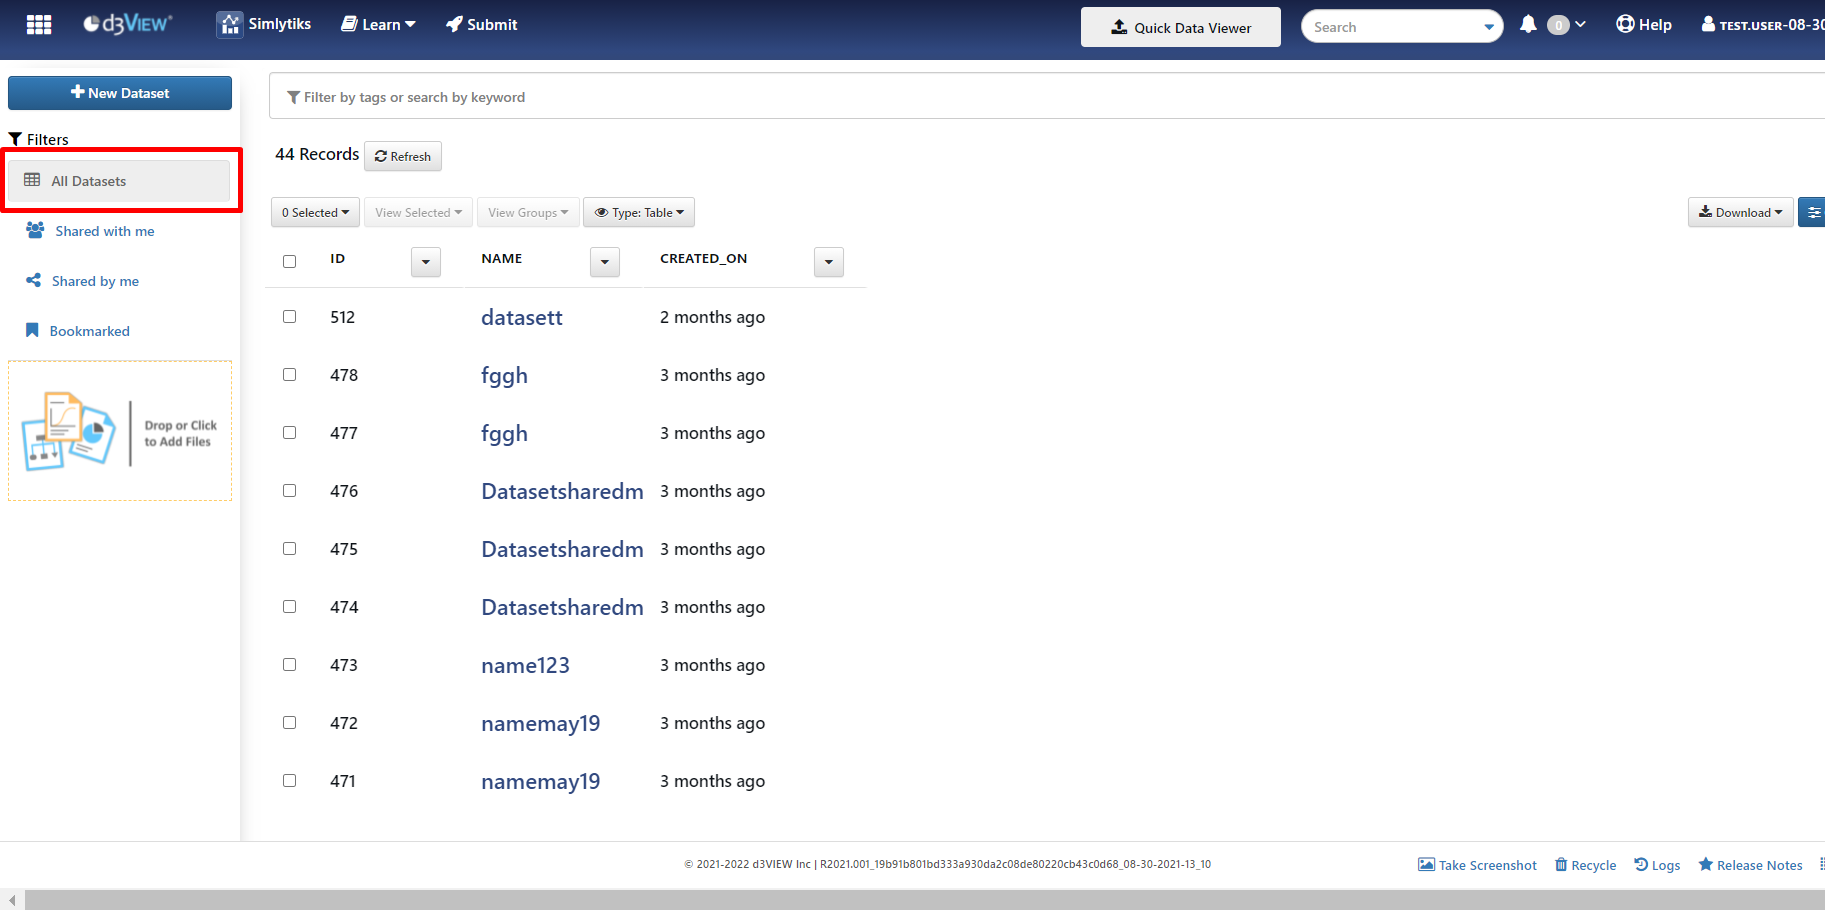
14. How do I view all my saved dashboards?
All saved dashboards will be accessible in the data table on the Simlytiks front page. Make sure to choose the ‘All Datasets’ filter on the left side filters panel to search through all saved dashboards.
Tags: All Datasets, Dataset
All datasets
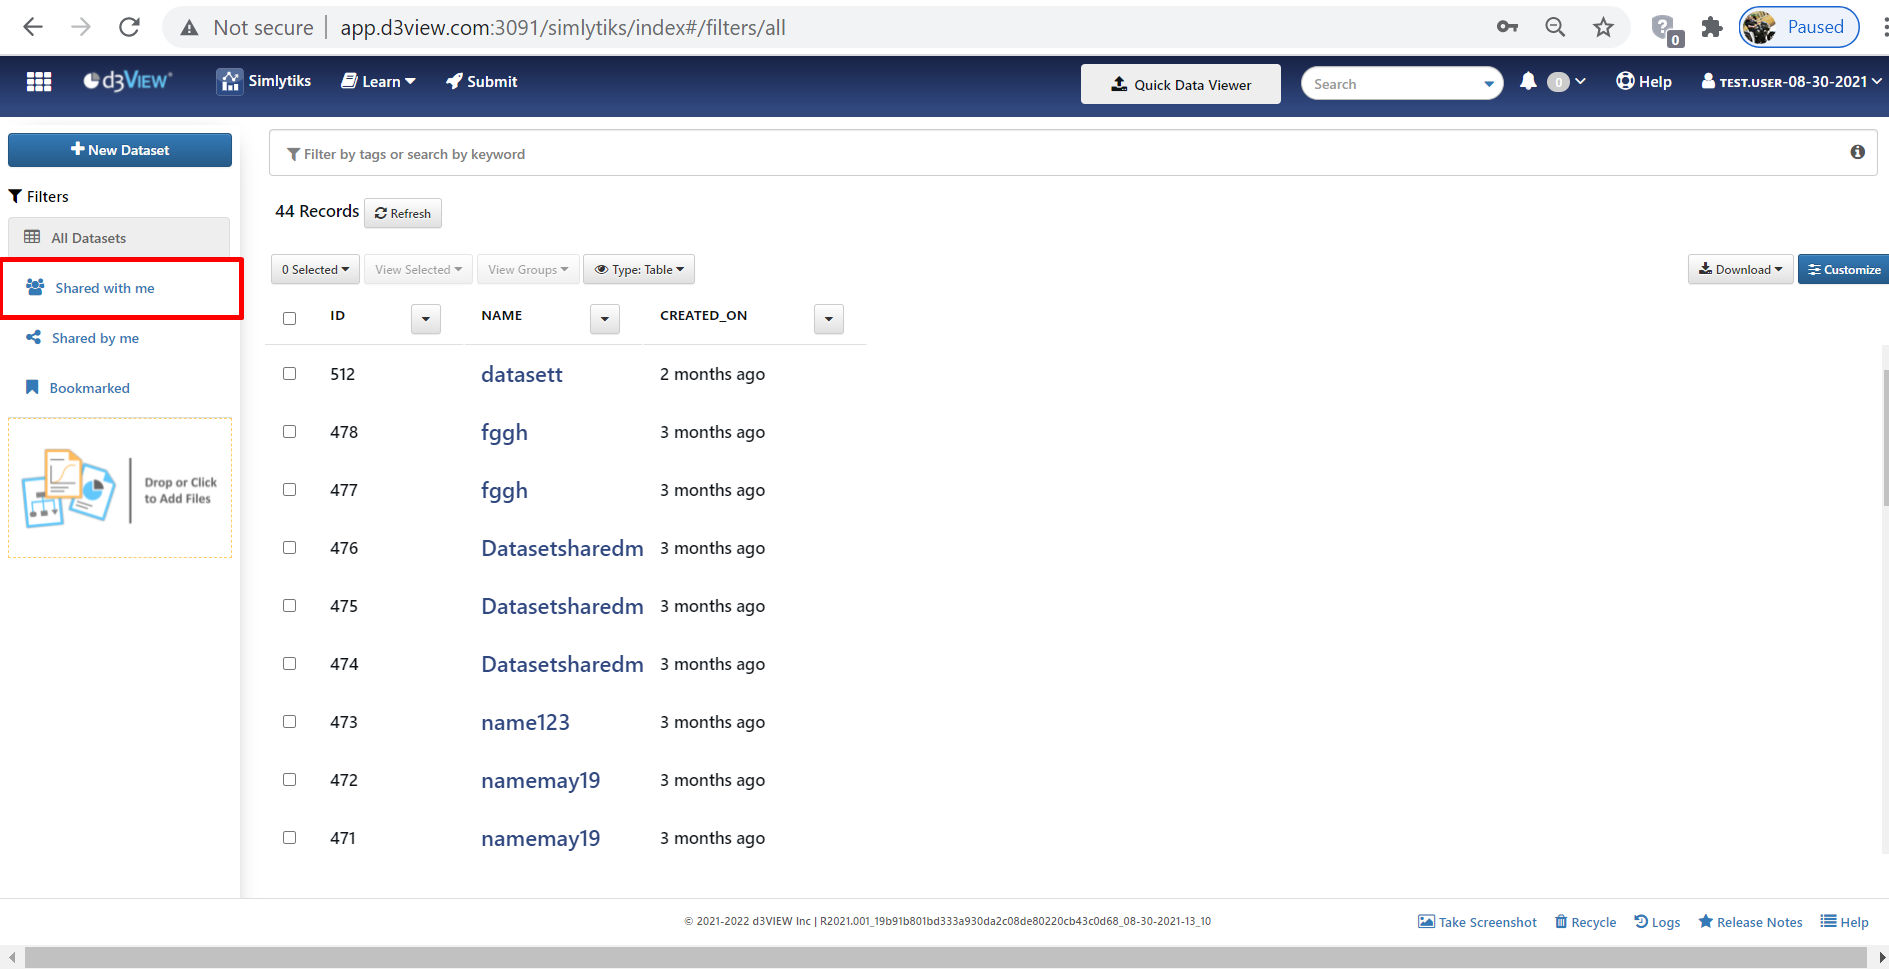
15. How do I view dashboards that are shared with me?
Shared dashboards are accessible through the data table on the Simlytiks front page. Choose the ‘Shared with me’ filter on the left side panel to view dashboards that have been shared by others.
Tags: Shared with me, Dataset
Shared with me
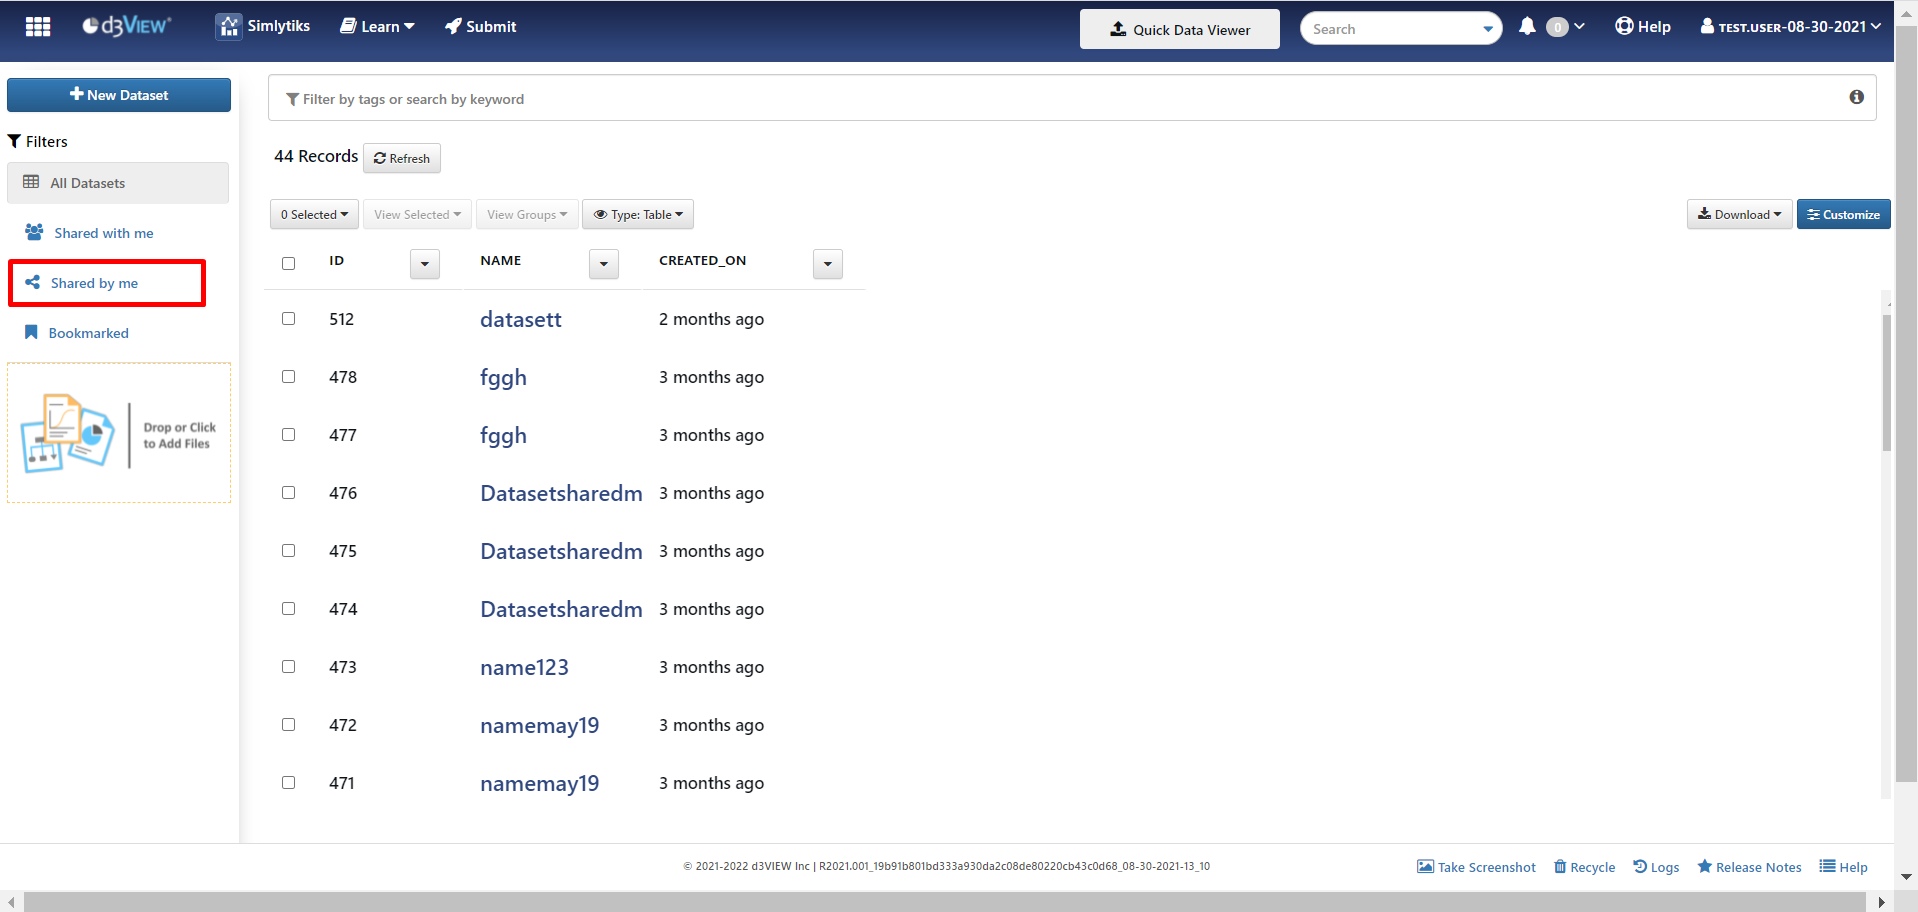
16. How do I view dashboards that I have shared with others?
Shared dashboards are accessible through the data table on the Simlytiks front page. Choose the ‘Shared by me’ filter on the left side panel to view dashboards that have been shared with others.
Tags: Shared by me, Dataset
Shared by me
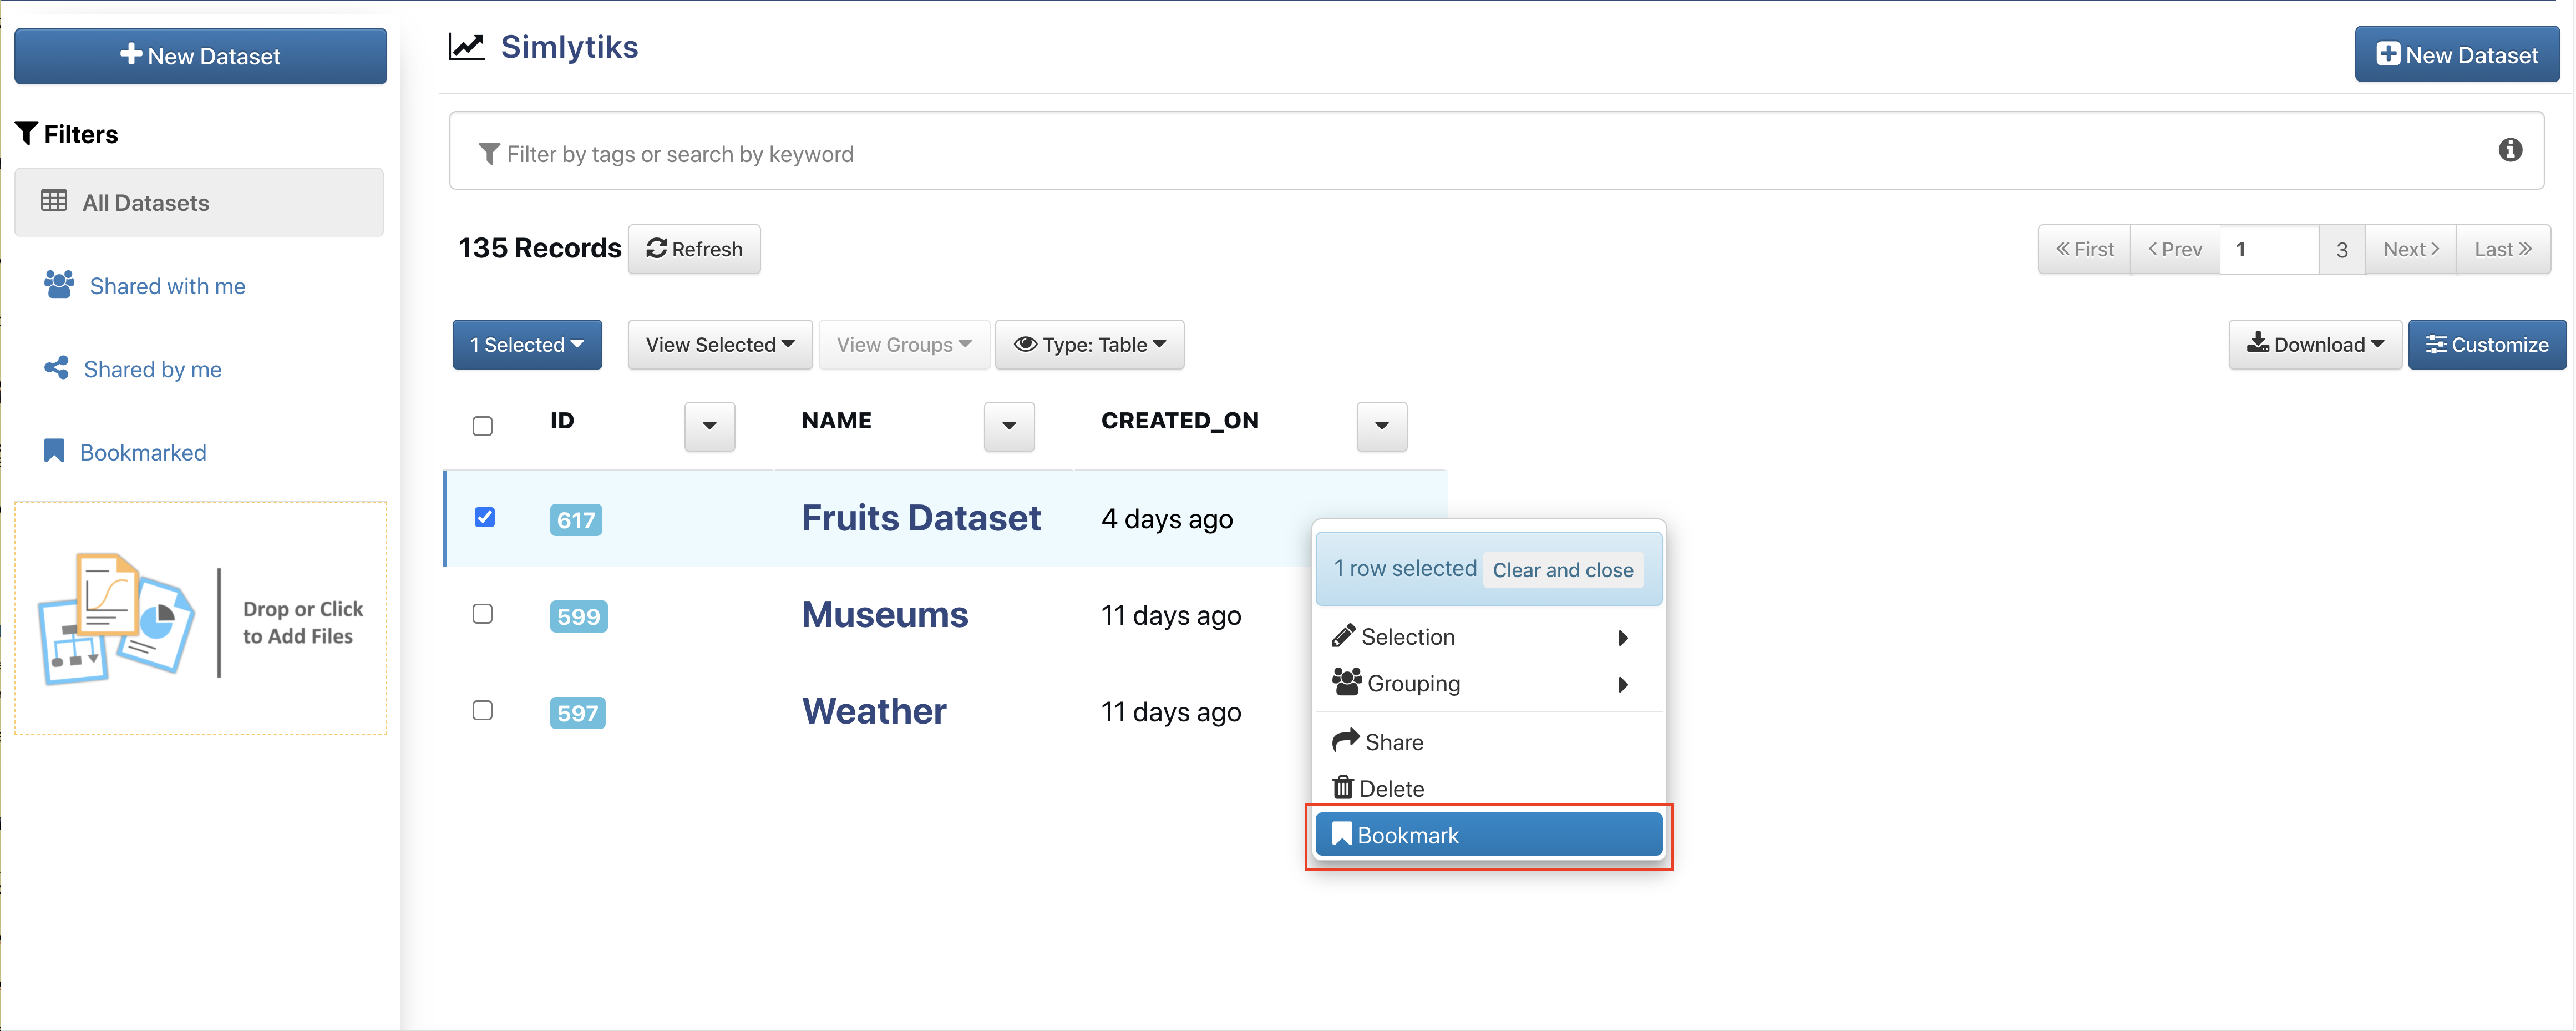
17. Can I save important dashboards to a special folder?
We can bookmark dashboards that are important by right-clicking on the dashboard and choosing ‘Bookmark’. Then, we can access these bookmarked dashboards separately by choosing the ‘Bookmarked’ filter in the left side panel.
Tags: Bookmarked, Dataset
Bookmarked
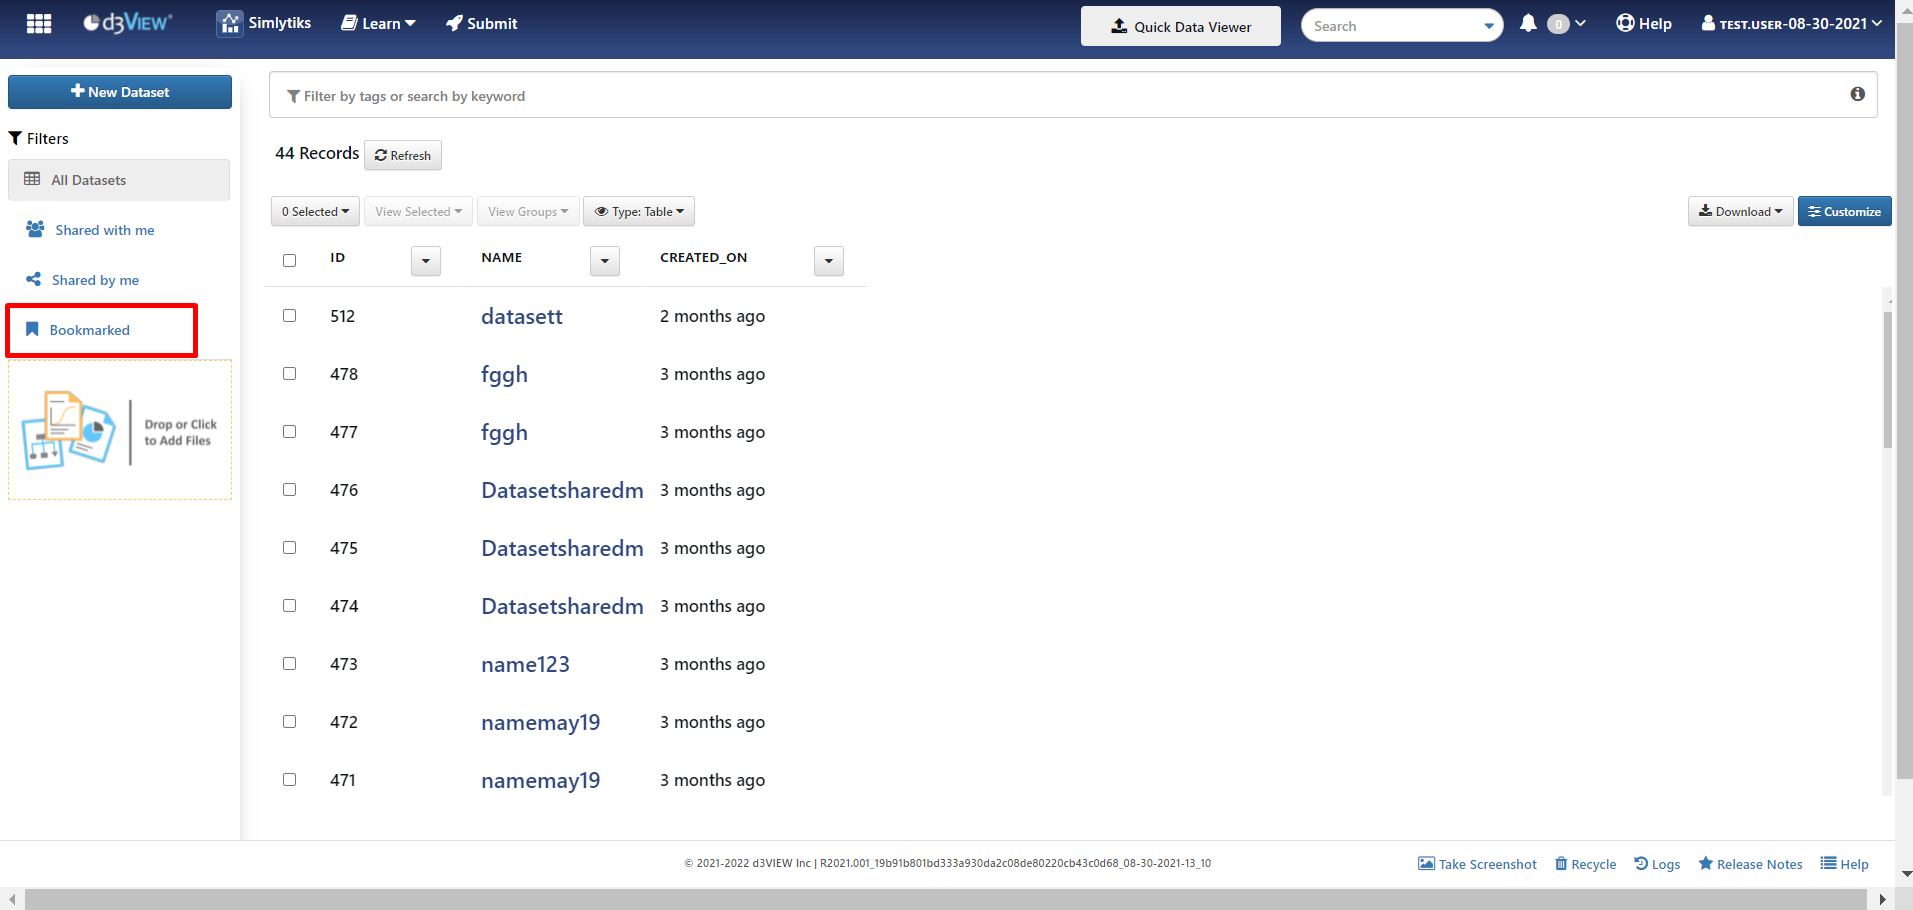
18. How do I view my bookmarked dashboards?
Bookmarked dashboards are accessible through the data table on the Simlytiks front page. Choose the ‘Bookmarked’ filter on the left side panel to view dashboards that have been bookmarked.
Tags: Bookmarked, Dataset
Bookmarked
19. How do I select, deselect, group, share, edit or delete dashboards?
Dashboard data table commands can be found under ‘Selected’ after selecting desired records. They can also be found by right-clicking on a dashboard record.
Tags: Selection, Dataset
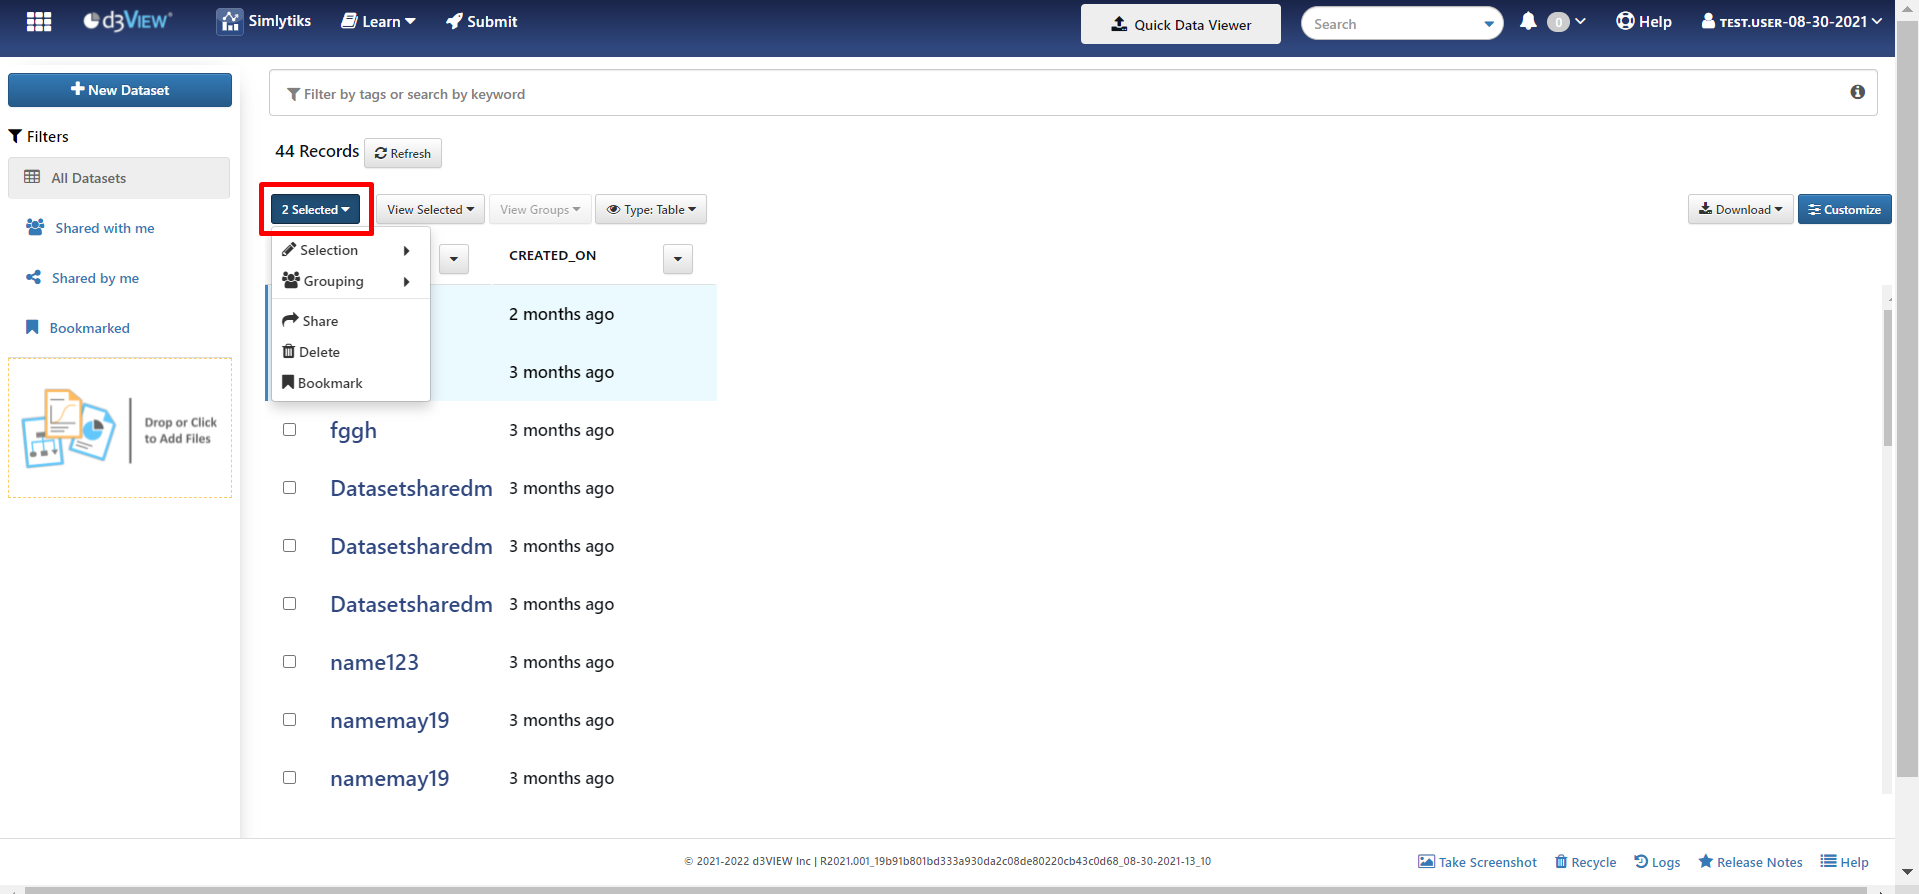
Selection
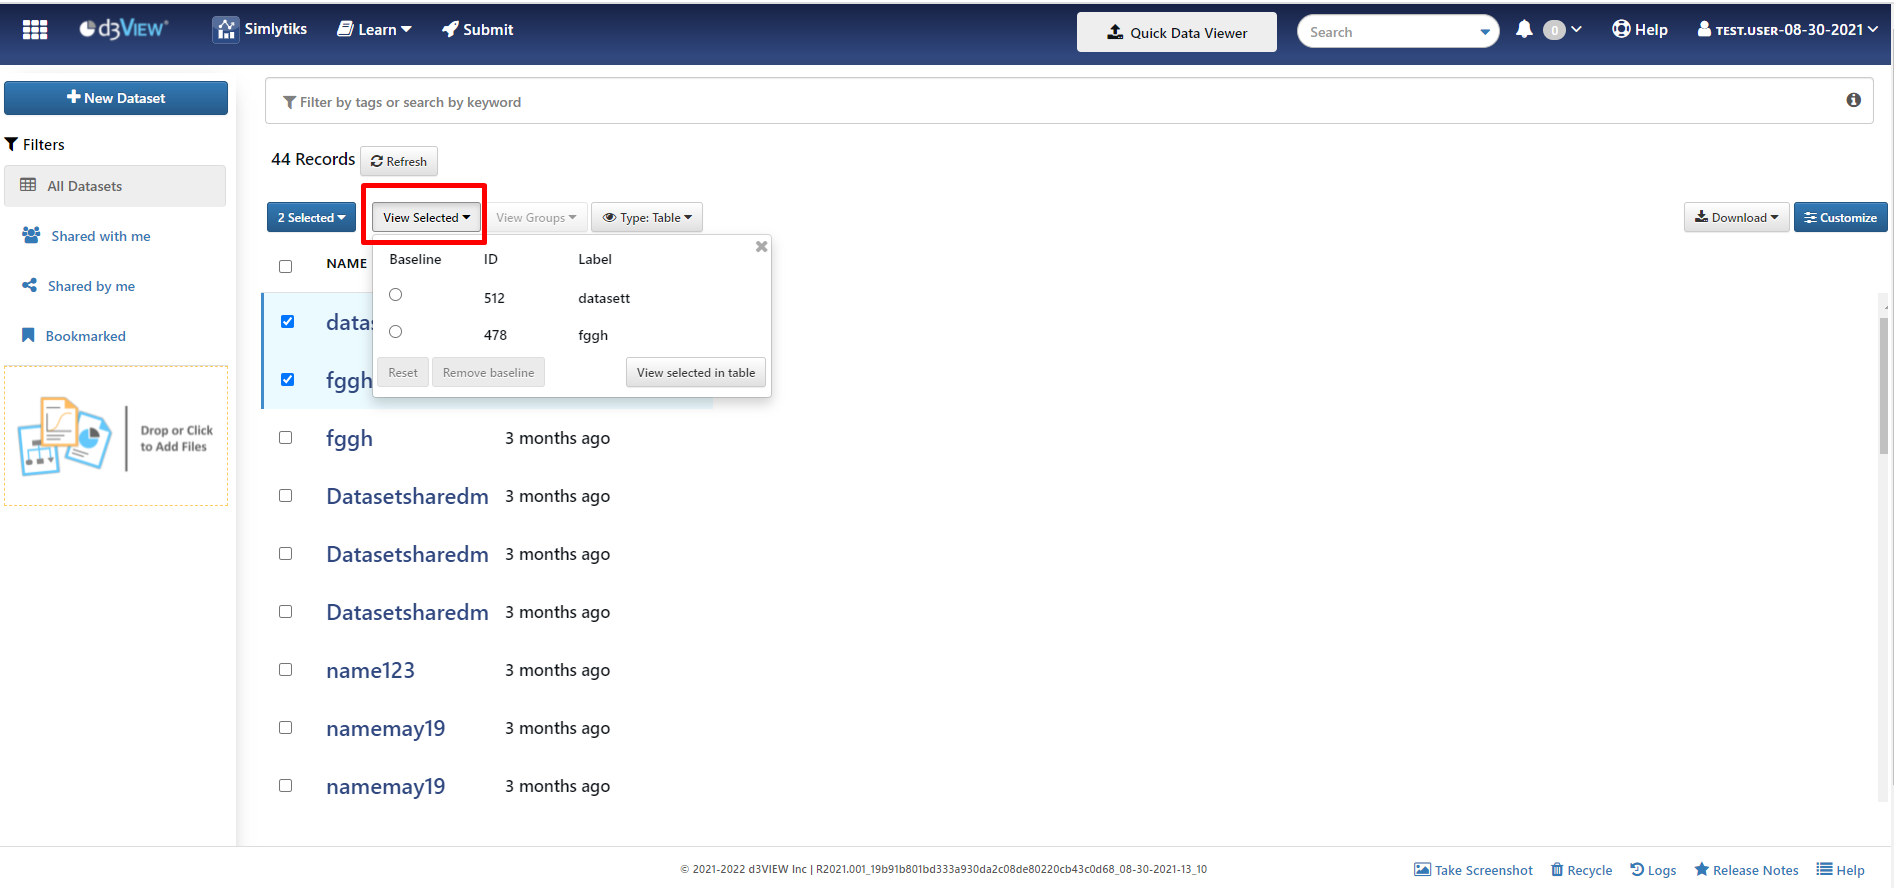
20. How do I view the selected records separately?
We can view the selected records separately by clicking on ‘View Selected’ under the ‘Selected’ dropdown or by right-clicking and choosing this option.
Tags: View selected, Dataset
View selected
21. How do I reset data after viewing selected?
After choosing ‘View Selected’ in the ‘Selected’ drop-down or right-click menu, choose ‘reset’ to go back to the original data table of dashboards.
Tags: Reset, Dataset
1.png)
Reset (View selected)
22. How do I remove baseline in view selected?
After selecting some records and viewing them using ‘view selected’, we can highlight a particular selected record by clicking on check box available next to the ID that is base line column. which makes easier in viewing a particular record. If we want to remove this baseline, we can remove it by clicking on ‘remove baseline’ in view selected window.
Tags: Remove baseline, Dataset
1.png)
Remove baseline (View selected)
23. How do I view selected records in table in View selected window?
Select some records in the table and click on ‘view selected’ to view only the selected records in the modal. If we want to view only these selected records in table, click on ‘view selected in table’ which shows only the selected records in table.
Tags: View selected in table, Dataset
1.png)
View selected in table (View selected)
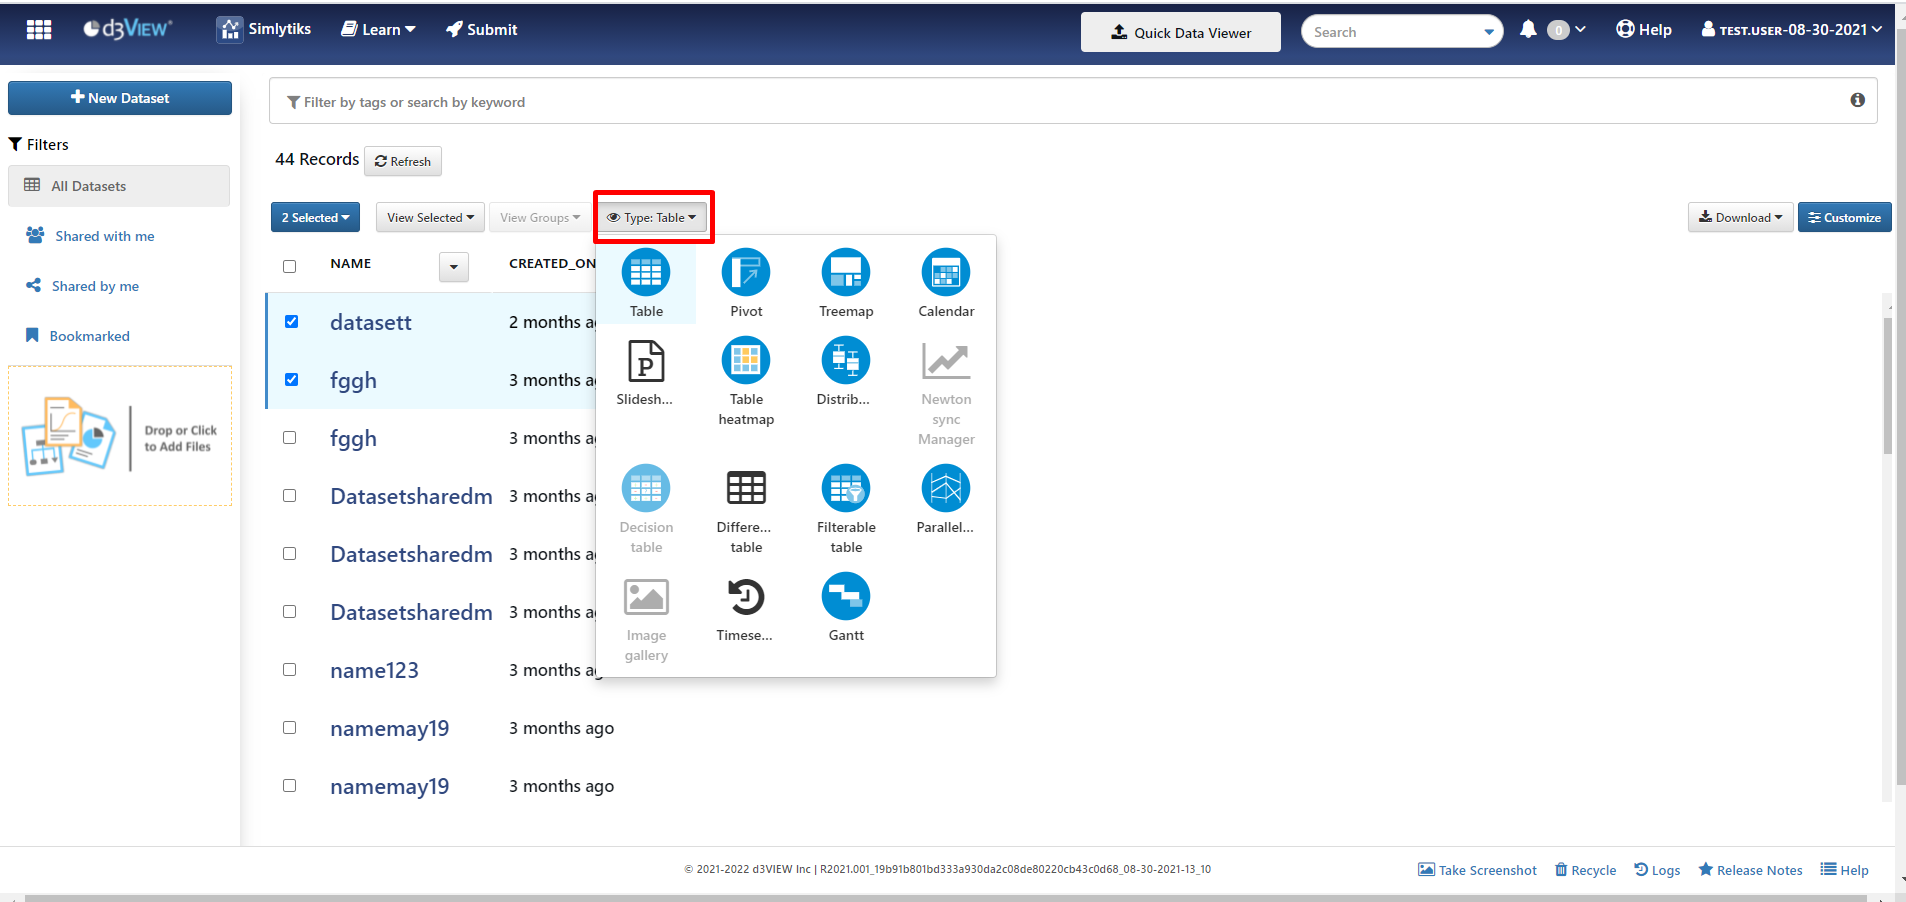
24. How do I view different table types for records?
By default records in home page will be shown in table format, if we want to view records in different view types, click on ‘Type’ and select any of the view types ex: Pivot table, Heat map, etc.
Tags: Type table, Dataset
Type Table
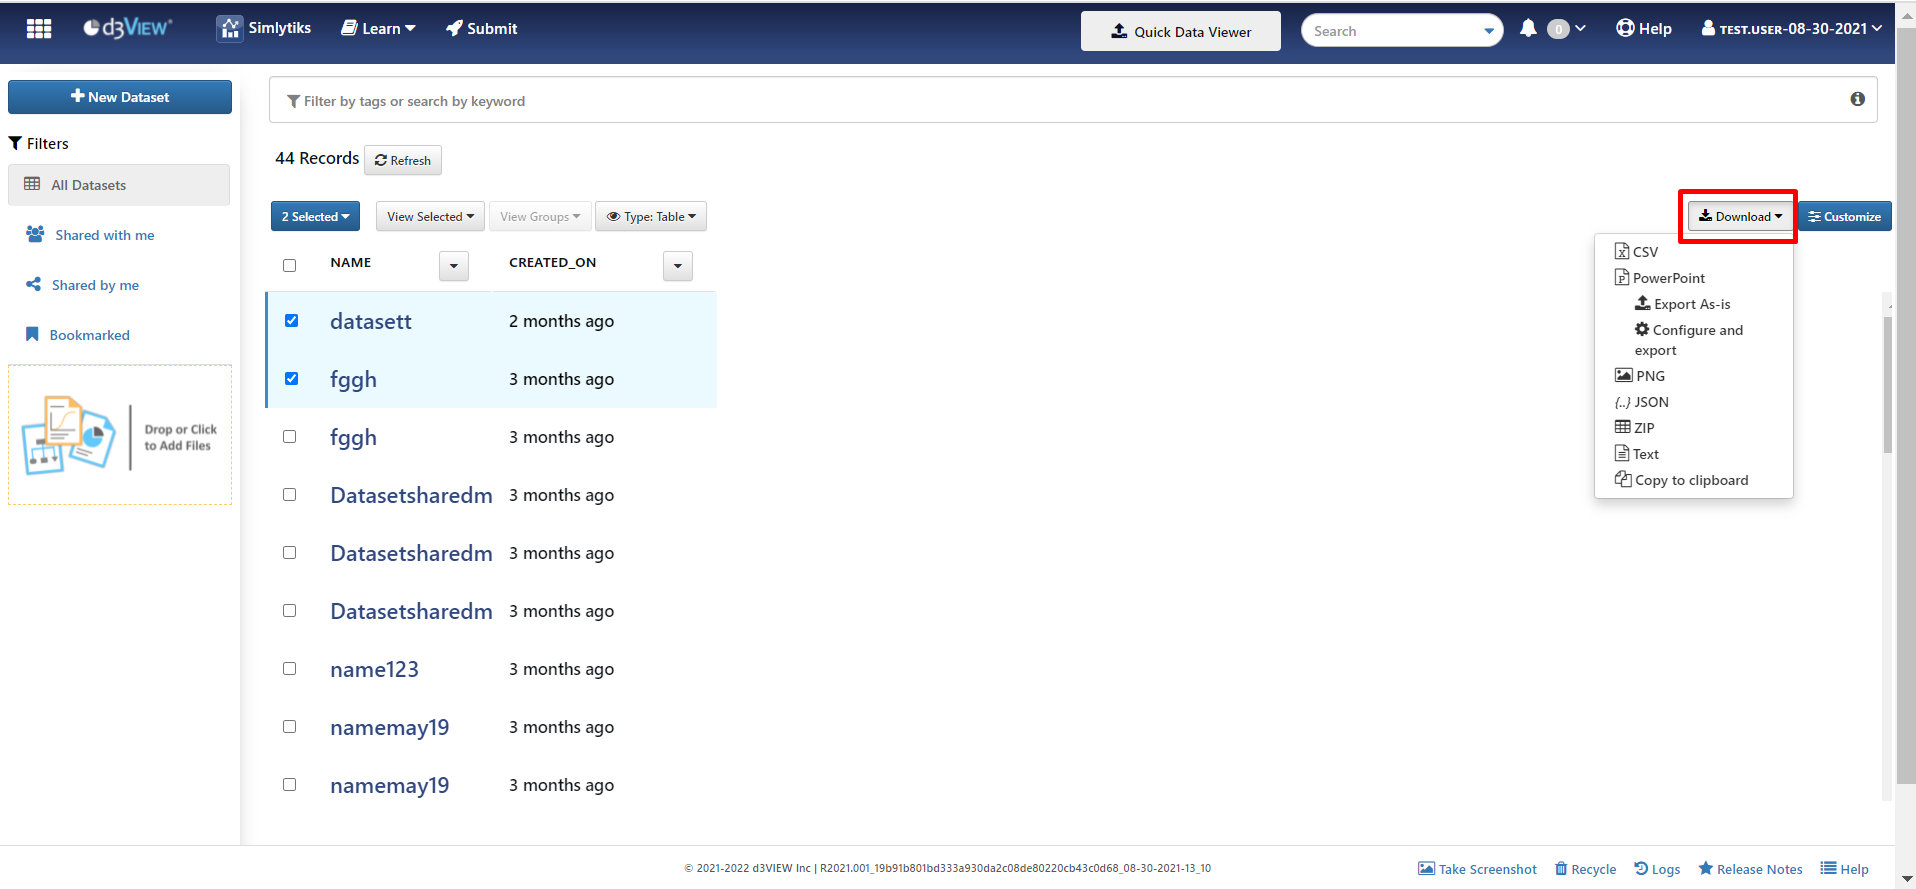
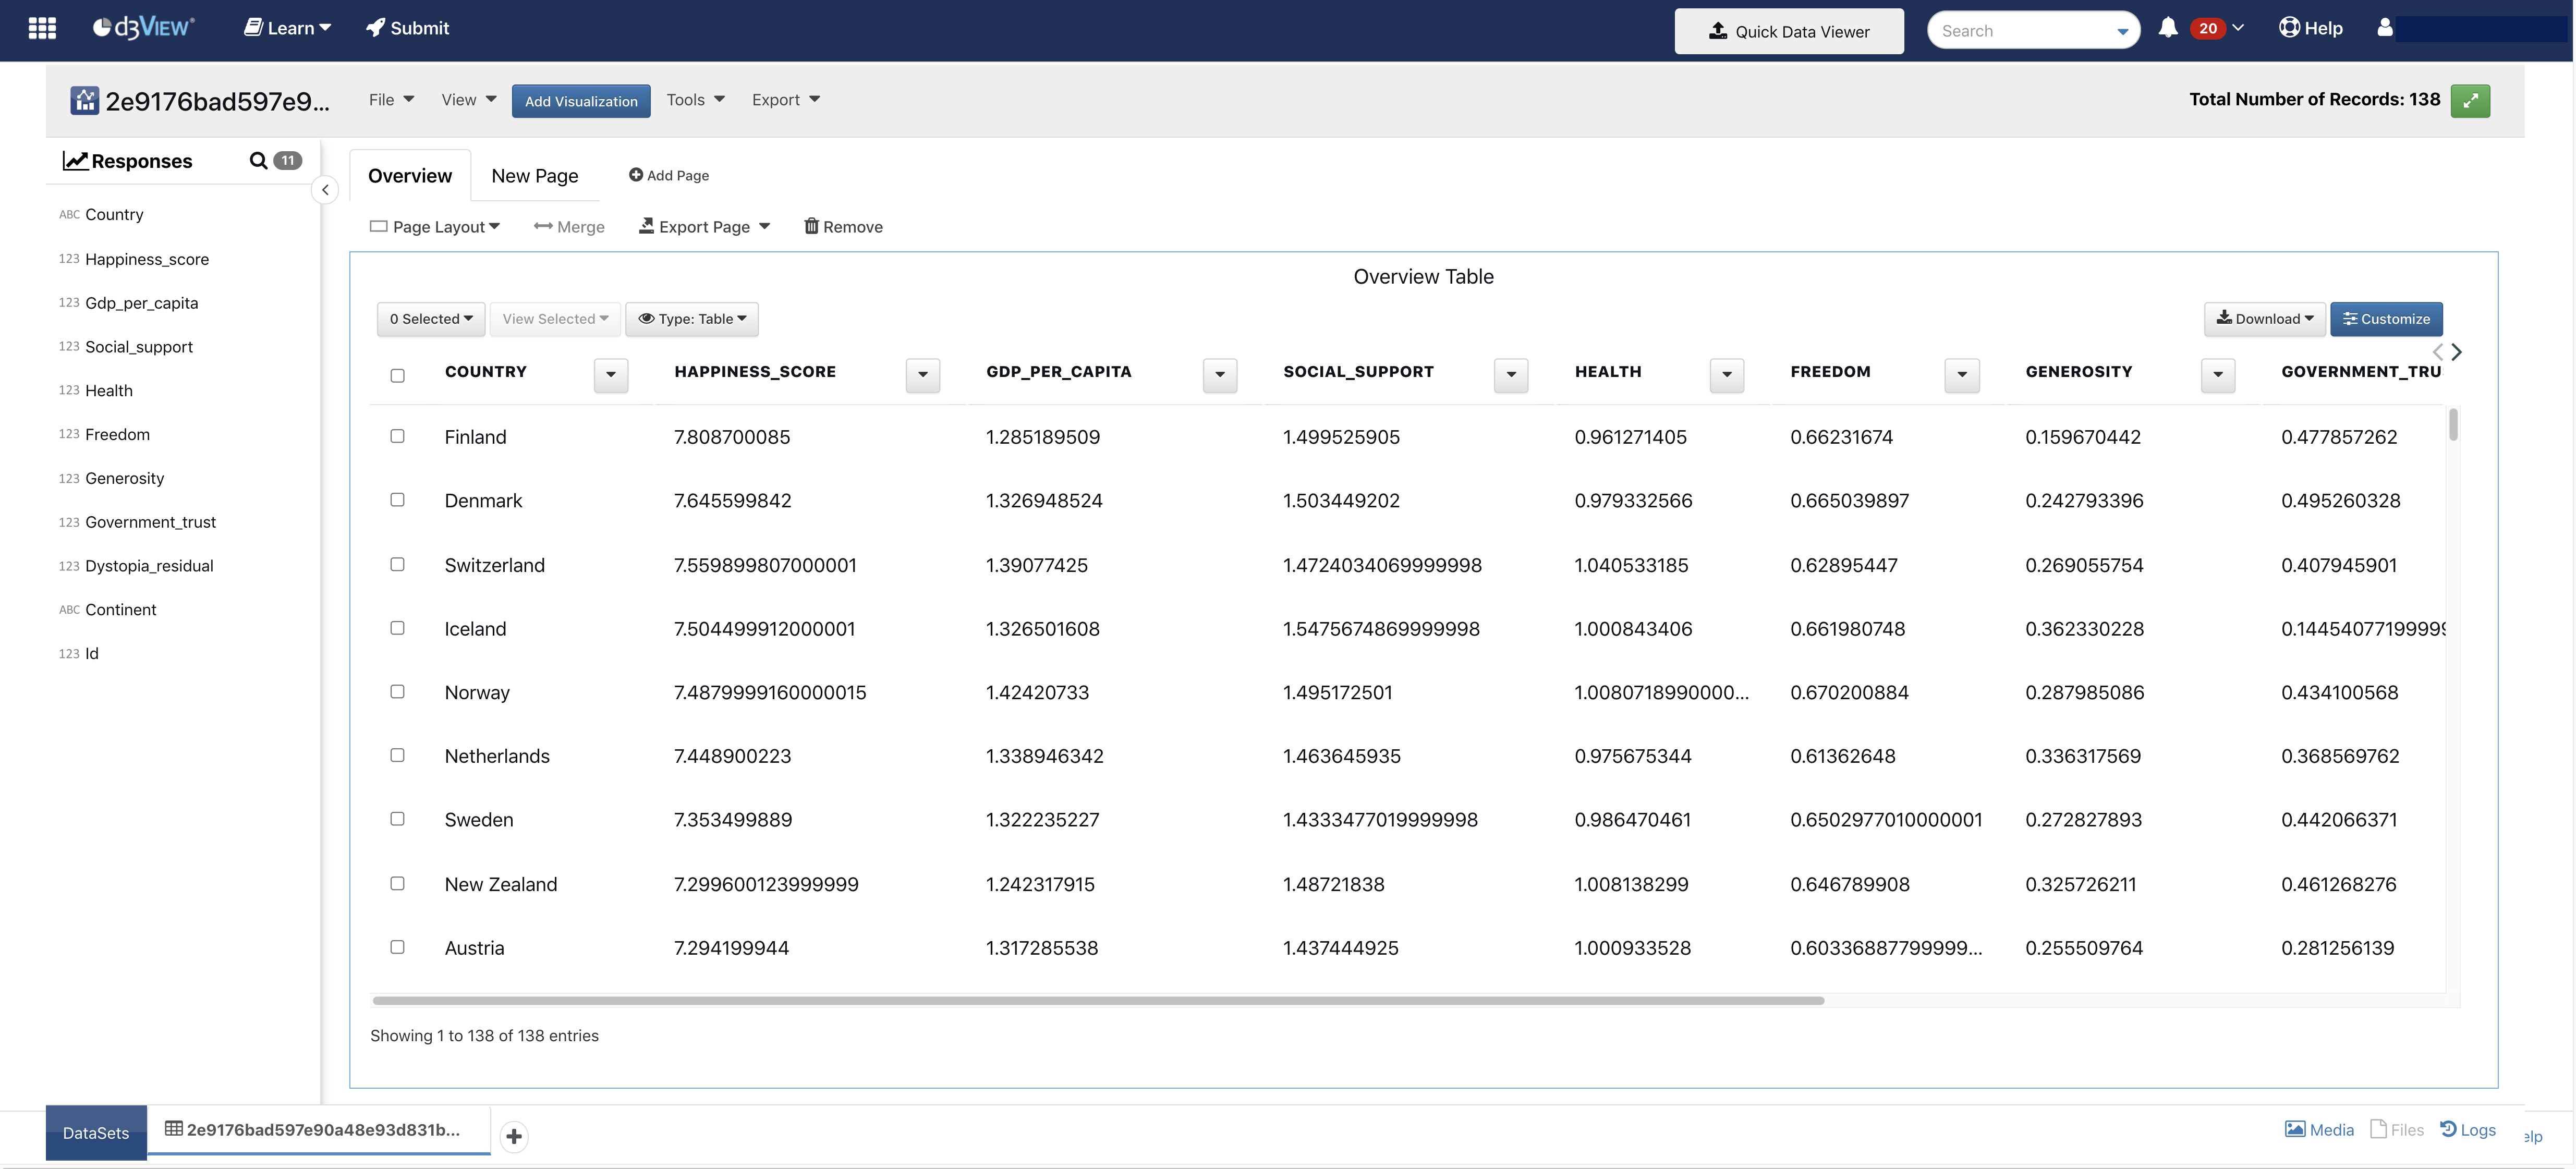
25. How do I download records of the page?
We can export data table in different formats, to download click on ‘download’ available towards the right side of the table and select any one of the available formats ex: CSV/ PPT/ JSON/ Image etc, to download records accordingly.
Tags: Download, Dataset
Download
26. How do I customize columns and preferences for records?
We can customize data table in terms of columns as well as font settings. Click on ‘customize’ button available towards the right side of the table and in ‘preferences’, we can change settings like font size, weight, and border for the data table text and using ‘Reorder columns’ we can choose columns for the data table so that we can avoid unwanted columns and we can view only necessary columns.
Tags: Customize, Dataset
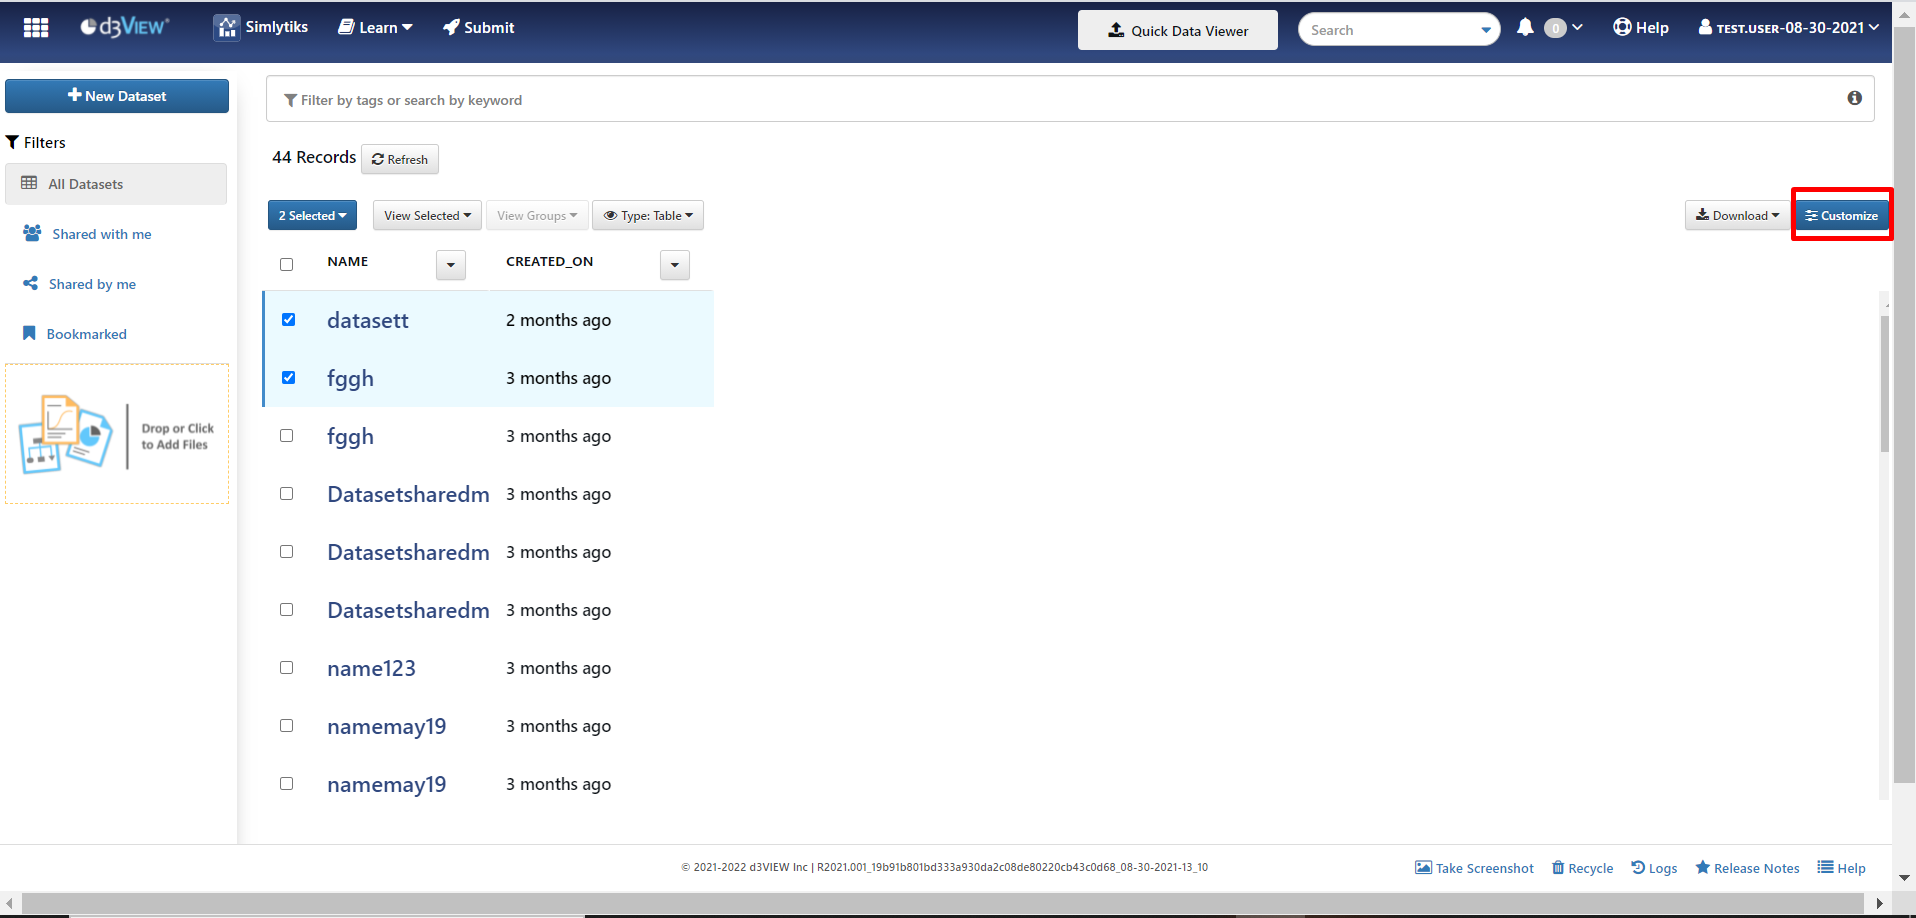
Customize
27. How do I sort order for record columns?
We can arrange each column inputs using sort button available at the top of each column. Using this button, we can arrange inputs in ‘ascending’ or ‘descending’ order also we can apply threshold/filter to filter records accordingly.
Tags: Sorting, Dataset
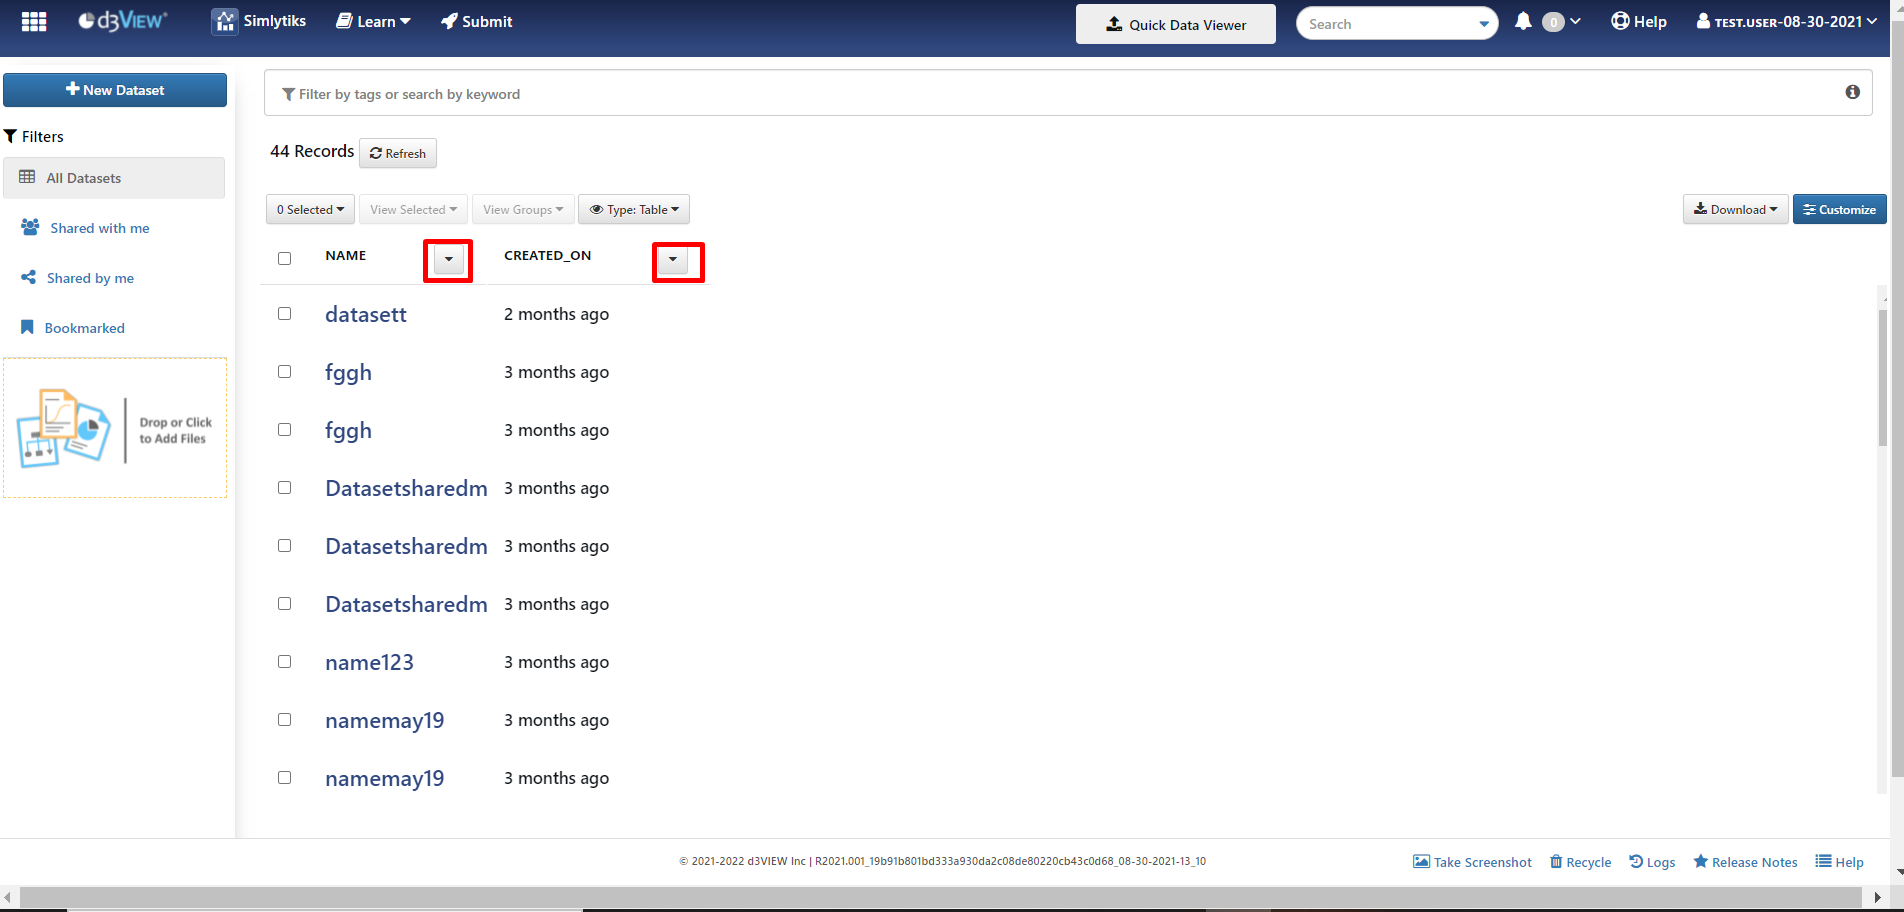
Sorting
28. How do I sort record columns in Ascending order?
We can sort/arrange records in ‘ascending’ order by clicking on sort button available for each column and then click on ‘ascending’ to arrange records in alphabetical order.
Tags: Sorting, Dataset
1.png)
Ascending (Sorting)
29. How do I sort record columns in Descending order?
We can sort/arrange records in ‘descending’ order by clicking on sort button available for each column and then click on ‘descending’ to arrange records from Z-A order.
Tags: Sorting, Dataset
1.png)
Descending (Sorting)
30. How do I add filters to records in sorting?
We can filter records by applying threshold/ filter, click on filters available Sorting Button and click on add filters where we can select operator from the dropdown and provide keyword based on the selected operator to filter records accordingly.
Tags: Add filter, Dataset
1.png)
Add filter (Filters)
31. How do I view the sample Datasets list in Simlytiks?
As we know, we can create dataset in different ways one of them is from sample datasets. Clink on ‘new dataset’ which opens up a modal and click on sample datasets which is towards the right side to view available sample datasets. Further we can add more visualizations and explore different charts in Simlytiks. refer screenshot for more information.
Tags: Sample Datasets, Dataset
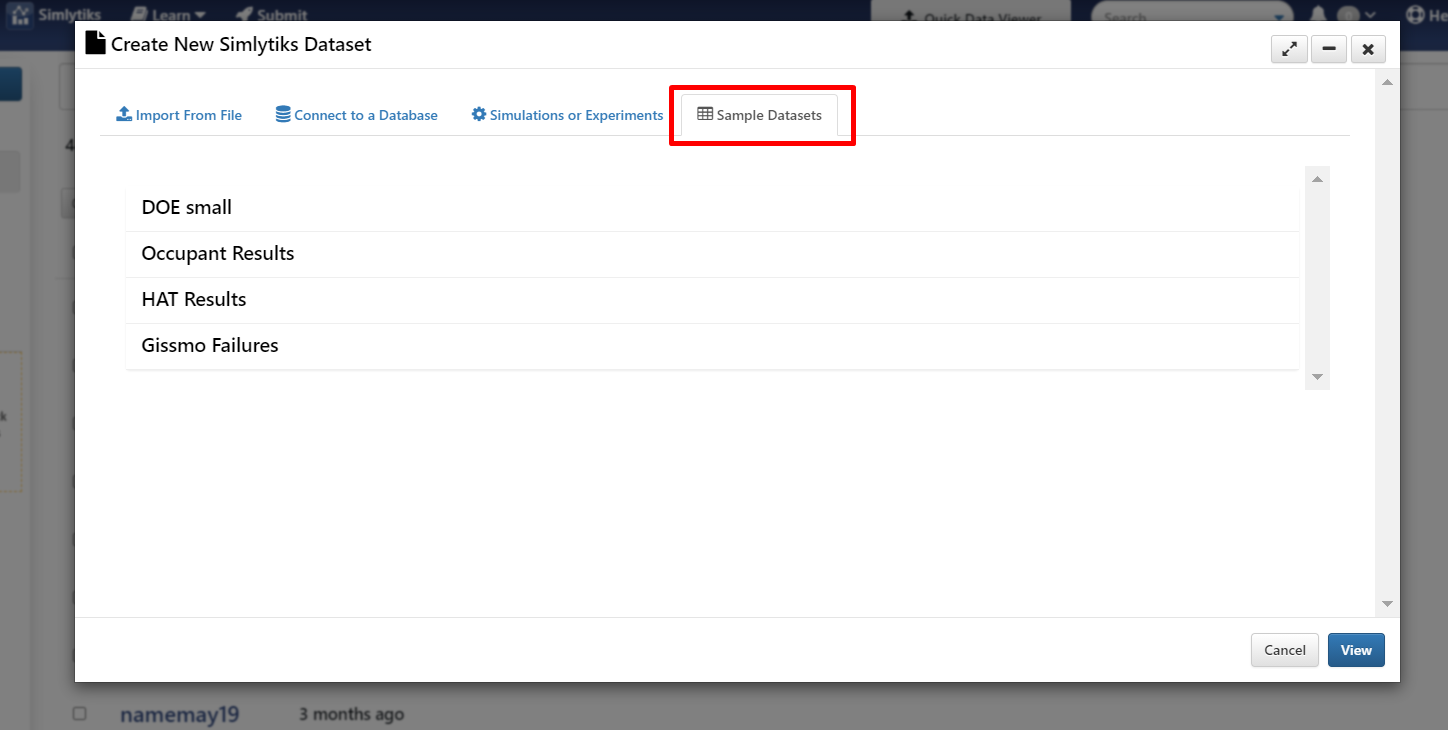
Sample Datasets
32. How do I import updated data into an existing exploration?
Under the File Menu, choose Import and open the updated dataset. Then when prompted, choose Replace existing to update your data.
Tags: Dataset, Data, Replace Data
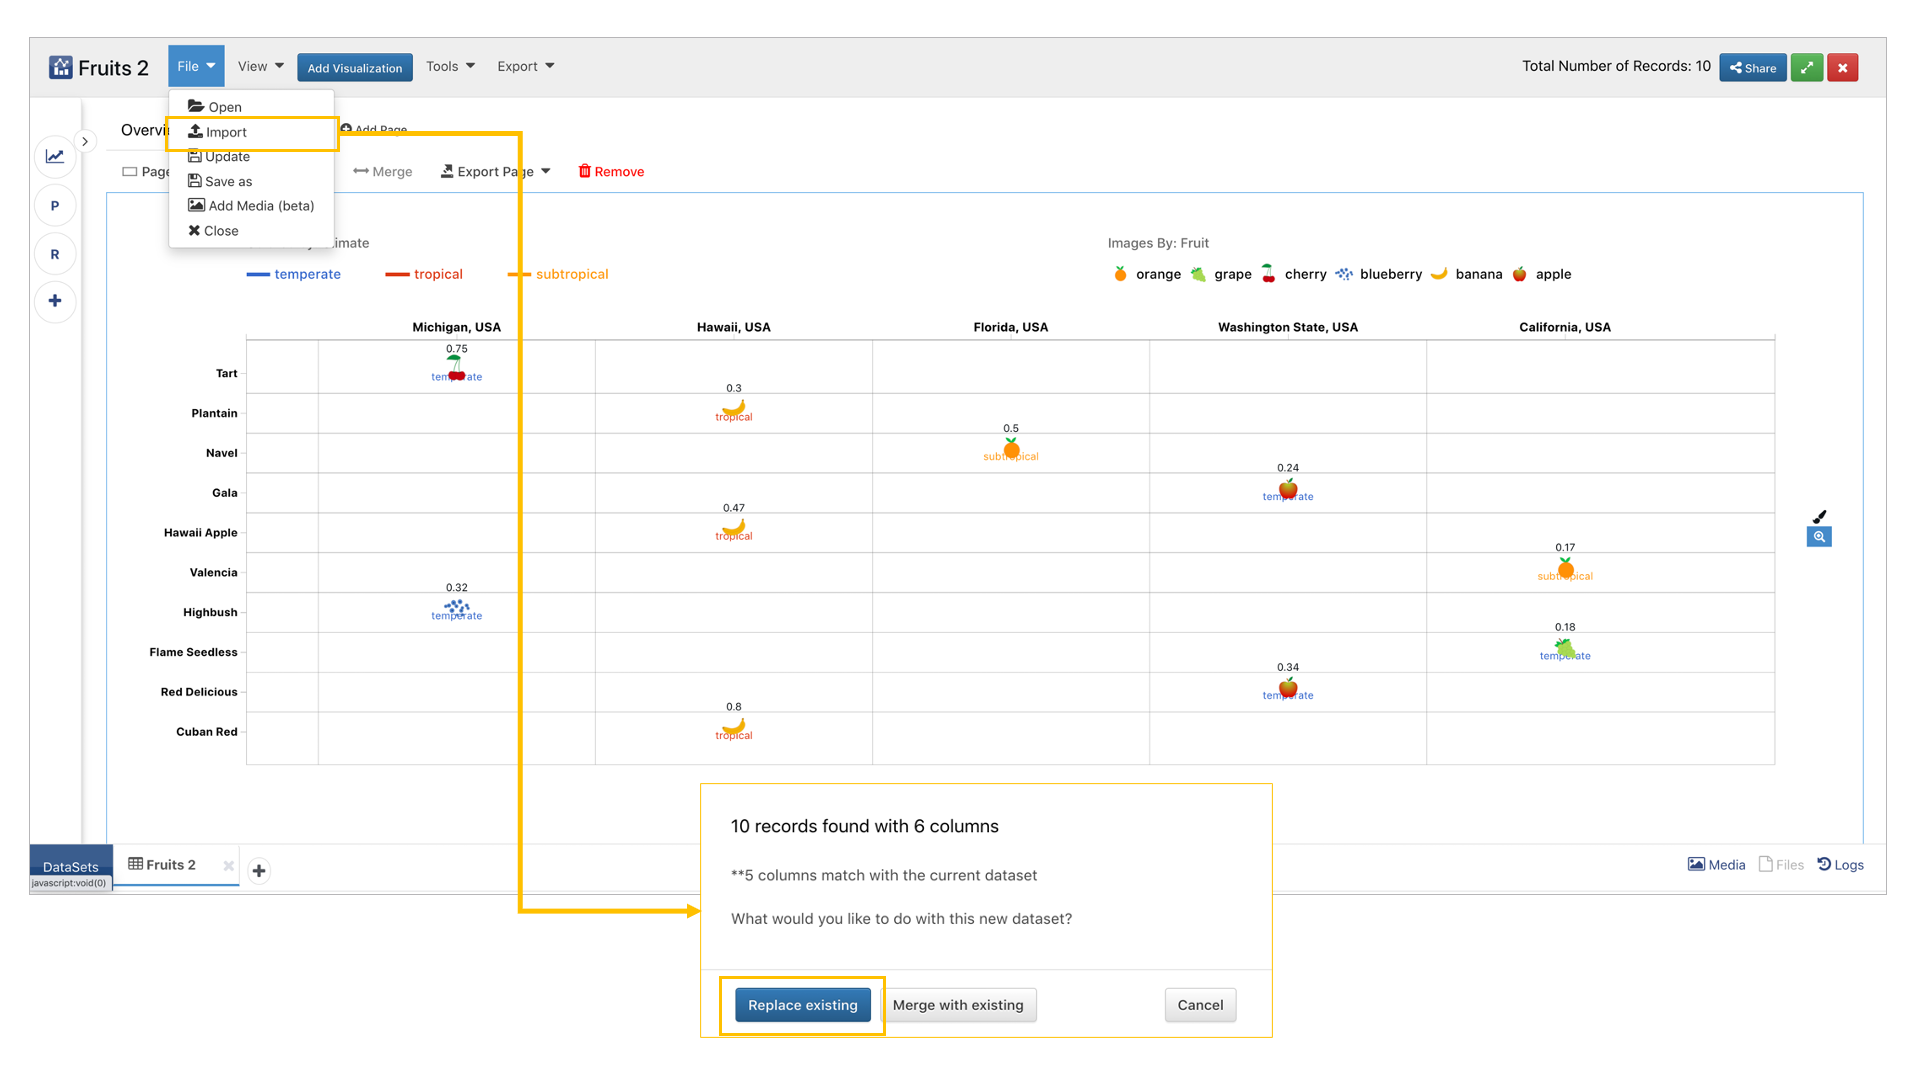
Update Data
Dashboard Customization
33. How do I change the name of data values in my data column?
Under the Tools Menu, choose Customize and tab over to the Aliases tab. Here, we can add different names for your data values without permanently changing them.
Tags: Customize, Data, Replace Data
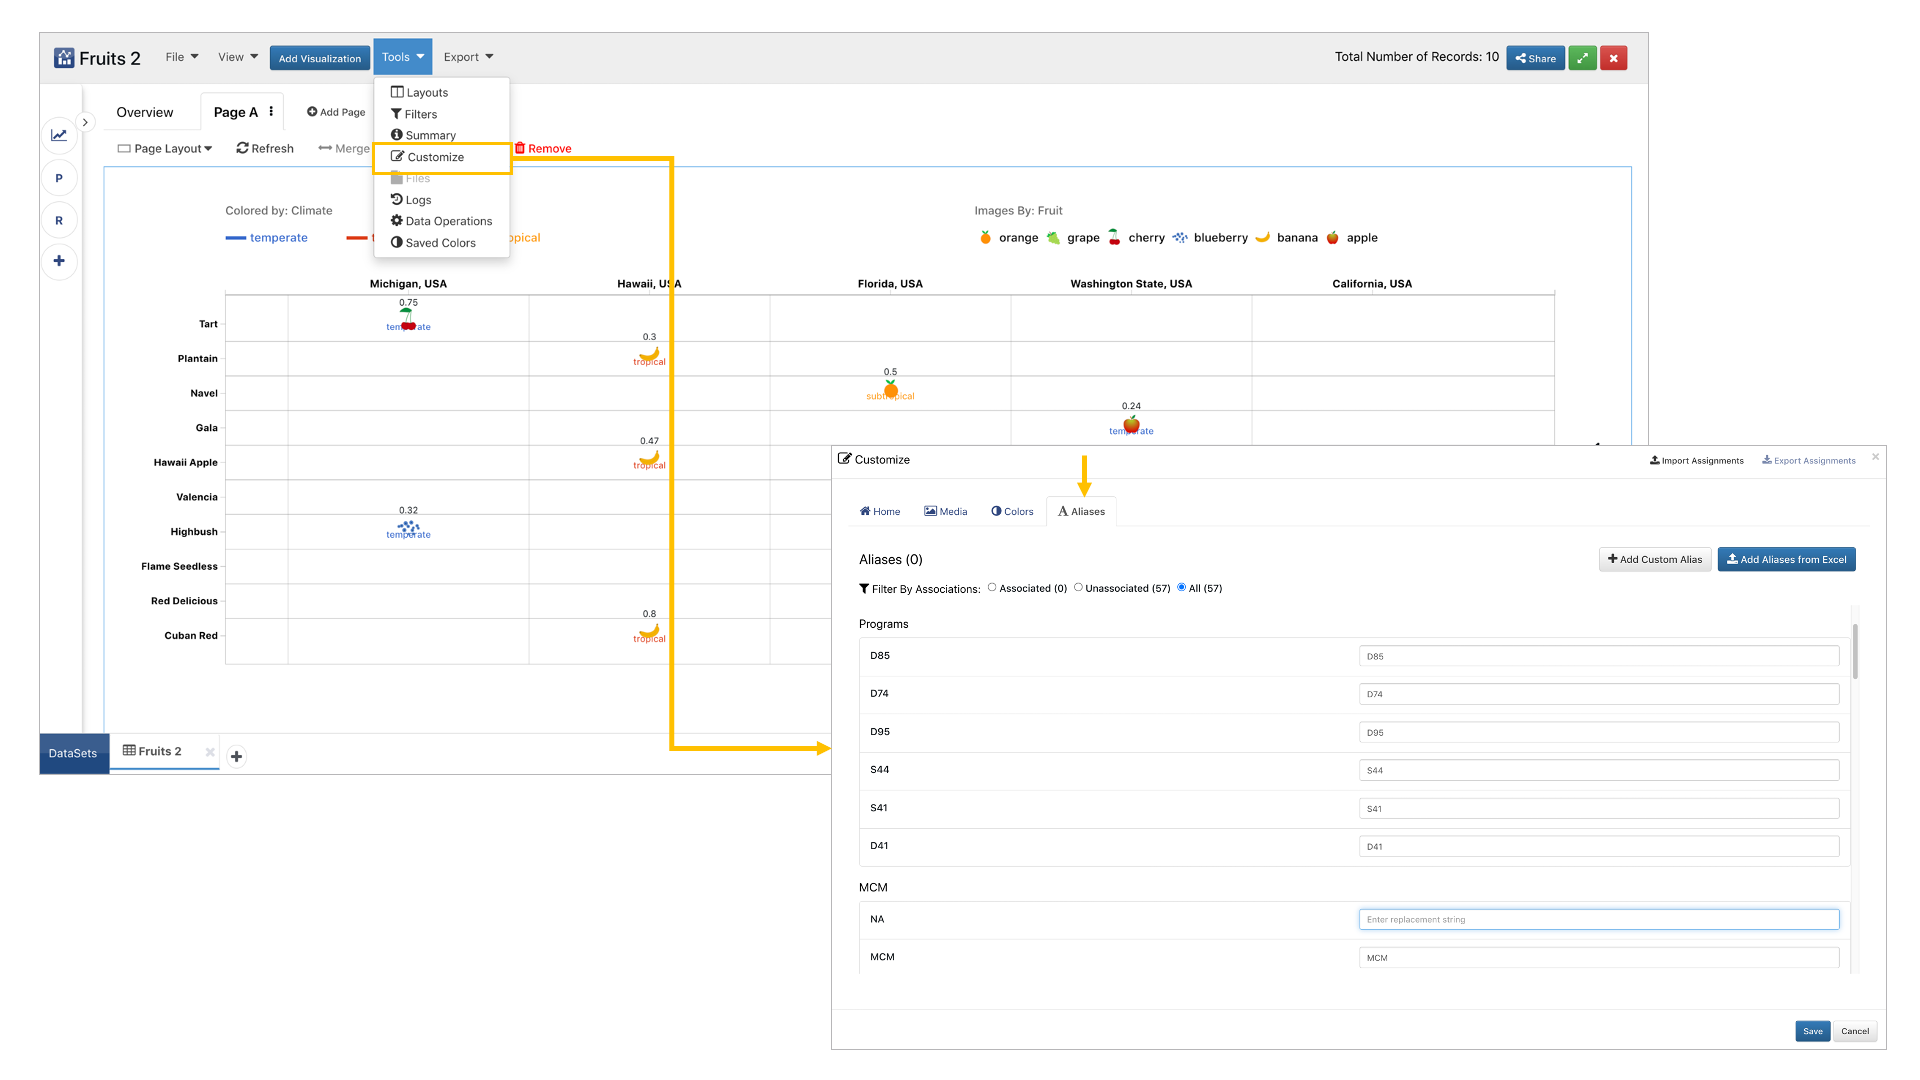
Custom Aliases
34. How do I upload media?
Under the File Menu, choose Upload Media to import images from the local machine.
Tags: Media, Images, Data
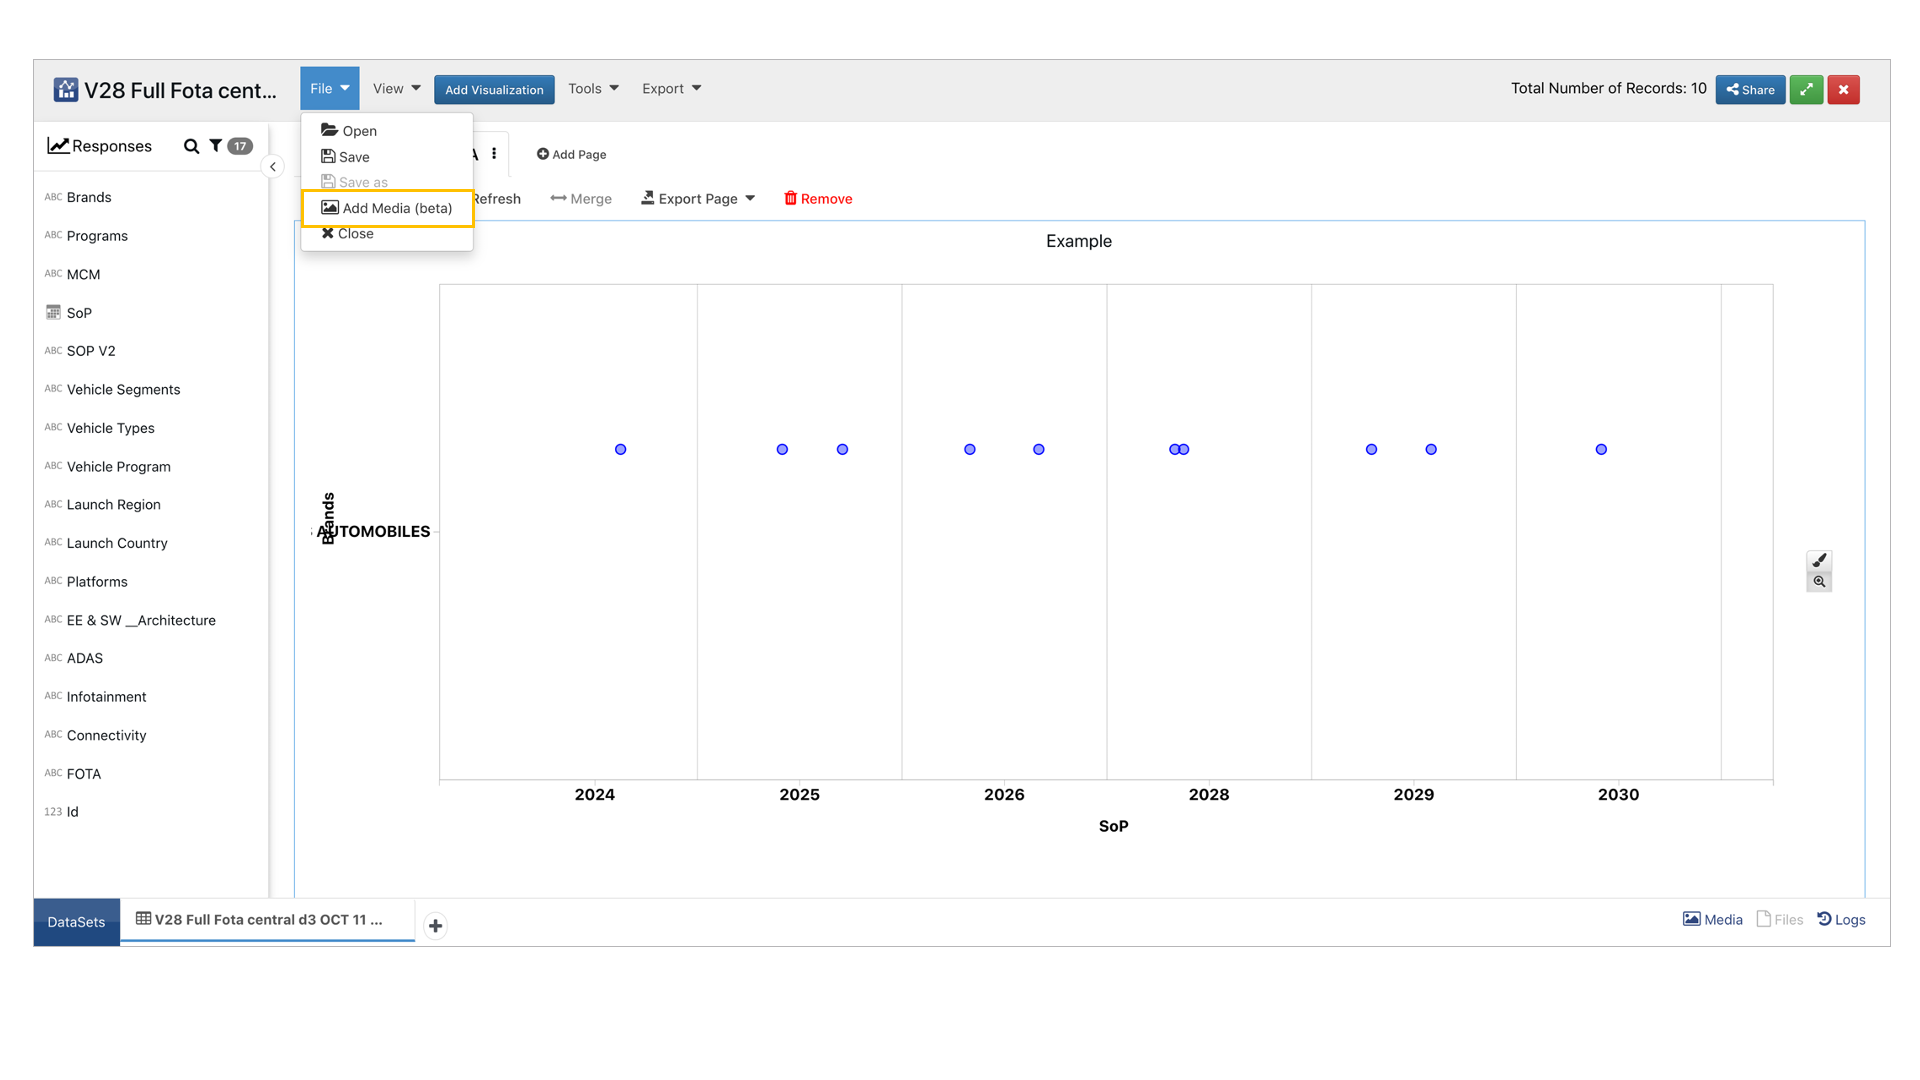
Upload Media
35. How do I assign my media to data?
Under the Tools Menu, choose Customize and tab over to the media tab. Here, we can choose a data column to grab values from, then drag-and-drop or auto-assign those values on the the images.
Tags: Media, Images, Data
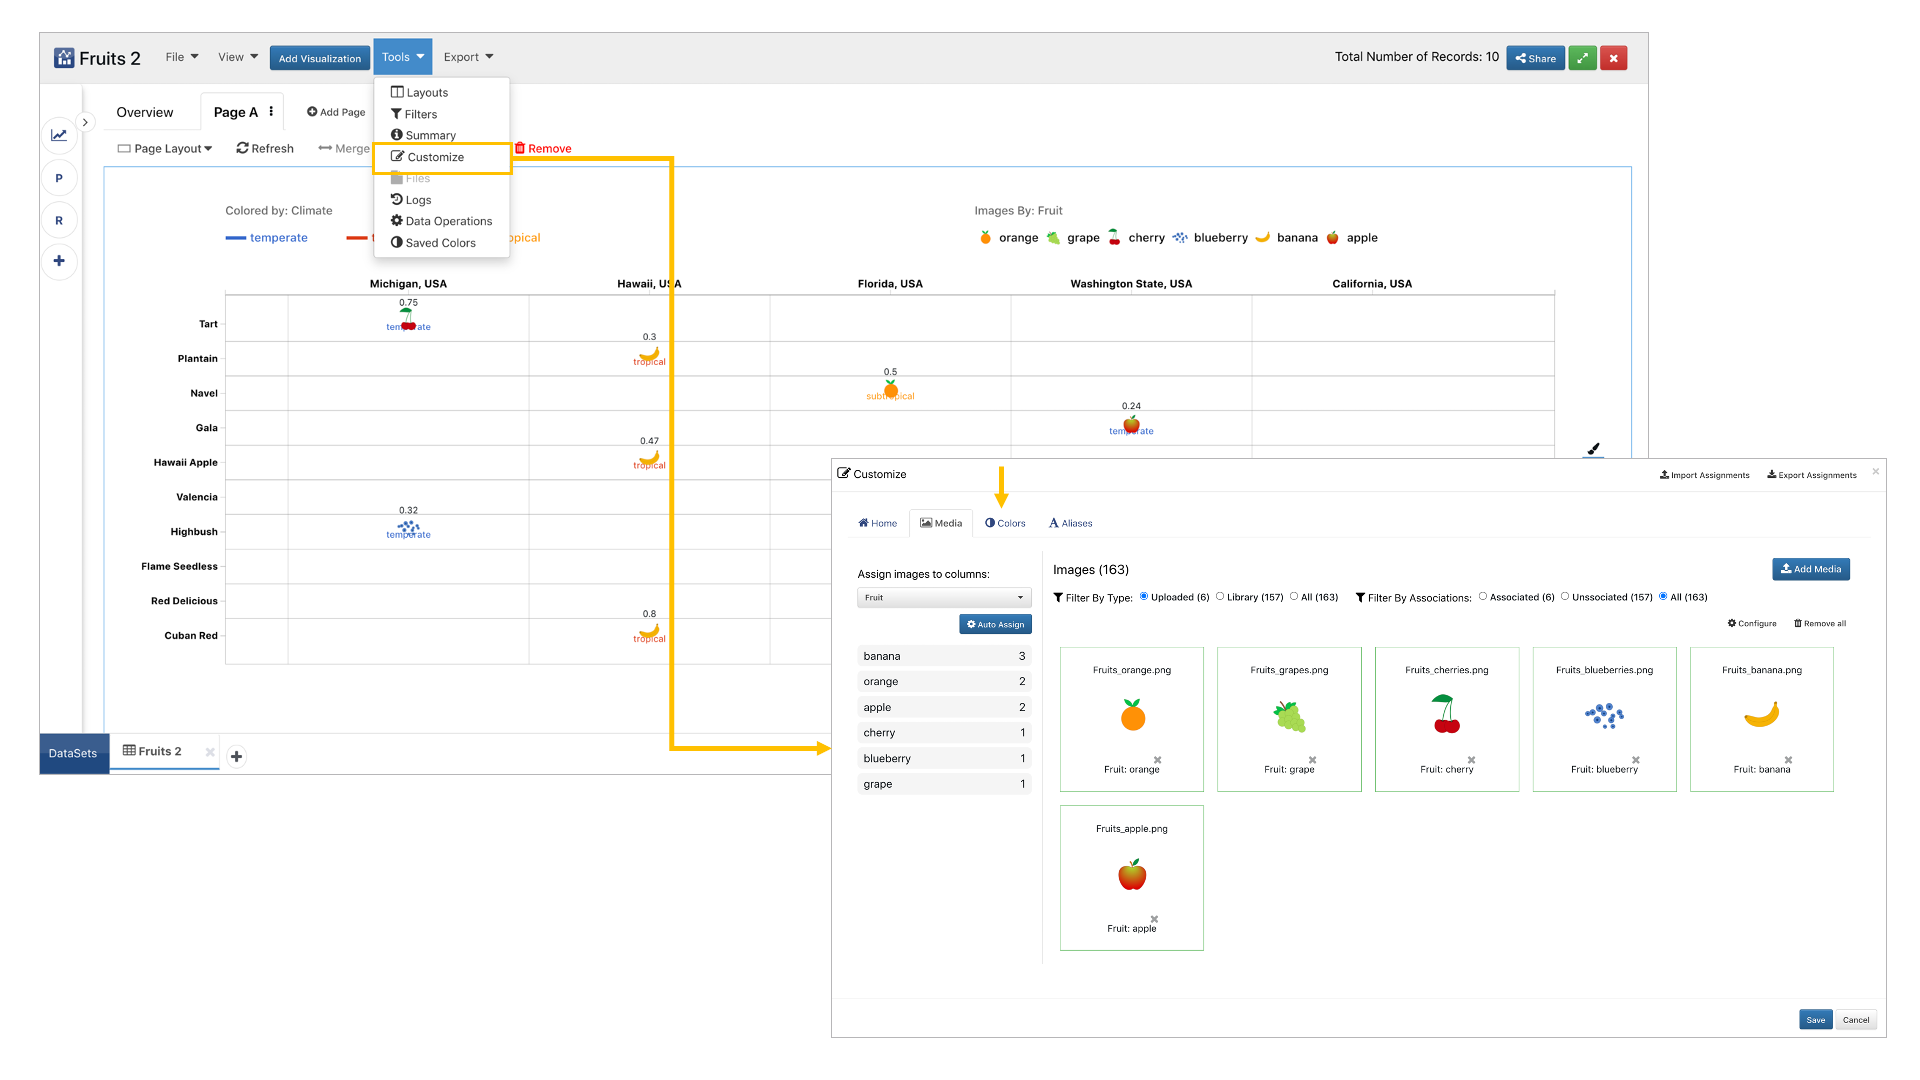
Assign Media
Dashboard Navigation
36. How do I save, update, add and edit media in Simlytiks?
After opening the dataset, click on file Dropdown button available in the top bar where we have options such as ‘open’ to merge another dataset with existing dataset, ‘save’ and ‘update’ dataset for updating versions, Add and Edit media where we can add media from local system and edit them which can be used while creating visualizations after assigning values and close dataset to close dataset.
Tags: File, Dataset
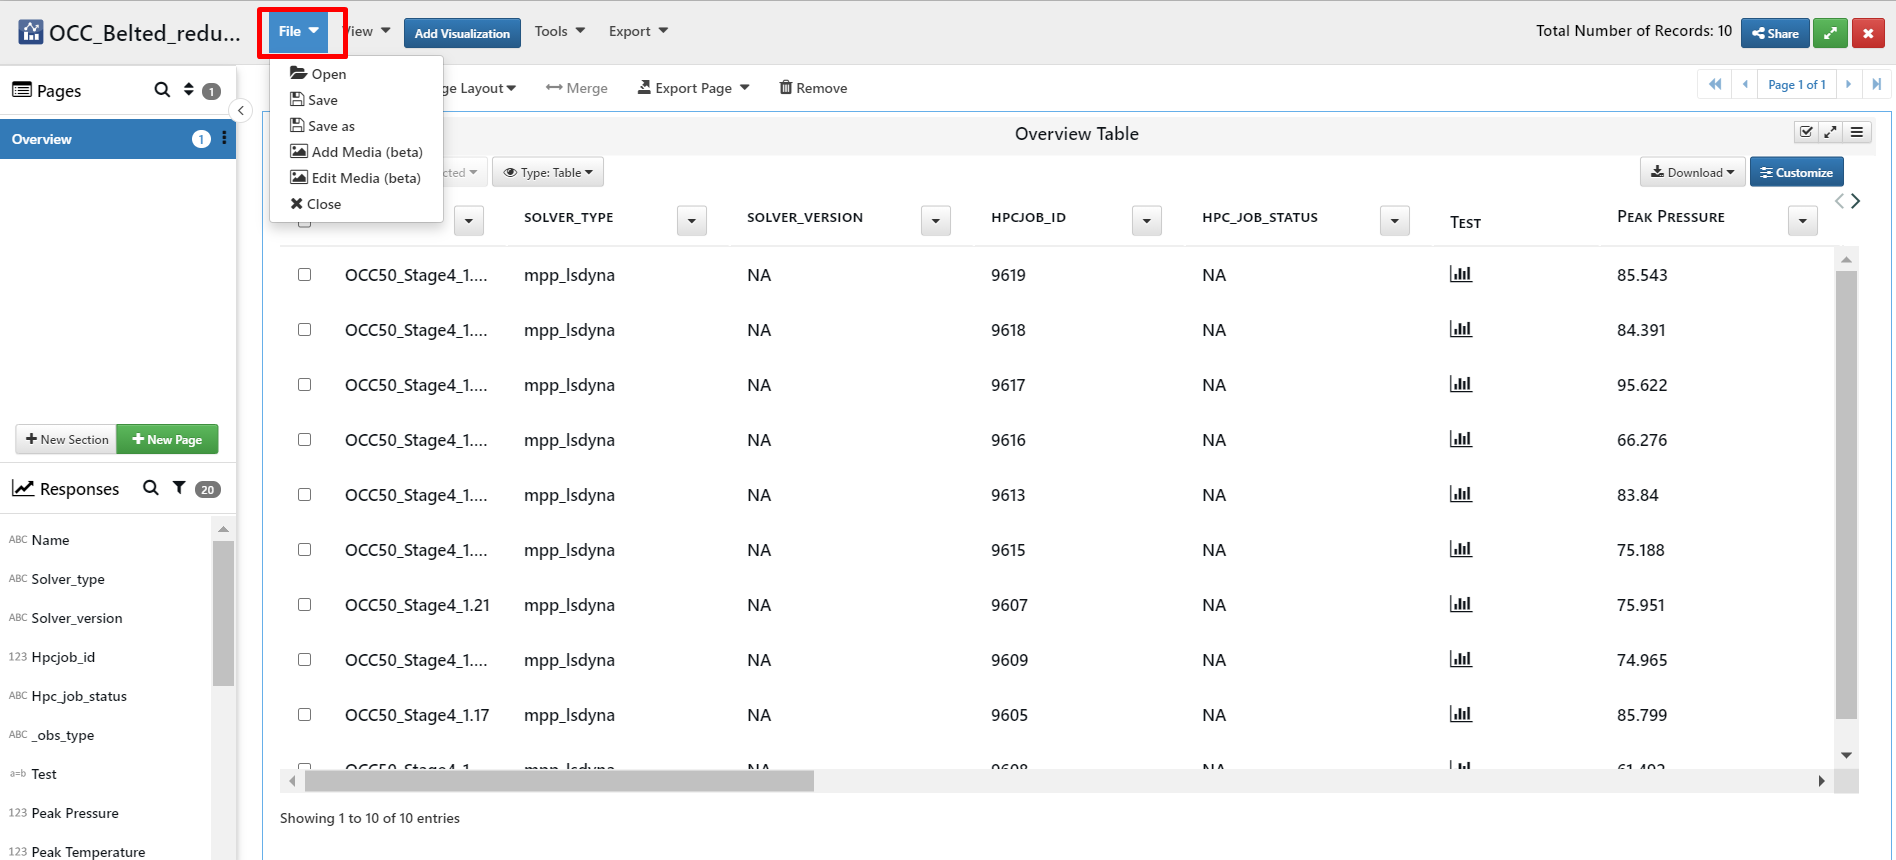
File
37. How do I view dataset in Classic and modern views?
Click on ‘View’ Dropdown where we can choose ‘modern’ or ‘classic’ to view overall simlytiks page in Classic and Modern views. These views differs in arrangement of pages. In modern view we can view pages at the top of the visualization whereas in classic view, we have separate section for pages above the responses towards left side.
Tags: View, Dataset
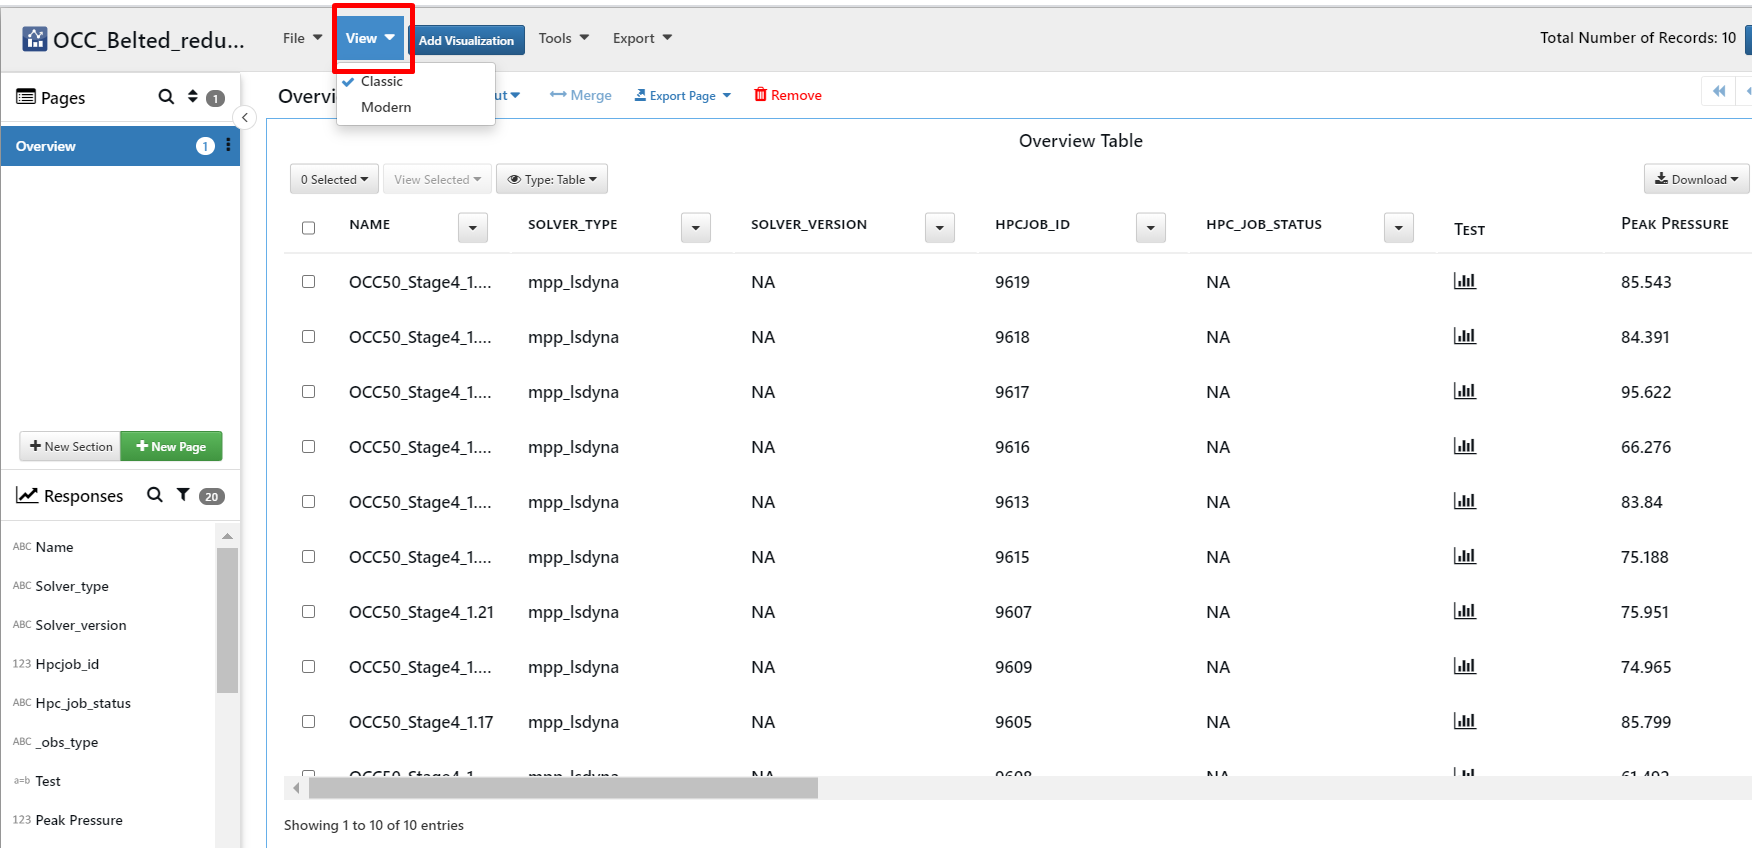
View
38. How do I save layouts, add filters, check schema editor/logs/data operations for Dataset?
Click on ‘Tools’ dropdown where we have options such as save layouts to save changes to the layout, filters where we can add filters and save them and we can use them as and when it’s required, summary to view summary of the dataset, schema editor, files, logs, data operations and saved colors for the legends.
Tags: Tools, Dataset
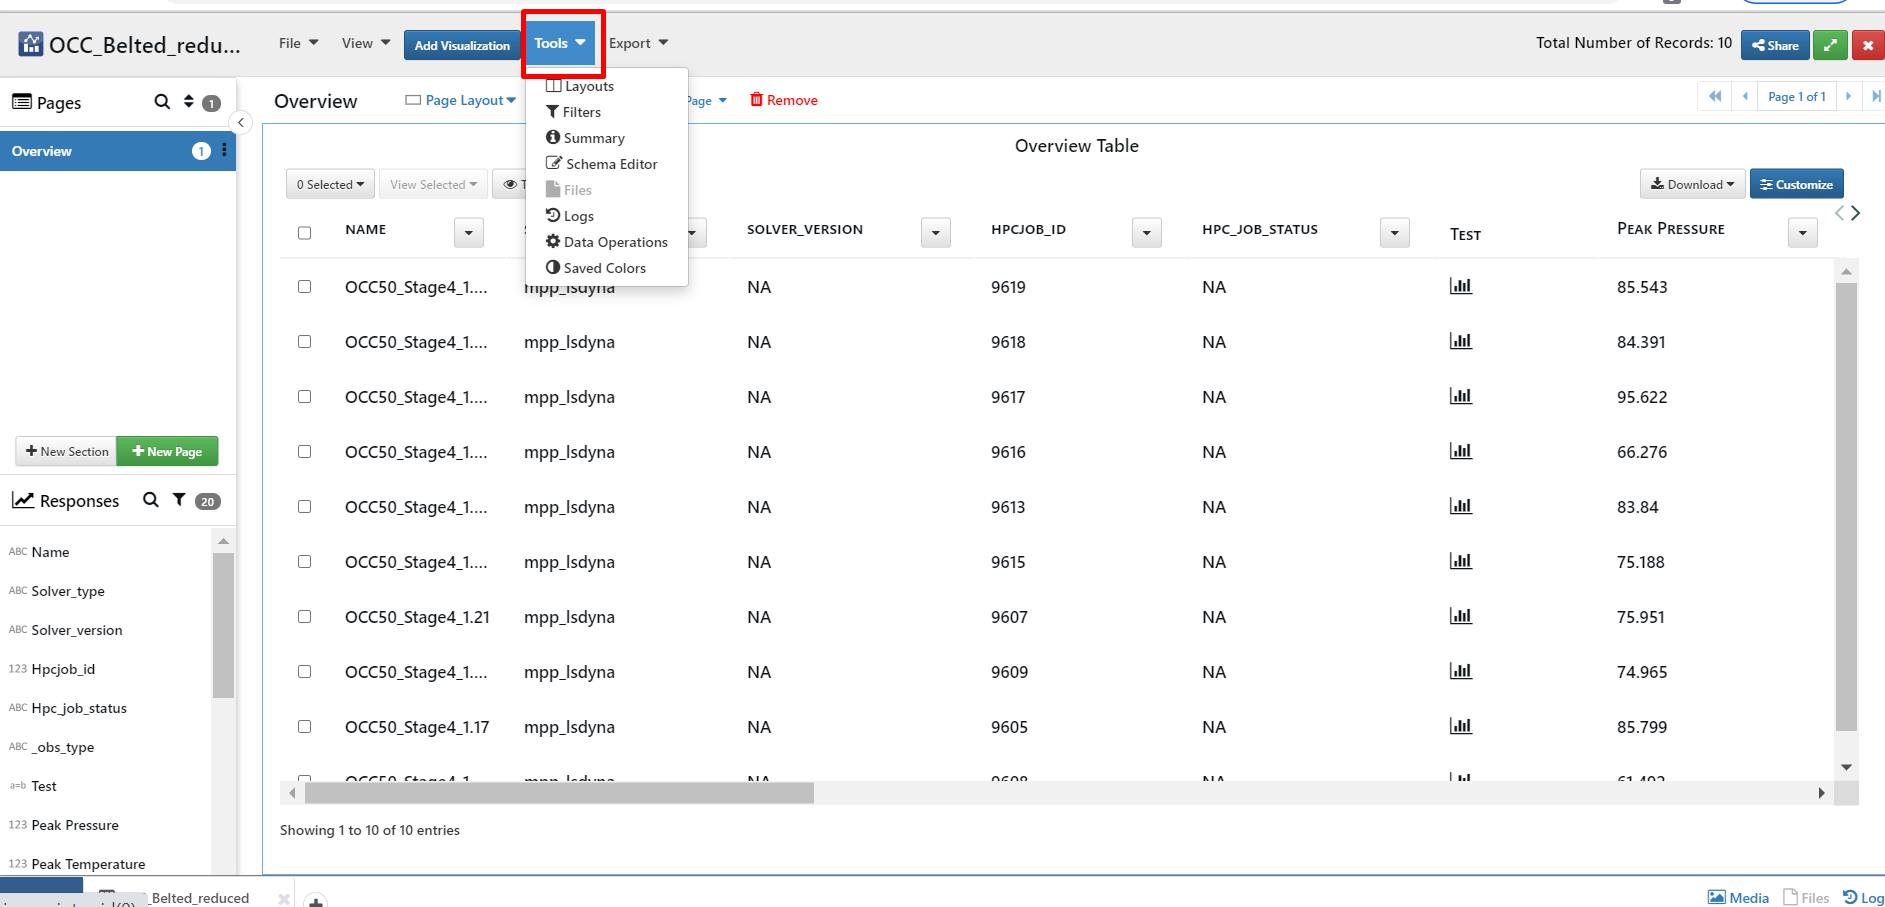
Tools
39. How do I Share layouts?
We can share saved layout with the users with the help of ‘Tools’ button and ‘Layouts’ where we can export the saved layout and we can share it with users.
Tags: Share layout, Dataset
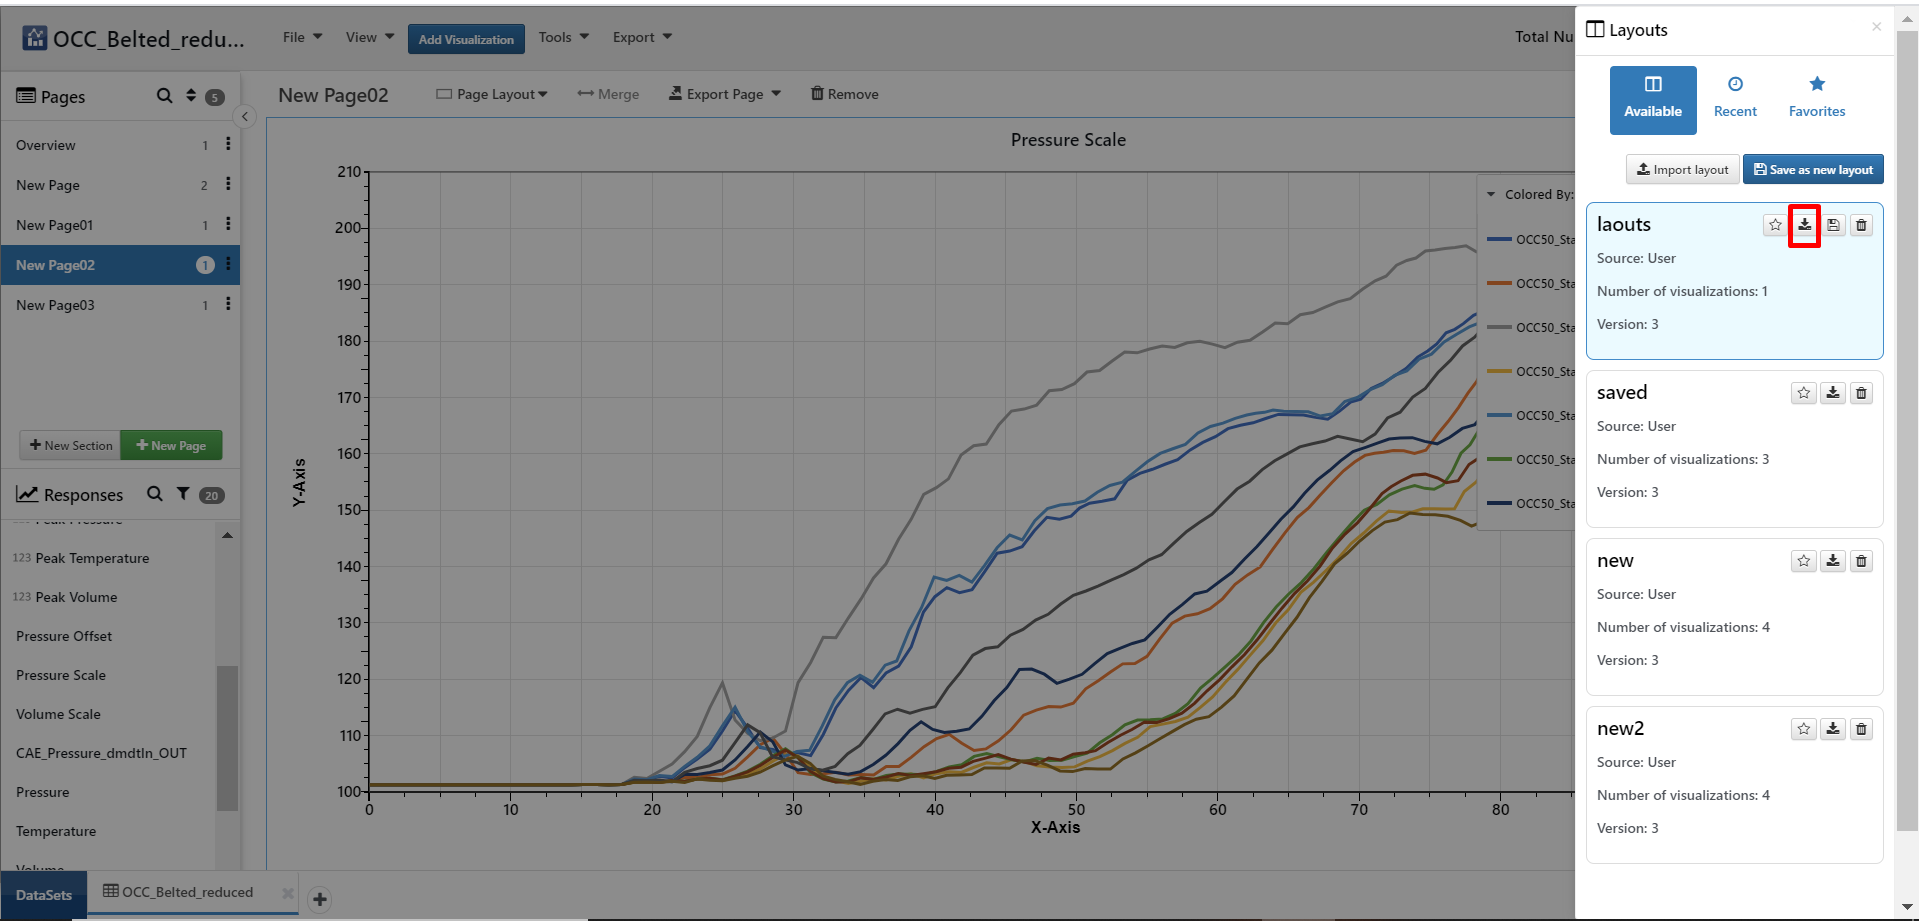
Share layout
40. How do I Export visualizations?
We can export dataset in various forms like PPT/EXCEL/CSV/JSON/Images and export layout. While exporting dataset as PPT, we can customize settings like, name of the PPT, Layout, Pages and slide layout. and click on ‘OK’ to export them
Tags: Export, Dataset
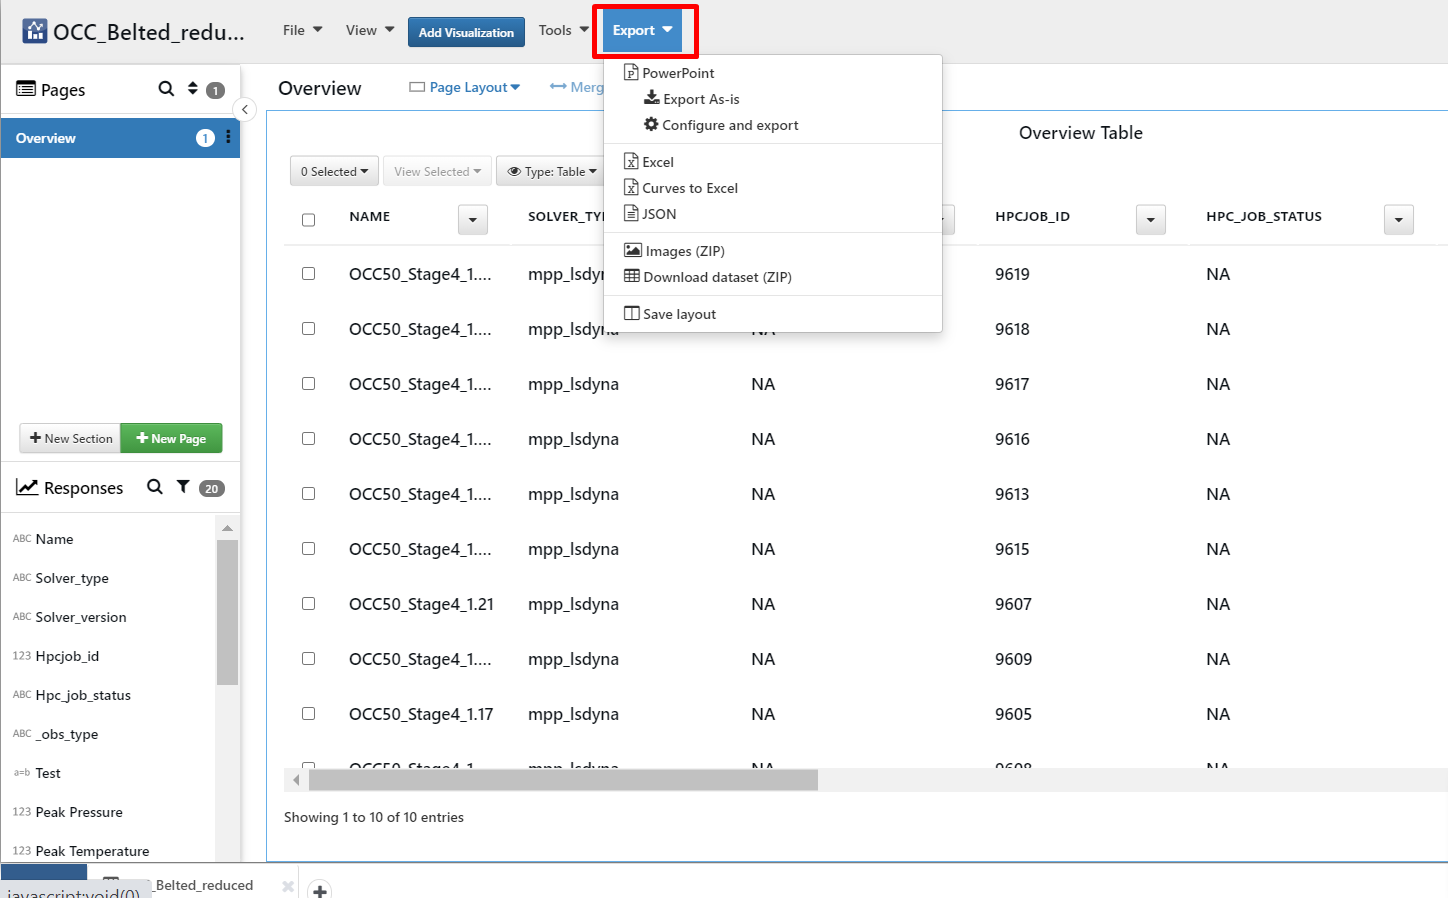
Export
41. How do I Share dataset?
Click on share button available at the right top corner of the page to open share dataset modal where we can choose users and permissions for selected users and share entire dataset with selected users.
Tags: Share, Dataset
Share
42. How do I Enlarge window in share dataset?
We can Enlarge the Share Dataset window by clicking ‘enlarge’ button on the top right corner of the modal.
Tags: Enlarge share window, Dataset
1.png)
Enlarge window(share dataset)
43. How do I Minimize window in share dataset?
Click on Minimize button to Minimize the share dataset modal and dock it at the bottom of the page and we can enlarge it again to view the share dataset modal.
Tags: Minimize share window, Dataset
1.png)
Minimize window(share dataset)
44. How do I Close window in share dataset?
We can Close the Share Dataset window by clicking on the ‘Close’ button on the top right corner of the modal.
Tags: Close share window, Dataset
1.png)
Close window(share dataset)
45. How do I Remove all users from share dataset?
We can remove all users from the share dataset window by clicking on the ‘Remove all users’ button on the share dataset modal. The added users and the previous users are removed if we want we can add new set of users with whom we want to share.
Tags: Remove all users, Dataset
1.png)
Remove all users(share dataset)
46. How do I Share dataset?
Click on Share button available within share dataset to proceed sharing, where we will get a link which we can share it with users or we can view it in new tab if we want to view by itself.
Tags: Share dataset, Dataset
1.png)
Share(share dataset)
47. How do I Cancel share dataset?
After providing all necessary informations, click on ‘Cancel’ button available within share dataset to cancel/stop sharing dataset with selected users which terminates dataset sharing.
Tags: Cancel share dataset window, Dataset
1.png)
Cancel(share dataset)
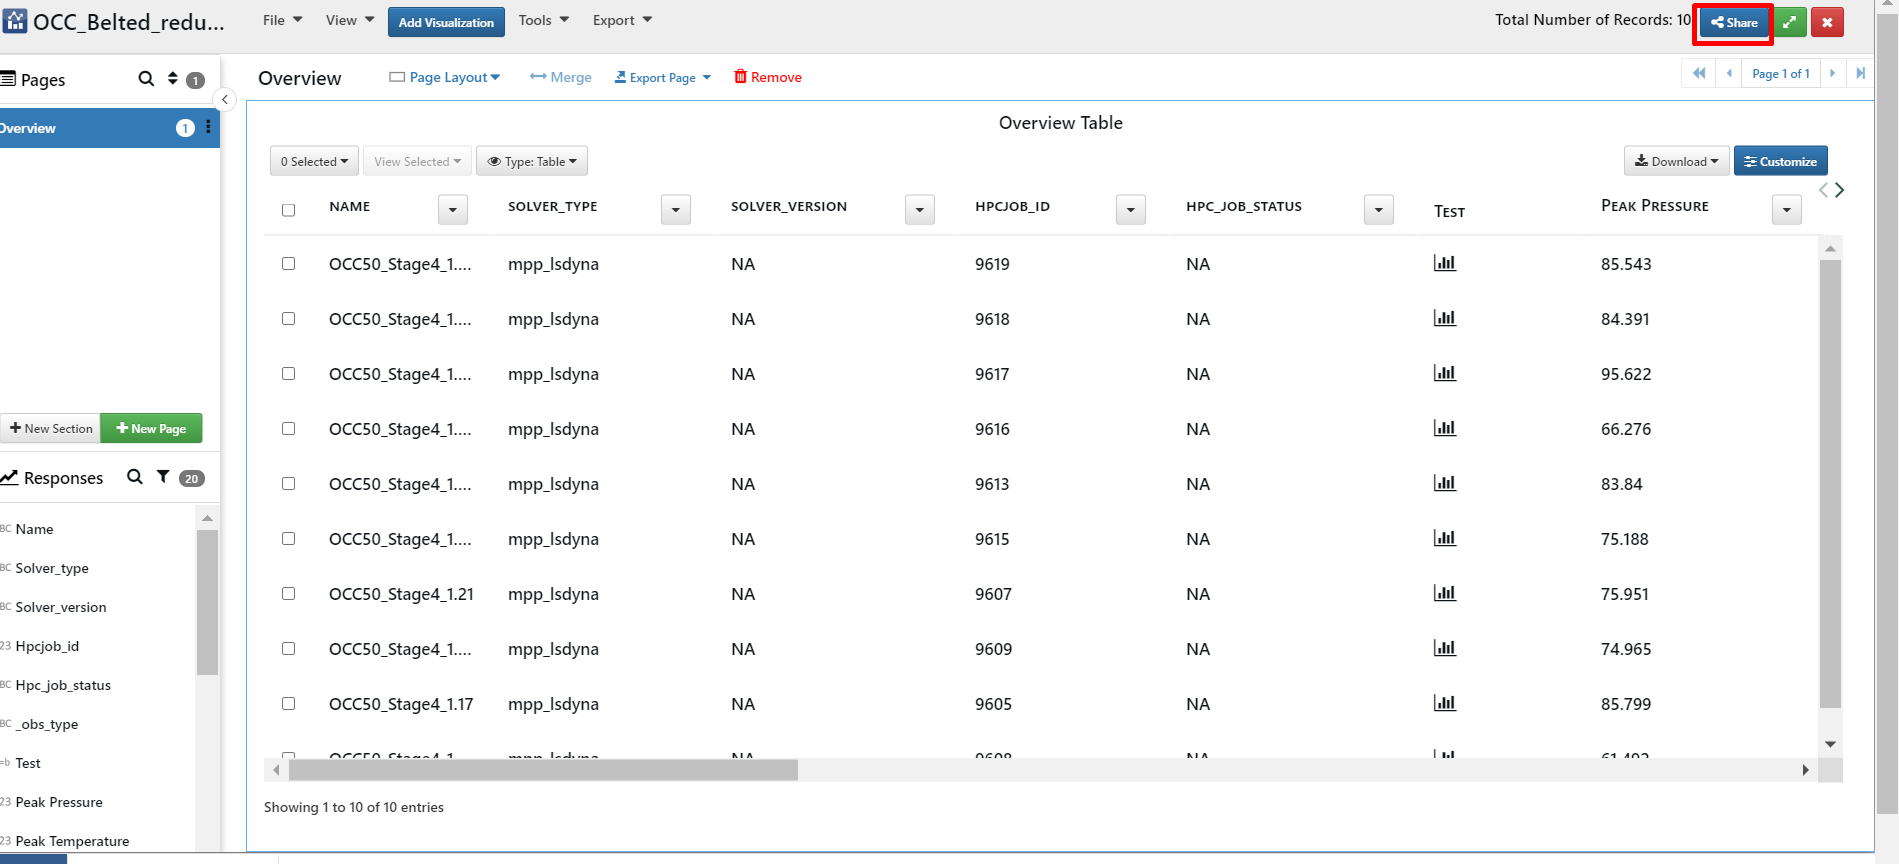
48. How do I Enlarge dataset in Simlytiks window?
Click on Enlarge button available at the top right corner to enlarge simlytiks window or to view dataset in full screen.
Tags: Enlarge share window, Dataset
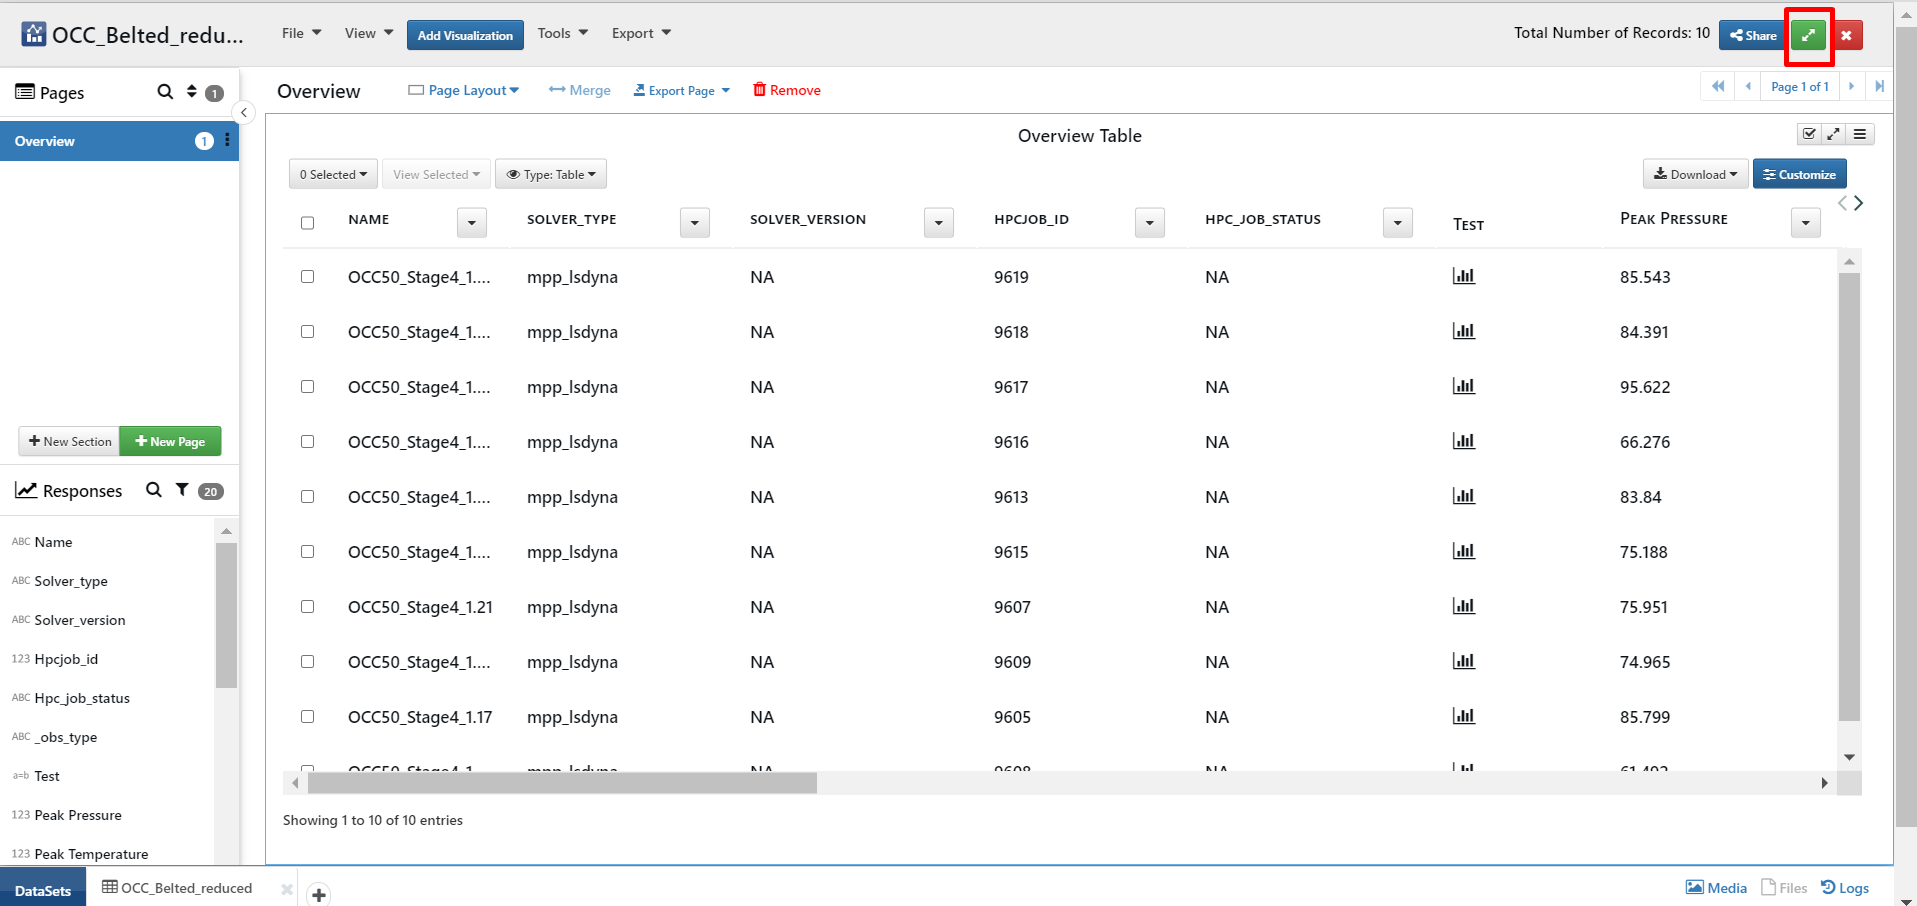
Enlarge dataset
49. How do I close the dataset?
We can close the simlytiks Dataset window by clicking on the ‘close’ button on the top right corner of the modal.
Tags: Close share window, Dataset
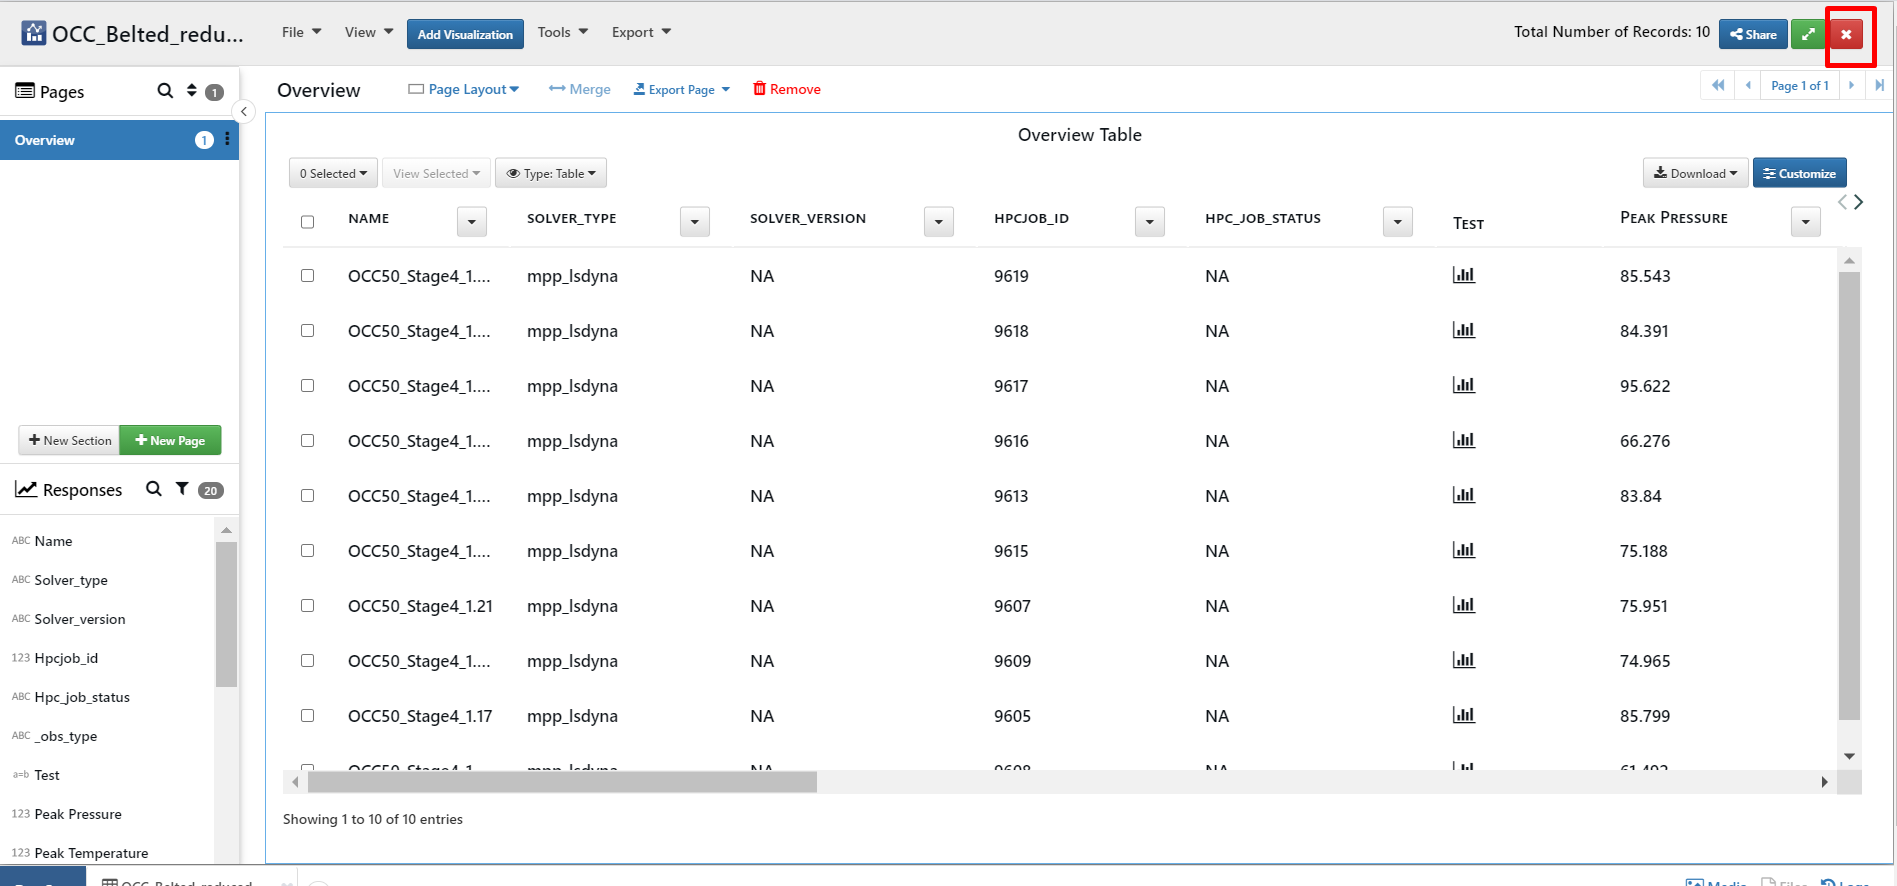
Close dataset
50. Can I save my changes/dataset to dashboard and come back to the same visualization later?
While closing current dataset, we can provide name for the dataset and we can save it as a record in simlytiks home page so that we can view it quickly, later and if we want we can add visualizations to it and update dataset in ‘files’ dropdown which updates version.
Tags: Save Simlytiks Dashboard, Dataset
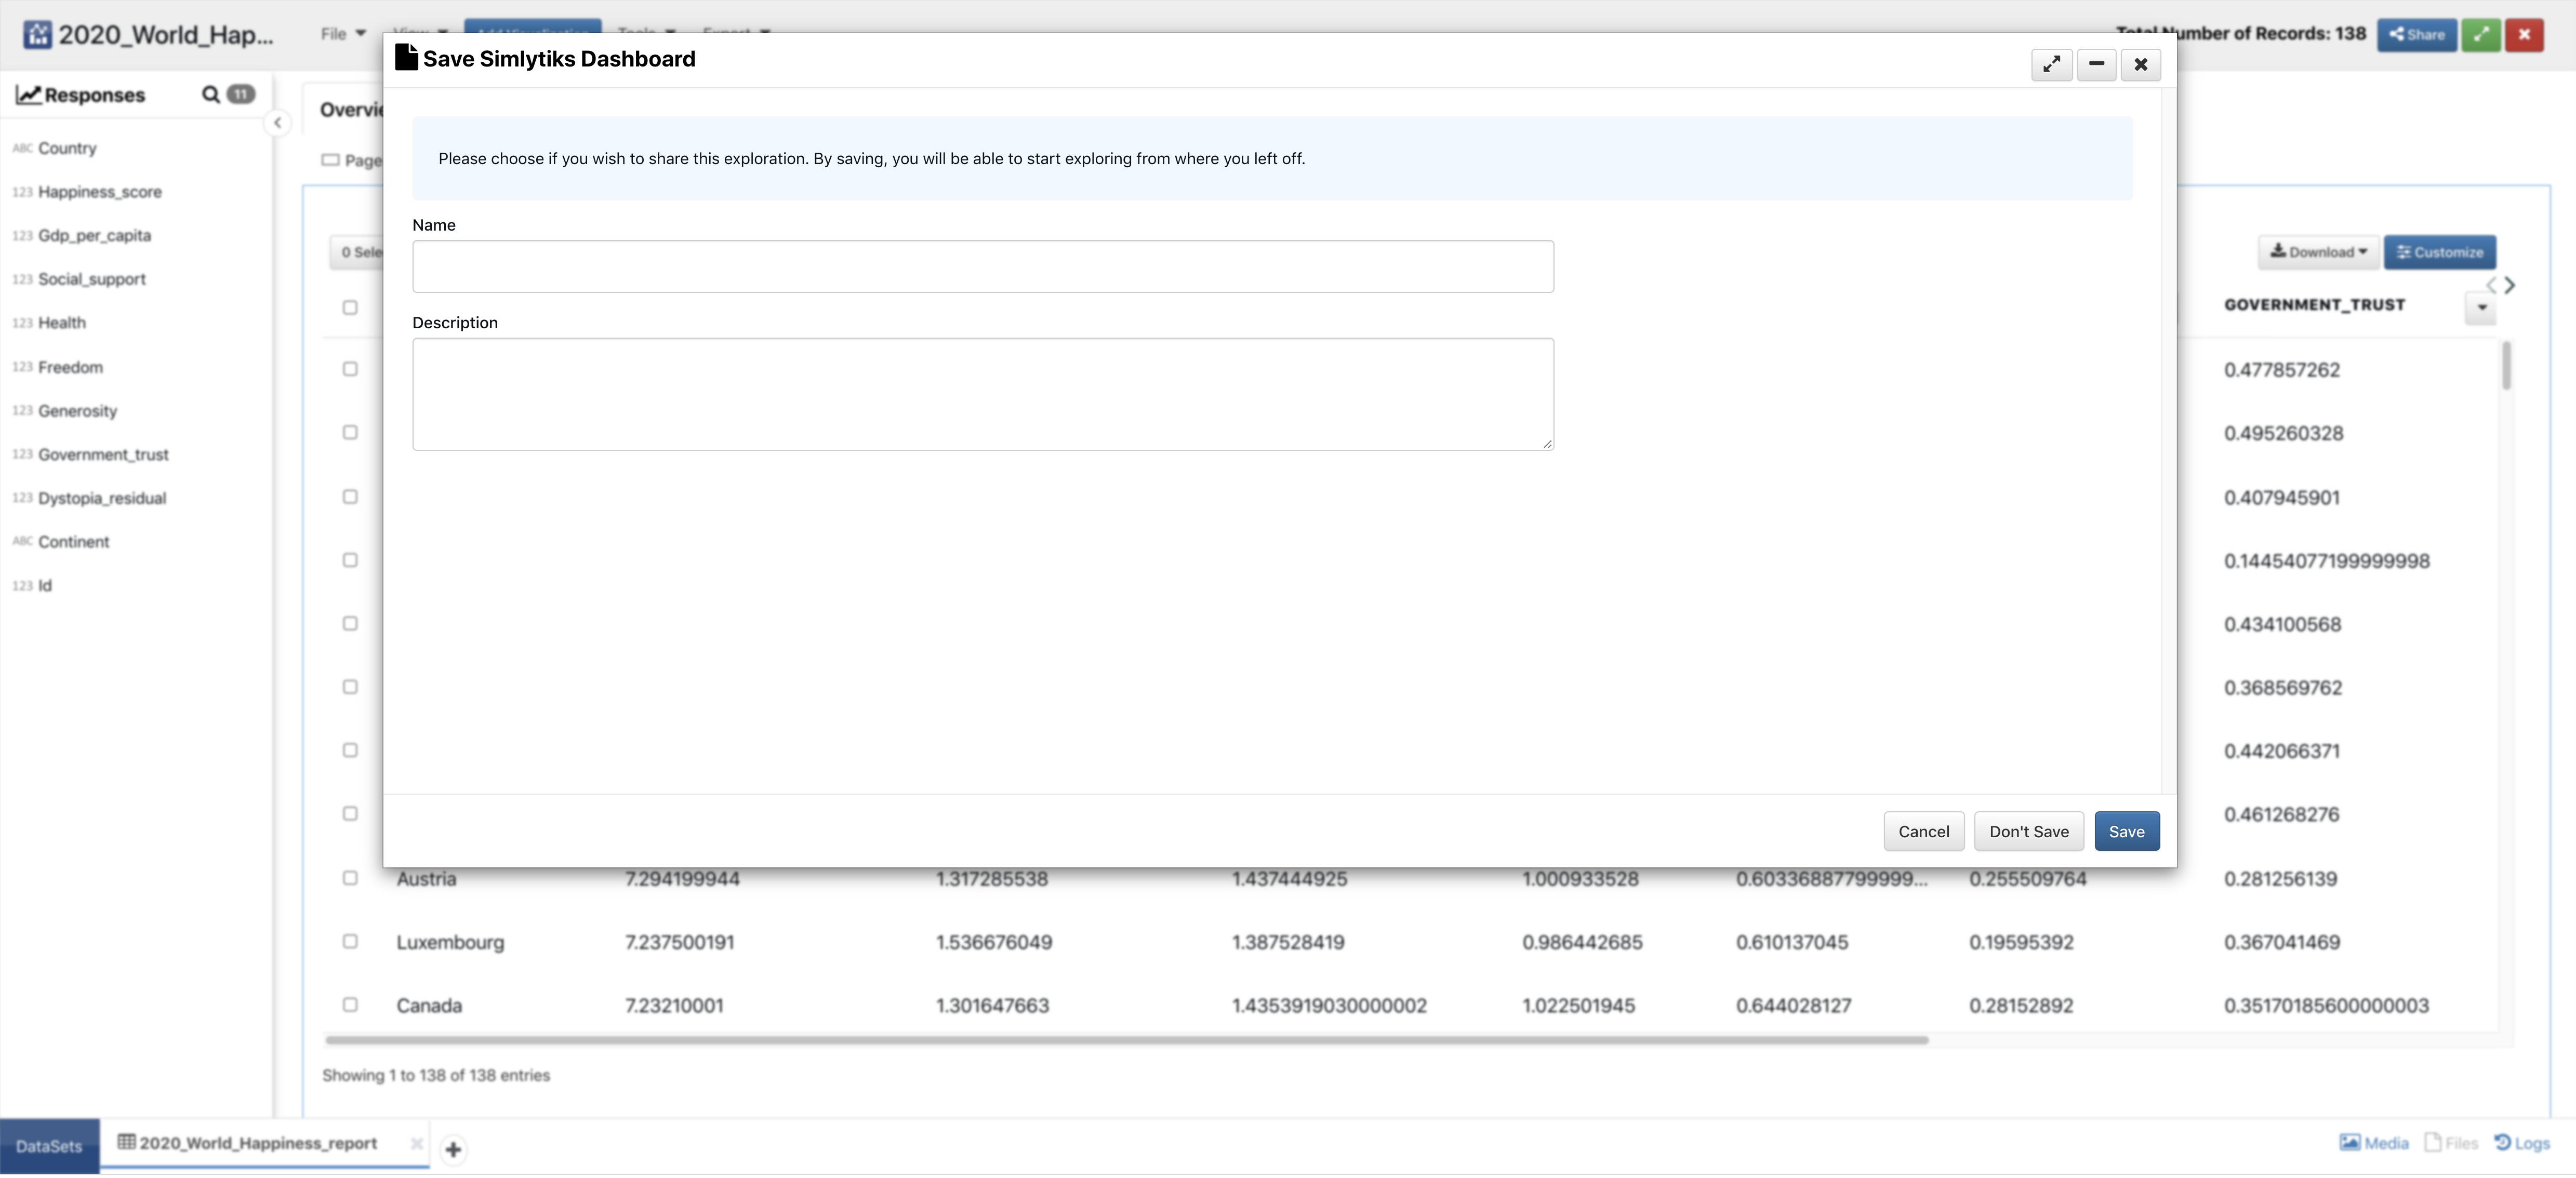
Save Simlytiks Dashboard
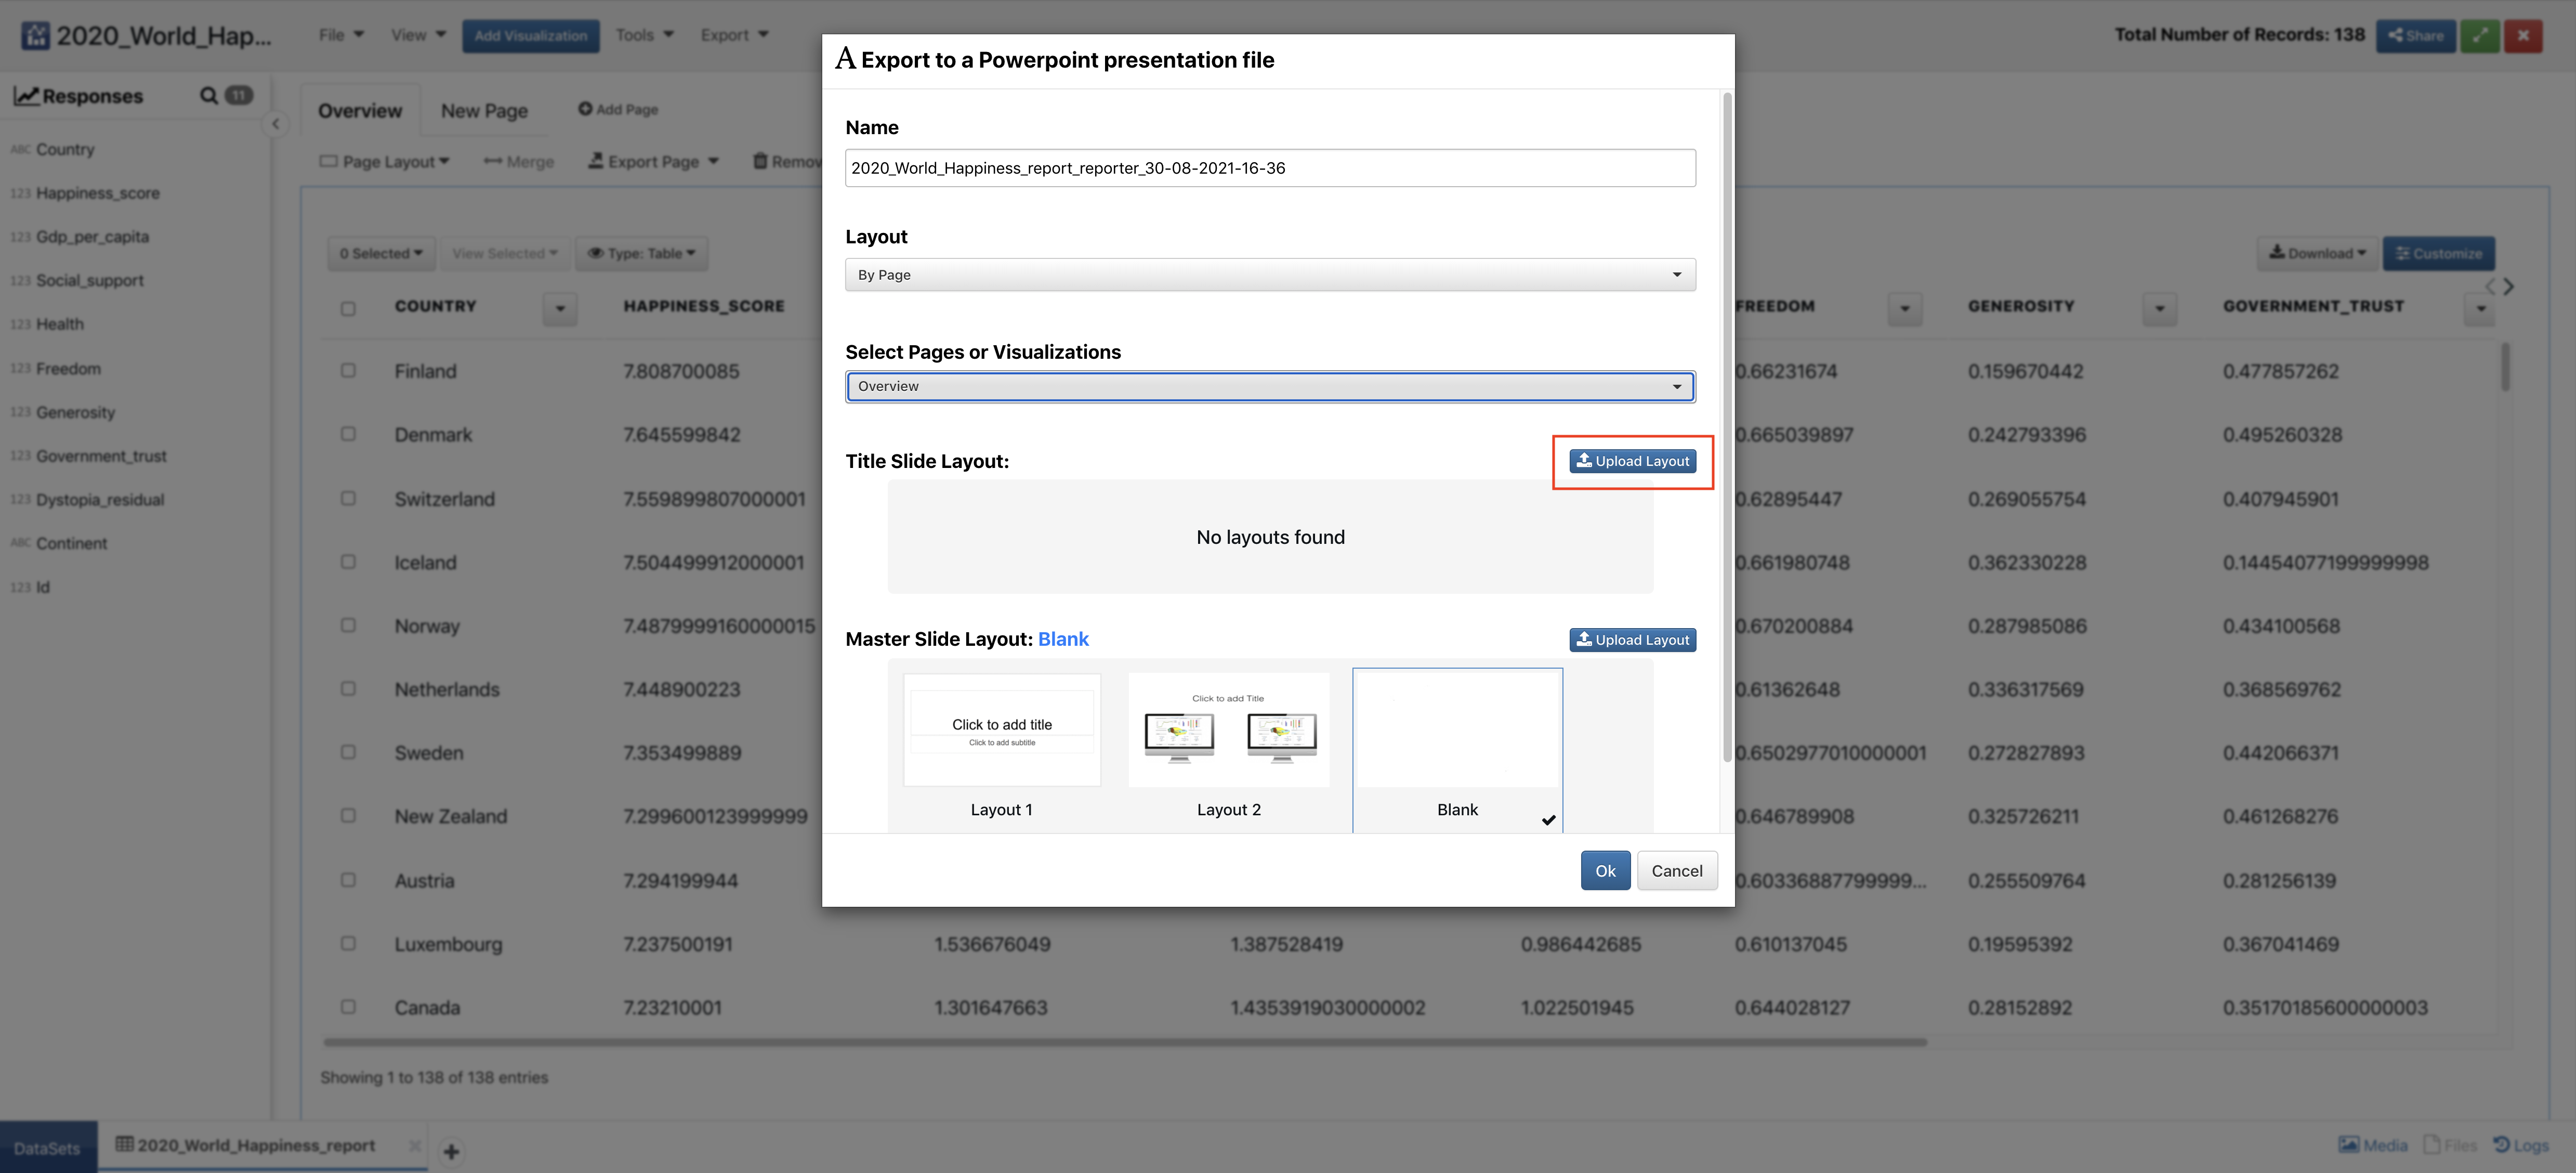
51. How can I export the PPT with a custom corporate theme?
You can upload a layout for your slides when exporting a dataset as a PPT under the Export menu.
Tags: PPT Layout, Dataset

PPT Layout
52. Do people with the shared link need accounts in d3VIEW to view?
They do not. Links created from the Share button on the top bar will be public links, meaning anyone can view and explore that particular dataset on that specific link.
Tags: Public Link, Dataset
Public Link
Dashboard Pages
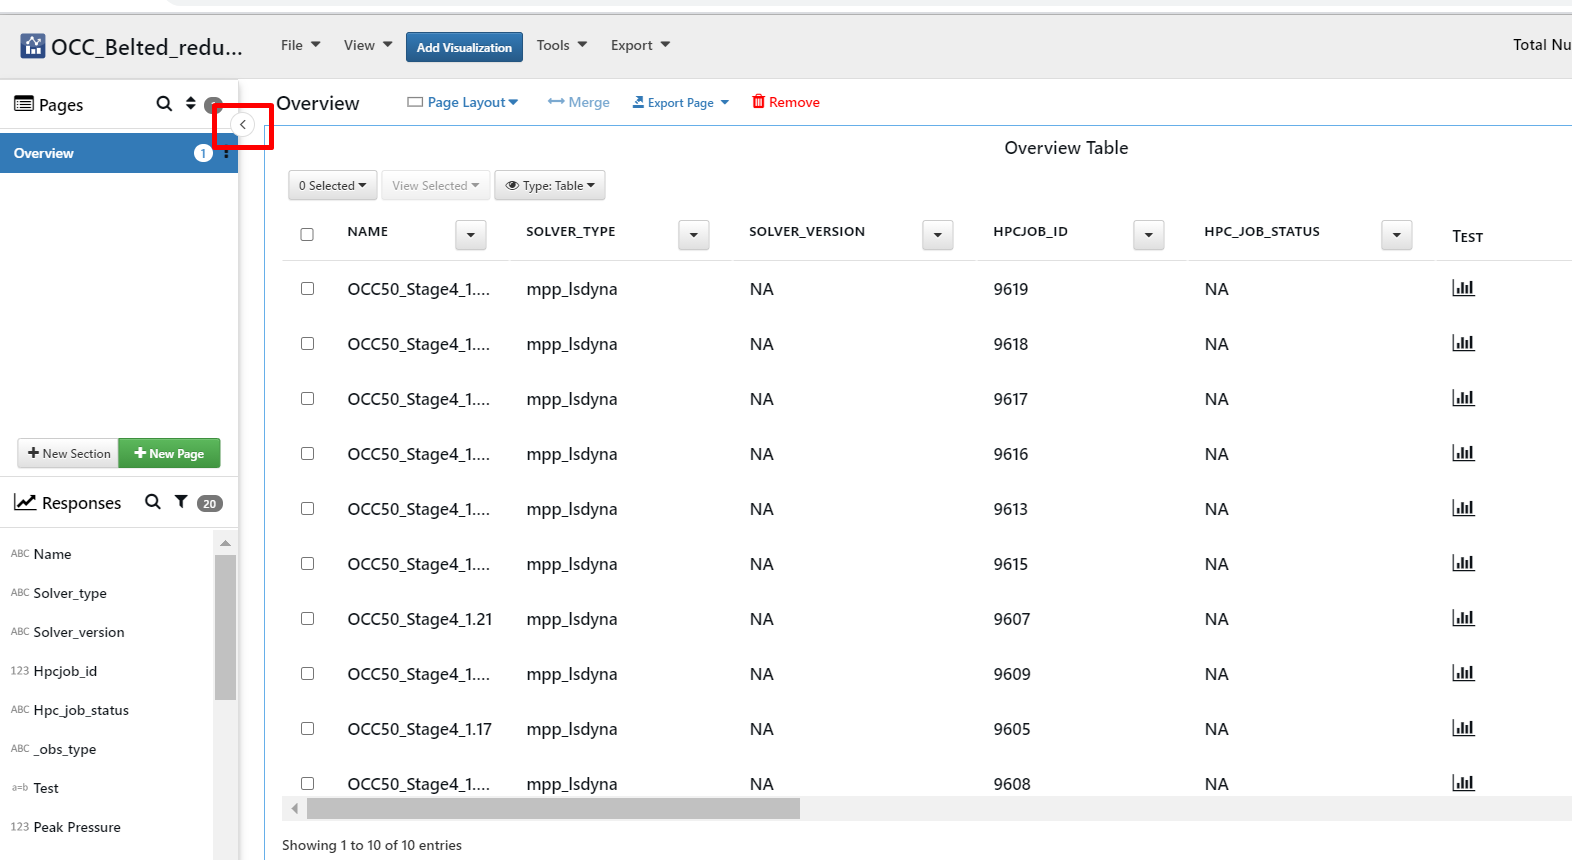
53. How to Hide/Unhide pages and responses?
We can Hide/unhide pages by clicking on the ‘toggle’ button(<) on the top left of the simlytiks page/ left side panel which looks more spacious. We can unhide pages and responses by clicking on ‘>’ button.
Tags: Toggle responses, pages, Dataset
Toggle responses, pages
54. How do I view Pages in toggle responses?
We can view pages in Toggle responses by clicking on Pages button(P) available after hiding the side panel to view list of pages and select pages.
Tags: Pages (P), pages, Dataset
(toggleresponses)1.png)
Pages (P) (toggle responses)
55. How do I view responses in toggle responses?
We can view responses in Toggle responses by click on Responses(R) button available after hiding side panel while toggling to view responses list.
Tags: Responses, pages, Dataset
1.png)
Responses (toggle responses)
56. How do I add New page in toggle responses?
We can add new page in toggle responses by clicking on New page(+) button available after hiding side panel while toggling to add new pages to the dataset.
Tags: New page (+), pages, Dataset
New page (+) (toggle responses)
57. How do I Edit Visualization page name?
We can edit name of the visualization by clicking on visualization page name. We can also save the new name to the visualization page.
Tags: Edit page name, Dataset
Edit page name
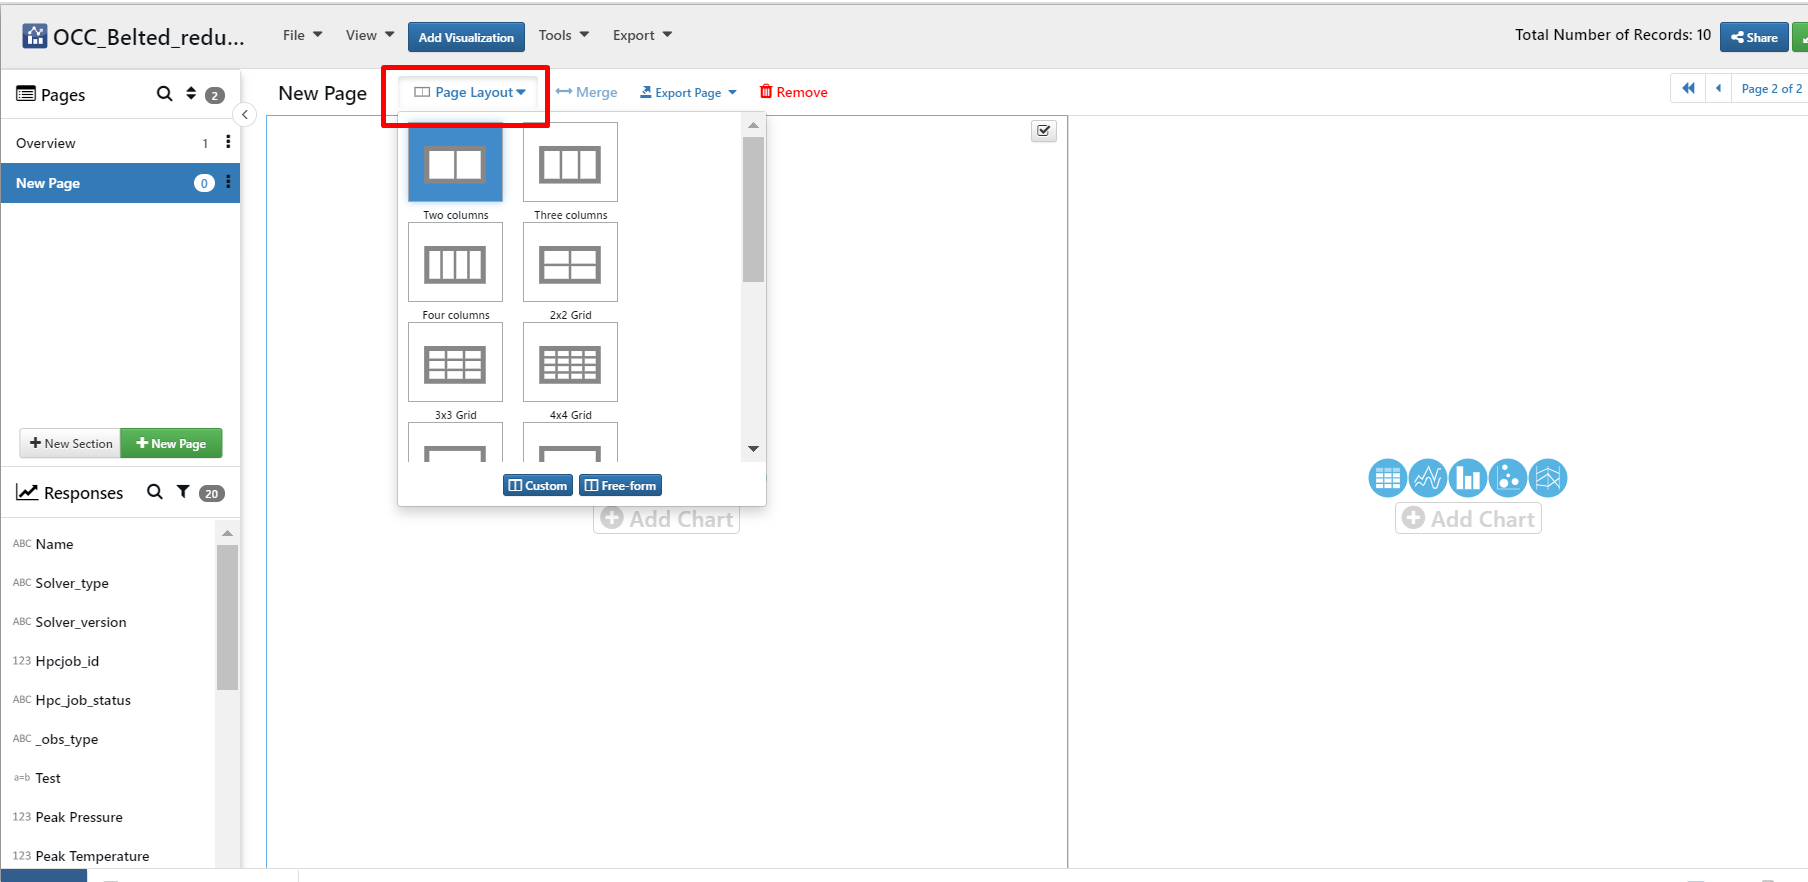
58. How do I change Page layout for Visualization pages?
We can change the current page layout to different page layouts such as two column, 2x2 grid, 3x3 grid etc by clicking on ‘Page layout’ button available at the top of the visualization next to the page name. We can customize layout by providing name, no.of rows and no.of columns for the new layout, Also Click on Free form layout button to add any number of visualization in it by drag and drop responses.
Tags: Page layout, Dataset
Page layout
59. How do I export a page?
We can export current visualization page by clicking on Export Dropdown button to export the page as PPT, single image or images(zip). This button is specific for the pages.
Tags: Export page, Dataset
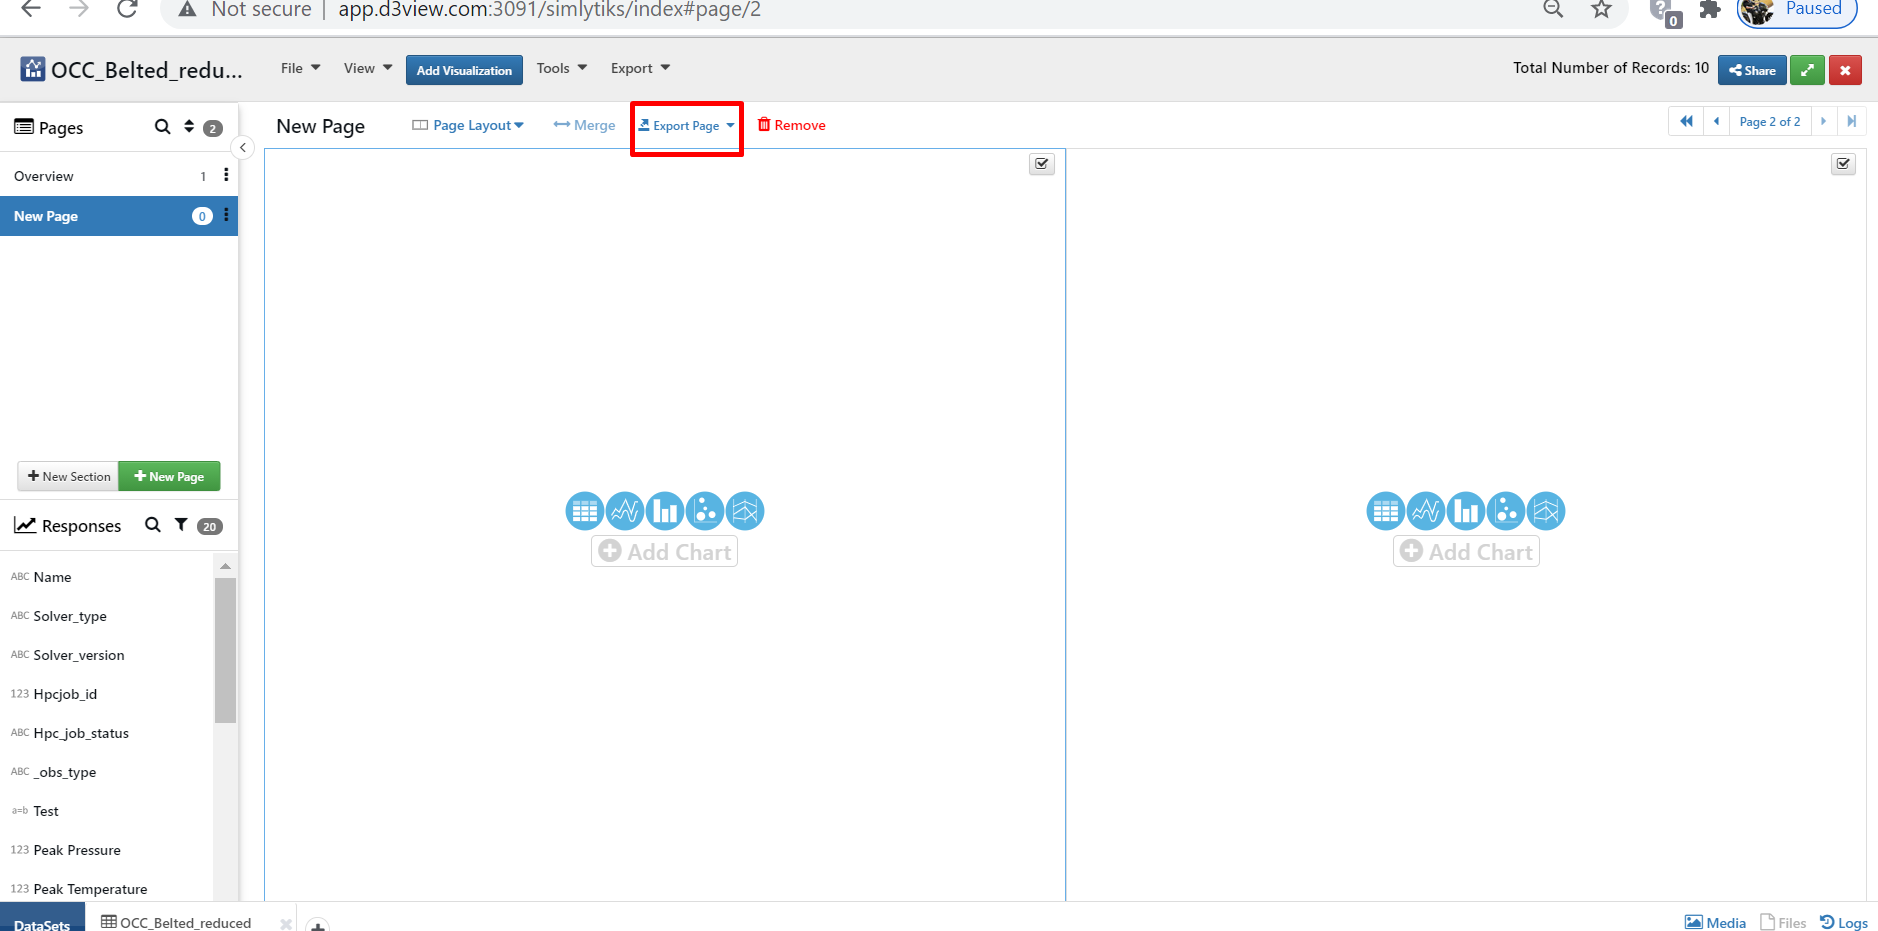
Export page
60. How do I remove a page?
We can delete the current visualization page by clicking on ‘remove’ button available next to export button below the top bar. This is specific for the page.
Tags: Remove page, Dataset
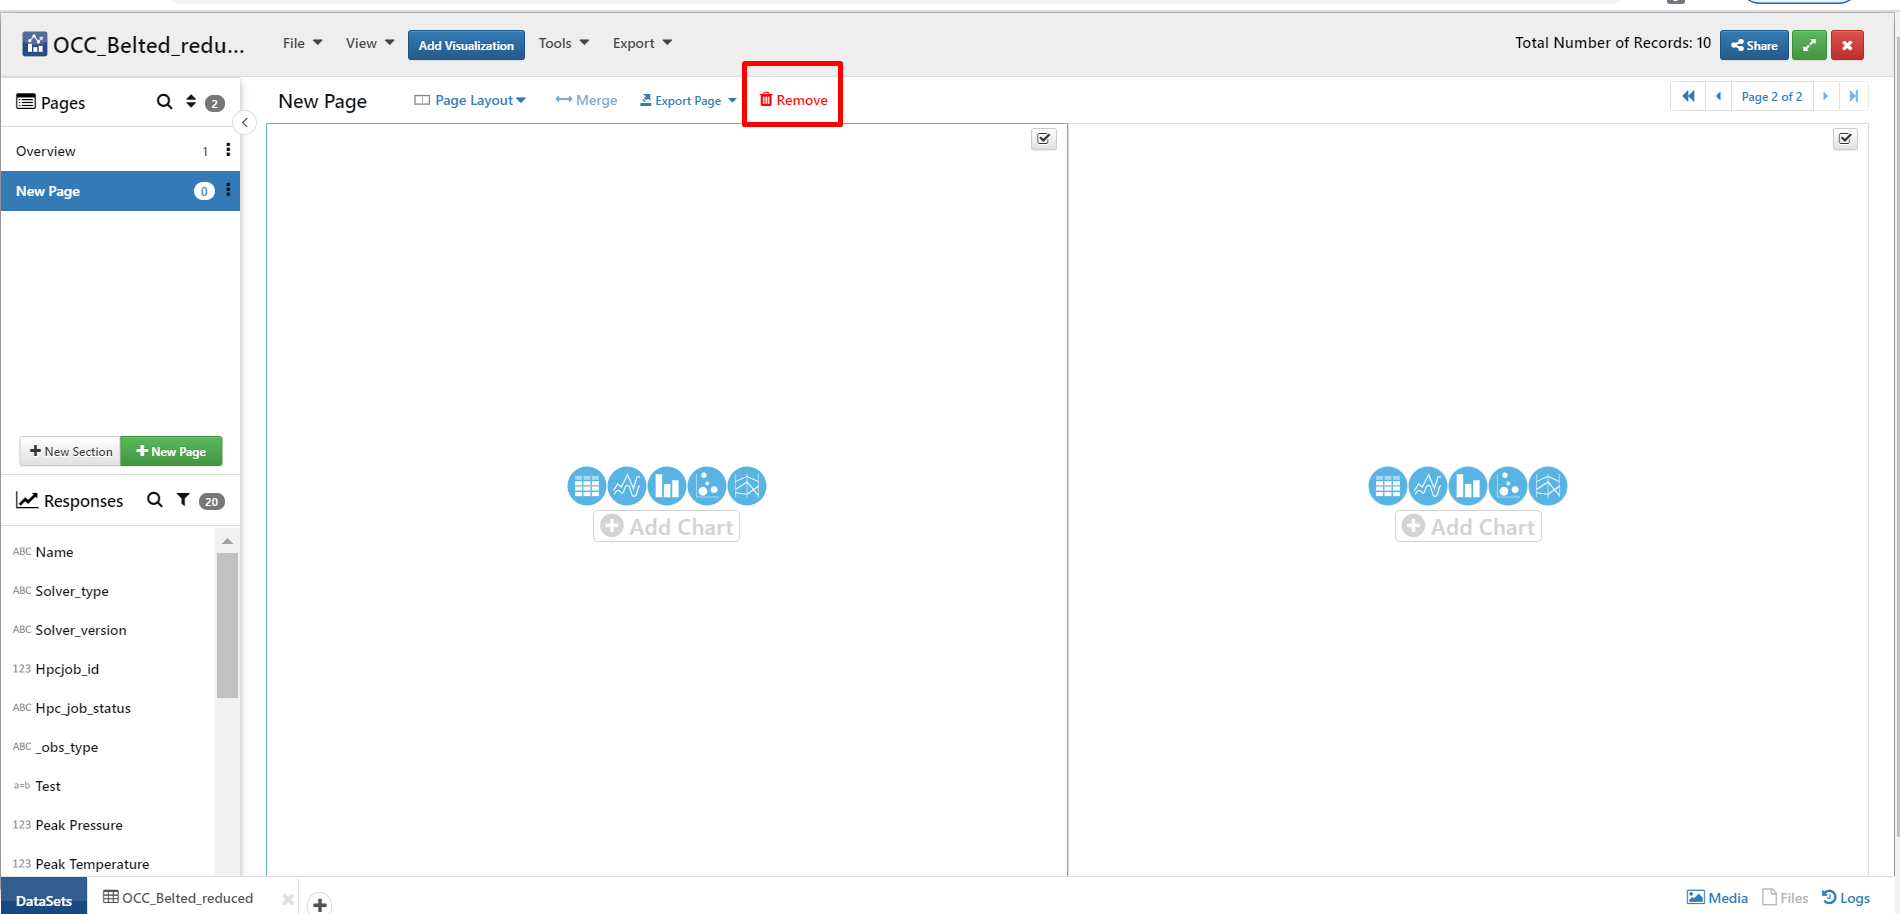
Remove
61. How do I go to Next page / previous page in Simlytiks?
We can move to next and pervious visualization pages by clicking on Next page/ previous page arrow buttons available at the right top of the simlytiks page we can also jump to first or last page using ‘first page’ and ‘last page’ buttons respectively which will be helpful for the dataset with many pages.
Tags: Next page/ previous page arrows, Dataset
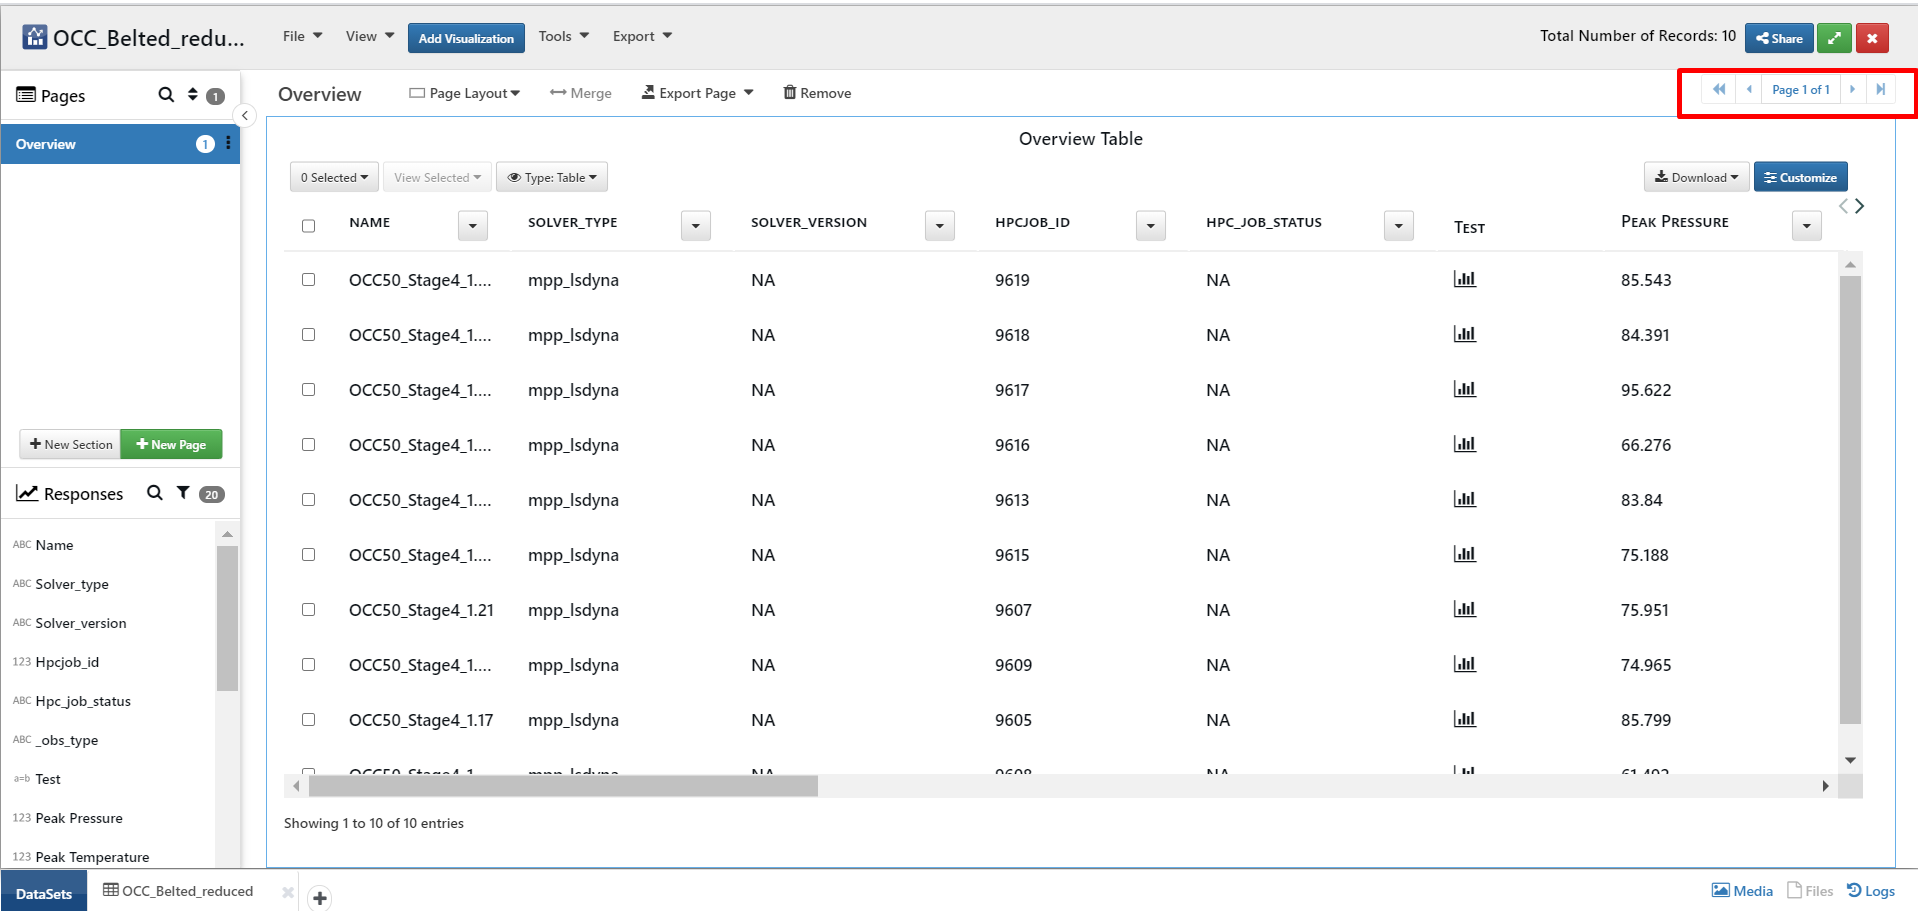
Next page/ previous page arrows
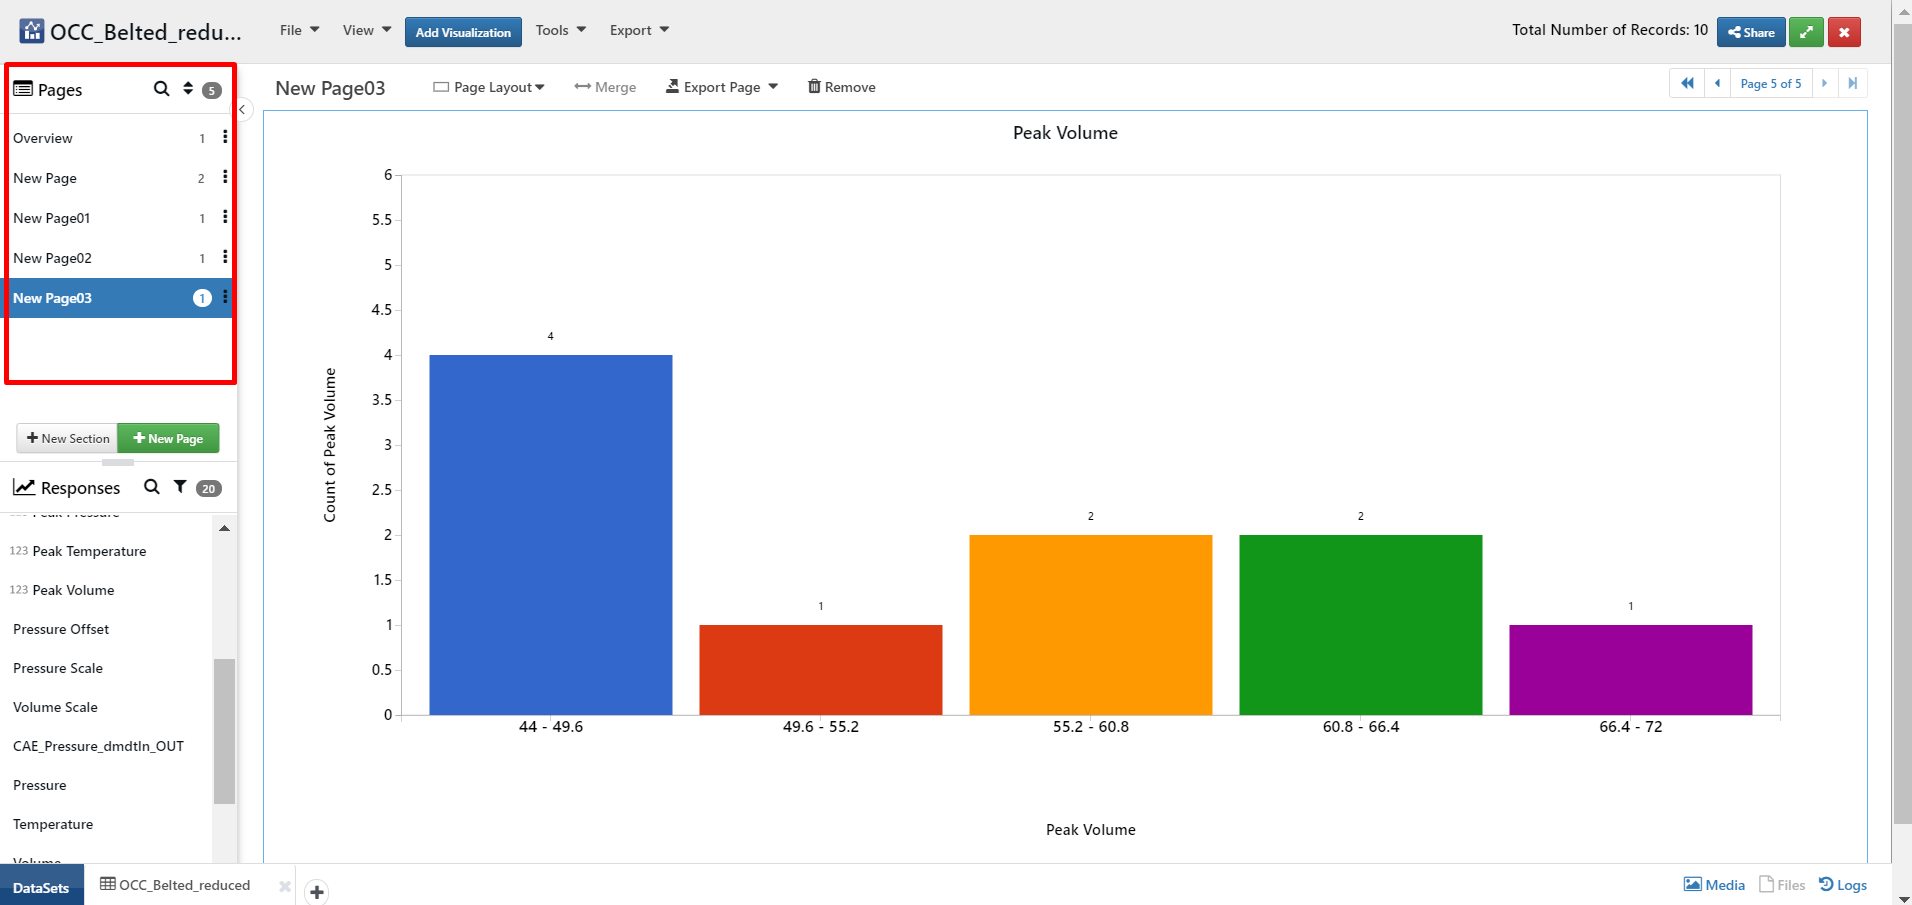
62. How do I add New section to Dataset?
We can add New section to the Simlytiks Dataset by clicking on New section button available in pages section and provide name for the section and click on ‘save’ to create new section. We can further add new pages and visualization charts to it , drag and drag visualizations from section to section. refer screenshot for more information.
Tags: New section, Dataset
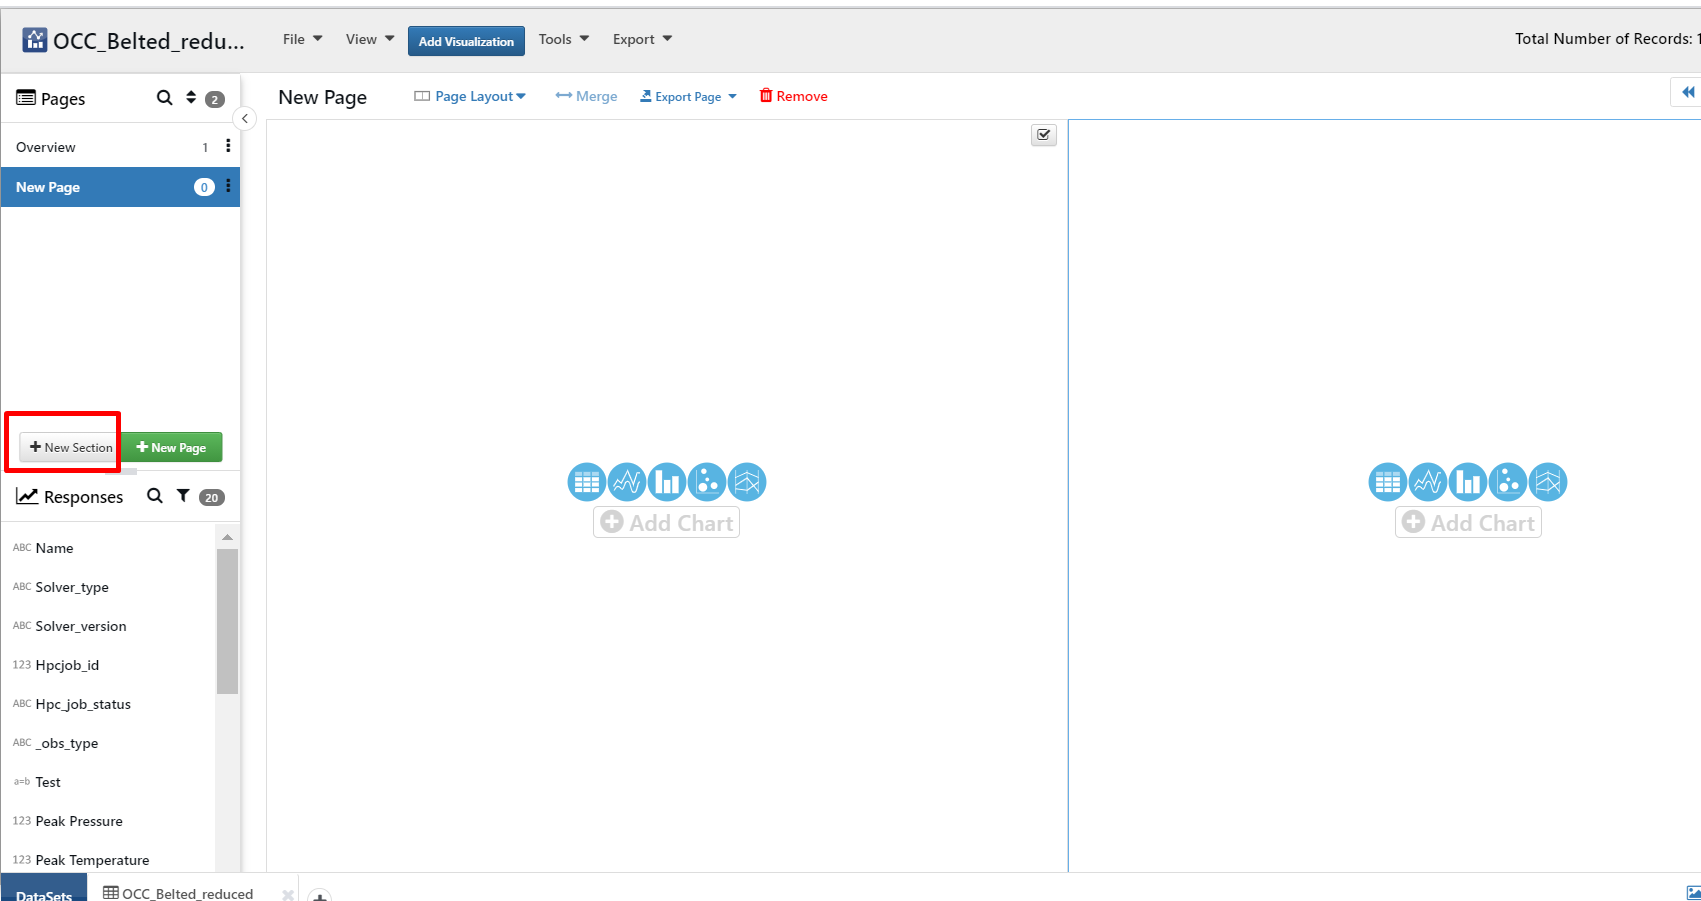
New section
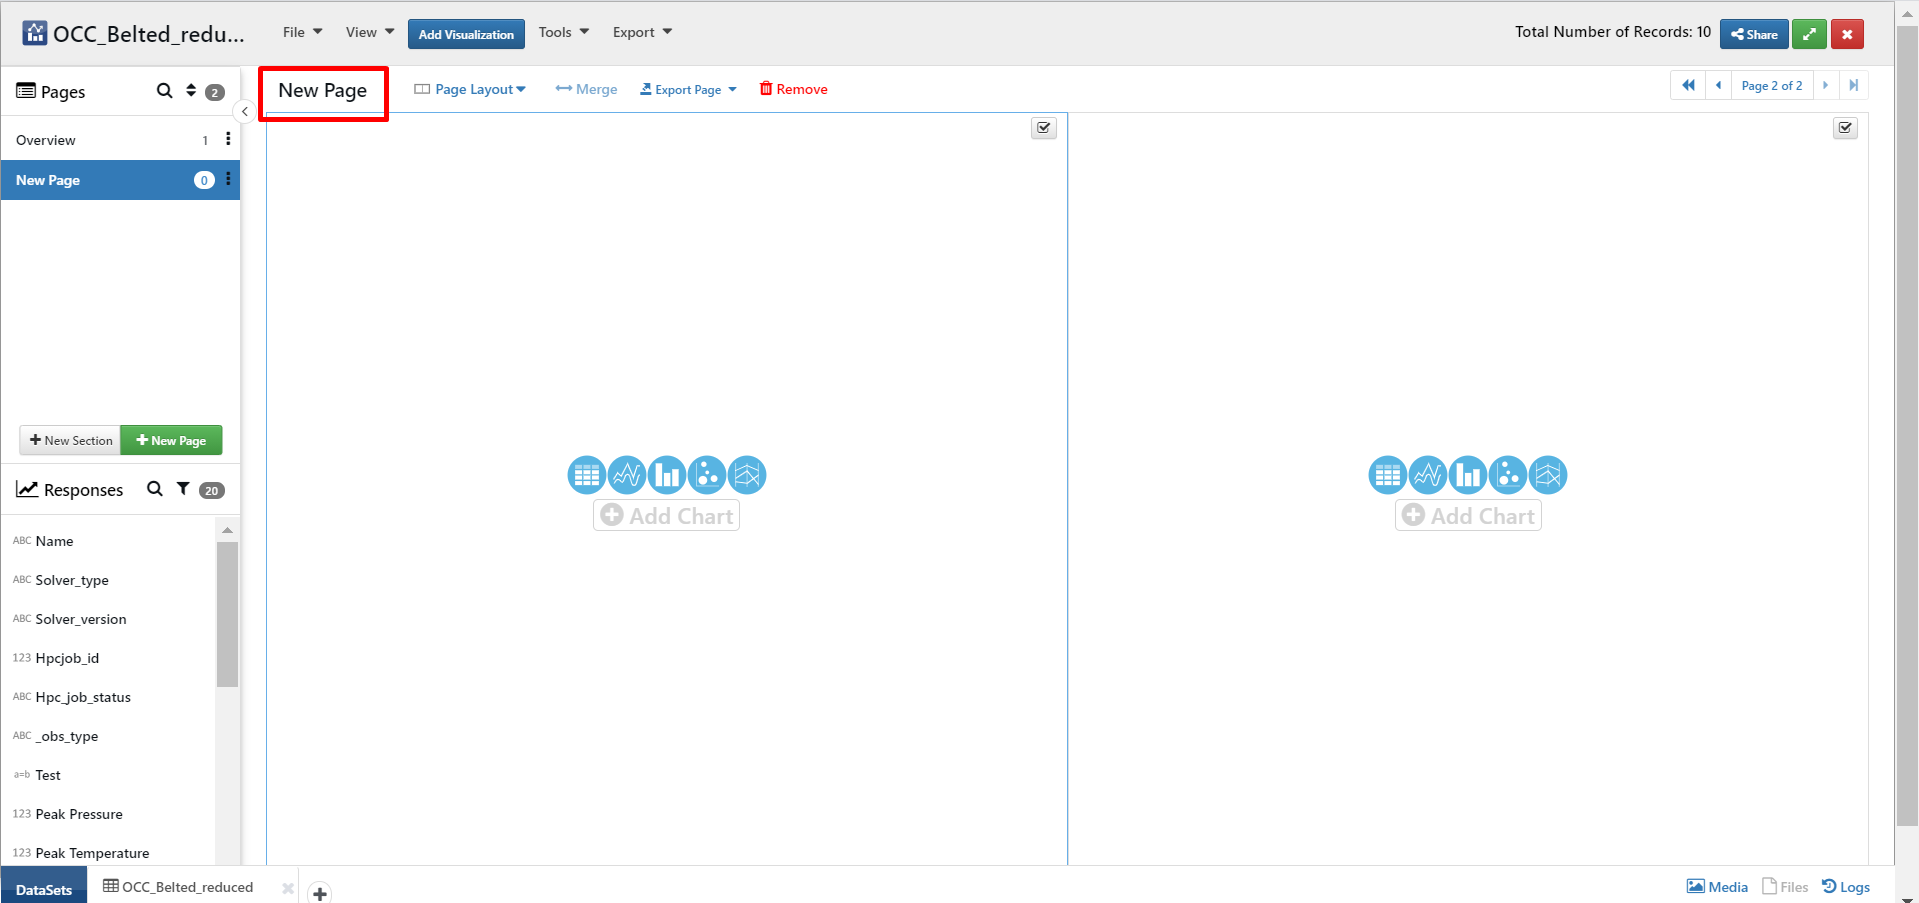
63. How do I add New page to Dataset?
We can add New page to the Simlytiks Dataset by clicking on ‘New page’ button available in pages section. We can further add more visualization charts to the page. refer screenshot for more information.
Tags: New page, Dataset
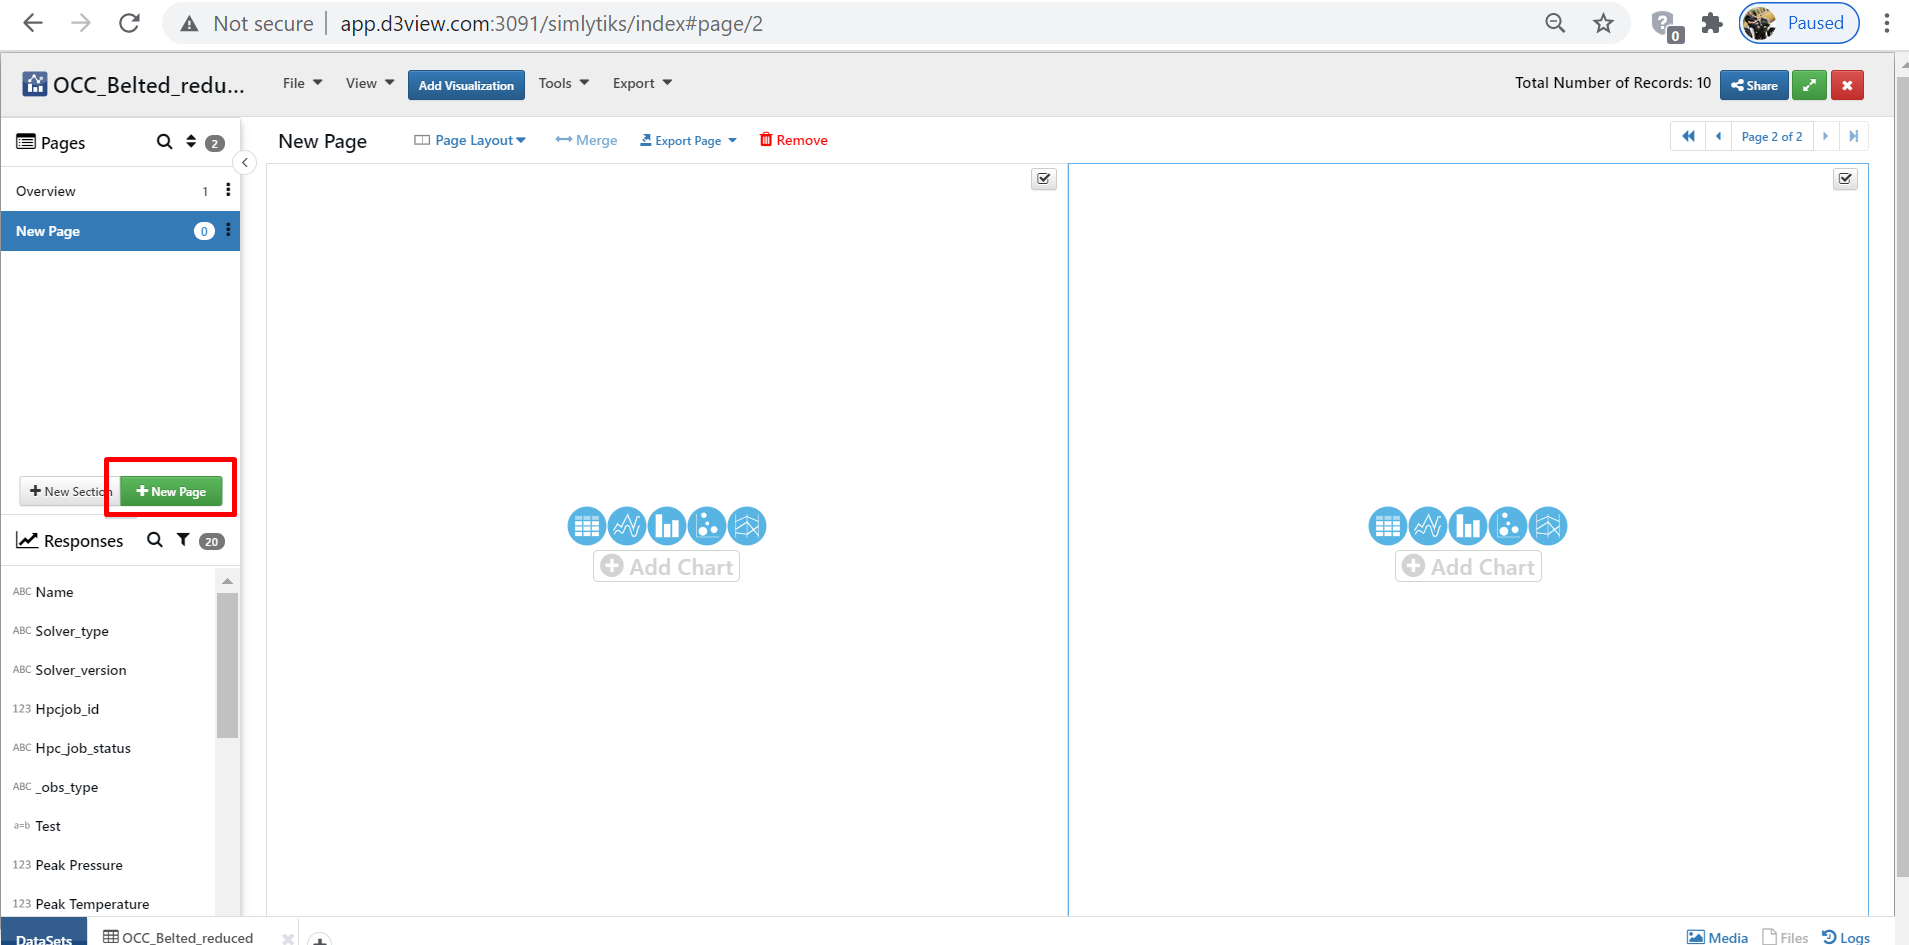
New page
64. How do I edit/remove pages in Simlytiks?
Once the page is created, we have option to edit and delete it By clicking on 3 vertical dots available for each page where we can edit it’s name and we can delete it if we want to delete it. we can set page as initial page by clicking on ‘set as initial page’ to view the page as initial page when we open the dataset again.
Tags: Edit page, remove page, Dataset
1.png)
Three dots (available for each page)
65. How do I Reorder pages?
We can re-order pages by dragging them dropping them to the position we want in Sections and pages.
Tags: Re order pages, visualizations, Dataset
Re order pages
66. How do I Search response in Simlytiks?
We can search response by clicking on search response button available in response section. The searched response can be further added to page by dragging the response to the page.
Tags: Search response, Dataset
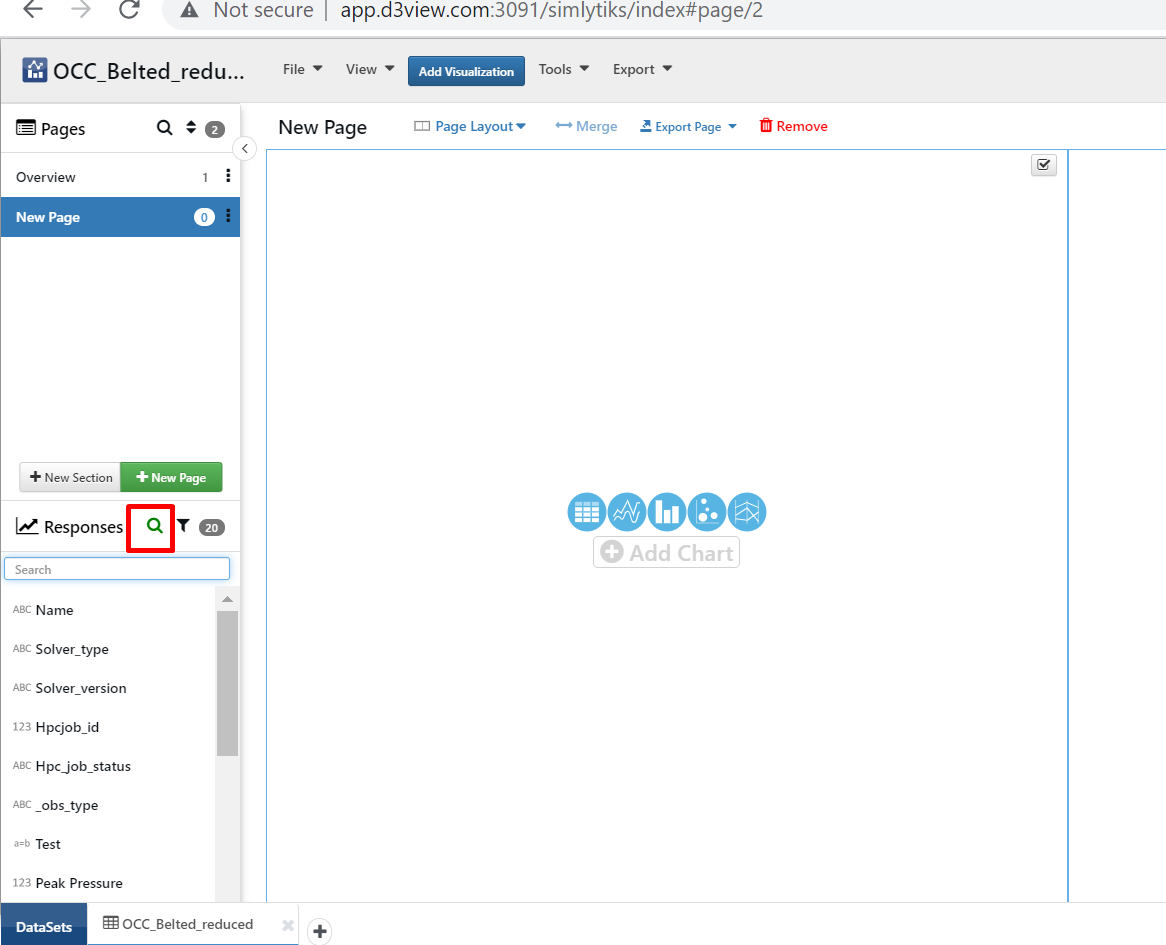
Search response
67. How do I Filter responses?
We can filter responses by clicking on filter symbol available in responses and sort responses based on its type such as images, curve, key value or scalar types.
Tags: Filter response, Dataset
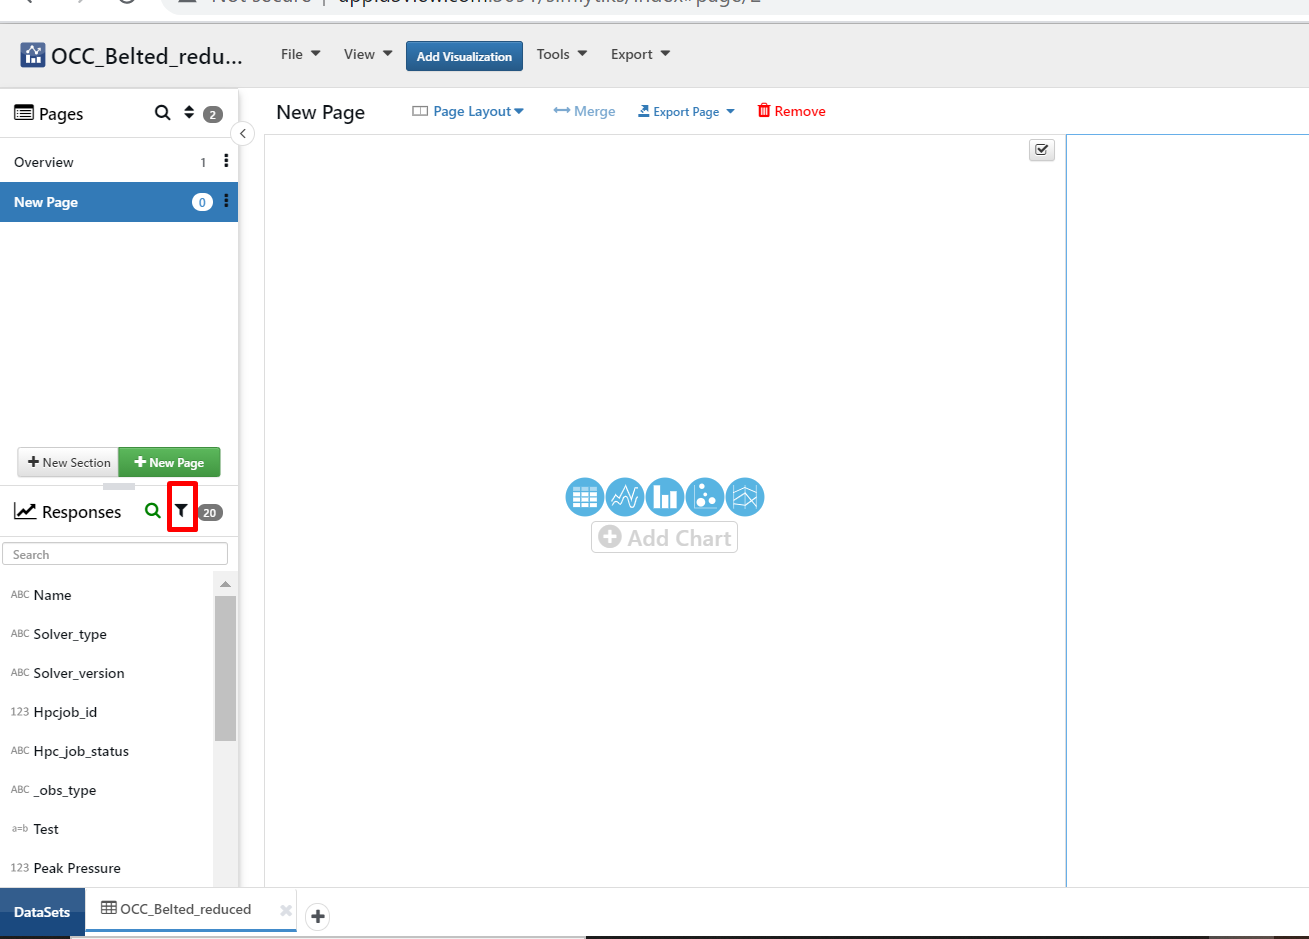
Filter response
Visualizations
68. How do I Add visualization to dataset?
We can add/create charts in different ways among them one is through ‘add visualization’ we can create different visualization by clicking on Add visualization button available in top bar where we can hover over to view placeholder and basic information and select any visualization to create them in Simlytiks page.
Tags: Add visualization, Dataset
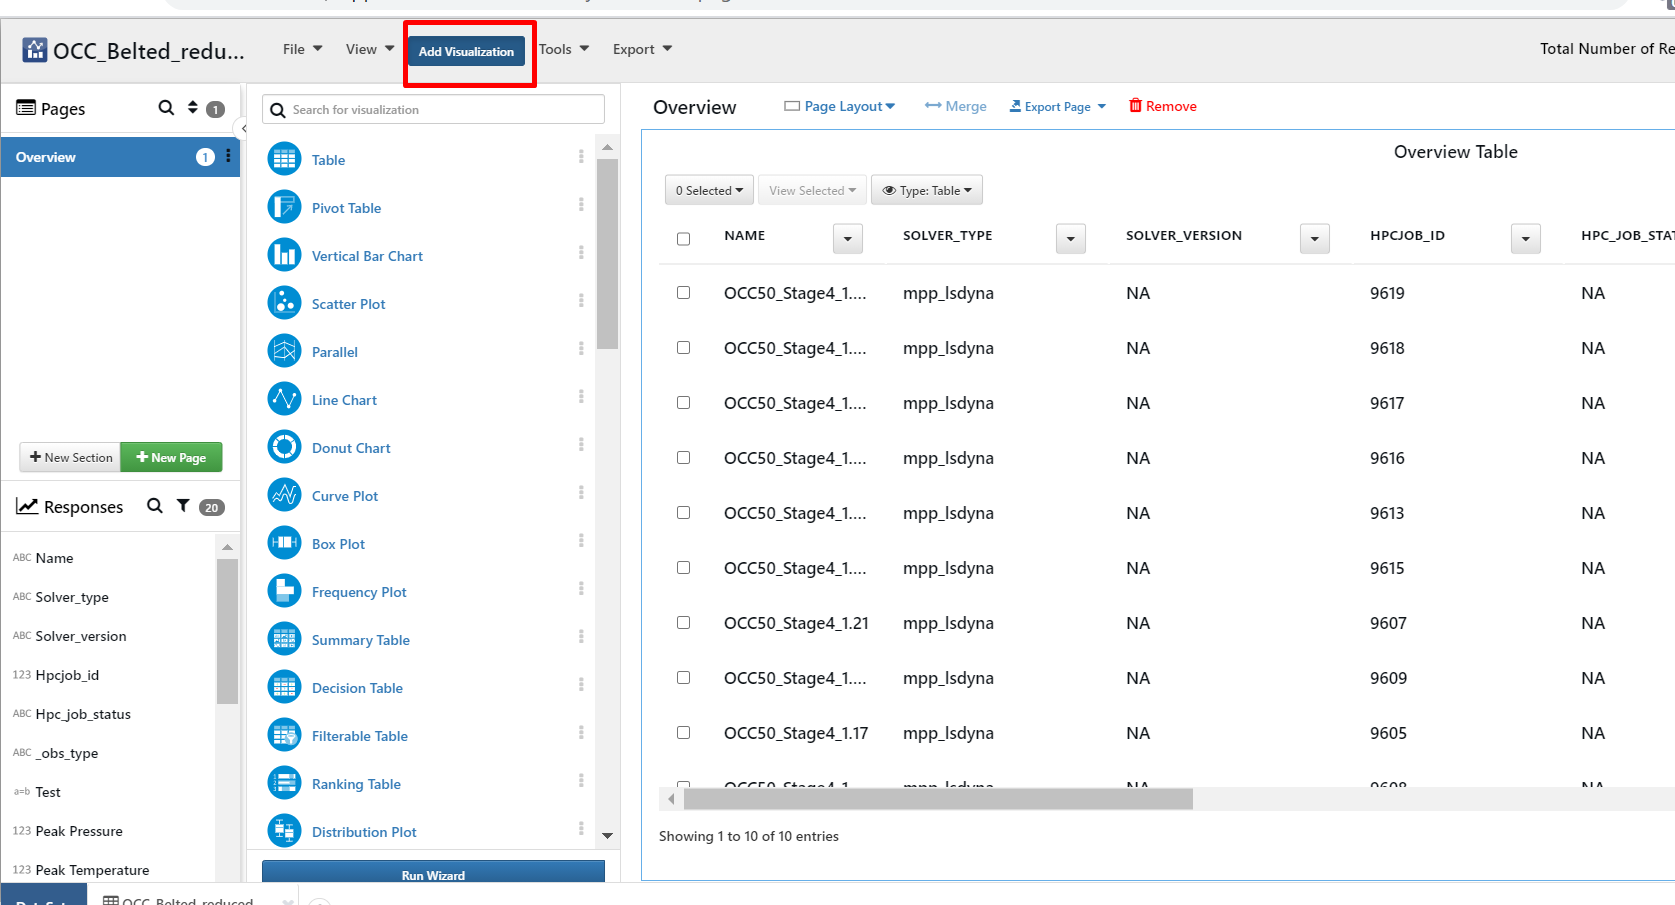
Add visualization
69. How do I Add visualization using Run wizard?
One of the ways of creating visualization is through ‘Run wizard’ we can Add visualization by clicking on Run wizard button available within the ‘add visualization’ to open a list of visualizations where we can select any of them and choose page and column to add them in corresponding position. Tags: Run Wizard, Dataset

Run wizard
70. How do I add basic visualizations to page?
We can add basic visualization by clicking on basic visualization icons available within the page, we can add curve, vertical bar chart, scatter and parallel plot and create those visualizations by providing necessary inputs. One quick way to create visualizations is drag and drop available responses from response section.
Tags: Basic visualization icons, Dataset
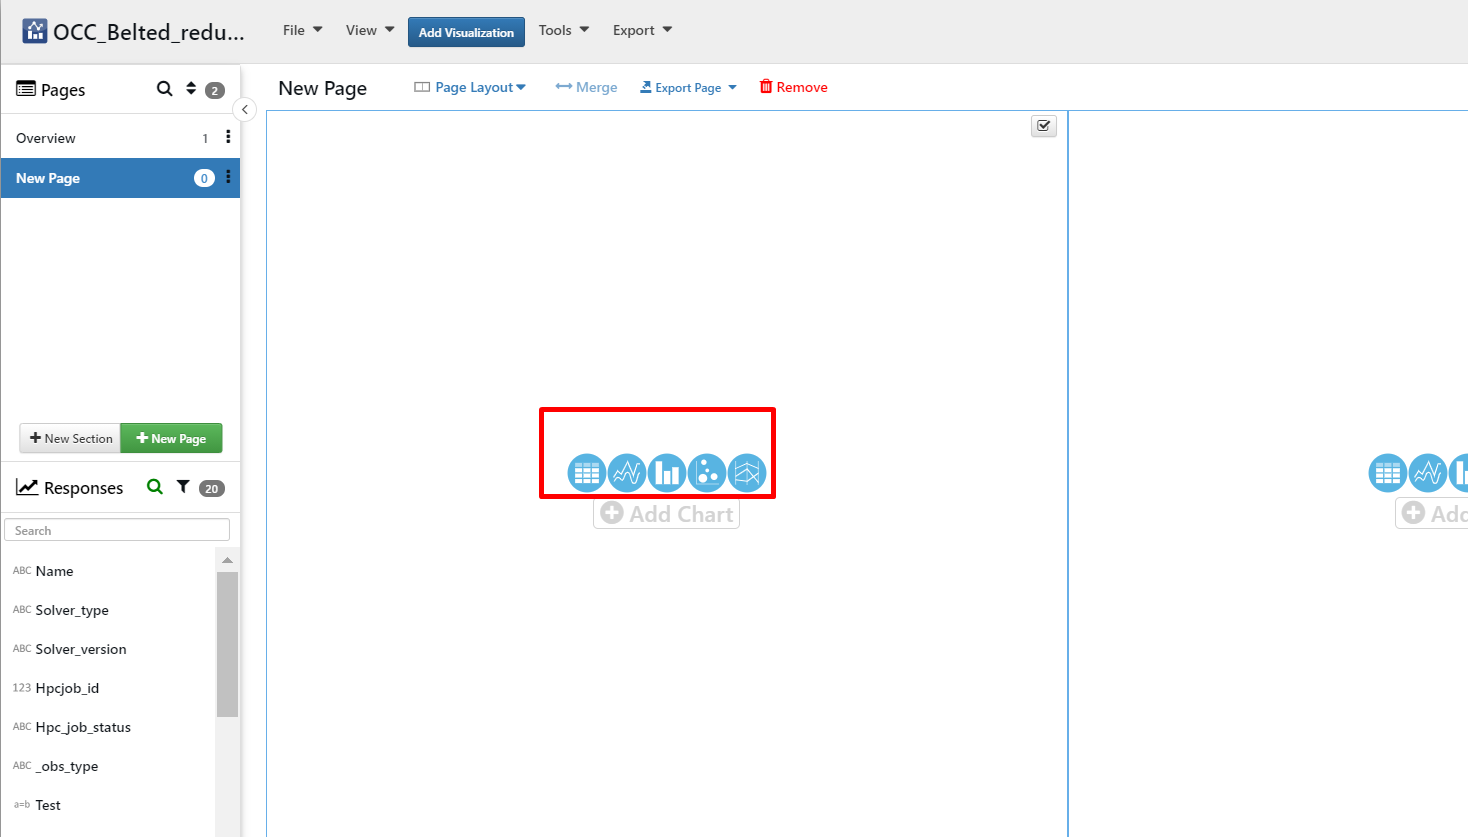
Basic visualization icons
71. How do I add visualizations to page in Simlytiks?
One of the ways of creating visualization is through ‘Add chart’. We can add visualizations to page by clicking on Add chart button available within the page below the basic visualization icons, which has more number of visualizations, We can select any of them and provide necessary inputs and create them by clicking on accept.
Tags: Add chart, Dataset
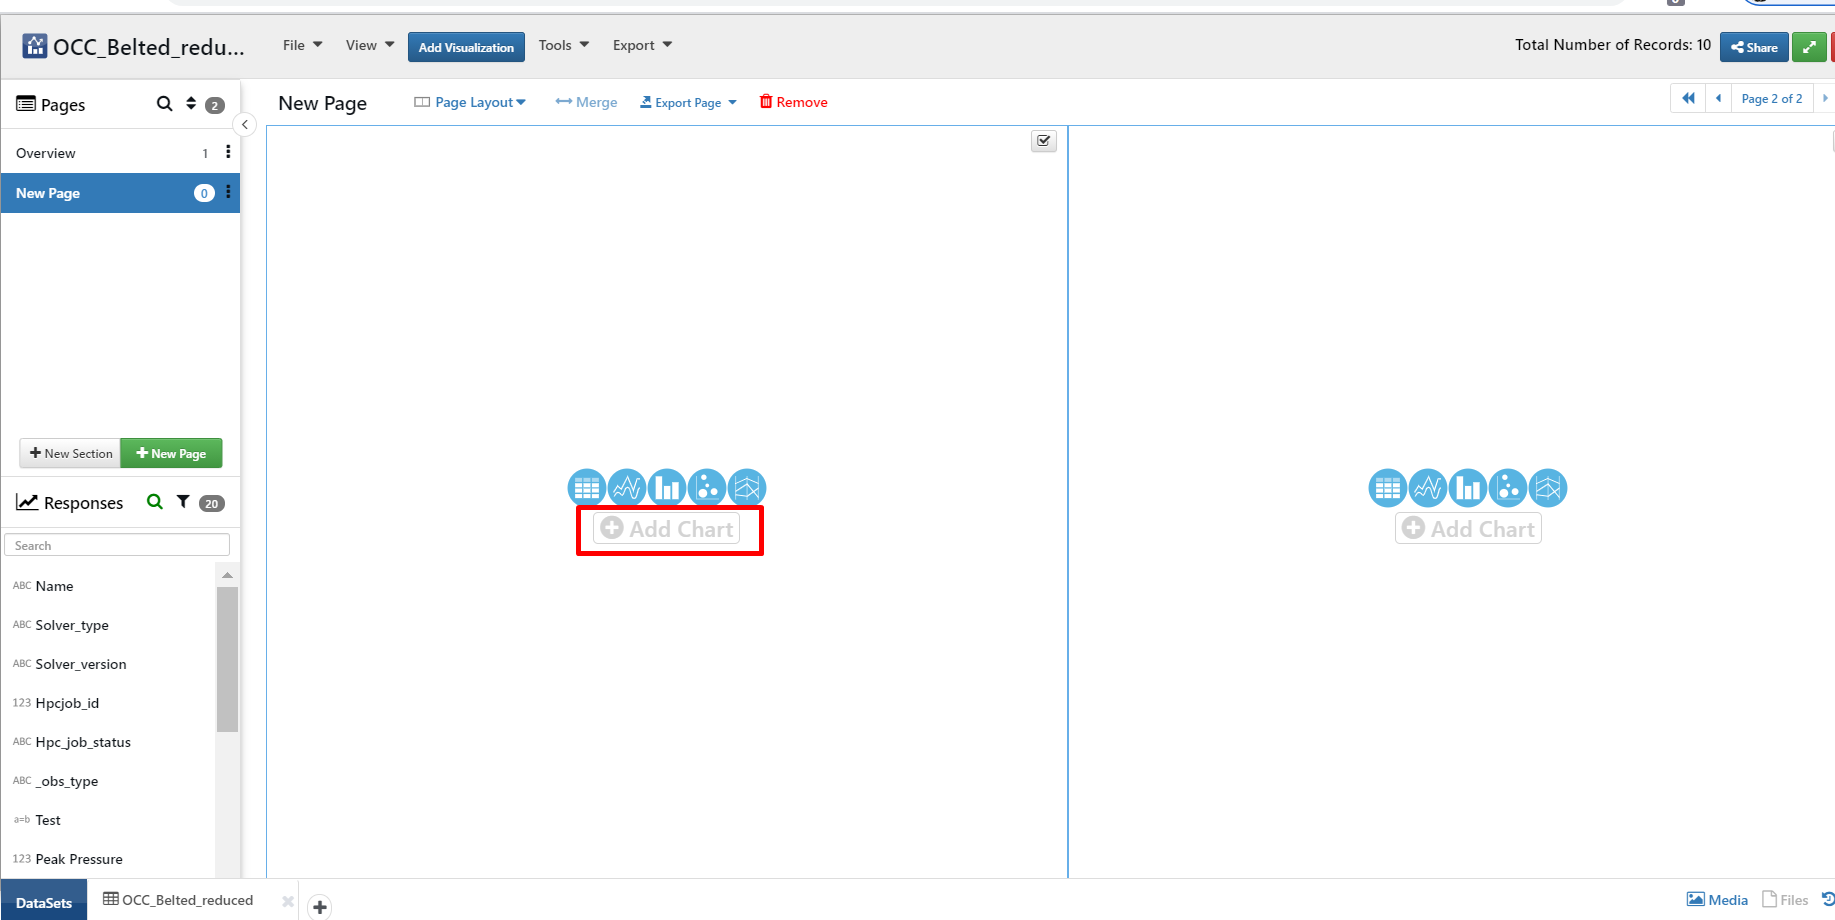
Add chart
72. How do I add a visualization?
We can add visualization to the page by clicking on ‘Accept’ button after providing necessary inputs for the creating visualization, we can add settings available in data, grouping, sorting, color, Appearance and Misc. refer screenshot for more information.
Tags: Accept chart, Dataset
1.png)
Accept (Add chart)
73. How do I Cancel adding a visualization?
We can Cancel adding visualization to the page by clicking on cancel button while creating visualization.
Tags: Cancel Add chart, Dataset
1.png)
Cancel (Add chart)
74. How do I Merge two Visualizations?
We can Merge two or more selected visualizations in the page by clicking on ‘merge’ button available next to page layout below the top bar after selecting visualization by clicking on the check boxes for the chart, once the visualizations are merged, we can see only one visualization among the selected ones even after even after un-merging it. refer screenshot.
Tags: Merge, Dataset
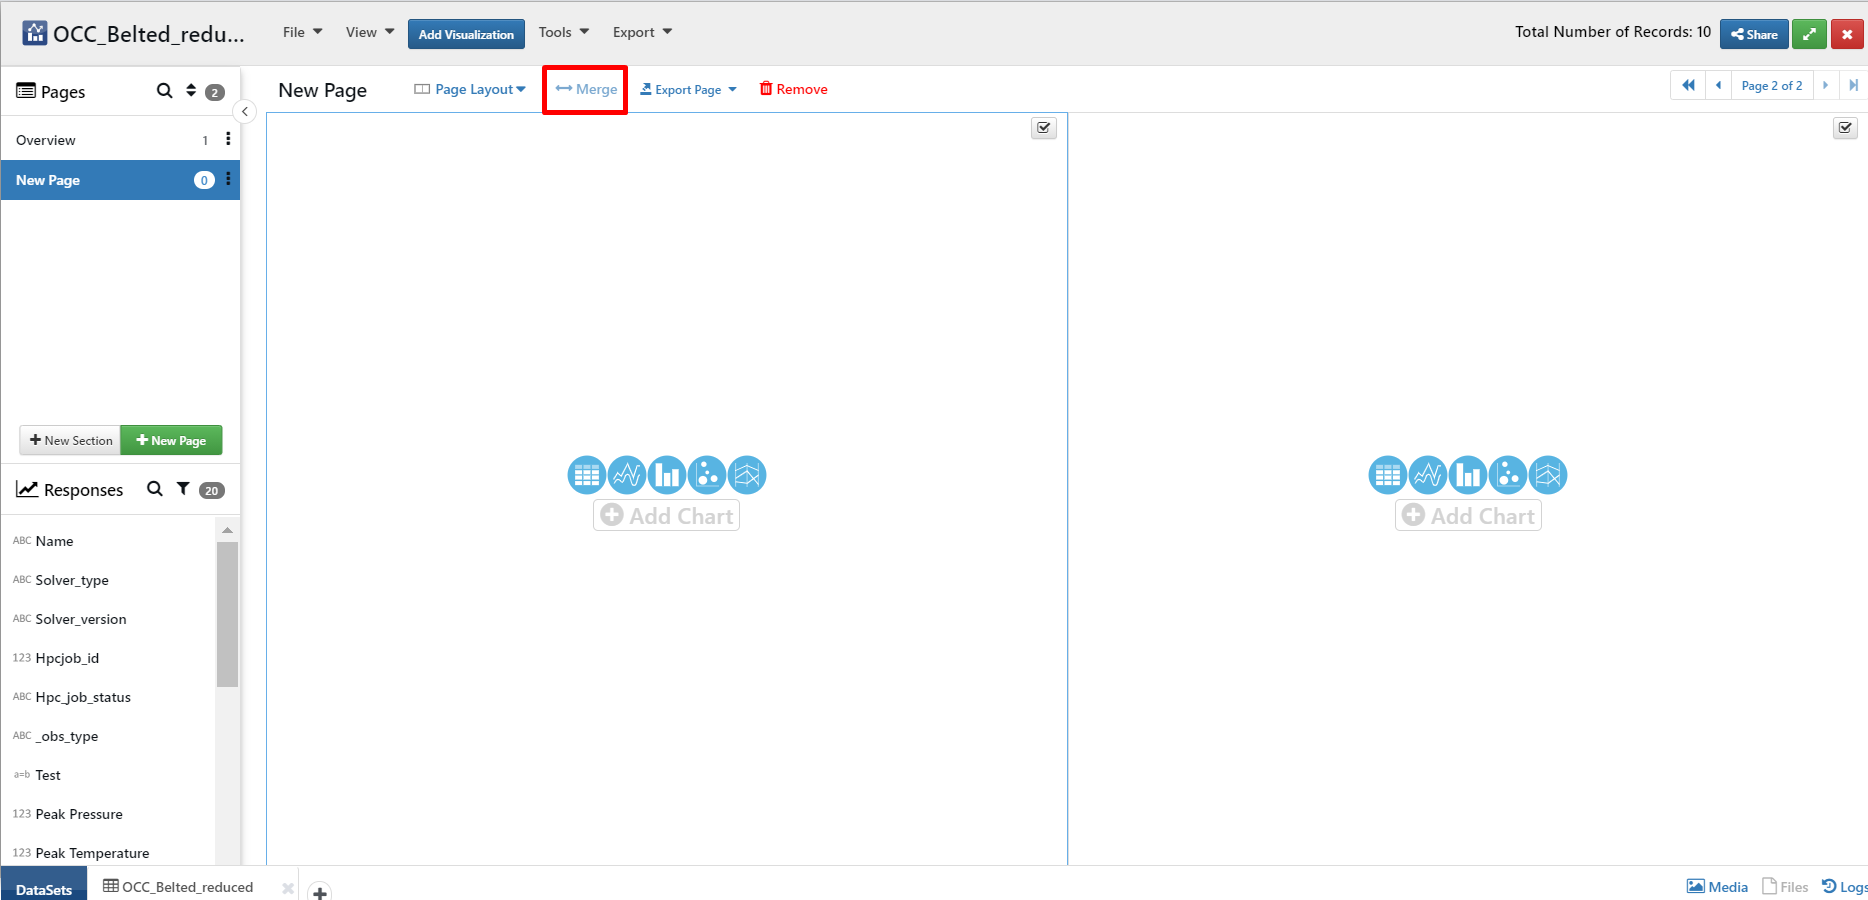
Merge
75. How do I add Data/basic information for a visualization?
We can add Data for a visualization by clicking on ‘Data’ button available for the visualization while creating it. we can add name and other basic information for the visualization from this option. We can edit them as well after creating the visualization using edit visualization.
Tags: Data, add chart, Dataset
1.png)
Data(add chart)
76. How do I Group data for a visualization?
We can group data for visualization by clicking on ‘Grouping’ button available for the visualizations while creating it.We can group data for specific visualizations such as scatter plot, bar charts etc.
Tags: Grouping, add chart, Dataset
1.png)
Grouping(add chart)
77. How do I sort data in a visualizations?
We can sort data for the visualization by clicking on ‘Sorting’ button available while creating visualization. We can sort the visualization data available for specific visualizations such as Bar charts, Scatter plot etc.
Tags: Sorting, add chart, Dataset
1.png)
Sorting(add chart)
78. How do I add color inputs for visualization?
We can add color inputs by clicking on ‘Color’ inputs button available for the visualization while creating it. We can add color inputs available for the specific visualizations such as Bar chart and scatter plot etc.
Tags: Colors, add chart, Dataset
1.png)
Colors(add chart)
79. How do I format appearance while adding visualization?
We can format appearance by clicking on the ‘appearance’ button. We can check the appearance of a visualization and we can change settings like, Min/Max values, Axes labels, show/hide legends, show/hide datum lines etc. These are specific for specific visualizations ex:curve plot etc.
Tags: Appearance, add chart, Dataset
1.png)
Appearance(add chart)
80. How do I add Misc options to visualizations?
We can add Miscellaneous settings by clicking on ‘misc’ button while creating a visualization. we can add settings like datum area, average lines etc. These are specific for specific visualizations ex: curve plot.
Tags: Misc, add chart, Dataset
1.png)
Misc(add chart)
81. How do I add Filters to visualization while creating it?
We can add filters by clicking on Filter button available while creating visualization. we can filter legends of the chart based on applied filter ex: name, solver_type etc. We can remove these filters by resetting in edit visualization.
Tags: Filters, add chart, Dataset
1.png)
Filters(add chart)
82. How to I change aspect ratio for visualization while creating it?
We can change aspect ratio for the visualization by clicking on aspect ratio button available below the filter. We can change size of the visualization while creating it. After creating viz, we can edit it using aspect ratio available in 3 horizontal lines towards the right top corner of the viz.
Tags: Aspect ratio, add chart, Dataset
1.png)
Aspect ratio(add chart)
83. How do I add AnimateBy for the visualization?
We can add animation to the visualization by clicking on animateBy option available below the aspect ratio button while creating it. After clicking on animateBy, select category to apply animateBy. We can play, pause the animation even while creating it as well as after creating it.
Tags: Animate, add chart, Dataset
1.png)
AnimateBy(add chart)
84. How do I edit Visualization name?
We can edit Visualization name by clicking on visualization name, it opens up a popup where we can edit the current name, font size, font style color of the name, Italics, underline etc by taking advantage of these buttons after changing settings click on save to apply changes to the visualization name.
Tags: Visualization name, Dataset
Visualization name
85. How do I Bold visualization name?
We can bold visualization name by clicking on visualization name which opens up edit label modal where we can click on ‘Bold(B)’ and click on ‘save’ to save changes and apply it to the visualization name.
Tags: Bold, edit visualization name, Dataset
1.png)
Bold (edit visualization name)
86. How do I edit visualization name to Italics?
We can format visualization name as Italics by clicking on visualization name, We can click on Italics(I) in the edit label modal and click on ‘save’ to save and apply changes to the visualization name.
Tags: Italics, edit visualization name, Dataset
1.png)
Italics(edit visualization name)
87. How do I edit Font Style for visualization?
We can change font style for visualization name in edit label modal which opens up when we click on visualization name and we can select any of the available font styles in the dropdown and click on ‘save’ to save and apply changes.
Tags: Font style, edit visualization name, Dataset
1.png)
Font Style(Edit visualization name)
88. How do I edit Color of the visualization name?
We have option to change color for the visualization name in edit label modal which opens up when we click on visualization name. Here we can select color from color panel and click on save to save and apply changes to the name.
Tags: Color, edit visualization name, Dataset
1.png)
Color of the visualization name(Edit visualization name)
89. How do I Save edited name?
We can format settings for the visualization name in edit label modal after changing settings like name, font style, size, color we can click on ‘save’ which saved the latest settings and the settings are applied to the visualization name.
Tags: Save, edit visualization name, Dataset
1.png)
Save(edit visualization name)
90. How do I Cancel visualization name editing?
We can cancel visualization name editing while we are in the edit label modal, if we don’t want to apply the new settings for the name, we can click on ‘cancel’ button to cancel editing which closes edit label modal.
Tags: Cancel, edit visualization name, Dataset
1.png)
Cancel (edit visualization name)
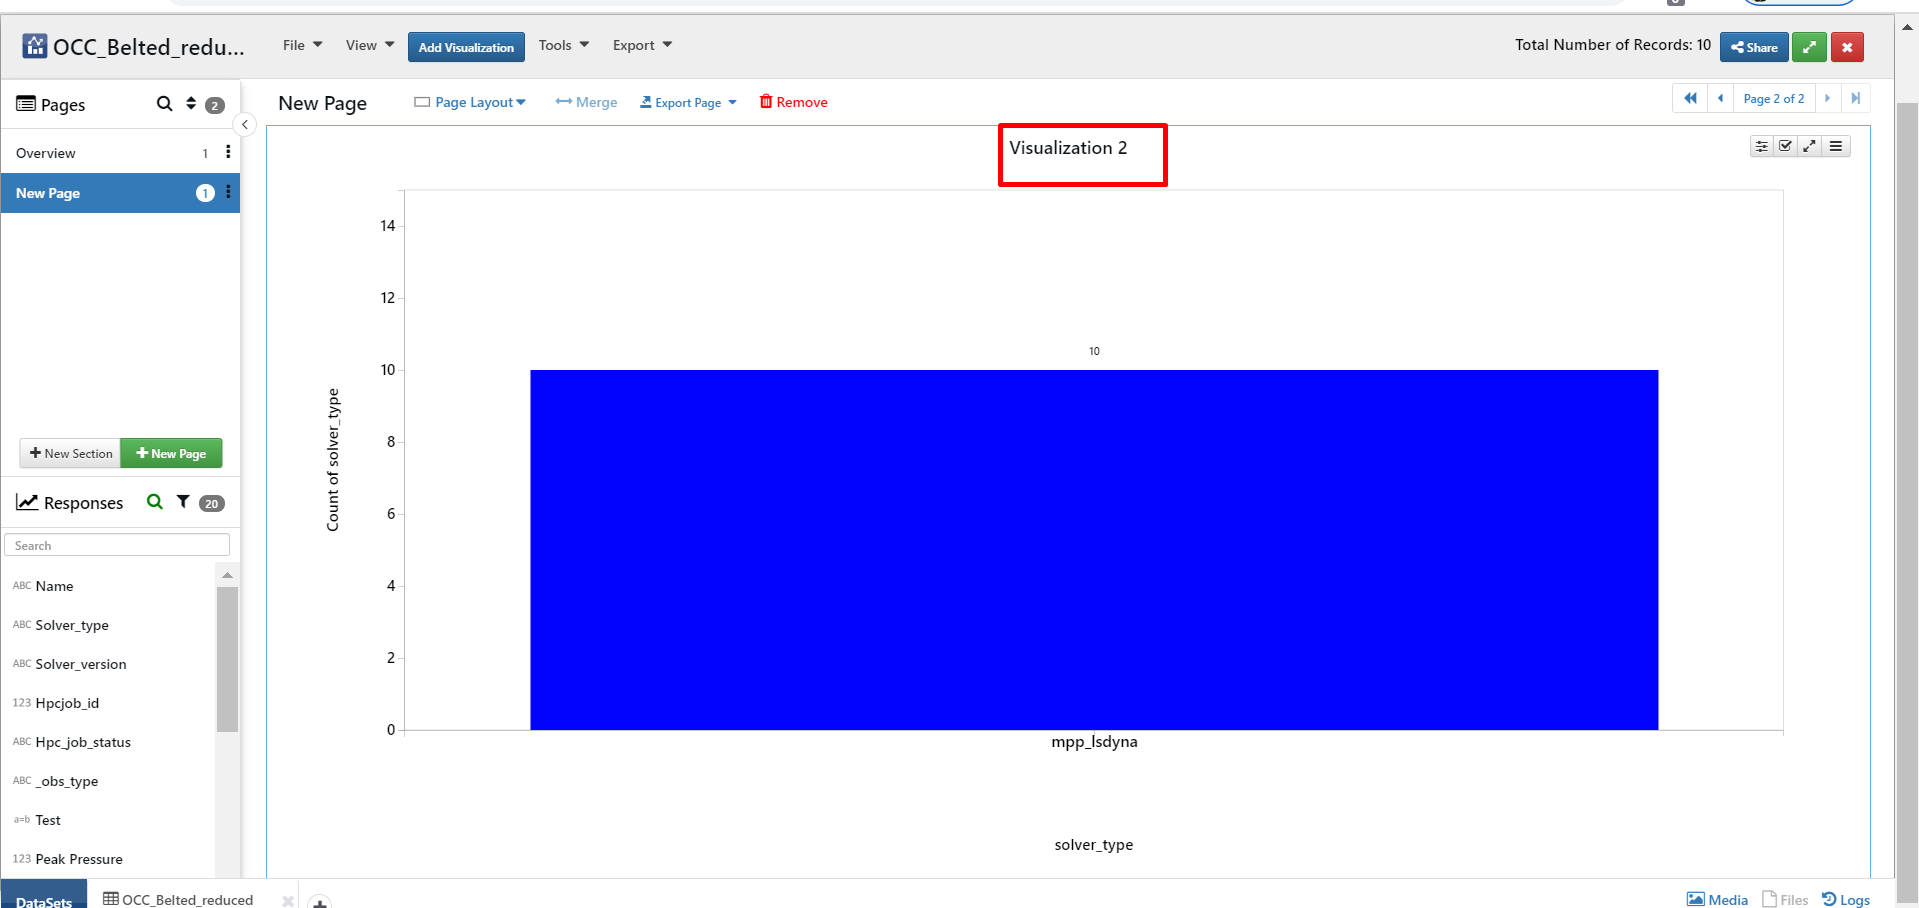
91. How do I Enlarge/minimize visualization?
We have option for enlarged view of the visualization for more clear and detailed view of the visualization. For this we have to click on ‘Enlarge’ button available at the right top of each visualization also we can minimize it to original view using the same button.
Tags: Enlarge visualization, Dataset
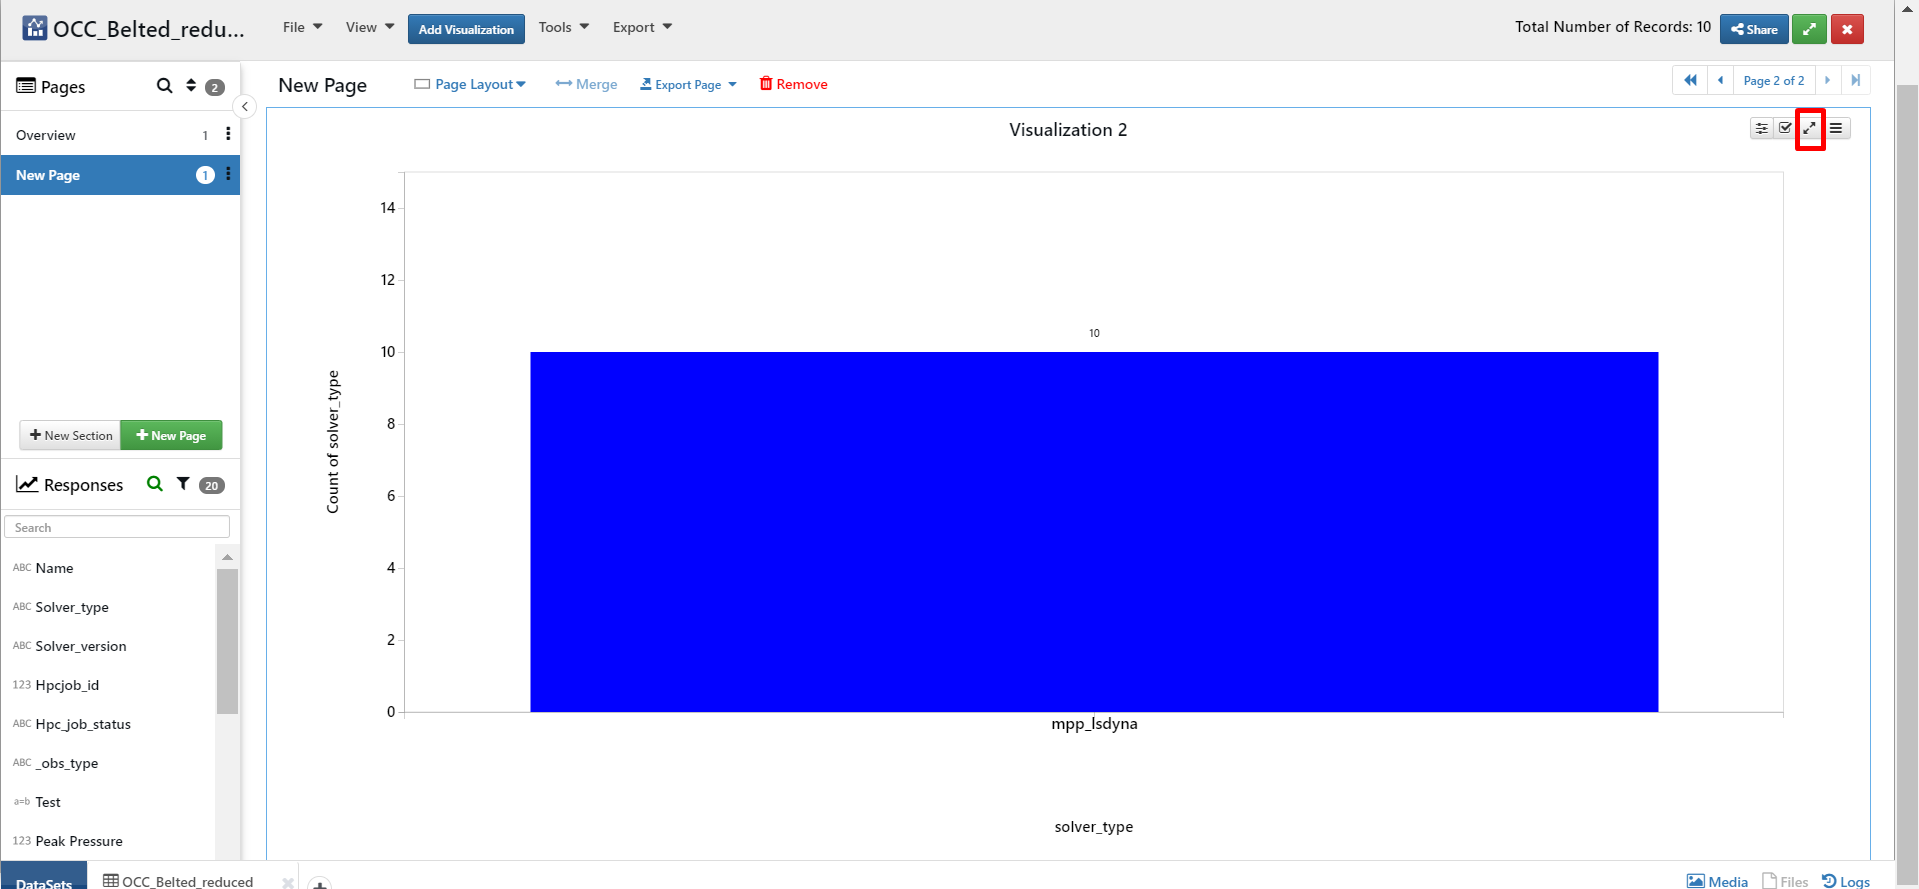
Enlarge visualization
92. How do I edit, download or share visualization?
We have edit visualization options available in 3 horizontal lines available at the right top corner of each visualization where we can find other options like, download to export chart as image, share chart with users, refresh, Hide title, and delete visualization and clone viz. We can take advantage of these buttons for the respective functionalities.
Tags: Edit, download, share, Dataset
1.png)
Three lines(options for the visualization)
93. How do I view different Chart types for visualization?
By default view type is line, we can change view type for the viz by clicking on view type button(eye icon) where we have different view types, we can select on any of these to view in corresponding type. ex: table, points, points with line etc. Tags: Chart type, Dataset
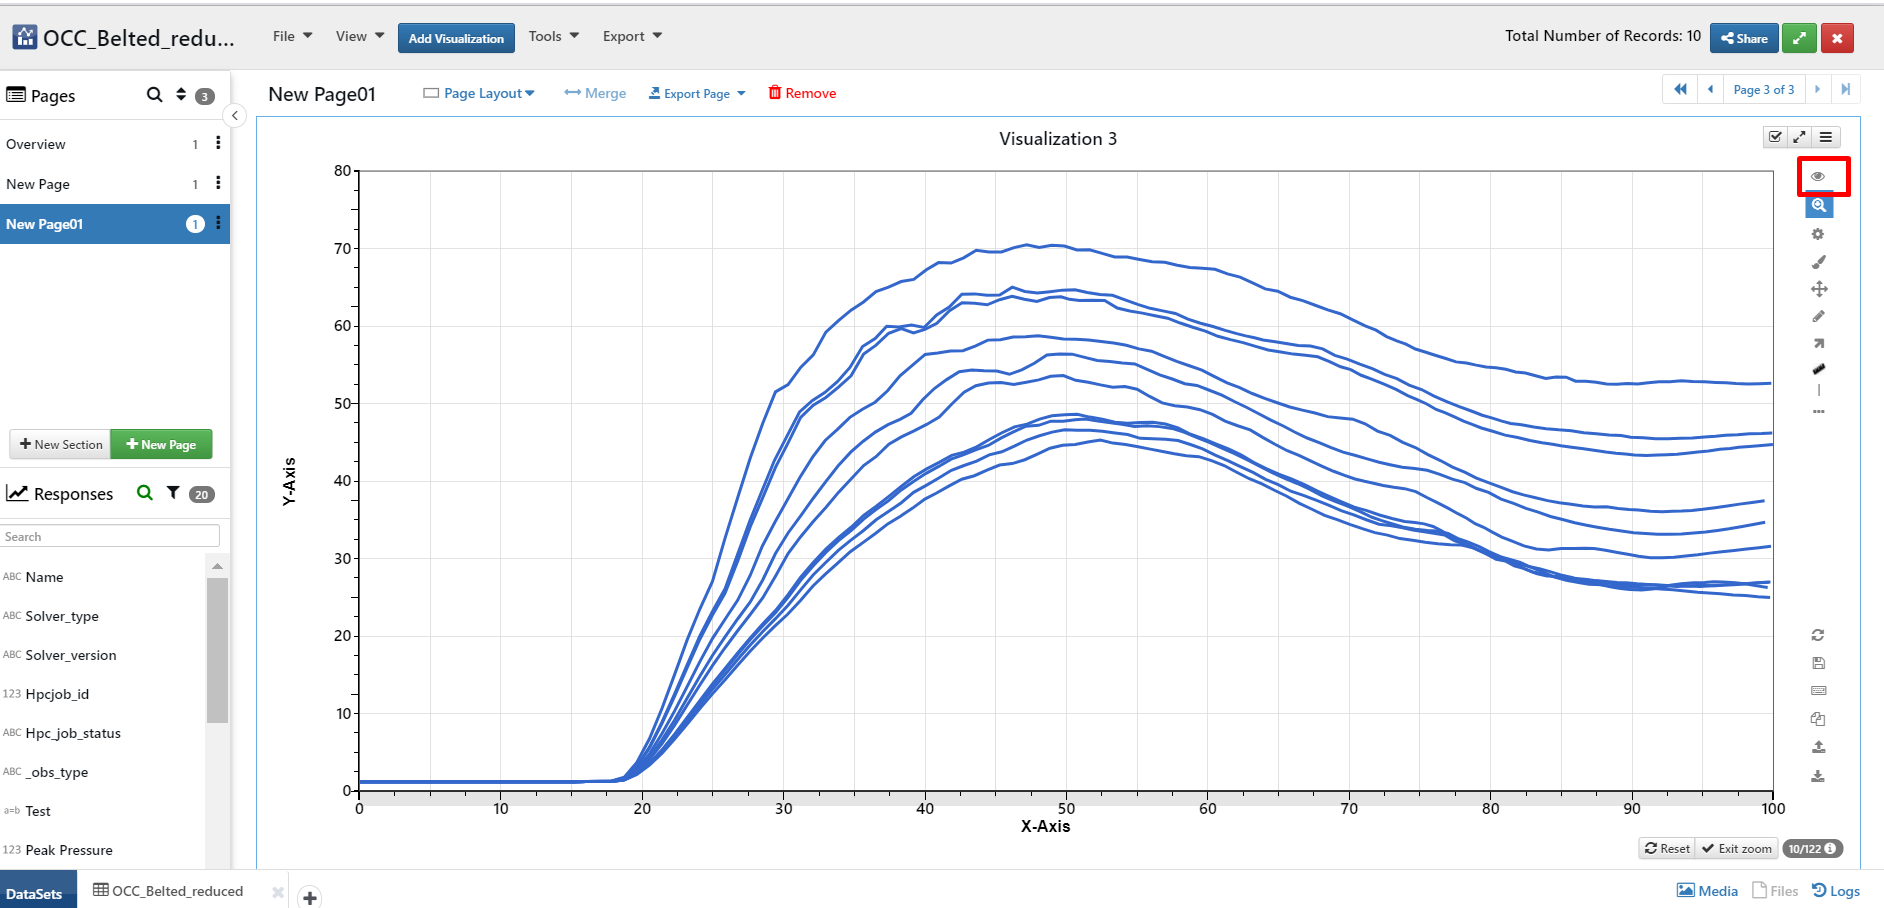
Chart type
94. How do I Zoom in the visualization?
For more detailed view of the visualization, we can zoom it as per the requirement by clicking on ‘zoom’ button and drag and select area to be zoomed in. We can get back the original viz by clicking ‘zoom out’ or ‘autofit’ available in right click options when we right click on the visualization.
Tags: Zoom in, Dataset
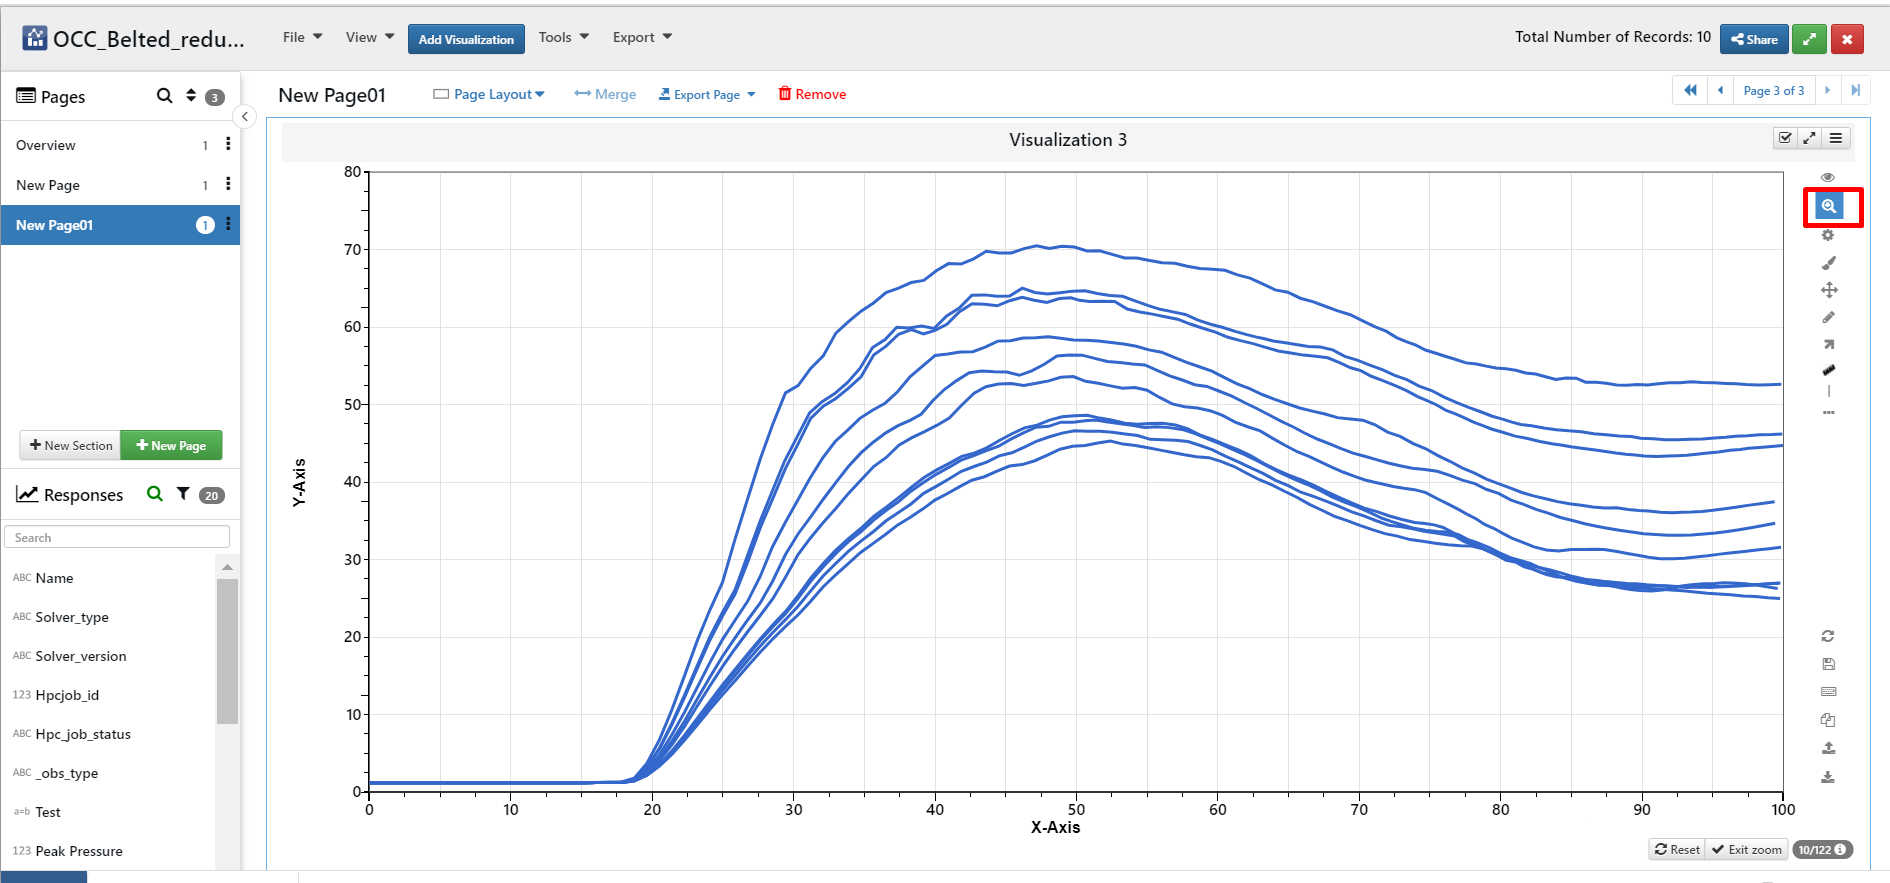
Zoom in
95. How do I Zoom vertically and horizontally into visualization?
Instead of free zoom in, we have other two zoom in options that is ‘vertical zoom’ and ‘Horizontal zoom’ by clicking on ‘zoom type’ button available in right side where we can select zoom in type and select area by draging to zoom in.
Tags: Zoom type, Dataset
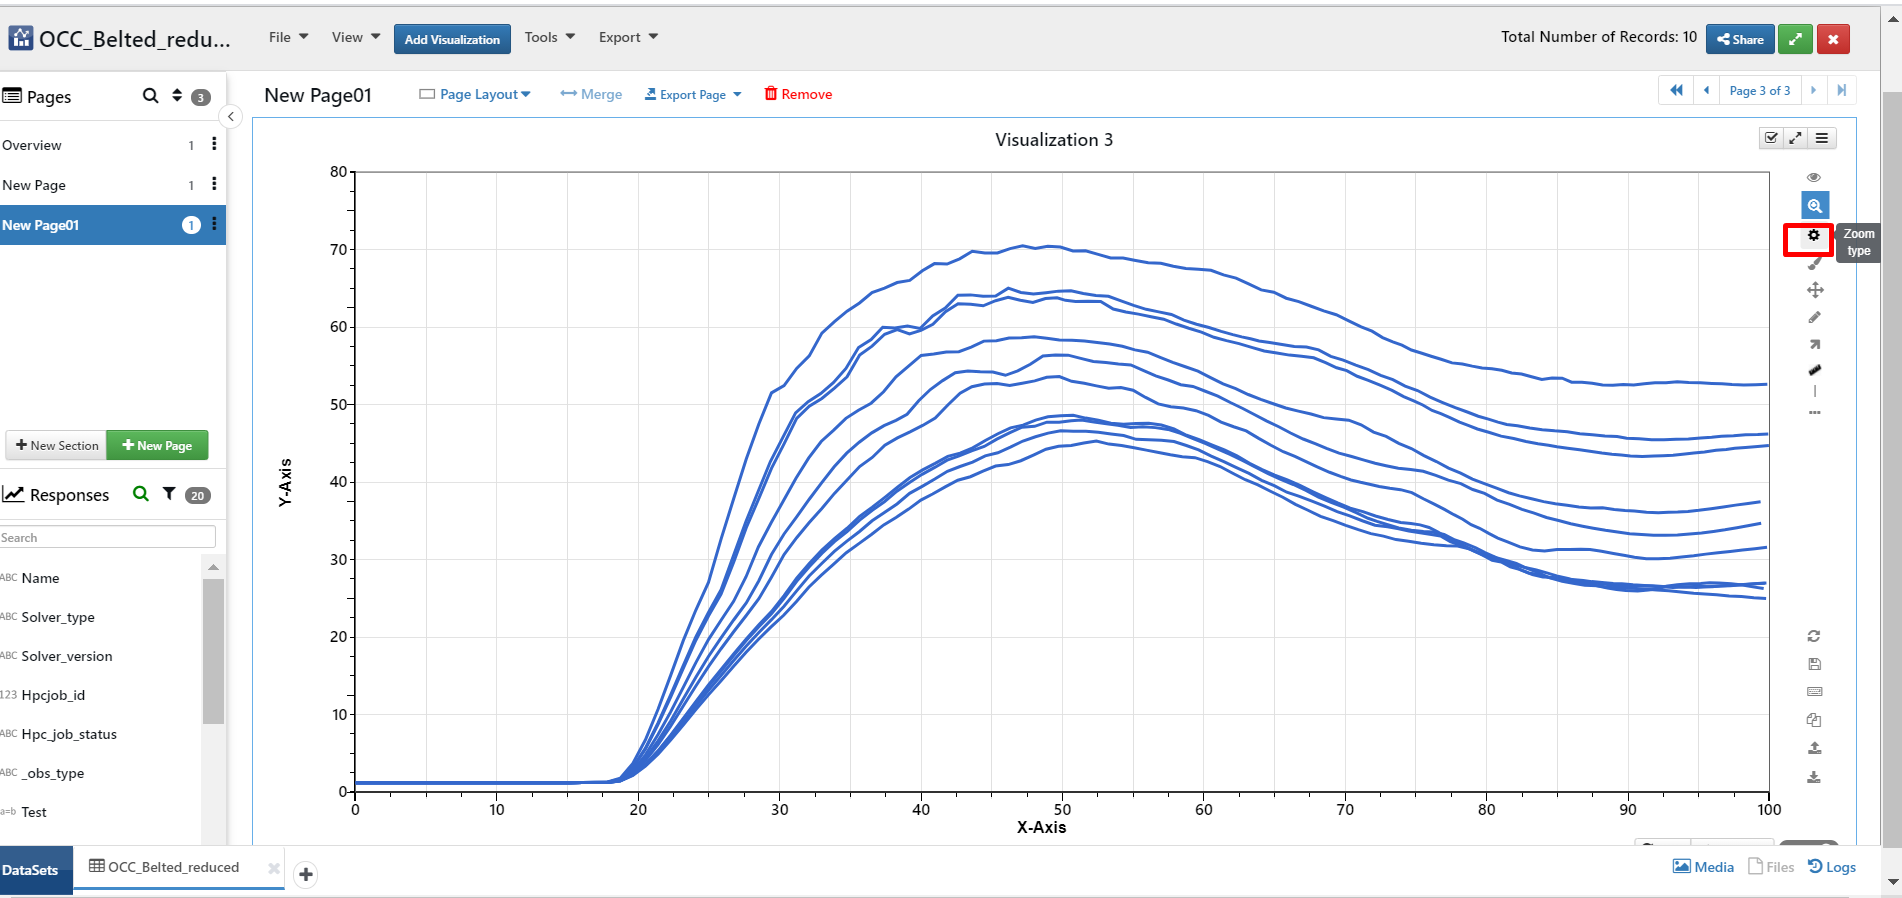
Zoom type
96. How do I Highlight visualization?
We have option to highlight specific legends in the visualization by selecting ‘highlight’ button(brush icon) available in the right side and drag area to select legends which has to be highlighted. Further we have option to filter the legends using ‘Keep highlighted’ or ‘Remove highlighted’ which shows up at the top of the visualization once we select legends.
Tags: Highlight, Dataset
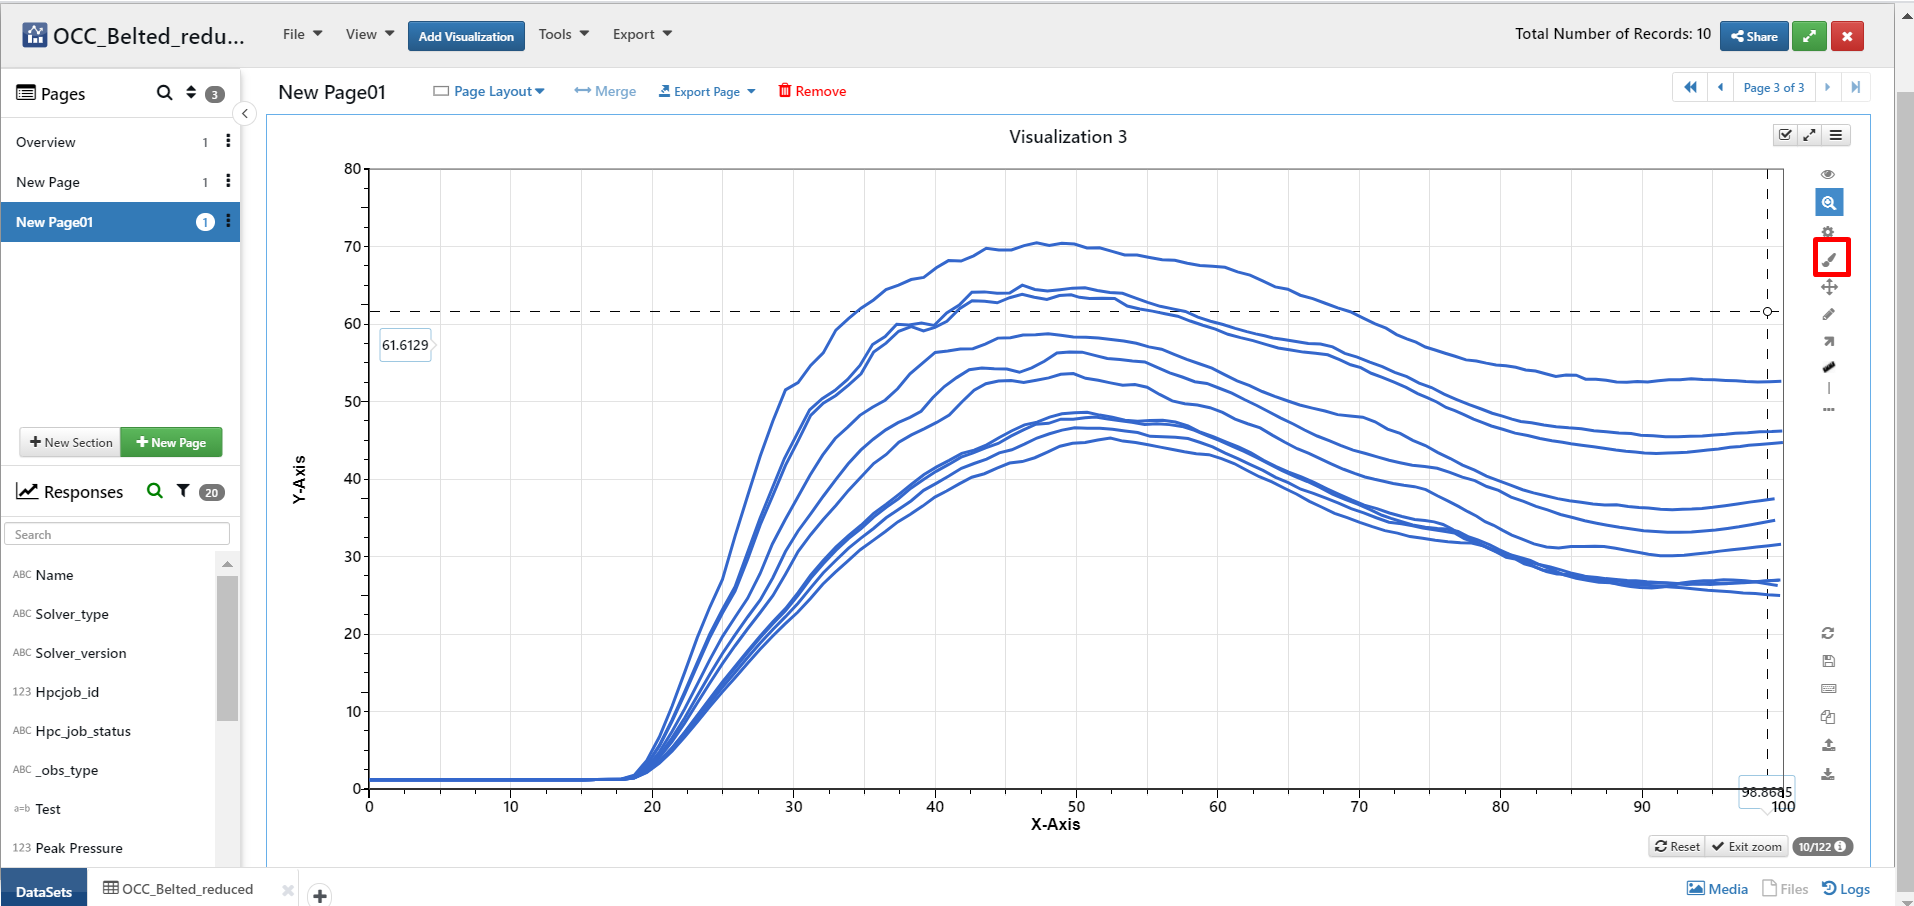
Highlight
97. How do I Change axis titles?
We can change axis labels/titles by clicking on axis titles/ labels which opens edit label modal where we can edit axis labels and other settings like font size, style, color, Bold, Italics then click on save to save changes and apply it to the axis titles.
Tags: Axis titles, visualizations, Dataset
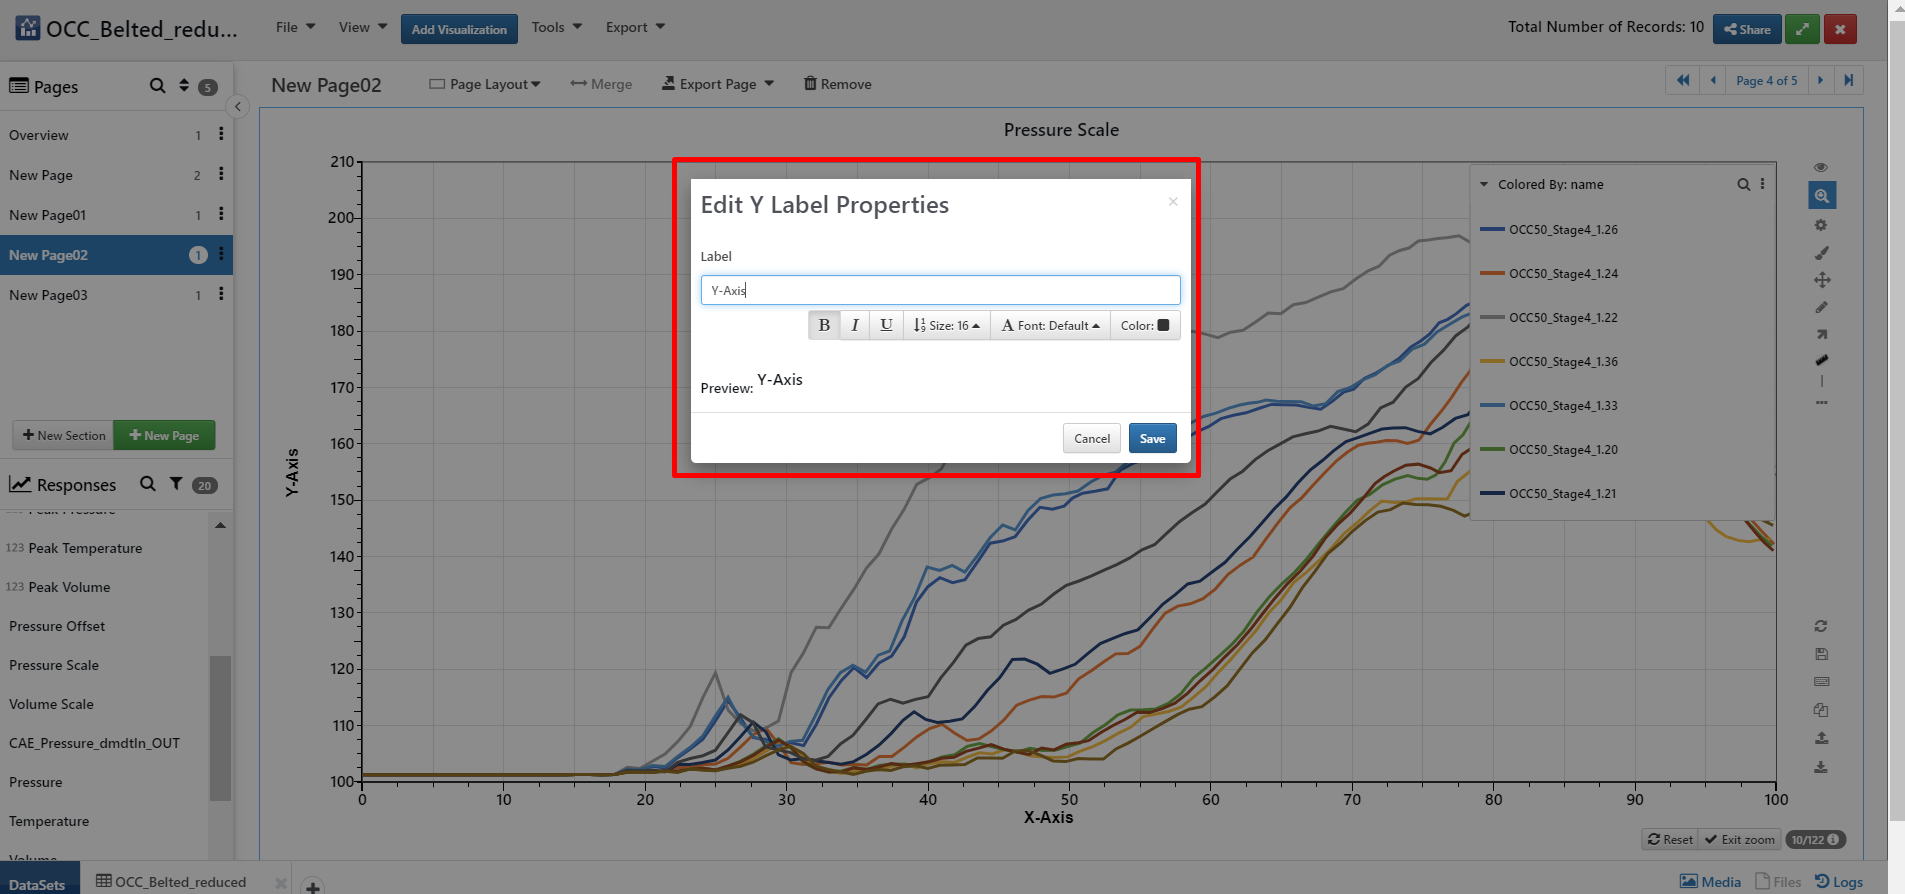
Axis titles
98. How do I upload media?
We can add media to the simlytiks or edit existing media. To add media click on ‘file’ and click on ‘add media’ which opens up file explorer where we can select images from local system and add them to the simlytiks media which further opens media window, where we can see added image and select columns in the dropdown and drag and drop values onto the visualization. We can drag only one value for each image. These images in-turn can be used while creating visualization Y-axis data by selecting column inputs which we had selected while adding media. Instead of adding new image, we can make use of existing images in the media in similar way in edit media.
Tags: Add media, Edit media,
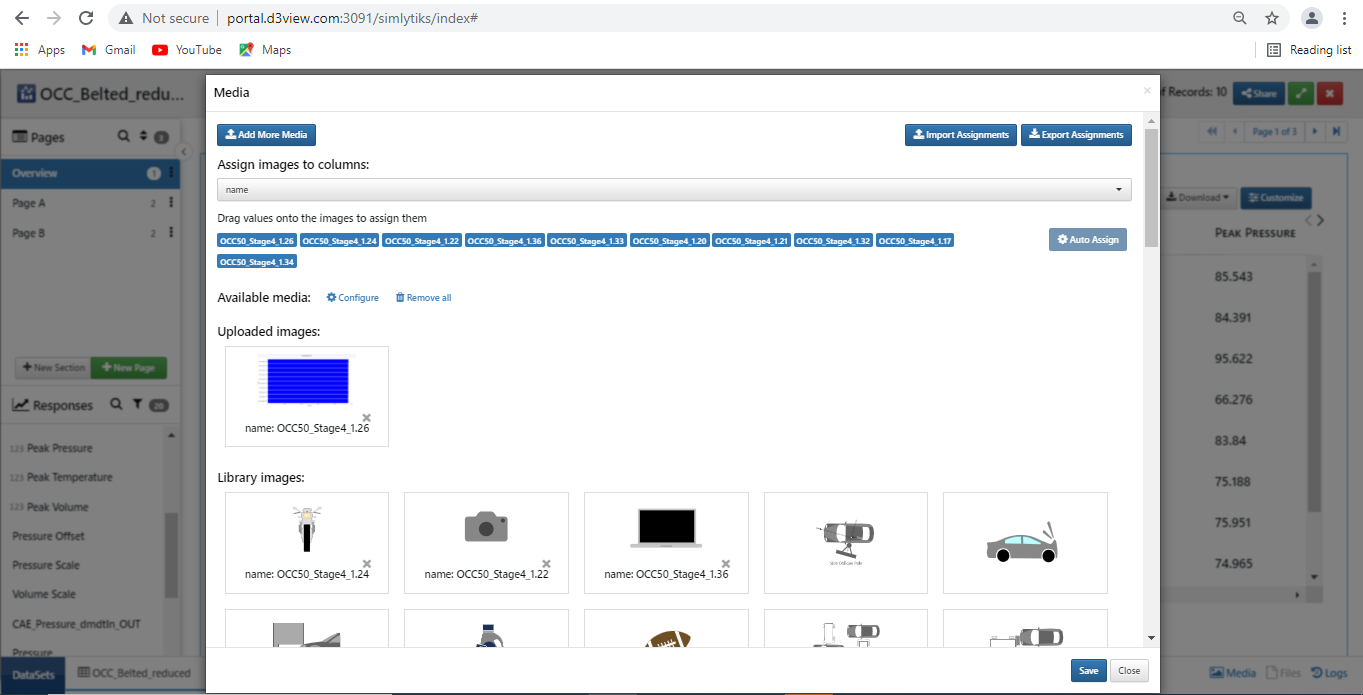
Add_Edit media
99. How do I add watermark?
For scatter plot visualization, we have option to add watermark by right-clicking on the visualization and select ‘add watermark’ which opens up water mark editor, where we can enter text and format other settings like Bold, font style, font size, color, Orientation(vertical, horizontal, diagonal), and transparency by sliding the bar and click on save to save changes and apply it to the visualization. We can Edit settings for the watermark as well by right clicking on the added watermark.
Tags: add watermark, scatter plot, edit watermark
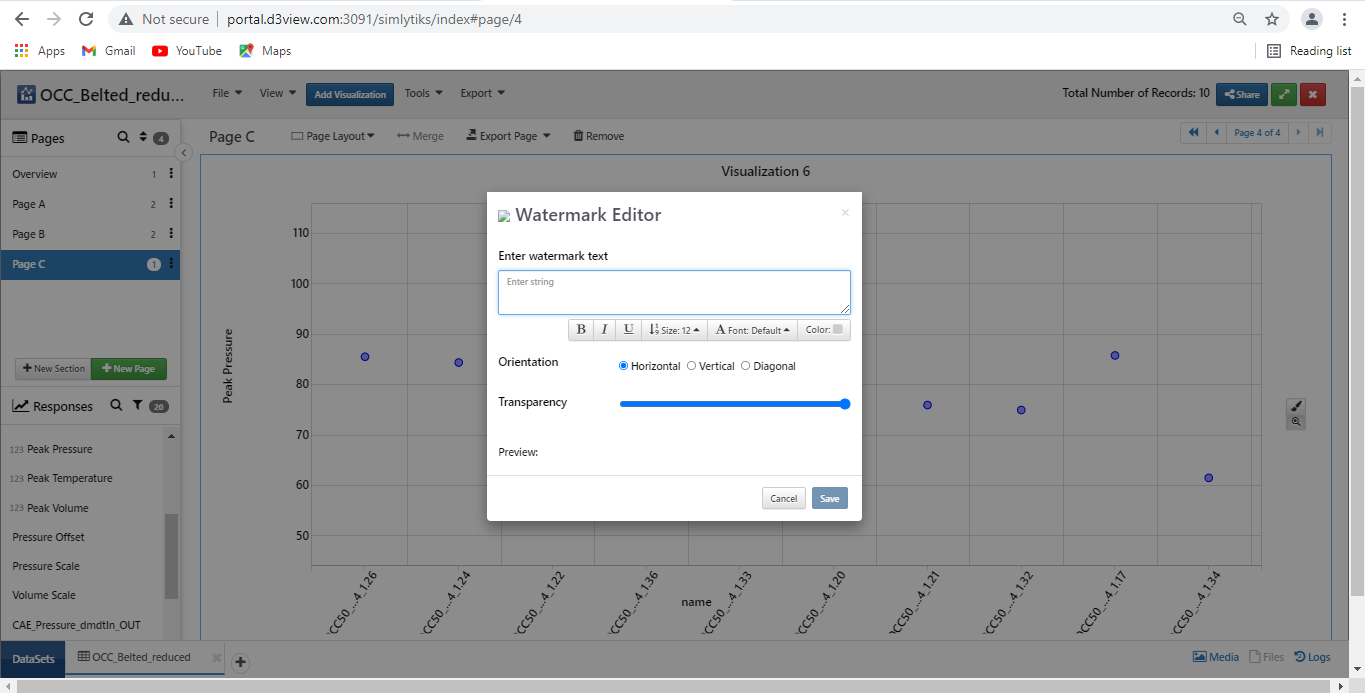
Add_watermark
100. Why aren’t my images uploading to my chart?
For the images in the media, we can drag and drop only one value for each image and we have to select the same column for Y-axis data which we had selected in media. Once this is done we can see images for the dragged values in the visualization. ex: If we had selected ‘name’ as column and dragged each name/ value for different images, then while creating chart, we have to select name as Y’axis data so that we can view images for the values/names instead of text.
Tags: media, images, uploading, chart
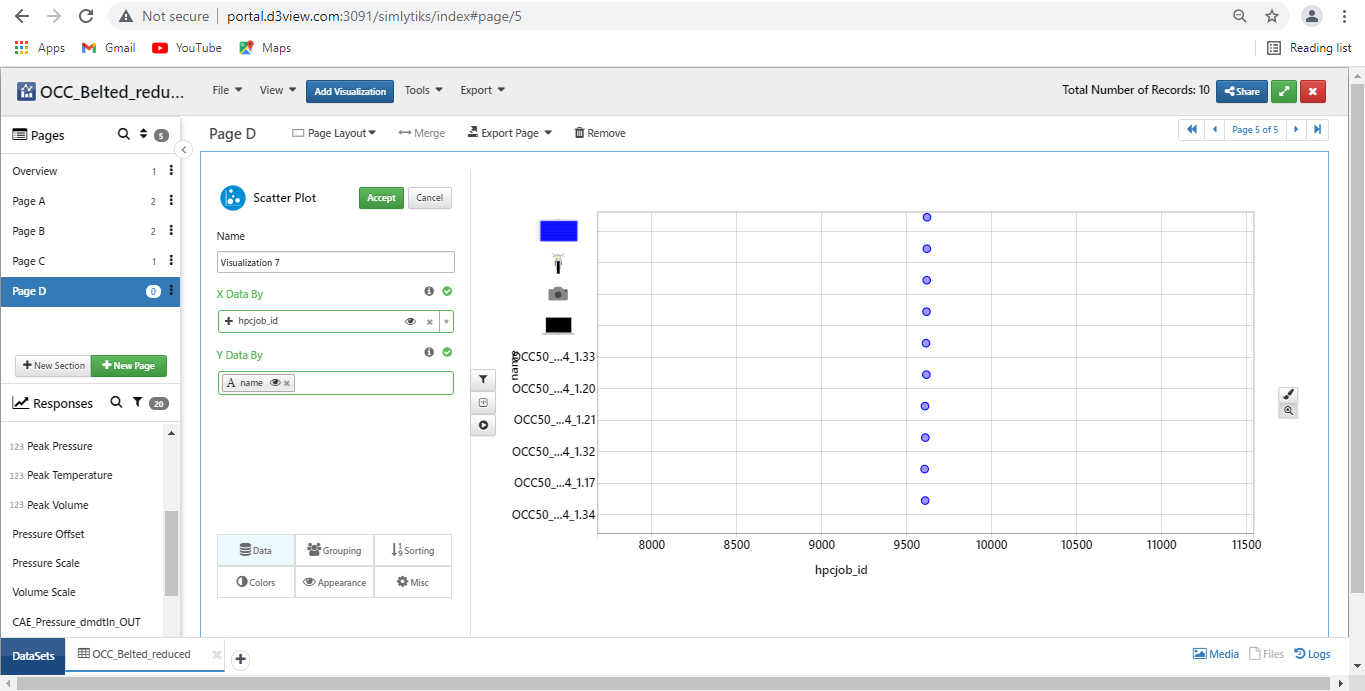
image uploading
101. How do I upload a PPT layout?
To export the page as PPT, click on ‘Export PPT’ and click on power point which opens up PPT builder where we can upload layout with the help of ‘slide layout’ button there we can ‘load from file’ to select file from local system and we can make use of the new layout from the file available in slide layout and we can export page accordingly.
Tags: PPT layout, slide layout, load from file
PPT layout
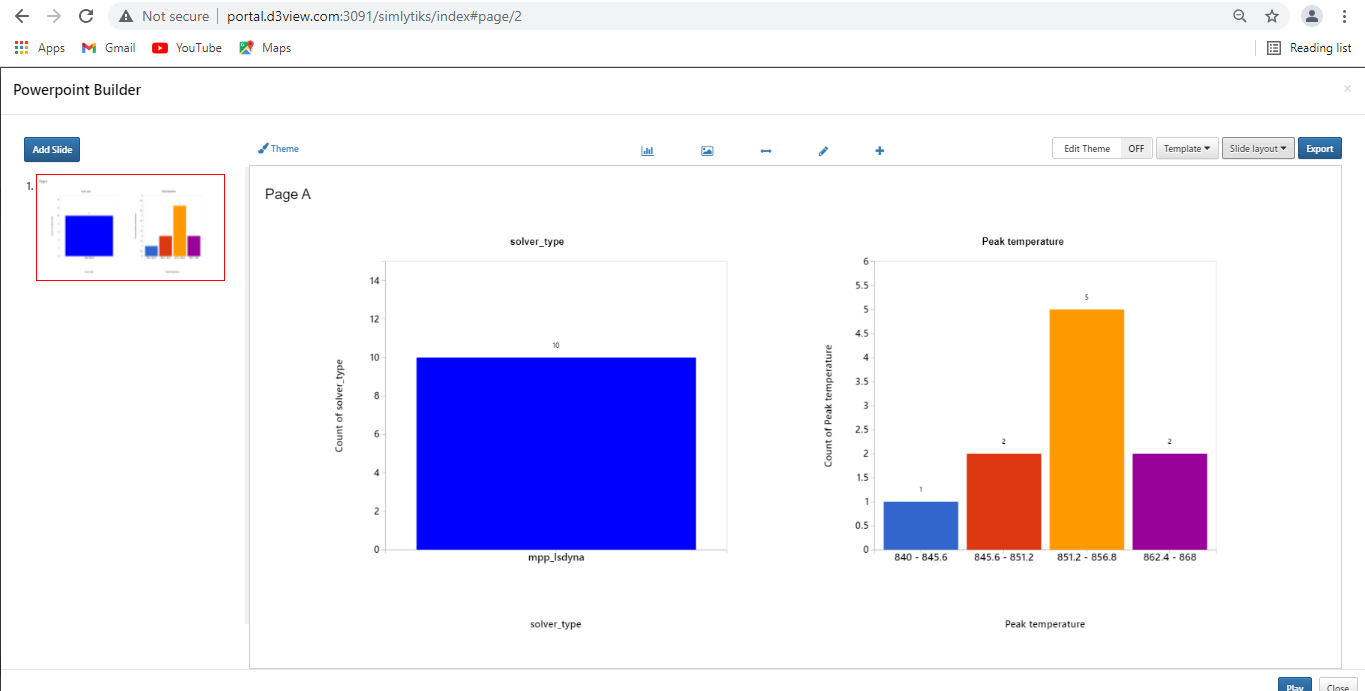
102. How do I access the PPT builder?
To access PPT builder, click on ‘export page’ dropdown and select PPT where we can see preview of the PPT and we export it by clicking on ‘export’ button available at the right corner of the PPT builder to export the page as PPT.
Tags: PPT builder, export page as PPT
PPT builder
103. How do I clone/copy a visualization?
We can clone visualization/copy paste visualization from one page to other page to retain same settings, click on 3 lines available for the visualization where we can see different options, click on ‘clone viz’ which copies the chart to the clip board and then open new page/empty page and right click to paste the visualization.
Tags: clone visualization, copy visualization
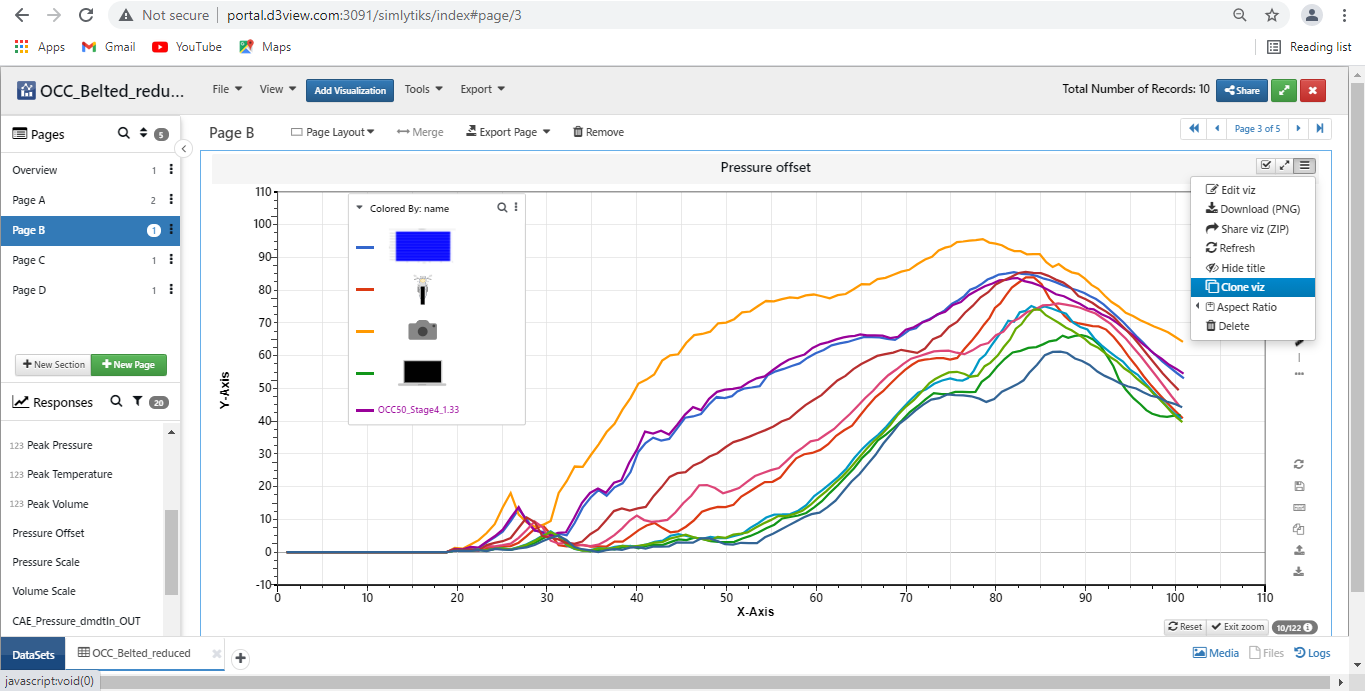
clone viz
104. How do I create different versions of the same chart?
We can have different versions of the chart by cloning or the copying visualization. Click on 3 lines at the top right corner and click on ‘clone viz’ which copies the chart to clip board. We can paste it to new page by right clicking on the new page and pasting it. We have one more way, right click on the source chart and click on ‘copy settings’ and check required settings in the popup window, and go to target chart to which we want to have same settings as source Chart. Right click on the target chart, click on ‘paste settings’ and select ‘only this visualization’ to paste settings only this chart.
Tags: copy visualization, clone visualization, copy settings, different versions
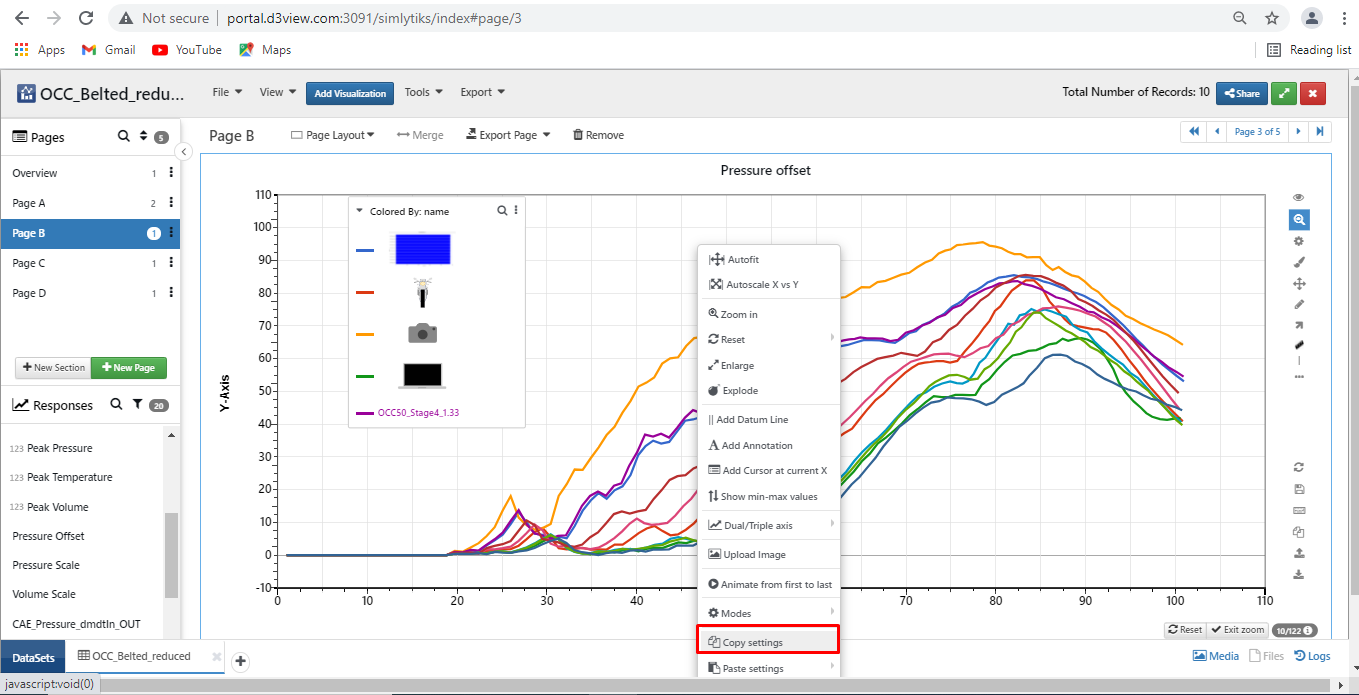
copy visualization
105. How do I quickly edit a chart?
After creating visualization/ adding visualization to the page, we have option for quick editing option for few settings which are very important. Click on ‘quick edit’ button available at the top of the visualization which shows important settings which we can edit quickly, edit any of them to apply changes to the viz quickly. ex: Bar chart, Scatter plot.
Tags: edit chart, quick edit, scatter plot, bar chart
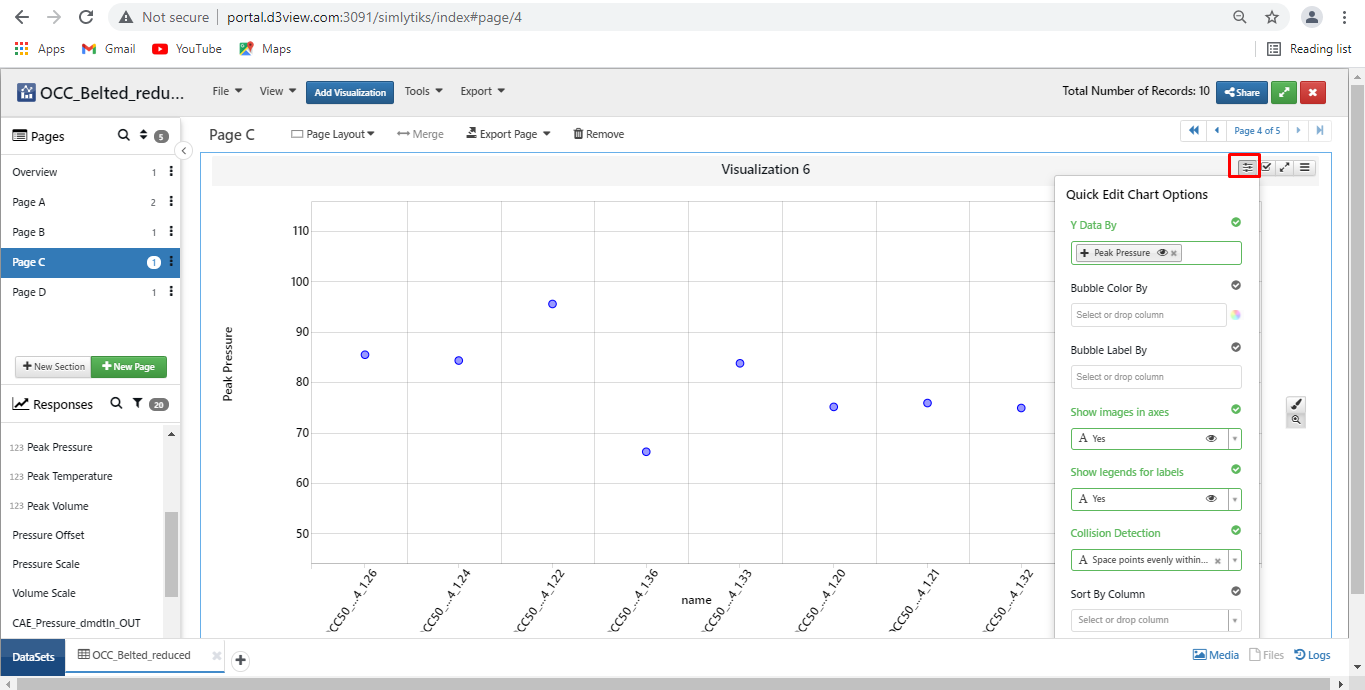
Quick edit
106. How do I change the color scheme for my chart?
We can edit color scheme for the chart. We have different ways to change colors in edit visualization, we can change ‘colorBy’ inputs for the viz or we can click on colored wheel to select any of the available color schemes in the dropdown and apply to change color pattern accordingly other way is click on ‘Tools’ available in the top bar where we can select ‘saved colors’ which opens up saved colors modal where we can change color for the legend by clicking on the existing color and click on save to save changes and apply settings to the visualization.
Tags: color scheme, saved colors
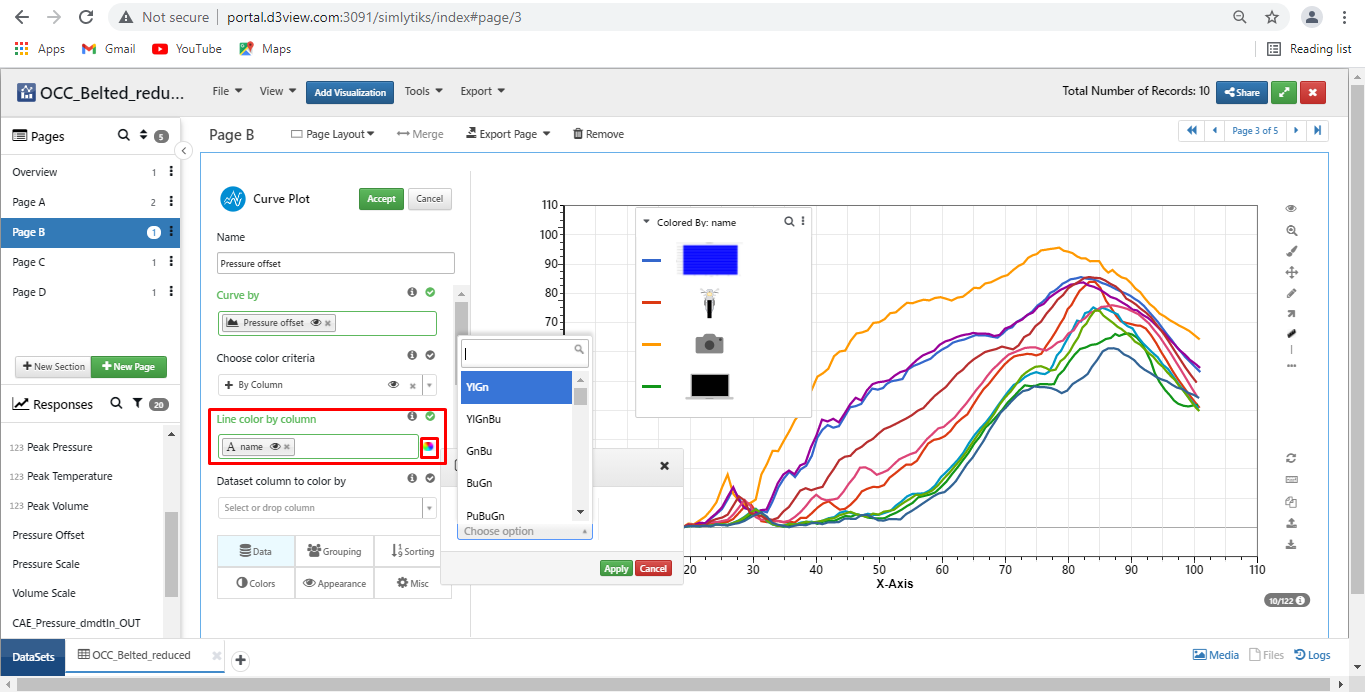
color scheme
107. How do I avoid overlapping text on my charts?
To avoid overlapping text, click on an axis title or the axis ticks to lower the font size and create more space in the chart. We can also format the plot area for certain charts under the right-click menu. The following images shows how to do this for bubble chart.
Tags: Text, Format Font
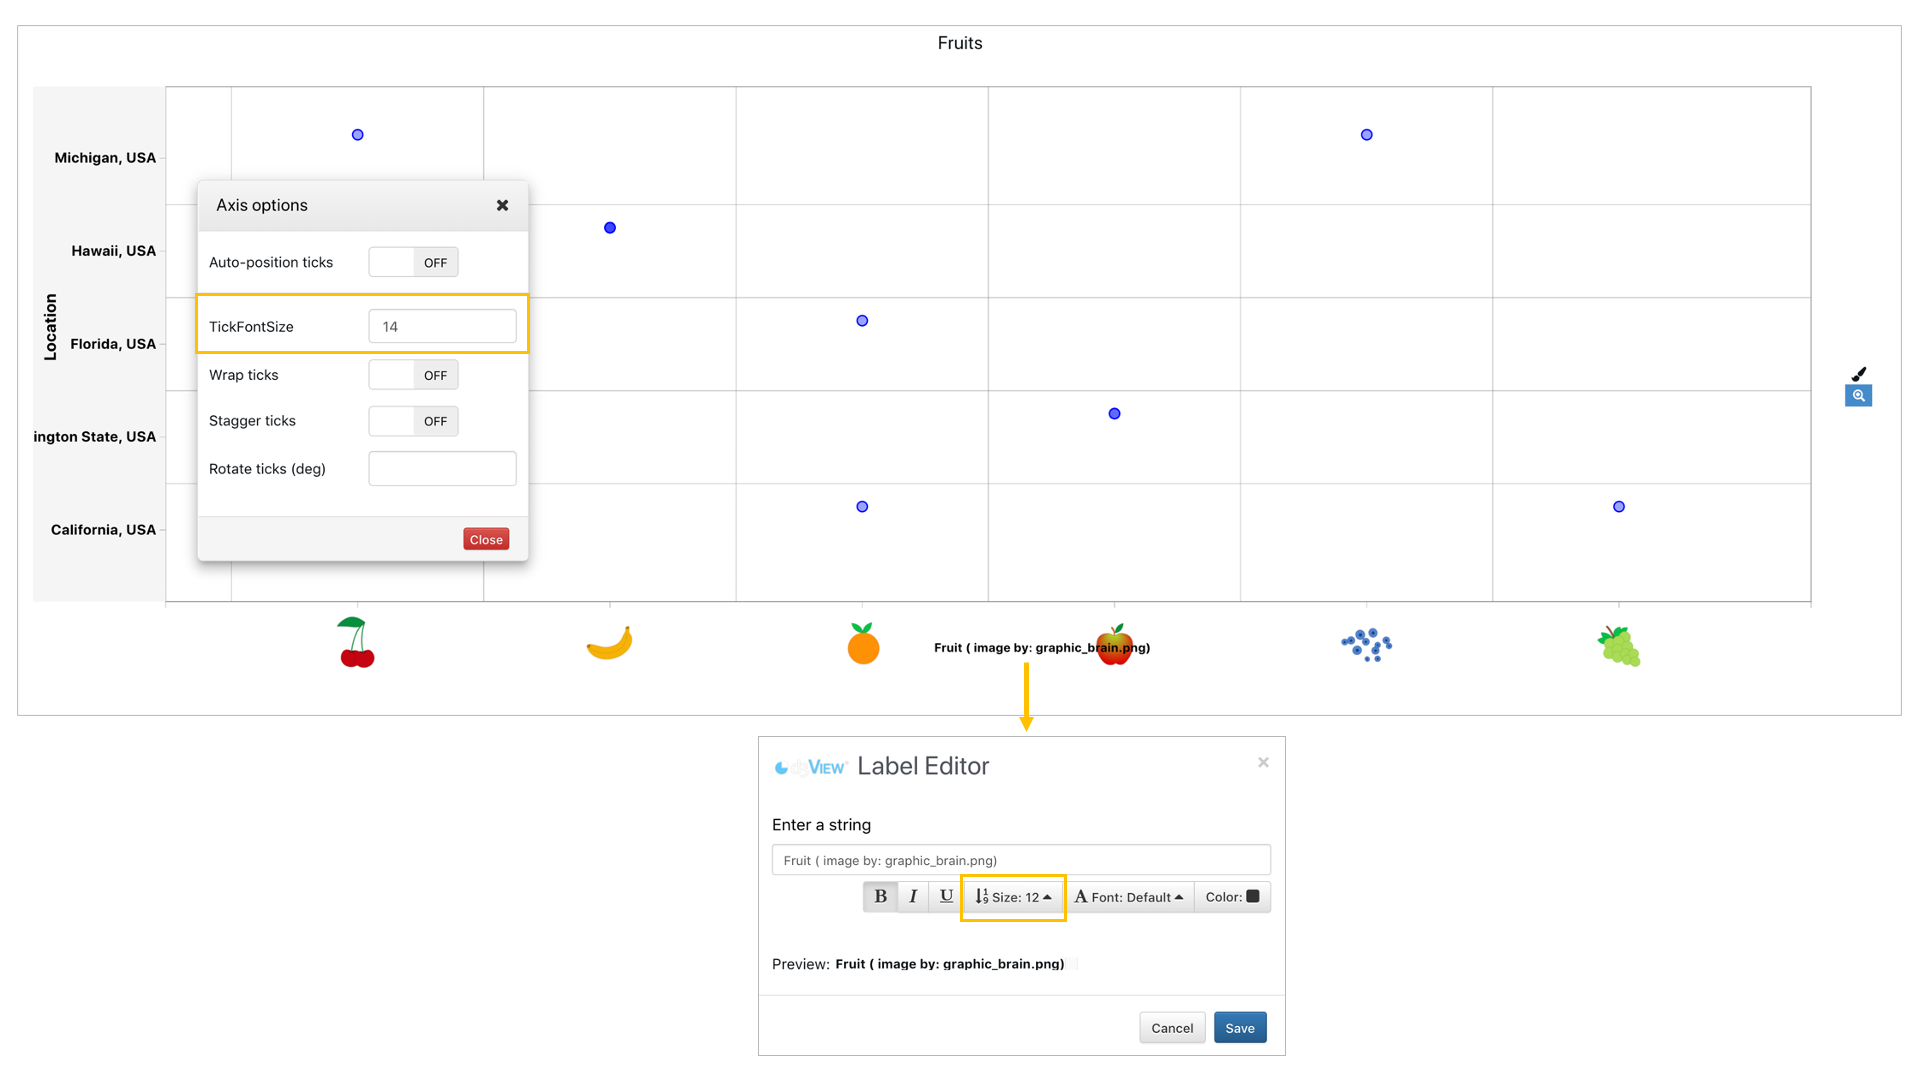
Format Chart Text
108. How do I add more color to my chart?
Most charts have the Color By option which color aspects of the chart based on data. We can also click on chart titles (main or axis) to edit and color them.
Tags: Colors, Color By, Format Titles
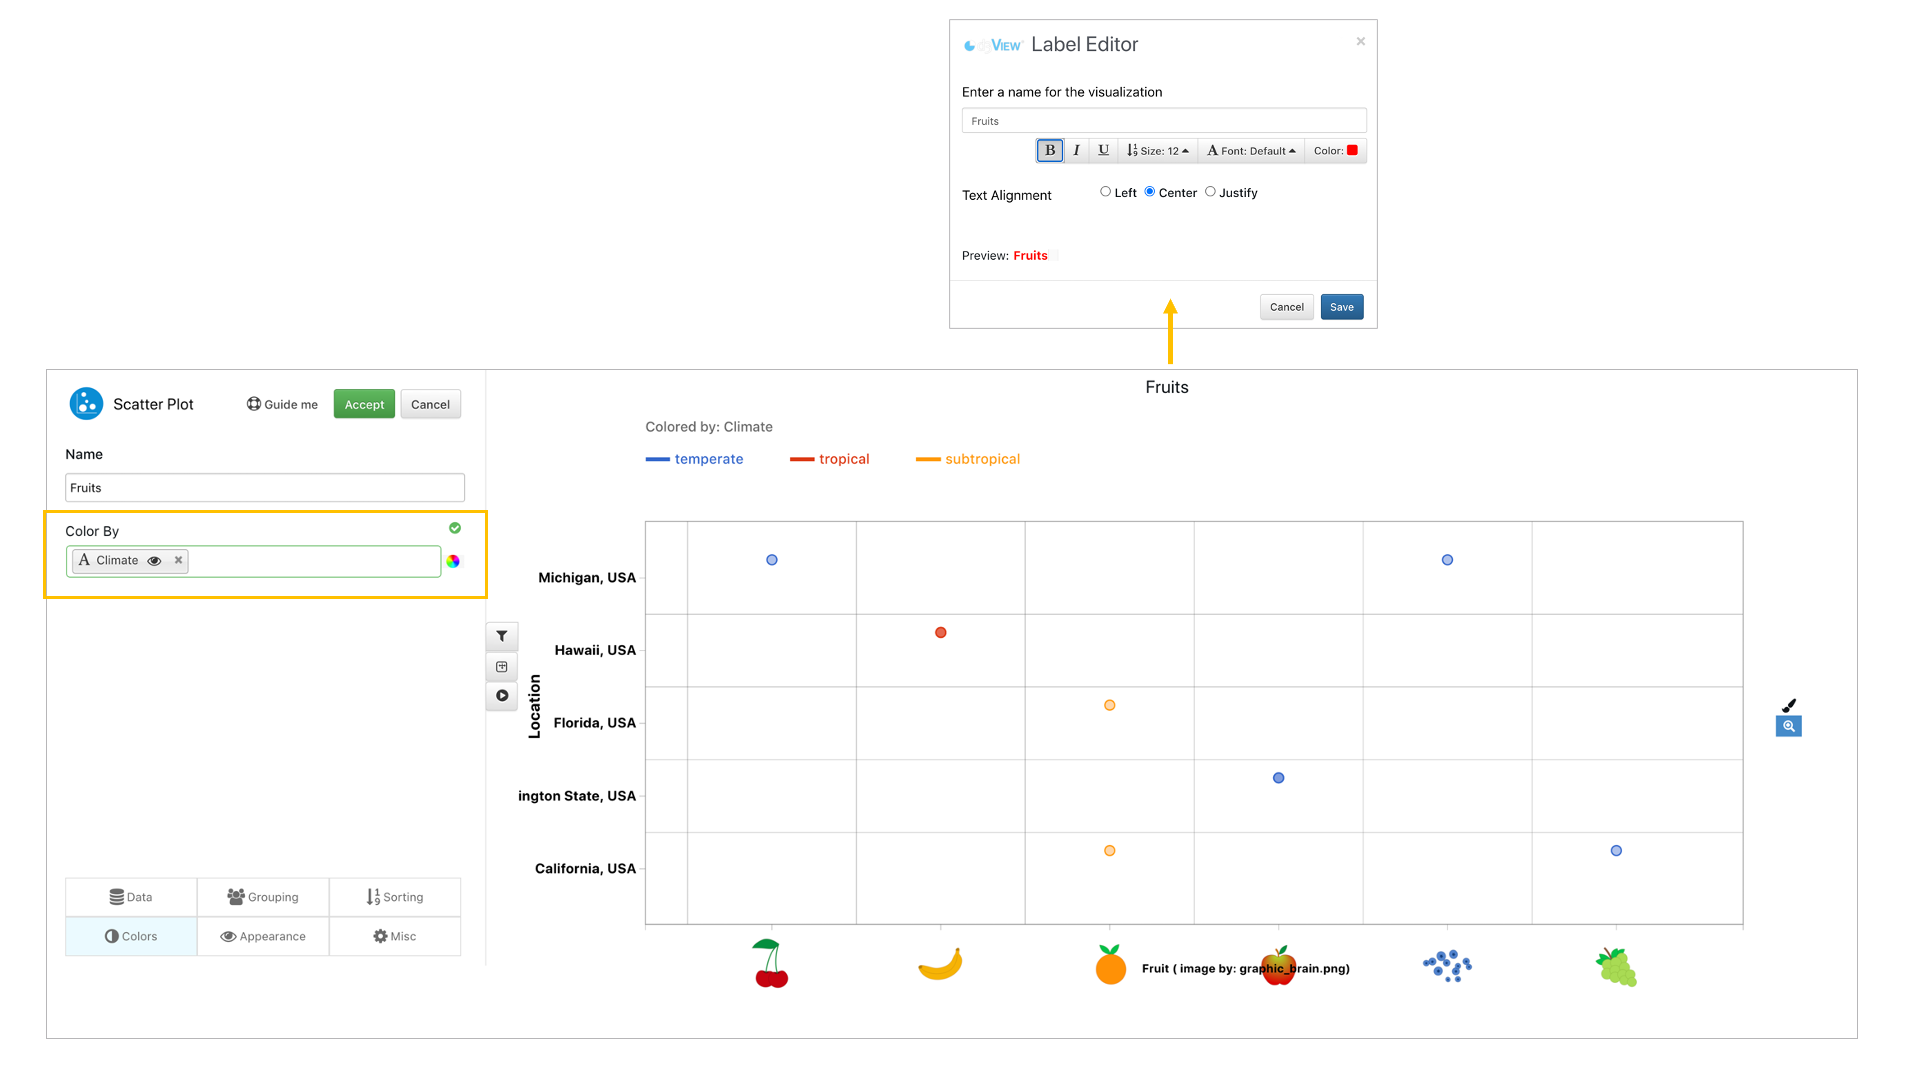
Adding Color
109. How can I used images instead of nodes for my bubble chart?
Bubble chart allows us to choose images for our nodes instead of the default circles. Find this option under the appearance tab and choose an image from available media or upload from your local machine.
Tags: Images, Media, Bubble Chart
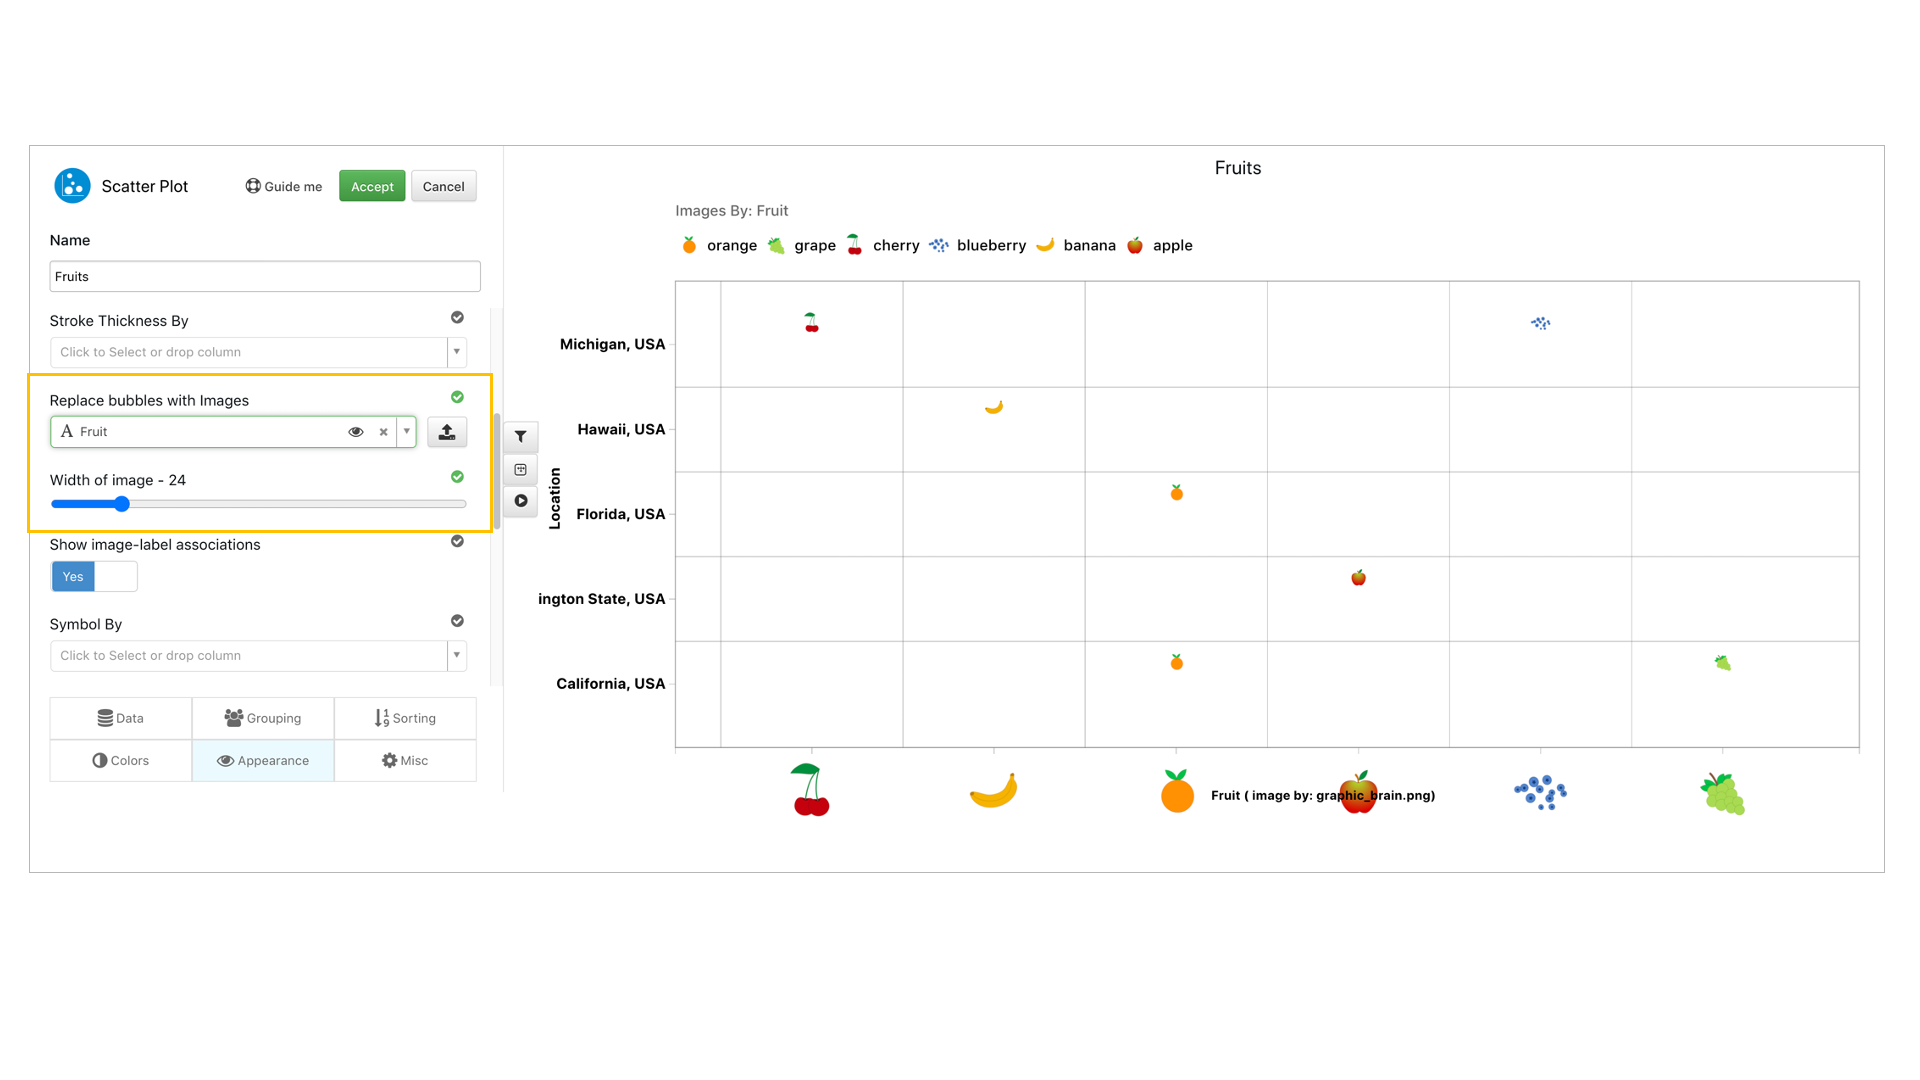
Images as Nodes
Version control
110. How do I save dataset to dashboard?
After opening a dataset, adding new page and creating a visualization, click on close dataset available at the top right corner of the Simlytiks page. This opens a modal where we can provide a name for the dataset and click on Save to save the dataset as a dashboard record.
Tags: save dataset, save as dashboard
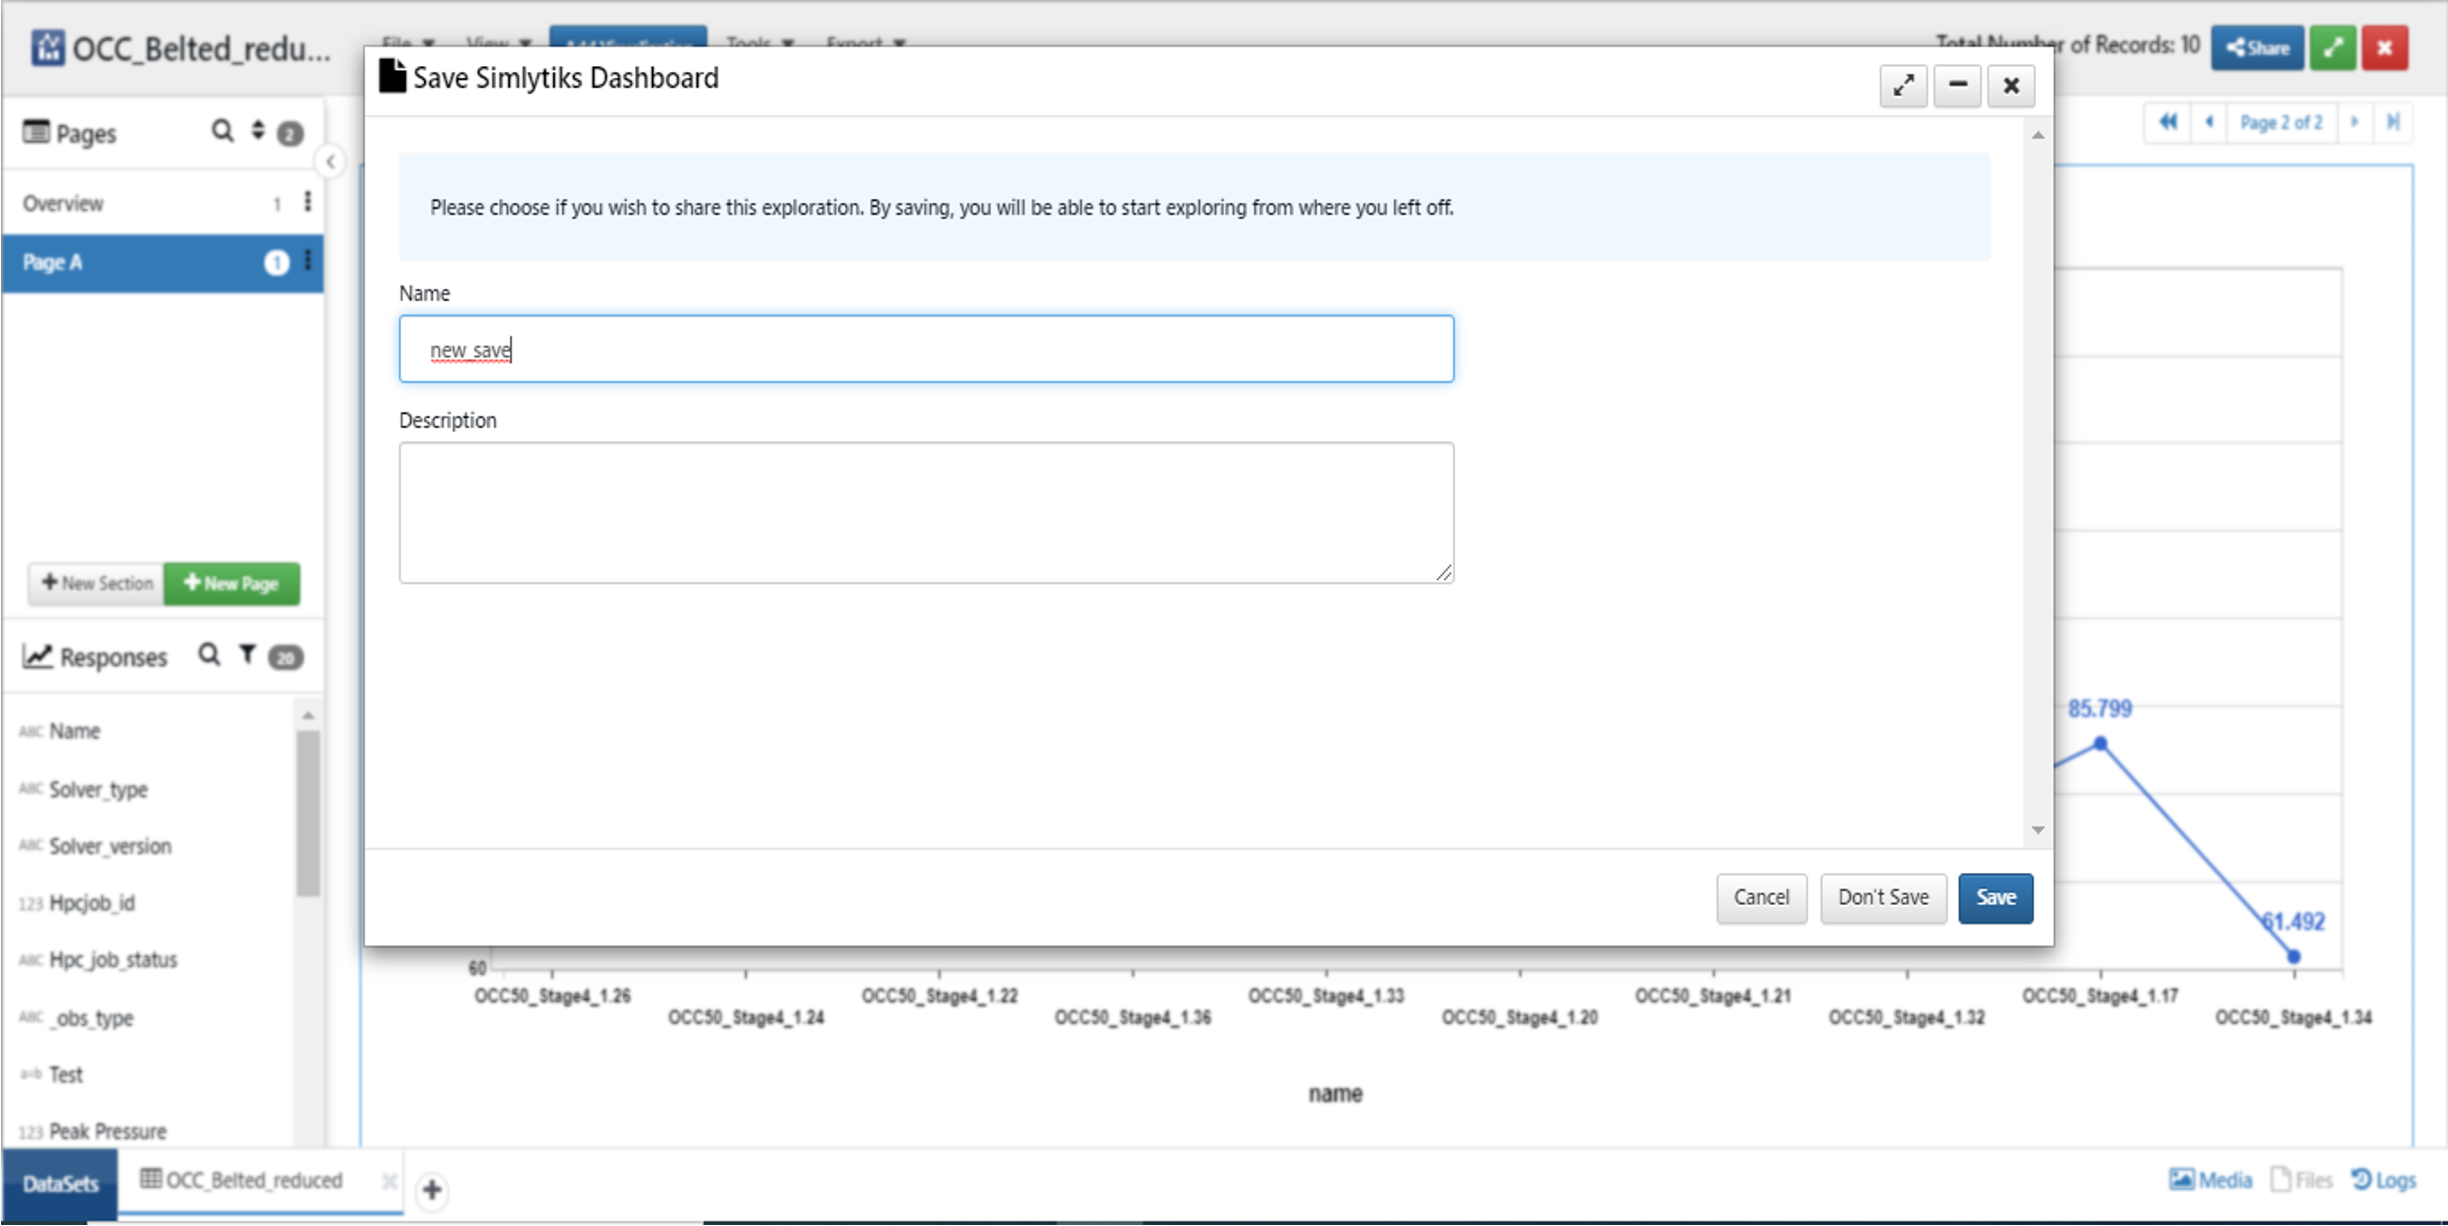
save dataset
111. How can I view version for the saved dataset?
We can view version for the saved dataset by clicking on clock icon for the dataset available in ‘Num_versions’ column to view versions for the dataset. As and when we update the changes in the dataset, we can view new versions here in version history modal.
Tags: versions, version history
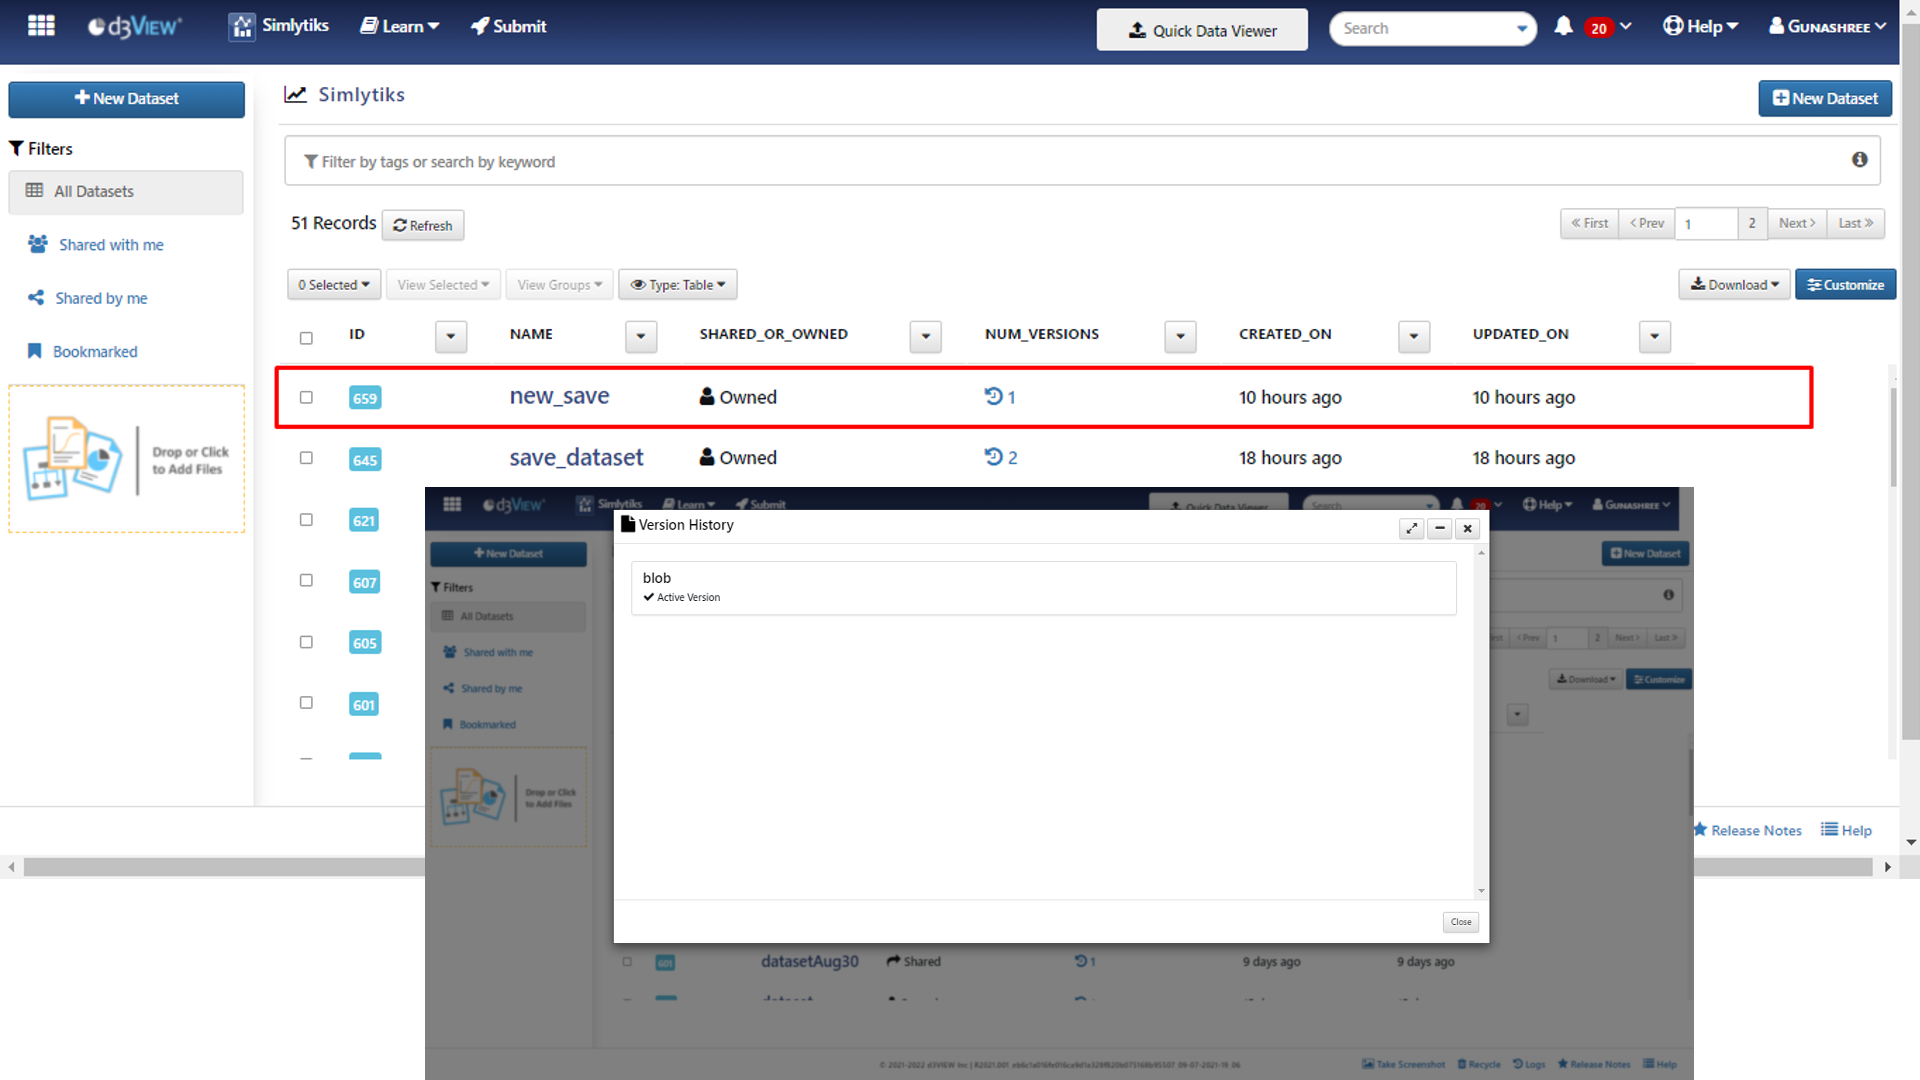
version history
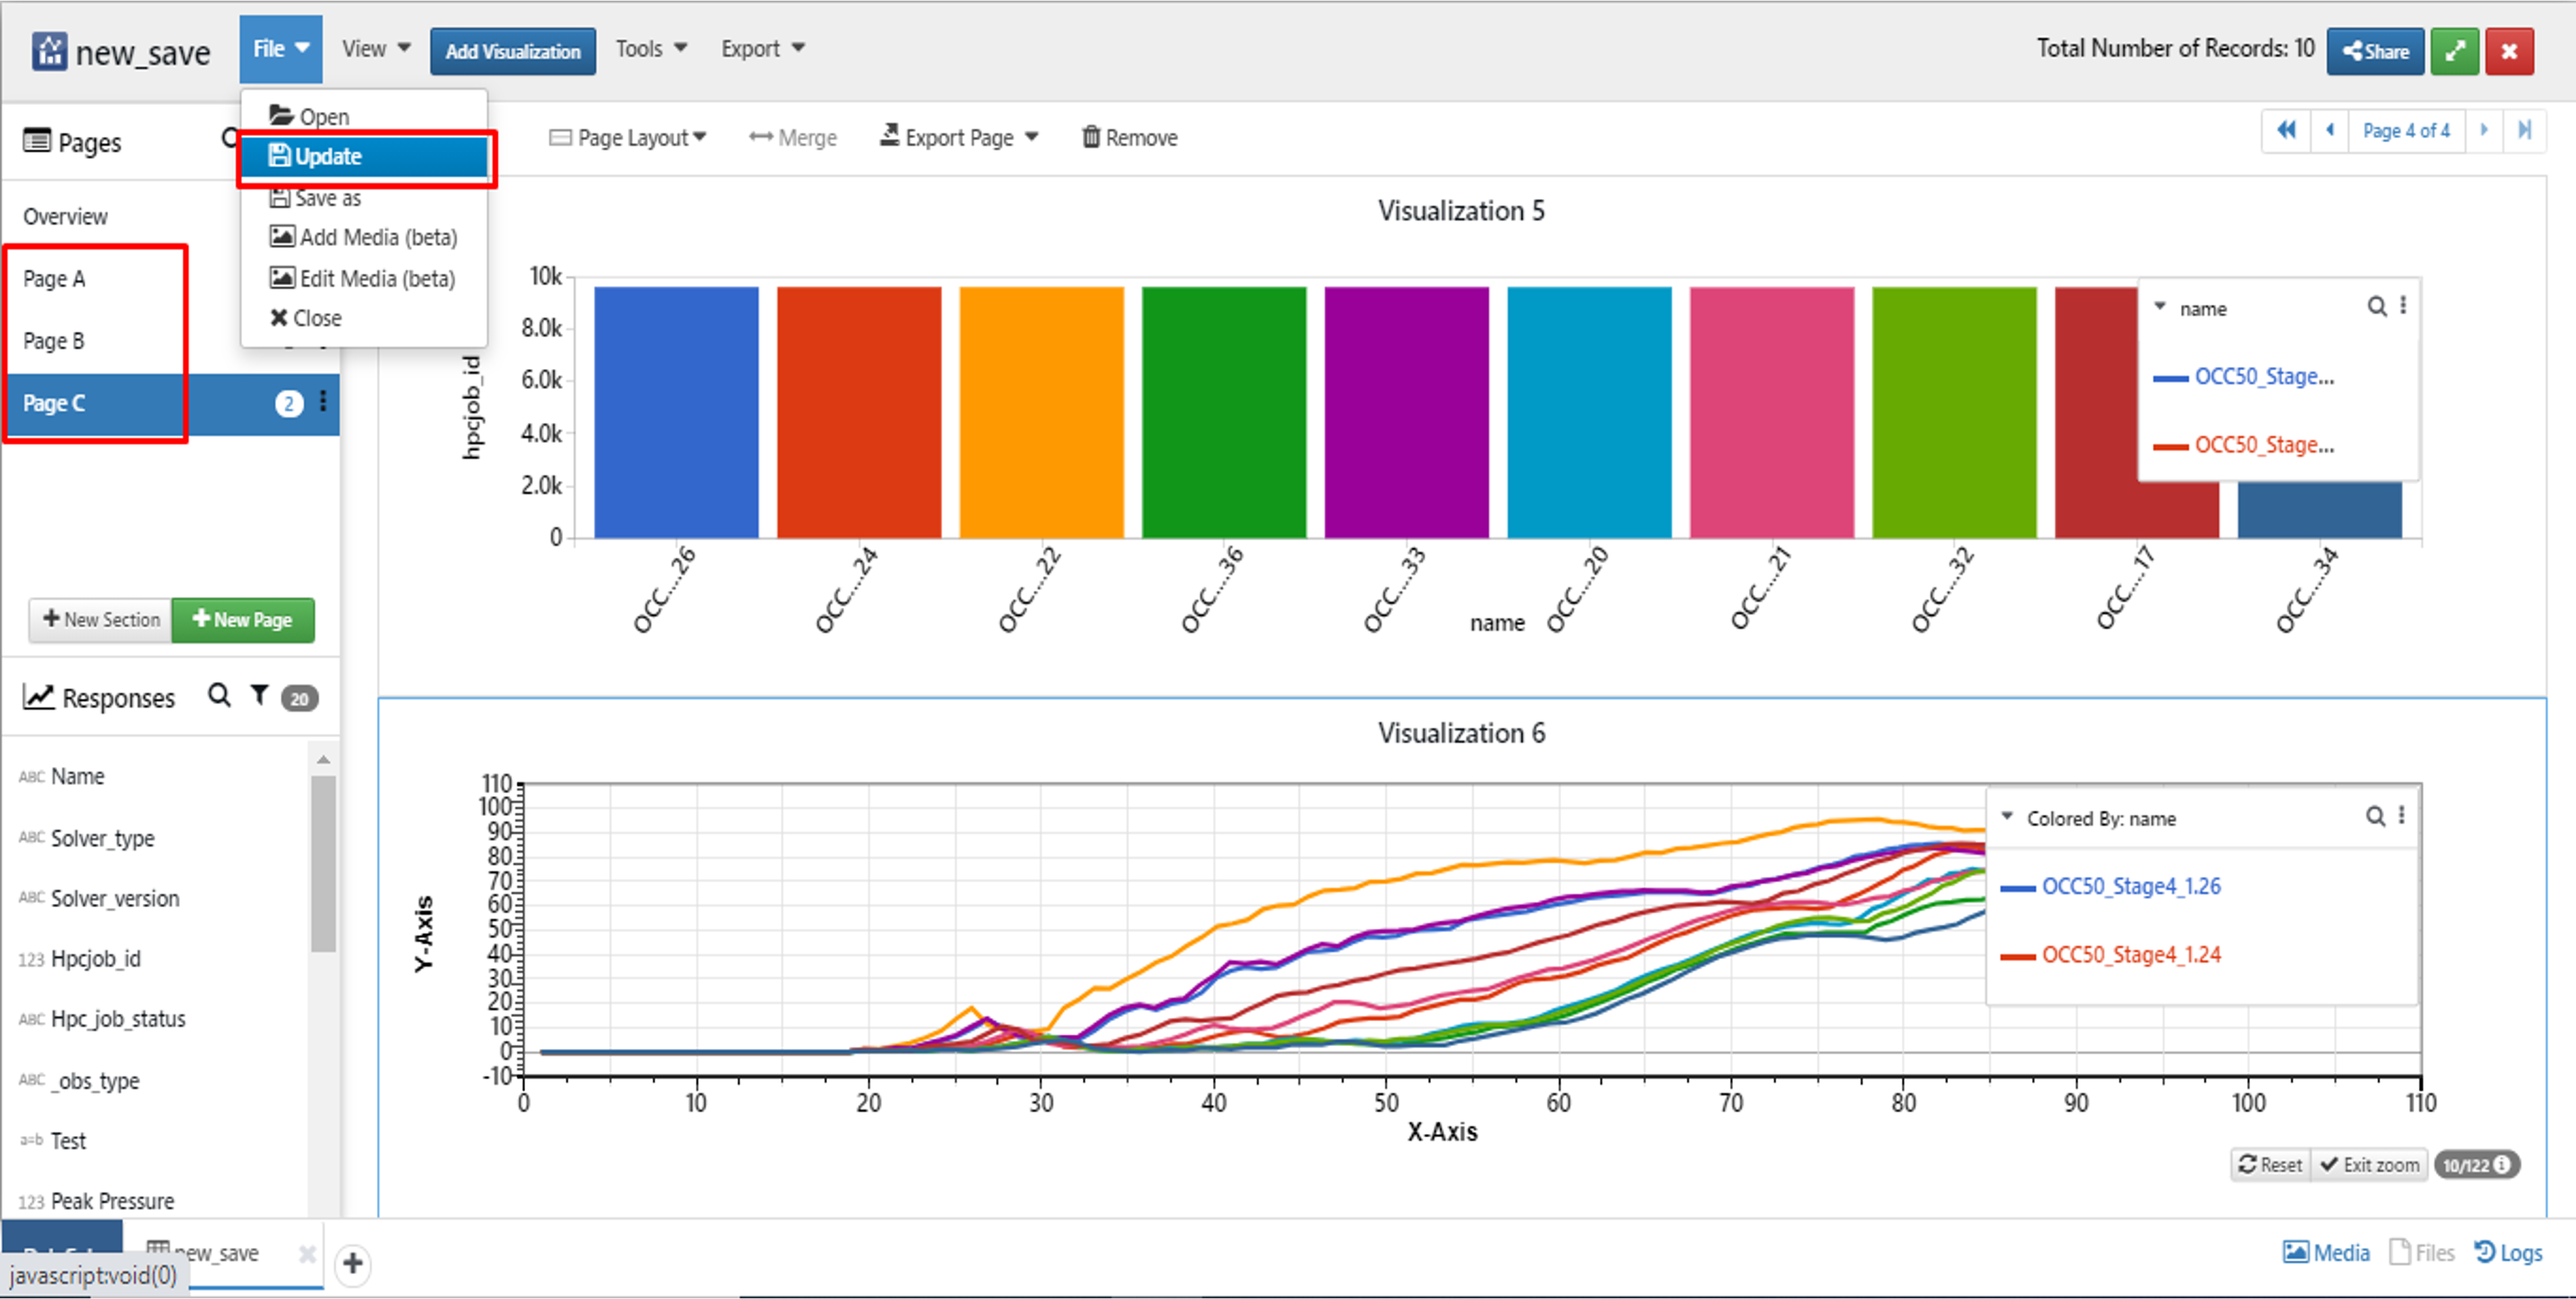
112. How do I update saved dashboard record?
To update the dashboard record, click on the saved record and make prominent changes to the dataset which makes easier to differentiate between versions. We can add new page and different visualizations in it and update dataset by clicking on ‘update’ available in ‘file’ in the top bar and close the dataset and we can view new/updated version for the dataset in version history. We can update versions as many we want by making changes to the dataset
Tags: update record, update version
copy visualization
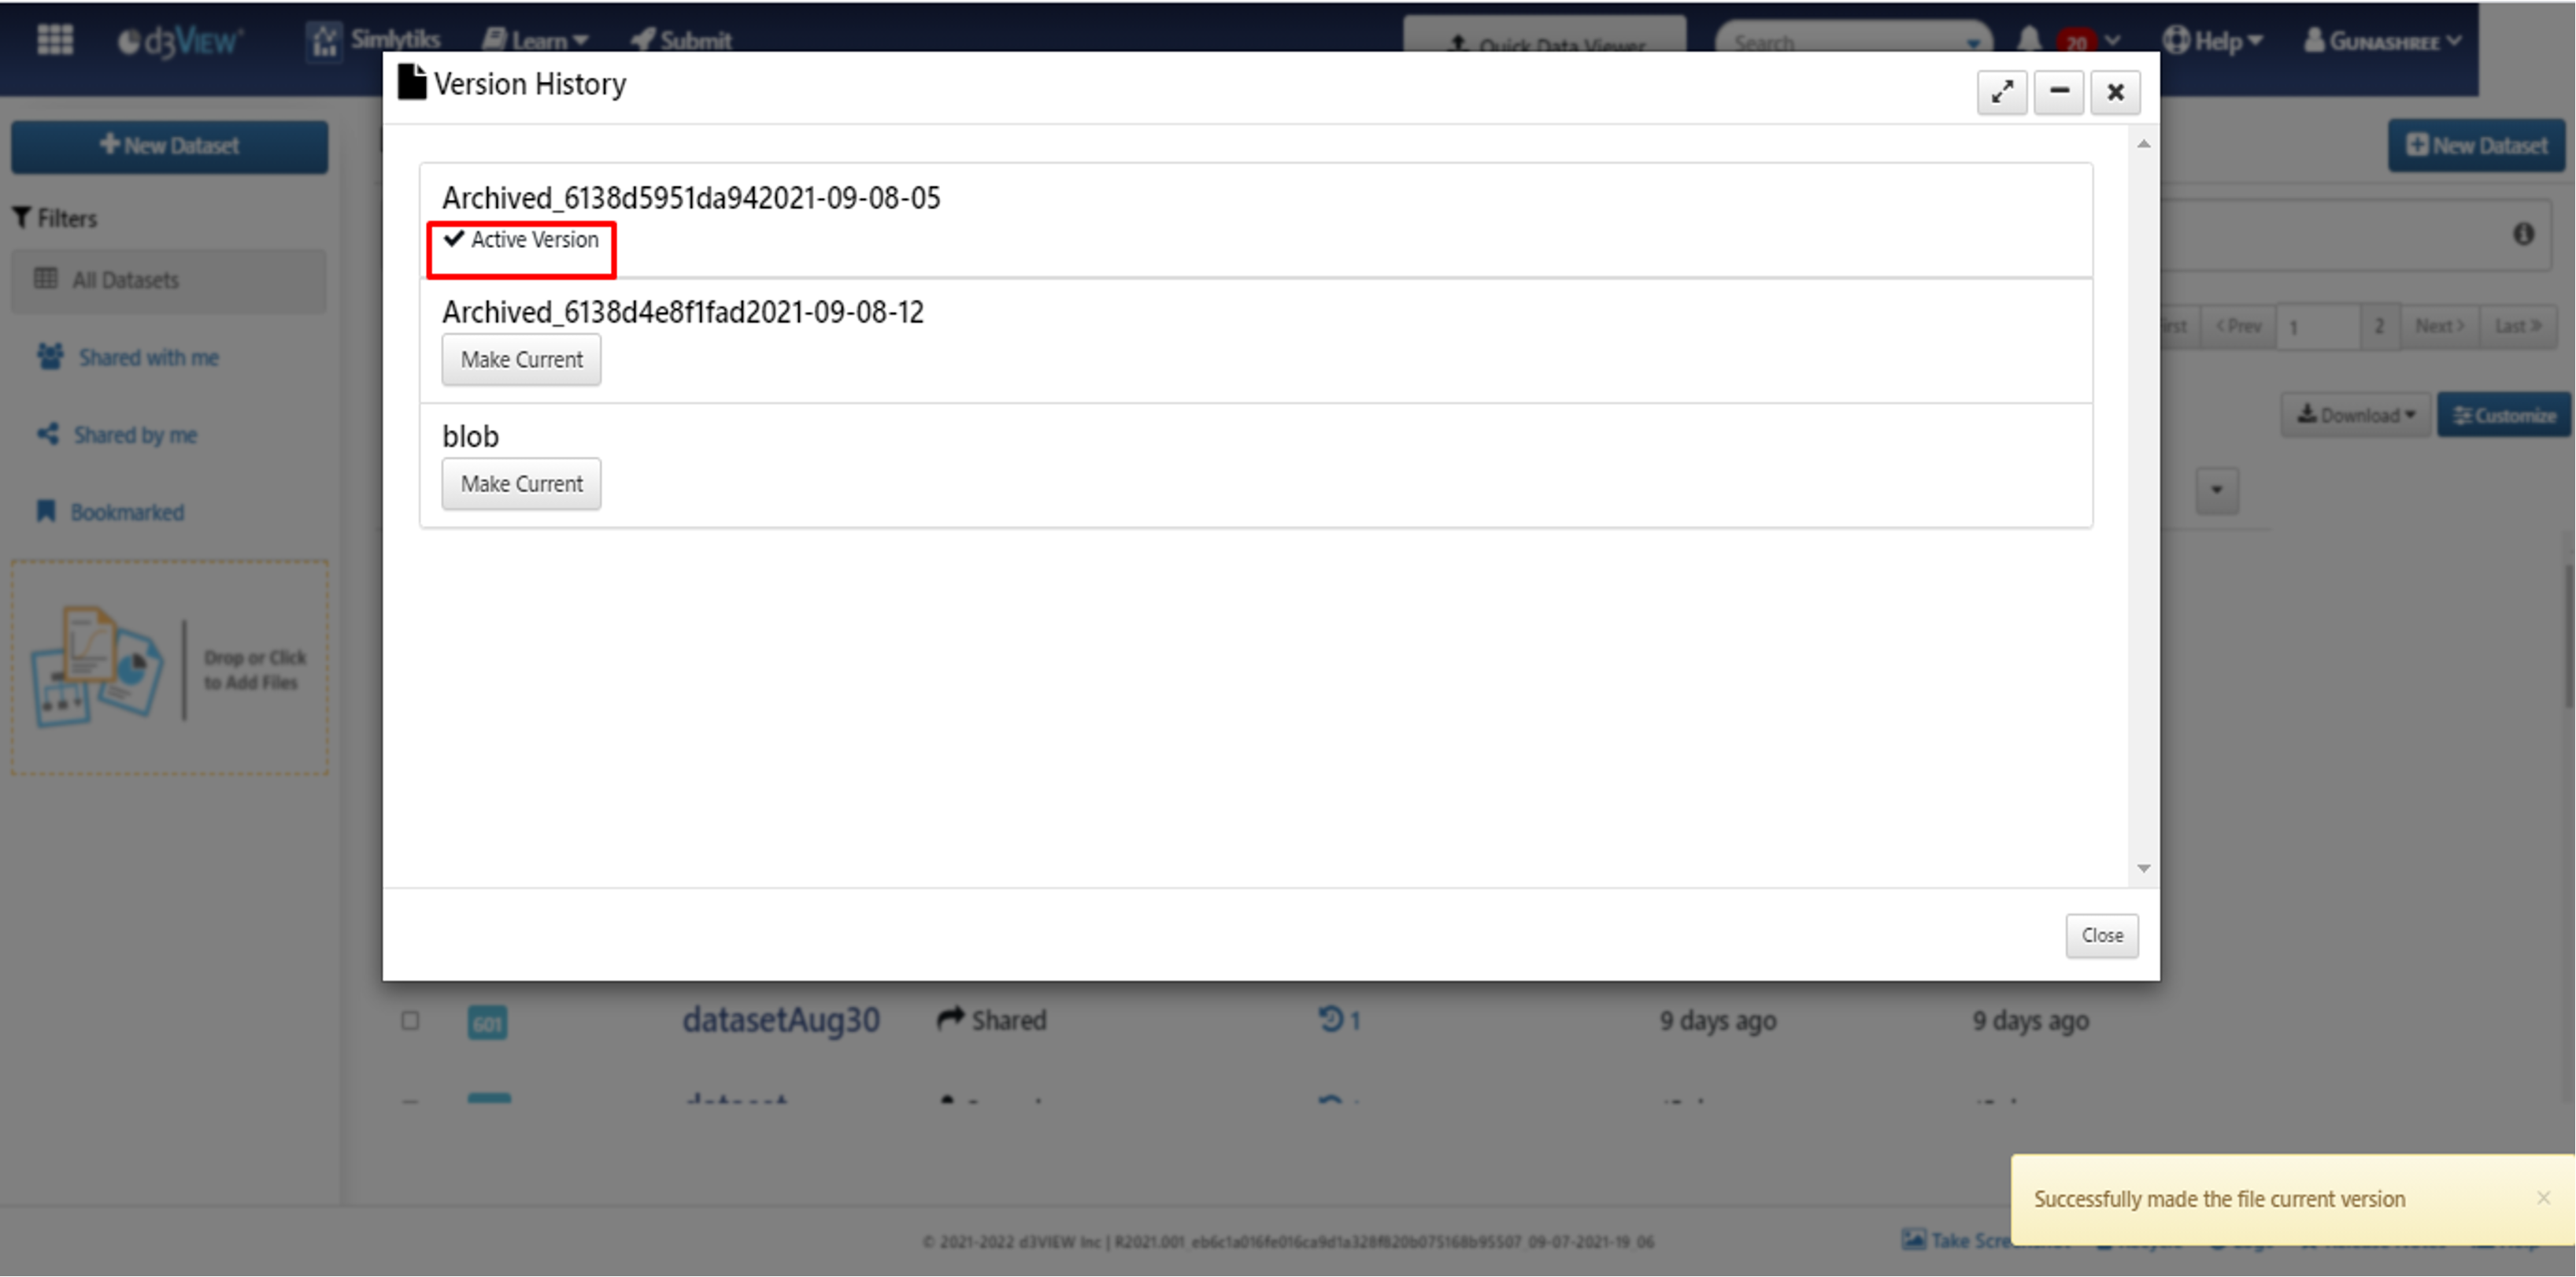
113. How do I activate a specific version?
After updating the dataset, we can activate a particular version to view dataset until that update. Click on ‘Num_version’(clock icon) for the dataset and make any of the available versions as active by clicking on ‘Make current’ button which activates the version and close the modal and open the dataset to view dataset till this update. We won’t see changes which are made after this update.
Tags: activate version, make current
Activate version
Support
If you run into any issues or still need more help, please reach out by sending the details to support@d3VIEW.com.