22.  Sharing
In this section, we’ll review the options available for downloading datasets, pages and charts, for sharing dashboards, and for adding security to charts.
Sharing the Fruits Dataset
Downloading
There are 3 main ways to download aspects of our Simlytiks Exploration.
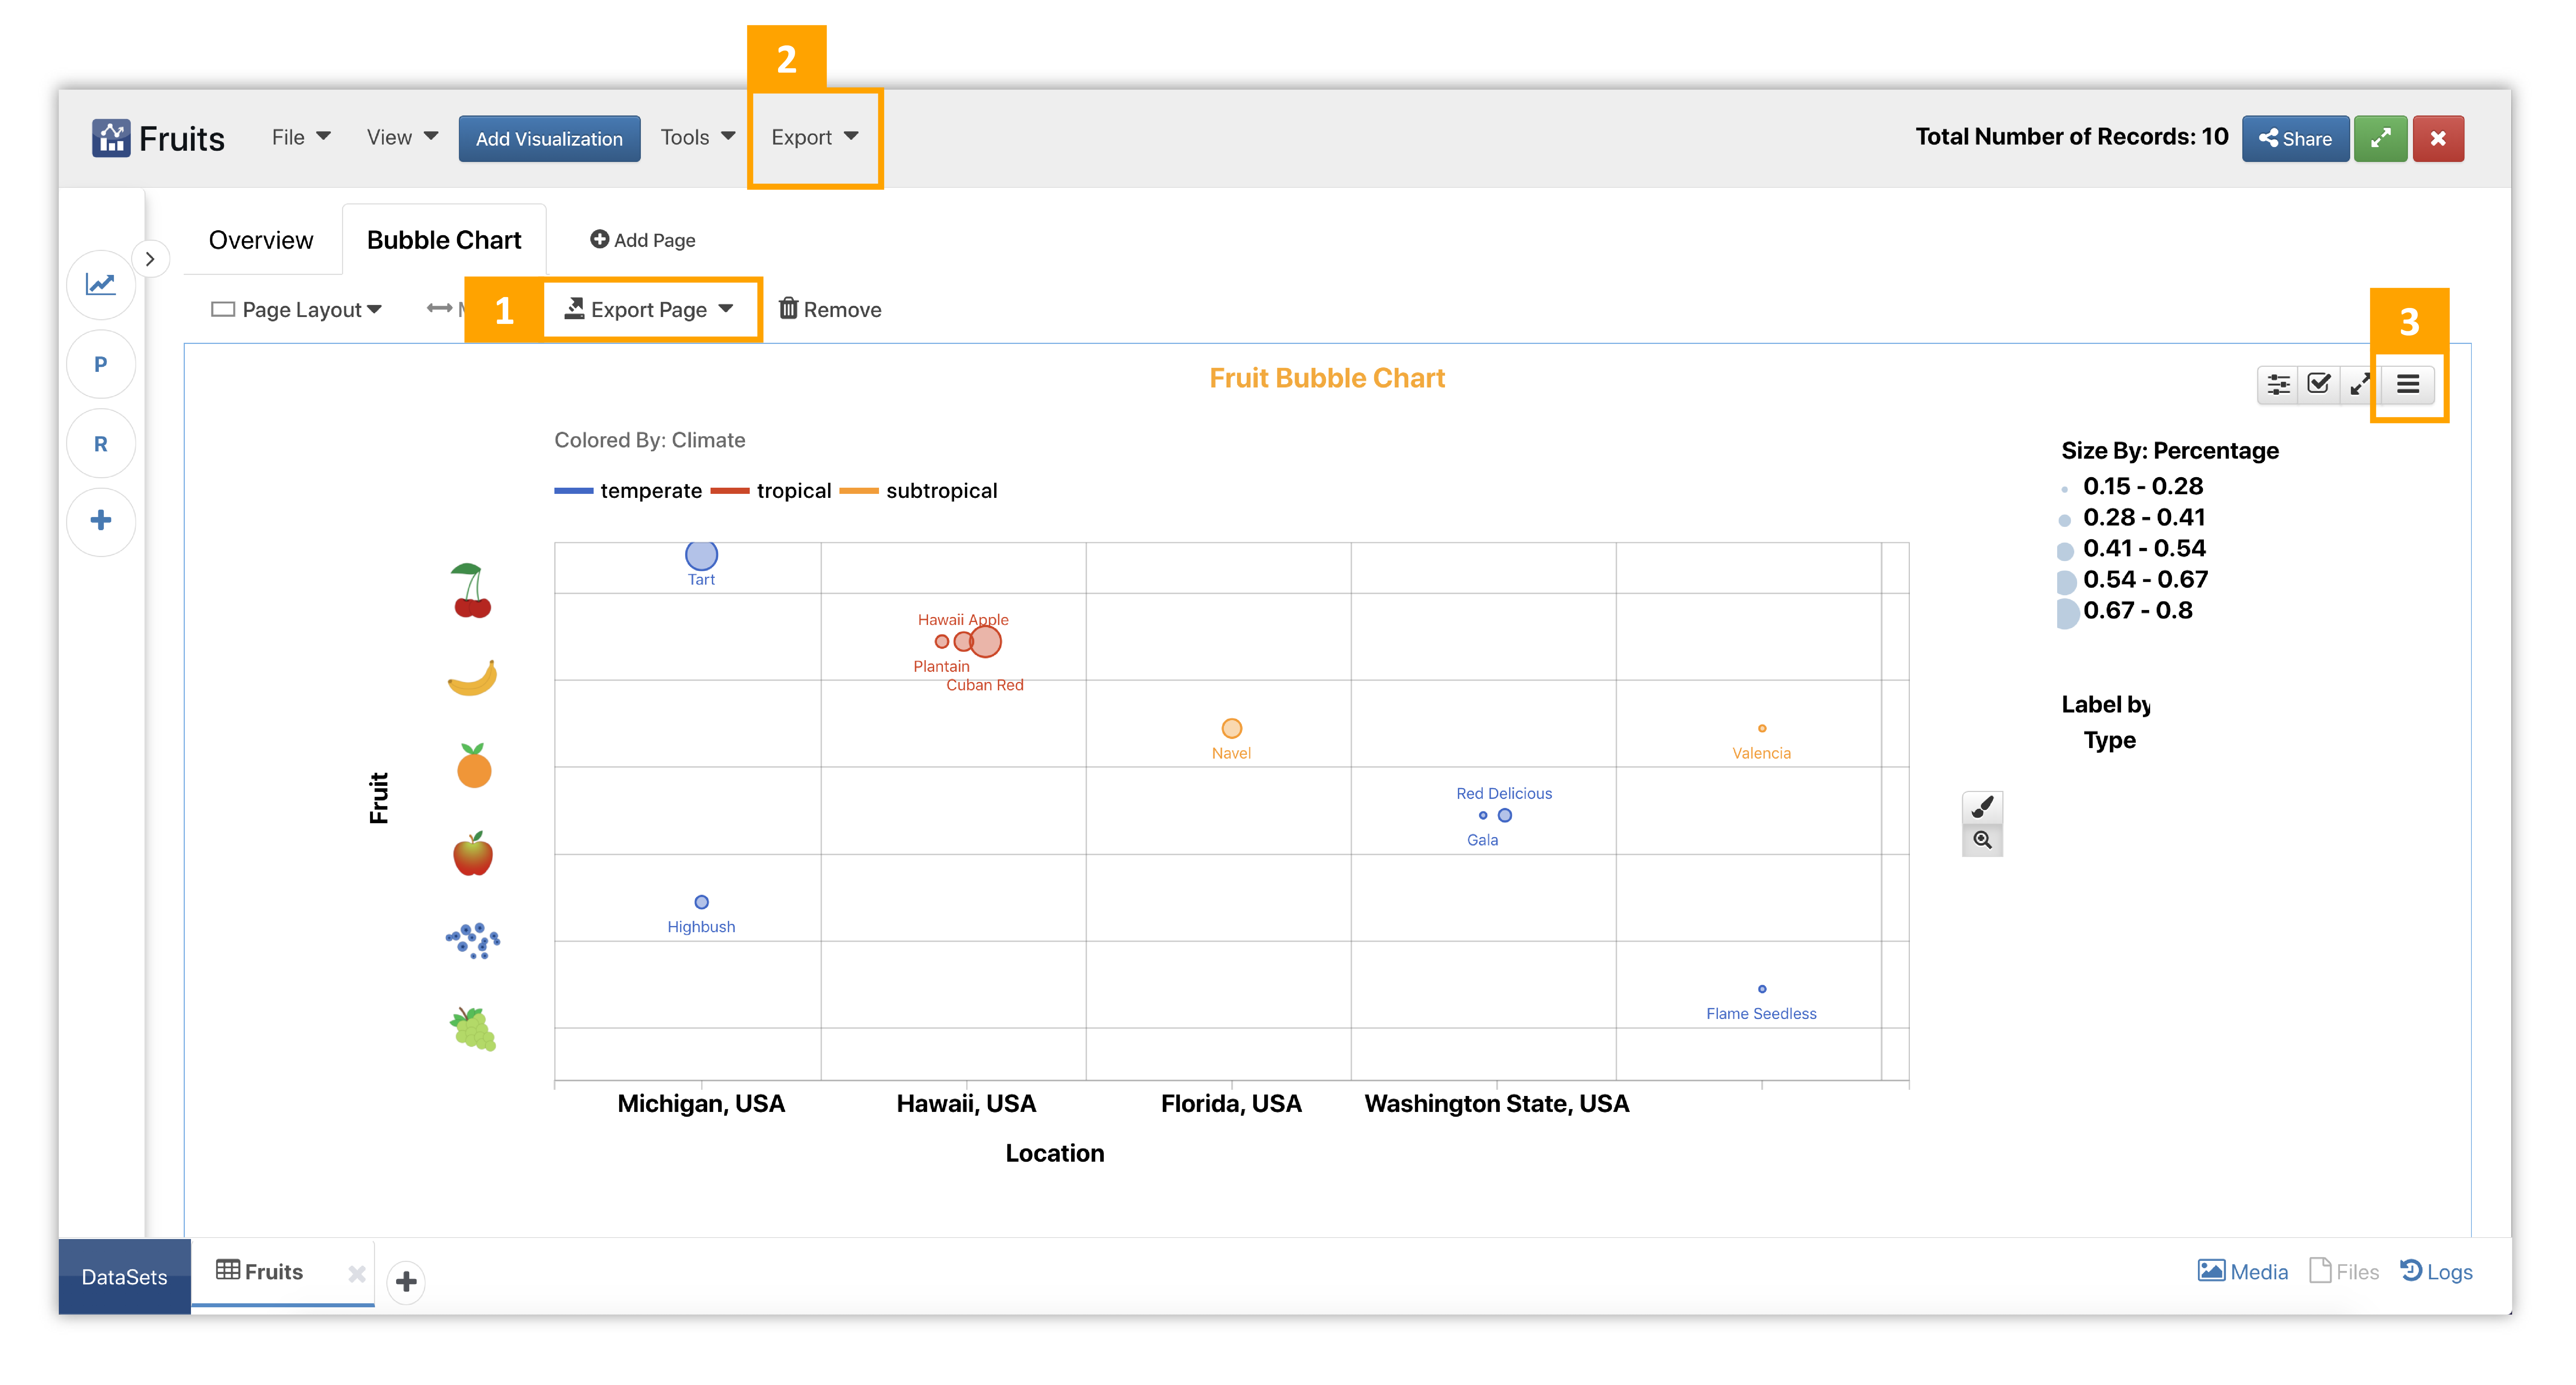
Figure 1: Sharing Overview
- Page Exporting
- Dataset Exporting
- Chart Export & Sharing
Downloading Datasets
Simlytiks promotes faster and smoother collaborative decision-making in another way through exporting and sharing datasets. Click the ‘Export’ button on the right side of the top blue bar to view a drop down menu of all the options for exporting the dataset. Most options will have an additional prompt window for choosing which parts of the dataset to download.
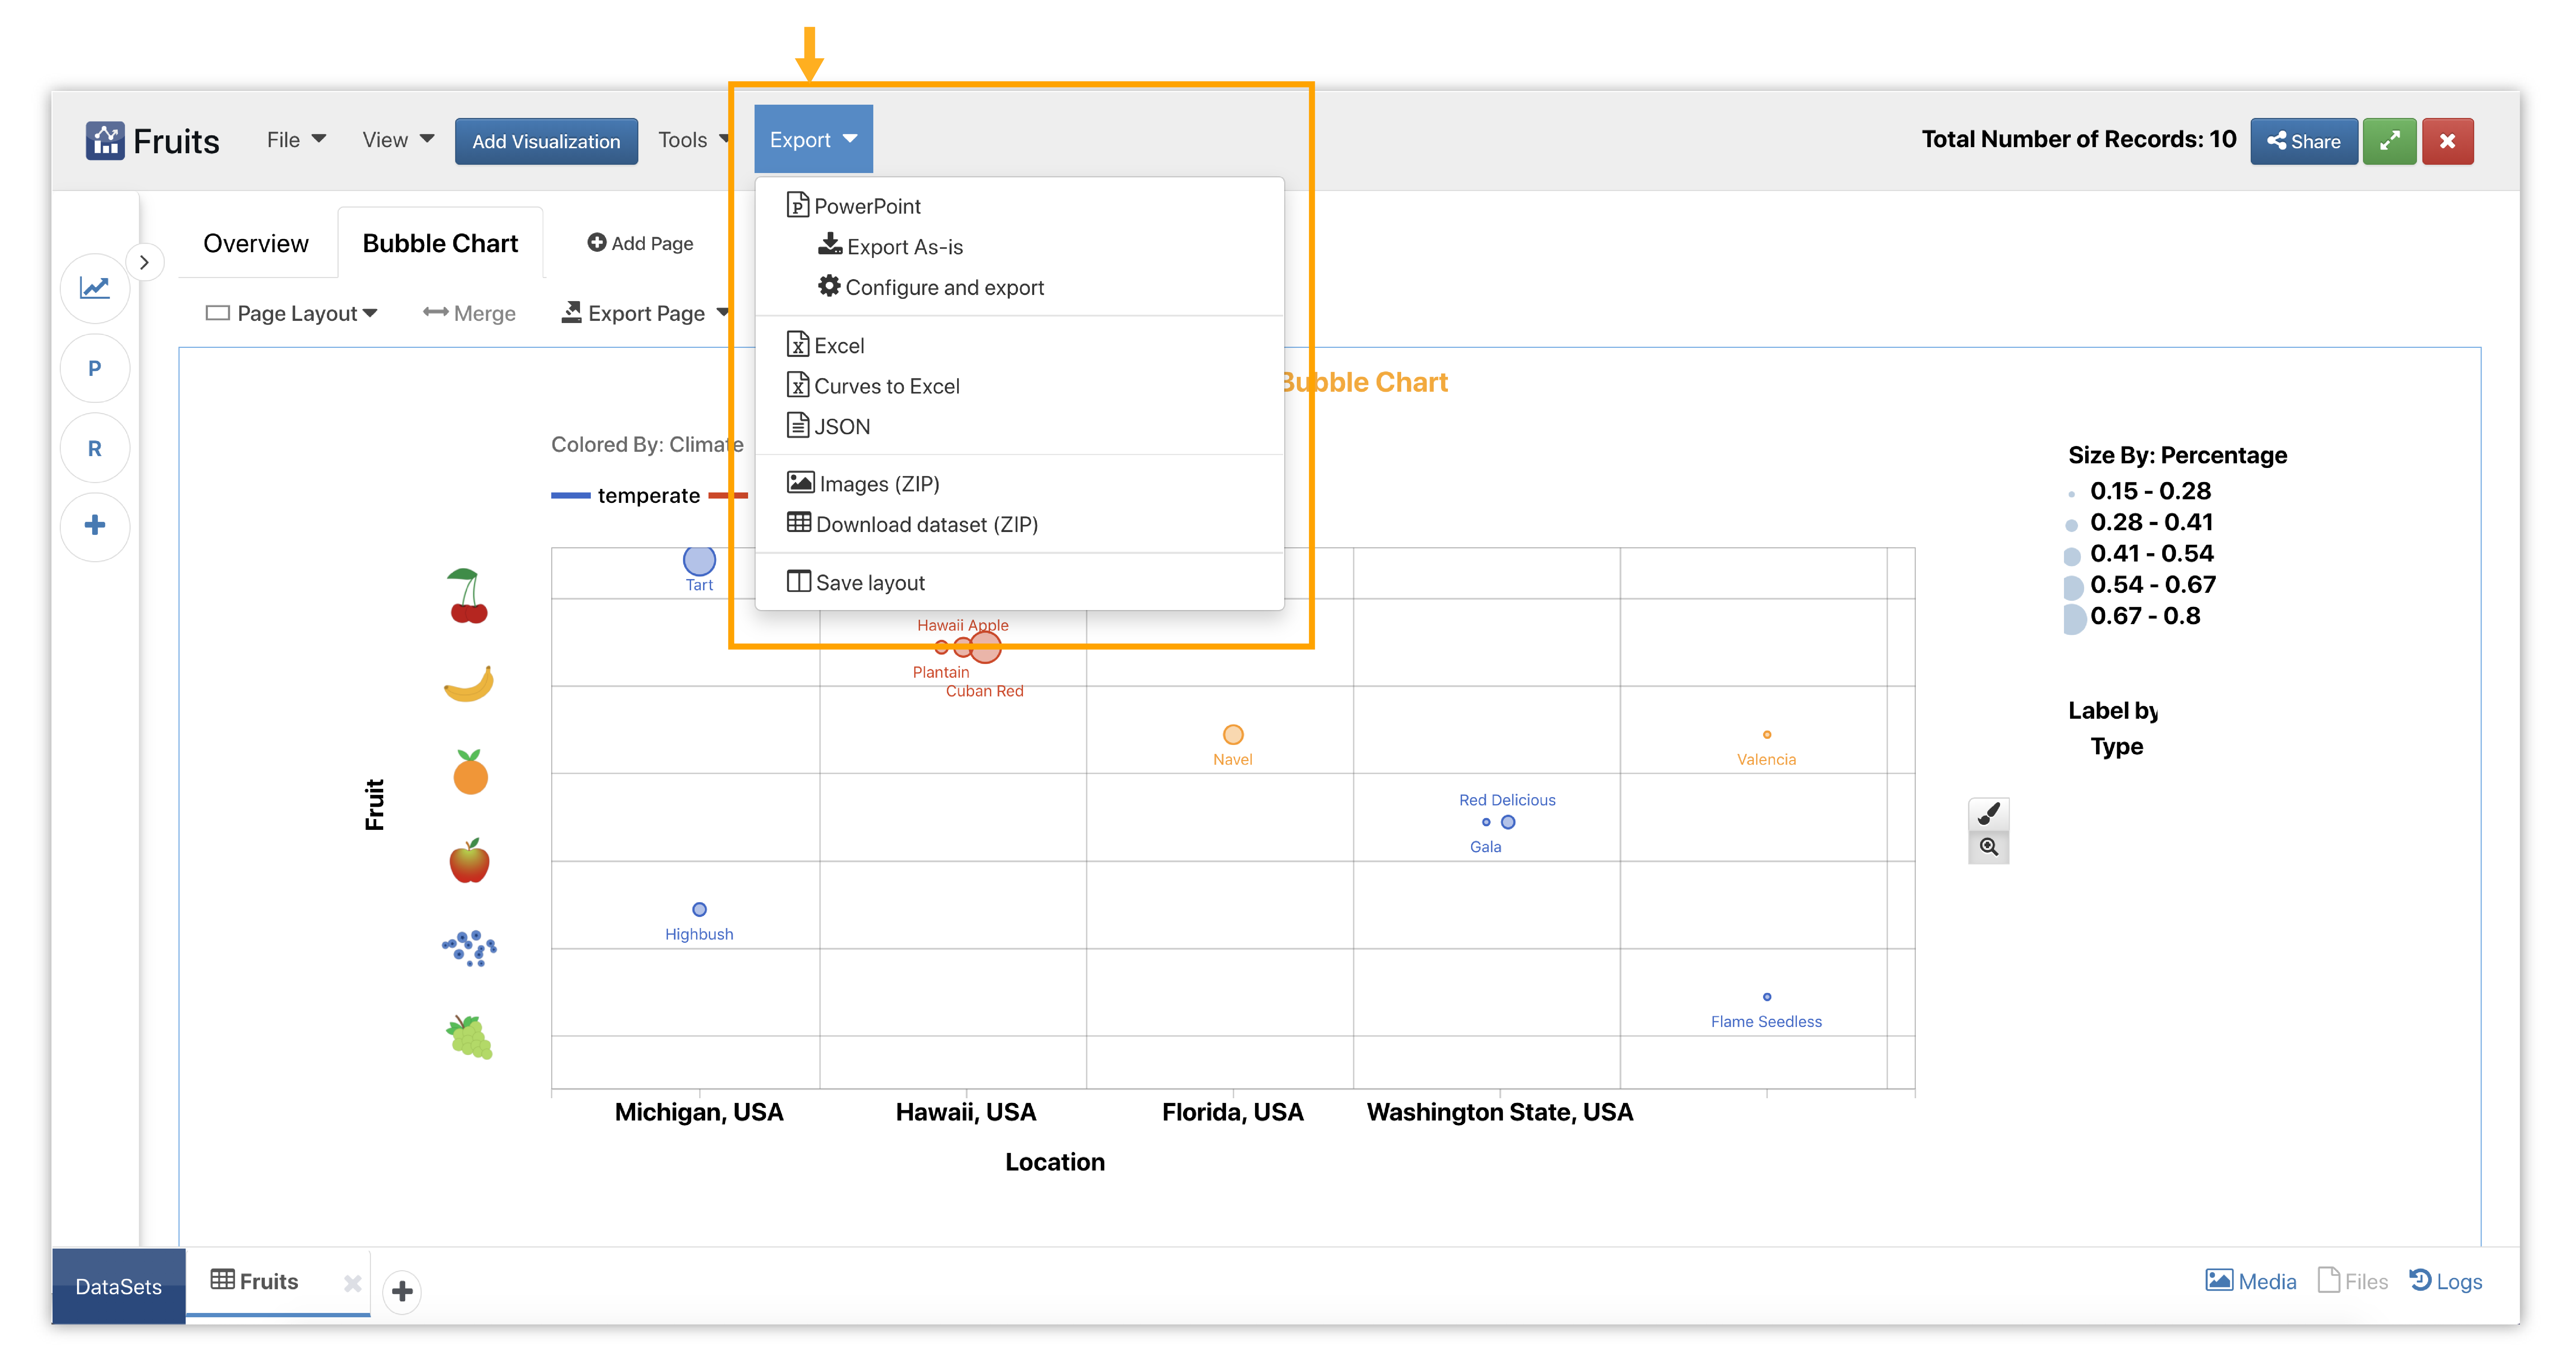
Figure 2: Dataset Export Menu
For exporting datasets as a file, choose the desired option in the ‘Export’ drop-down menu on the top bar commands. Next, select which data to include in the export and finish. Watch the following video to see an example of how to export a PPT without initiating the builder:
Watch the following video to see an example of how to export a dataset as an excel:
New as of September 2022, we can now download a dataset as an HTML.
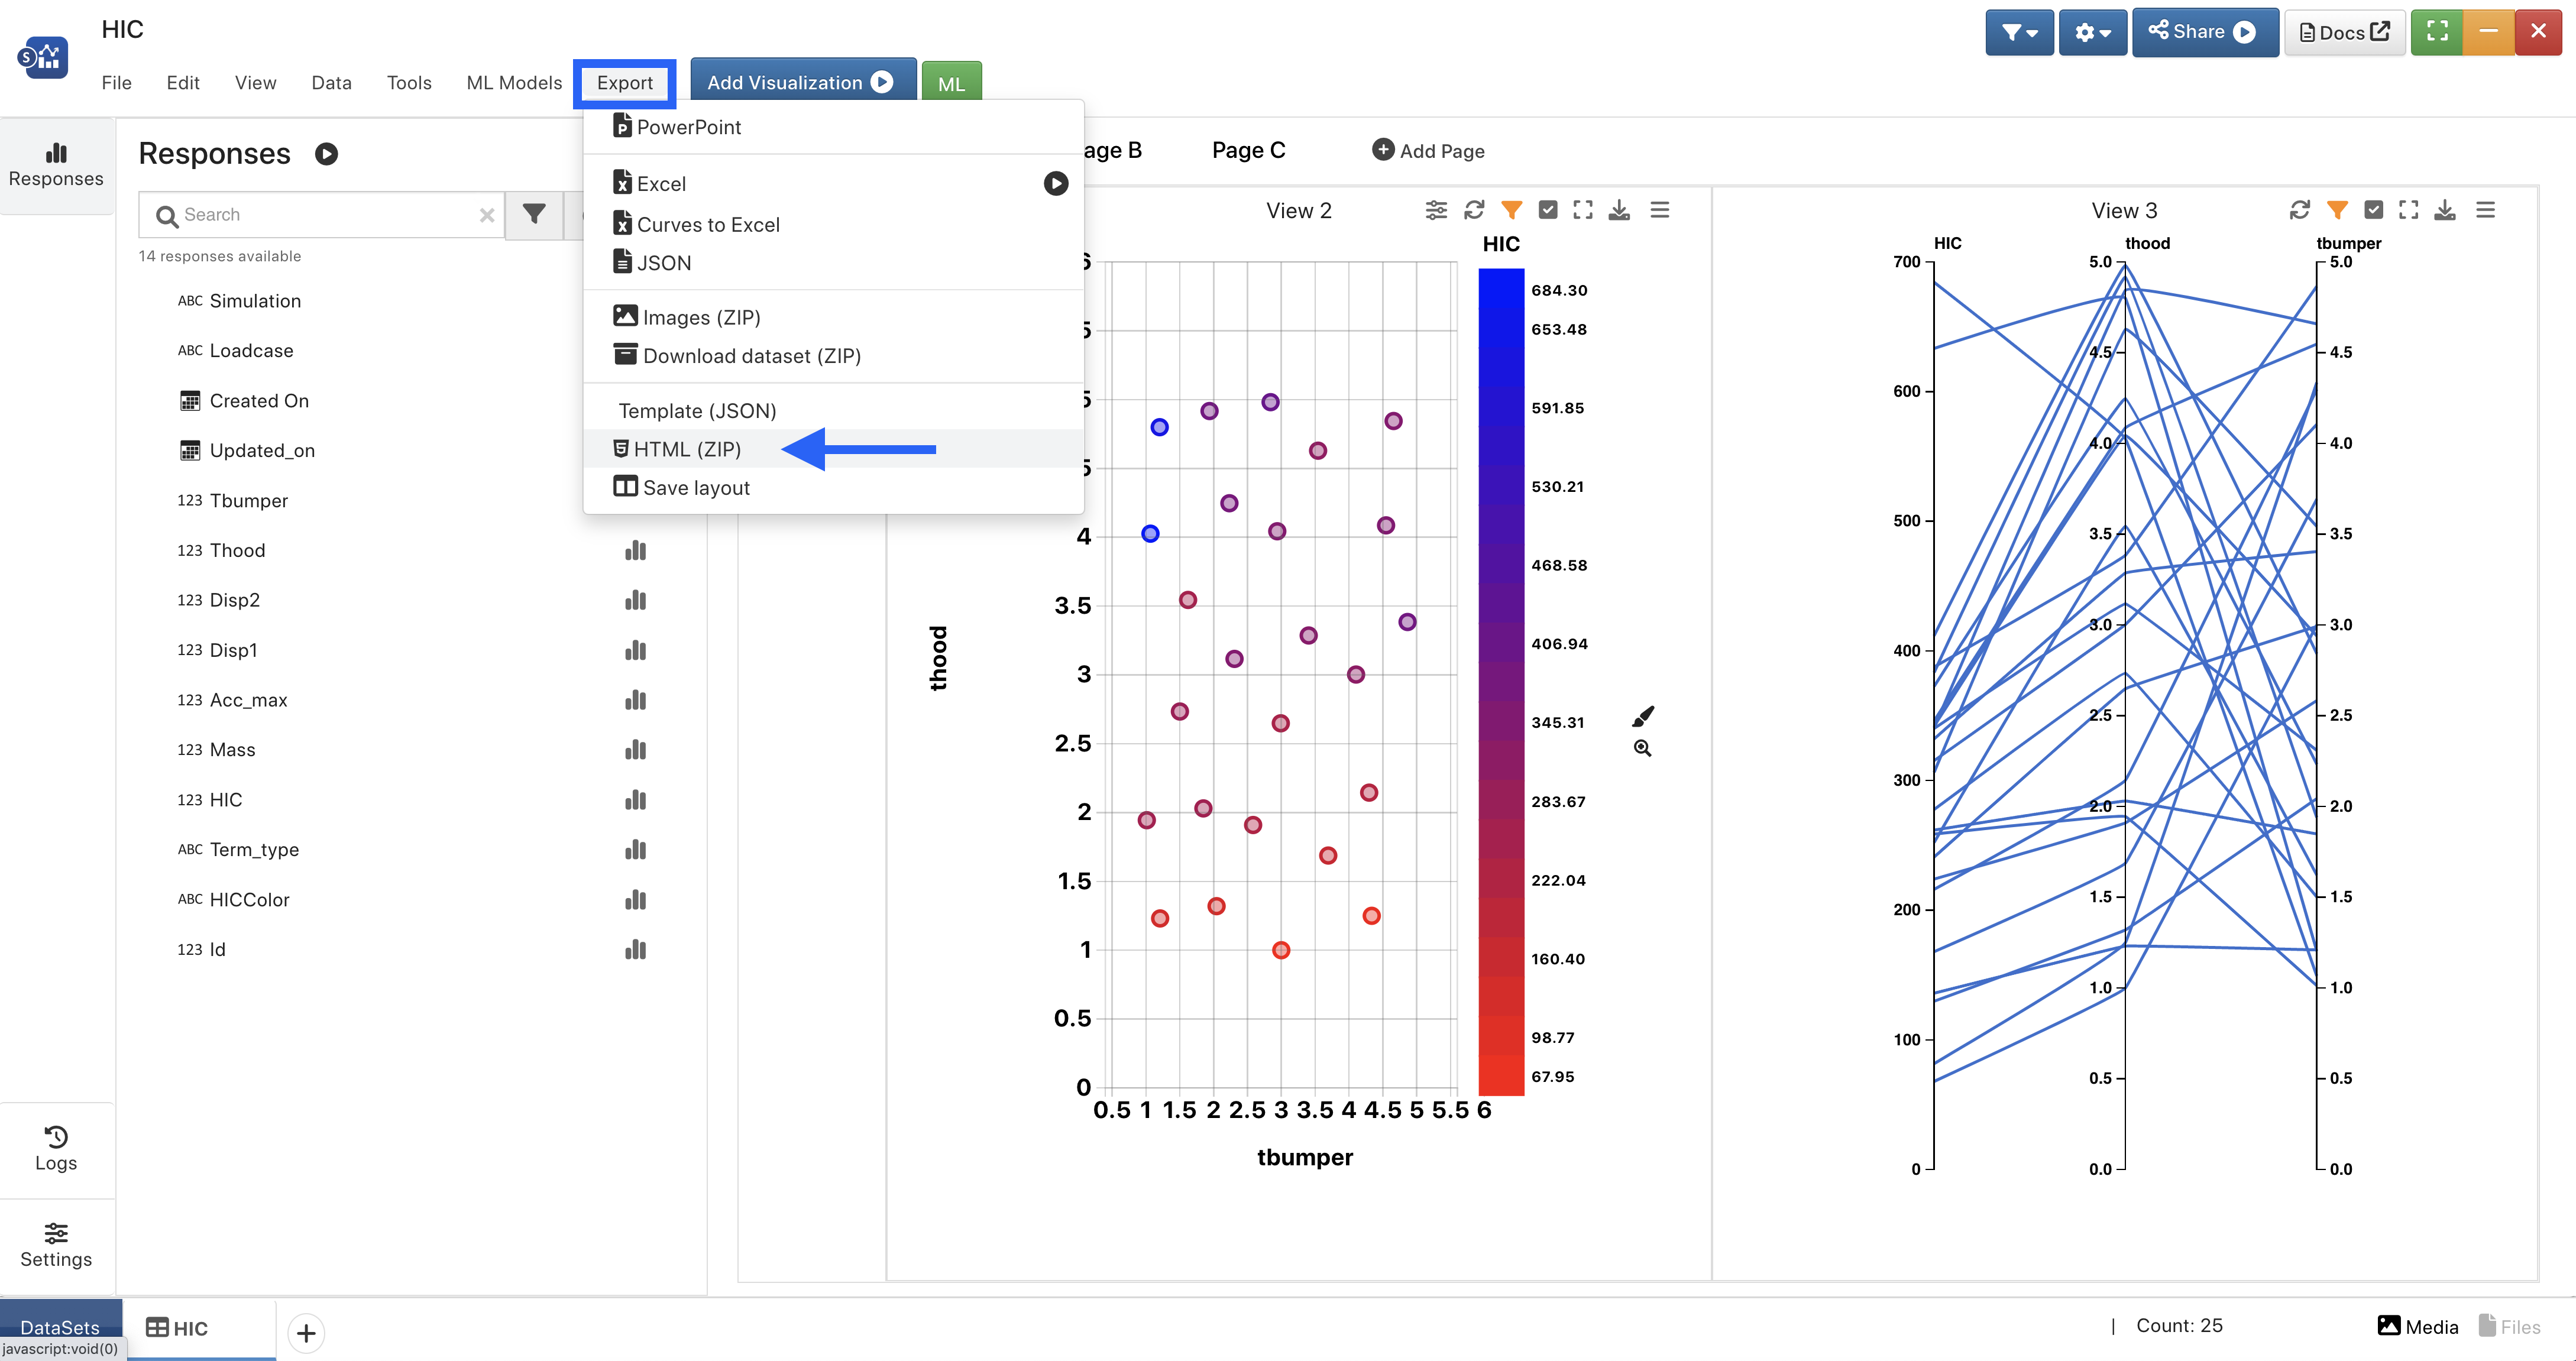
Figure 3: Dataset Export Menu
Datasets can be exported as HTML (zip) files, like Hypergraph, which ensures proper formatting of texts and images for internet browsers.
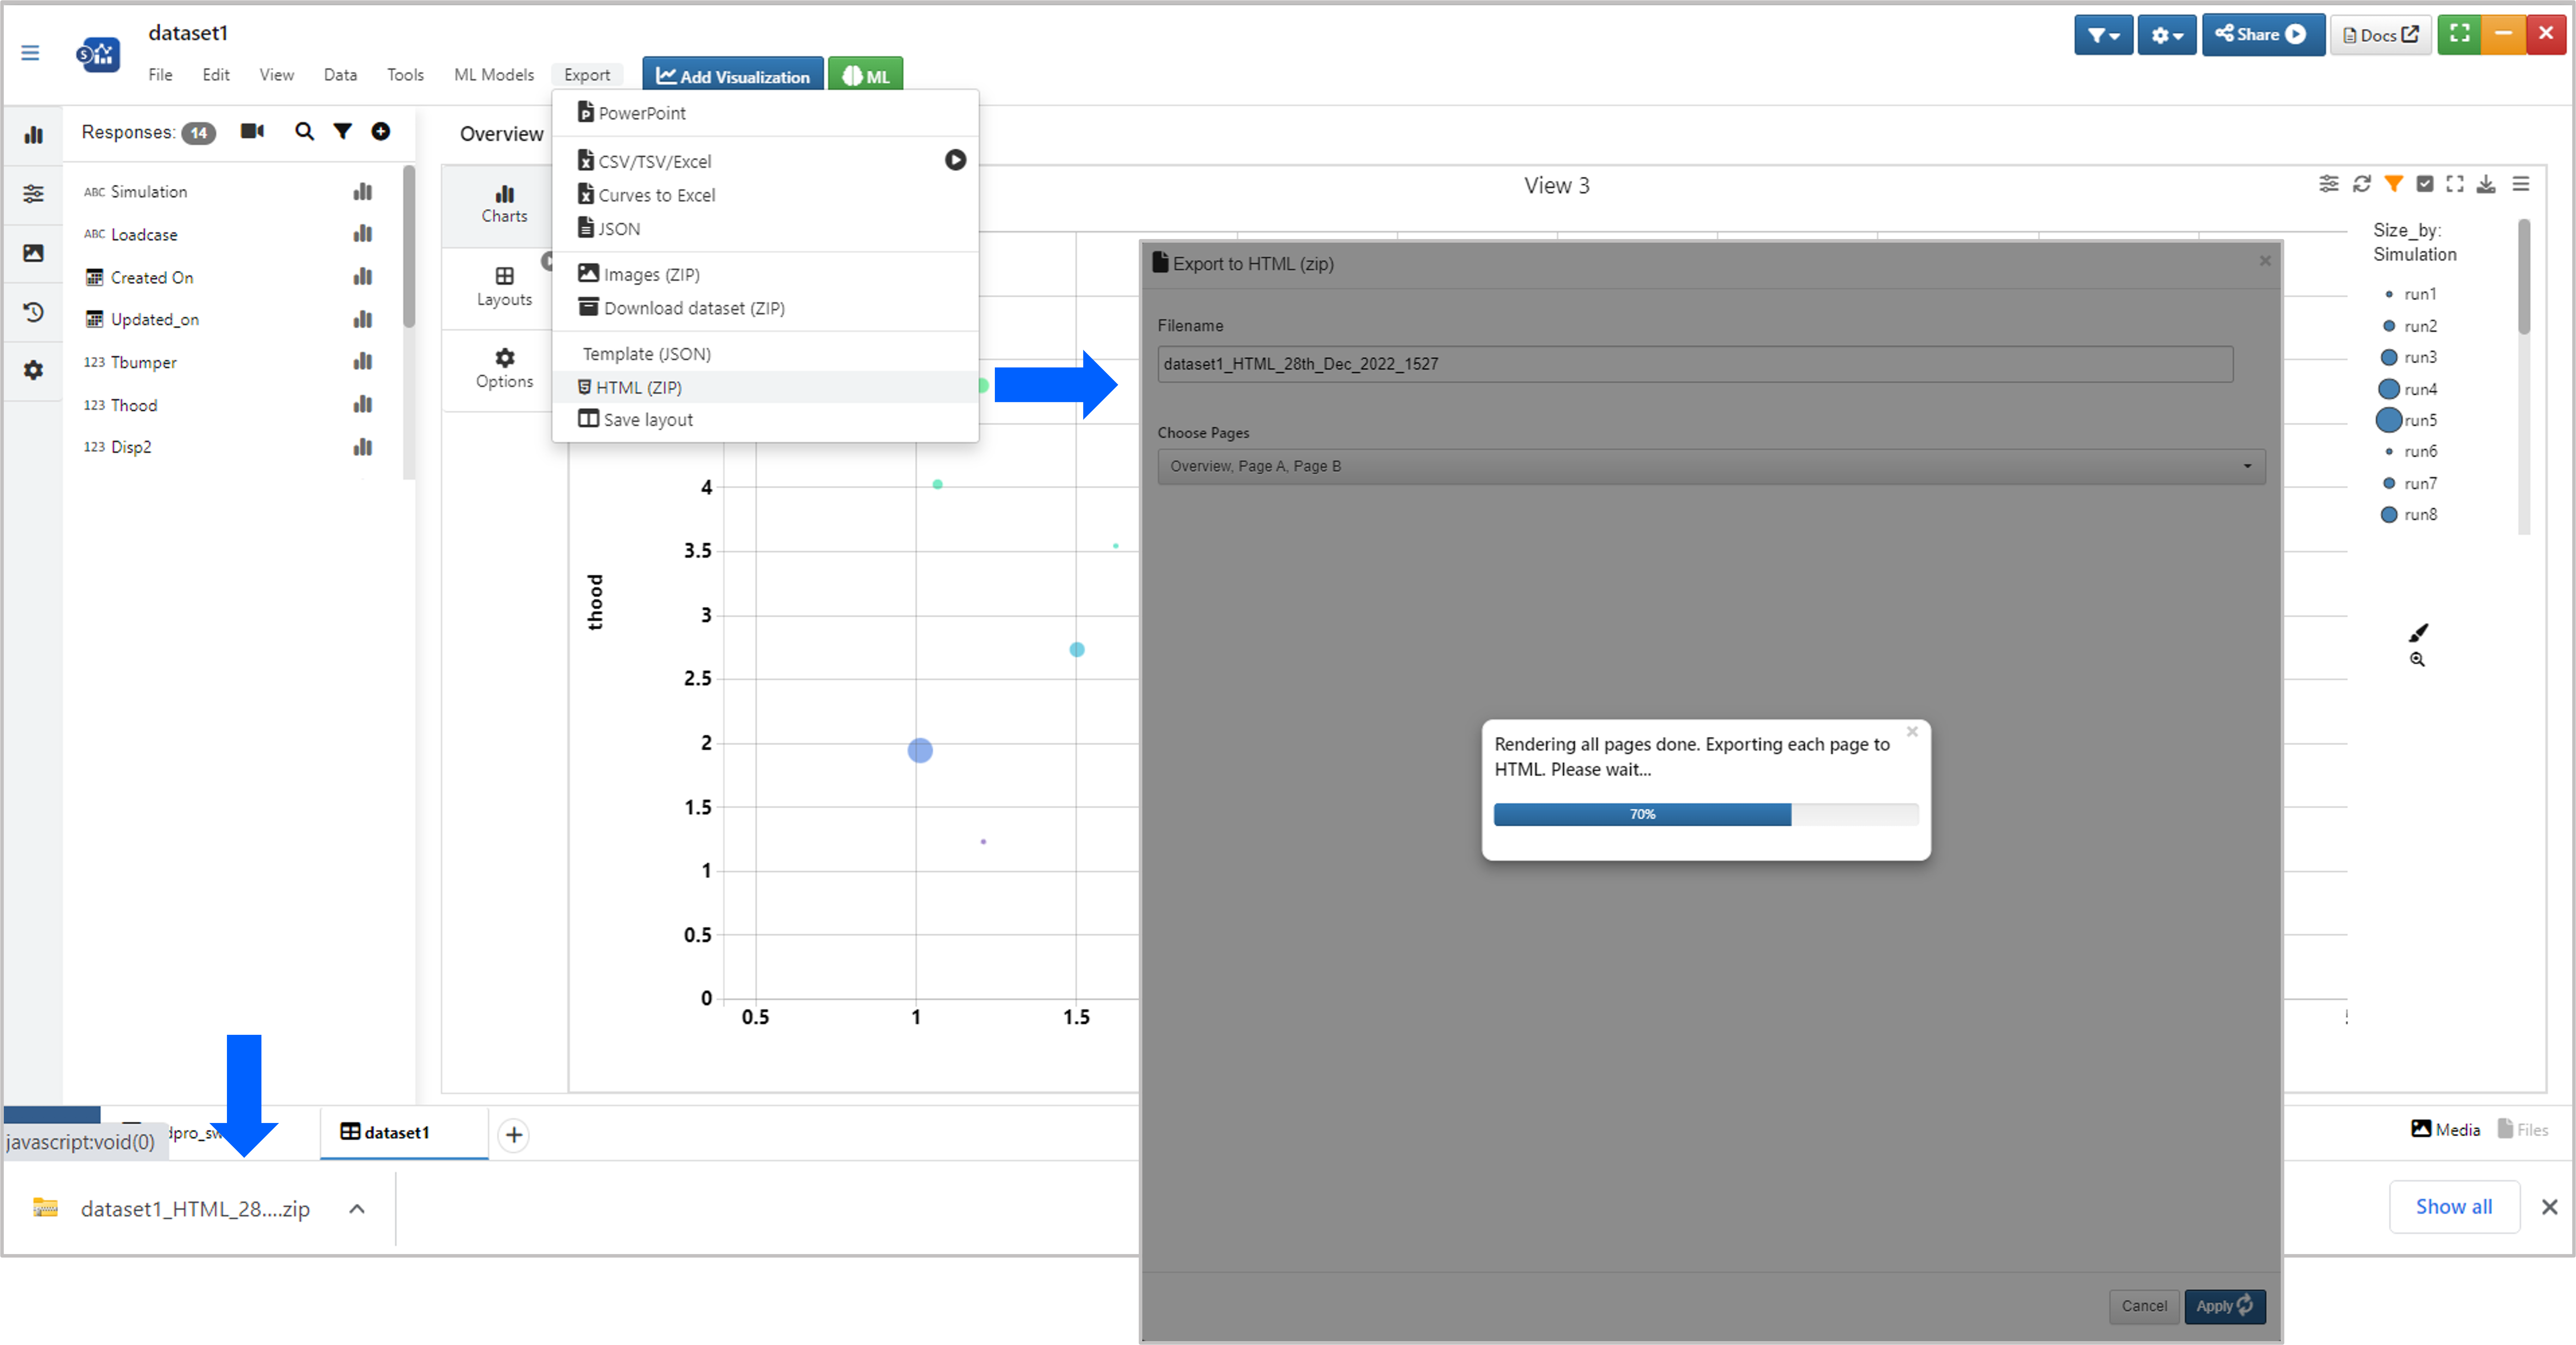
Figure : Dataset HTML Export
Visualizations in Simlytiks dataset can be exported as a Word document.
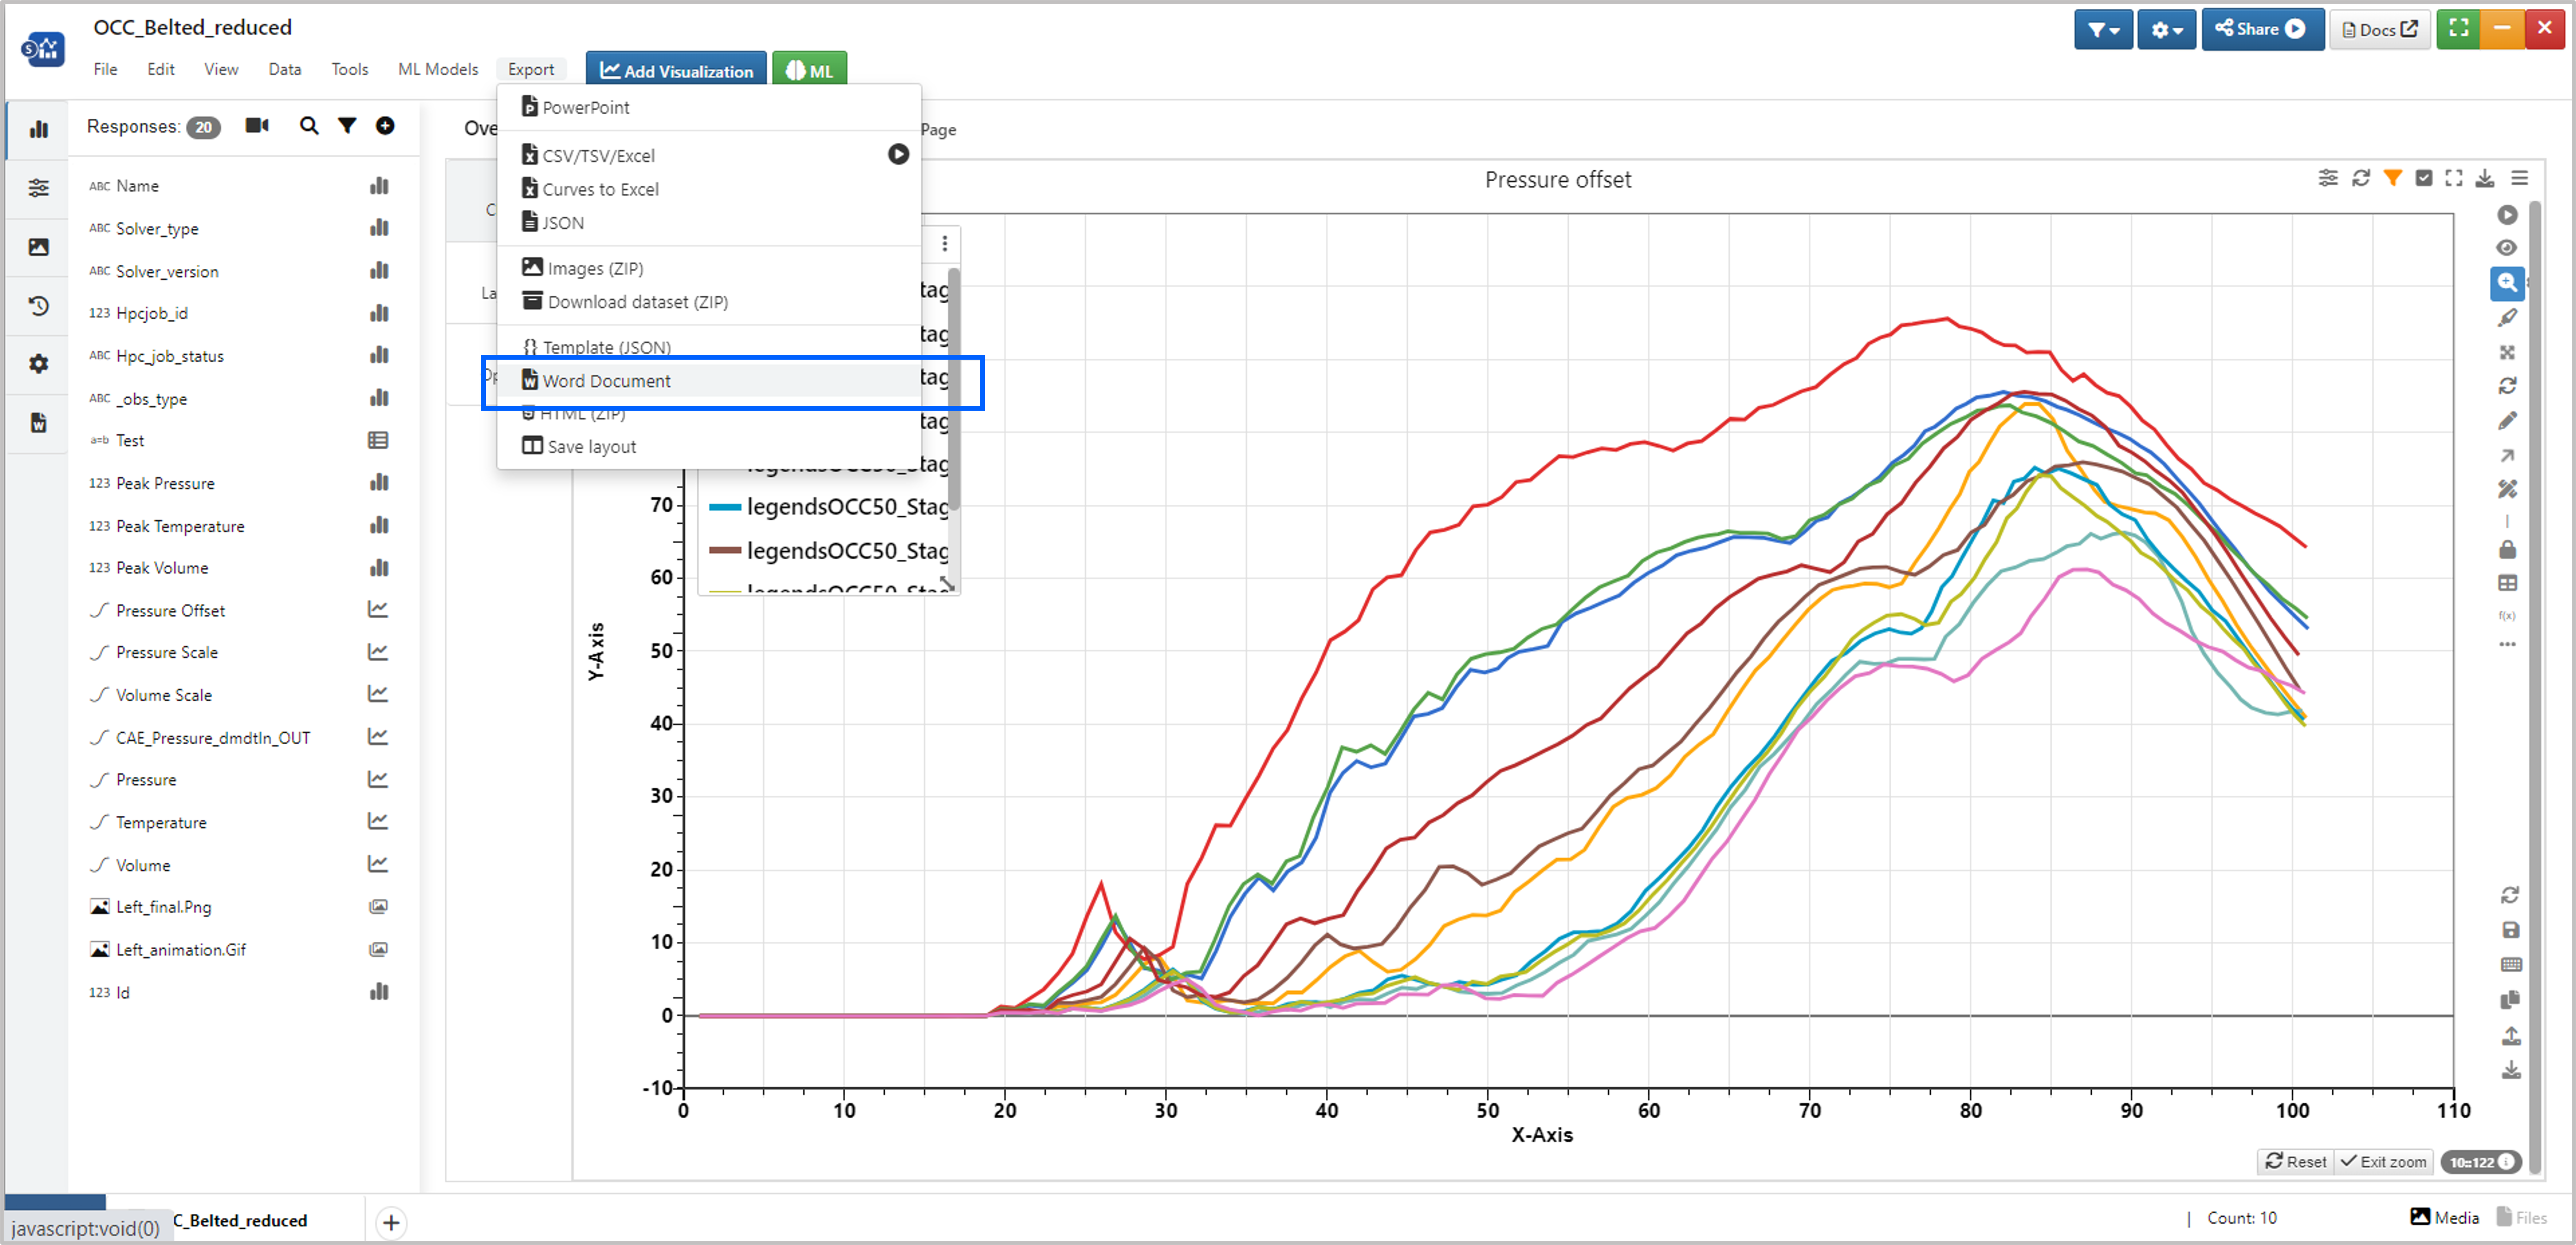
Figure : Dataset Word Export
Downloading Pages
If you really like the way one of your pages looks and want to include the comparison in a presentation or share it with a coworker, click the ‘Export’ button at the top of the page next to the ‘Layout’.
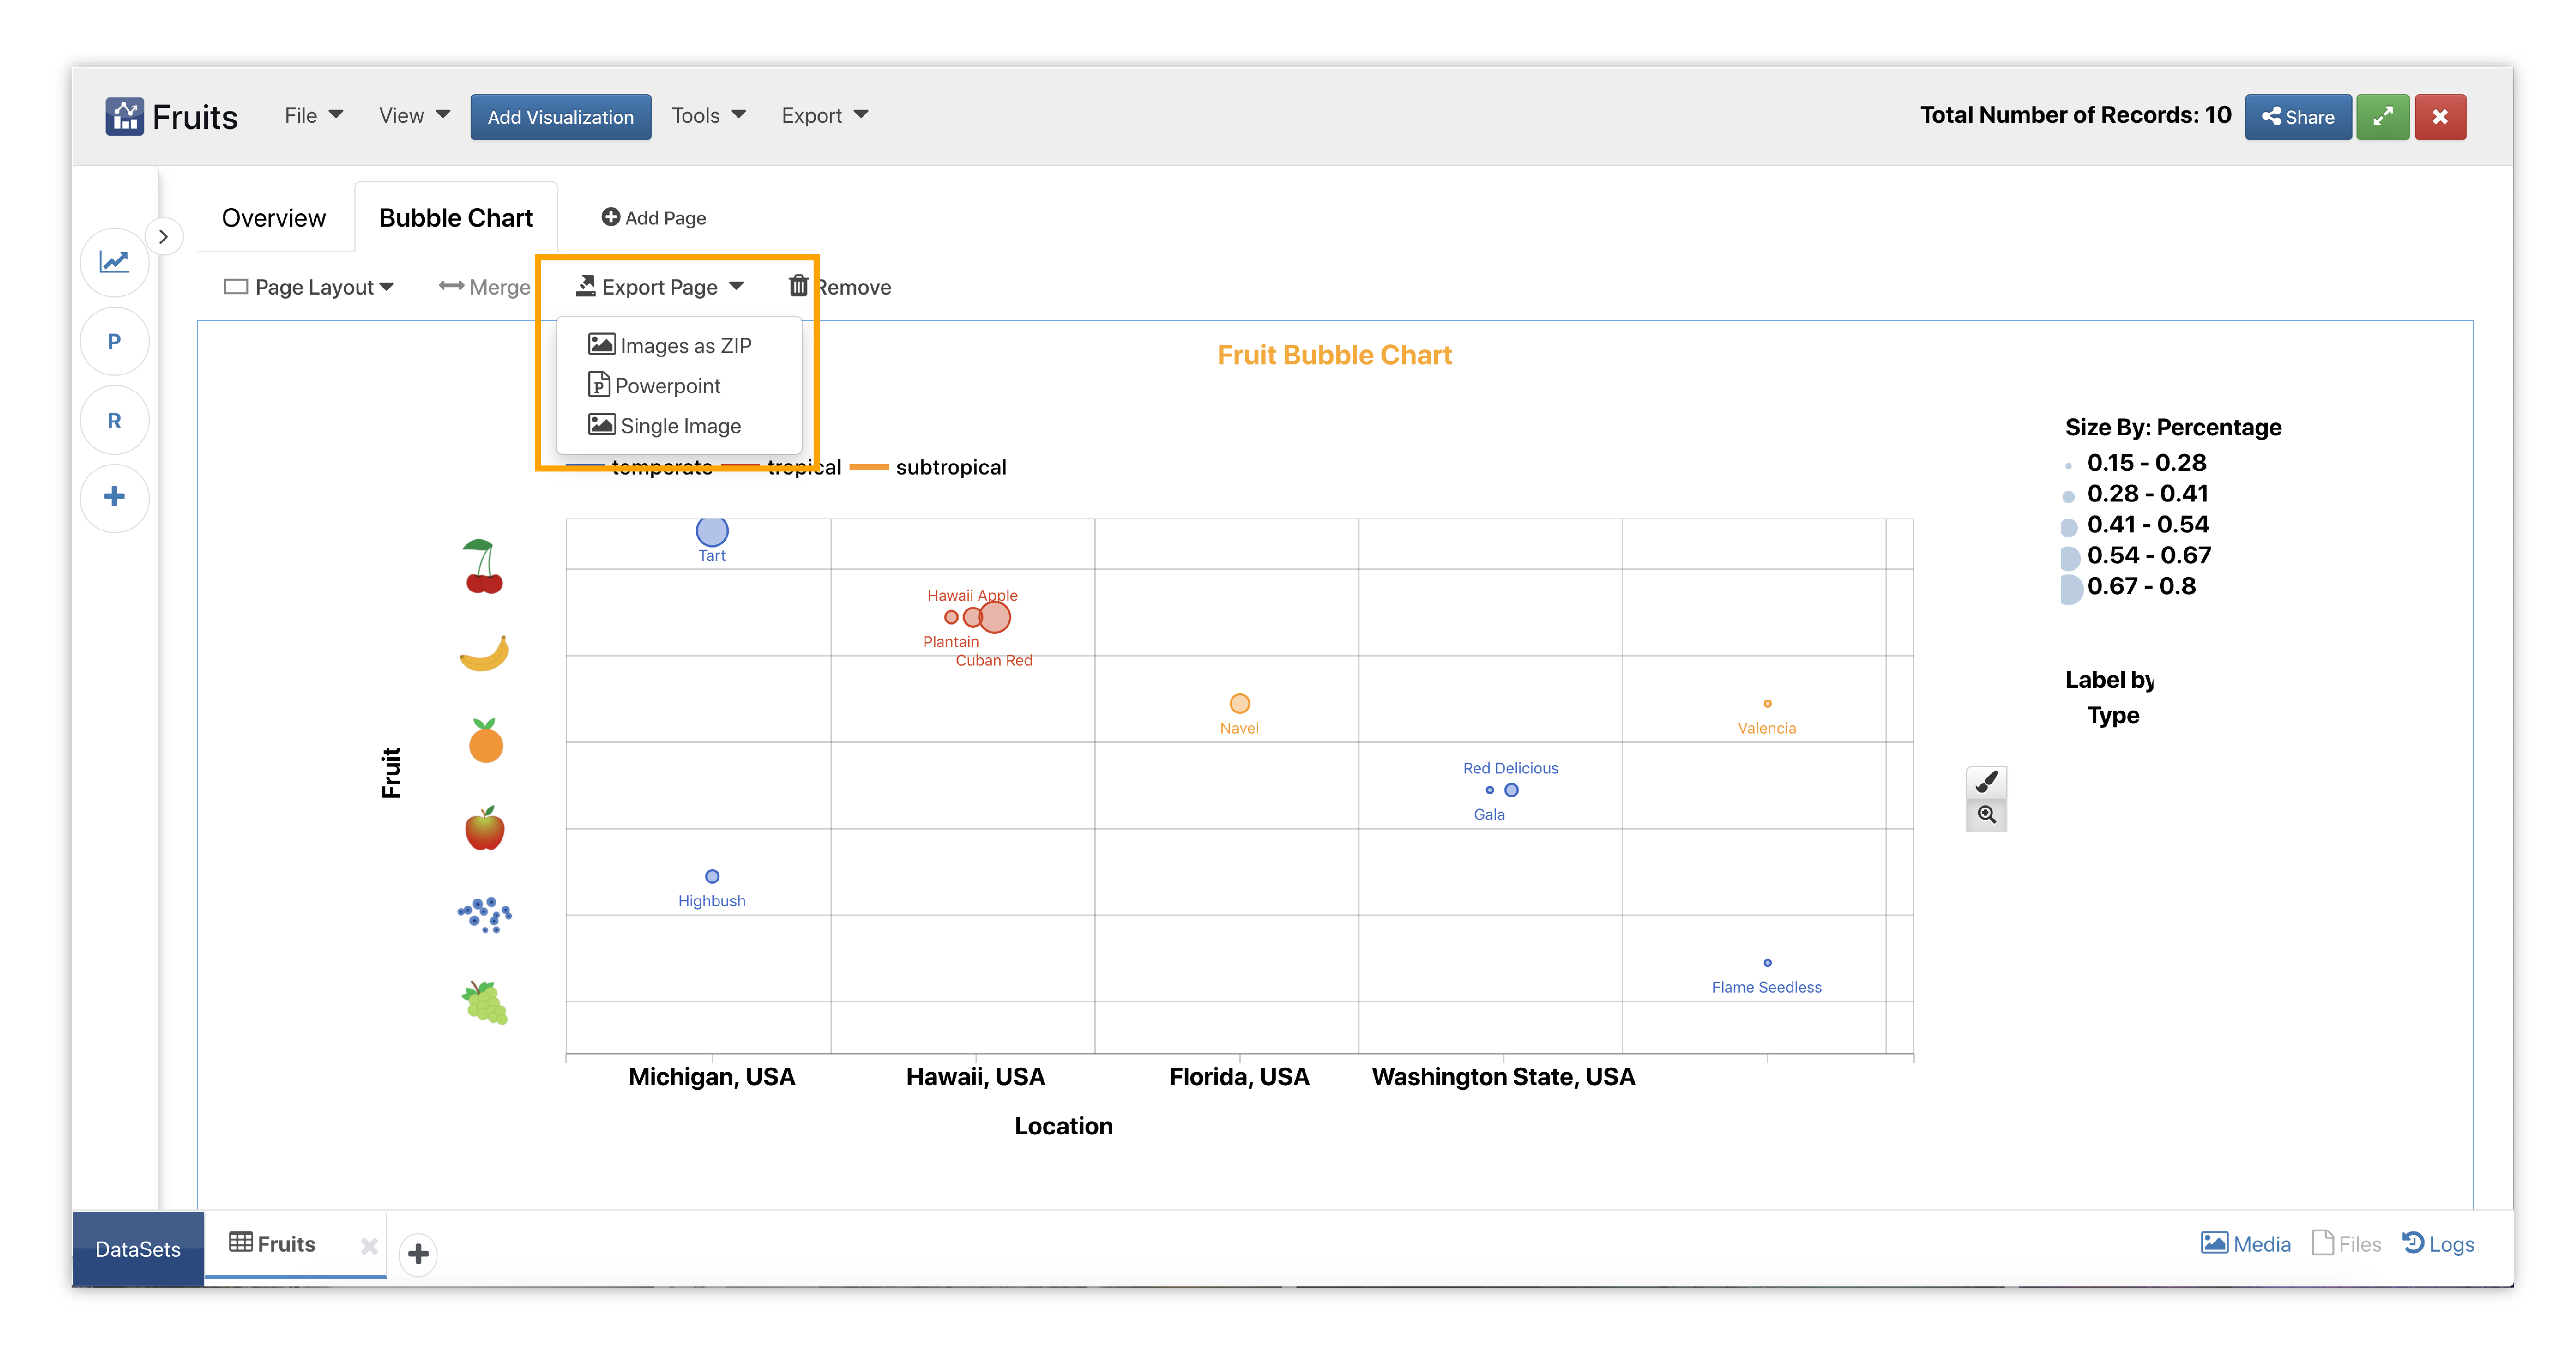
Figure 4: Pages Export Menu
Pages can be downloaded individually in two ways:
- Images: We can download the page as one PNG or each chart as a separate PNG in a ZIP image file.
- PowerPoint: We can also add our page to the PowerPoint Builder for creating presentations. Please review the PowerPoint Builder subsection below to learn how to use it.
Downloading Visualizations
One way to share information from our Simlytiks Dashboard is by directly downloading a chart. We can download a visualizer under its options menu at the top right corner of its contents or by right-clicking and choosing PNG export option under this menu.
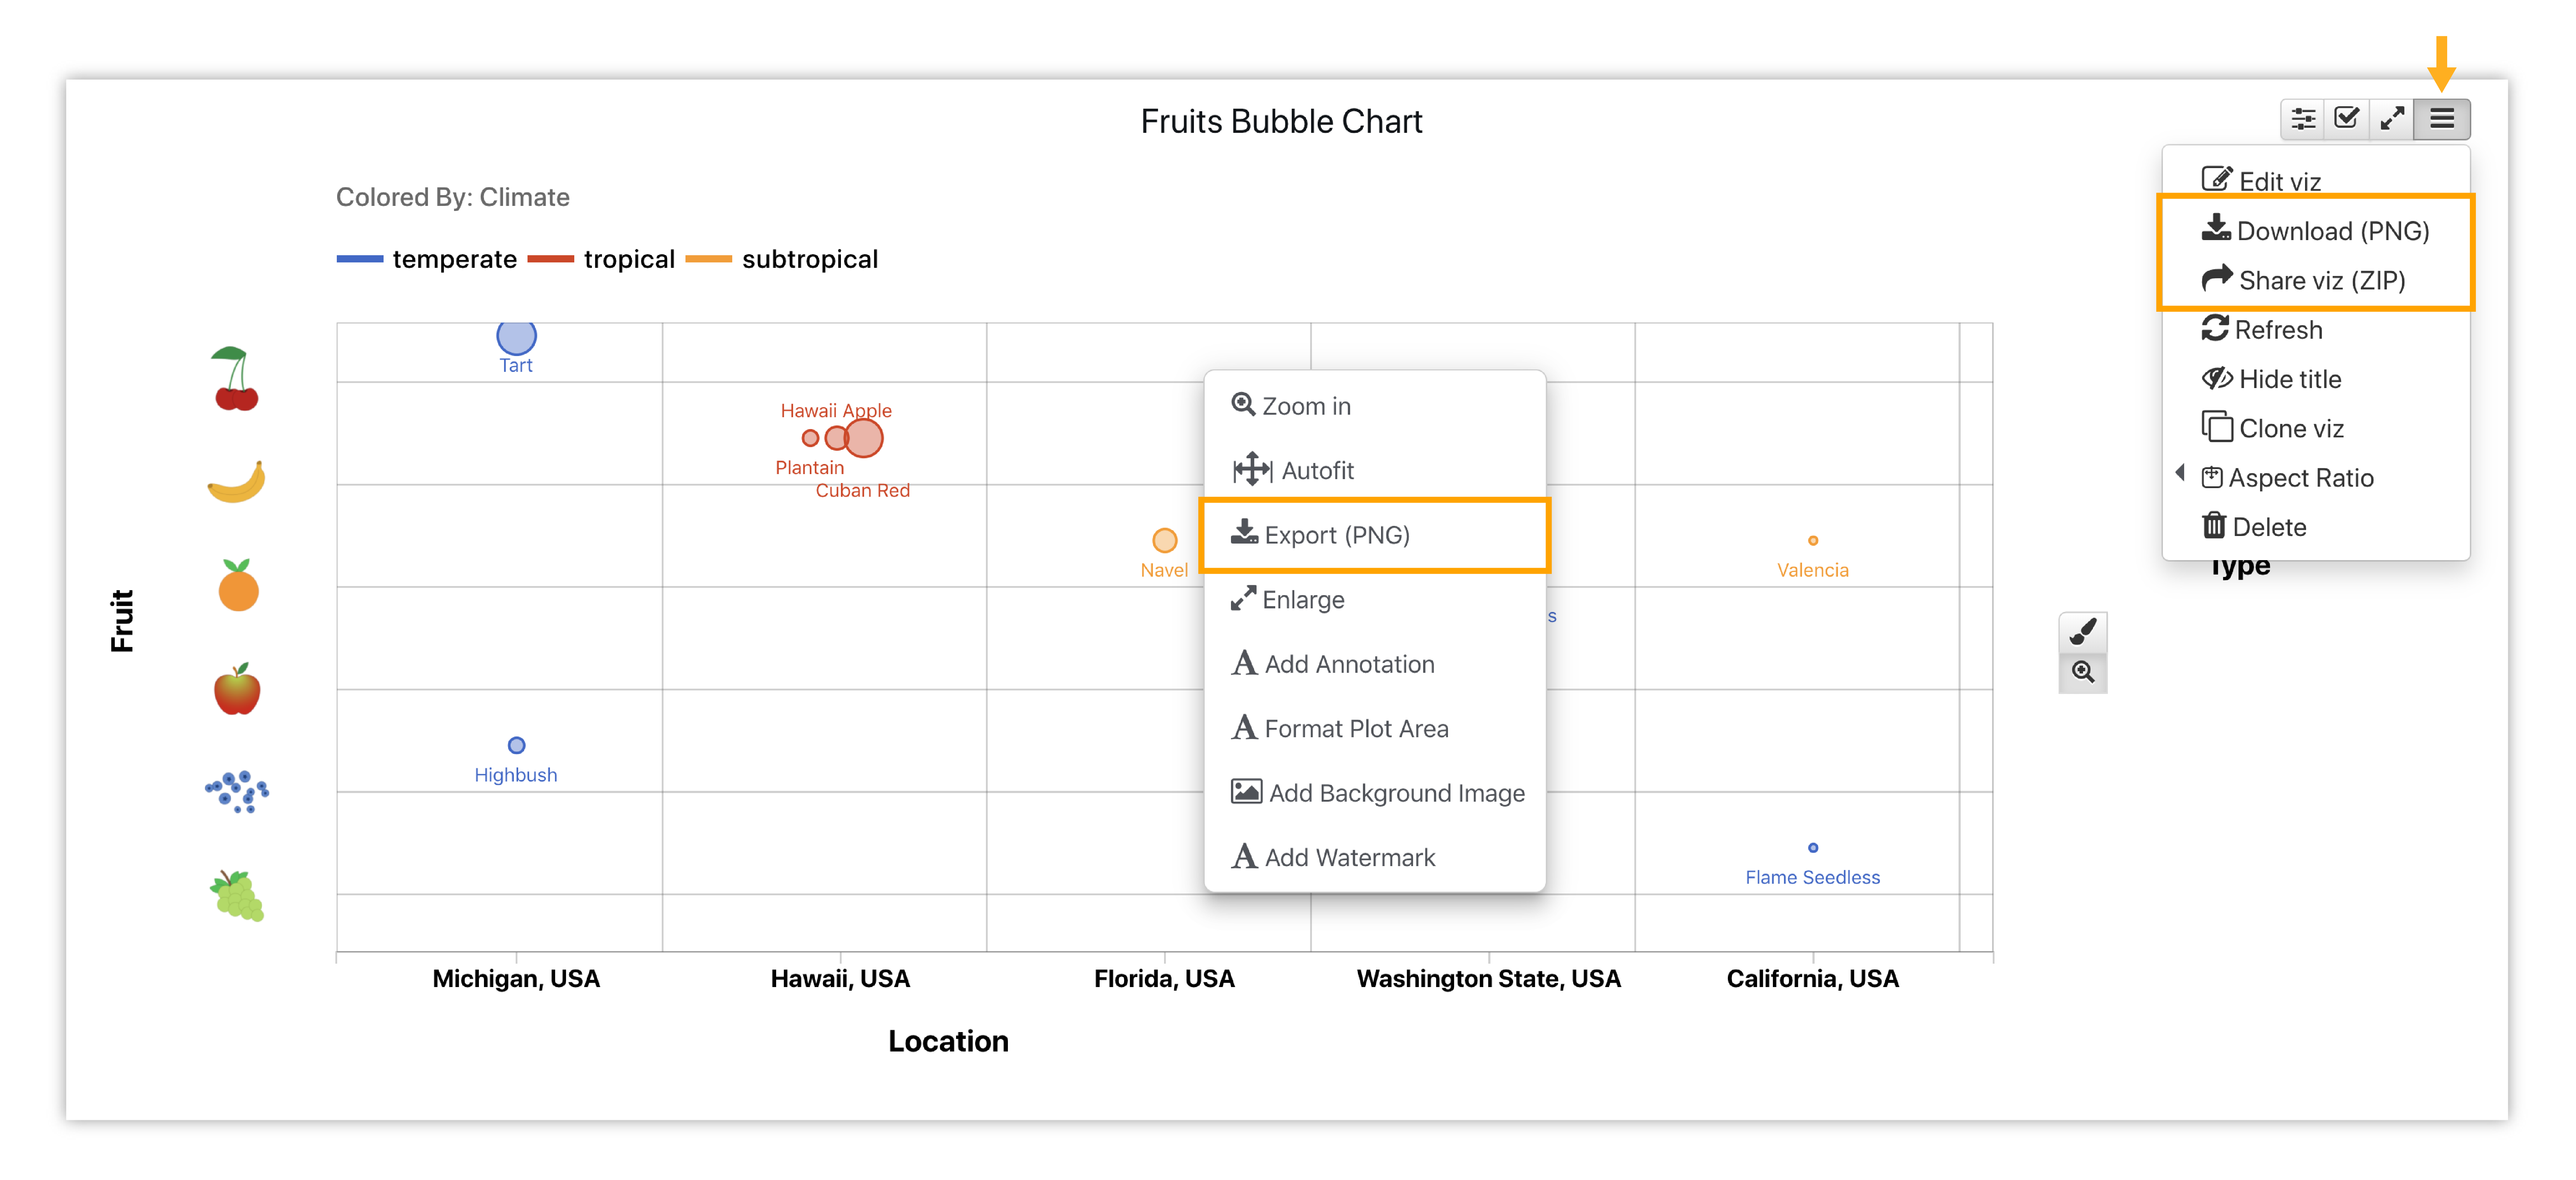
Figure 5: Chart Export
PowerPoint Builder
The PowerPoint builder allows us to add text, images, arrows, slides and other visualizations. It also supports editing visualizations directly and importing slide layouts. We can access the PowerPoint builder from the page or dataset export menu as discussed in the above subsections.
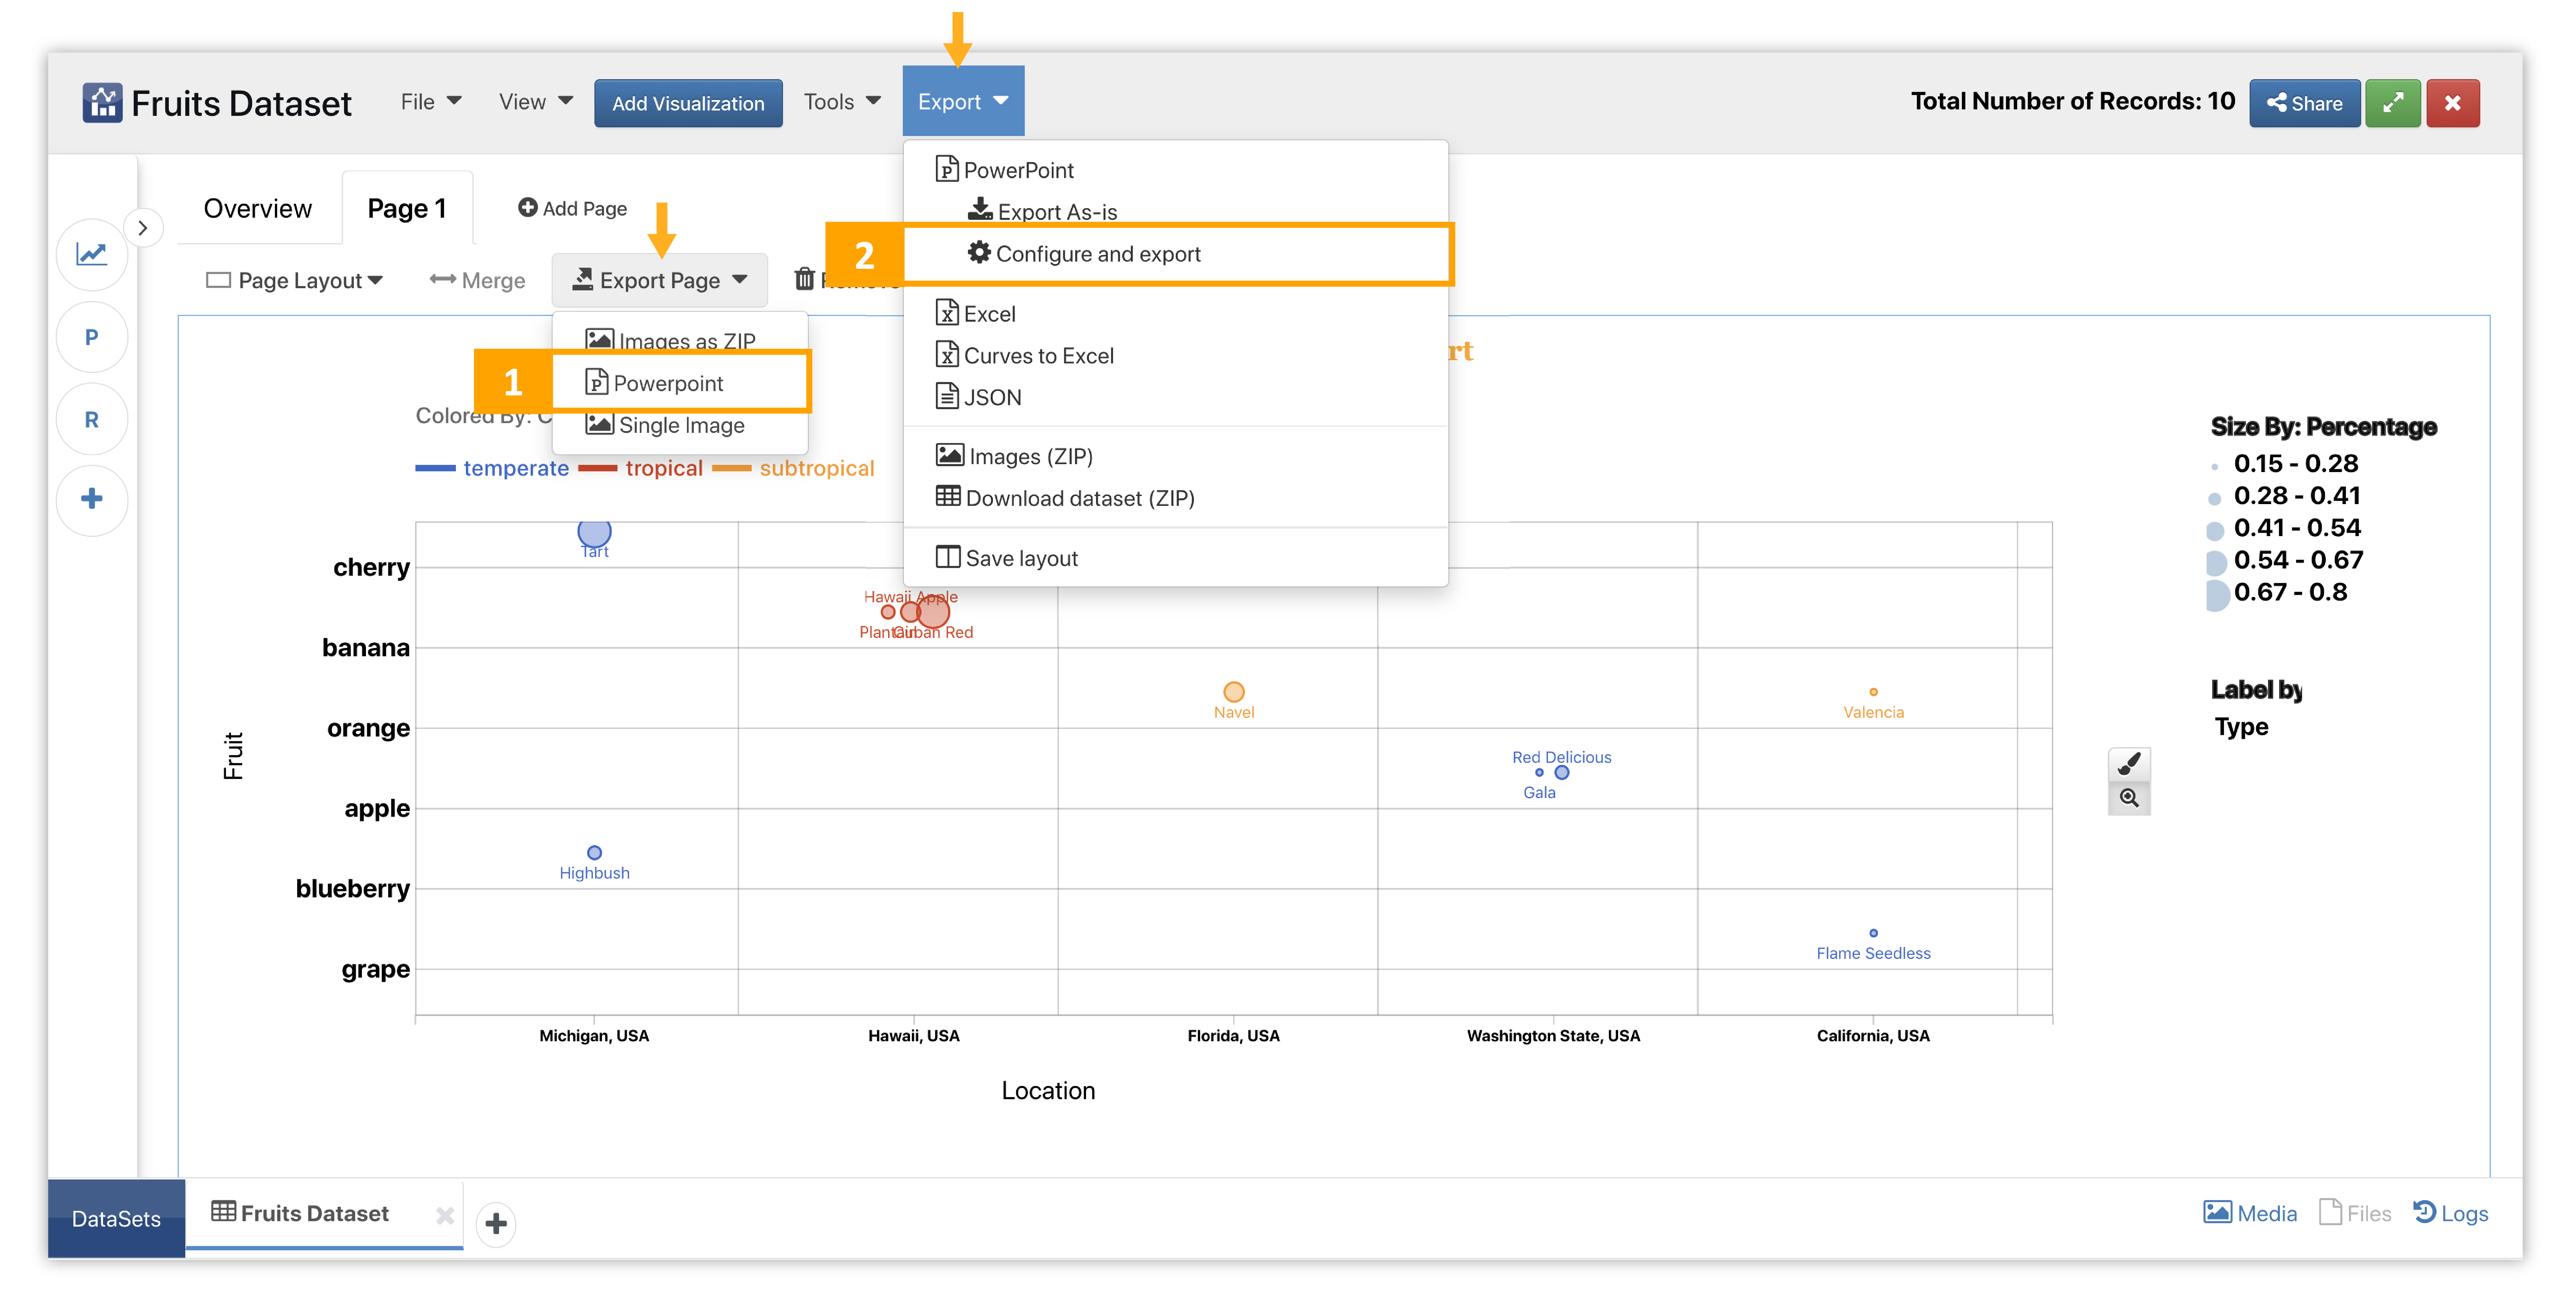
Figure 6: Accessing the PowerPoint Builder
- Page Export PowerPoint Builder
- Dataset Export PowerPoint Builder
Using the Builder
Basic PowerPoint functions can be found at the top of the screen. Click on text to edit it. The following video shows using the builder from page export.
You can also export the report as a PDF instead of a PowerPoint file.
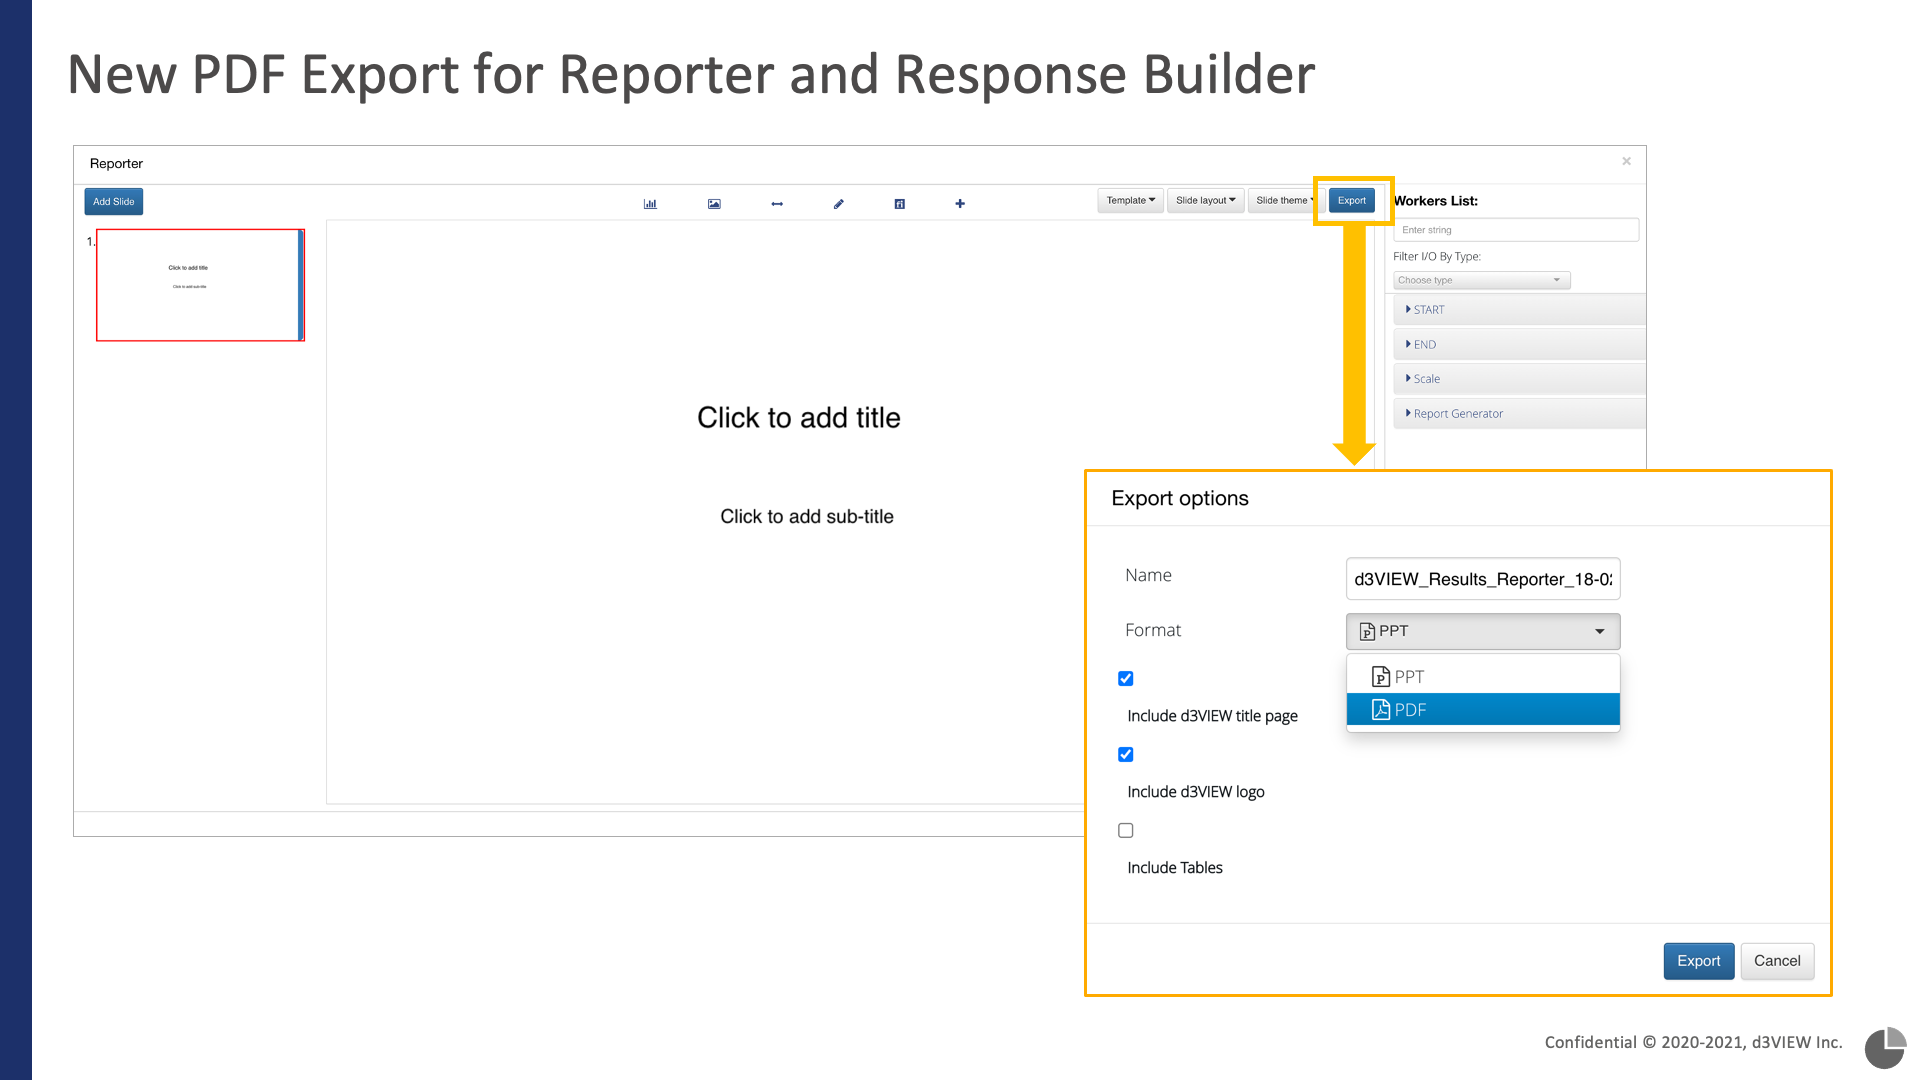
Figure 7: Export as a PDF
PPT Layouts
Once the builder is open, we can upload a layout for our slide under the Slide Layout top-right menu. Click on Load From File to upload a JSON template.
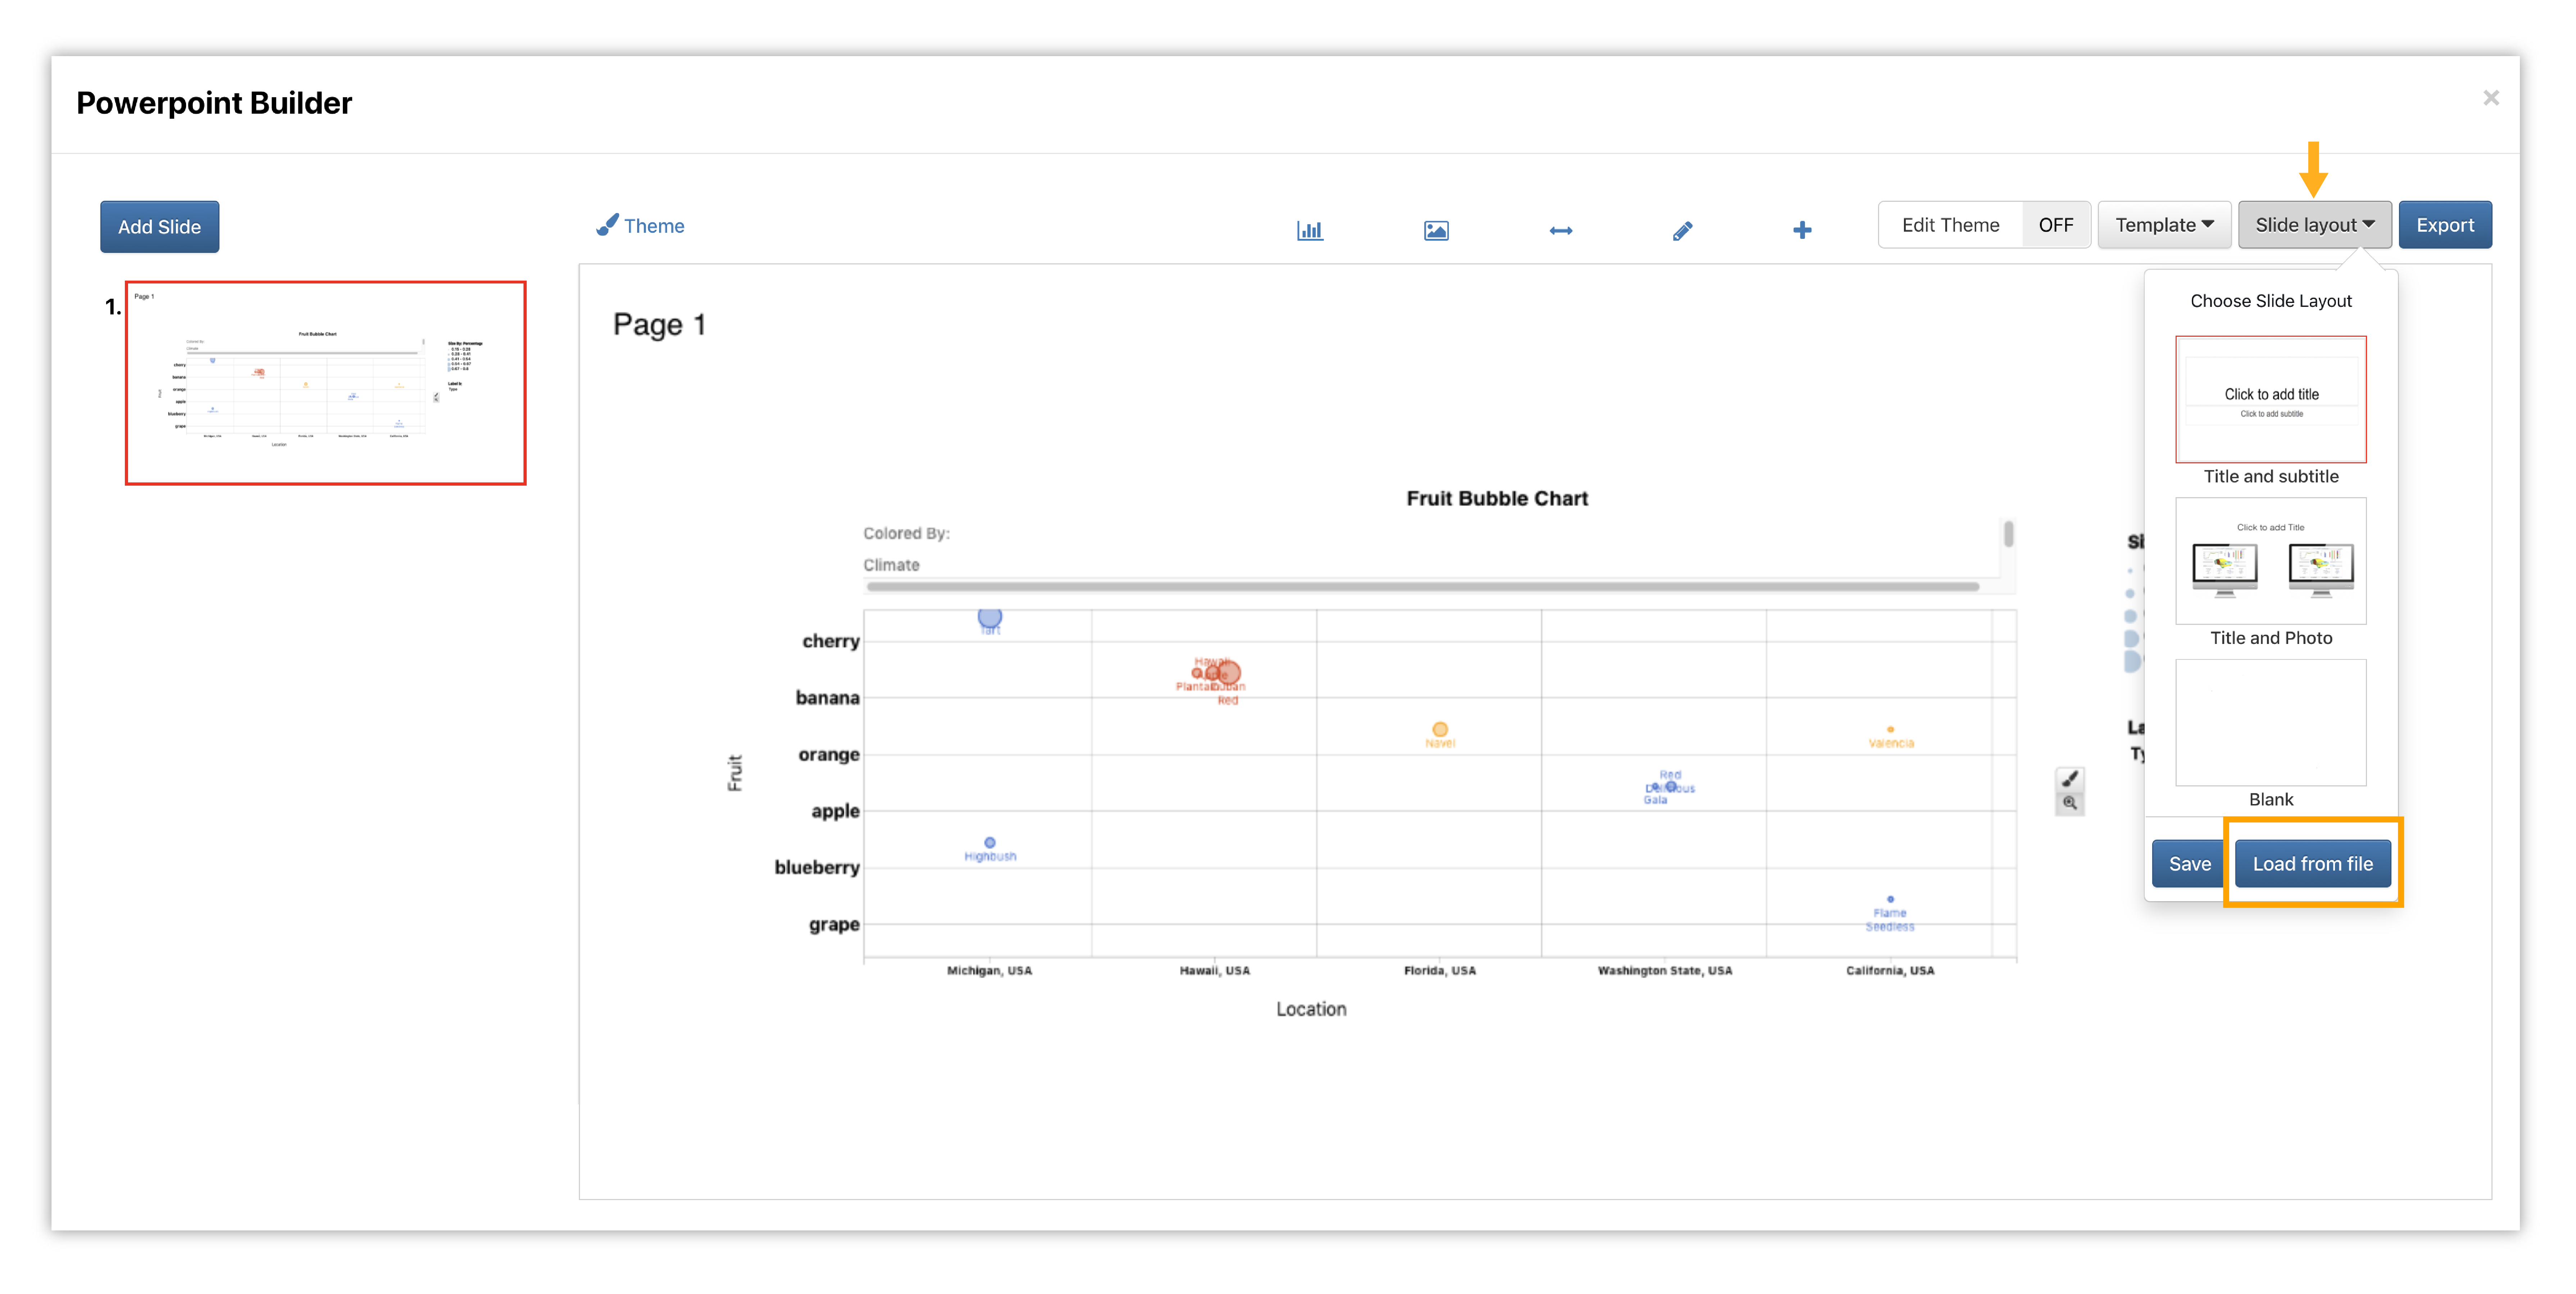
Figure 8: Uploading a PowerPoint Layout
Once we’ve chosen our file from the machine, the builder will automatically add it to our slide layout options. Make sure this new layout it chosen and viewable on the slide. Feel free to rearrange the elements of the implemented layout on the slide if needed. Here is a video showing how its done.
Sharing Explorations
We can create a public link of the dashboard to share with whomever we choose. To do this, click on ‘Share Dataset’ and add a description for data. The window will provide a link to copy and share for viewing. This link will show the dataset in the application just as it is shown by the user who created it.
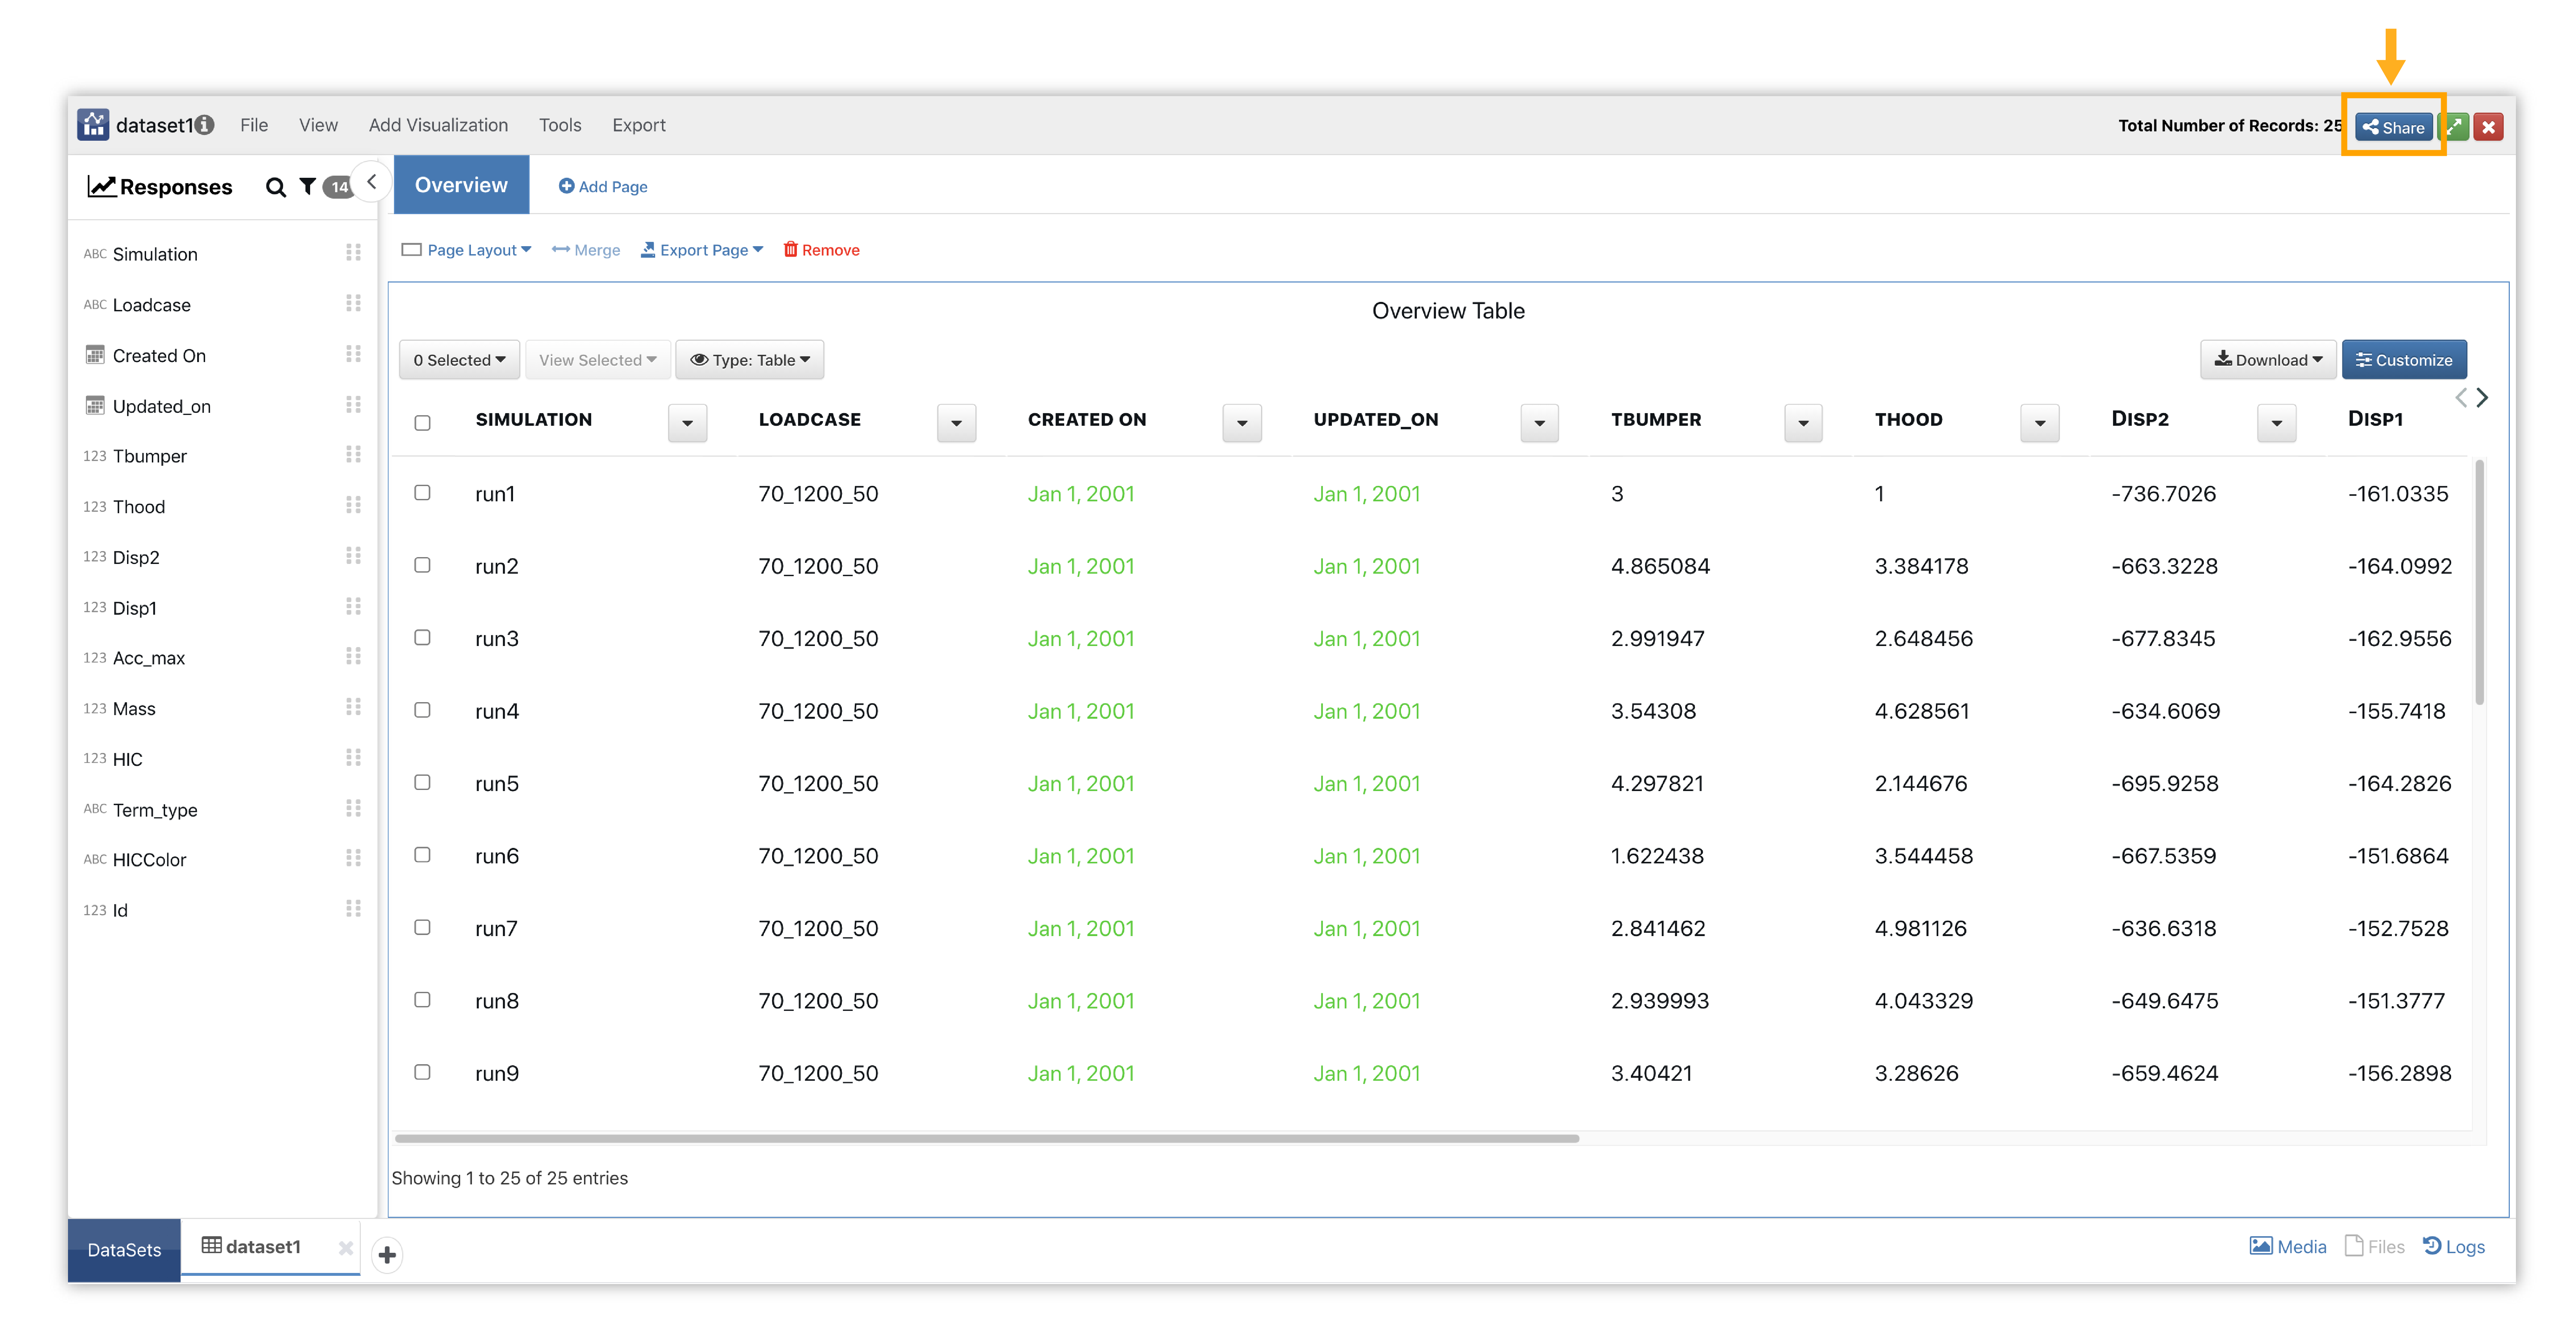
Figure 9: Dashboard Sharing
Here is a video showing the process:
Workflow Reporting
The d3VIEW applications integrate seamlessly with each, just like how we can import datasets into Simlytiks via Simulations or Physical Tests. We can also report using Simlytiks through Workflows using the Report Generator Worker.
Please refer to our main tutorial documentation to read a detailed guide on how to create workflows.
We’ll want to add the Report Generator worker at the end of our workflow, then click on it to configure. Similar to the PPT Builder, this updated worker will be able to gather any information from previous worker and generate a downloadable report.
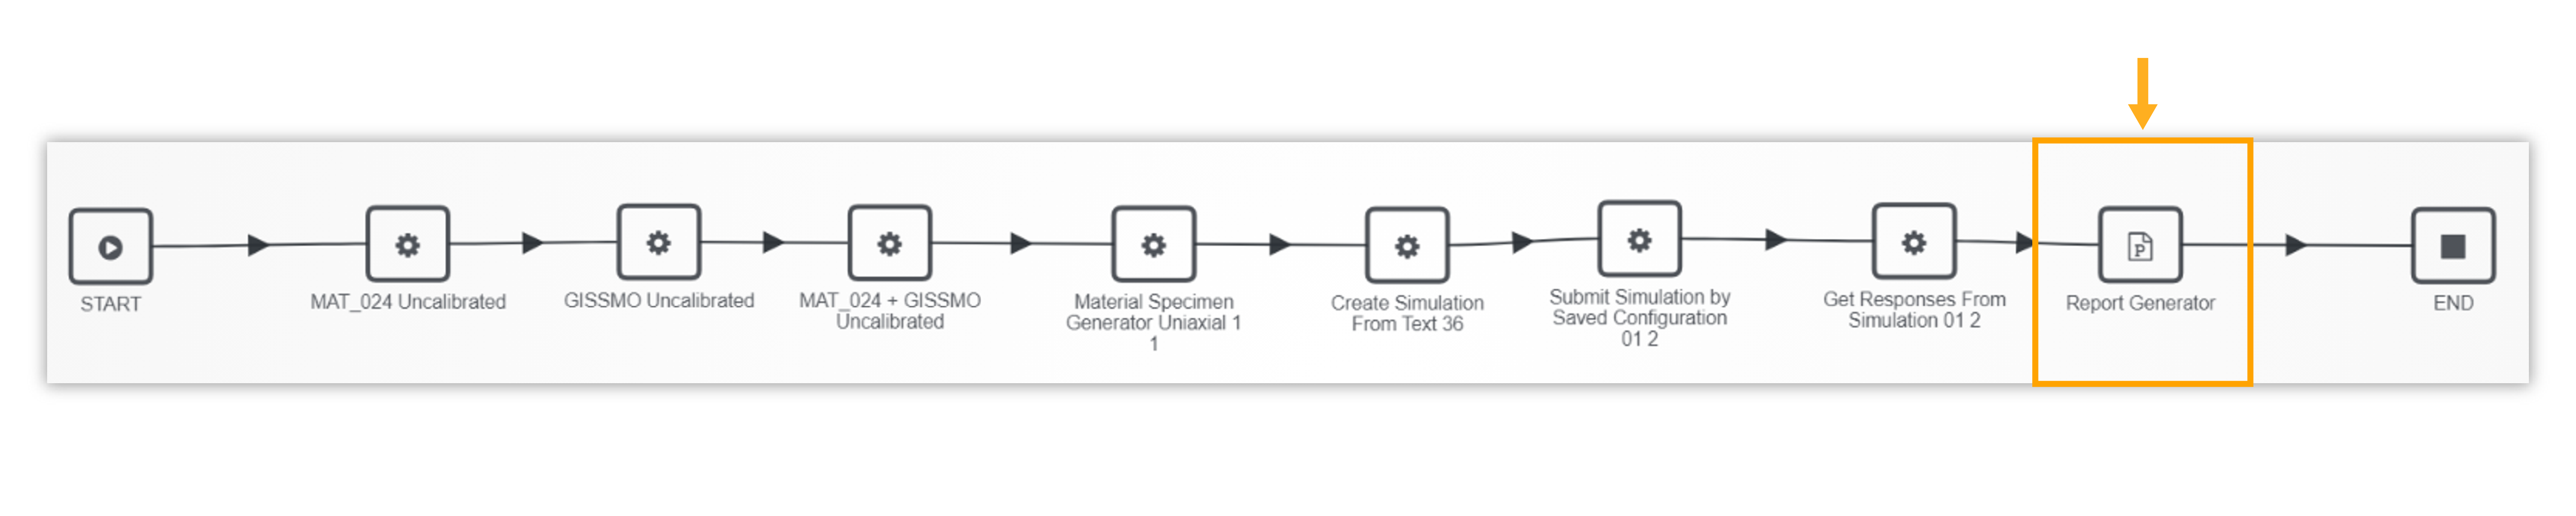
Figure 10: Workflow with Report Generator Worker
Next we’ll click on Configure Manually to generate a layout through Simlytiks.
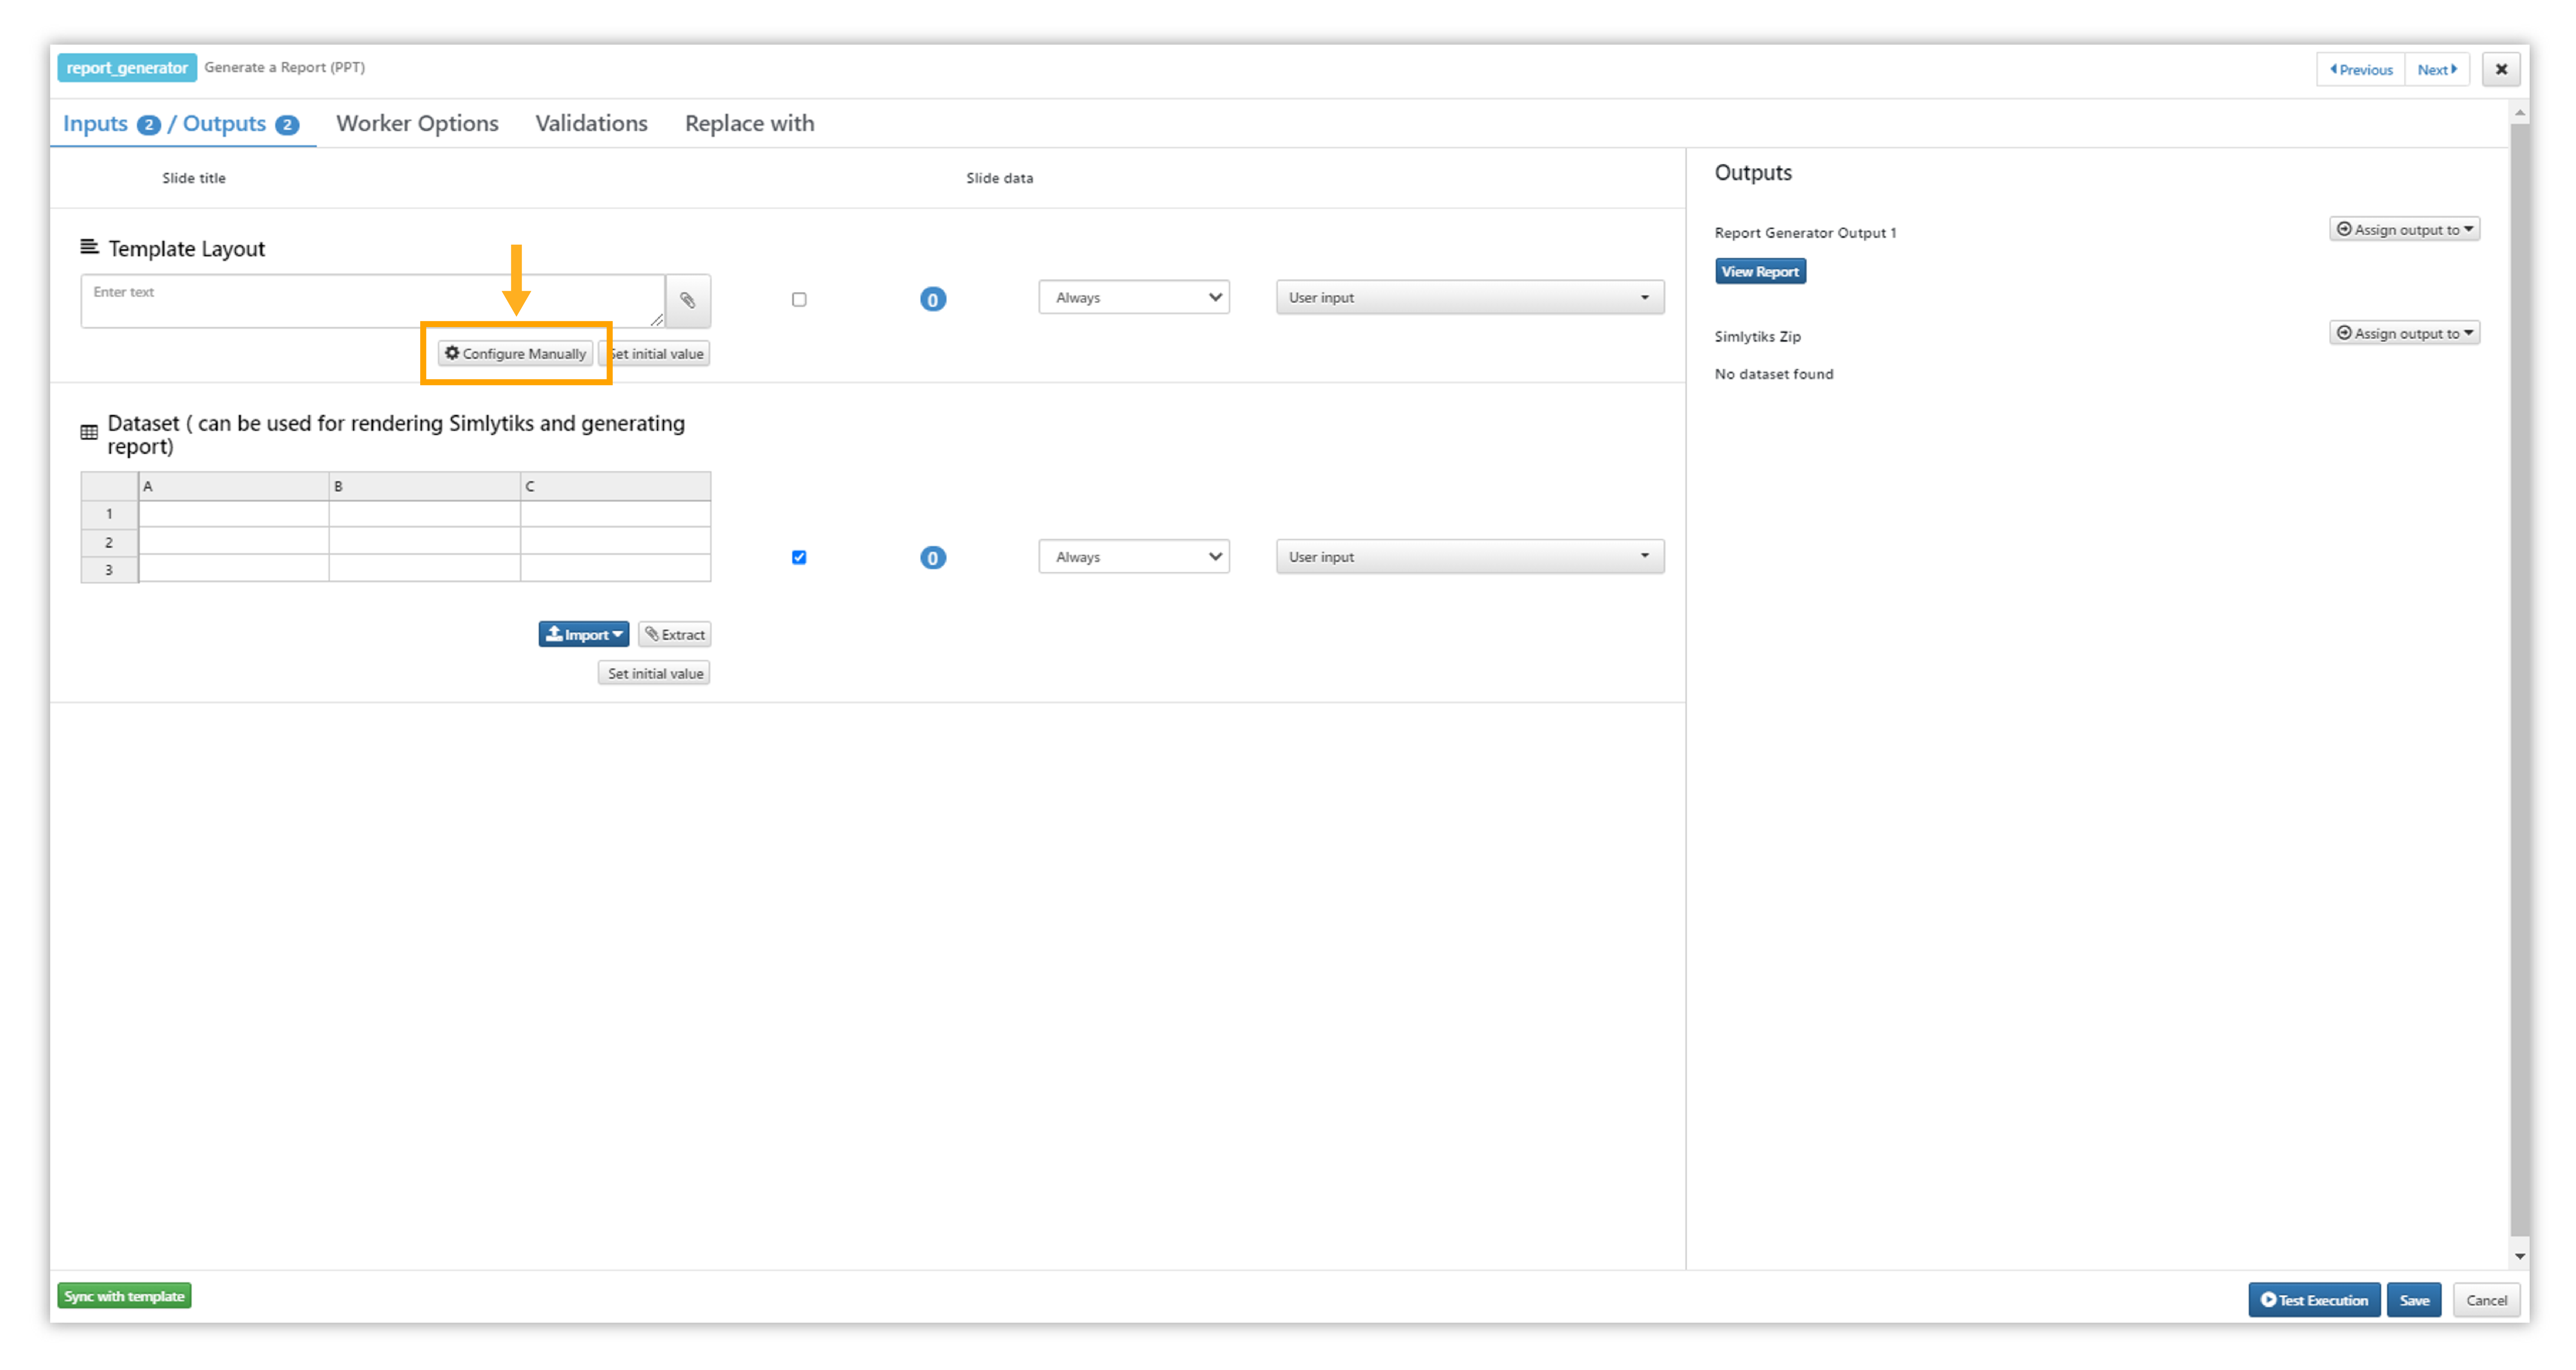
Figure 11: Configure Manually
Just like with data columns in Simlytiks Dashboards, we can drag worker input/output info into the report area as charts.
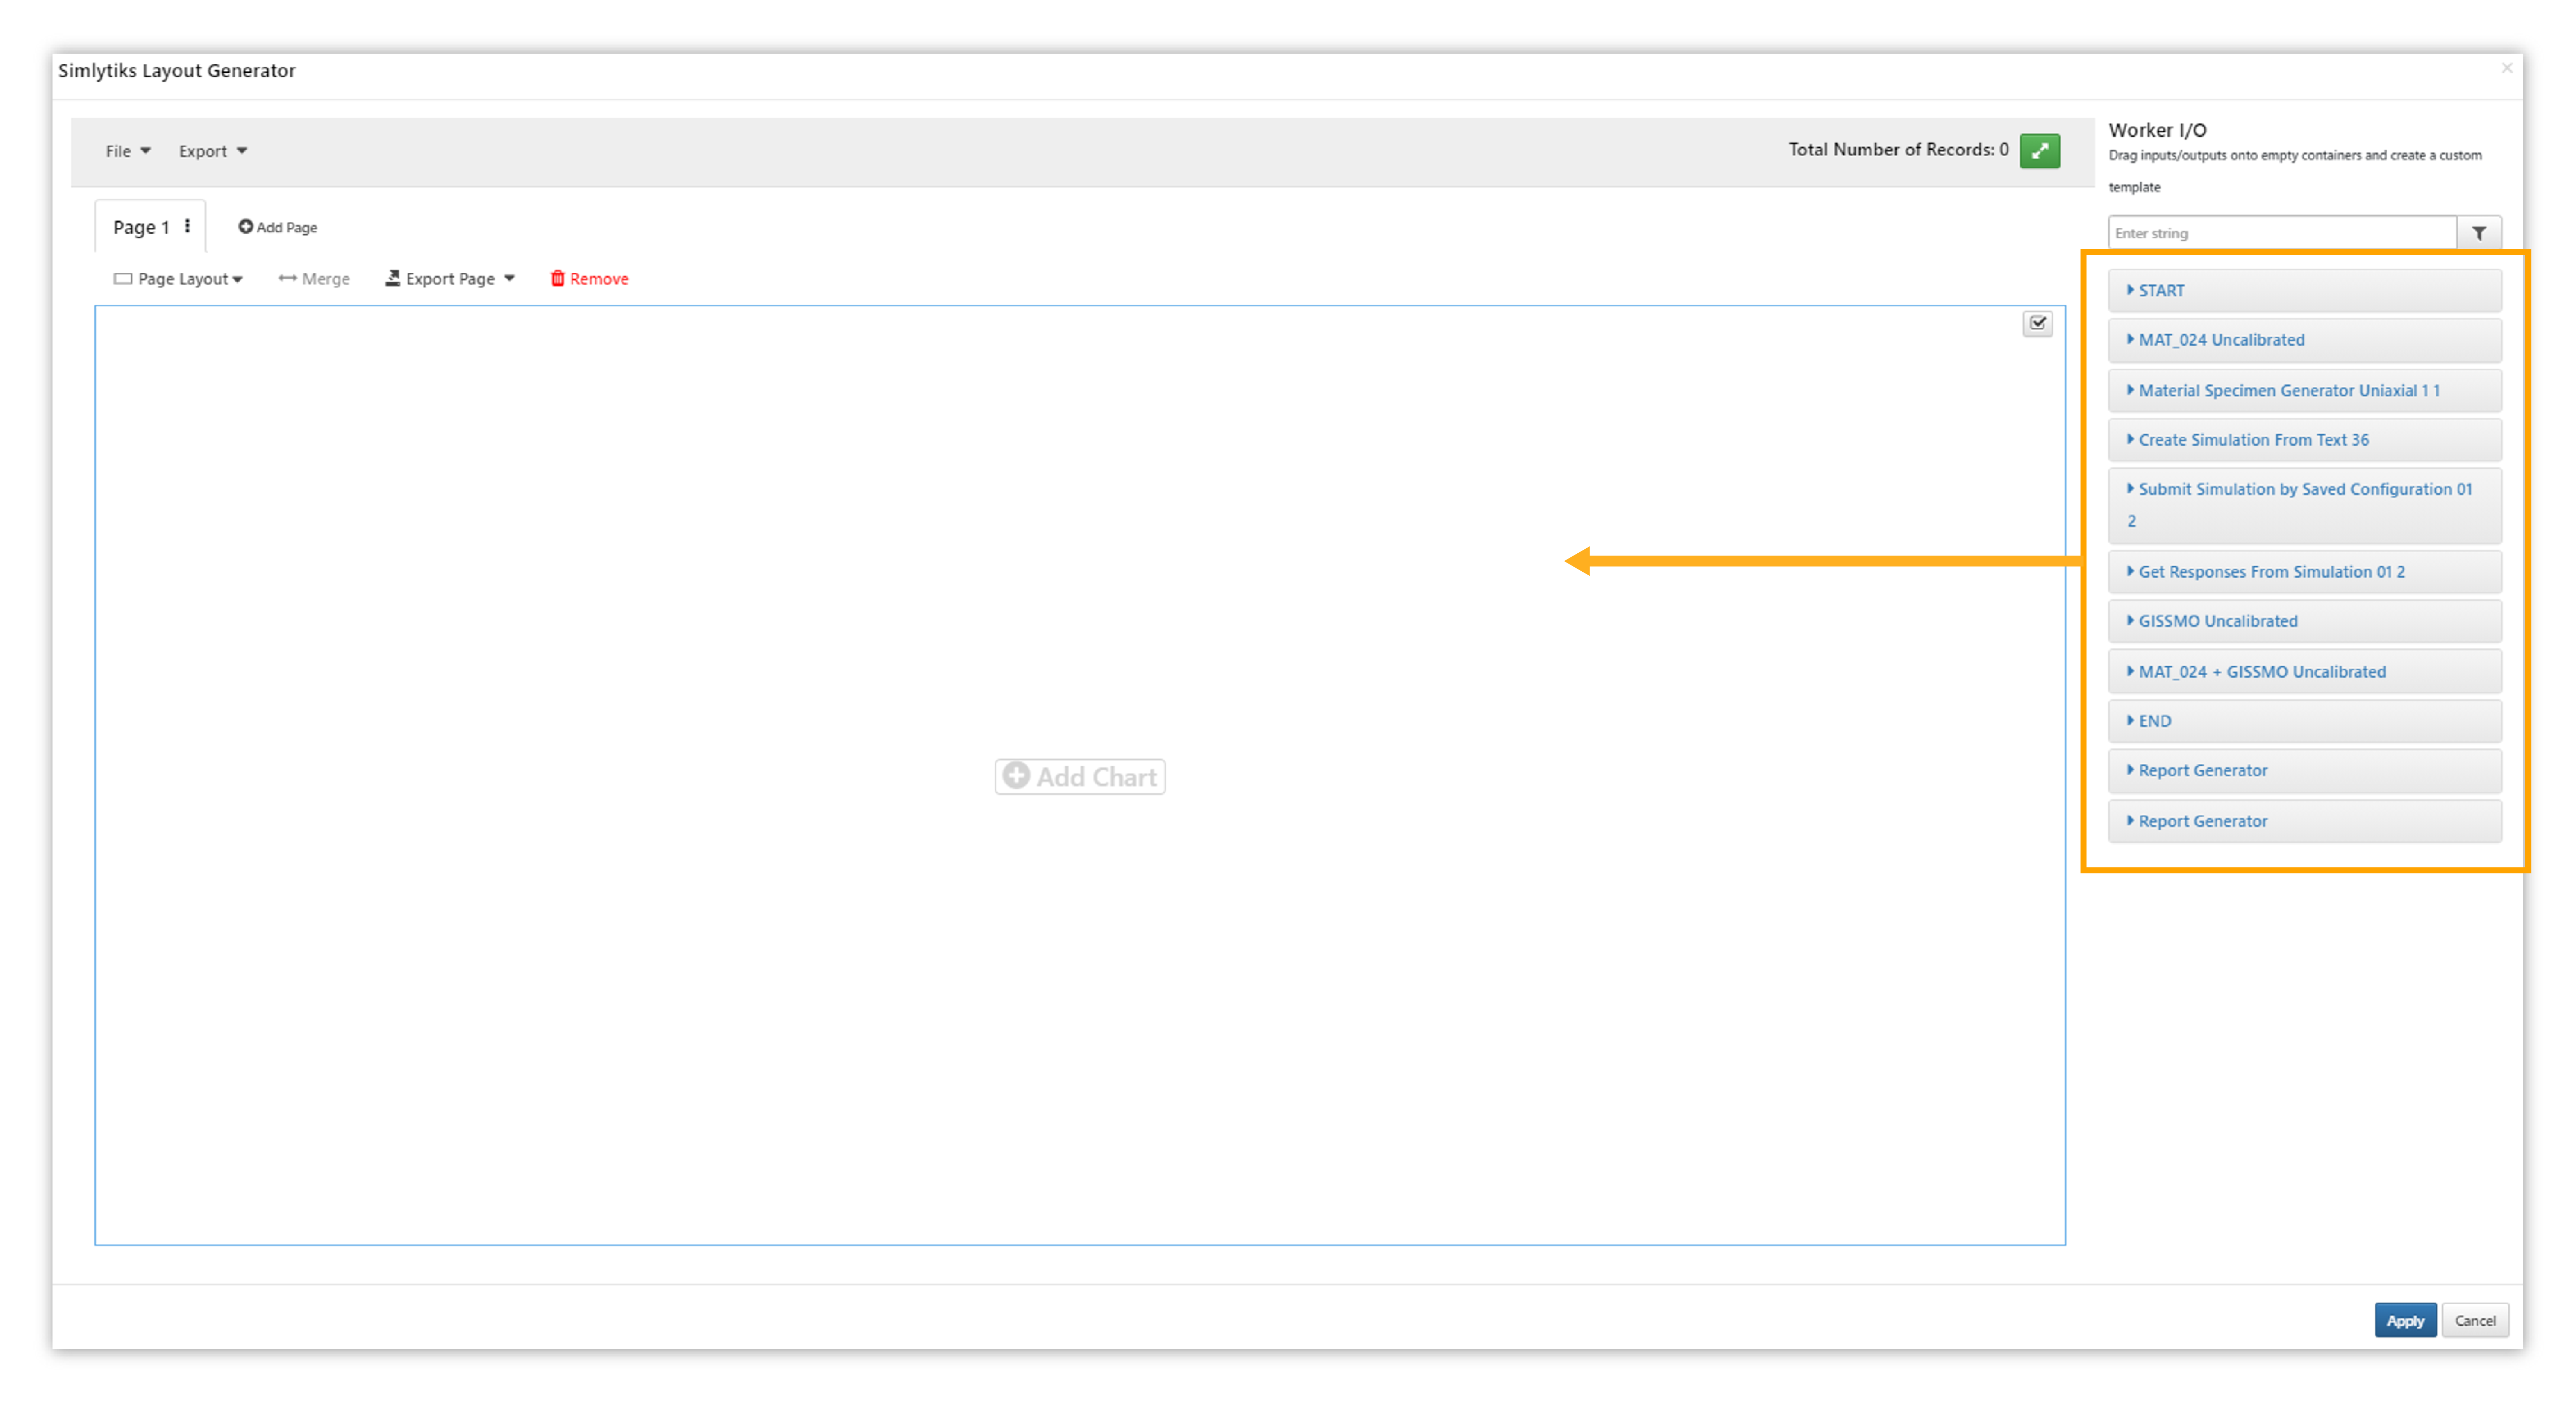
Figure 12: Add Charts
We can also add and edit pages similarly.
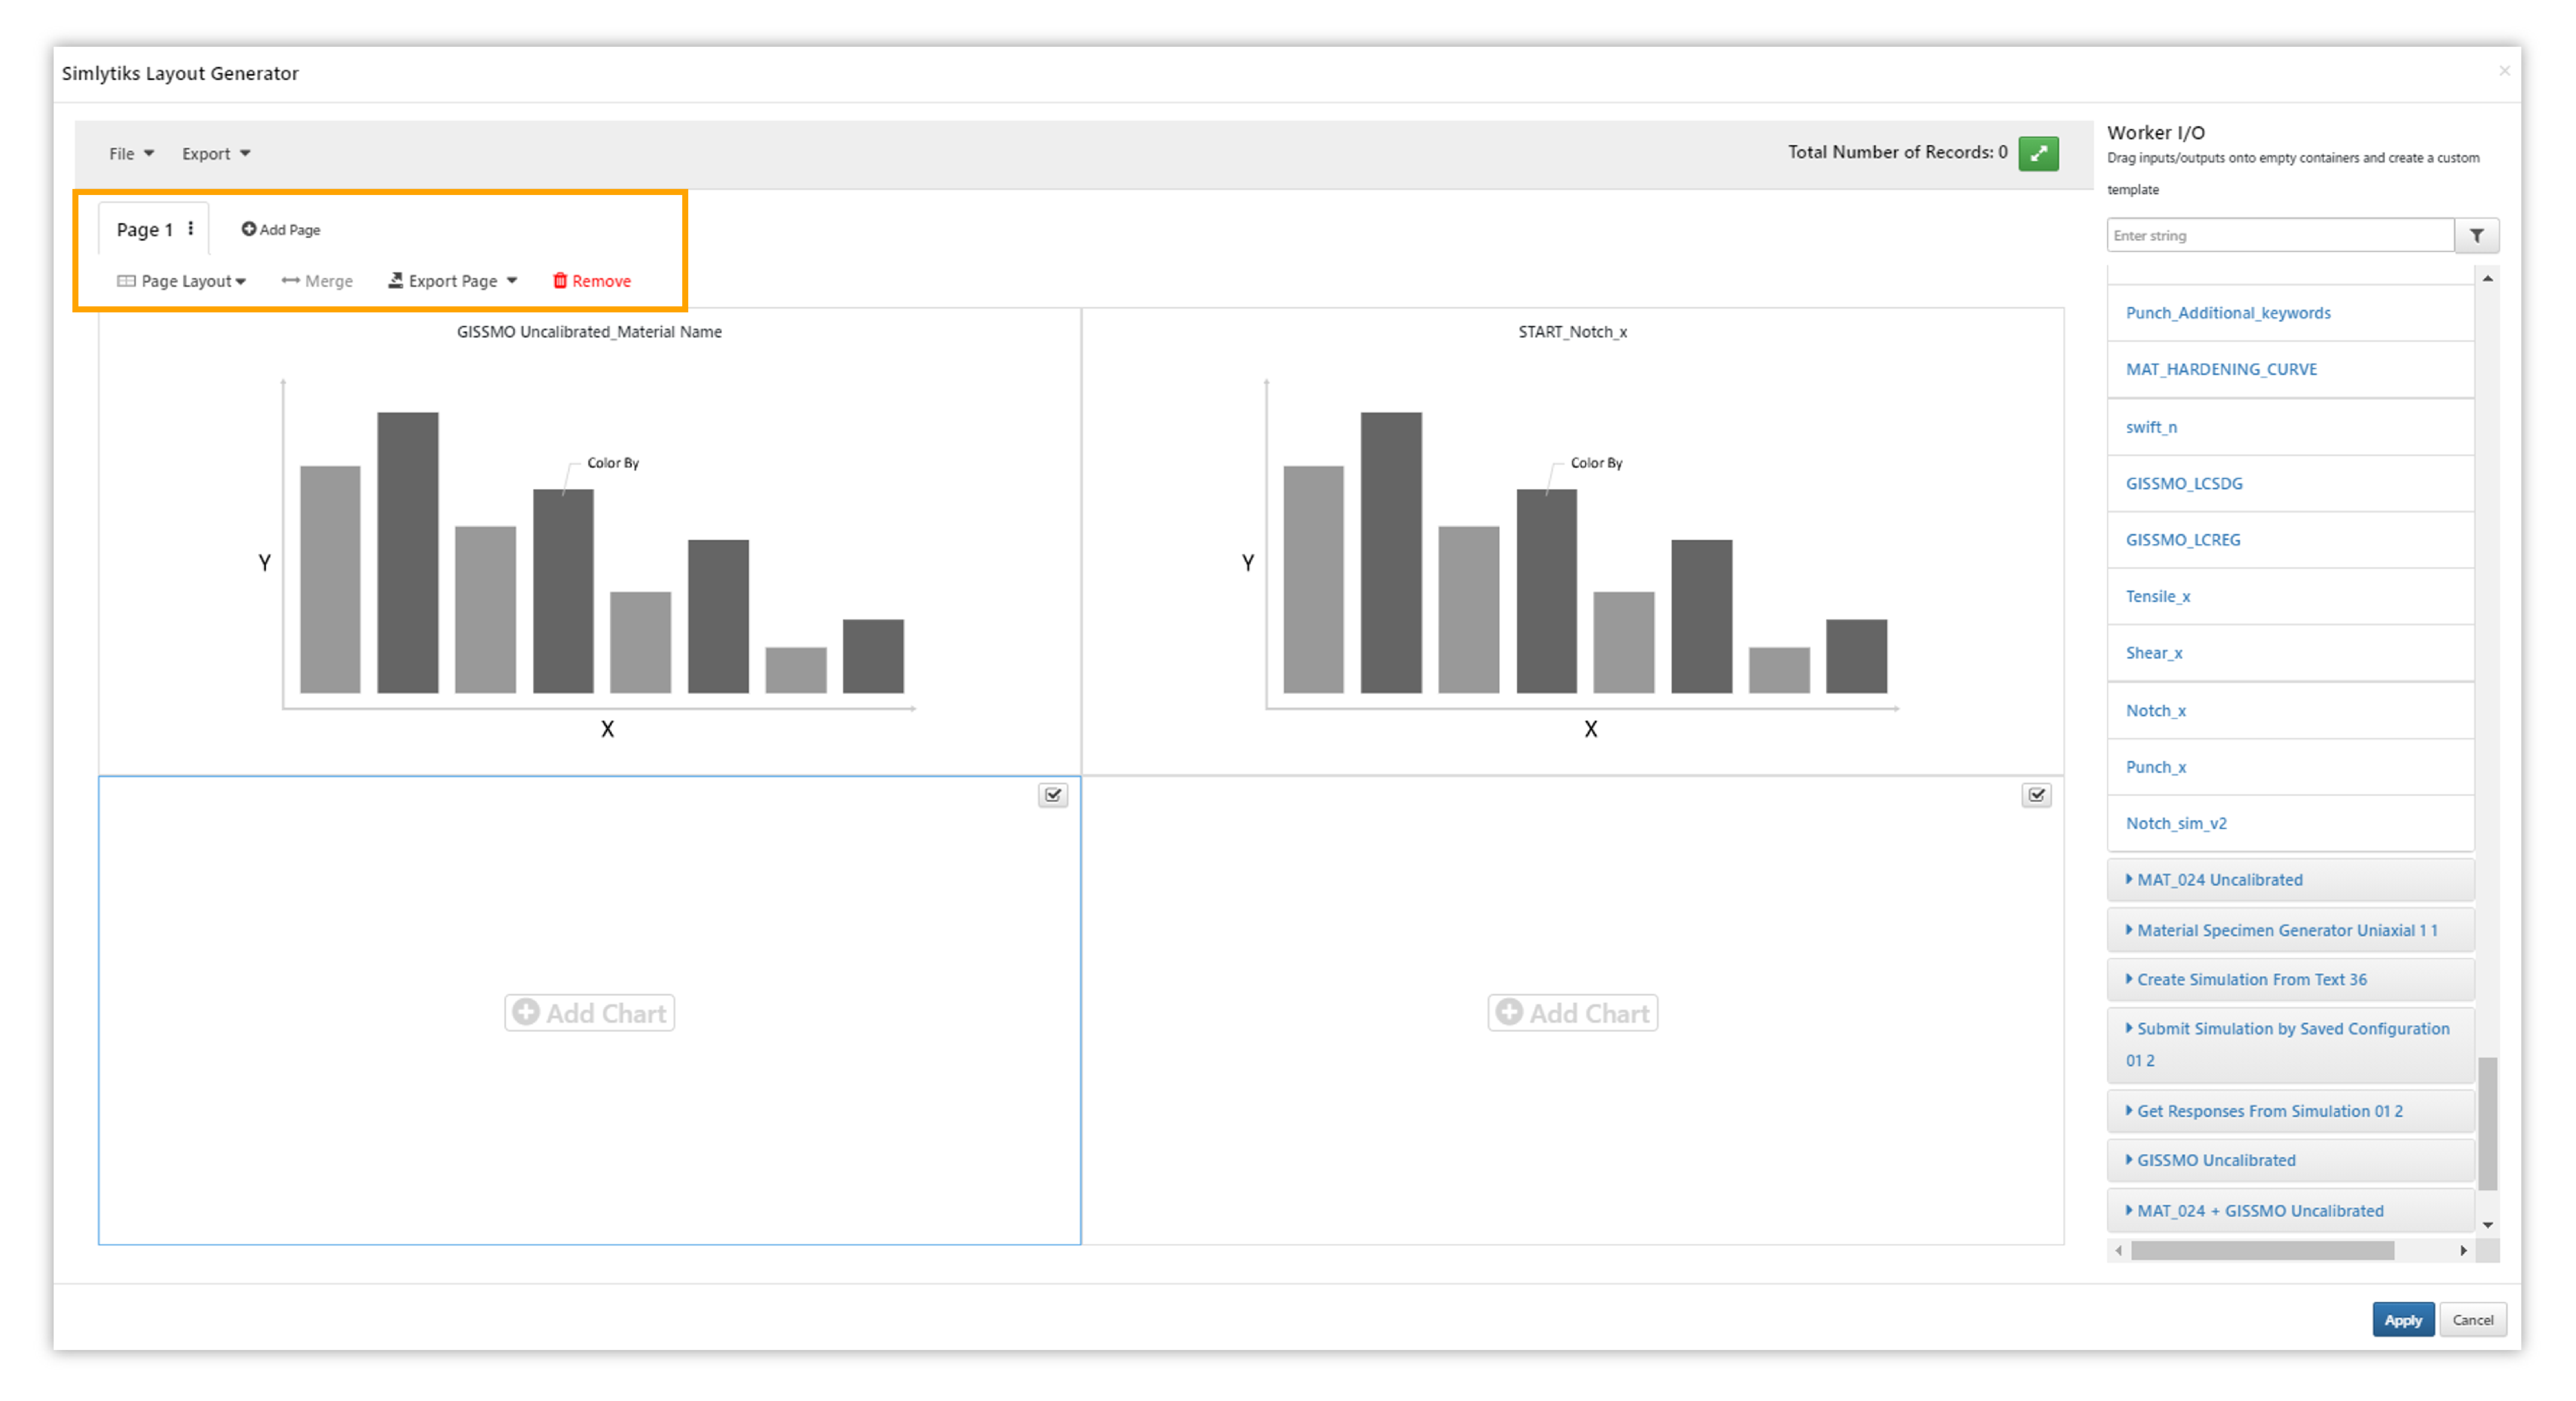
Figure 13: Edit Pages
The same visualization options can be found at the top right corner of the chart, where we can edit our chart. After adding and editing our charts, we’ll finish by clicking Apply at the bottom.
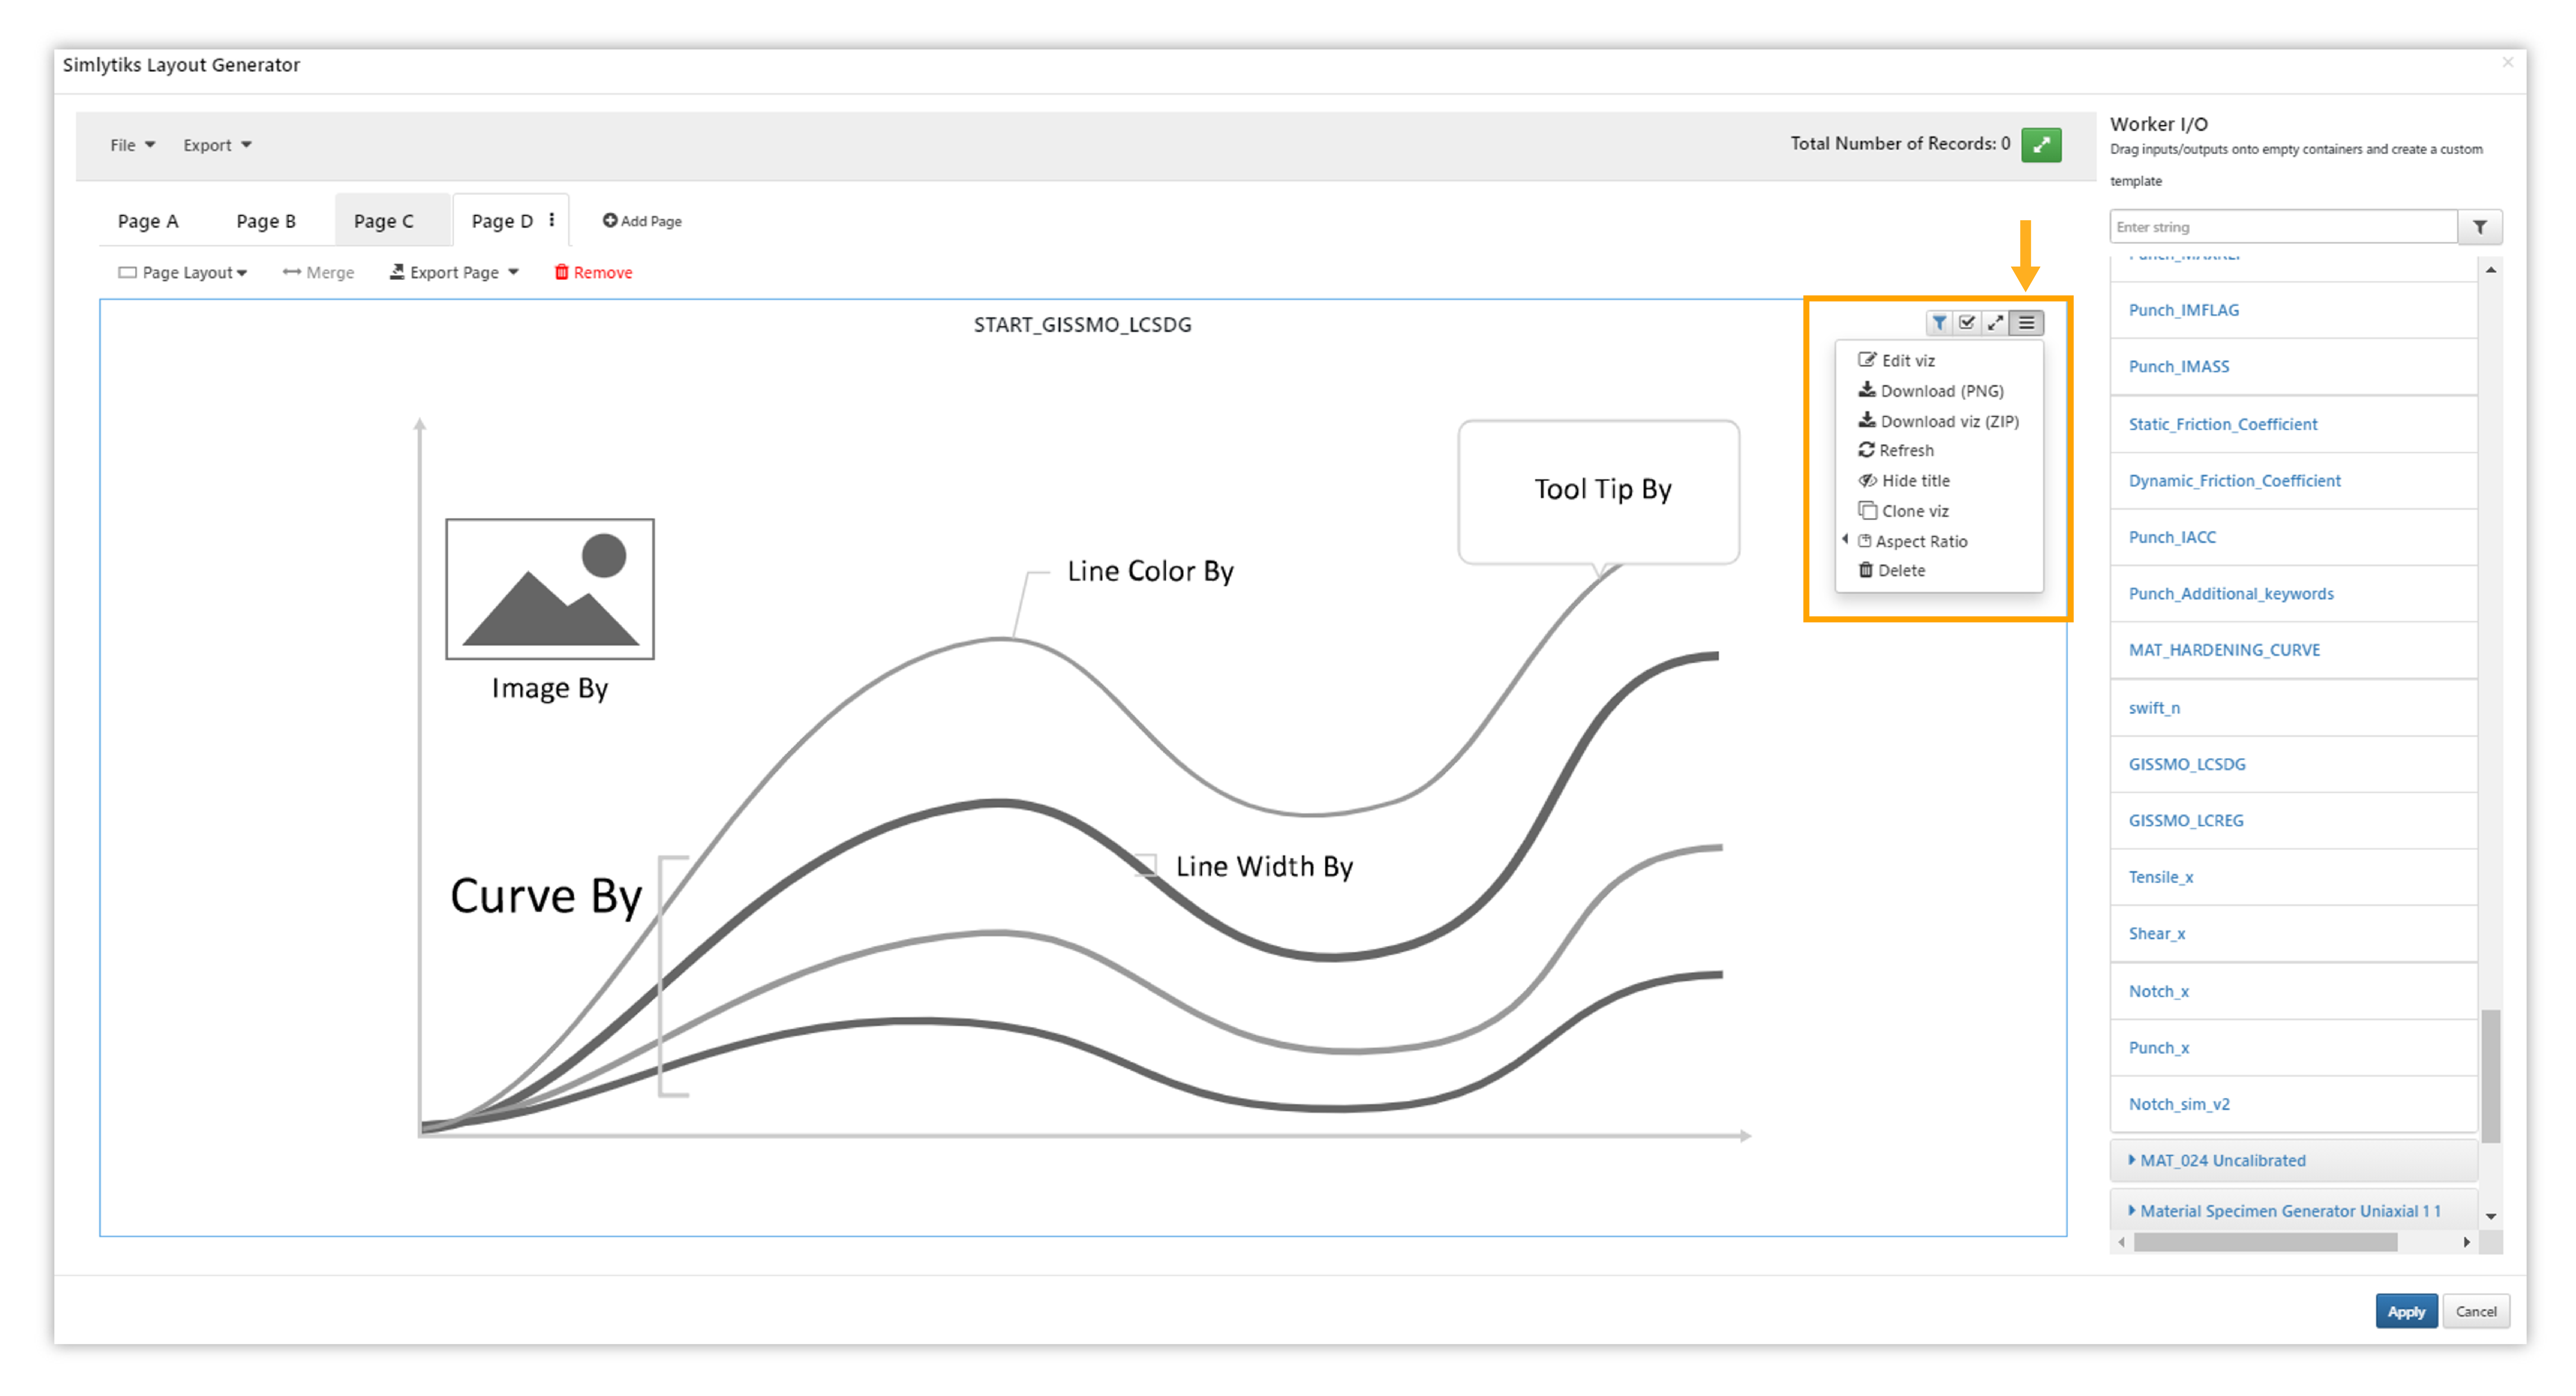
Figure 14: Visualization Options
The layout will be saved for Report Generation and records will be added automatically. Click on View Report to view and download a sharable PPTX file containing all the information added in the Reporter.
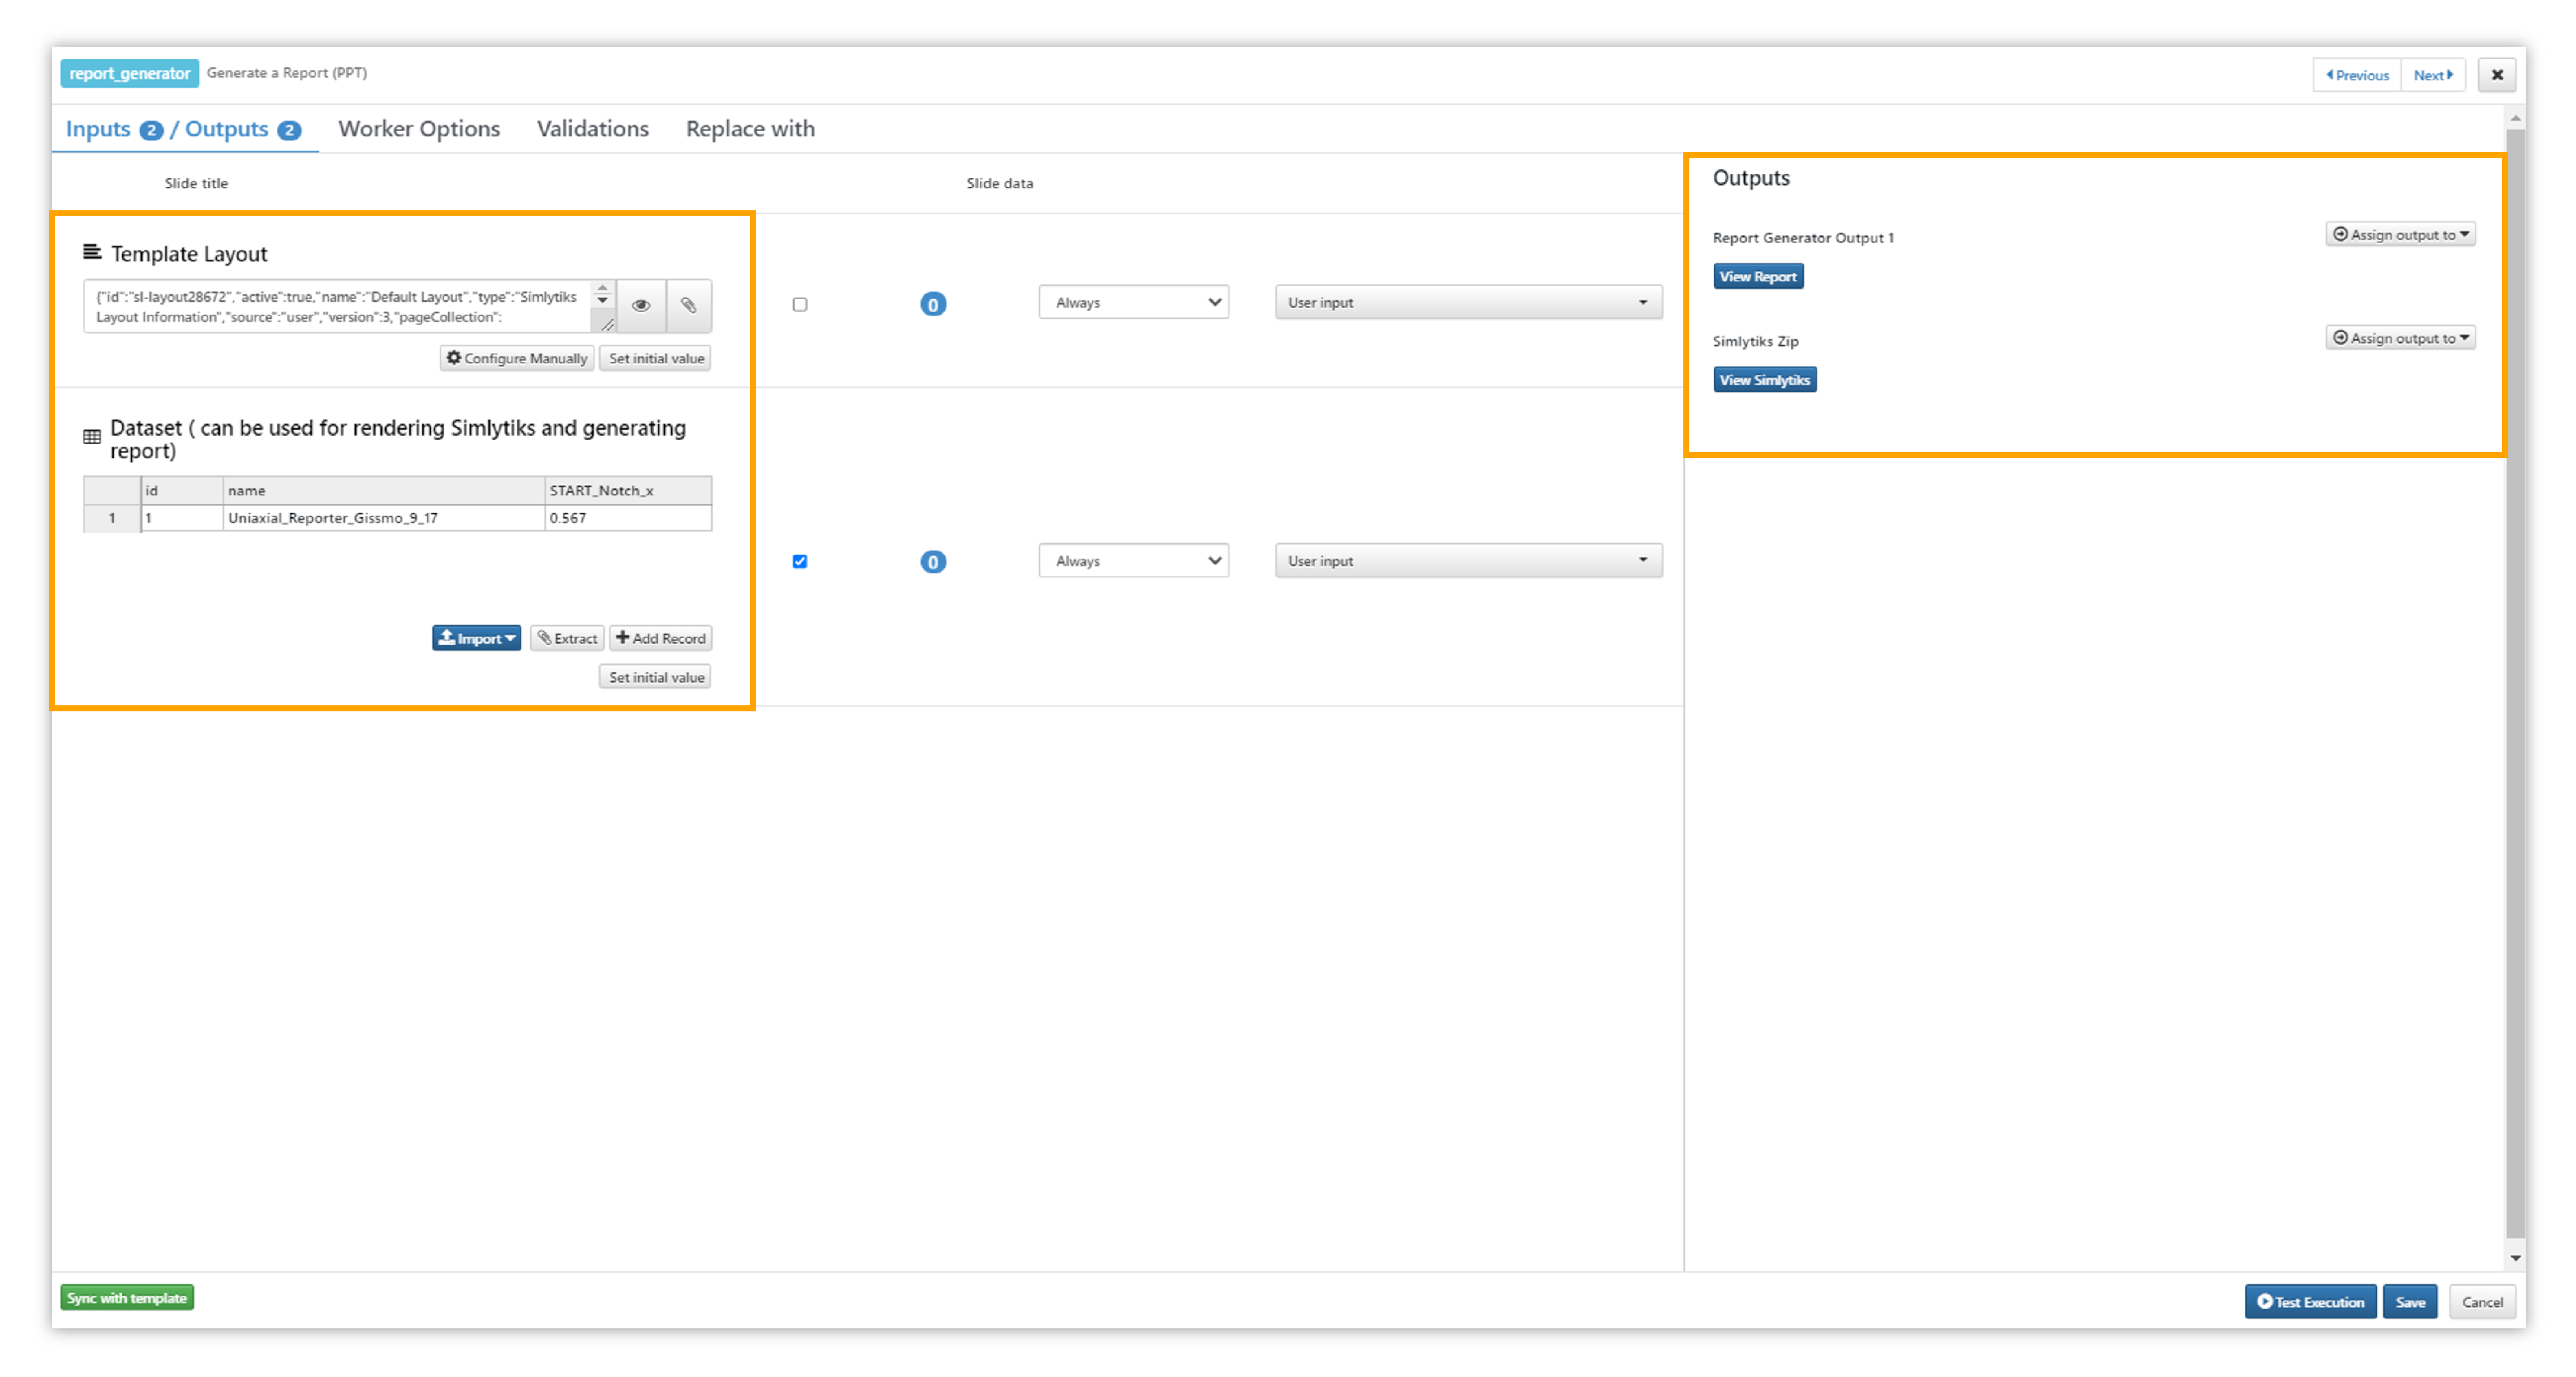
Figure 15: Report Generation & View Report
The video below shows how to create a reporter layout for a material calibration workflow.
Security
Simlytiks provides quick options for adding background images or watermarks to our chart to implement copyrights and insure security. Both of these options can be found under the right-click menu of a chart.
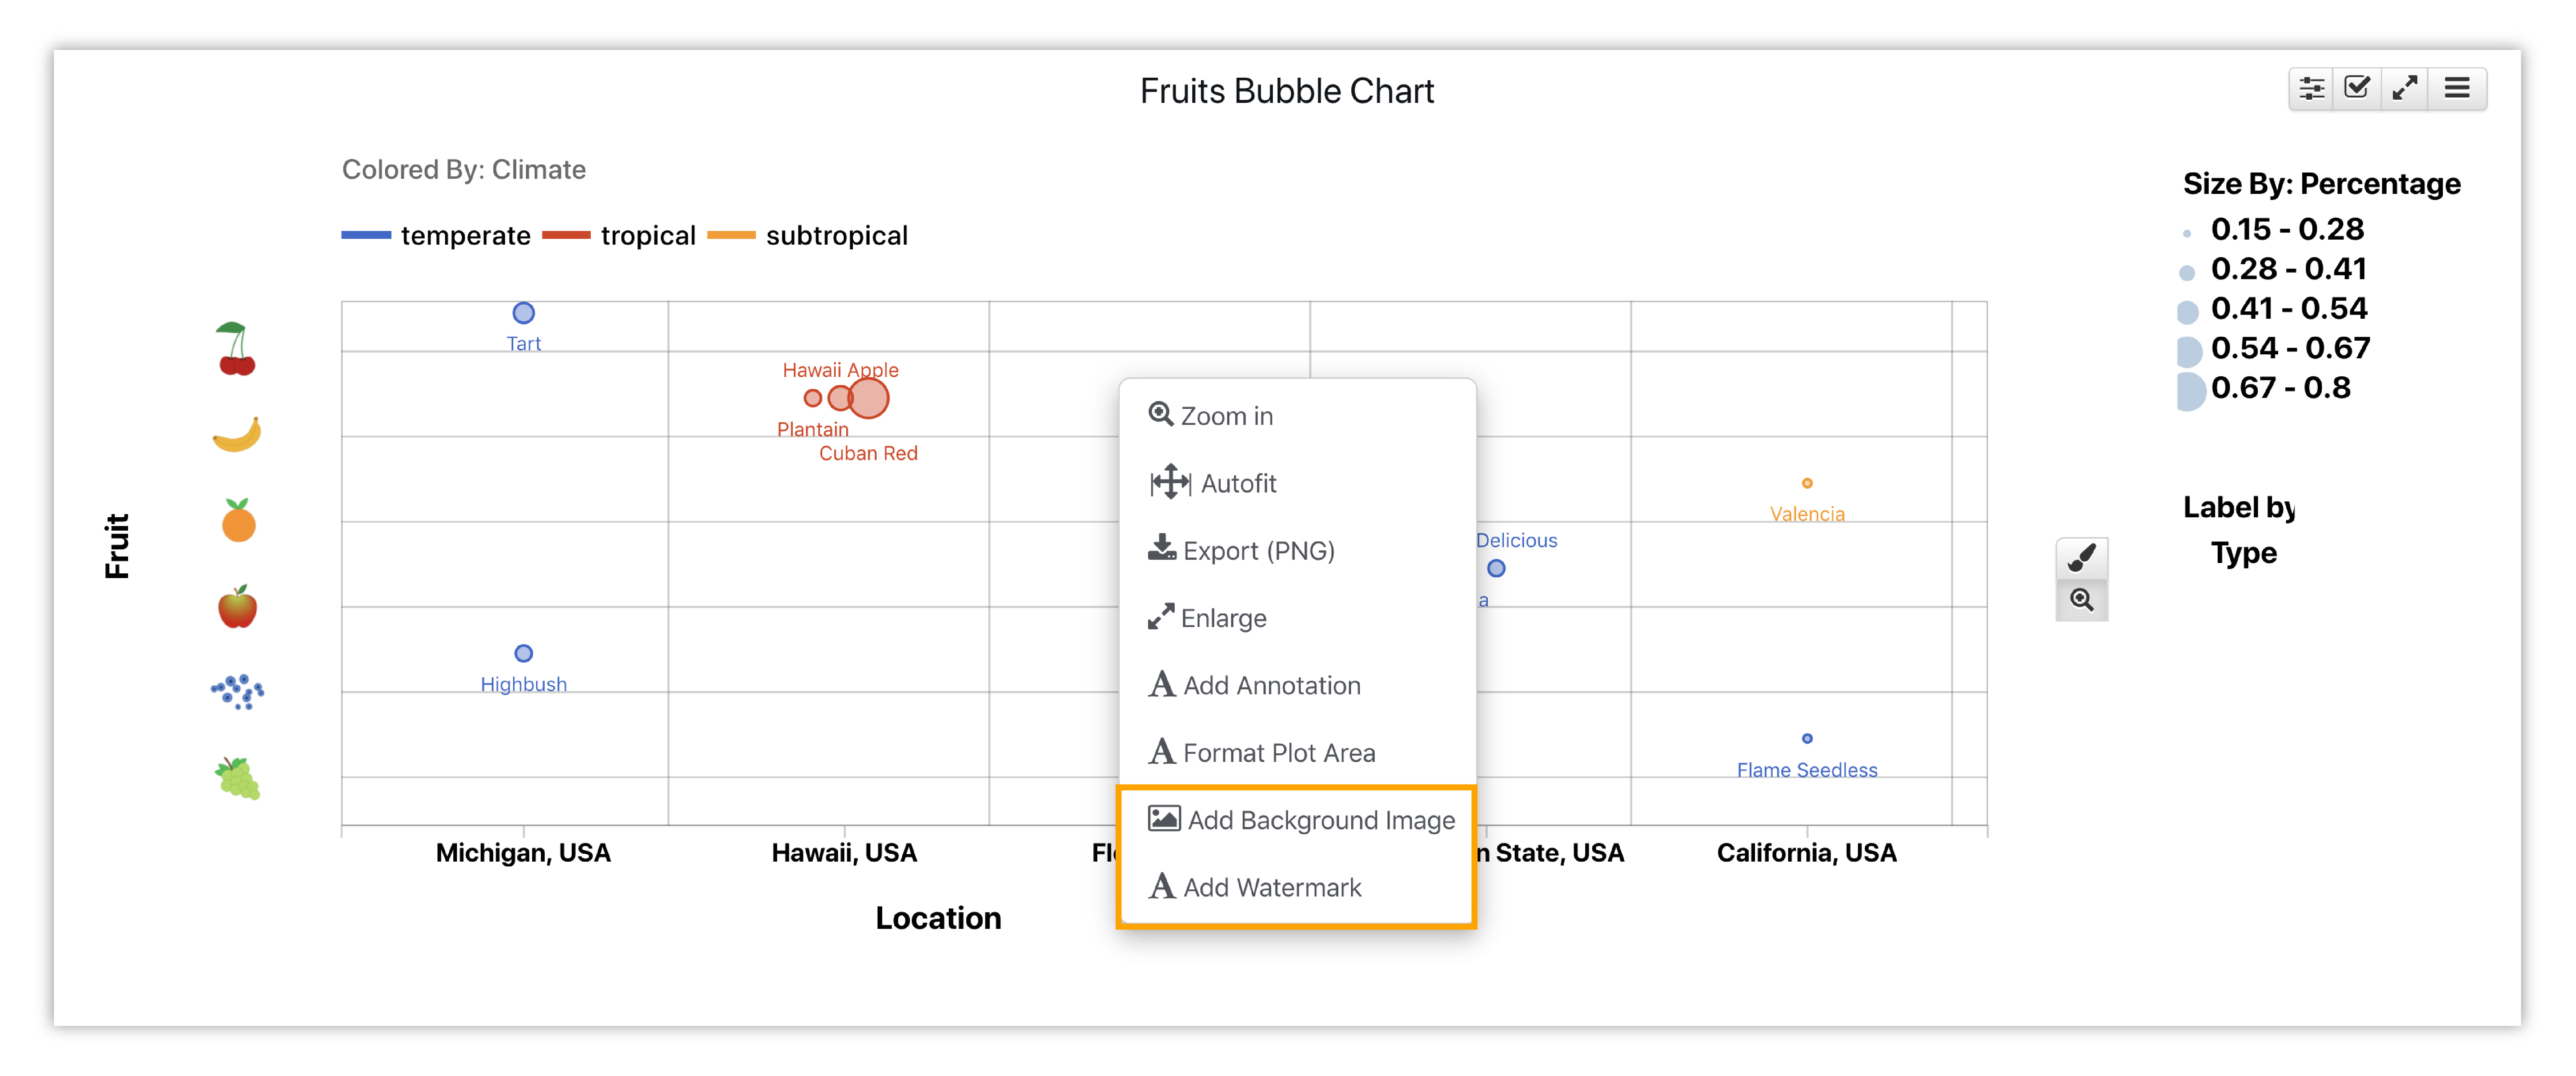
Figure 16: Right-Click Menu Security Options
Watermarking
Watermarking a chart involves inputting text to be implemented in the background of a chart.
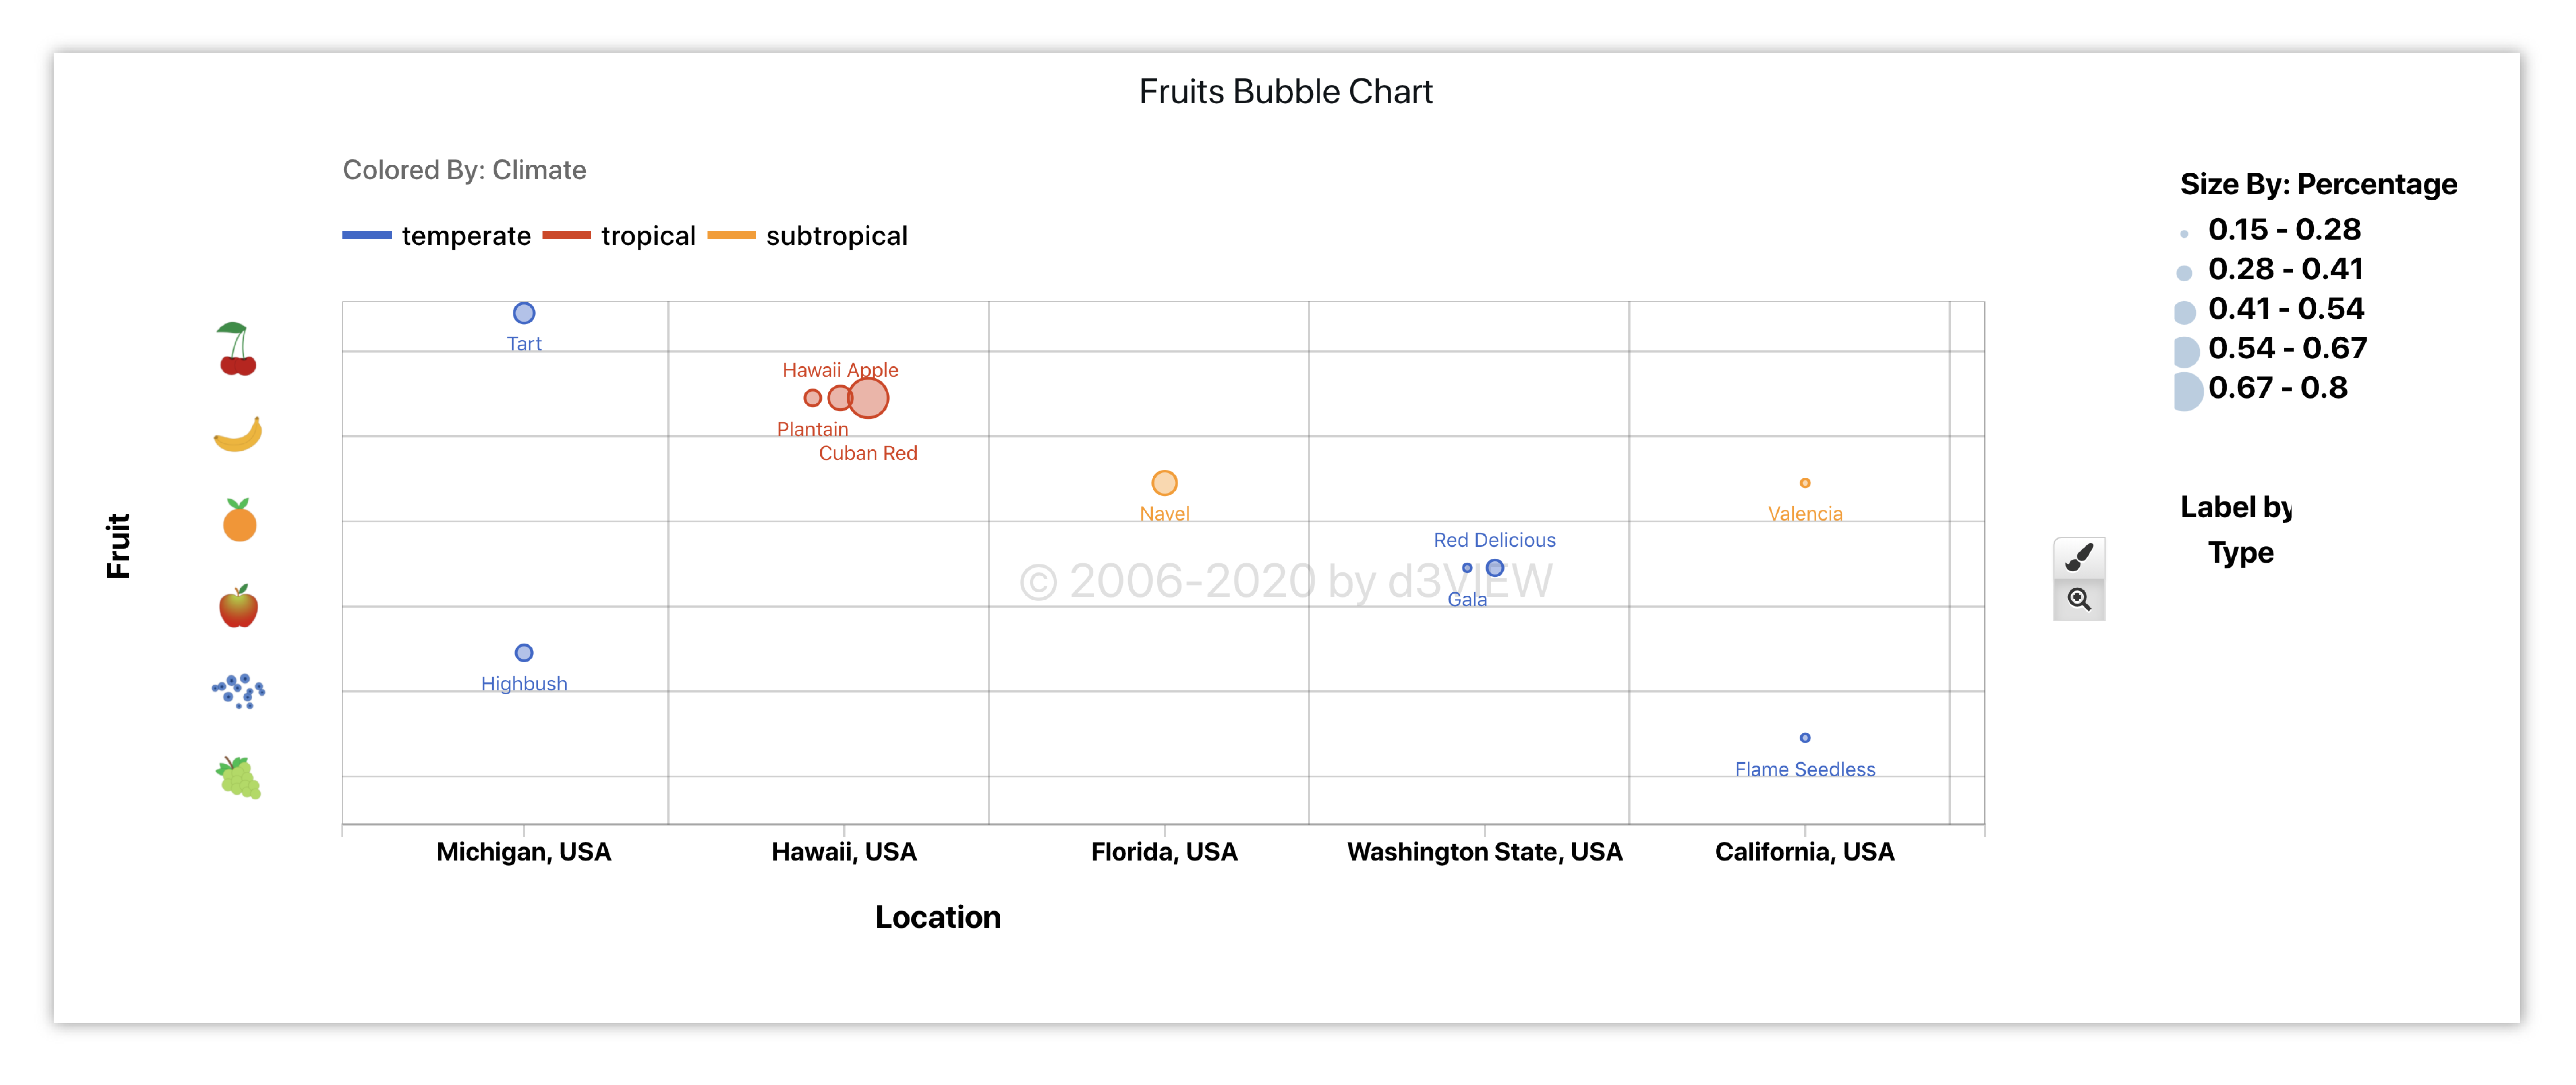
Figure 17: Watermark Example
Watch the video below to see how it’s done:
Background Image
Similar to watermarking, a background image, such as a trademarked logo, can be added with low opacity behind our chart.
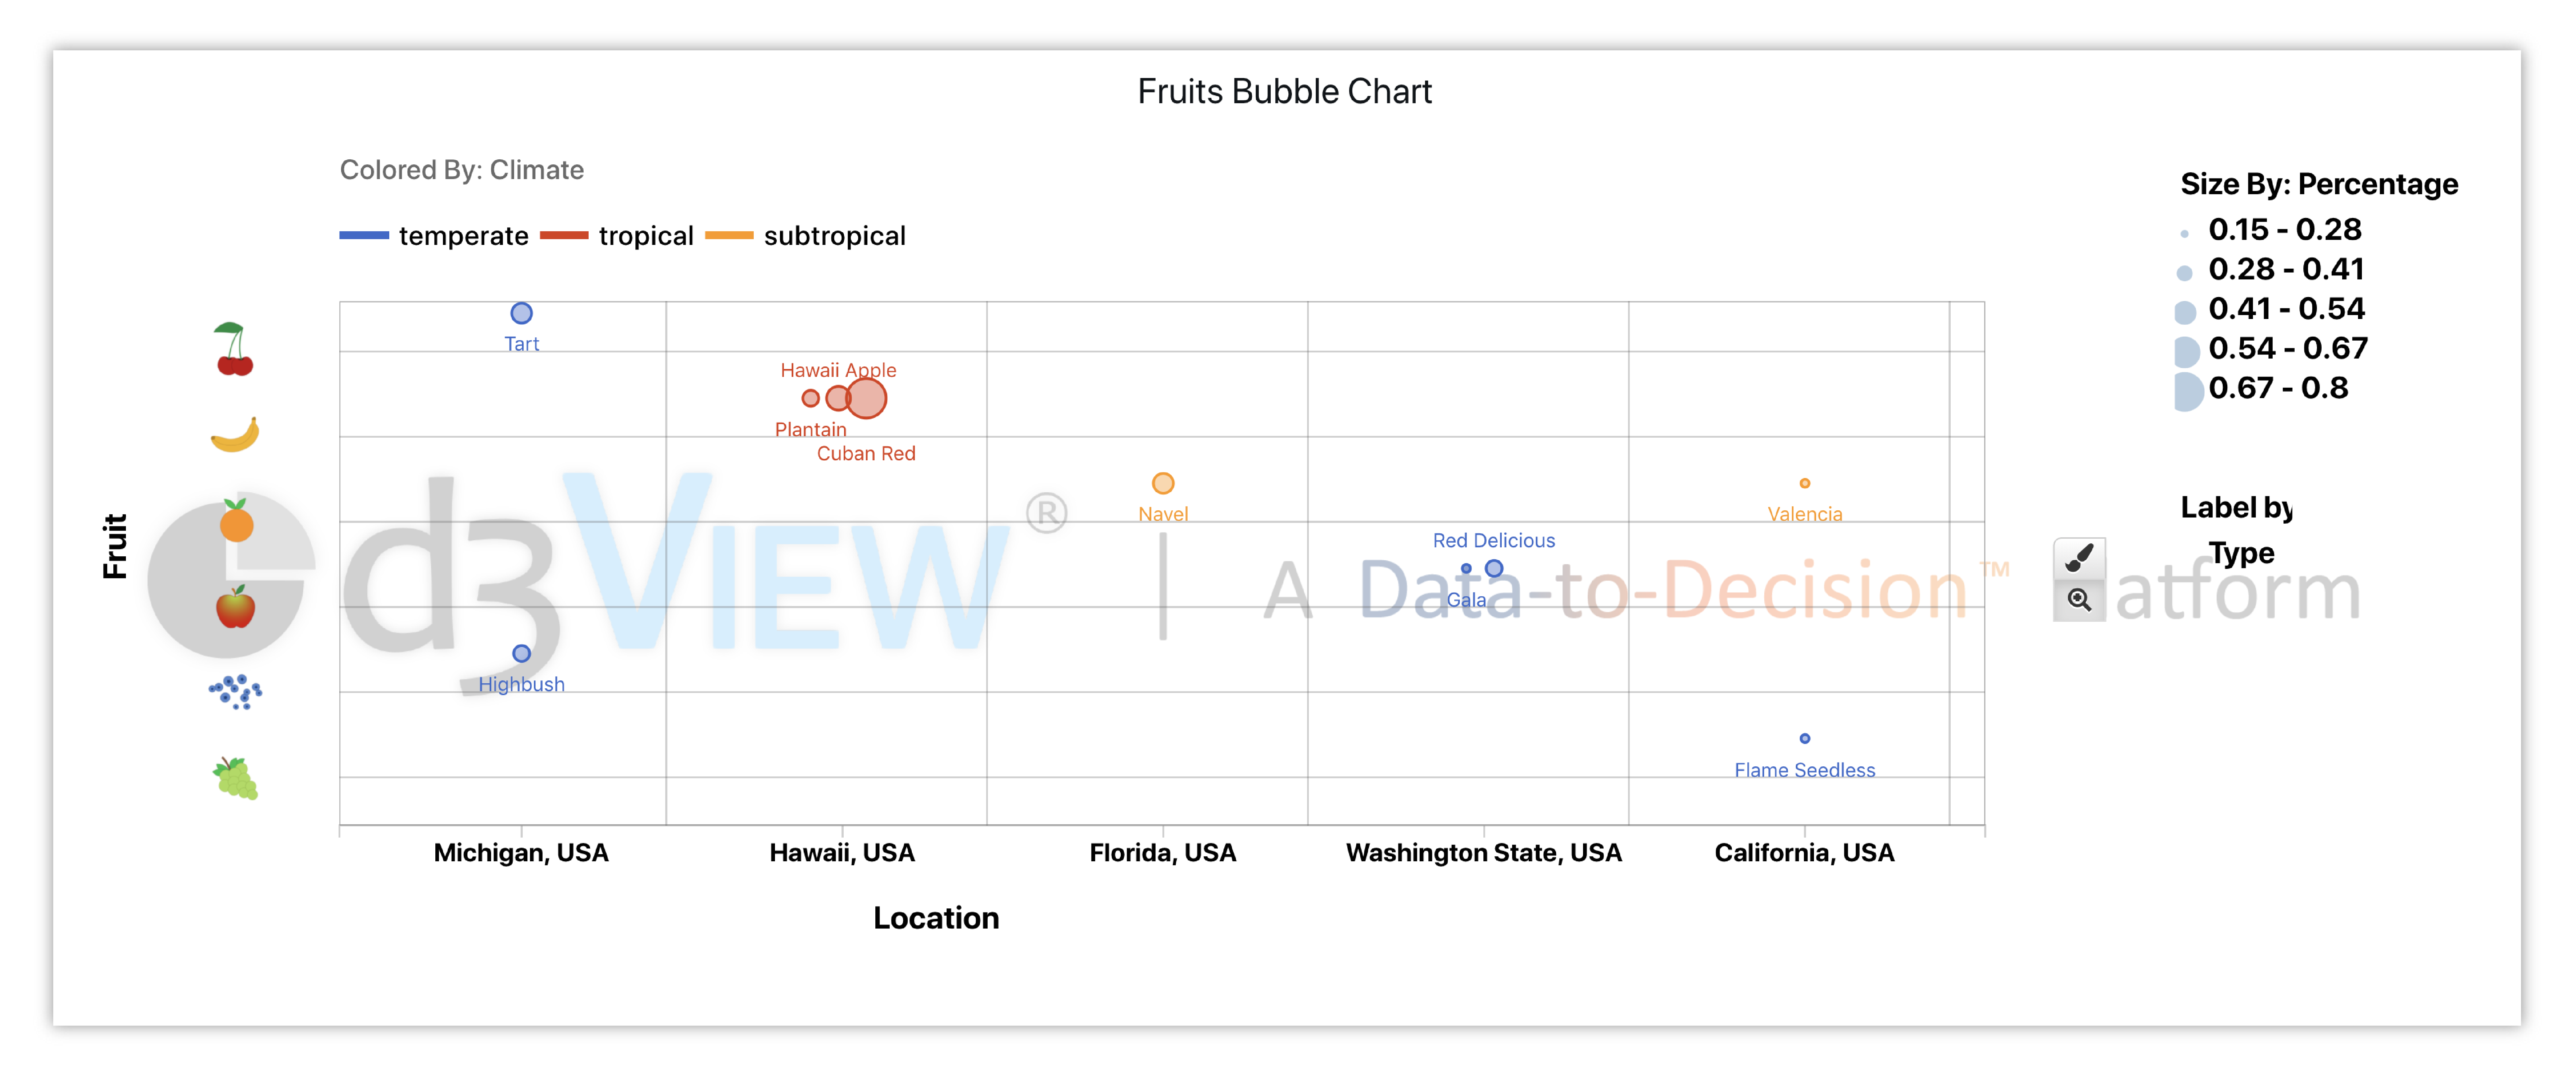
Figure 18: Background Image Example
We can do this by right-clicking and choosing this option in the menu. Drag-and-drop or click-to-upload the desired image into the pop-up window. The image will automatically appear with lowered opacity in the background of the chart. Right-click again to remove the background image if needed.
Watch the video below to see how it’s done: