
3.  Importing Data
Simlytiks allows for visualizations to be organized per imported data source, so we can keep certain visualized information separate from other visualized information.
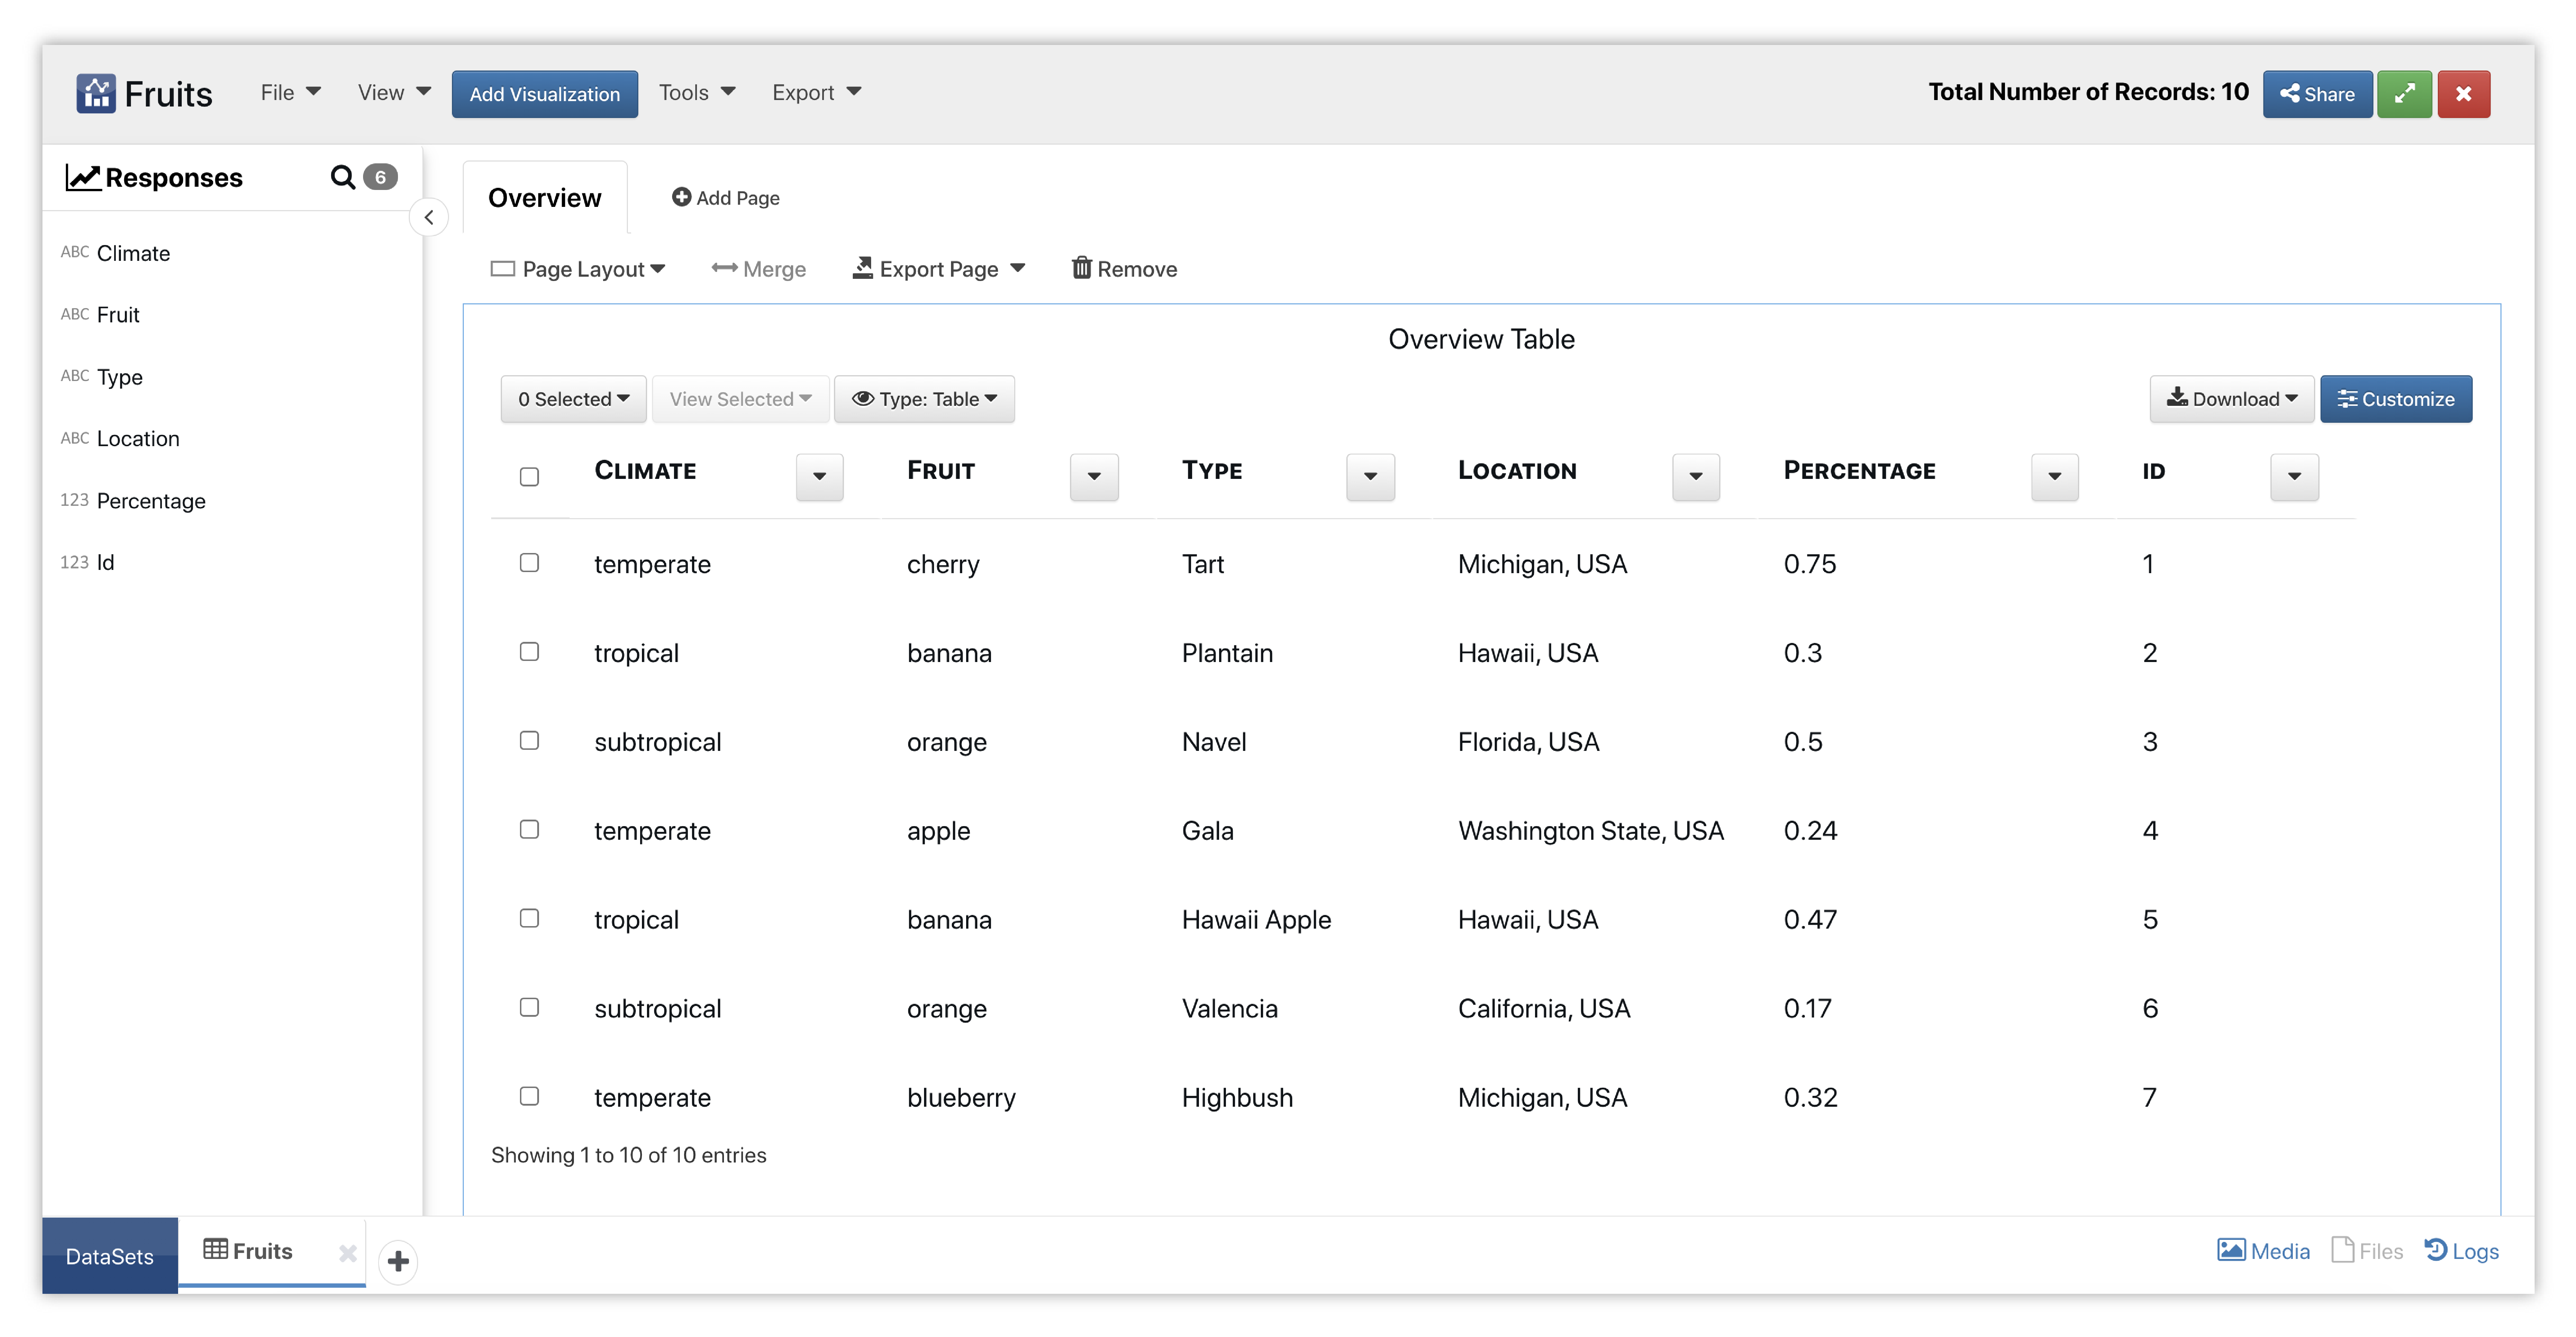
Initial View After Importing Data
To learn how to access the Simlytiks Application, please review this section.
The landing page allows us to upload new datasets, sift through and open saved dashboards, and drag-and-drop files quickly into the application.
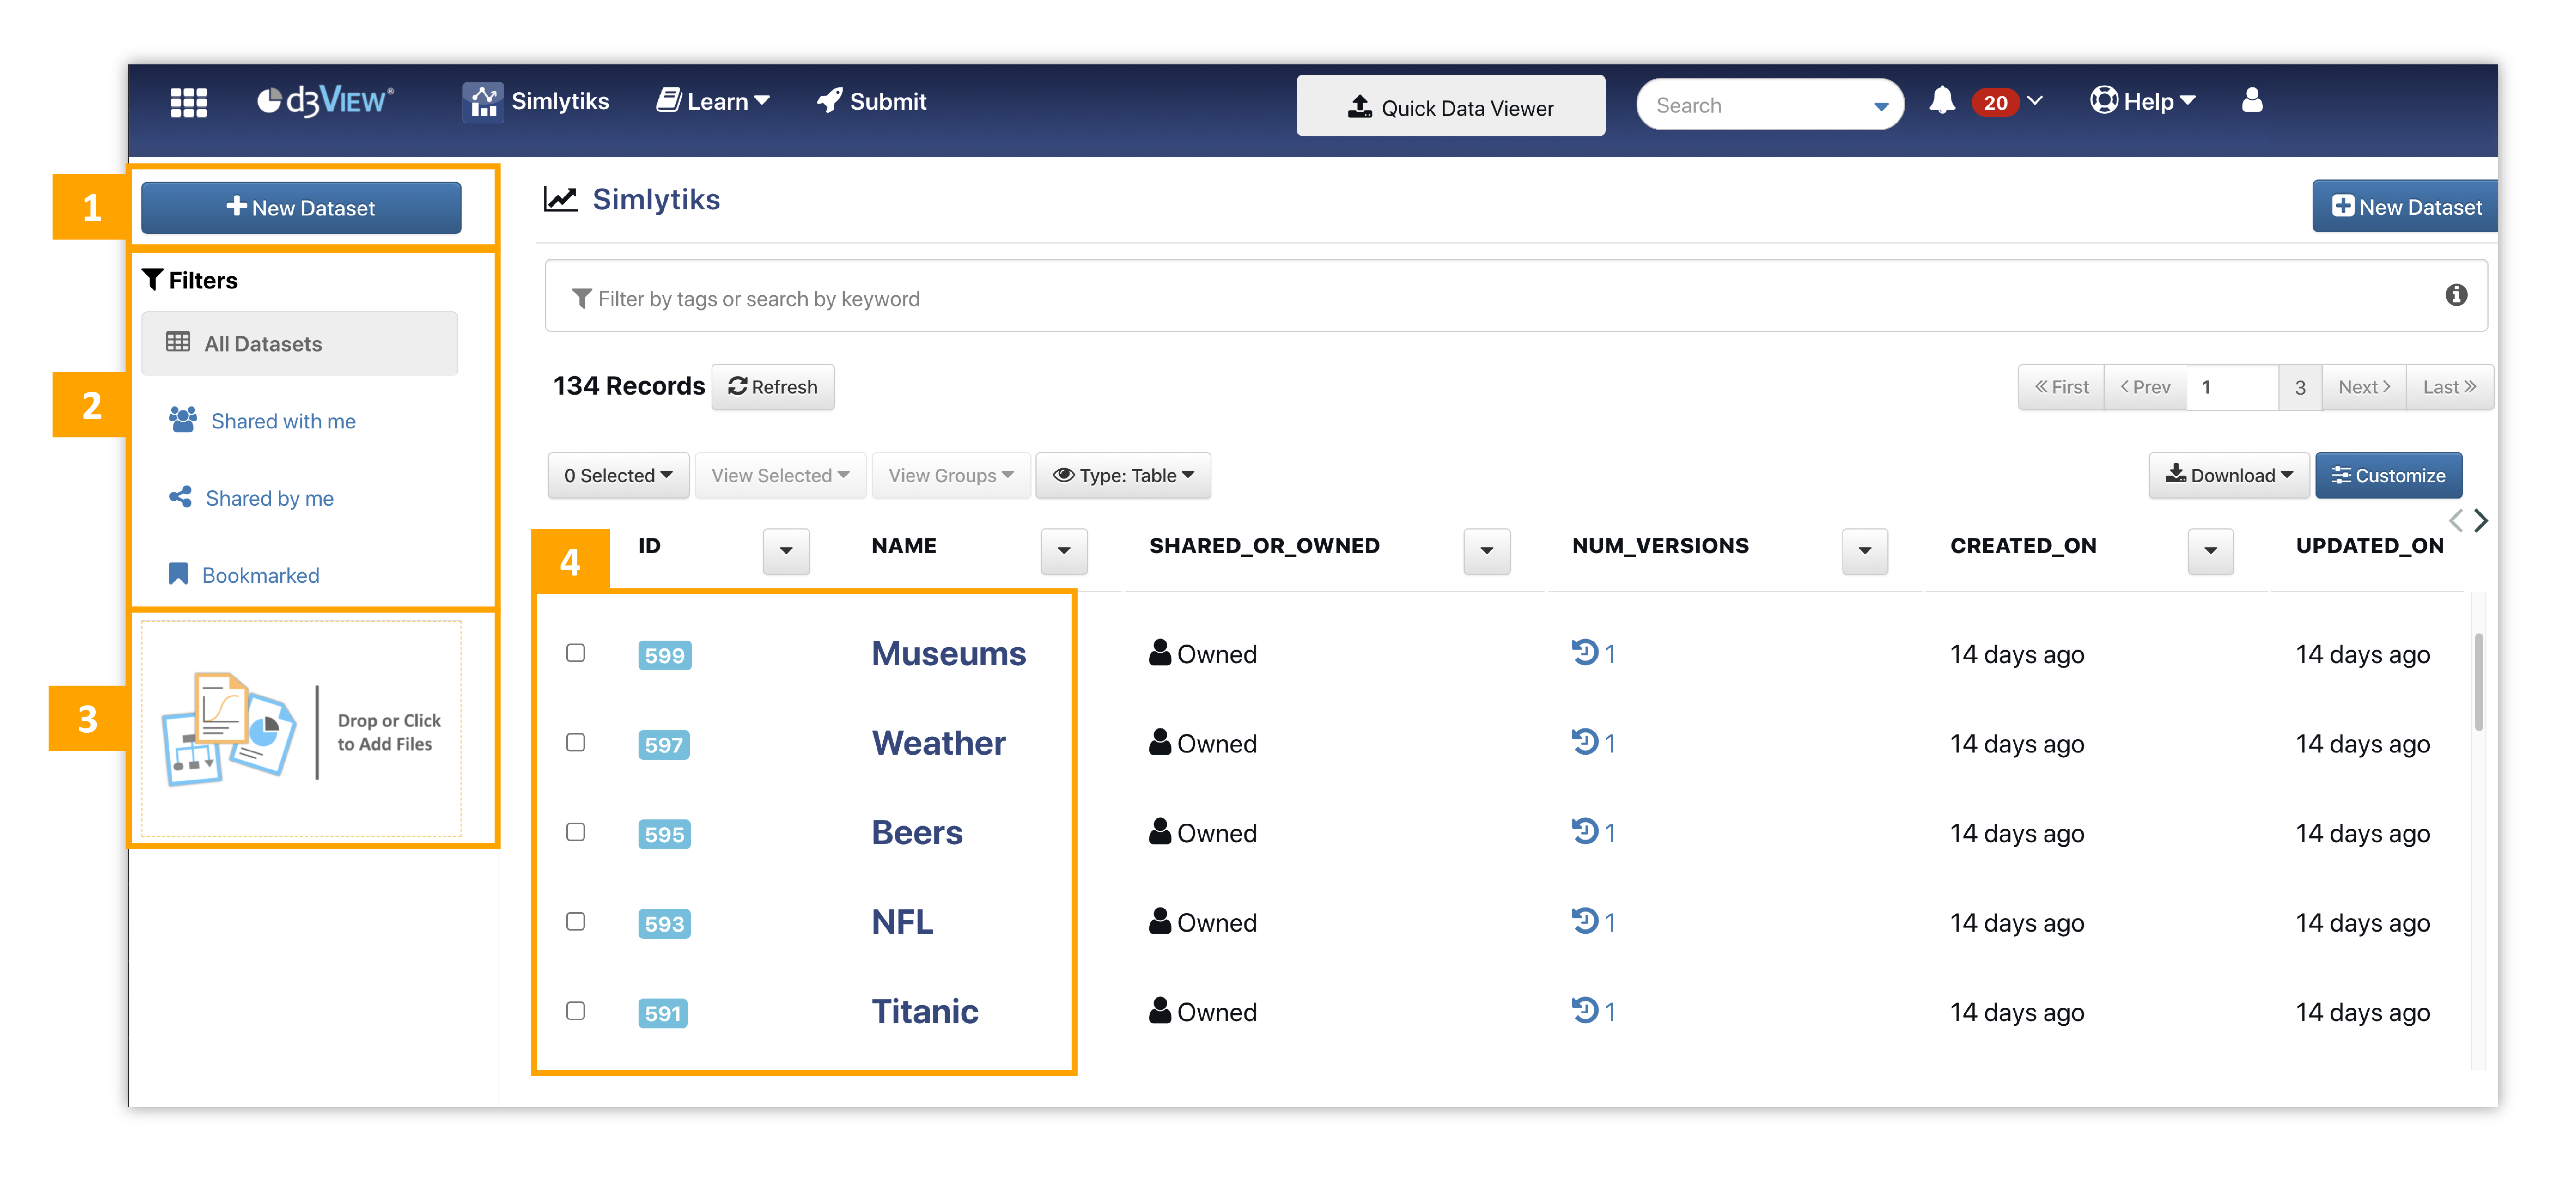
Figure 1: Simlytiks Landing Page
- New Dataset: Click this button to upload a dataset in Simlytiks and start creating a dashboard.
- Filters: Click on a basic filter to search through saved Simlytiks dashboards in the data table.
- Drop Box: Drag-and-drop or click-to-upload files to open as a dataset in Simlytiks.
- Saved Simlytiks Dashboards: Click on a dashboard name to reopen it in Simlytiks.
We can add data to explore in four main ways. Start by clicking on + New Dataset in the top left corner of the page to open the modal window for uploading data. Each tab in the modal contains each way for uploading data. Read on to learn about these.
Import From File
Upload data from our local machine by dragging-and-dropping files or clicking to open the local files window.
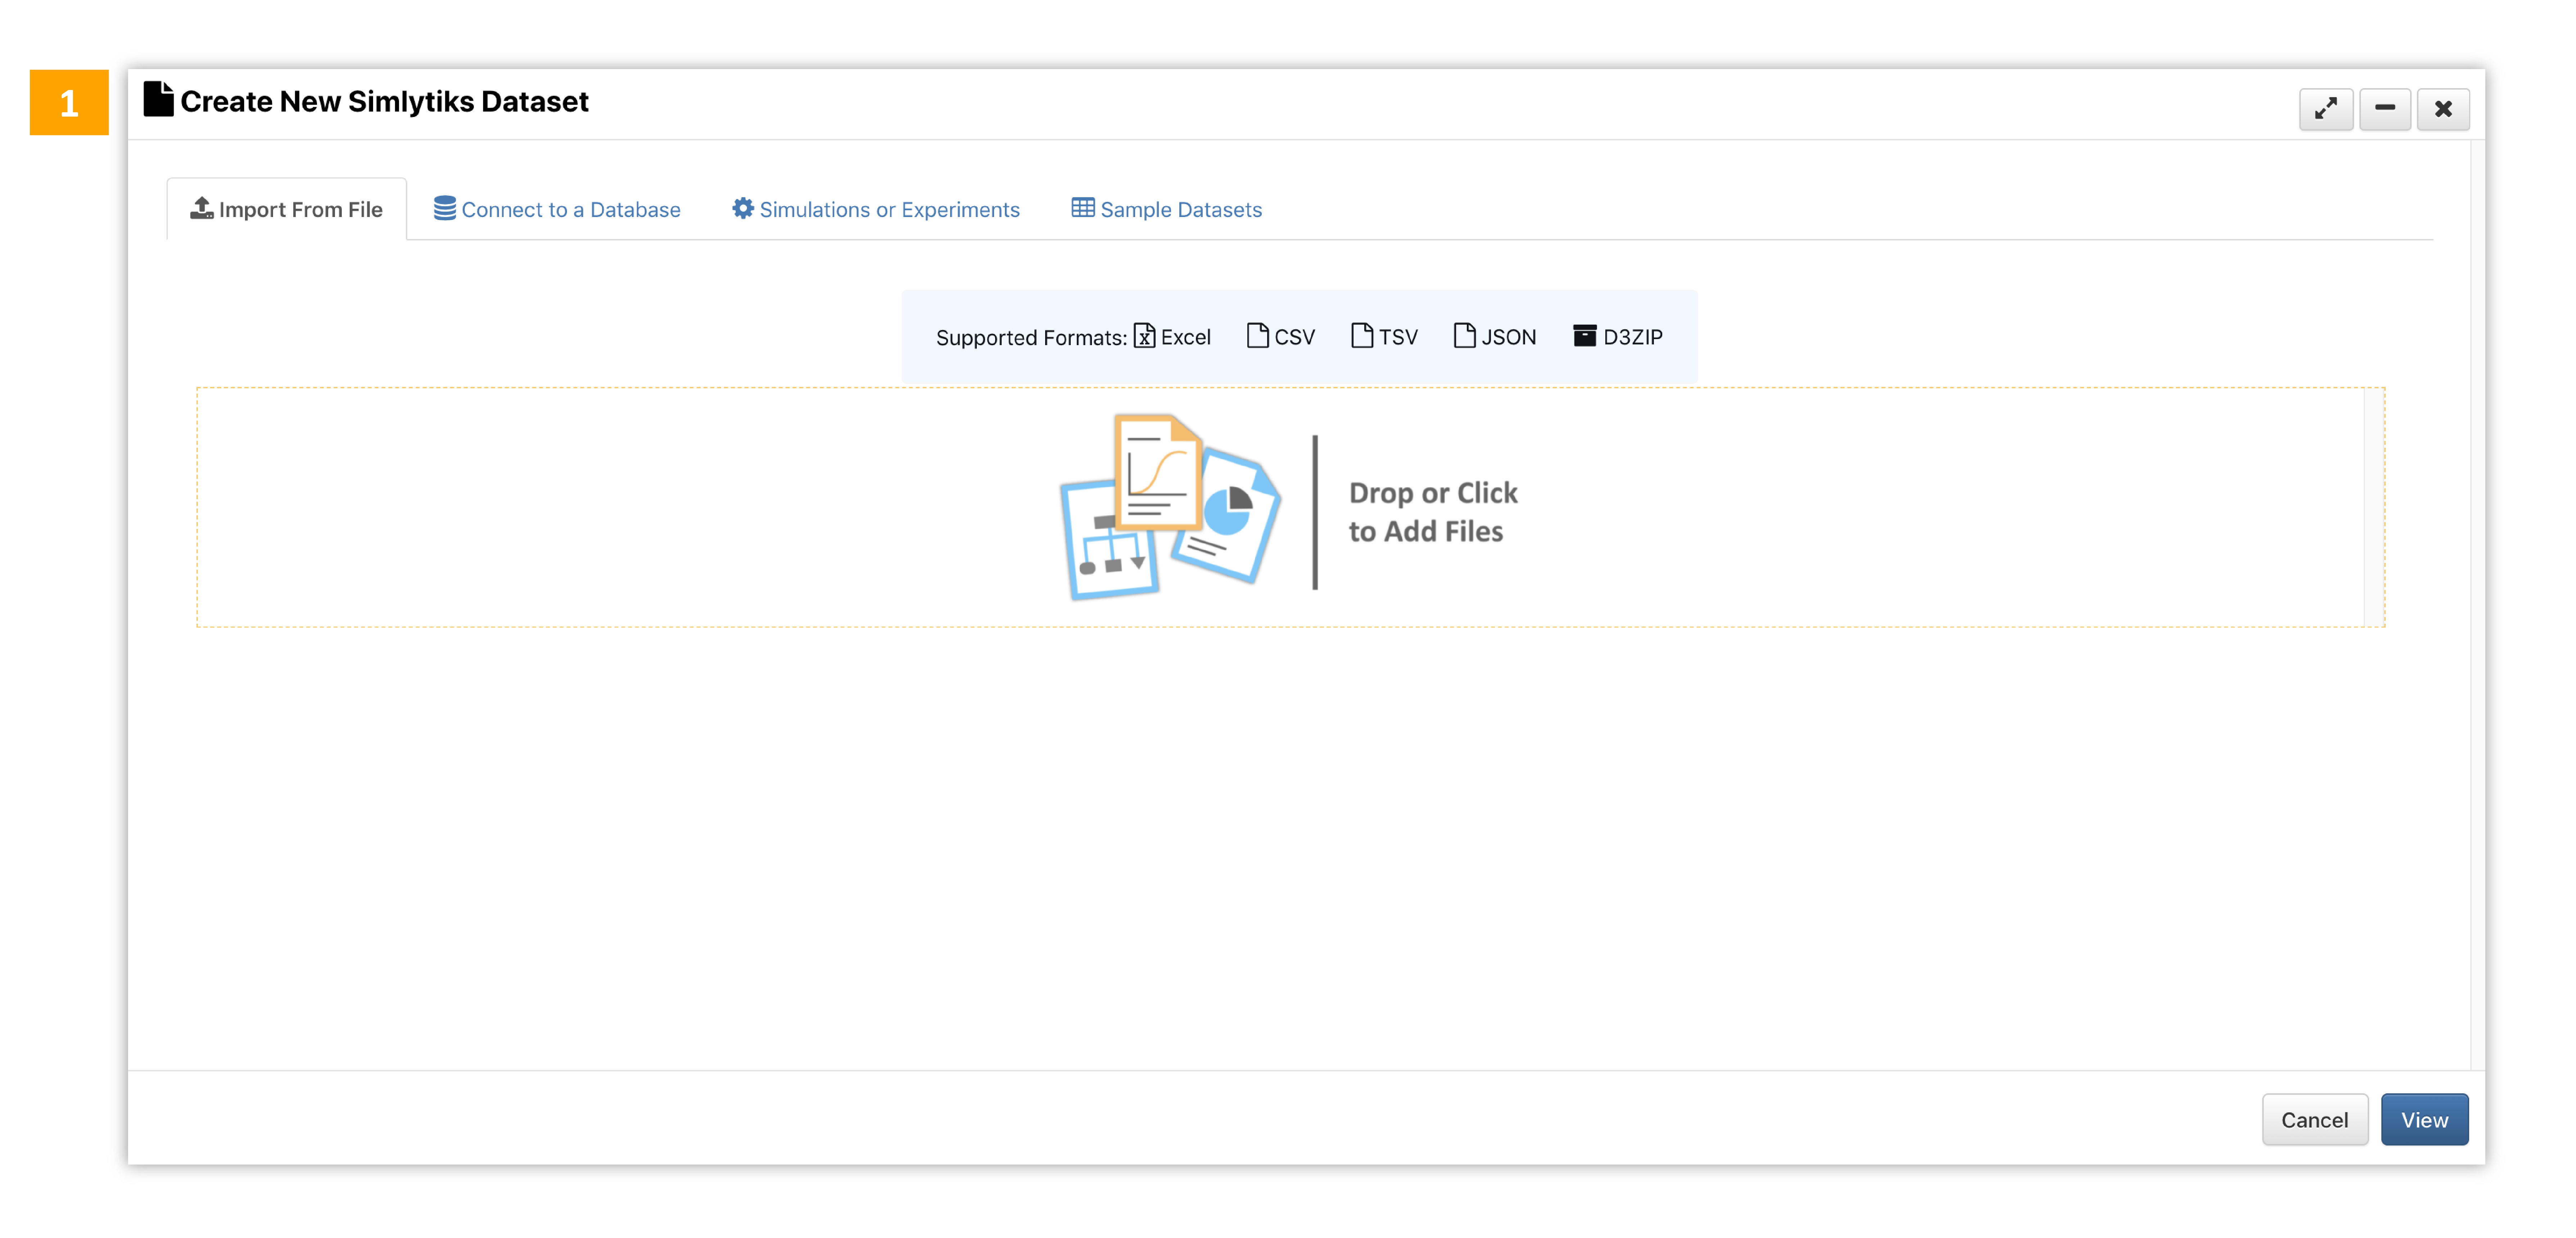
Figure 2: Import From File
The file will appear in the drop-zone. Finish importing the data into Simlytiks by clicking View at the bottom right corner of the modal. For excel files, we will be prompted to select data in the next window as shown in the following video:
New option added in File dropdown called File -> Import Pages which is similar to Import Visualizations that allows to import pages directly from any other saved datasets and copy them over to the current dataset.
A new alert message is displayed on Simlytiks page after we import data to the Simlytiks dataset. This message confirms a successful data import and fades away after 5 seconds.
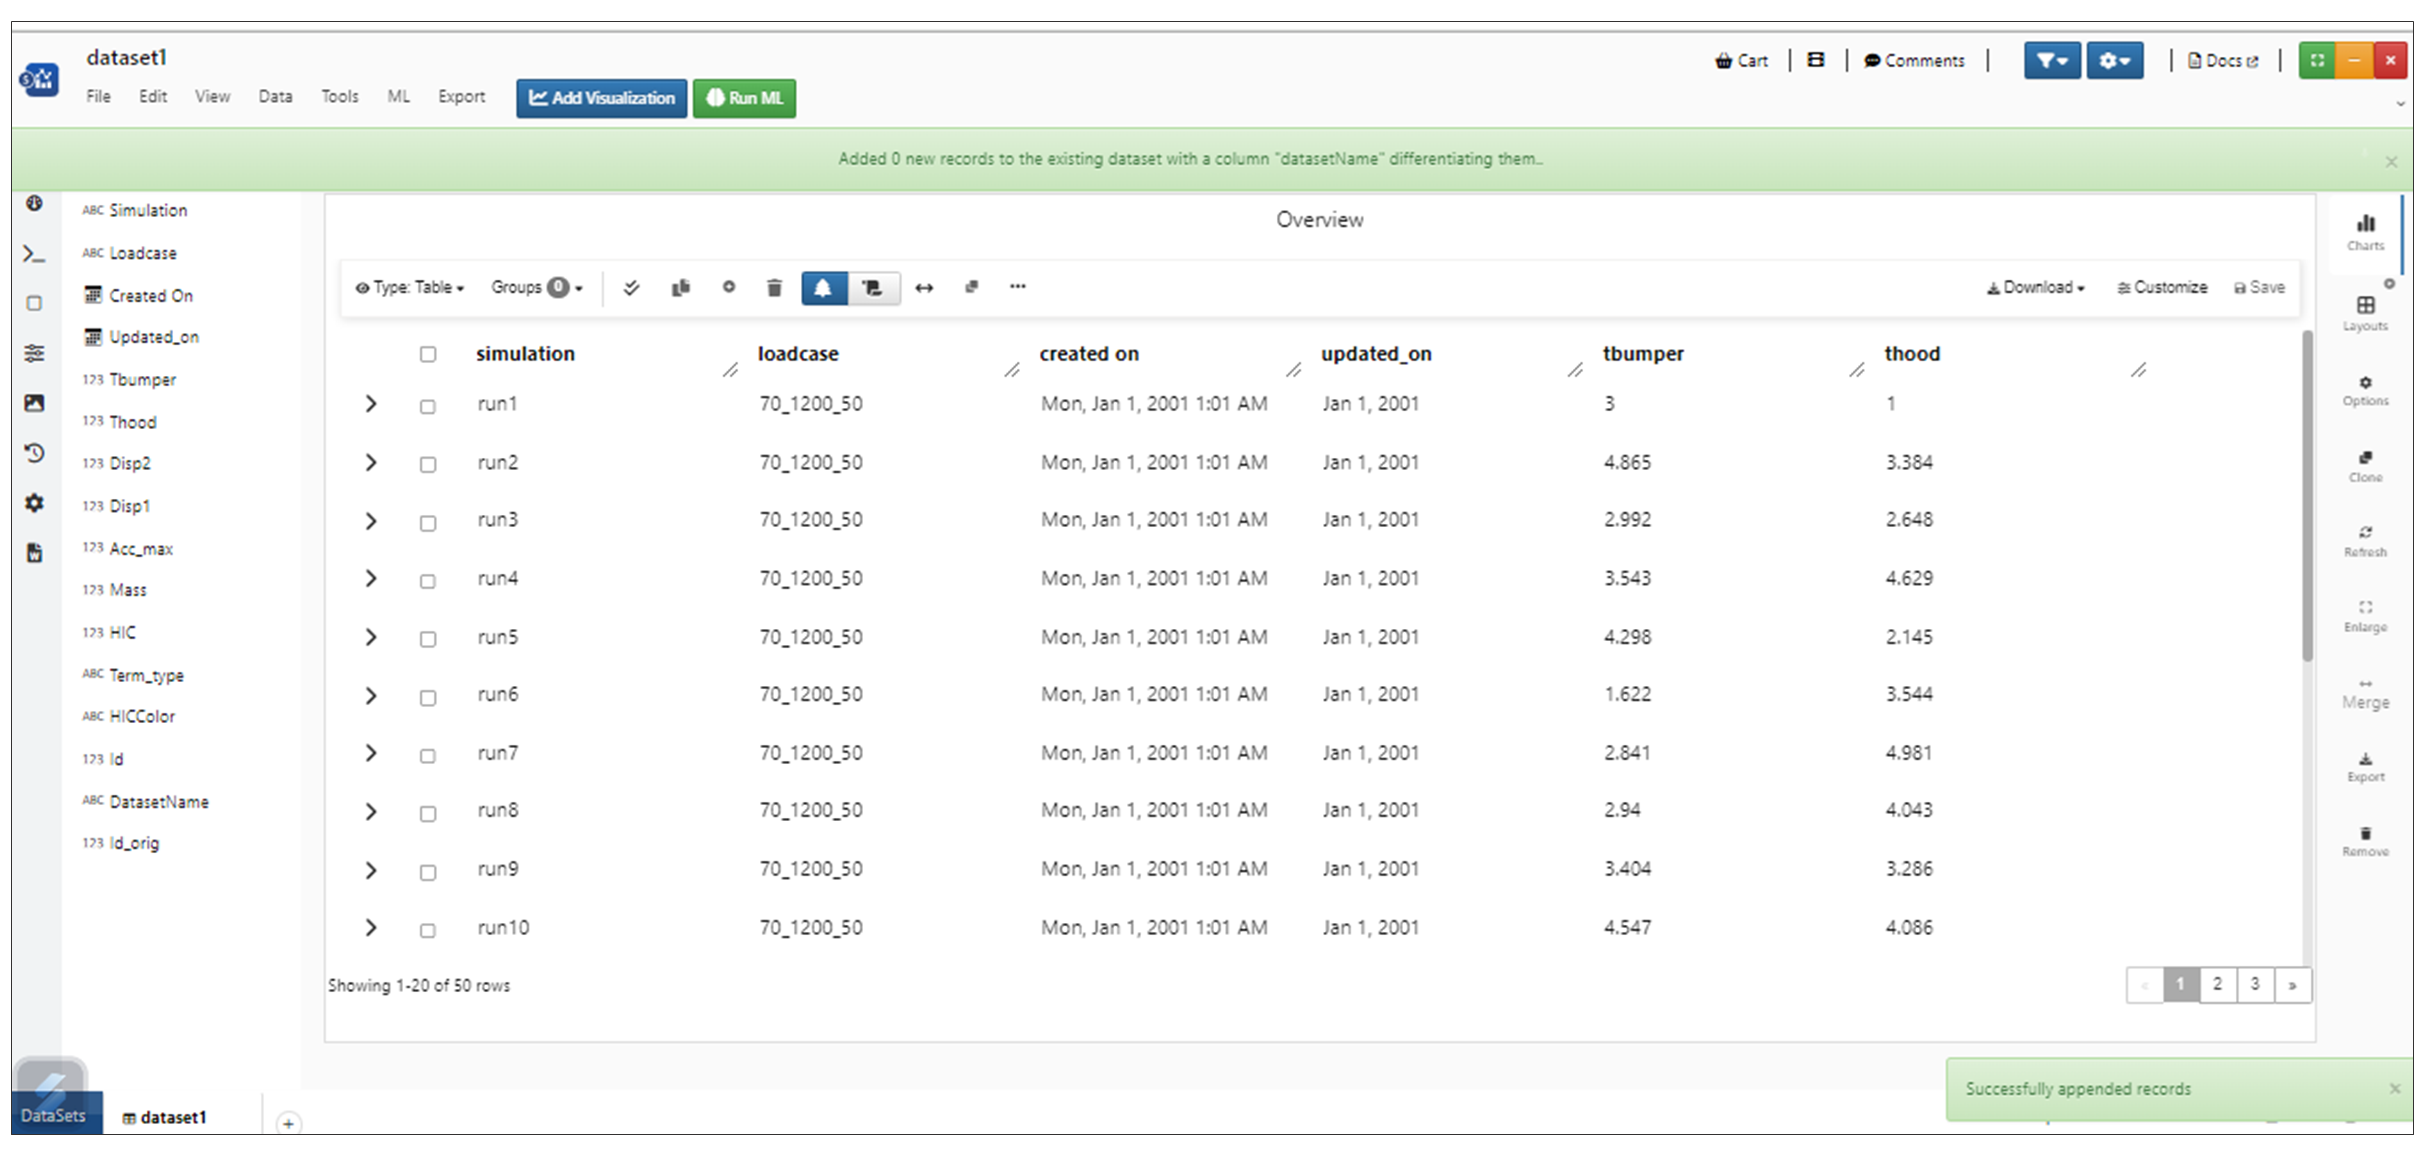
Import alert
Import Options
Import options are now available under File in Simlytiks.
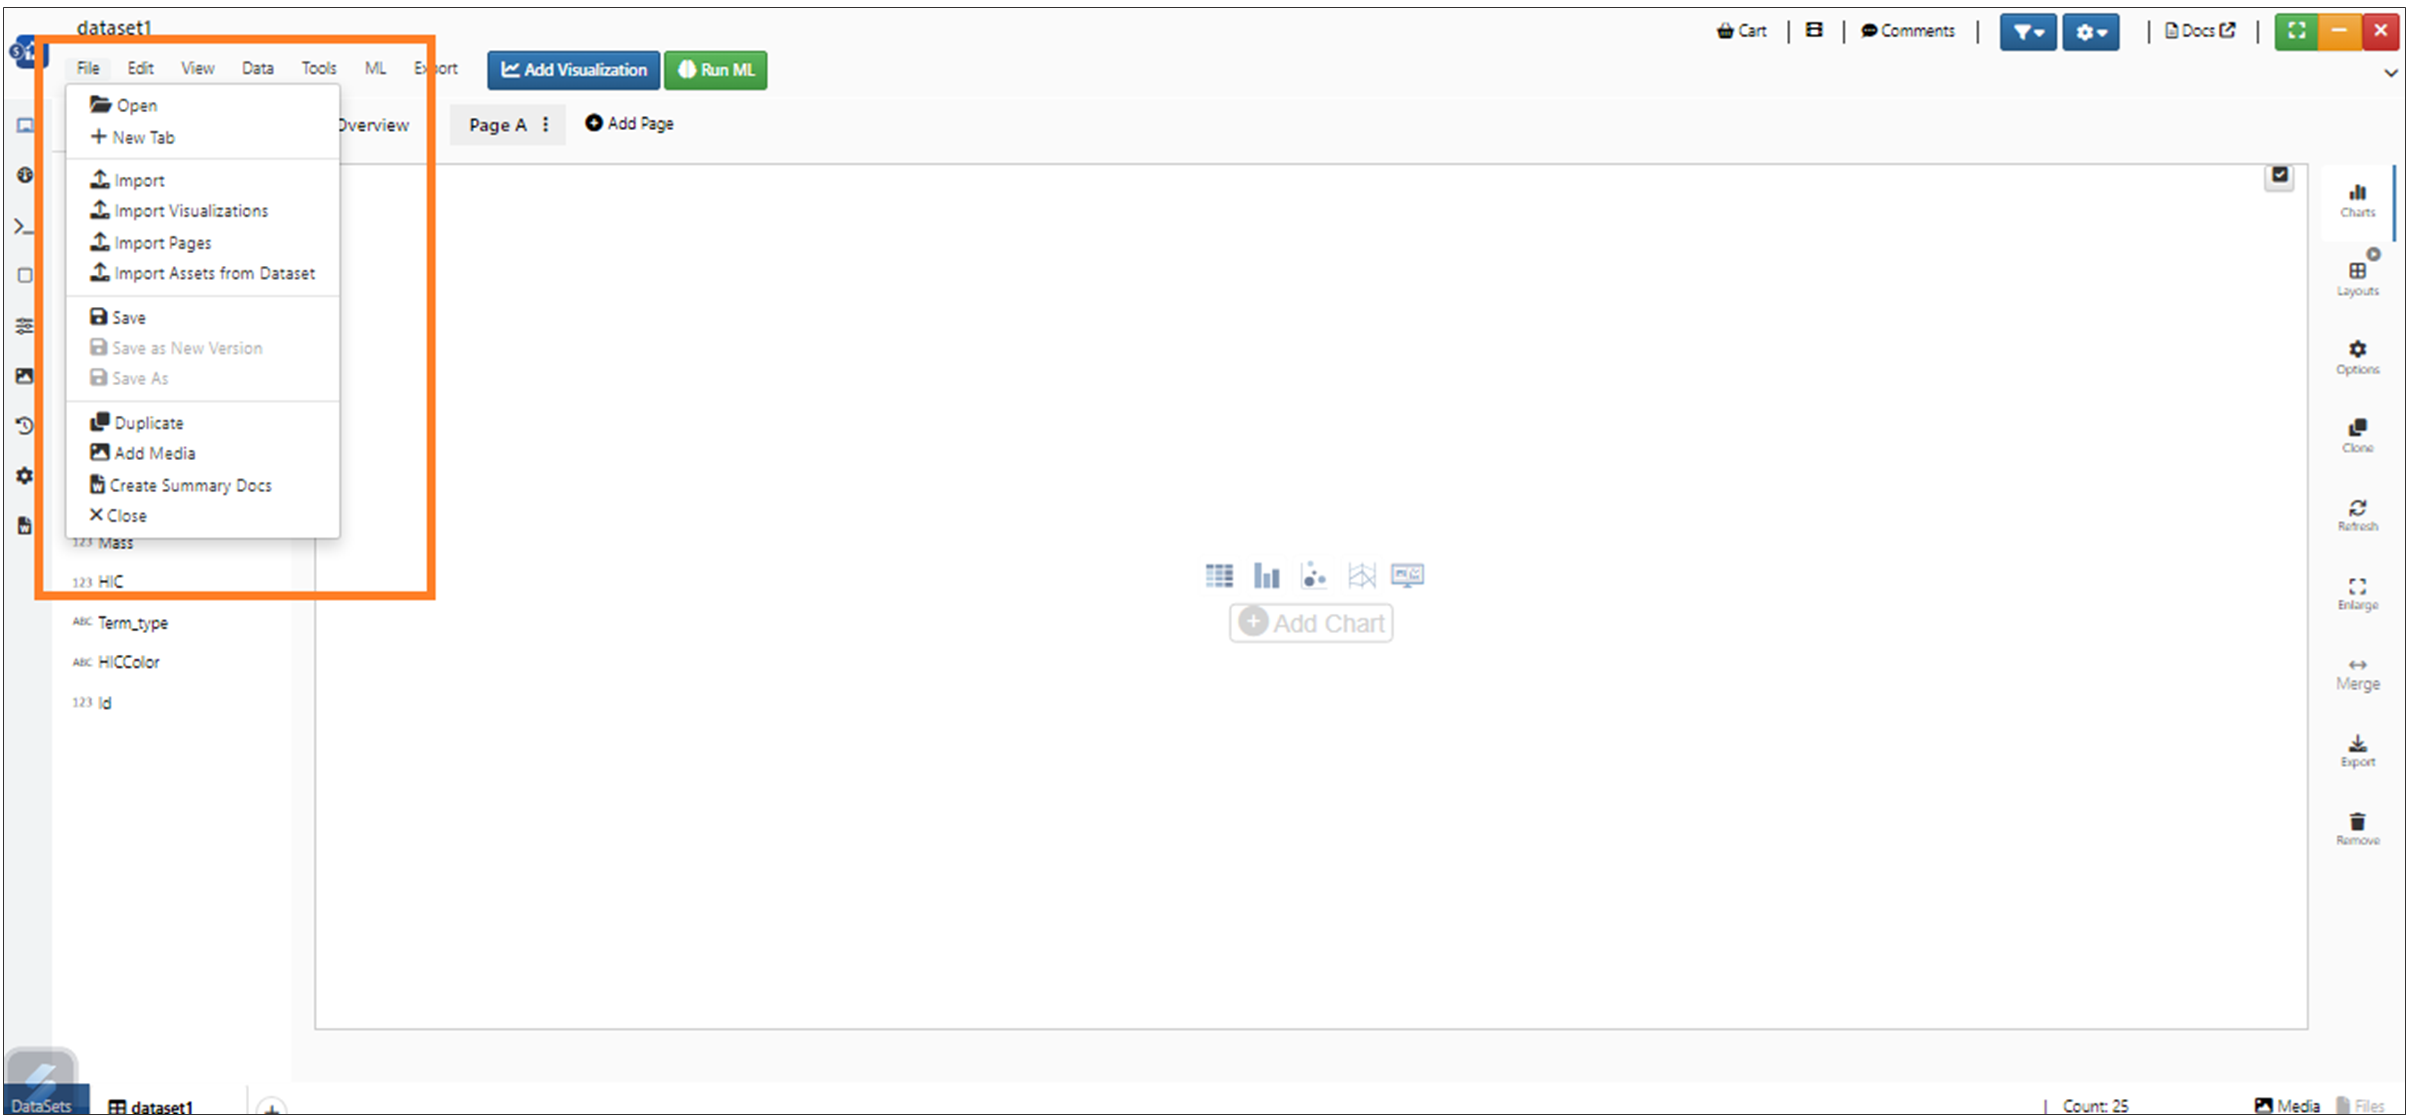
Import options
The Excel dataset with more than 100K blank rows and invalid column values is parsed correctly in Simlytiks.
Connect to Database
Source data from a database by running a query to pull the data.
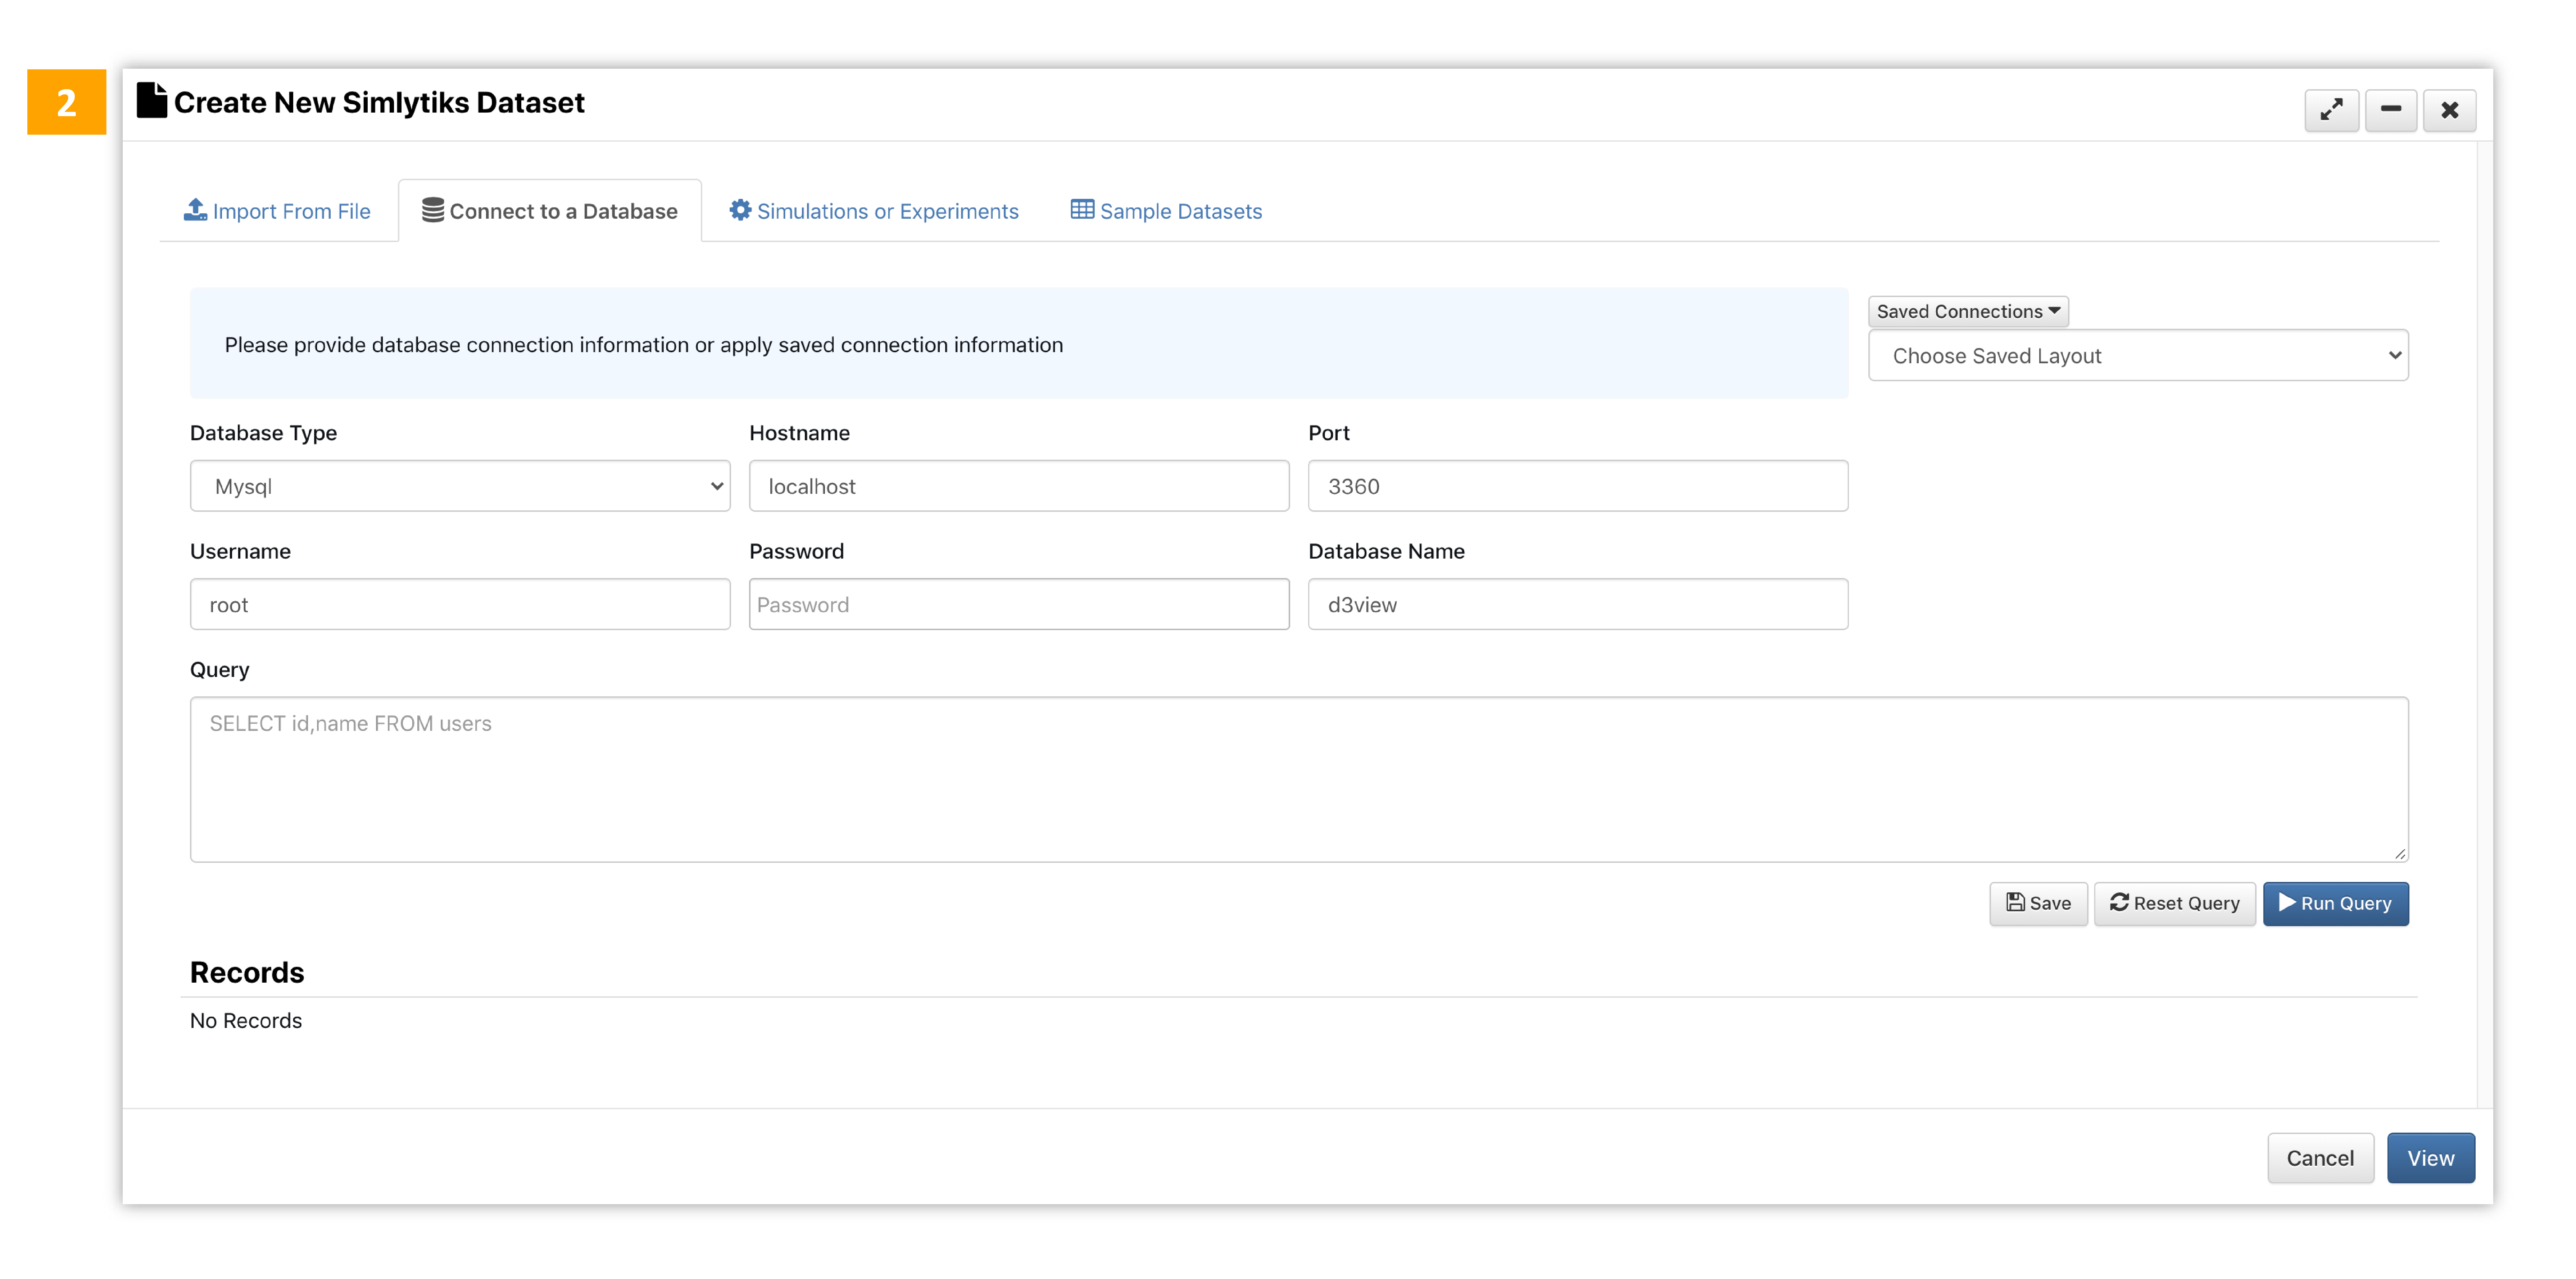
Figure 3: Connect to Database
Simulations or Experiments
Open a simulation or physical test in Simlytiks. We can sift through all our simulation and physical test records and choose to view one or compare multiple.
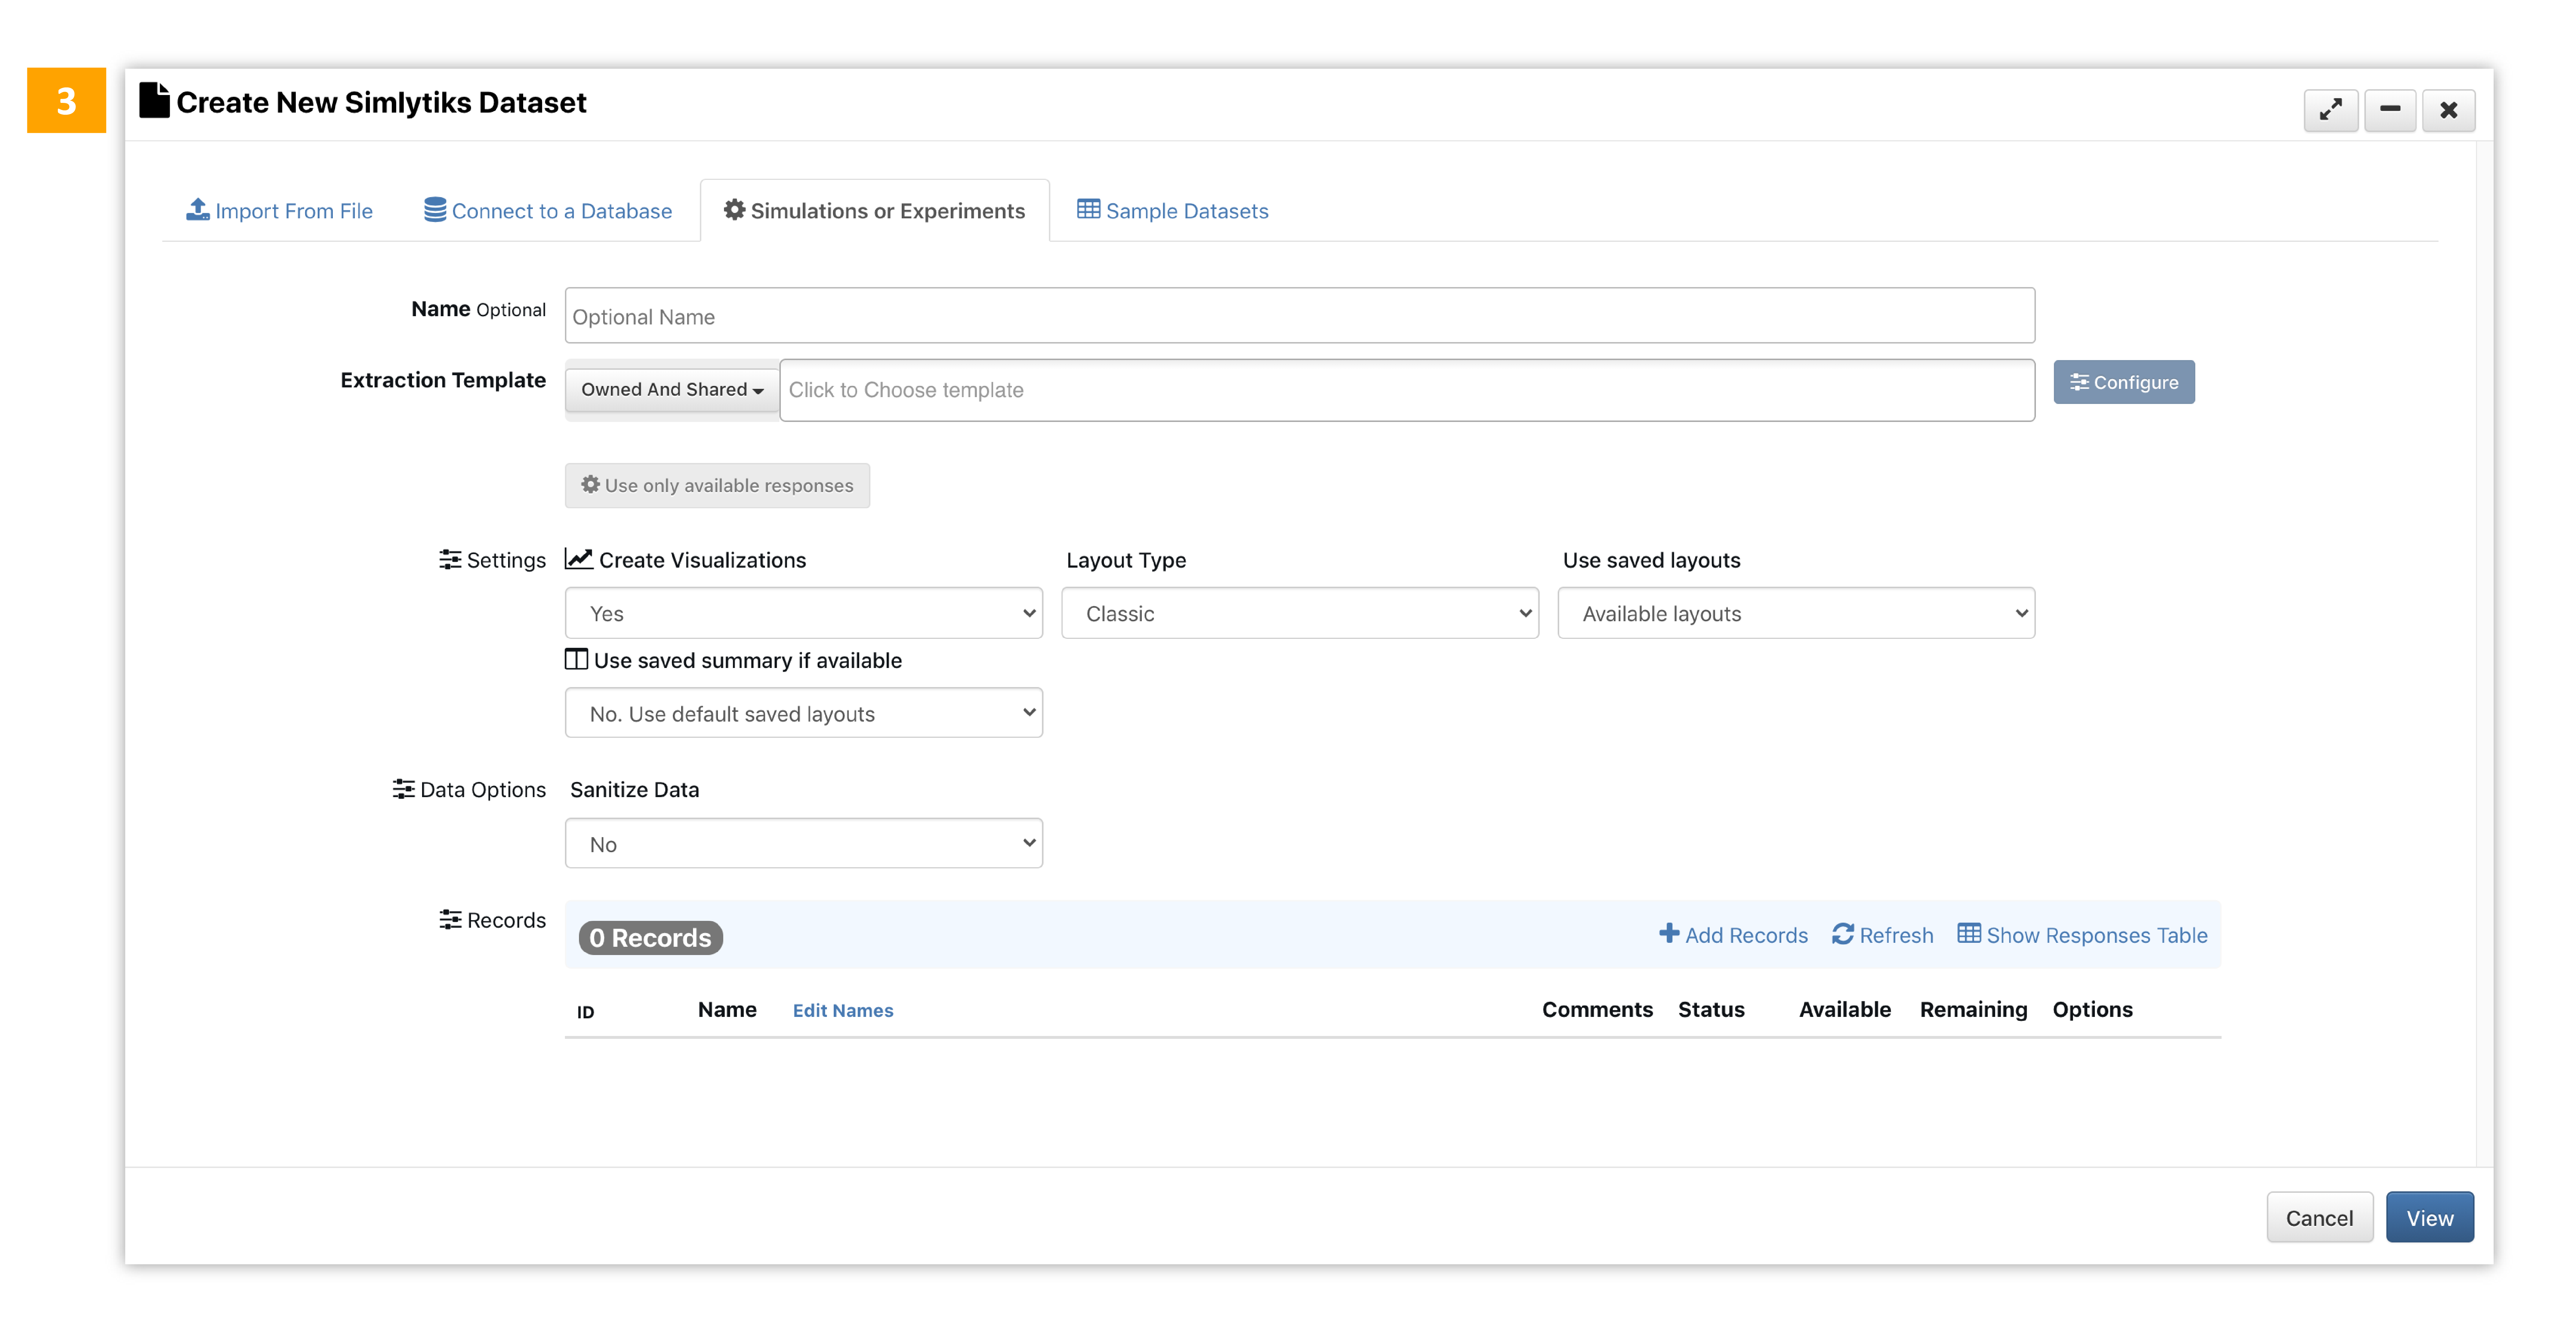
Figure 4: Simulations or Experiments
Mid-Run Extraction
NEW as of June 7, 2022: You can re-extract simulation responses to update your simulation comparison in Simlytiks. Use this option when choosing responses in the Simulation Compare window for viewing the data in Simlytiks.
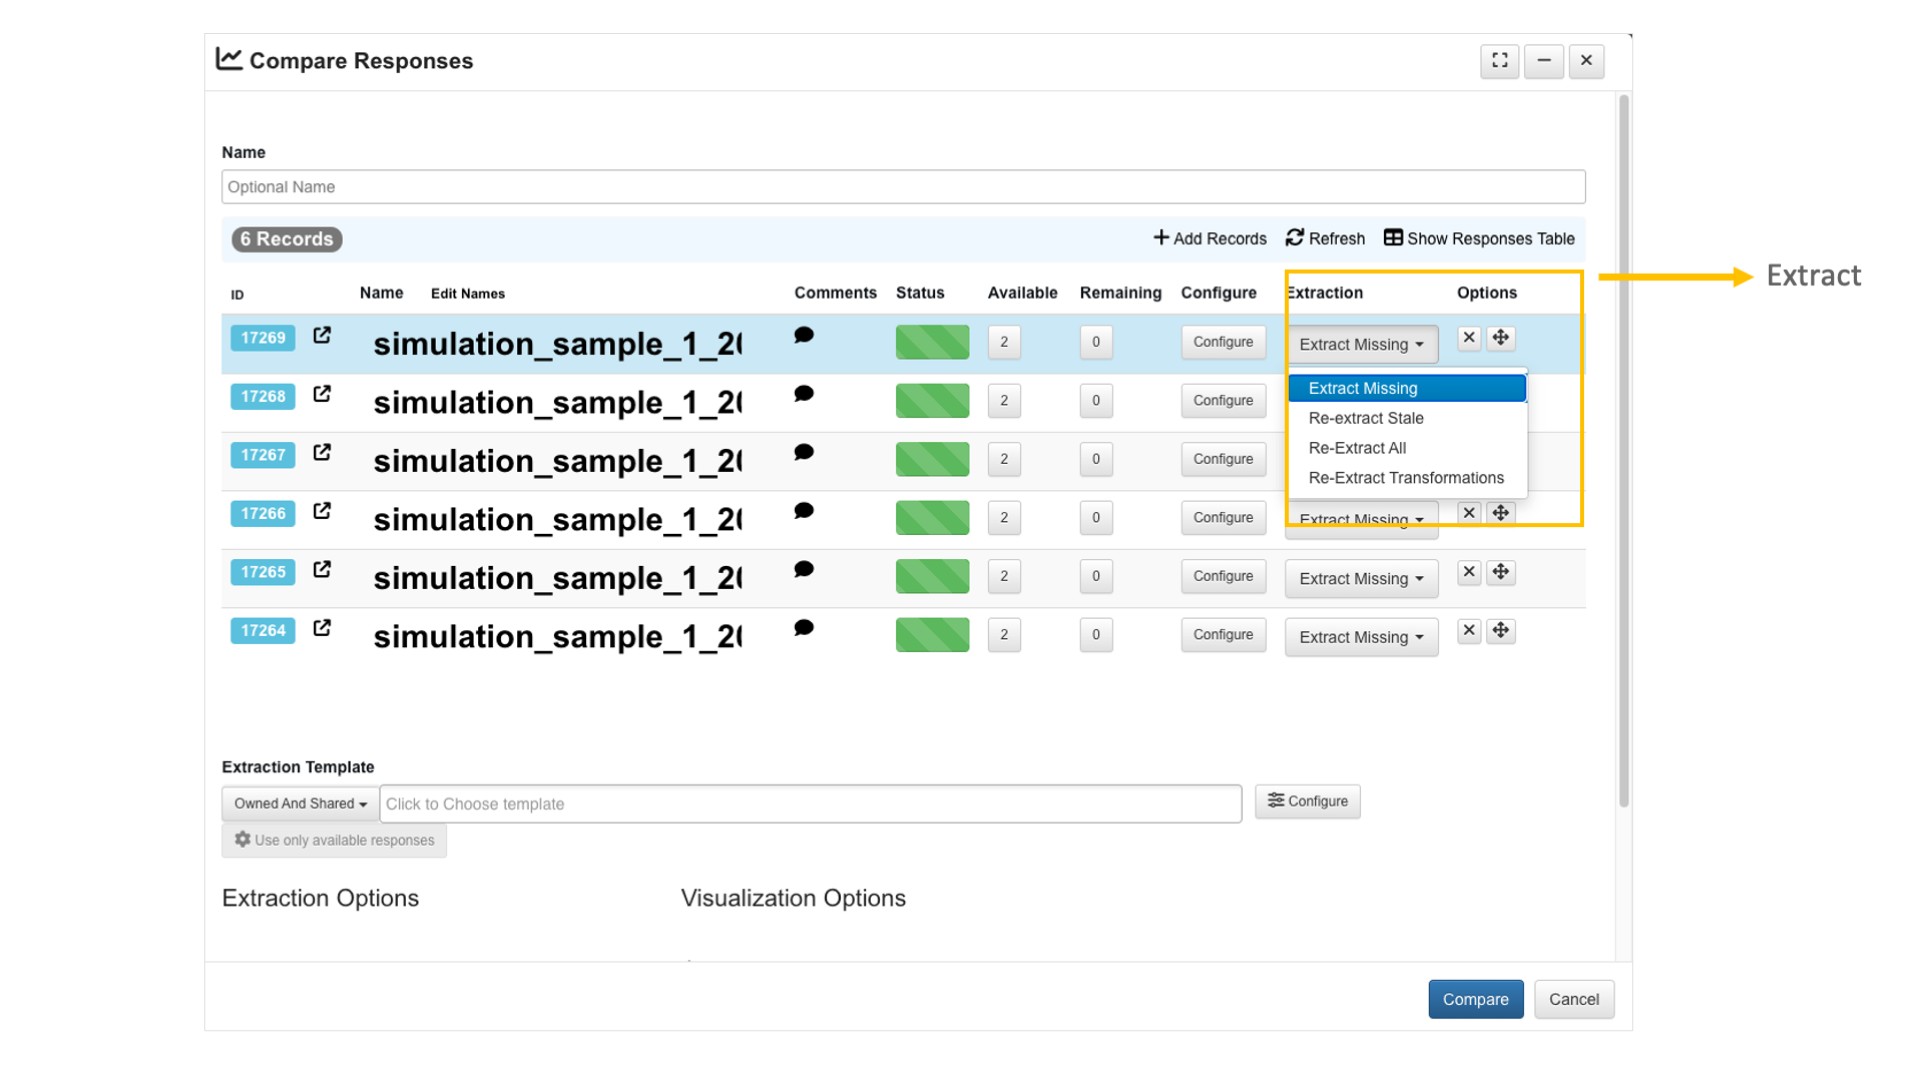
Figure 5: Mid-Run Extraction
Here is an example:
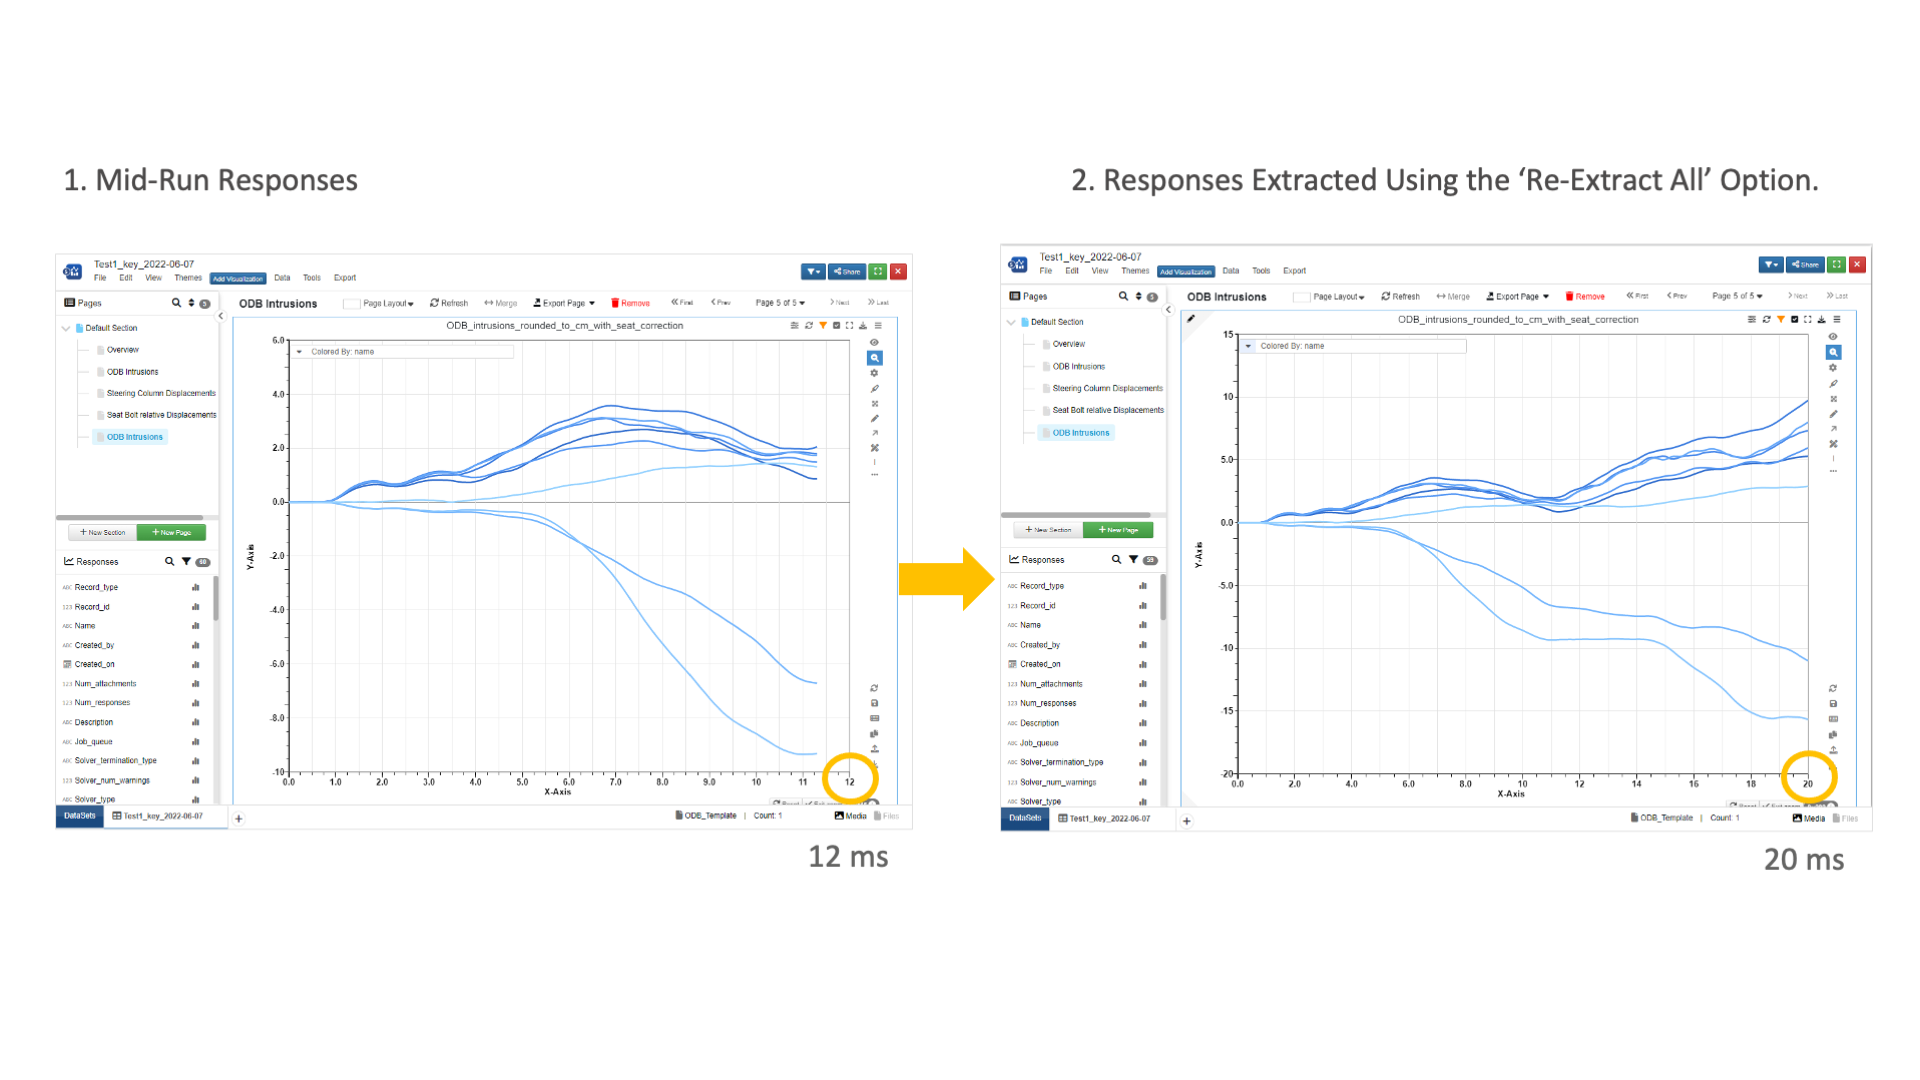
Figure 6: Mid-Run Extraction Example
Sample Datasets
Select one of the listed sample datasets to explore, and then click View to open it in Simlytiks. This is a great option if looking to just get familiar with Simlytiks.
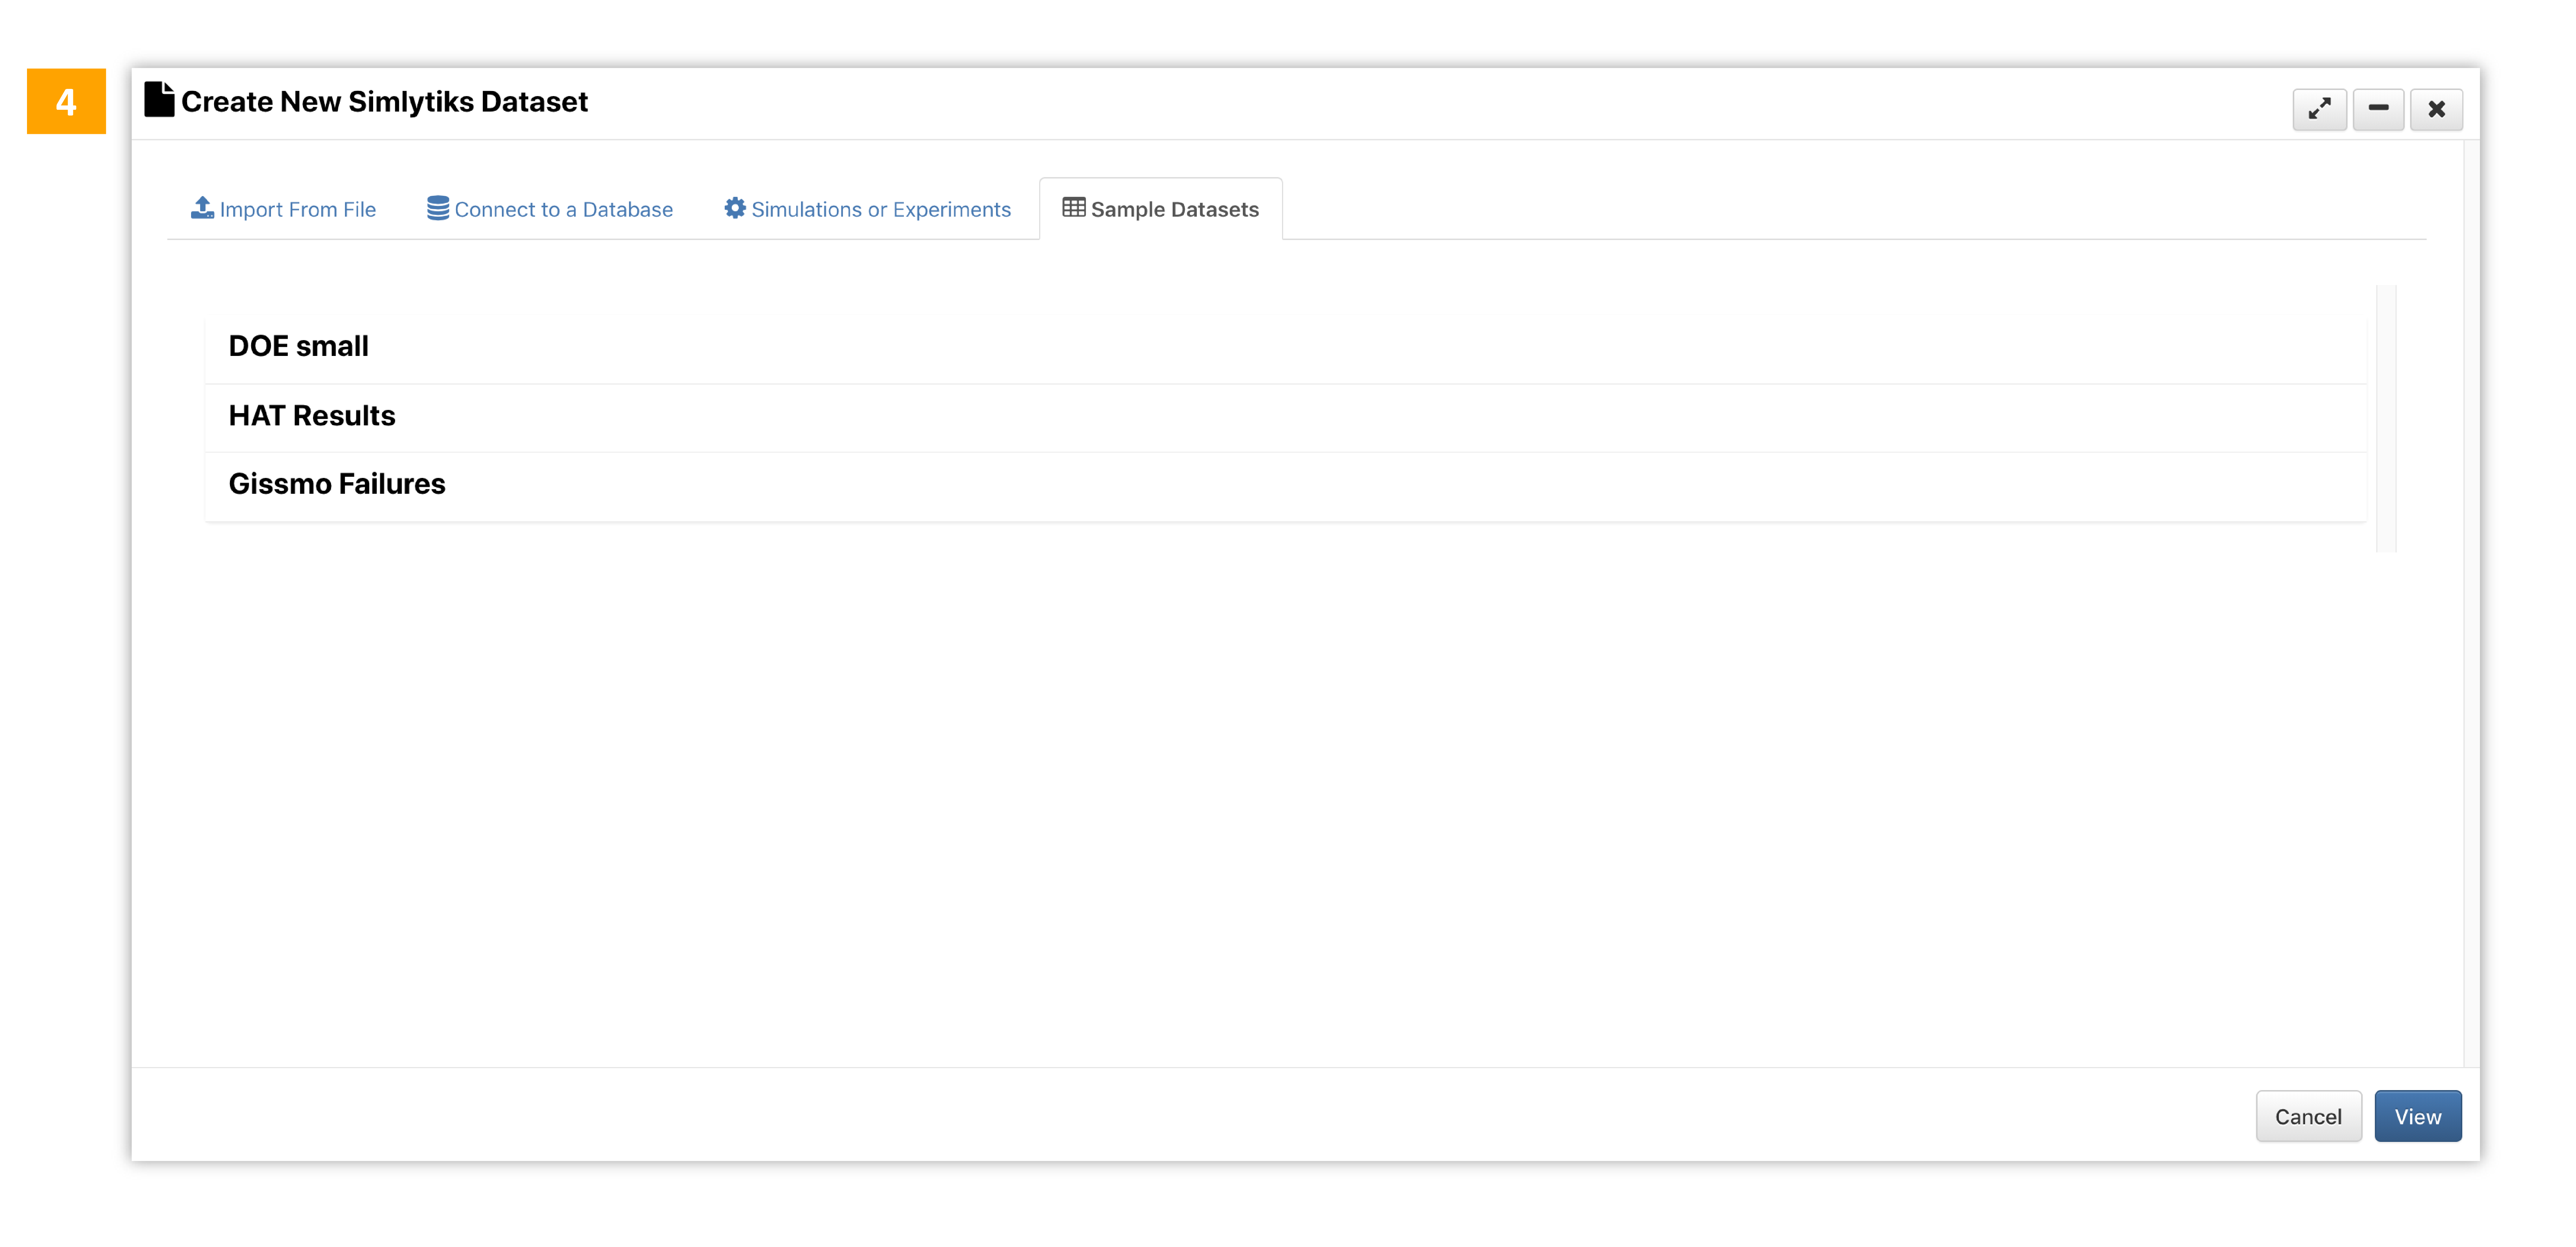
Figure 7: Sample Datasets
NHTSA
New NHTSA dataset is added to Simlytiks Library.
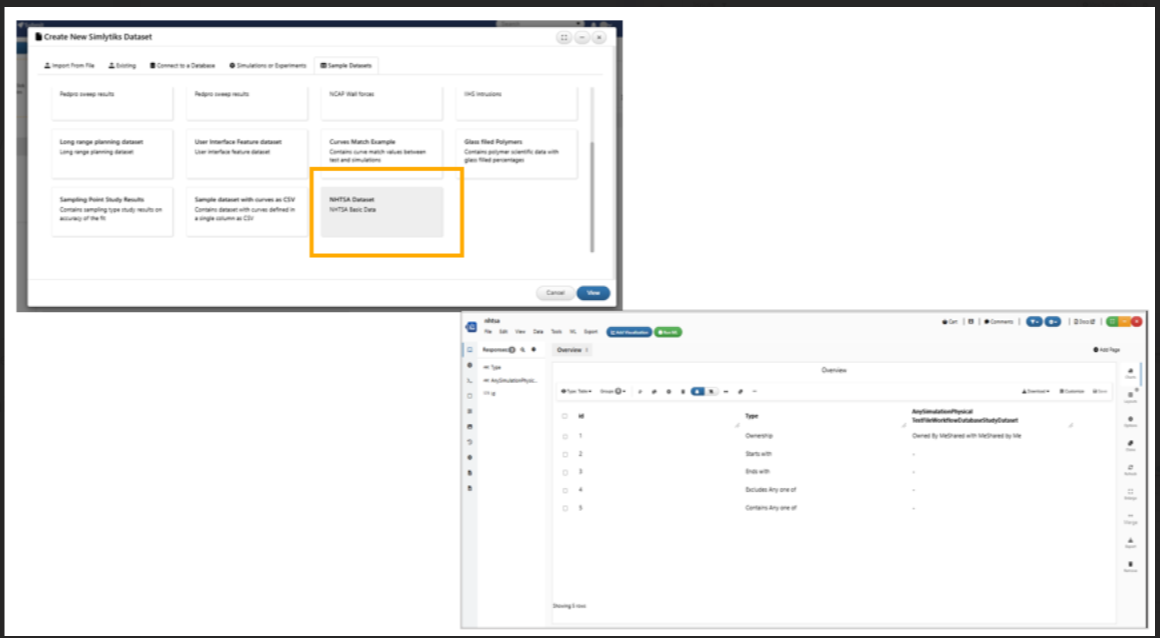
NHTSA
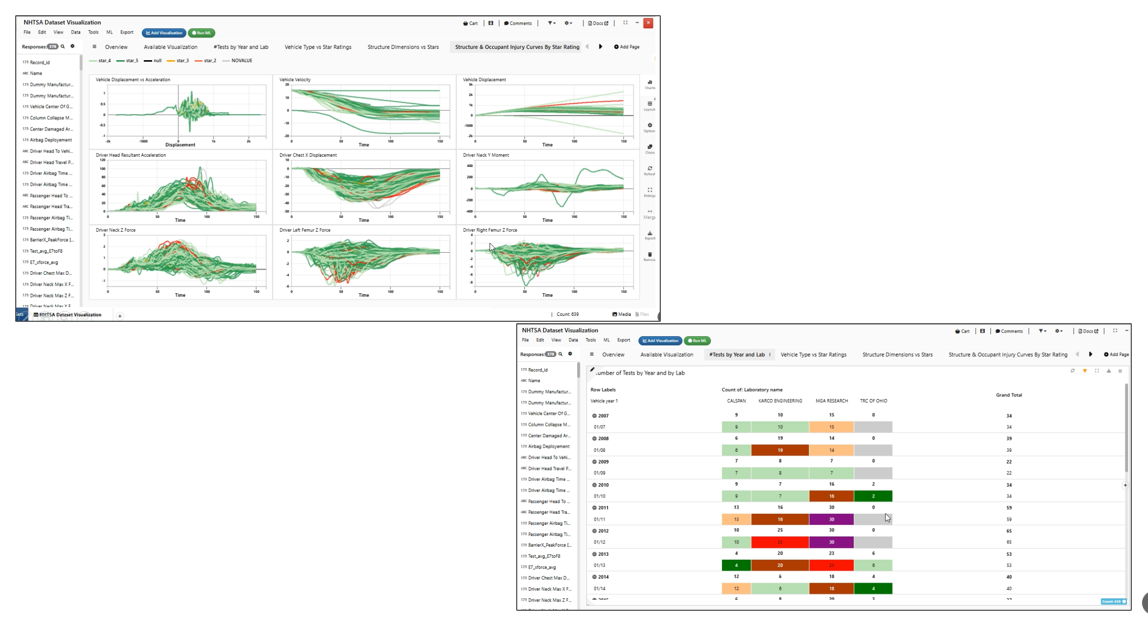
NHTSA
‘Loadcases PROFORMA’ dataset is now added to Simlytiks.
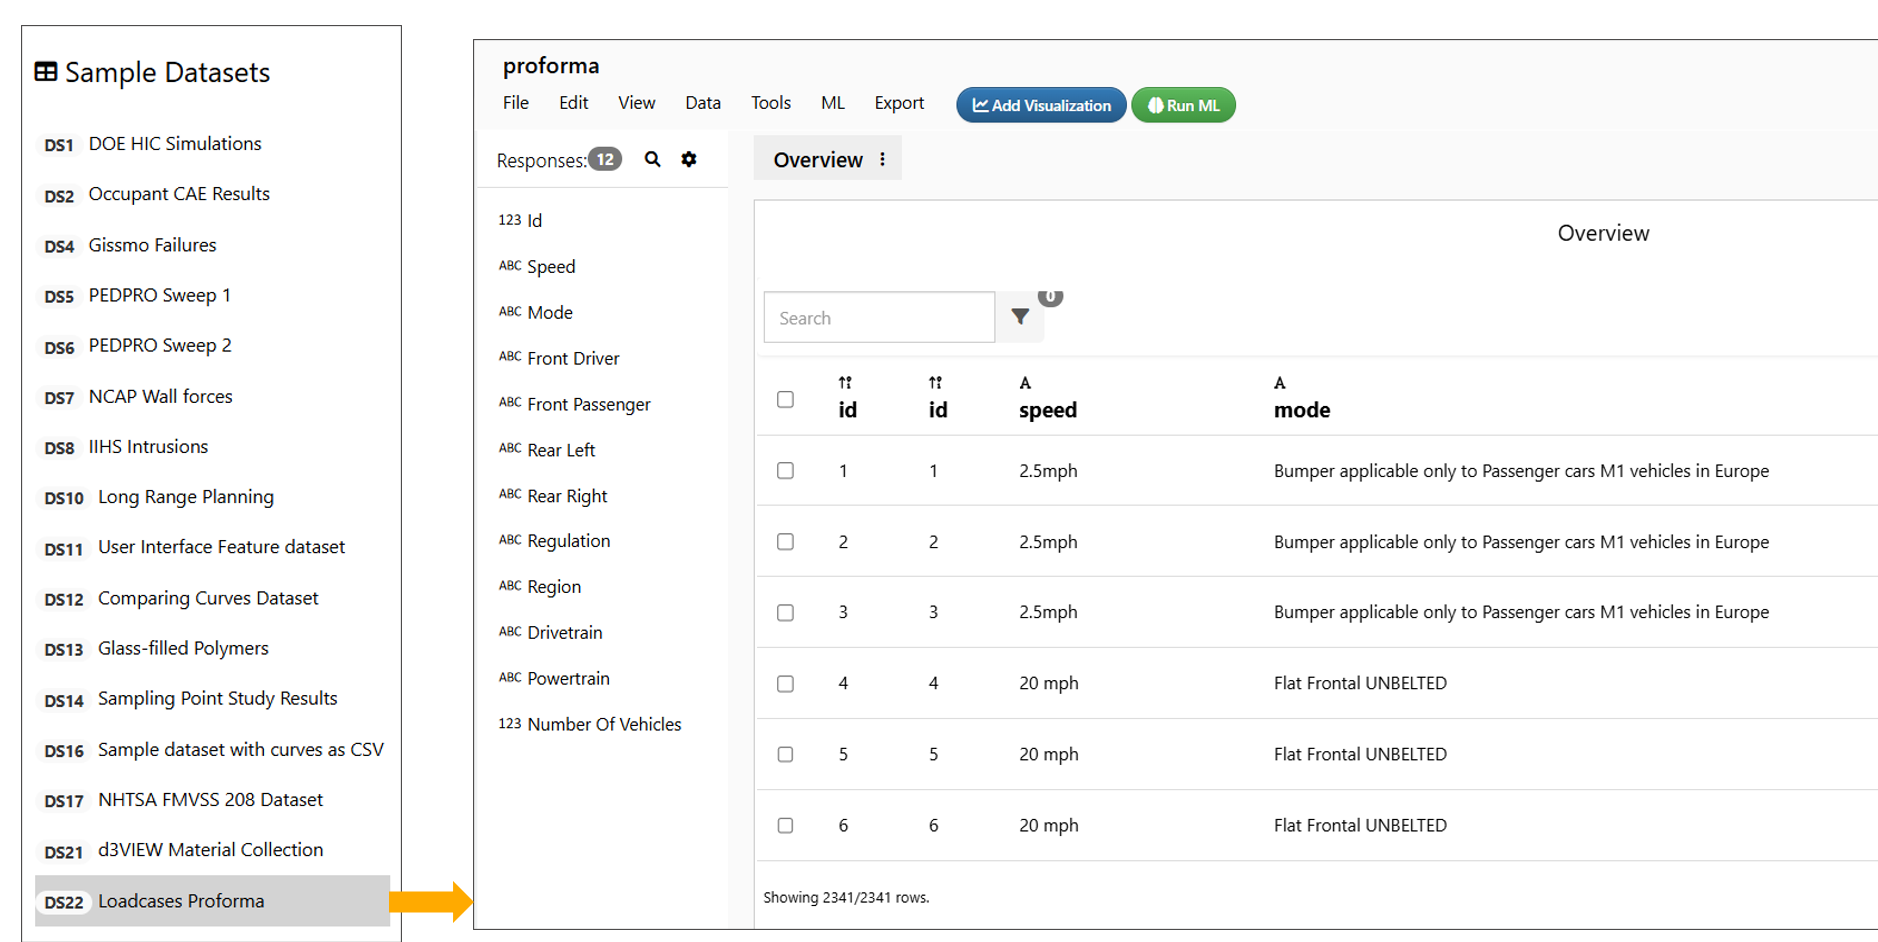
Loadcases PROFORMA
Data Sheets
Upon creating or opening a new dataset, you’ll have a dataset navigation bar at the bottom of the page where you con import more data to create multiple dataset explorations under the same Simlytiks window.
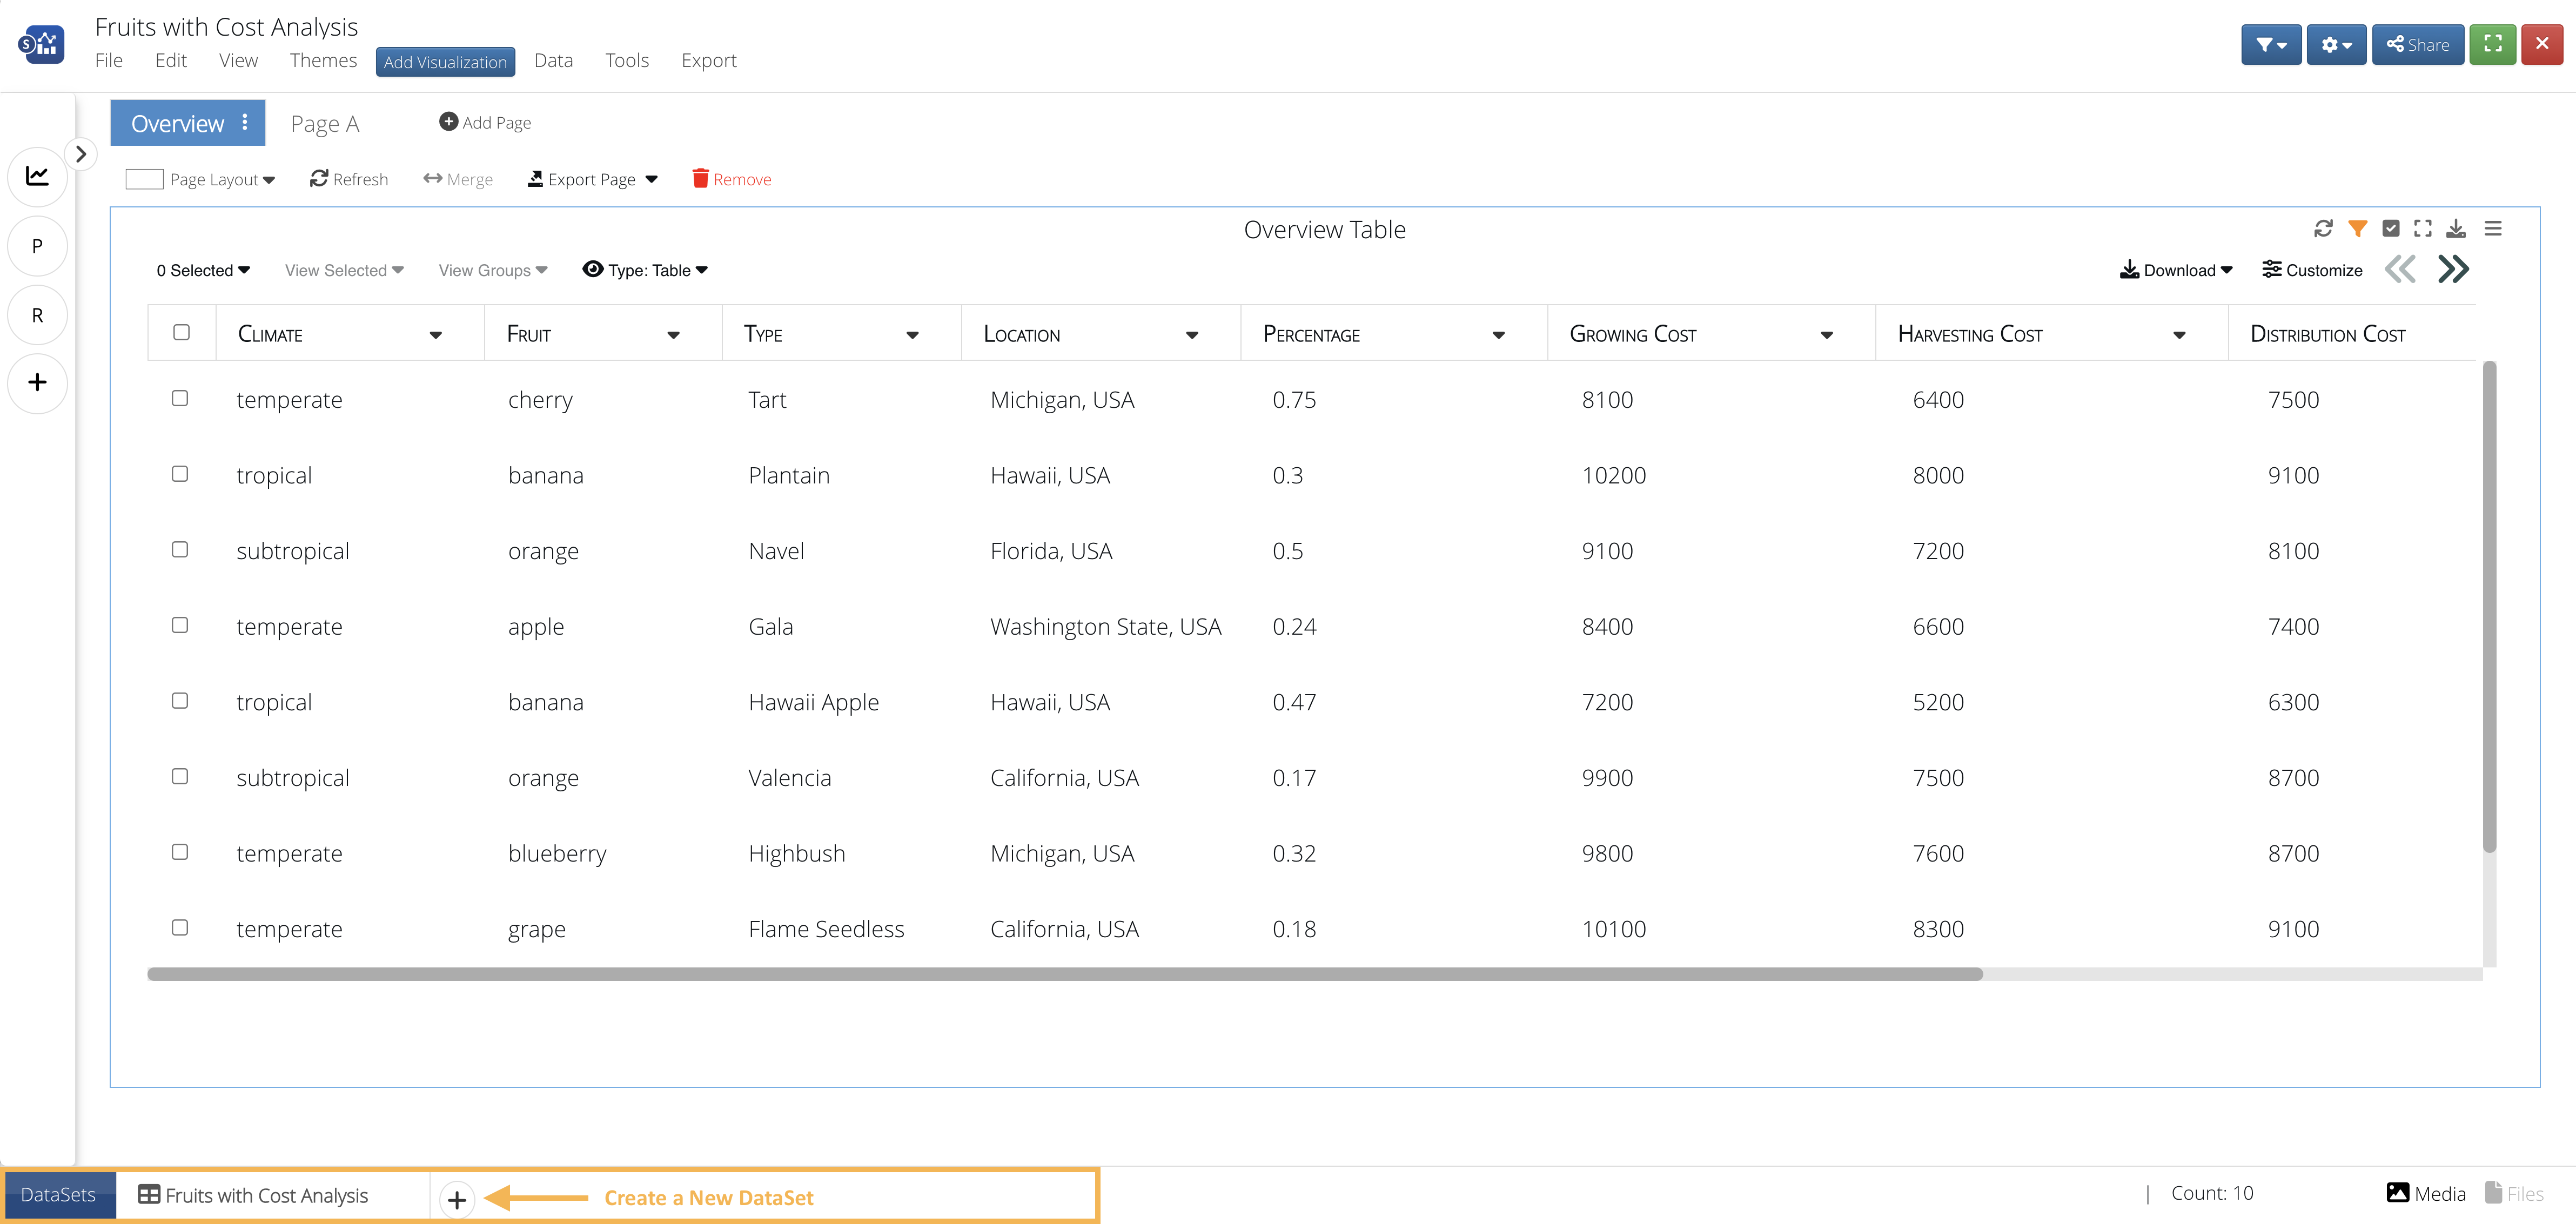
Figure 8: DataSet Navigation
Duplicating Sheets
Duplicate your data sheet under File > Duplicate. This is helpful if you want to separate explorations for the same dataset.
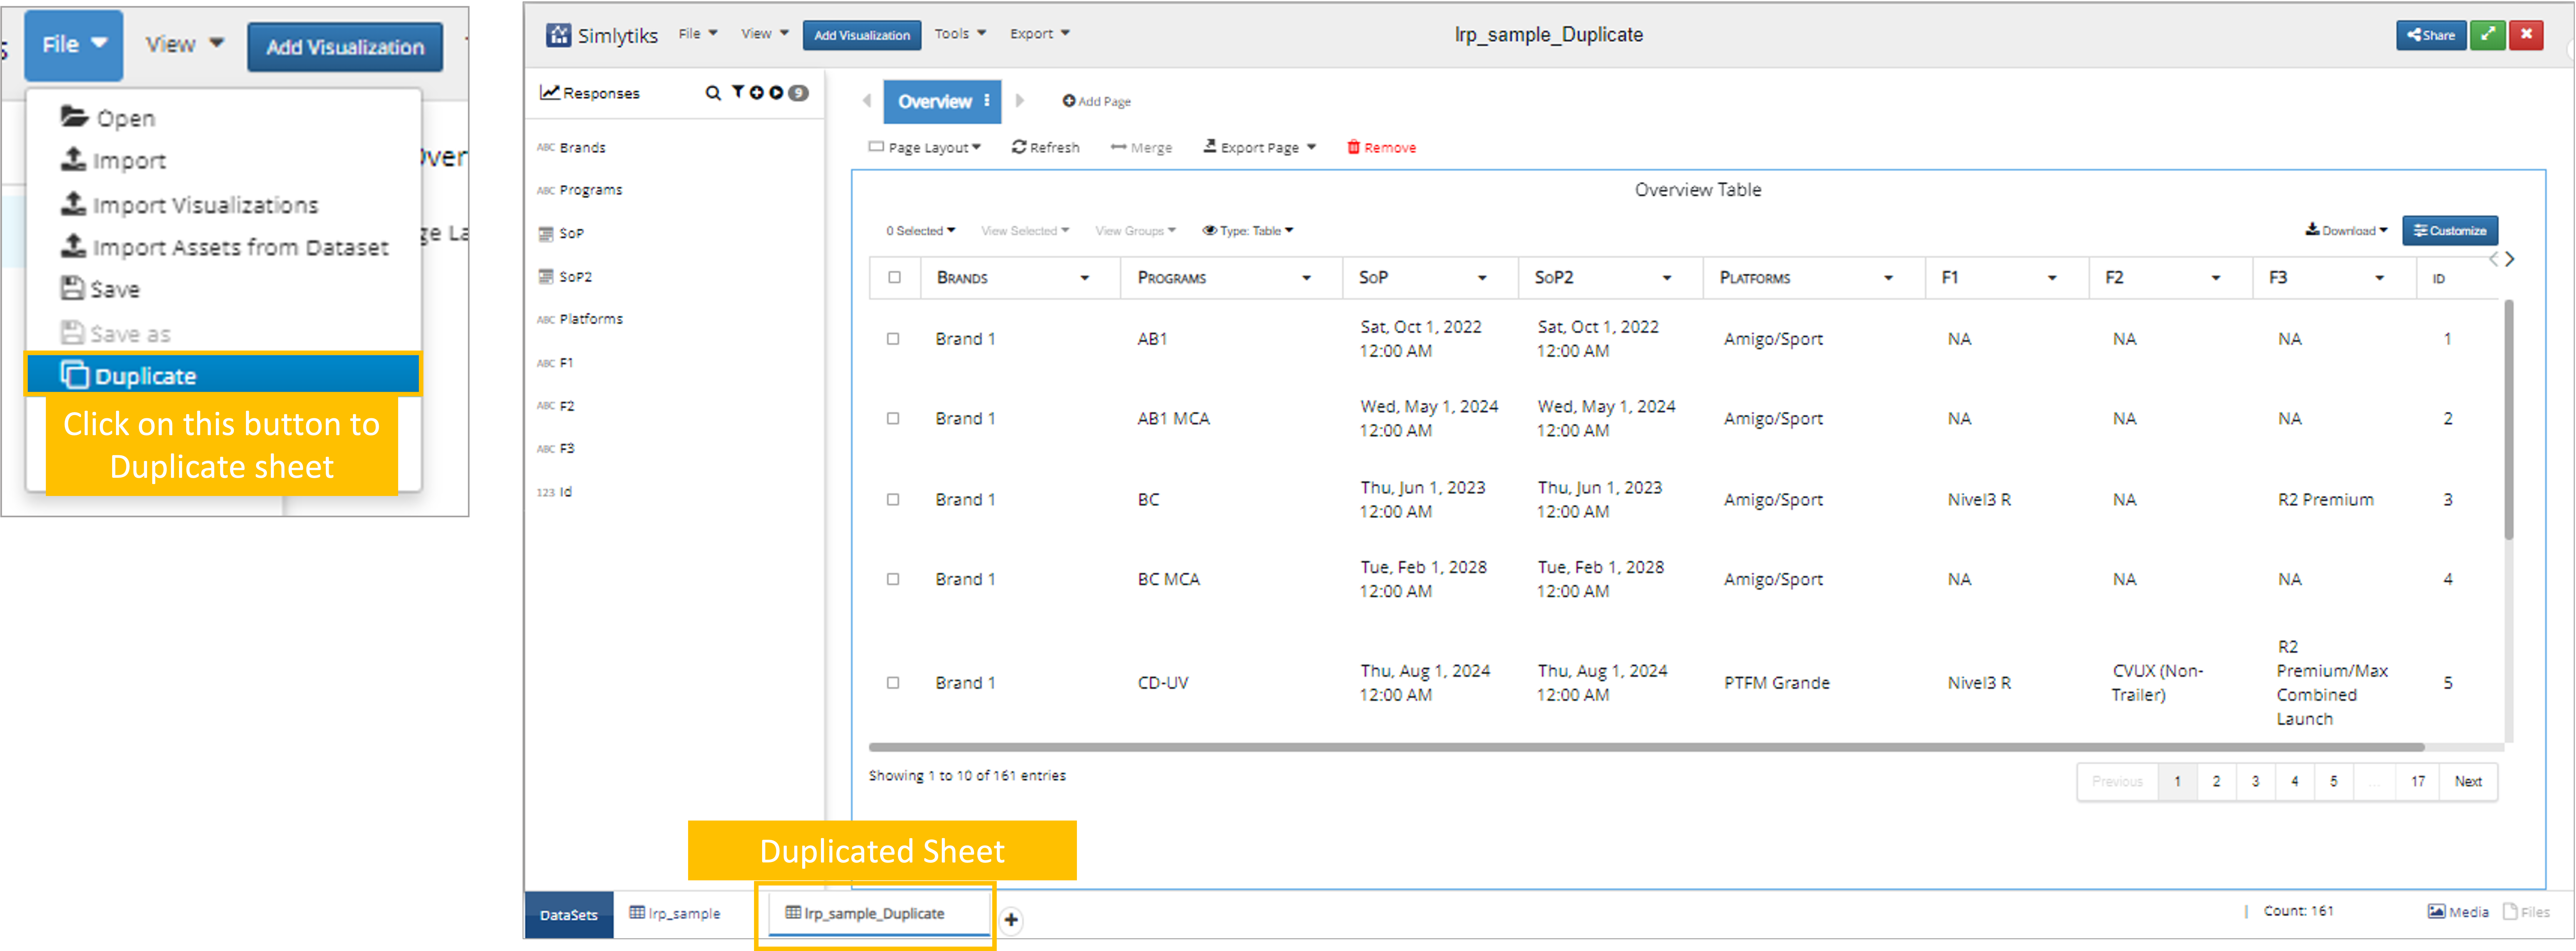
Figure 9: Duplicate a Sheet
DataTable
Added Auto Scale option to autofit columns which calls on save.
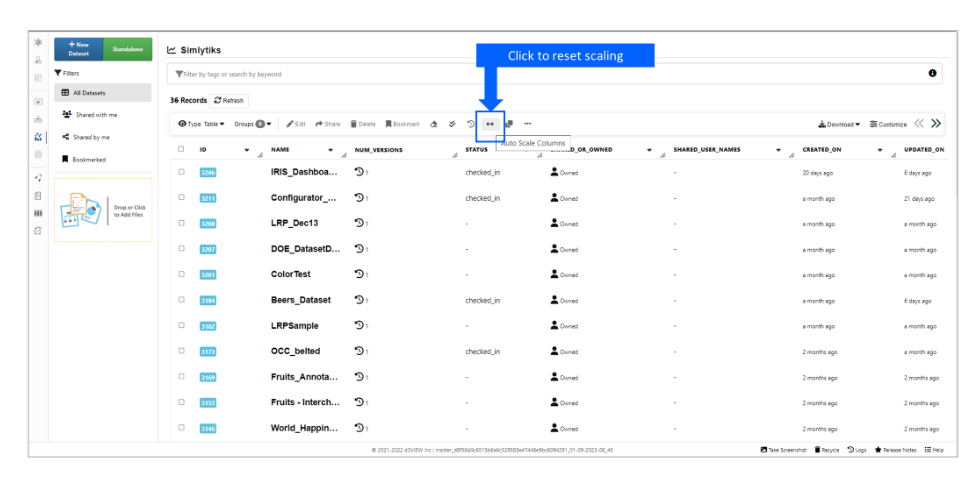
DataTable
When rows are removed from Overview table in Simlytiks,they are automatically added to the Global filters.
Datatable now supports viewing of Multiple column overlays at the same time.
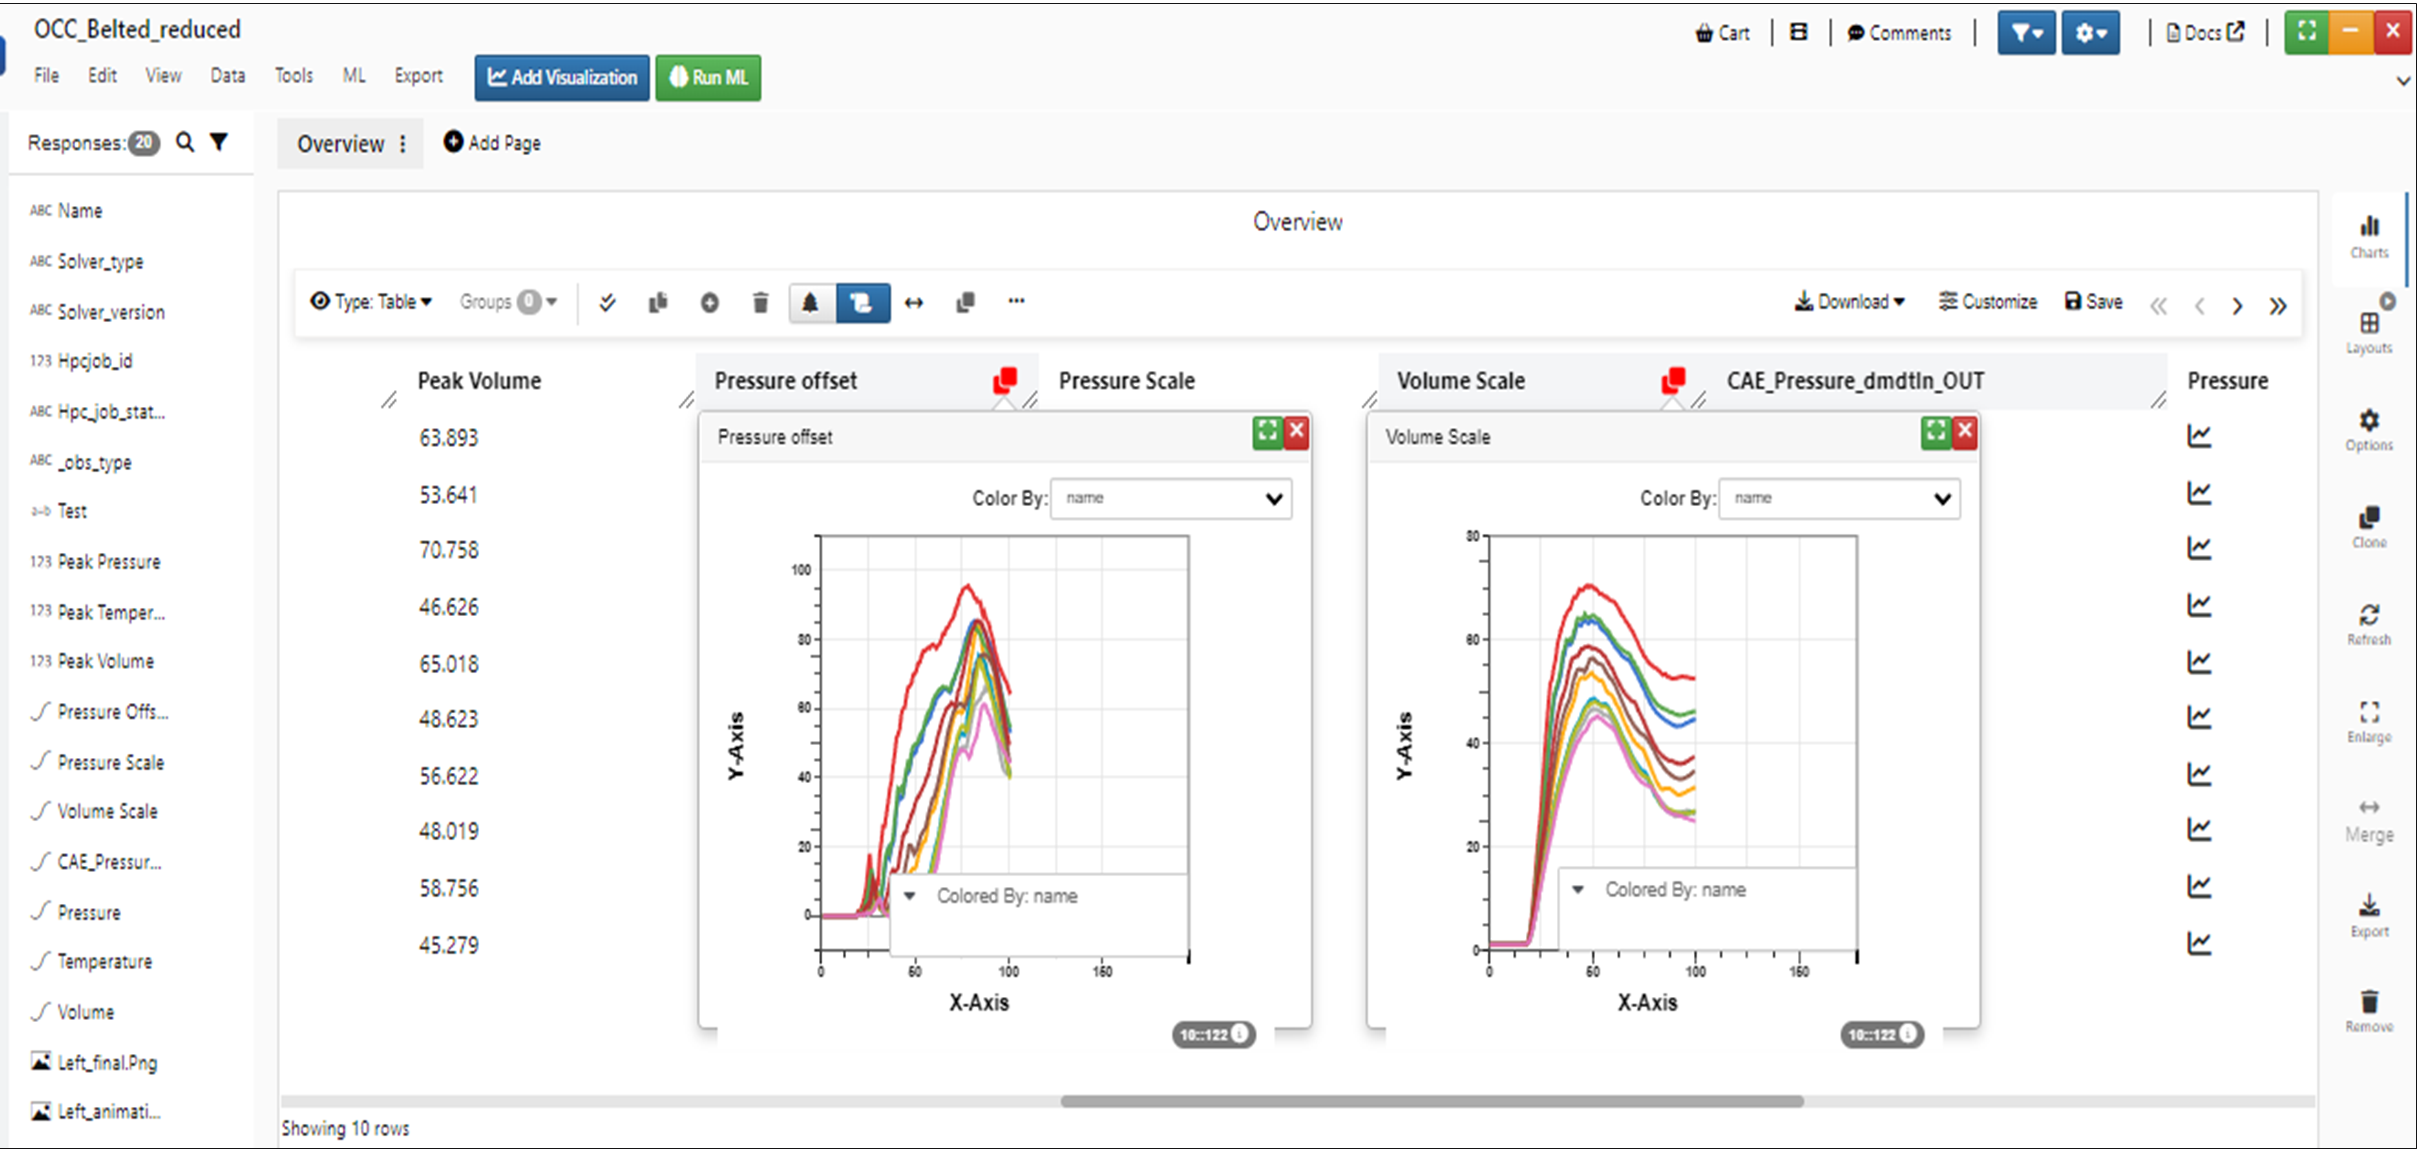
DataTable
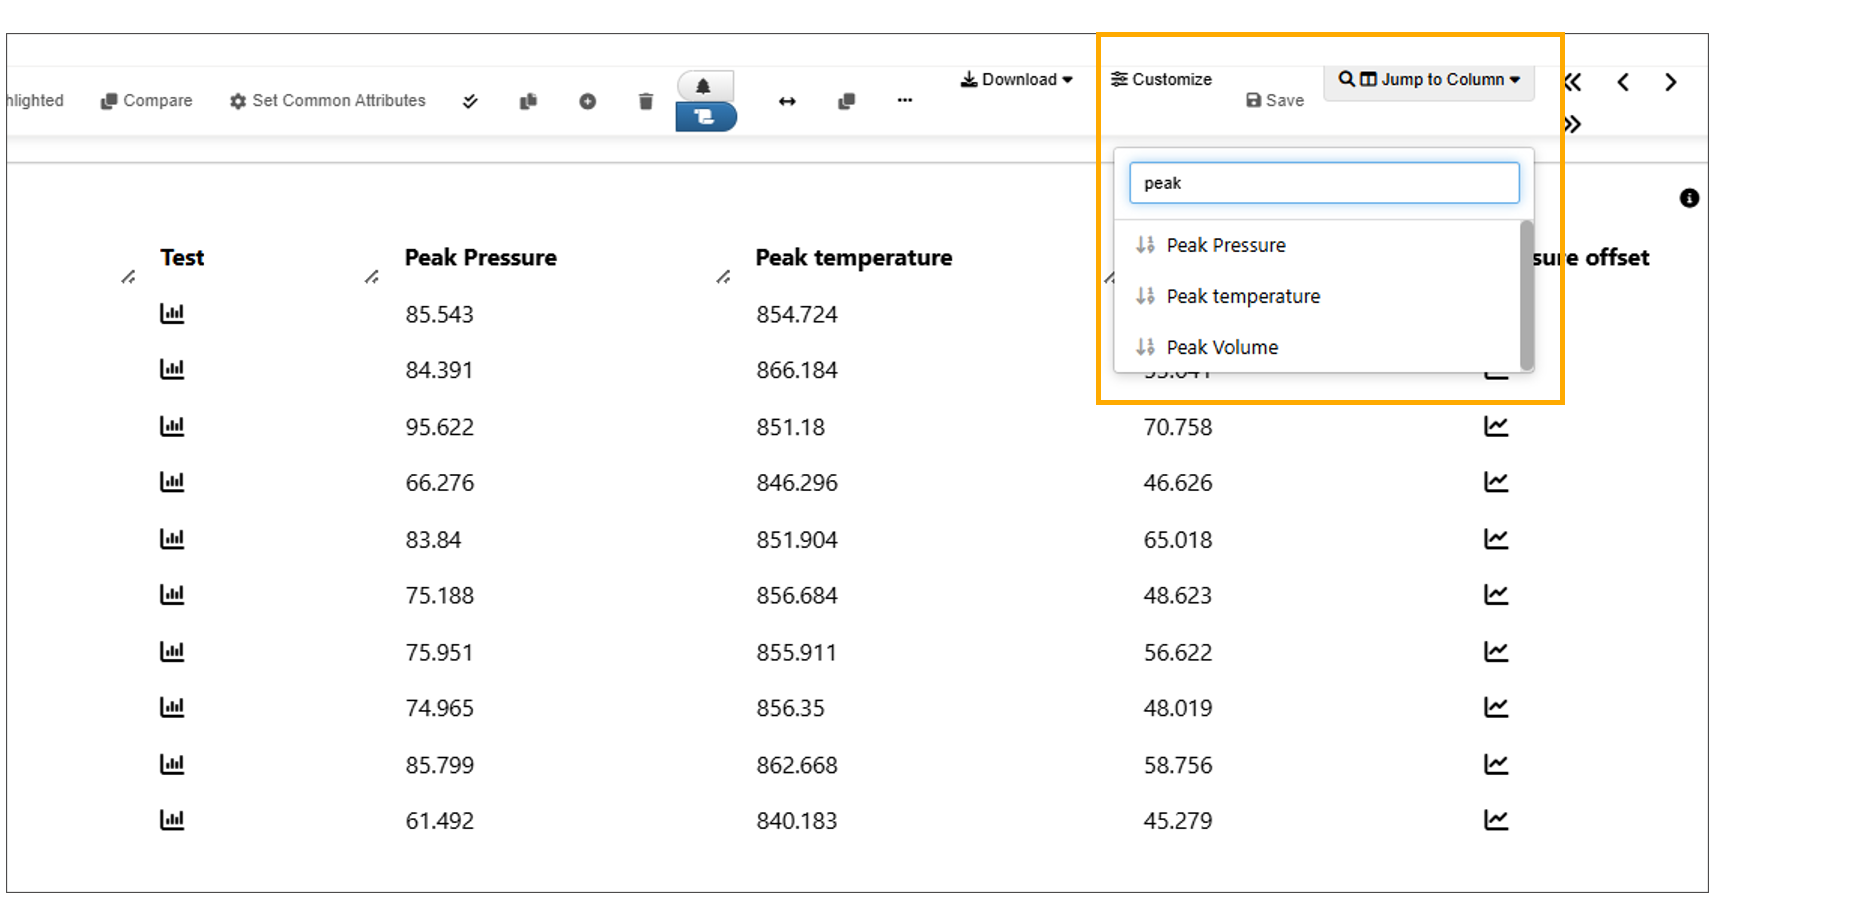
The Expanded view scroll buttons are now shown as 4 buttons: << , < , > & >> in Datatable.
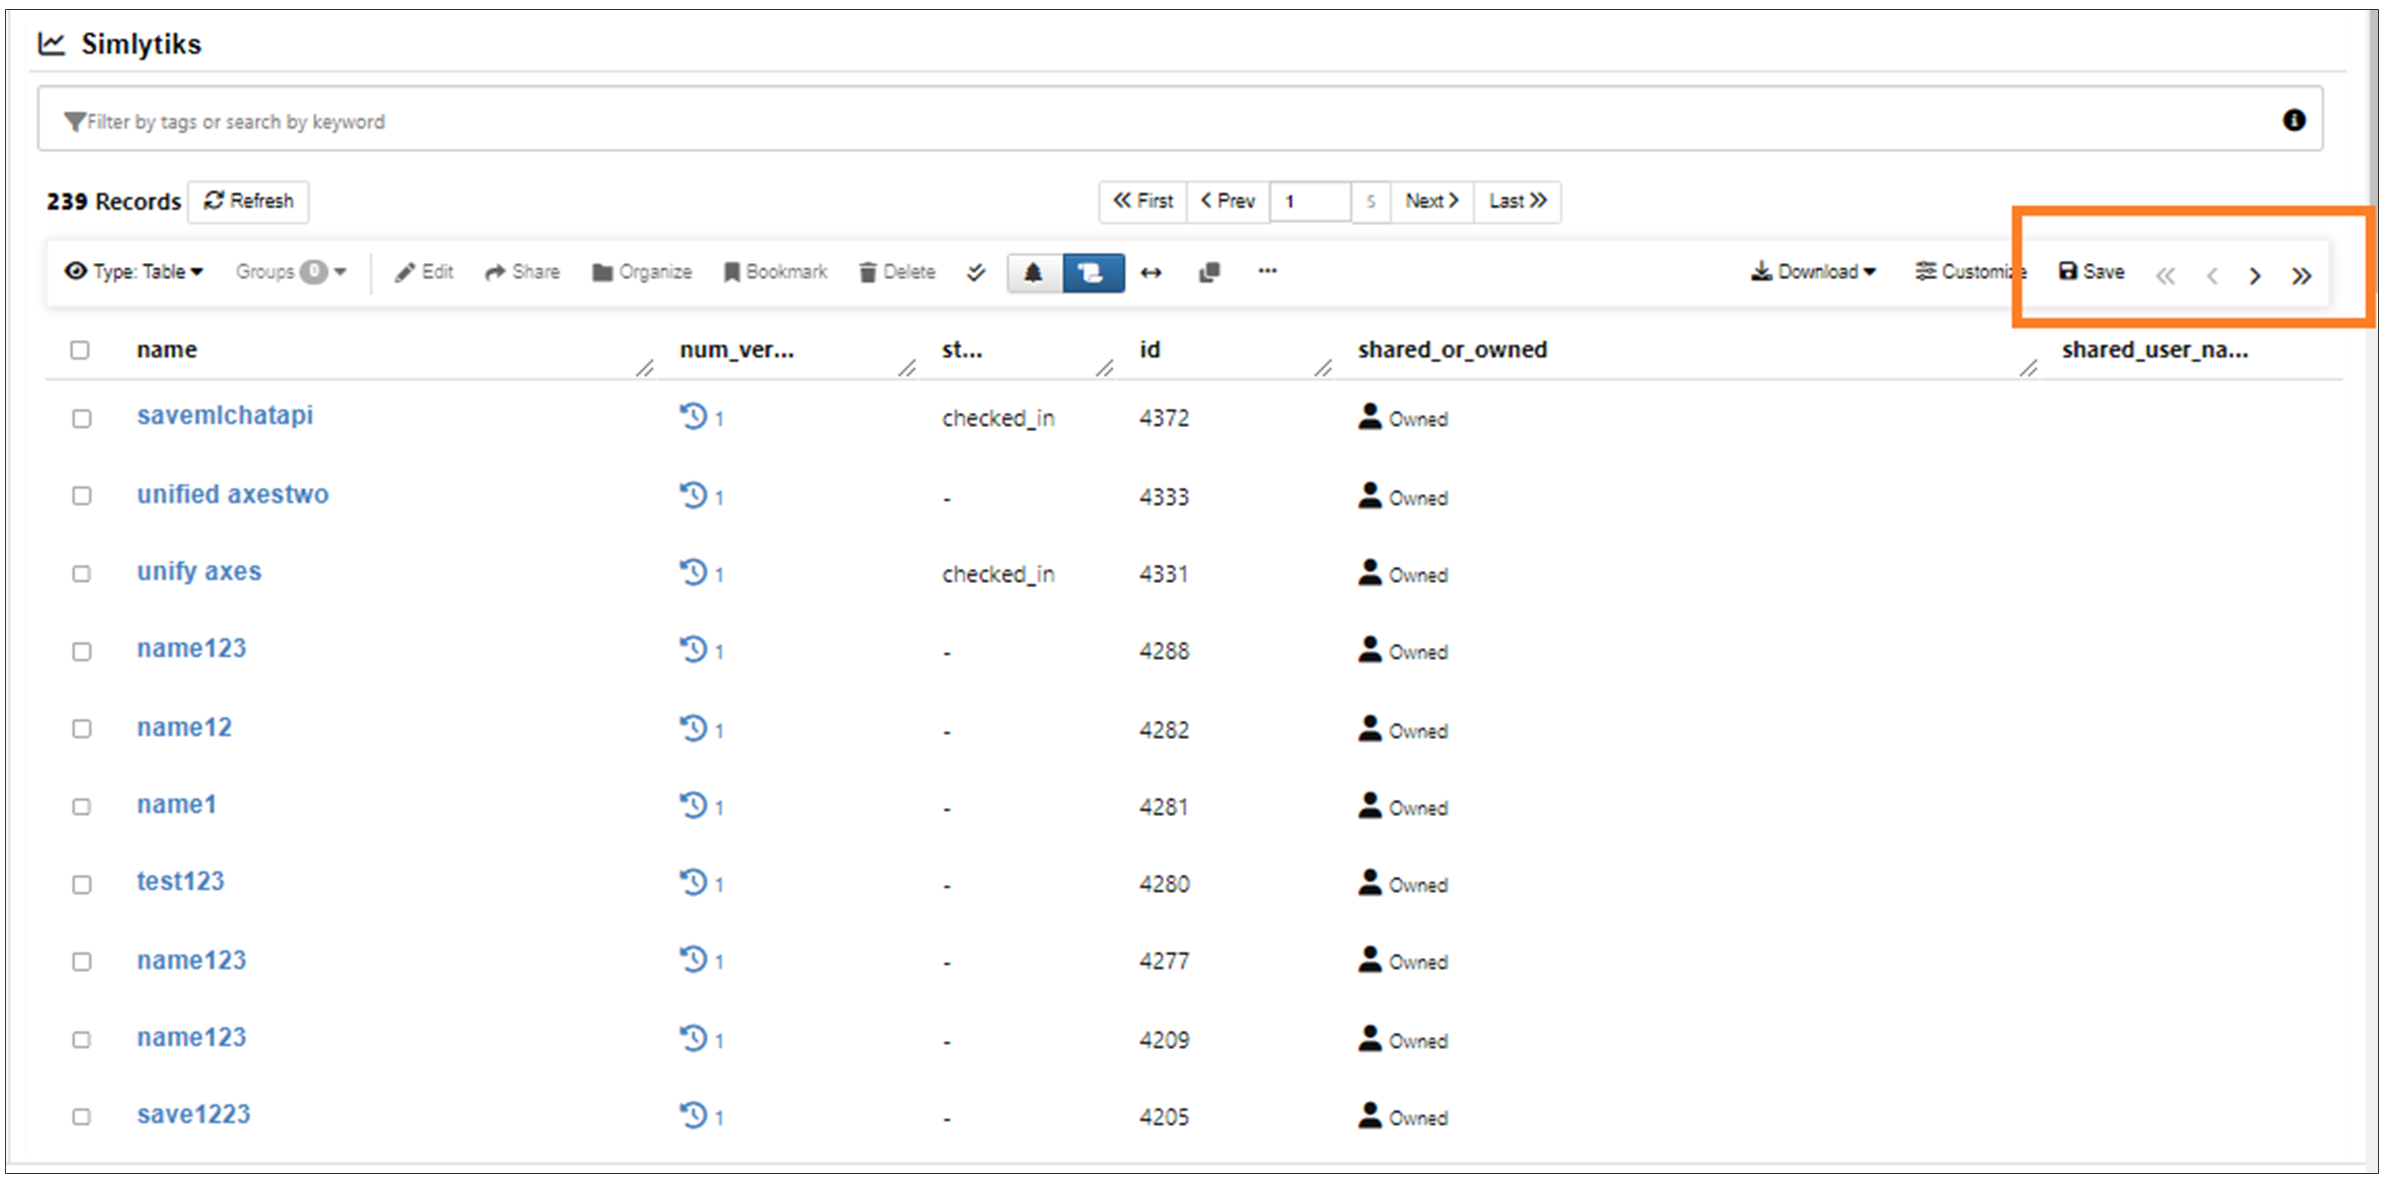
The Expanded view
Data table header columns have new Context menu option to add color to the column values. These values can be saved or can be Reset to original based on the requirement.
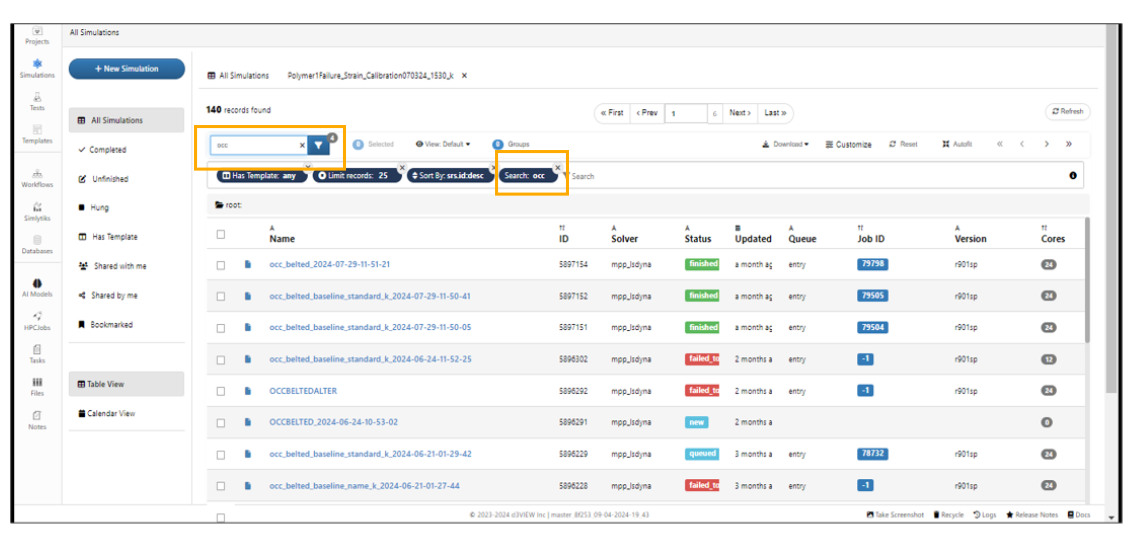
Two new search options added to DataTable below the enable search option under customize setting. These two new search options helps user to find the records as required.
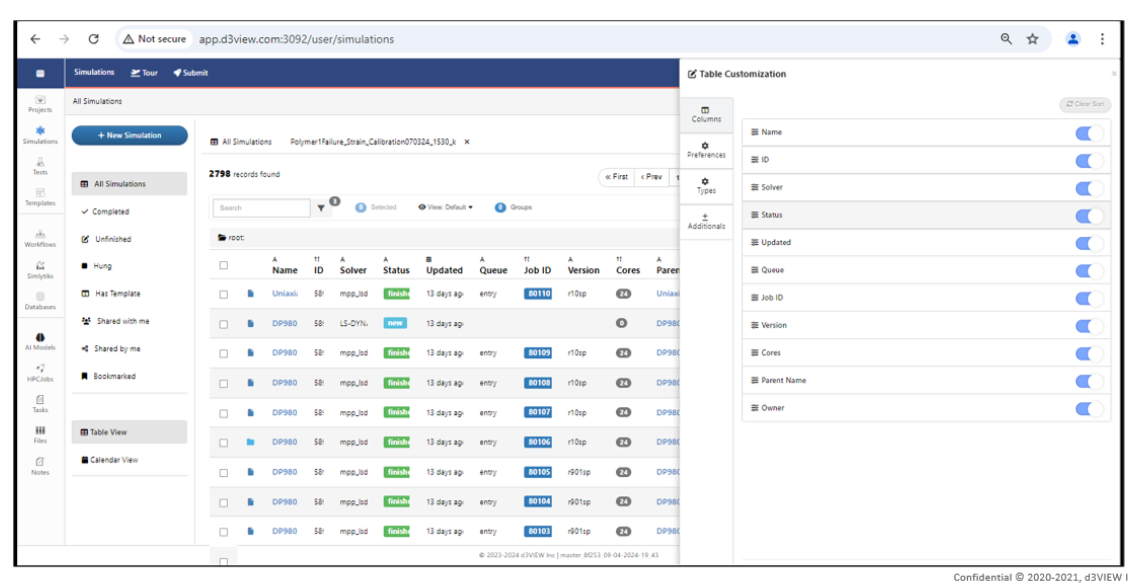
The new Data table columns can be shown and hidden in the customize option by enabling/disabling the column names.
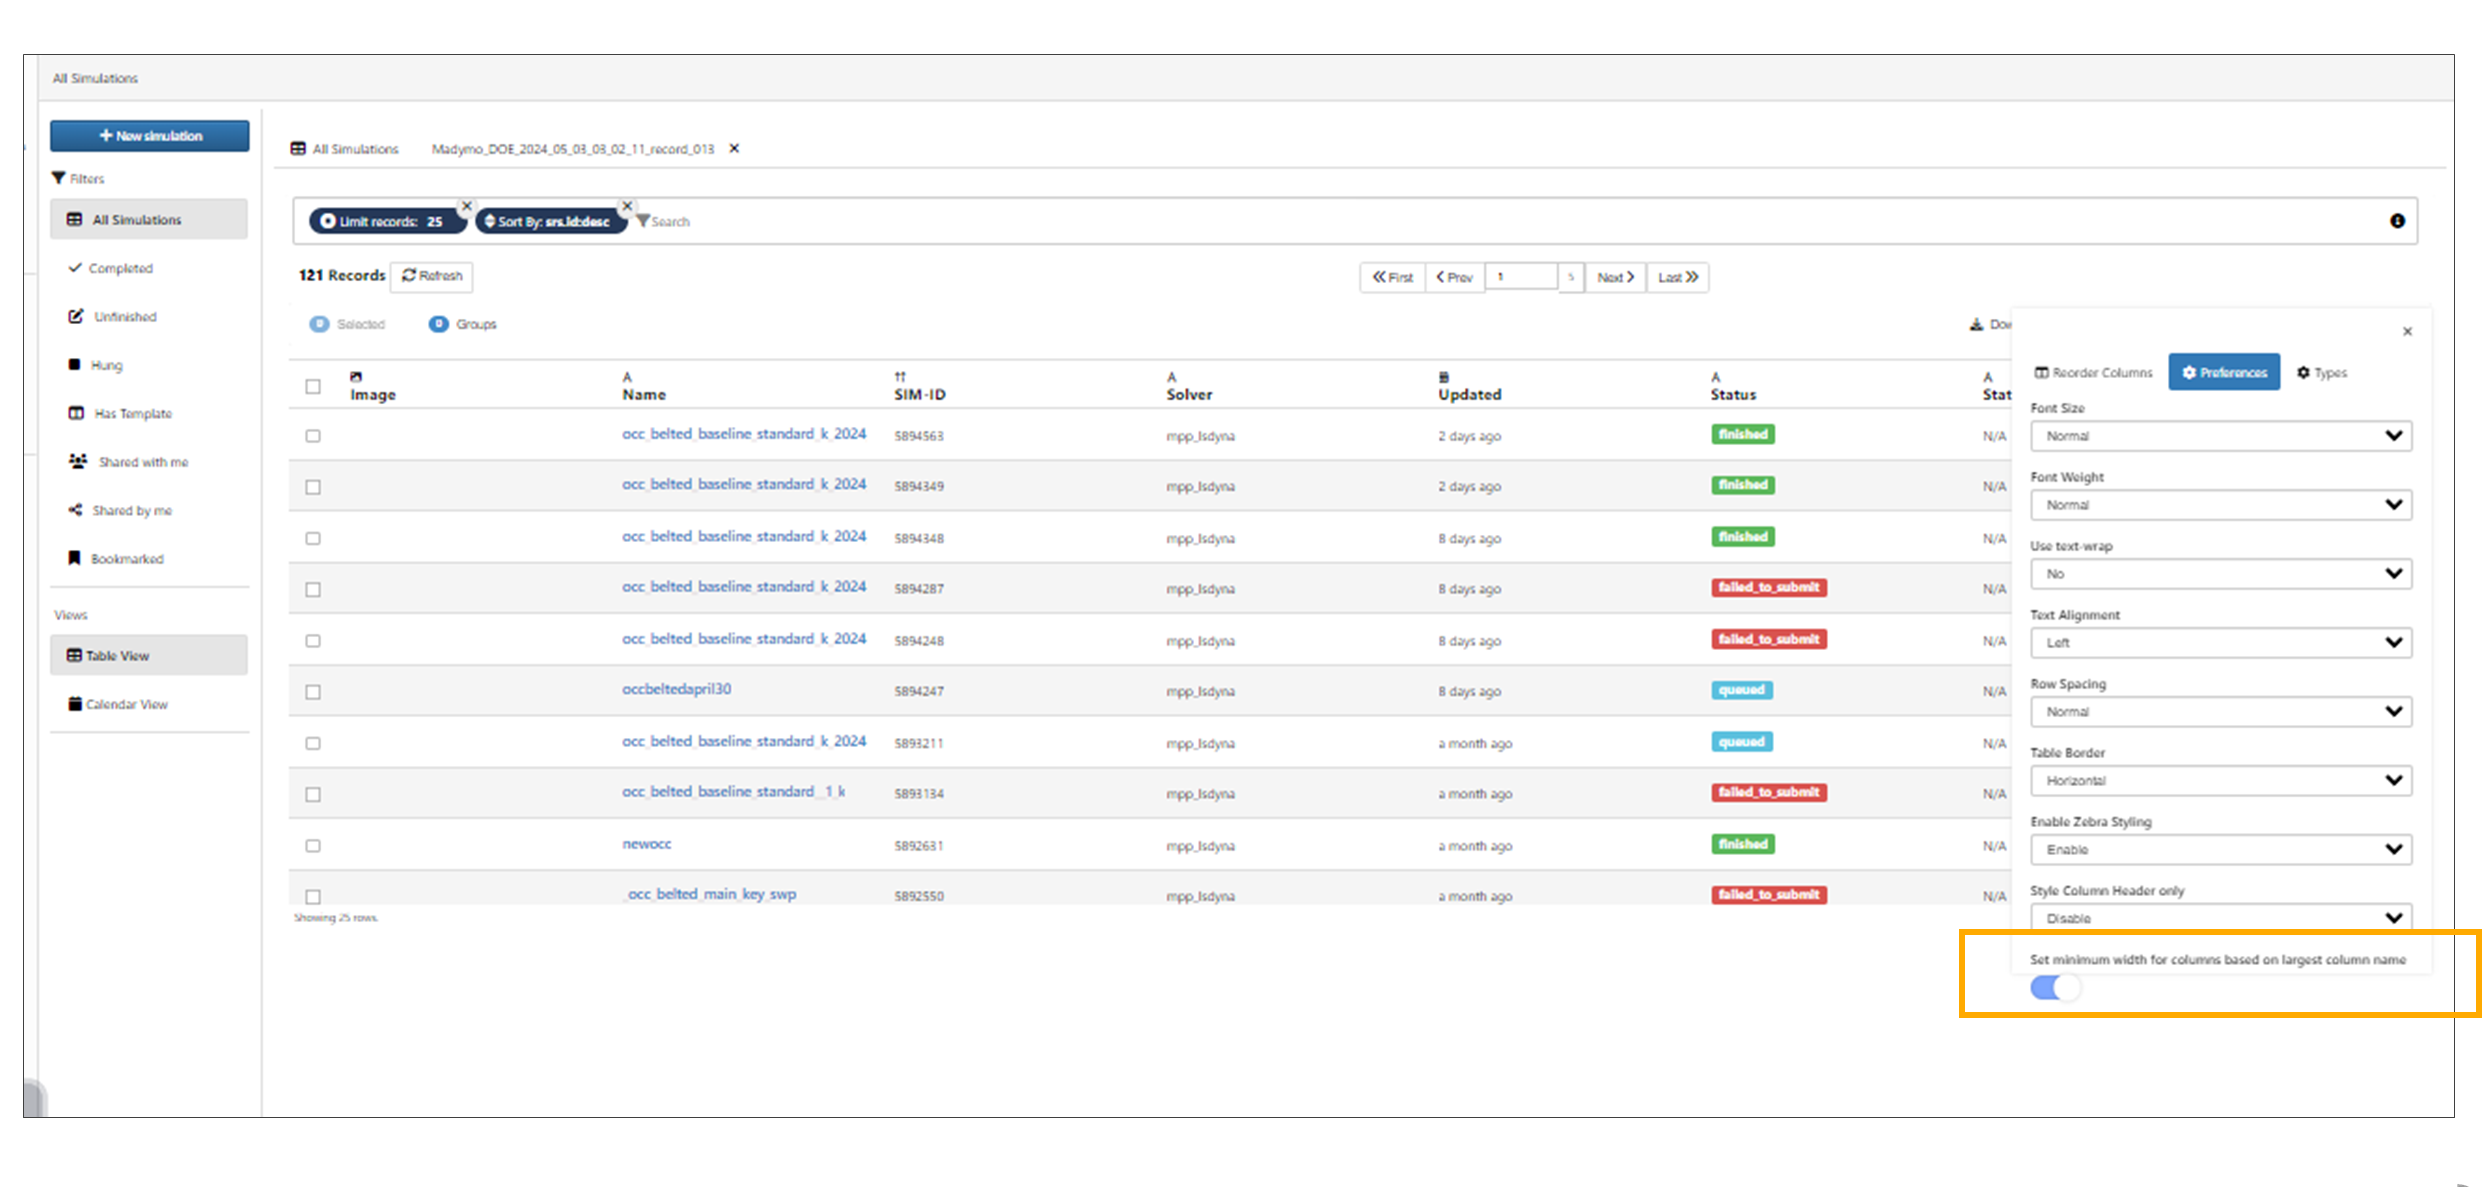
New setting is available for Datatable under customize option to set the minimum width of columns based on largest column name. This option when enabled , all columns will be set to constant width based on the largest column name in the page.
The setting ‘Set minimum width for all columns based on largest column name’ for datatable is now enabled by default in all datatables.
Datatable across the d3VIEW platform is updated; default columns are reduced and the column default width is removed.
New Table has a new feature in the header called Autofit which will fit each column (scalars) to the maximum width of their contents.
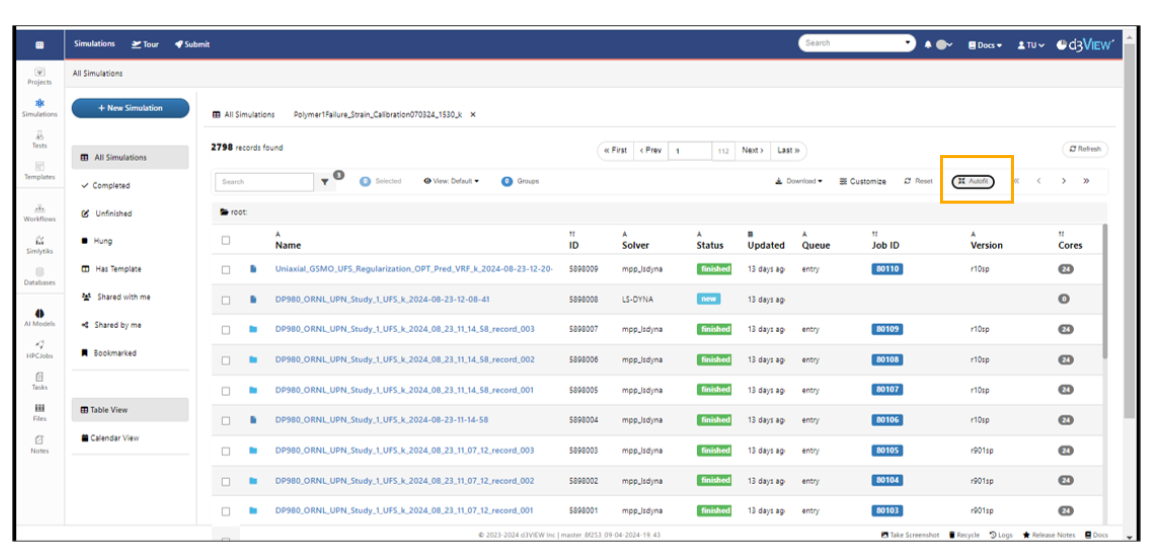
Newly added search in the header of Datatable will now link to the global filter search ( present within the filters) and changes in filter search will sync with the input.
In Datatable -> New filters in the header can now be synced with Simlytiks global filters by clicking the Save button in datatable settings header which will not only link to Tools -> Filters but also re-render other charts.
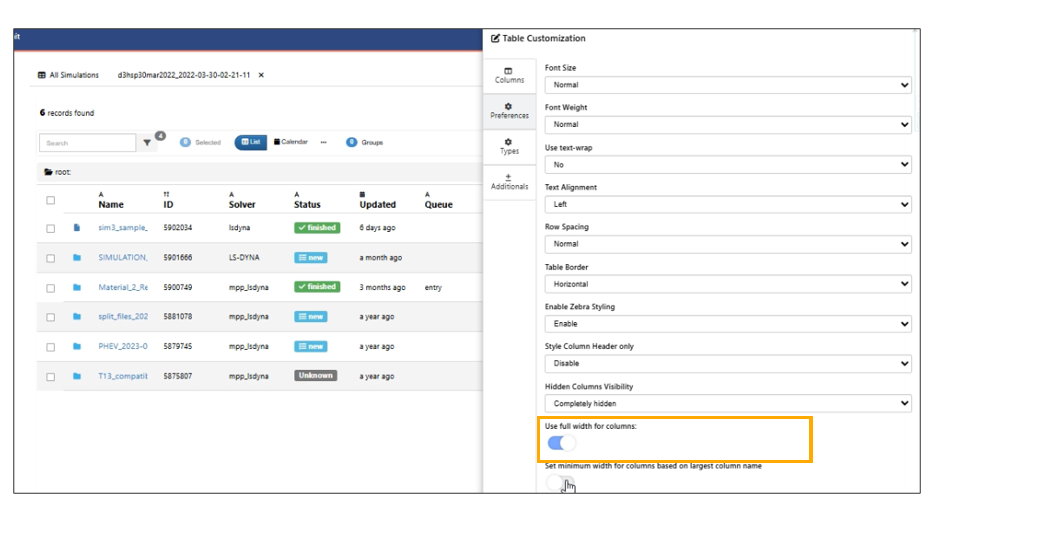
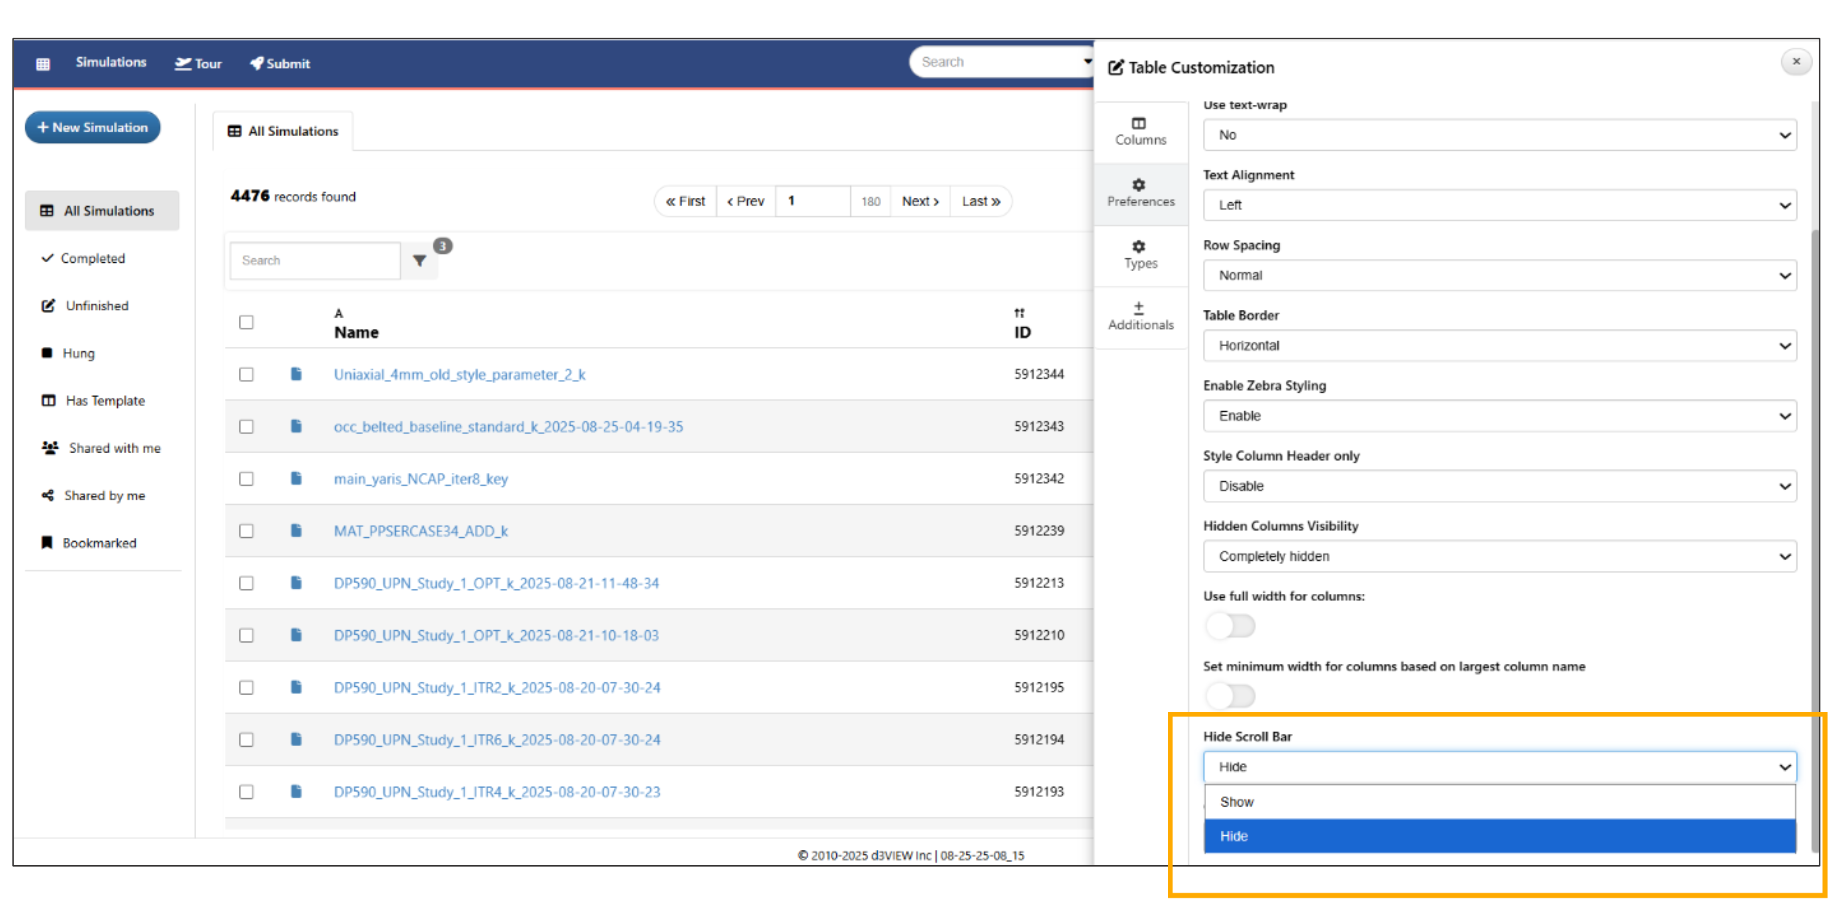
Datatable has a new option in the Customize -> preferences tab to ‘use full width for the columns’.
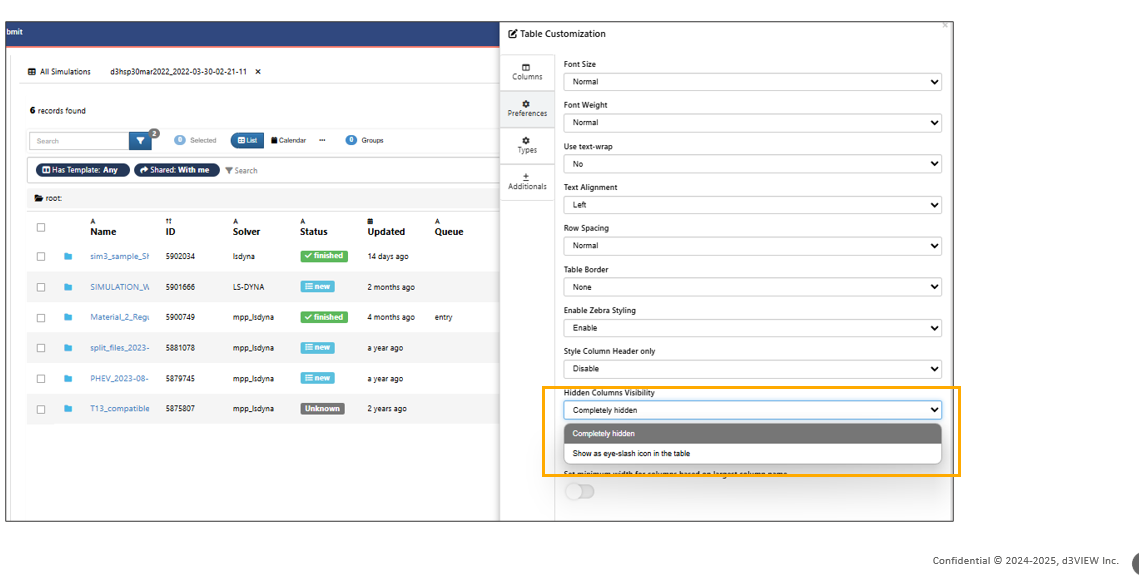
Datatable has a new setting in the Customize -> Preferences list to hide the columns completely from the table.
Horizontal bar
New option in Customize menu to hide/show horizontal scrollbar is available for Datatables.
New option in Customize menu to use horizontal scroll with left/right buttons and smooth scrolling is available in datatables.
Select/deselect
The re order columns in customize option under Datatable has new button to select/deselect all column checkboxes.
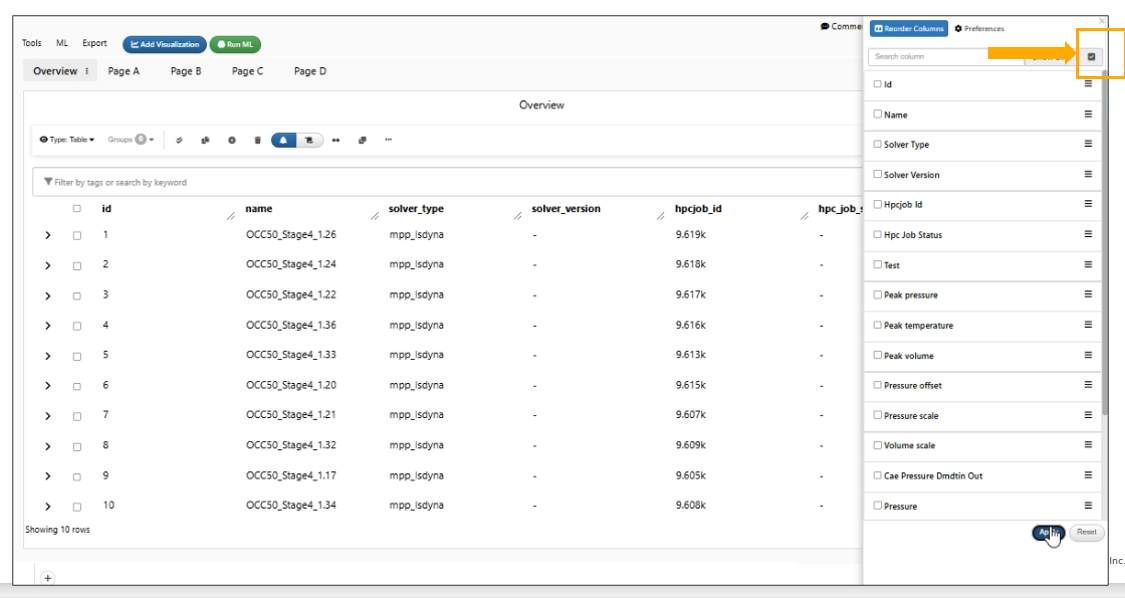
The Datatable has select all and deselect all checkbox in the customize option to enable users to select desired columns in the table
Filters in DataTable
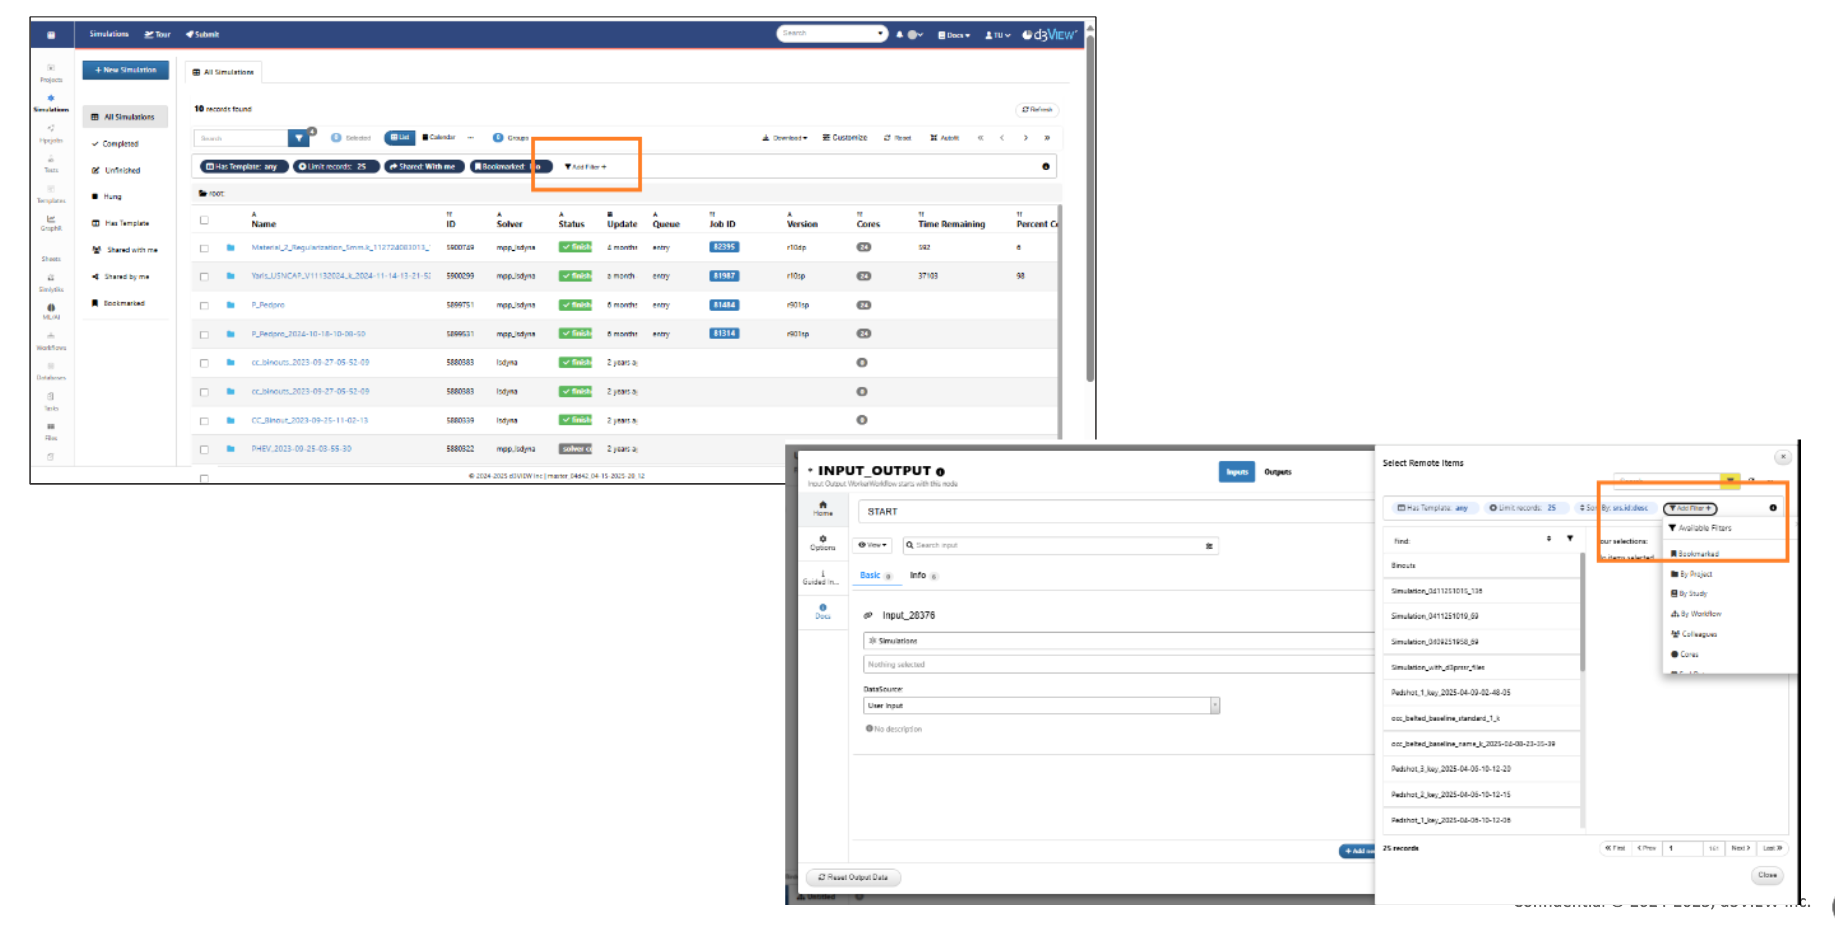
New button called ‘Add filters’ is added to the filter search in data tables across the platform. This helps user in finding filters and fetch records.
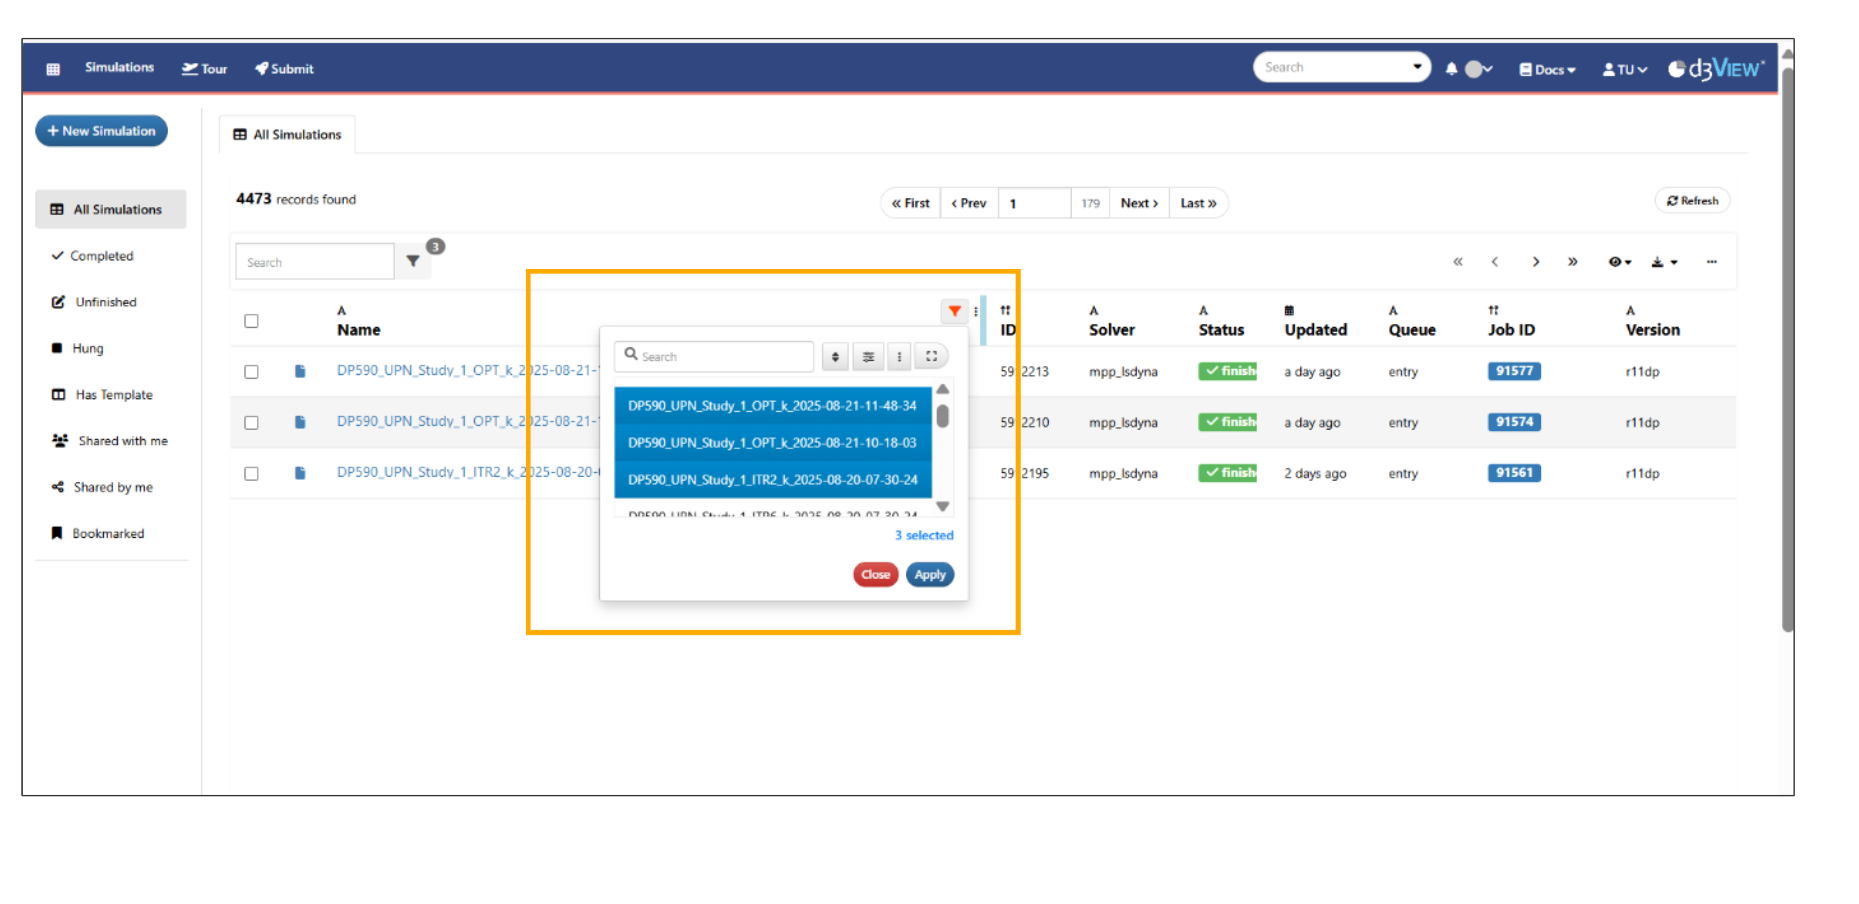
DataTable filters dropdown within column headers now supports multi-select for text columns.
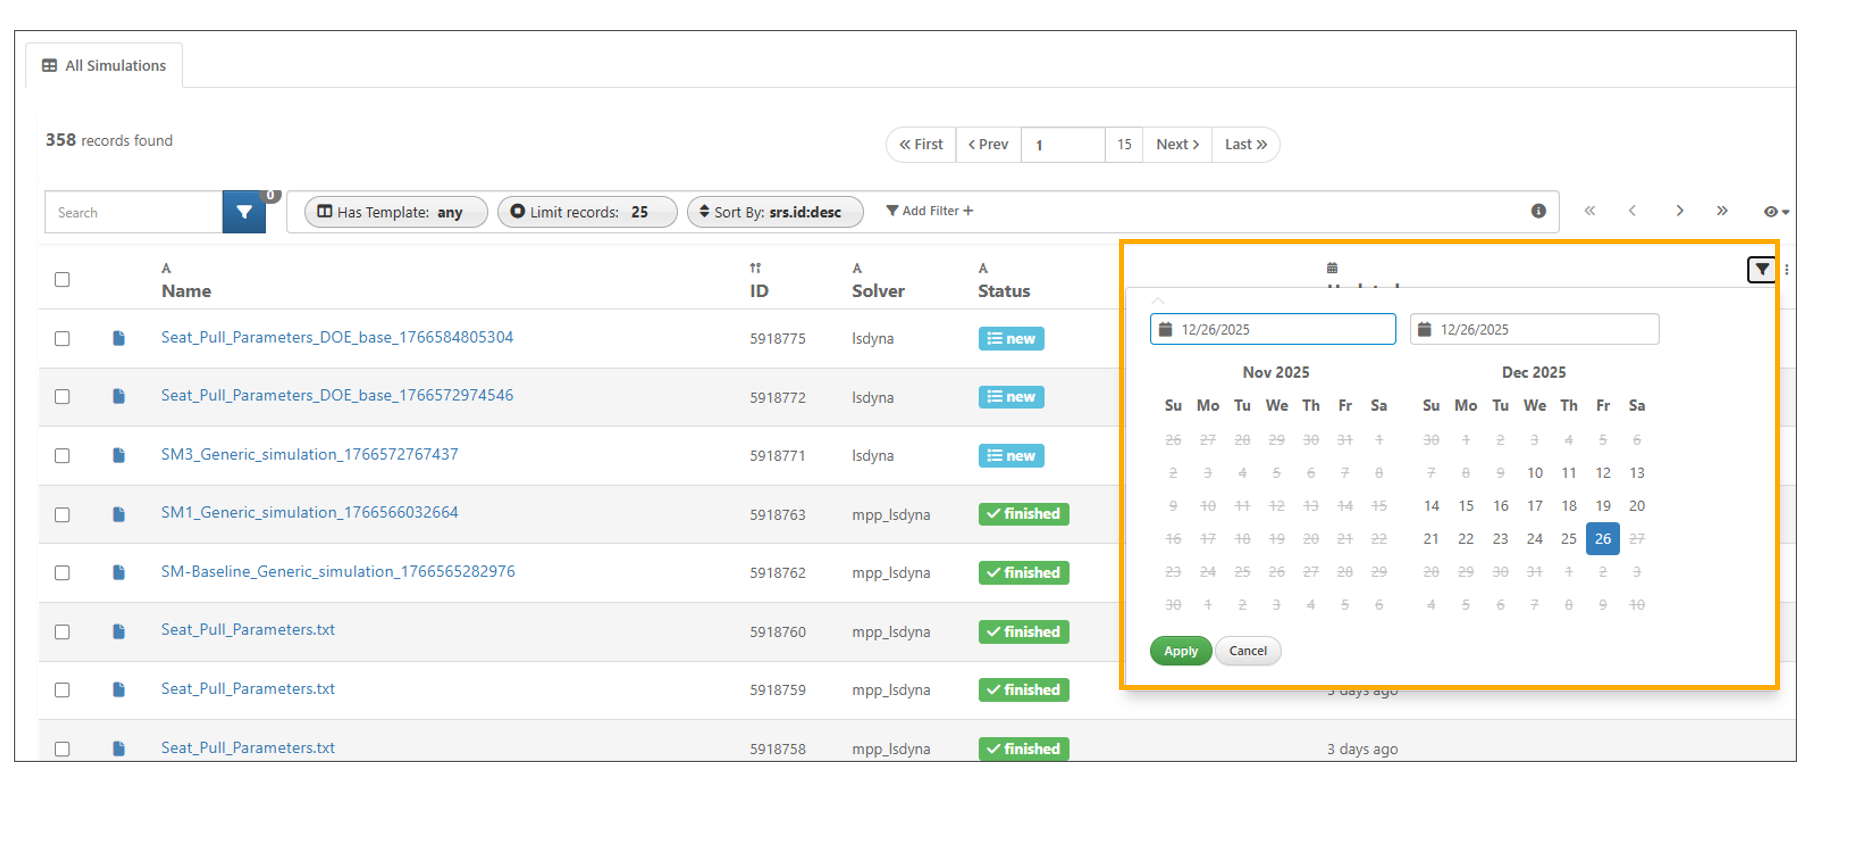
In Datatable, the Filters dropdown now includes an inline date range picker for date and datetime columns.
Datatable header bulk options
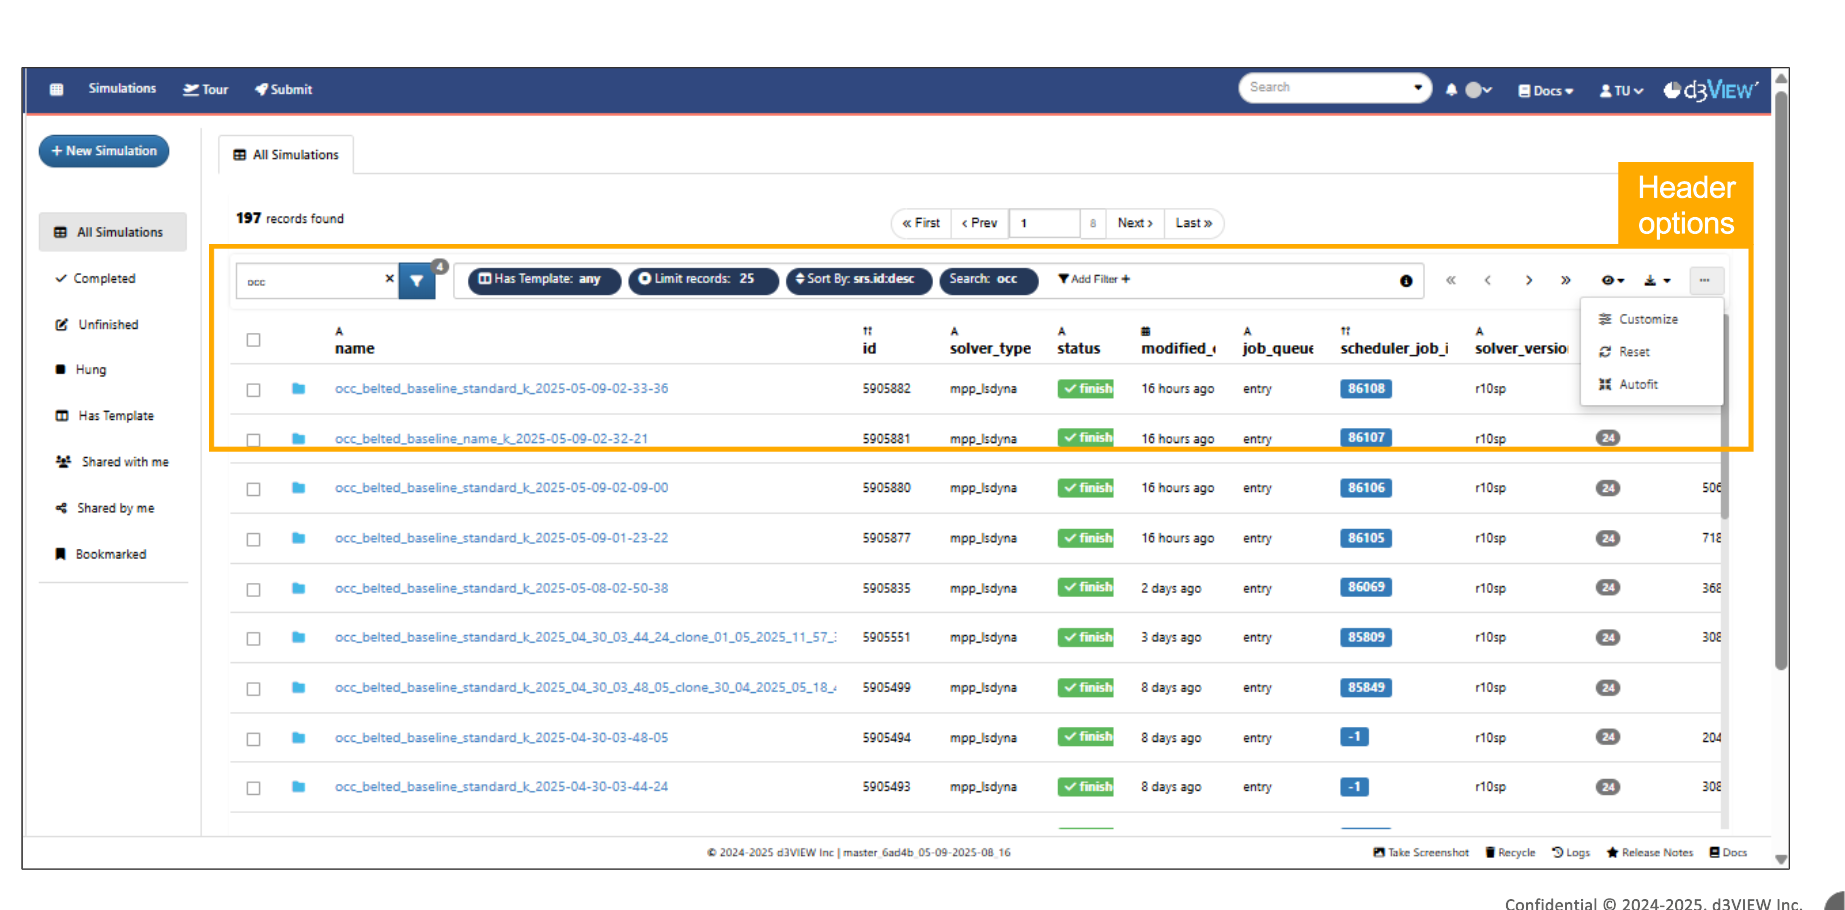
The Datatable header is updated to have the search , filters and other options of the table in the same row with dropdown
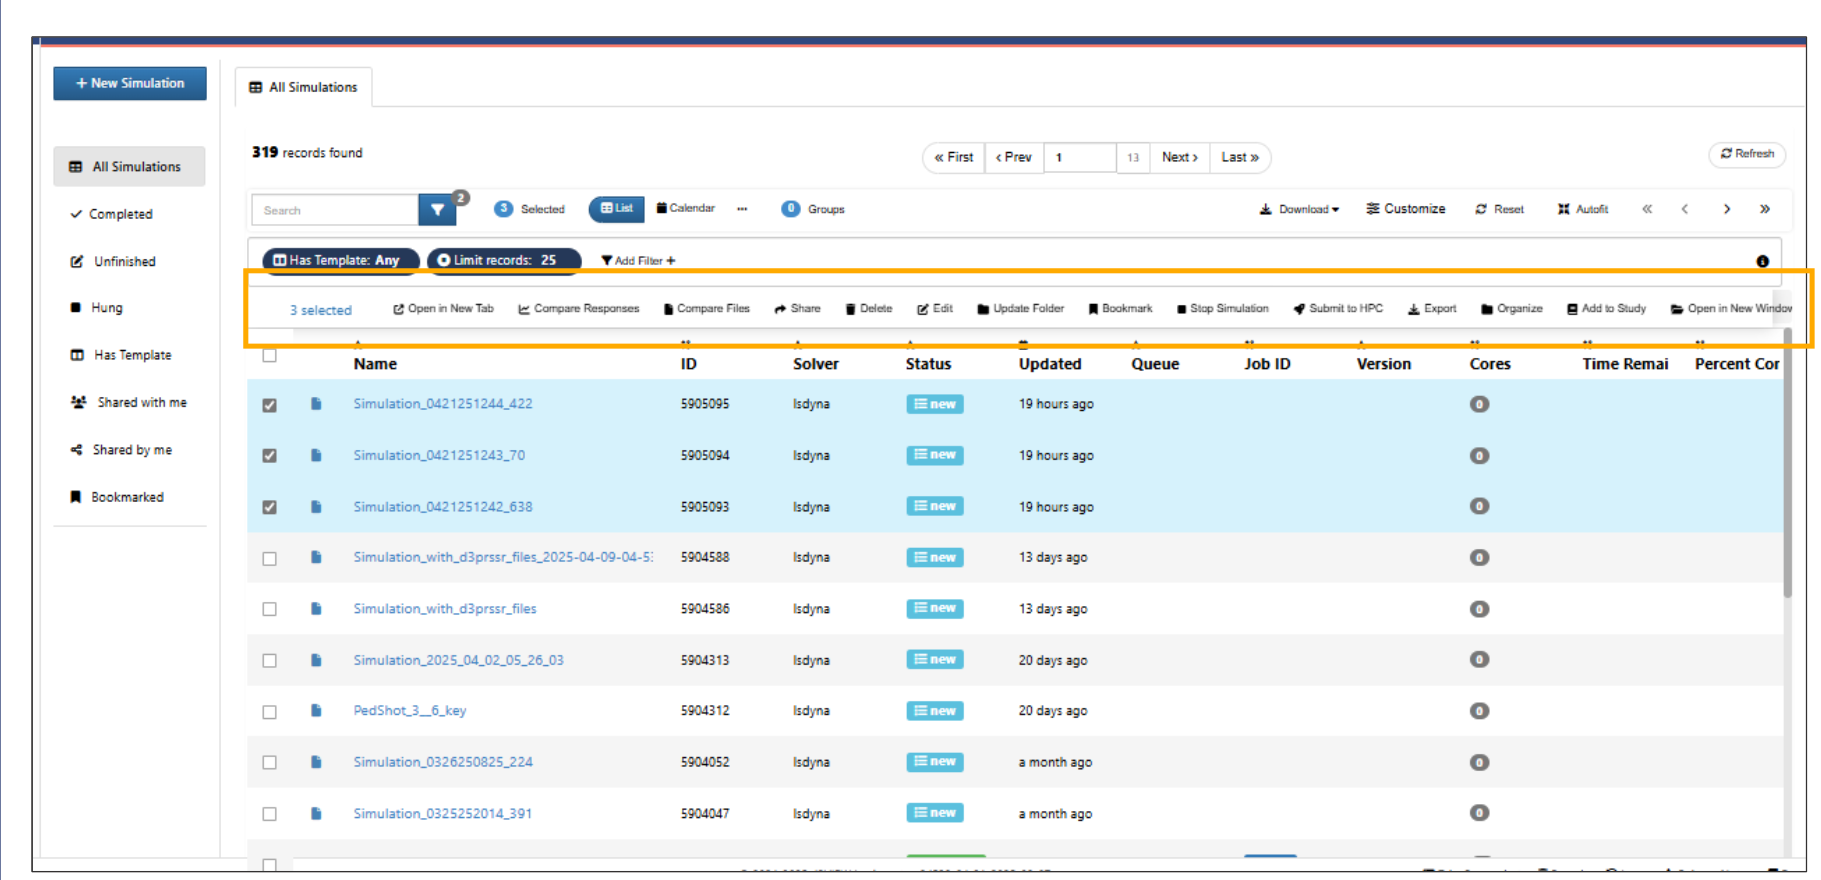
The records selected in Data table will show a new header with options such as share, delete, compare, export , bookmark, etc.
Reverse selection option is now available in the context menu of the selected records in datatable.
Header bulk options are added to HPC jobs page for selected records
The datatable will show the bulk header options in ‘Dropdown menu’ for the selected records in the page.
Re arranging
The Datatable now has a new option called ‘Row re-ordering’ option which allows user to rearrange the rows in the datatable. This option can be reverted back by refreshing the page or by using the reset option in table
Apply and Save
‘Apply Changes’ button helps to apply all changes at once, along with a search bar to filter columns by name under customize option in Datatables.
In Datatable, column customizations help rendering columns based on the applied filters.
Importing Additional Data
Importing Assets
You can import images/alias/colors from other datasets into your current dataset. This is useful if you need consistency in your data customizations through out all your explorations.
Figure 10: Importing Assets
Importing Updated Data
You can update your dataset by importing additional data and choosing to replace, join or append new with original data.
Here’s how it’s done:
This option can support merge when duplicate primary-keys are found as shown in the following video:
If an Excel has references to other sheets in Simlytiks, it takes a bit of time to fetch & store all values and a new alert message is shown while loading the Excel file.
Visualization Preview
All Visualizations’ preview options are now available on the top and Accept/Cancel buttons at the bottom of the viz preview modal in Simlytiks.
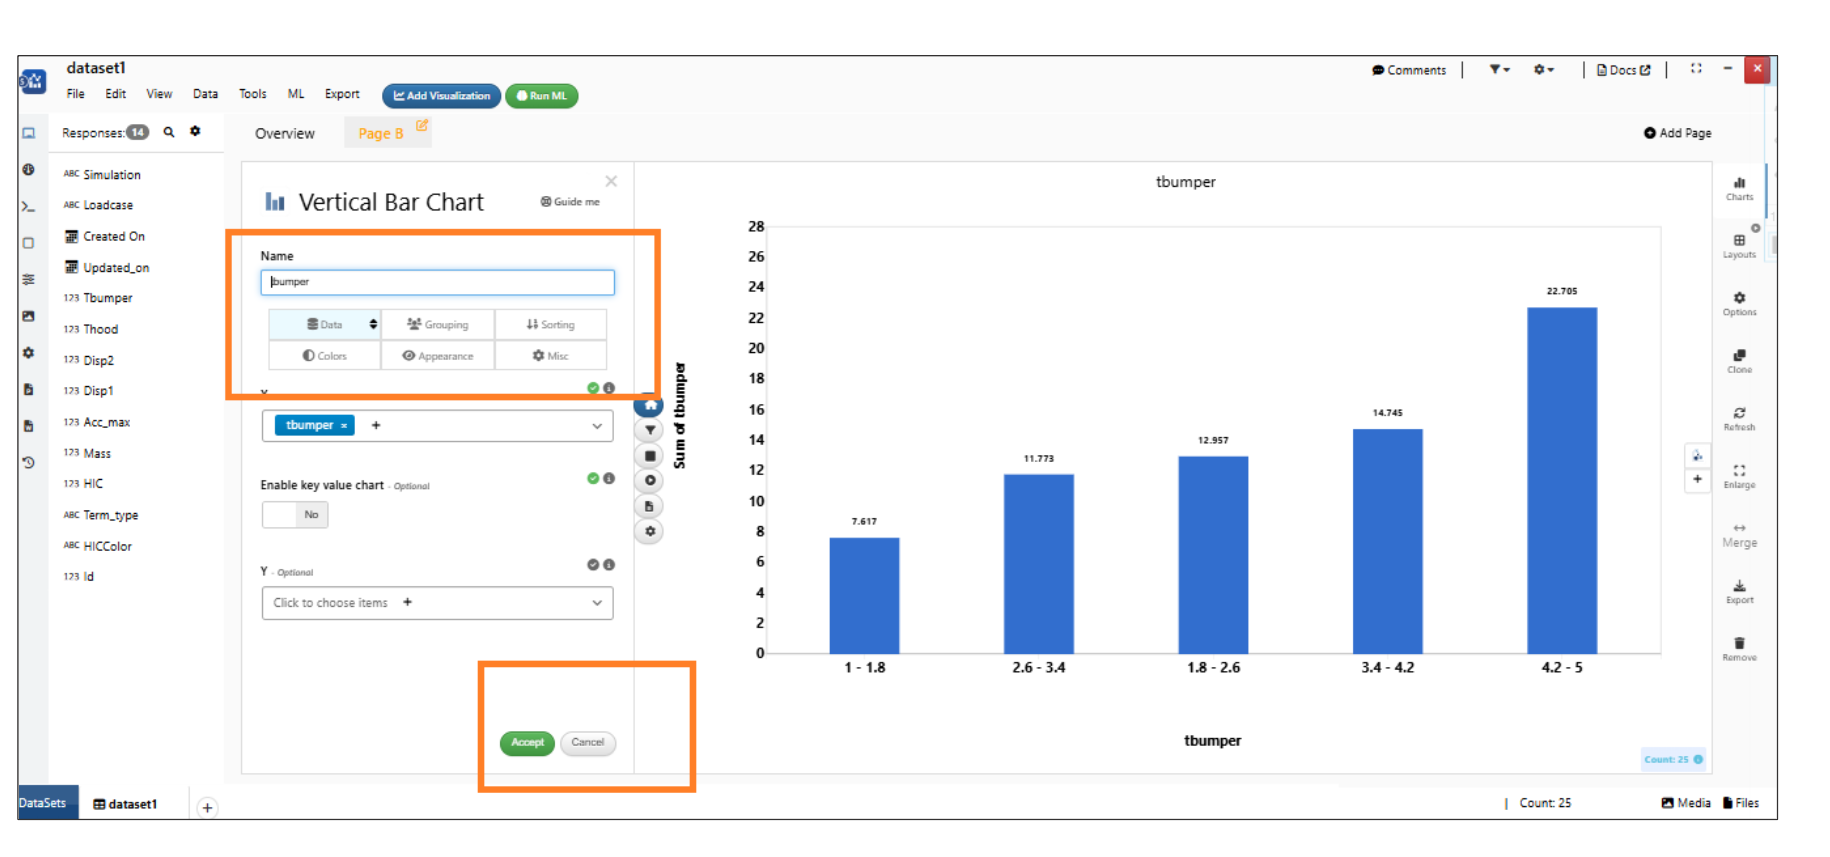
Preview Visualization
Export Options
Export Visualization
Added support to export visualizations in word format.
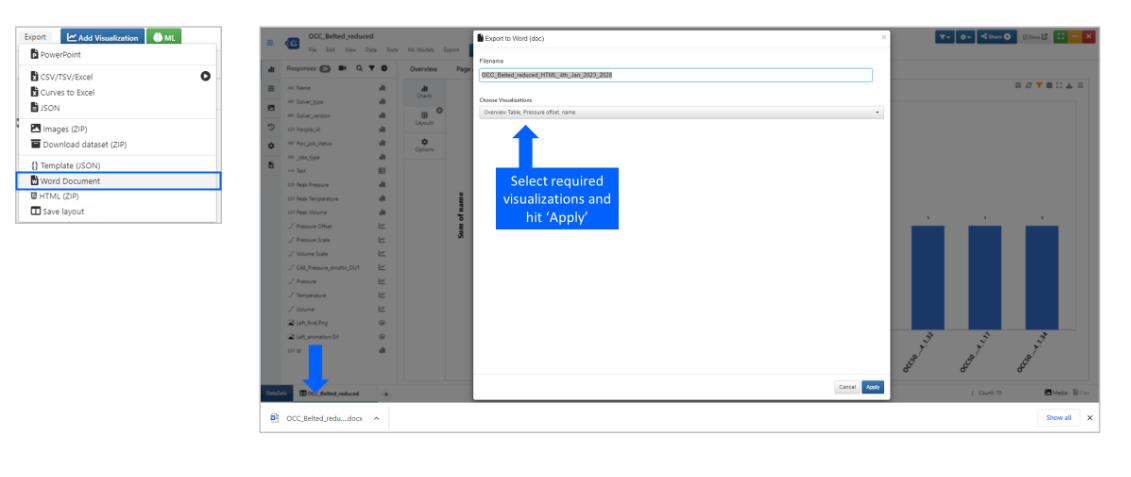
Export Visualization
Simlytiks dataset can be Exported as PowerPoint, CSV, Excel, Word, JSON, Images and Zip files.
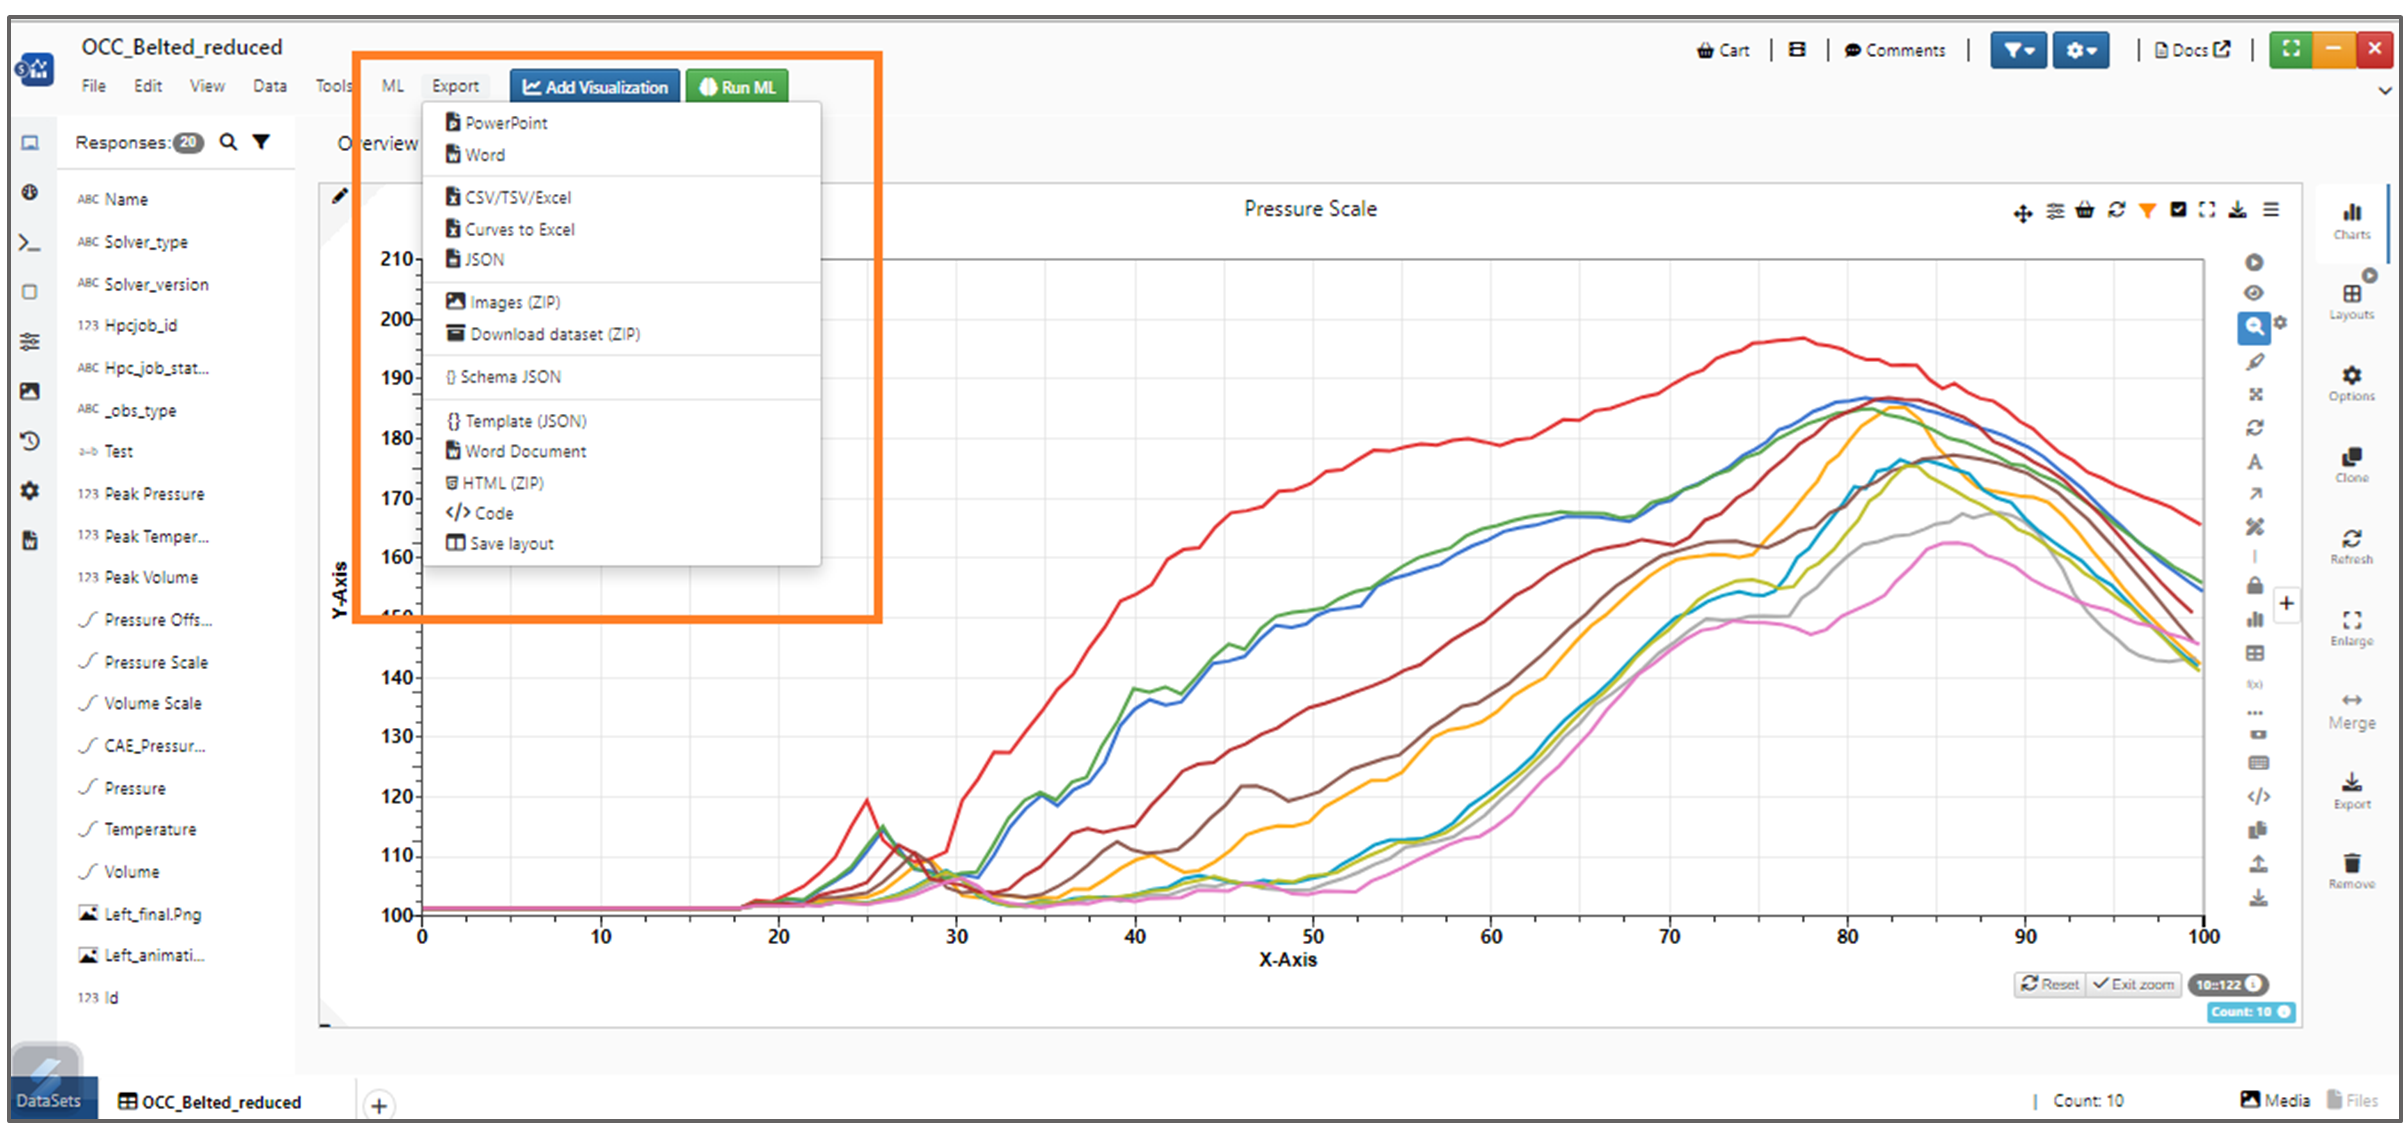
Export Options
Simlytiks now supports export of dataset/keyvalues from the datasets to an Excel in a scientific format and supports retrieval of the same.
In Simlytiks, exporting a dataset with curves to Excel now supports a new option to round up the decimal to a specific number of decimal places in exported file.
JSON export
All the visualizations in Simlytiks will support exporting as JSON file. This option is available in the settings of the visualization.
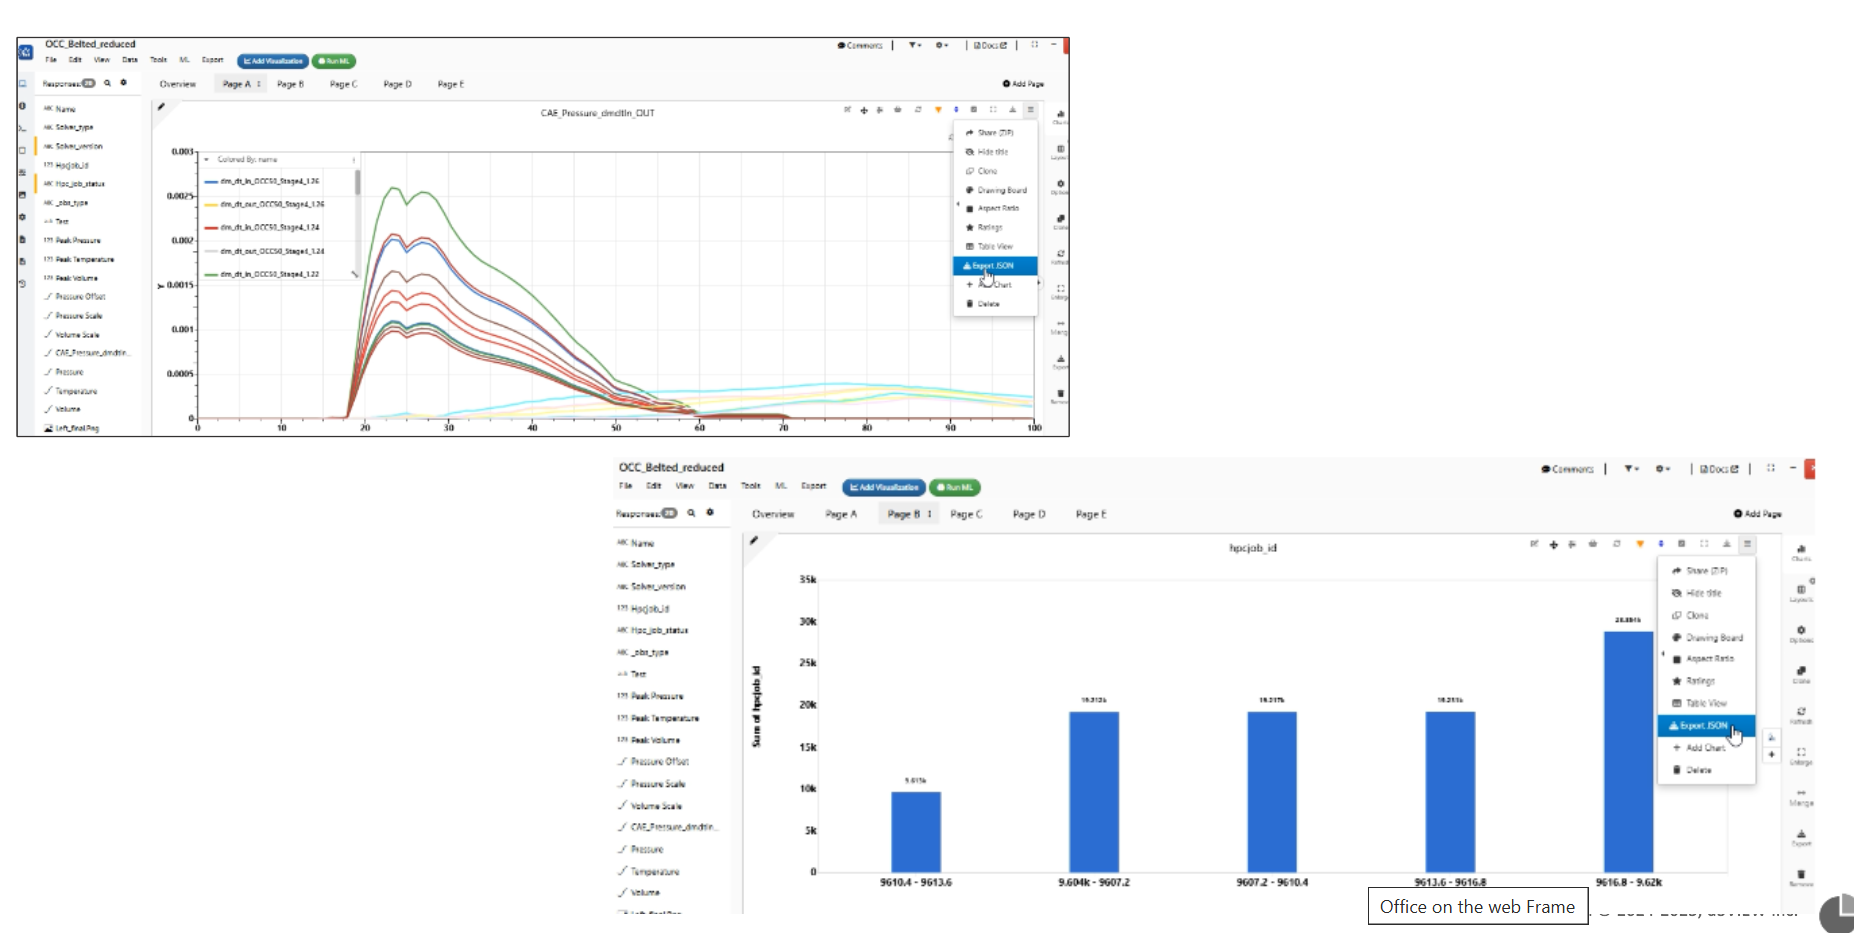
JSON Export
Export Zip with BSON
New option to Export in BSON format is added in the zip Export options of the dataset in Simlytiks which will cache the data thereby improving the performance of large dataset exports.
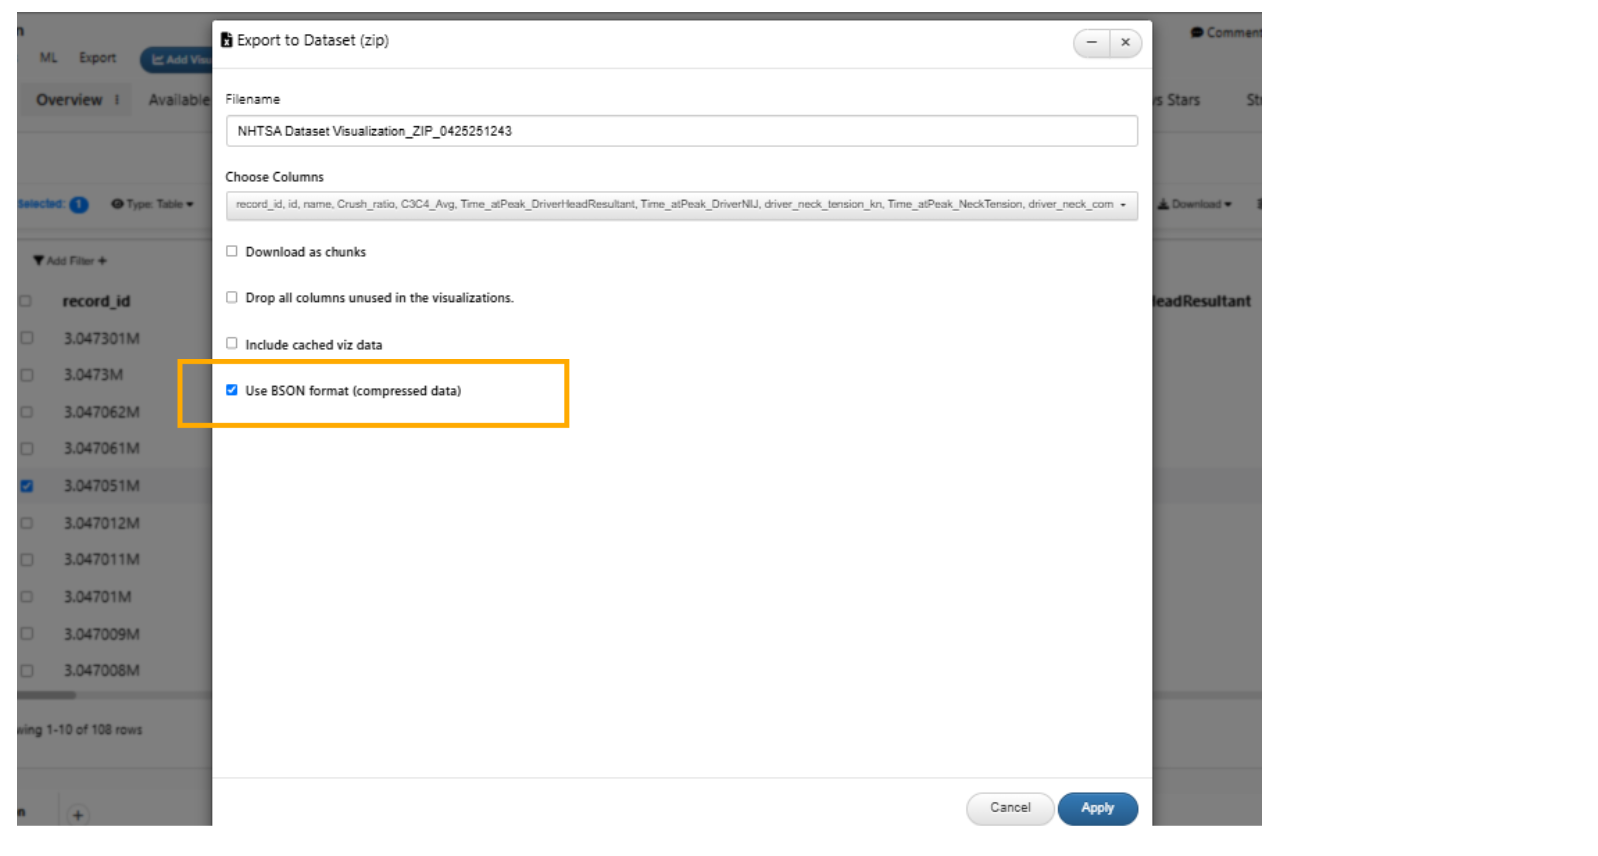
Export in BSON format
Large datasets that are available by comparing multiple Physical tests can be now exported as dataset using BSON format.
Export in ISO MME format
Simlytiks dataset now supports new exporting option called ‘ISO MME format’ for exporting data in ISO MME format, generating channel files, per-record folders with standard attributes, and a metadata file.
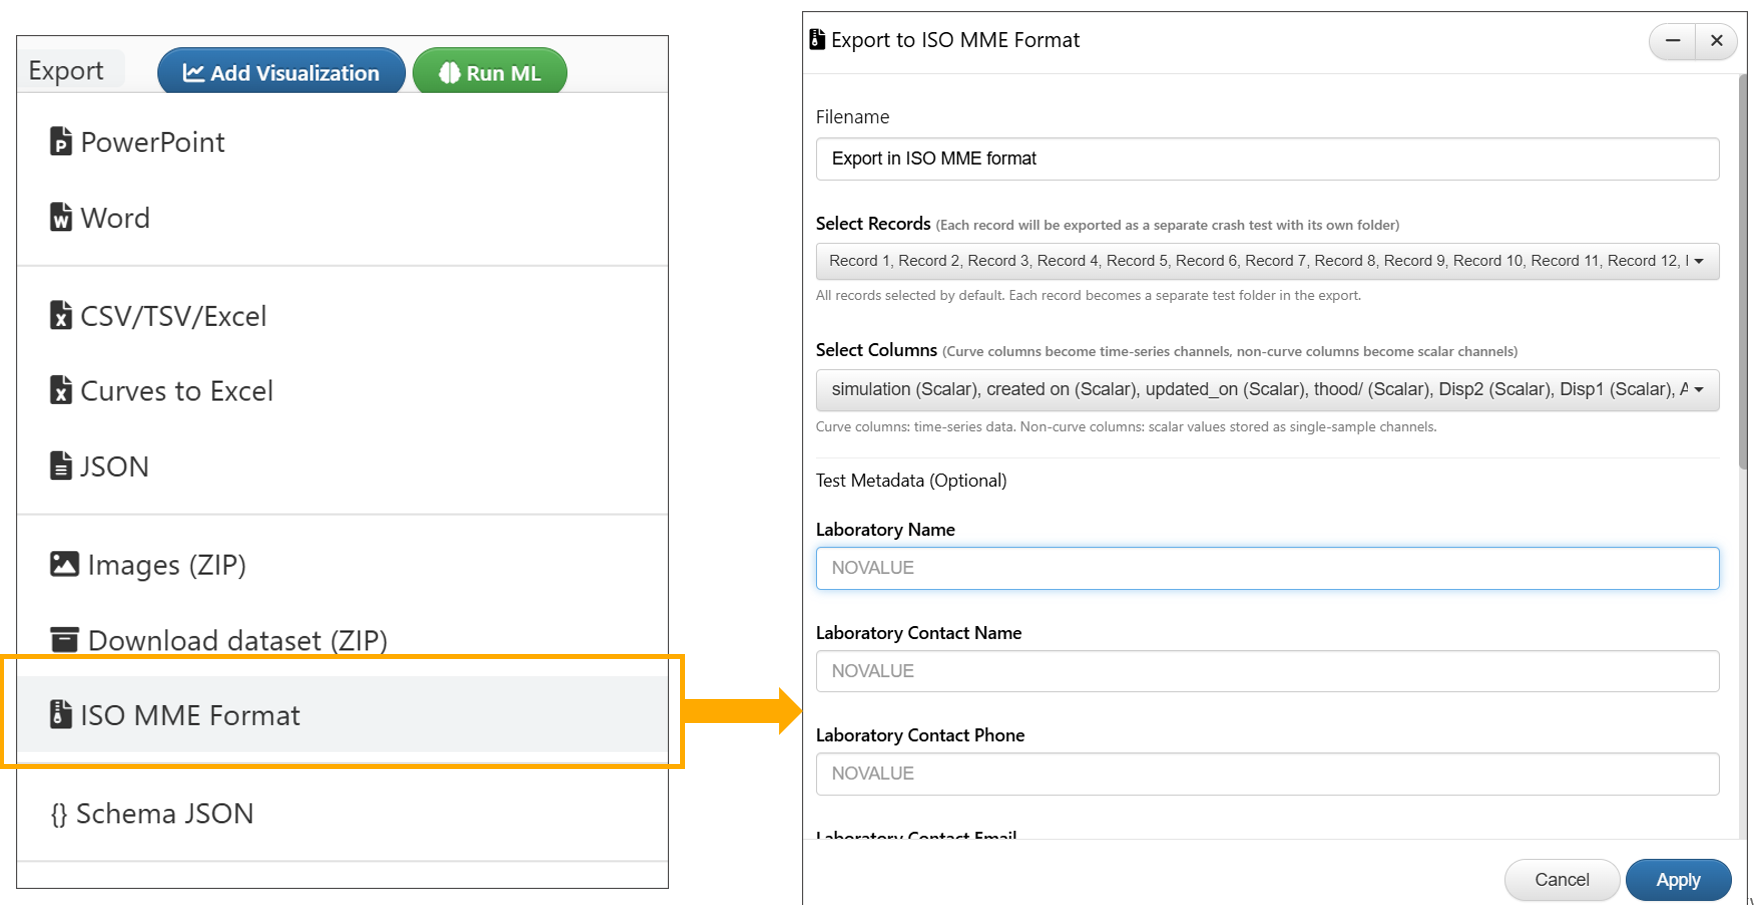
ISO MME format
Include all sheets
Multiple sheets with visualizations dataset can be exported by enabling the new option ‘Include all Sheets in the Zip’, available in the zip export modal in Simlytiks
Export Pages and Visualizations
Simlytiks datasets can be exported as a zip file by using the options - ‘Choose Visualizations’ & ‘Choose Pages’, to just select the required pages and/or the desired visualizations within a page.
Generate additional datasets based on active filters
In Simlytiks, when filters are applied under Tools → Filters, the Export ZIP option now shows a new option to generate additional datasets based on active filters. Upon re-uploading the ZIP, the header displays a database icon with a dropdown to switch between the filtered datasets.
In Simlytiks, additional datasets saved as ZIP file using Tools → Filters option will display the actual filter names in the header dropdown.
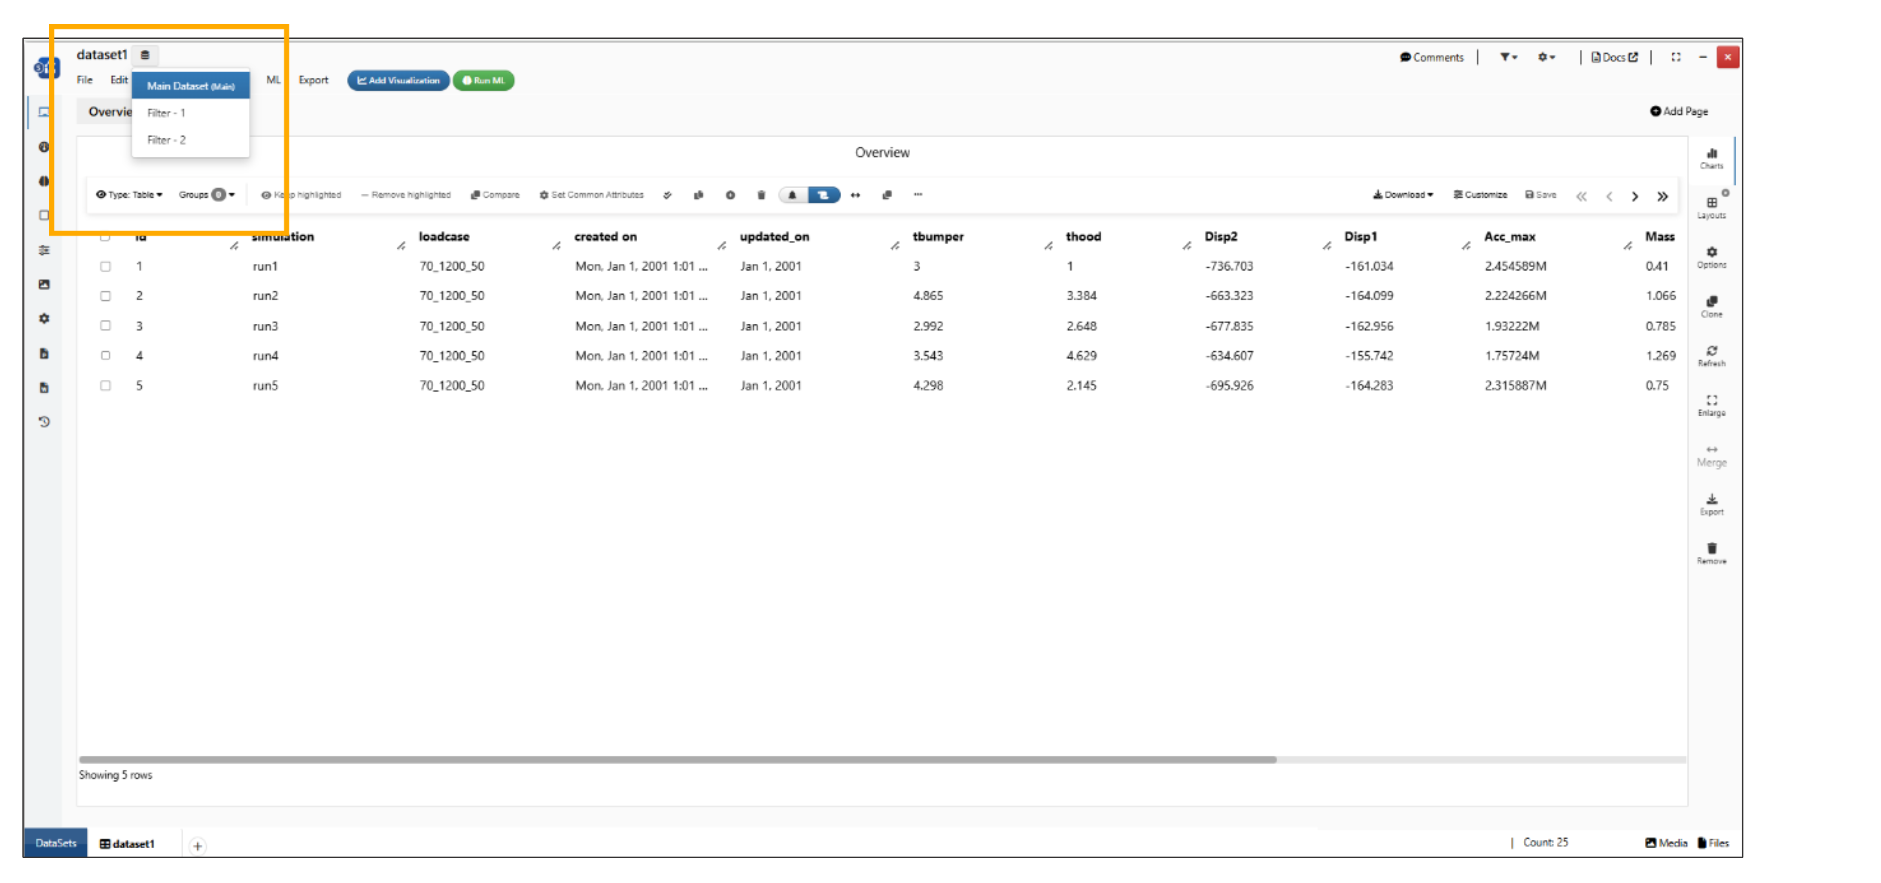
Filters name
Data Import
Data Import modal in Simlytiks is made user friendly now and has more changes in the UI and in the summary tab, match_maker now supports click events
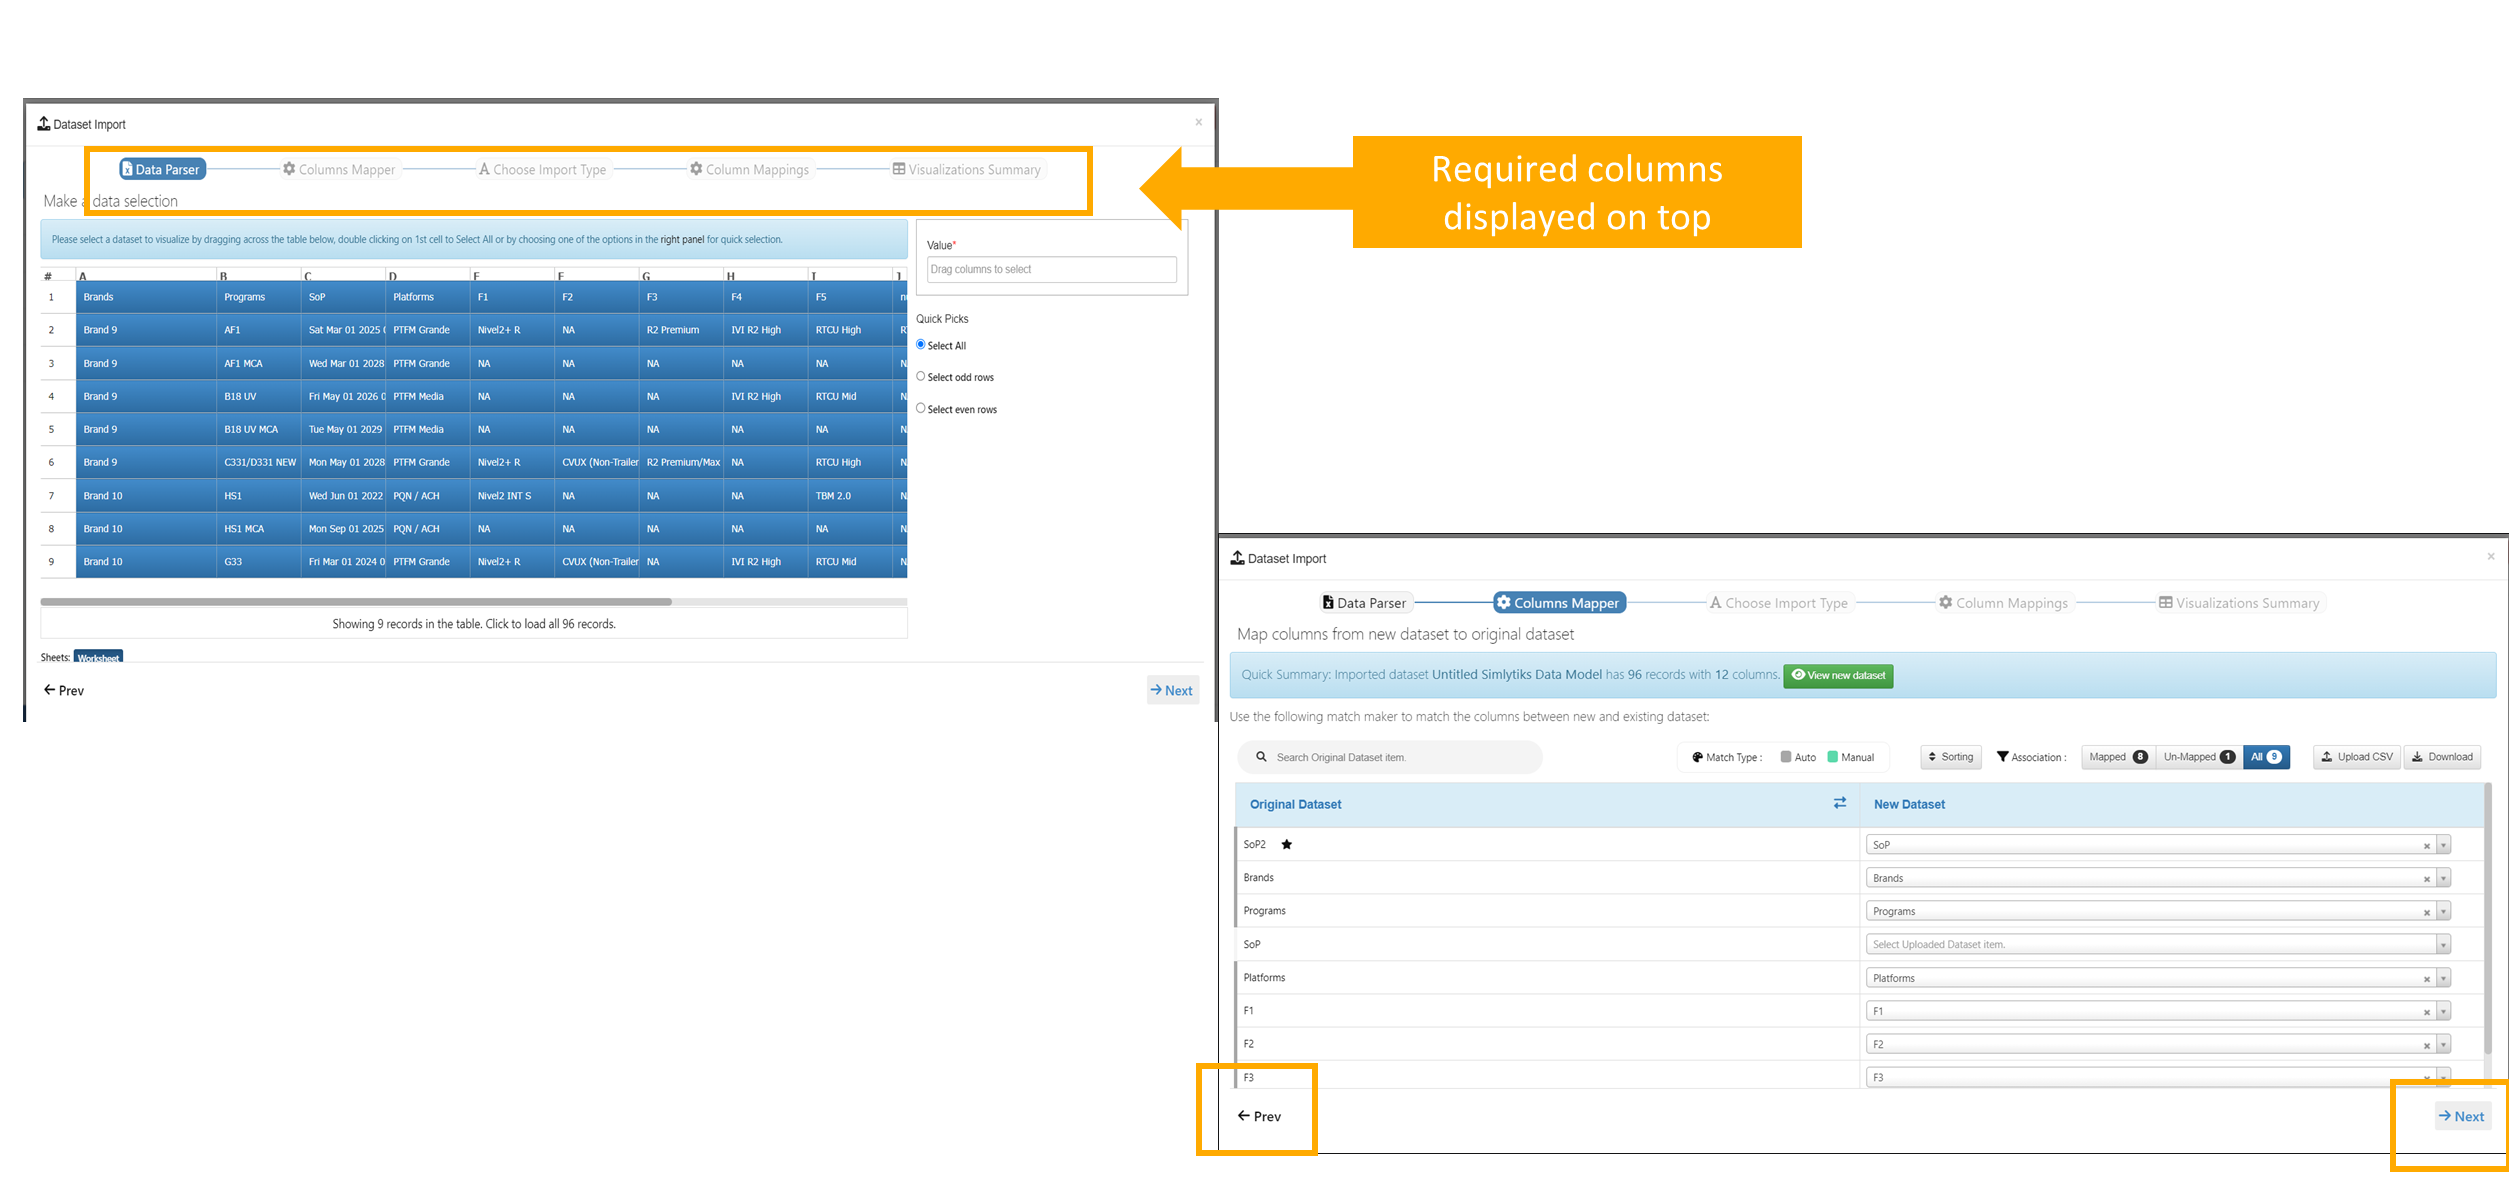
Figure: Import Modal
Matchmaker in data import now supports type based filtering in Simlytiks.
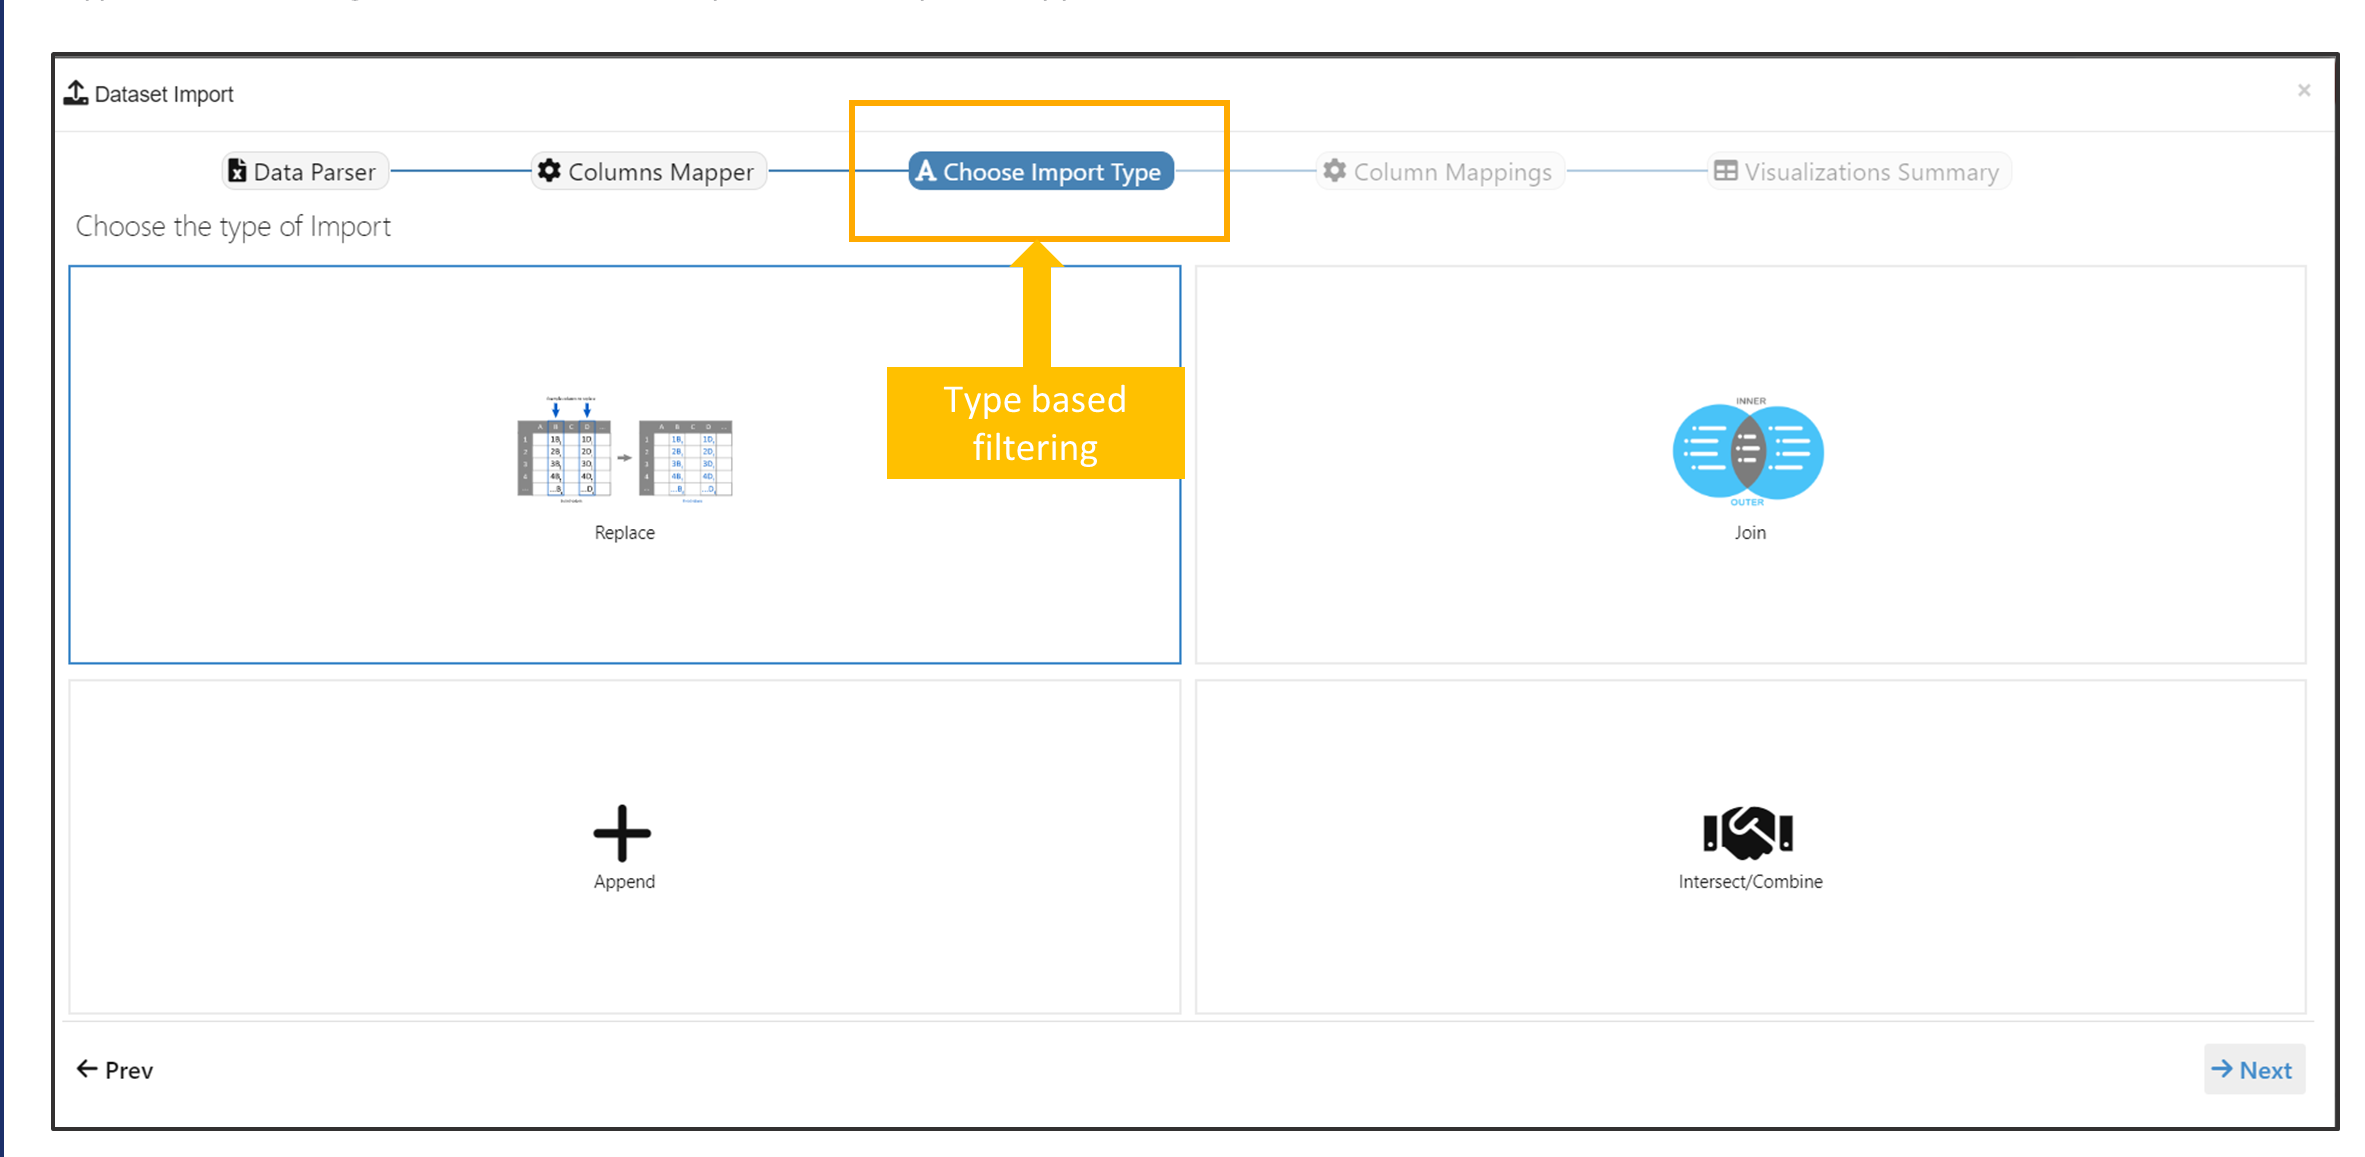
Figure: Data import match makeer
Match maker now has new view for multi column in Simlytiks data import
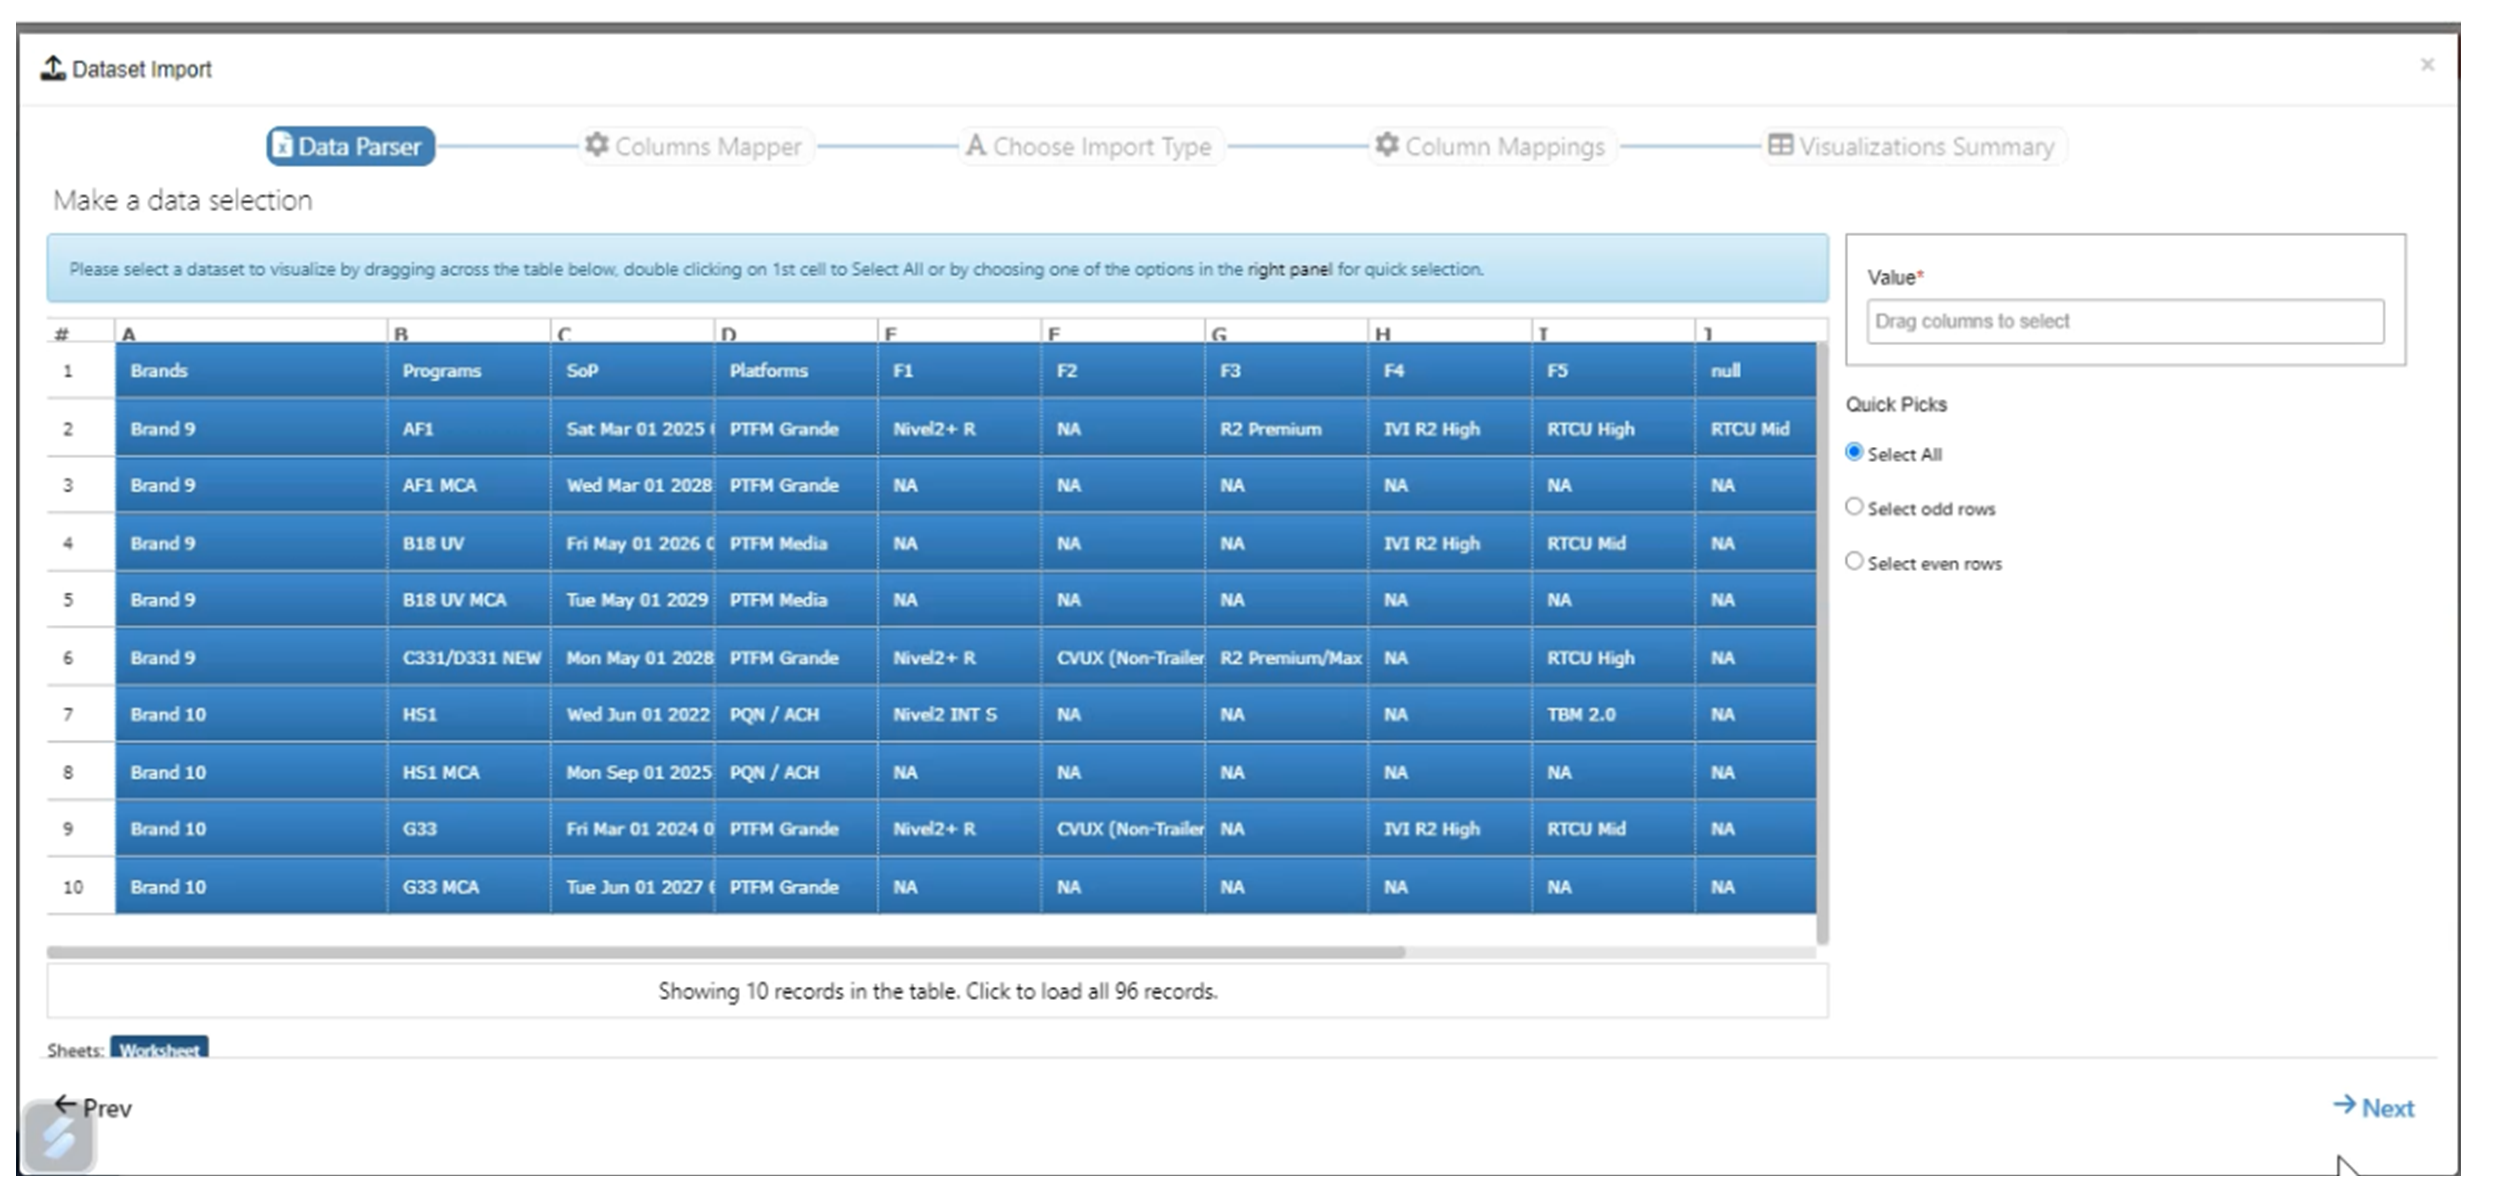
Figure: Data import match makeer
Scientific data formats Import
d3VIEW allows importing, visualizing and applying Machine-learning procedures on Scientific data. Scientific data refers to data associated with Engineering applications and includes formats such as Curves, Datasets, and Media files. In this example below, we see an example of importing Scientific data stored in the Excel format that is asssociated to one of the columns in the dataset below.
In the example below, the column “Cell Info” refers to a Curve column in which the value of each cell refers to the Sheet/Cell that contains the actual X and Y points of the Curve. When importing this file in Simlytiks, d3VIEW will automtaically detect this column as a Curve and read the curves as shown in the video.
Below screenshot shows example of Scientific data.
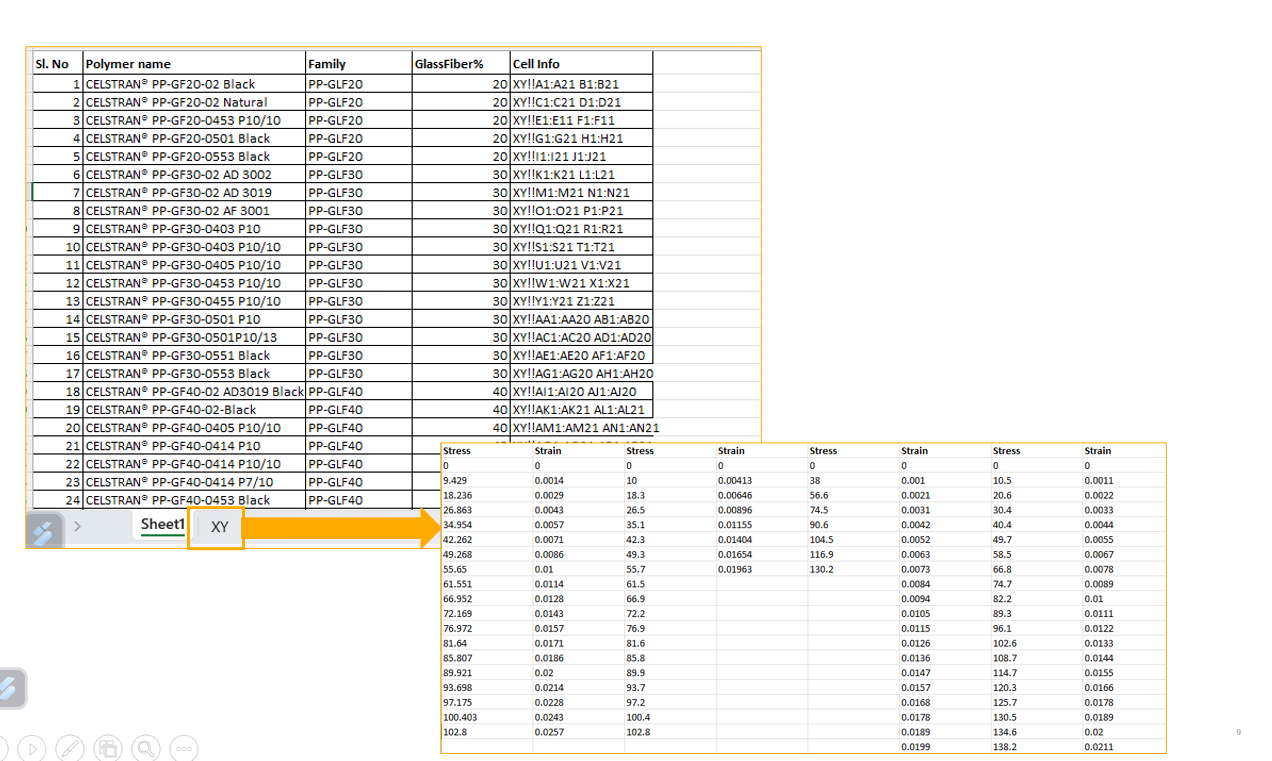
Example of Scientific data
This Scientific data can be Imported to Simlytiks on d3VIEW. The Scientific data is imported to Simlytiks with all data and view as visualization.
Below video shows how to import data and create visualization using Scientific data.
GF_Polymers Dataset
We have added new sample dataset GF_polymers to simlytiks datasets. The GF polymers are the Glass fiber reinforced polymers from our Thermoplastics/Polymer database, The Dataset is created to highlight the effect GF reinforcement has on a given polymer.
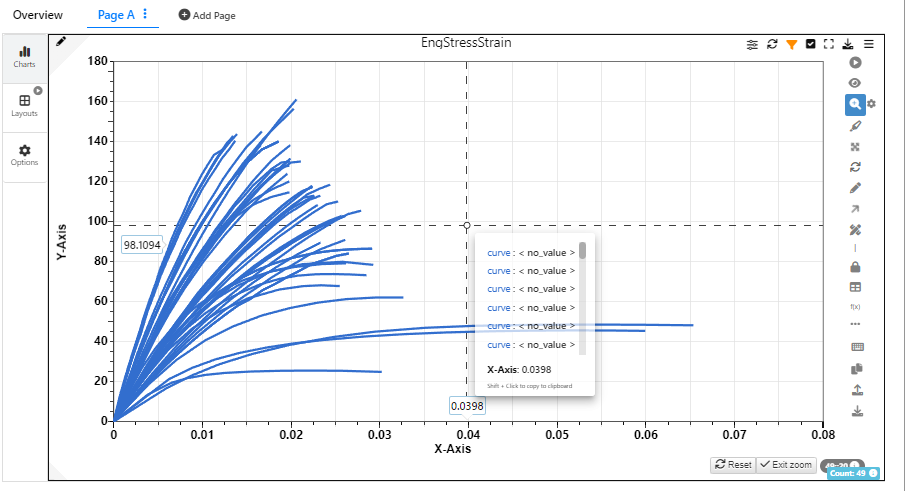
Figure 11: GF_Polymers
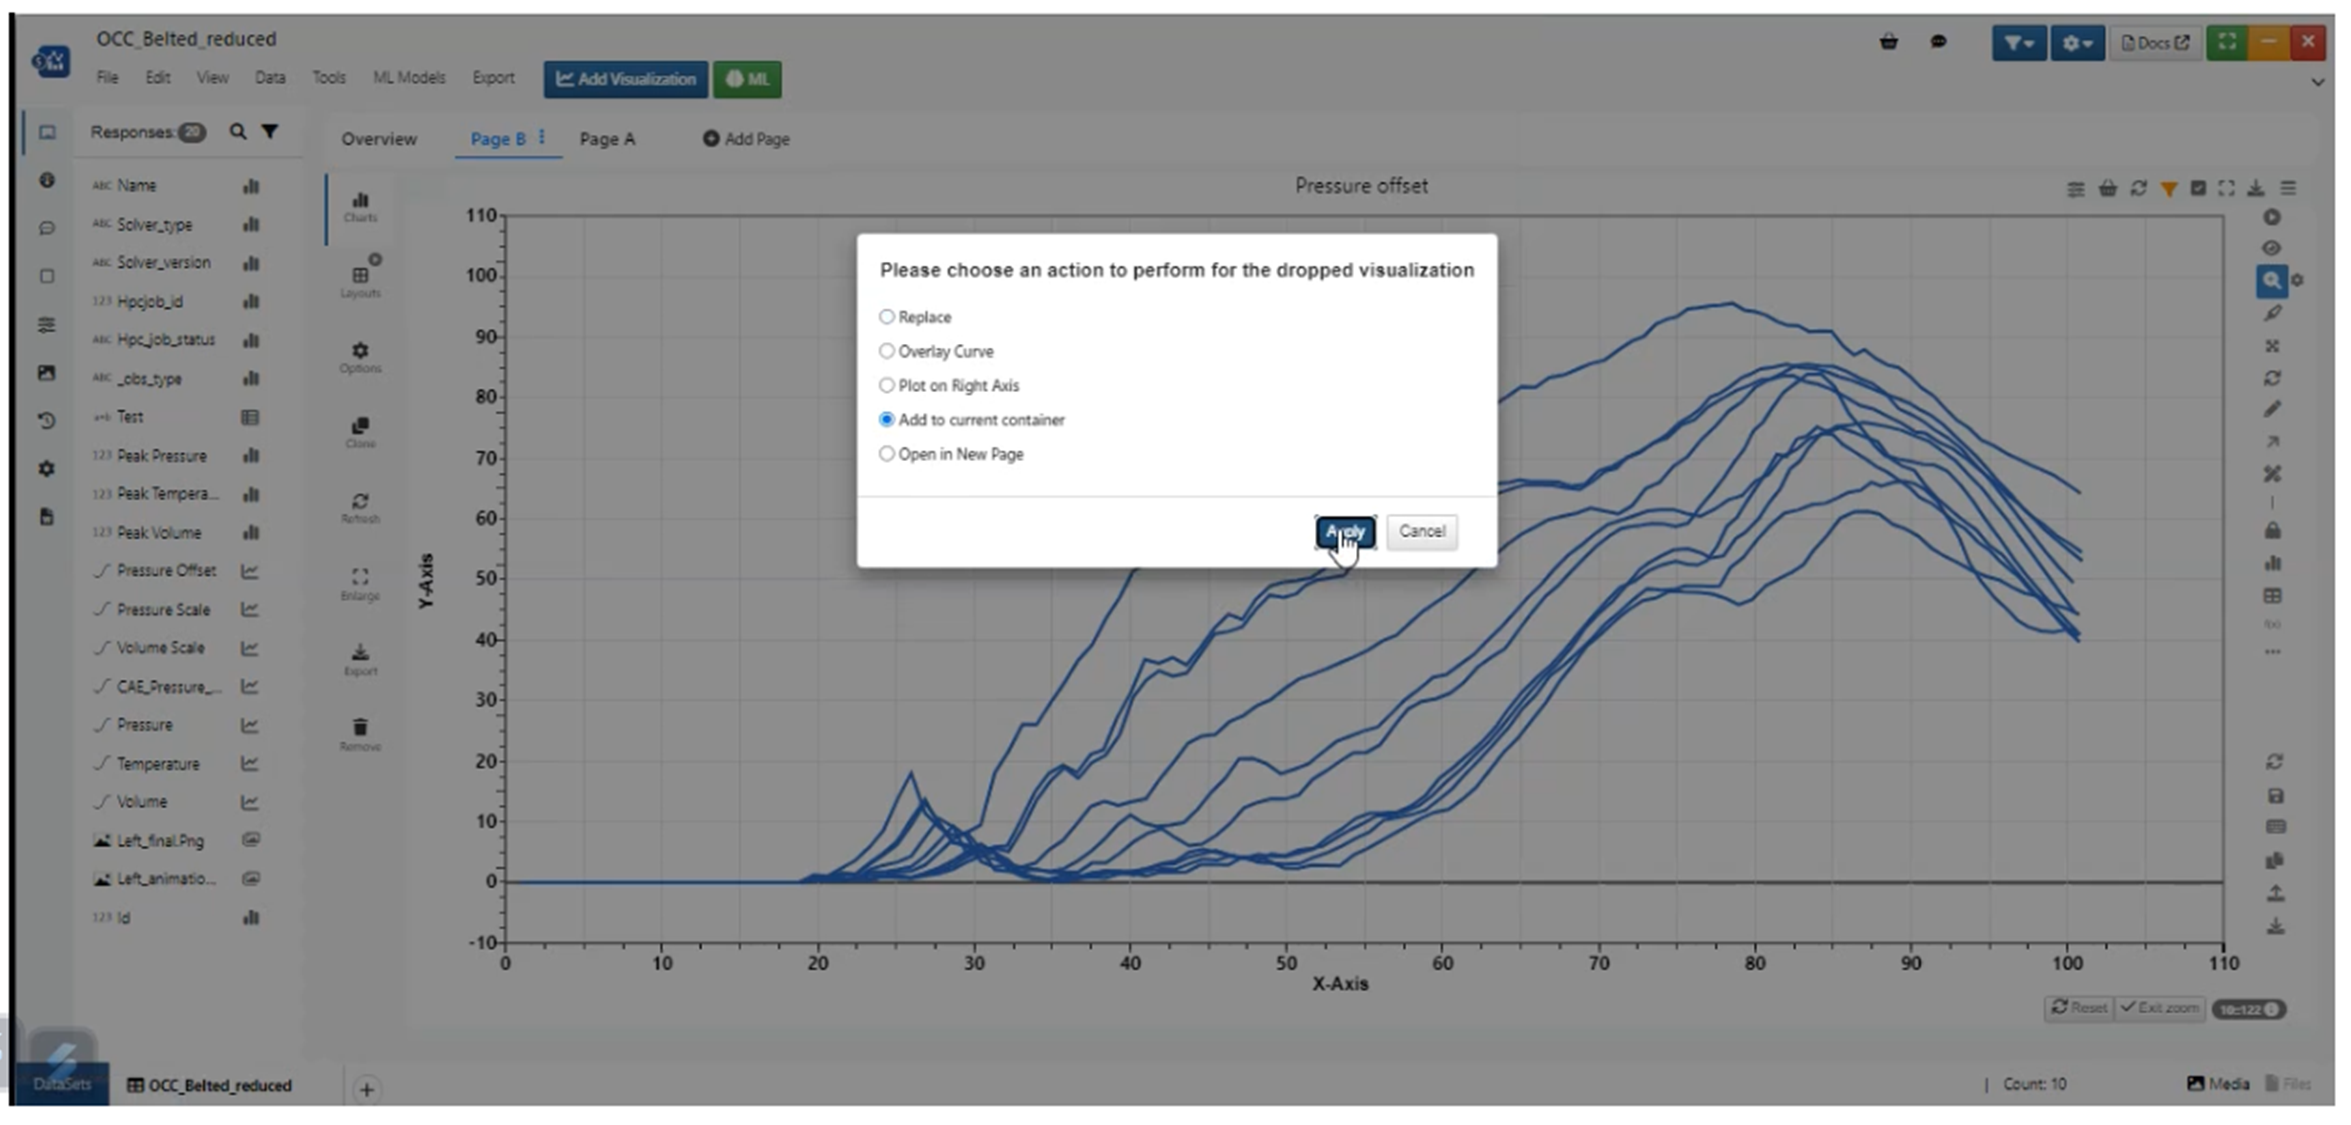
Visualization added to same container
In Simlytiks, we can now add visualizations to current container and visualizations can be viewed in carousel view.
Carousel view
Ribbon menu for Simlytiks
Added Ribbon Menu to Simlytiks for top Bar options
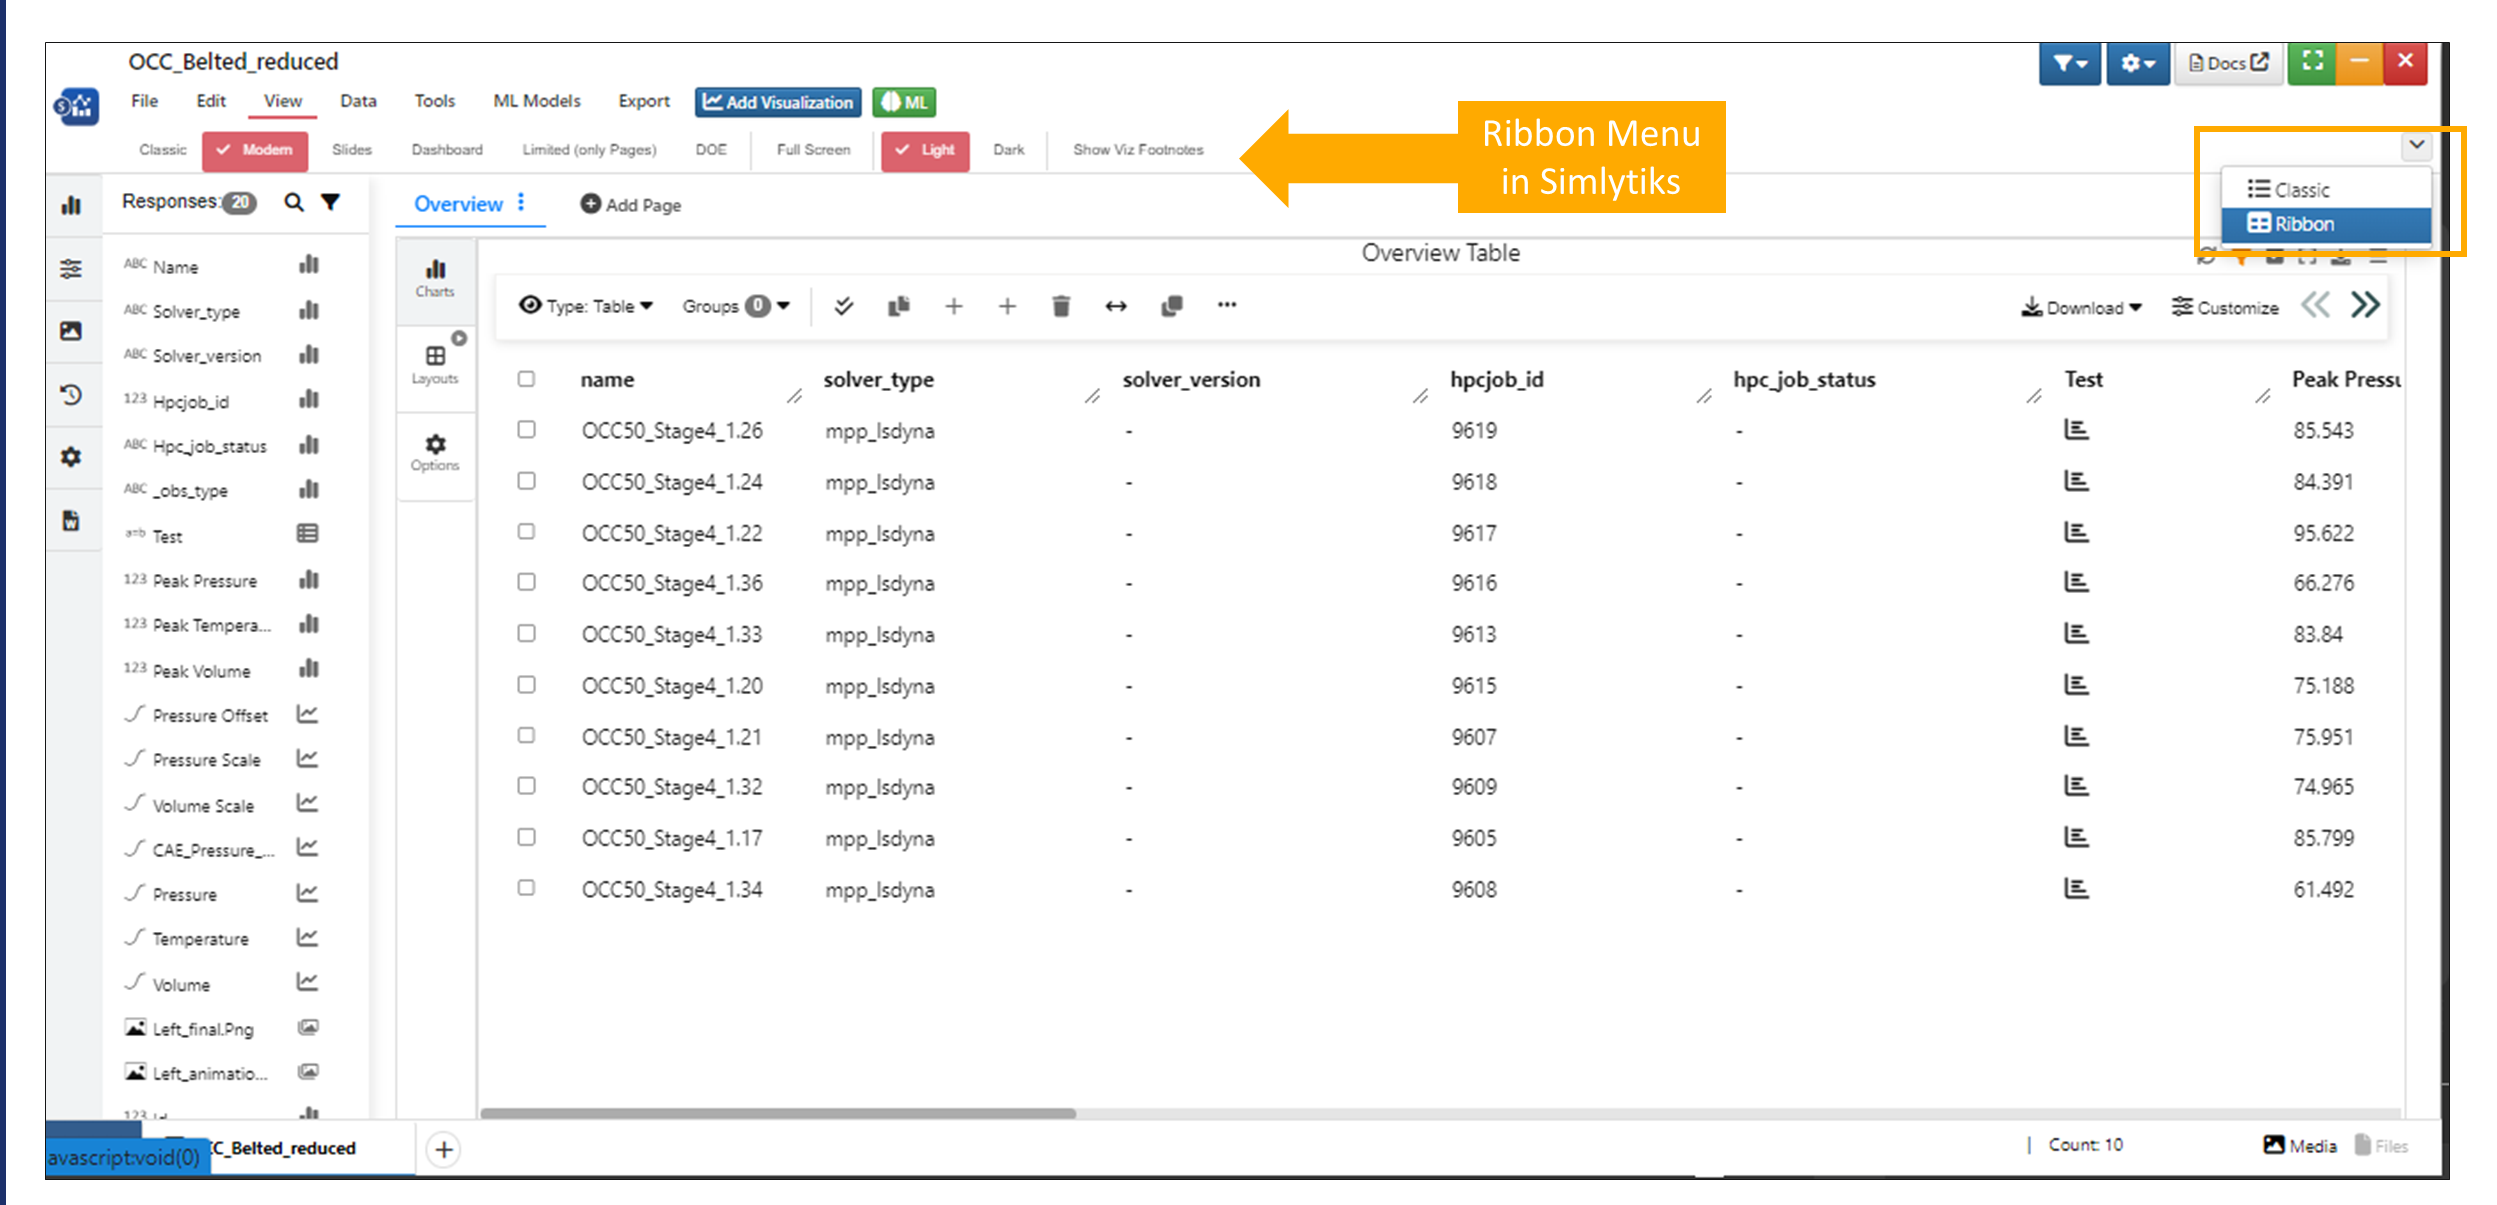
Ribbon menu for Simlytiks
Grouping in Simlytiks
In Simlytiks, Overview Table and Newton support Global grouping.
Simlytiks has new option ‘Groups and Filters’ together to operate on both of them at once. This new option is available under Tools option in Simlytiks header.
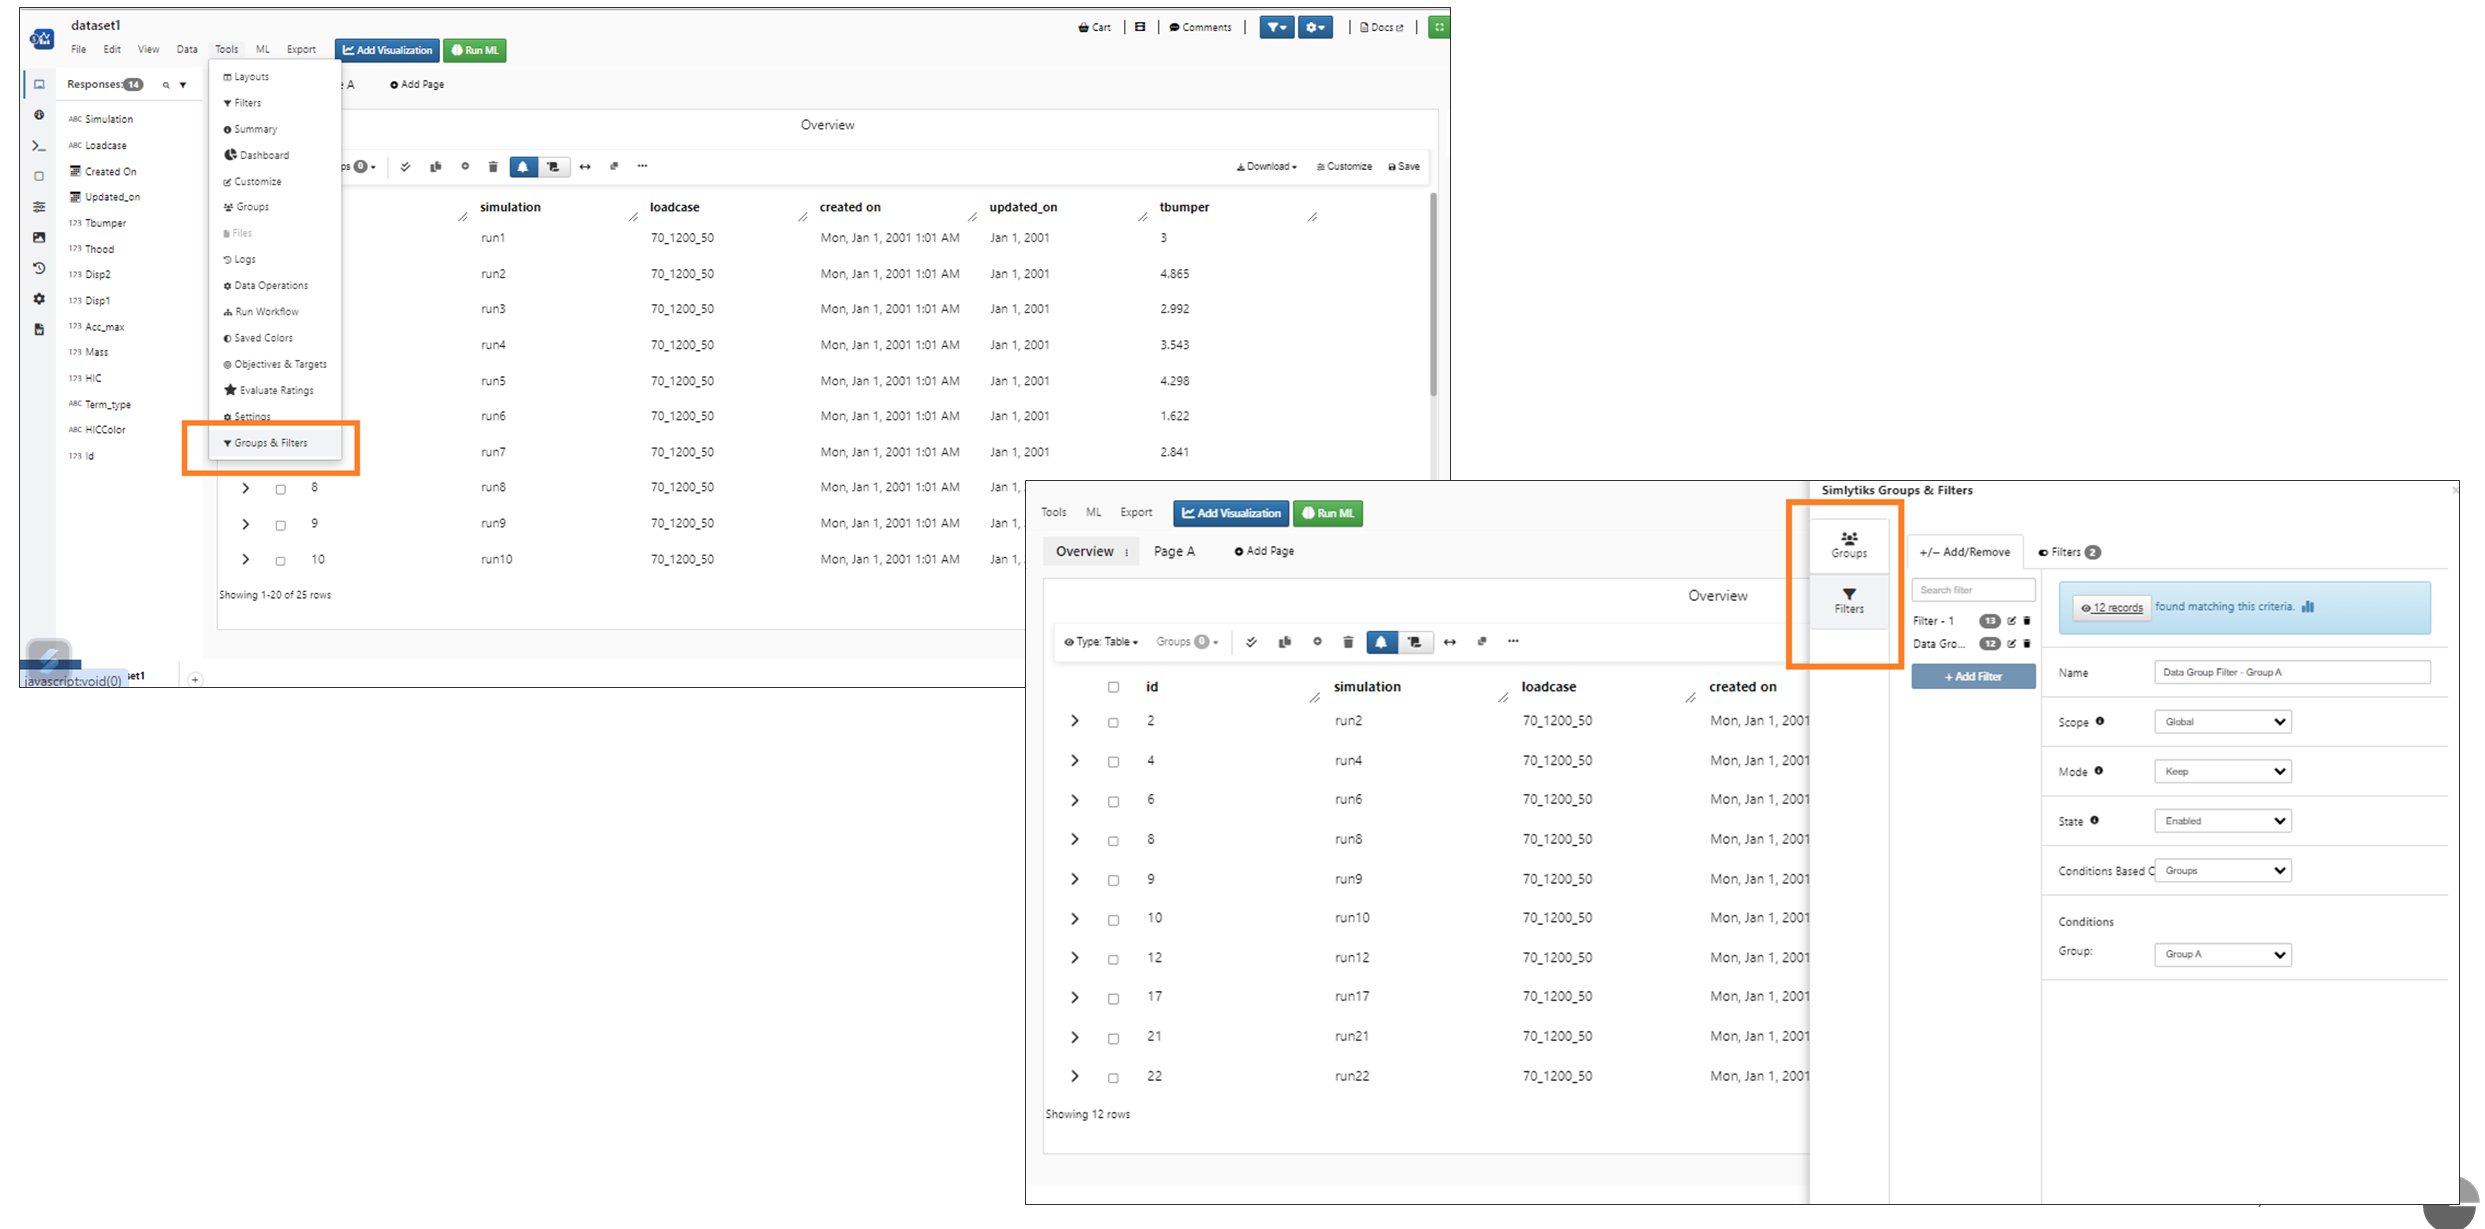
Groups and Filters
In Simlytiks, the Global filters added to the dataset is now applied to the visualizations with the Local filters as well.
Merge Visualizations
We can Merge different visualization in Simlytiks and the Merged visualizations can be exported as PPT.
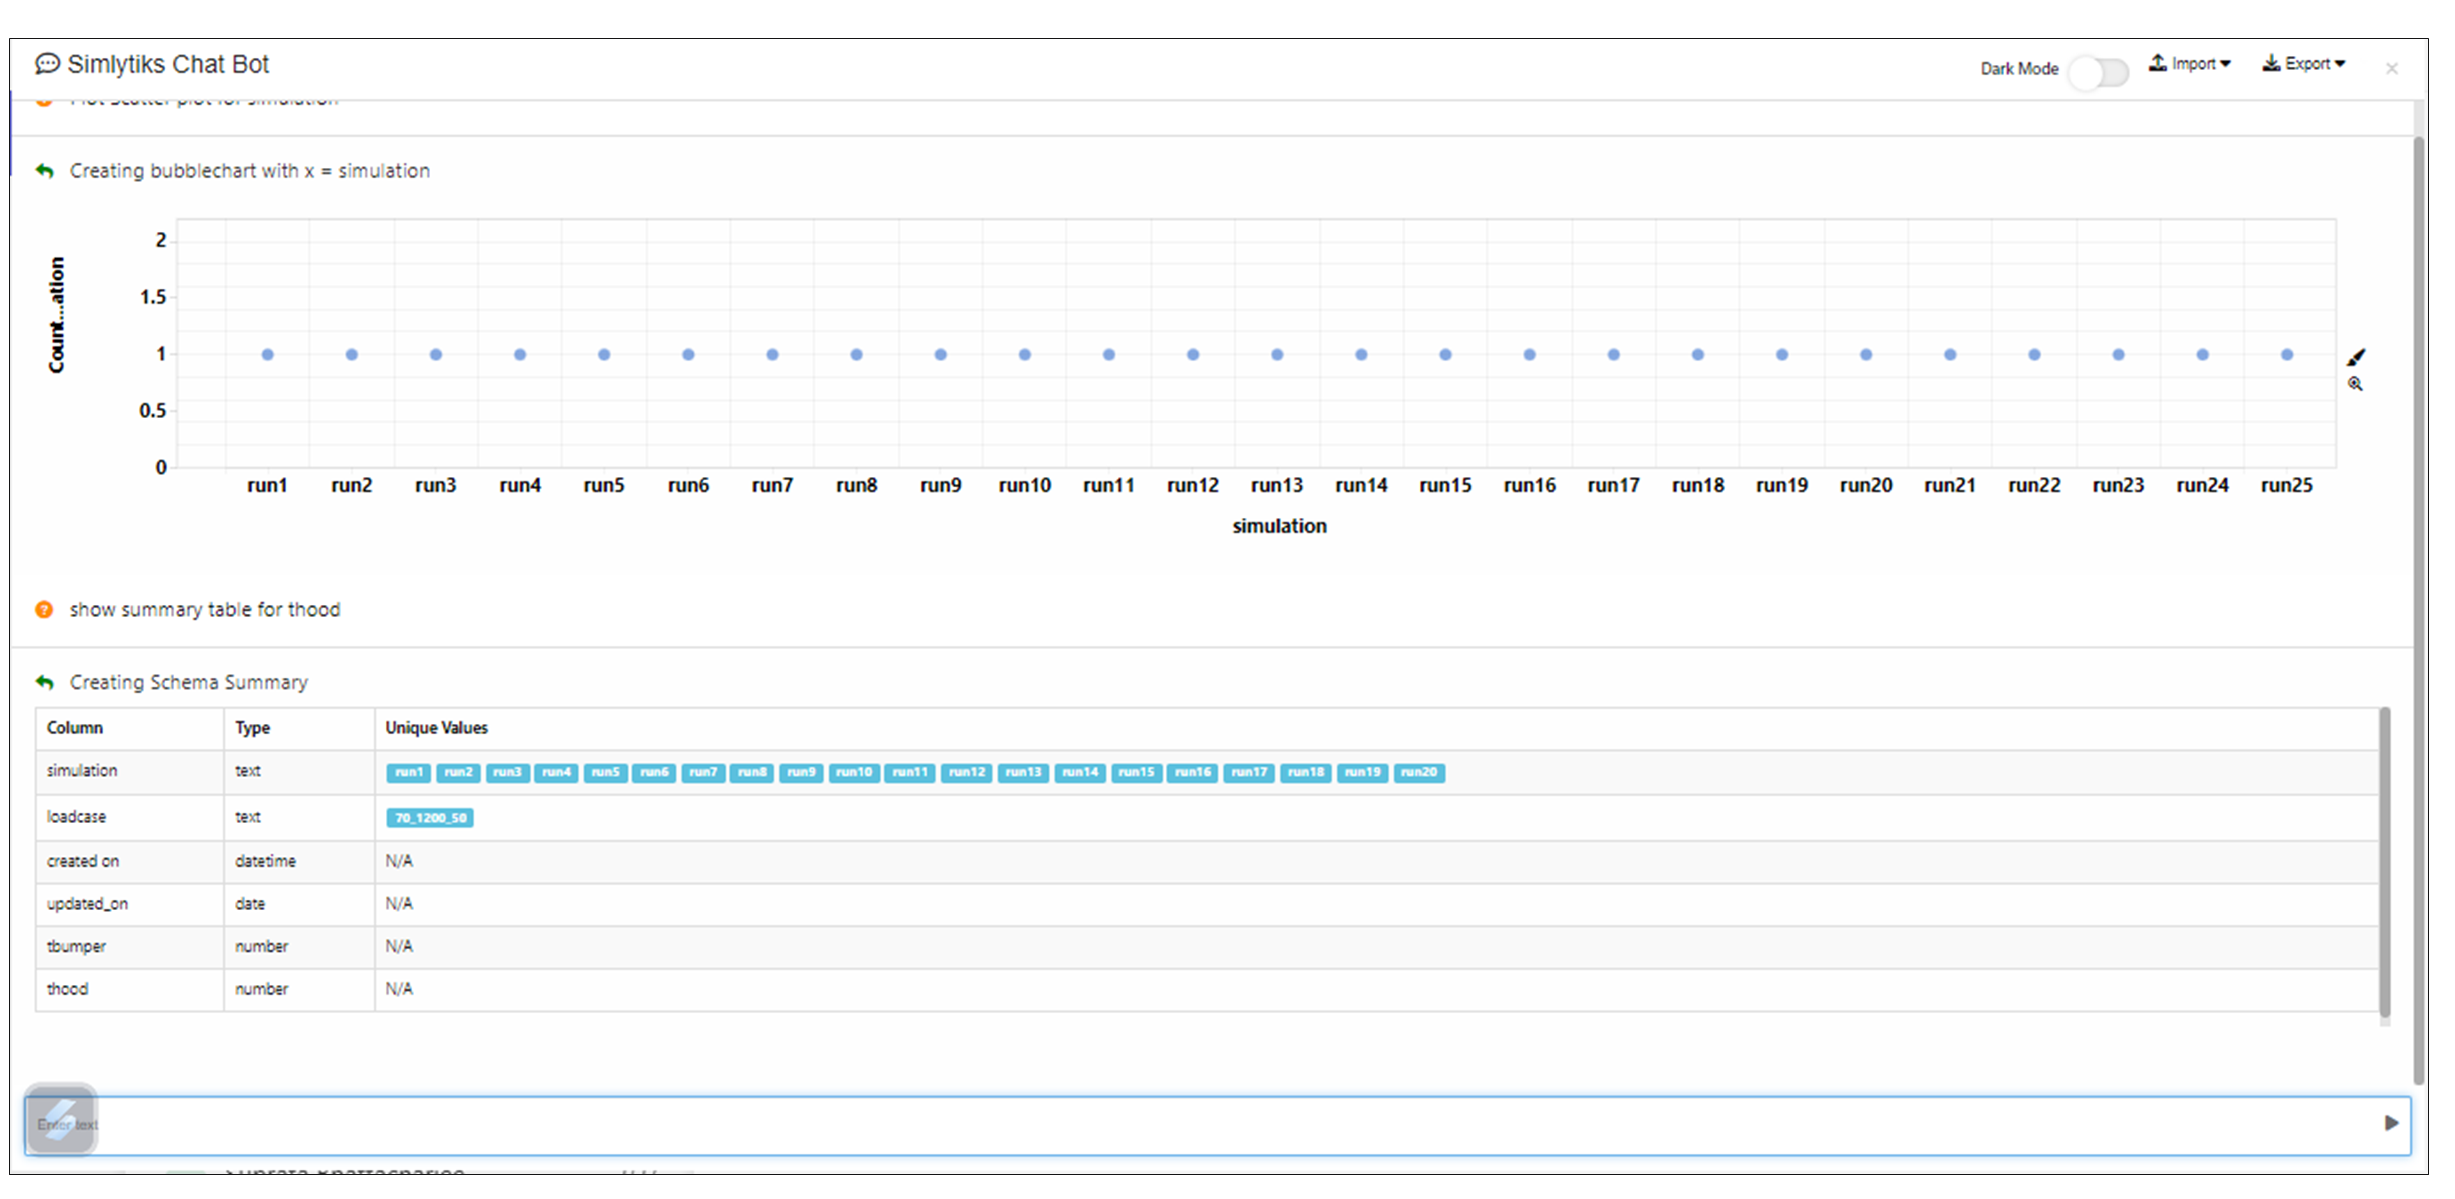
Chat API in Simlytiks
New feature Chat API is added to Simlytiks, where interaction added to the chat box in Simlytiks
Chat API in Simlytiks
The new feature Chat API now has examples of interaction when Chat is initialized in Simlytiks.
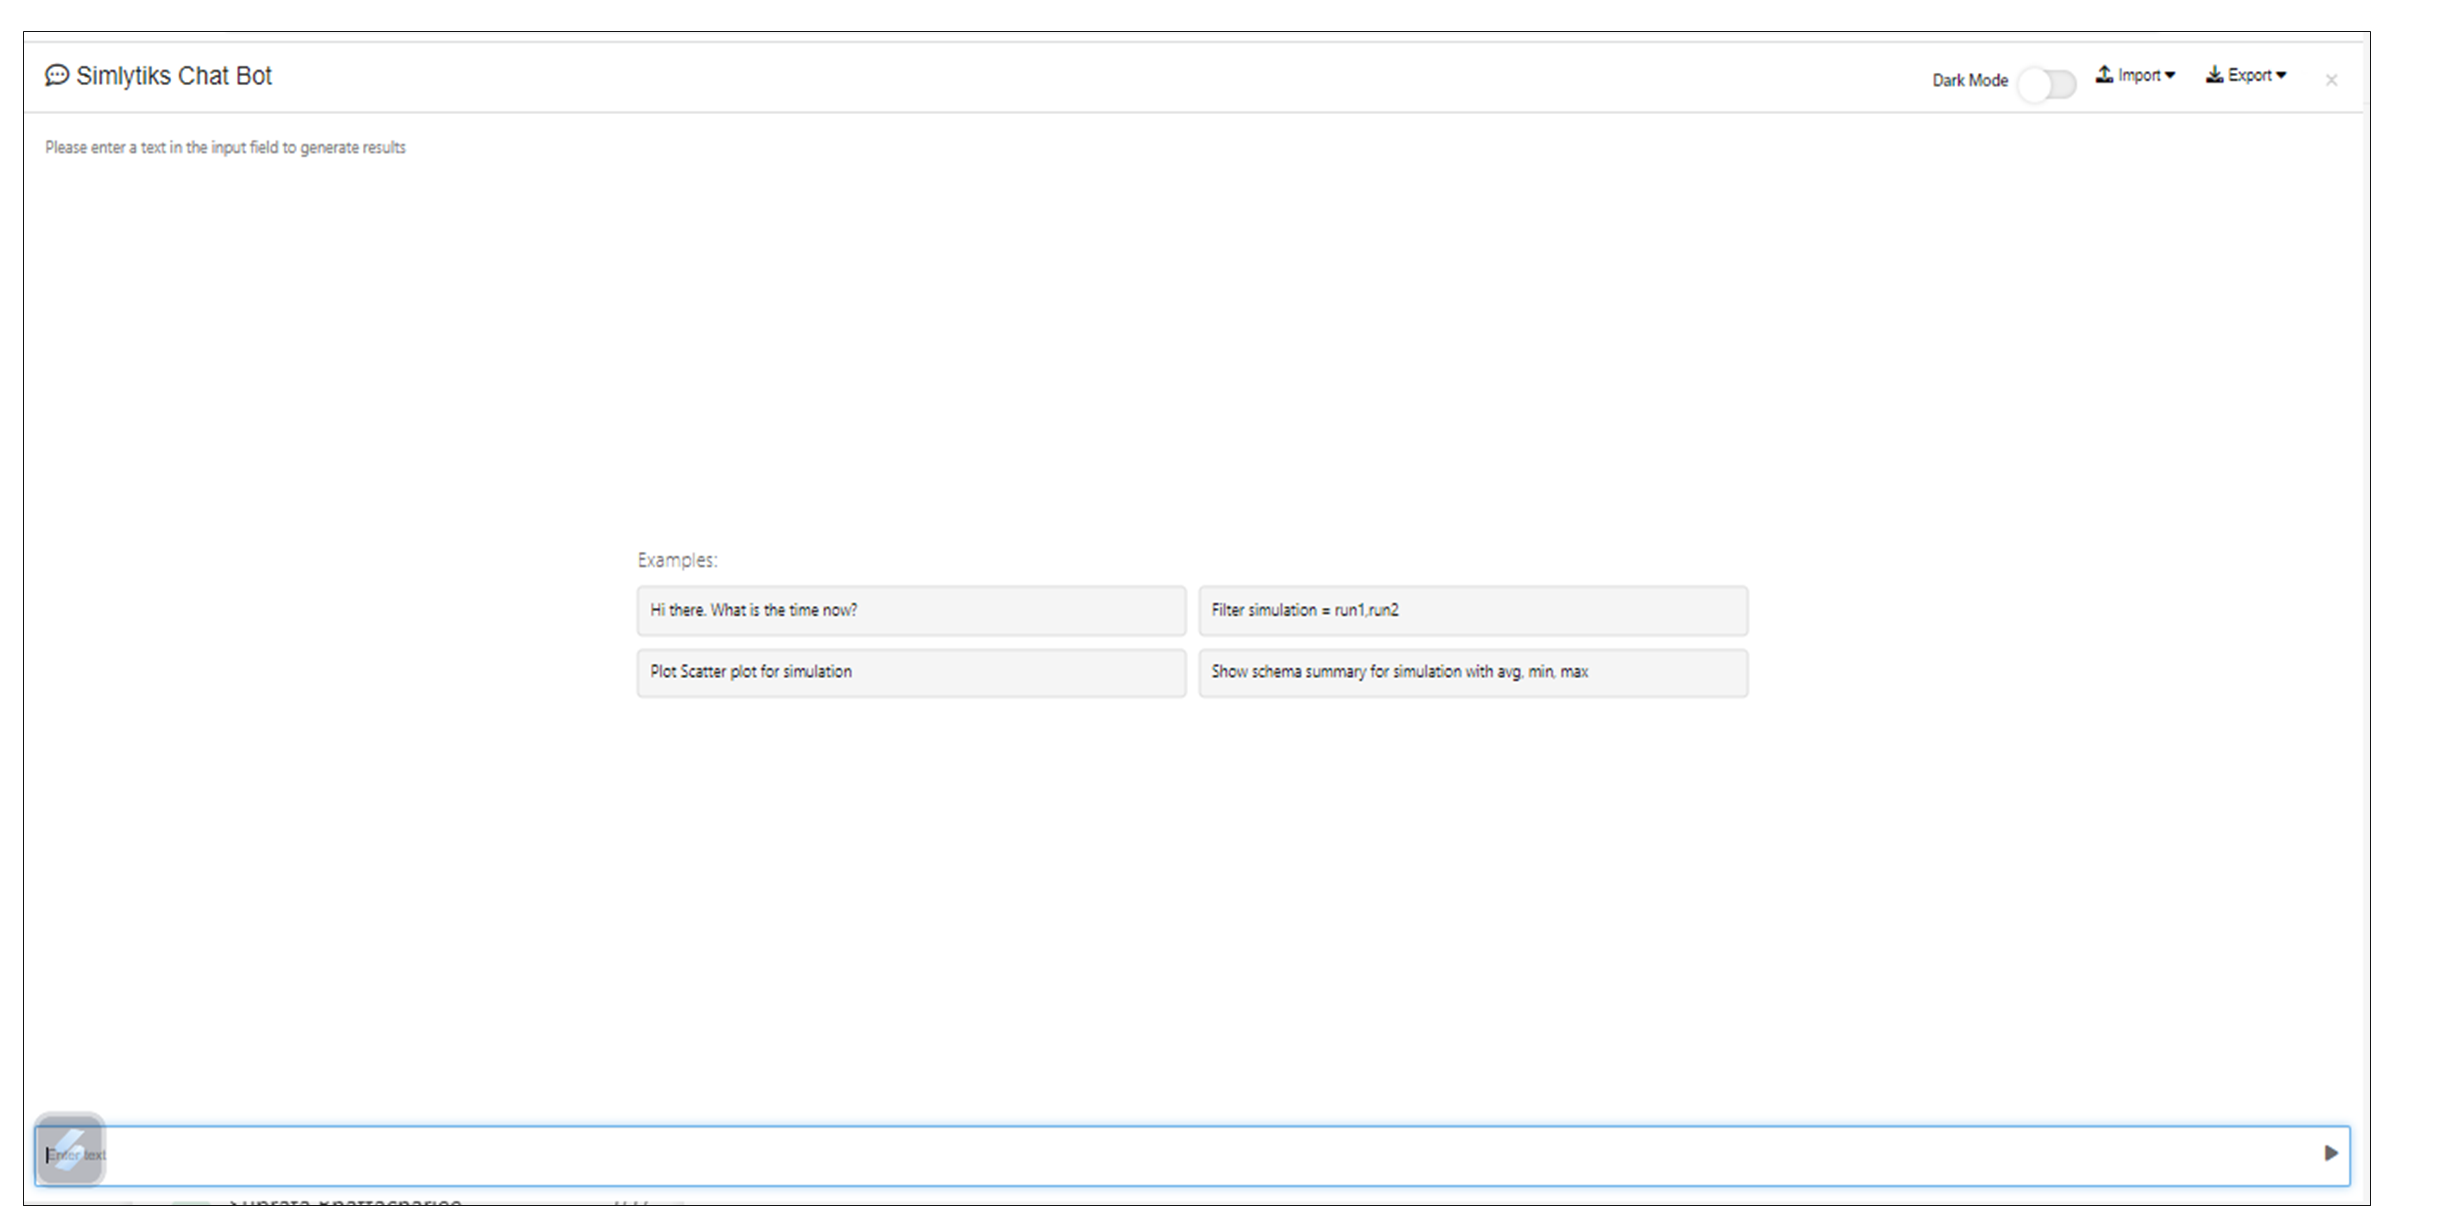
Chat API Examples
Chat API has now has both light mode and dark mode themes for interaction in Simlytiks
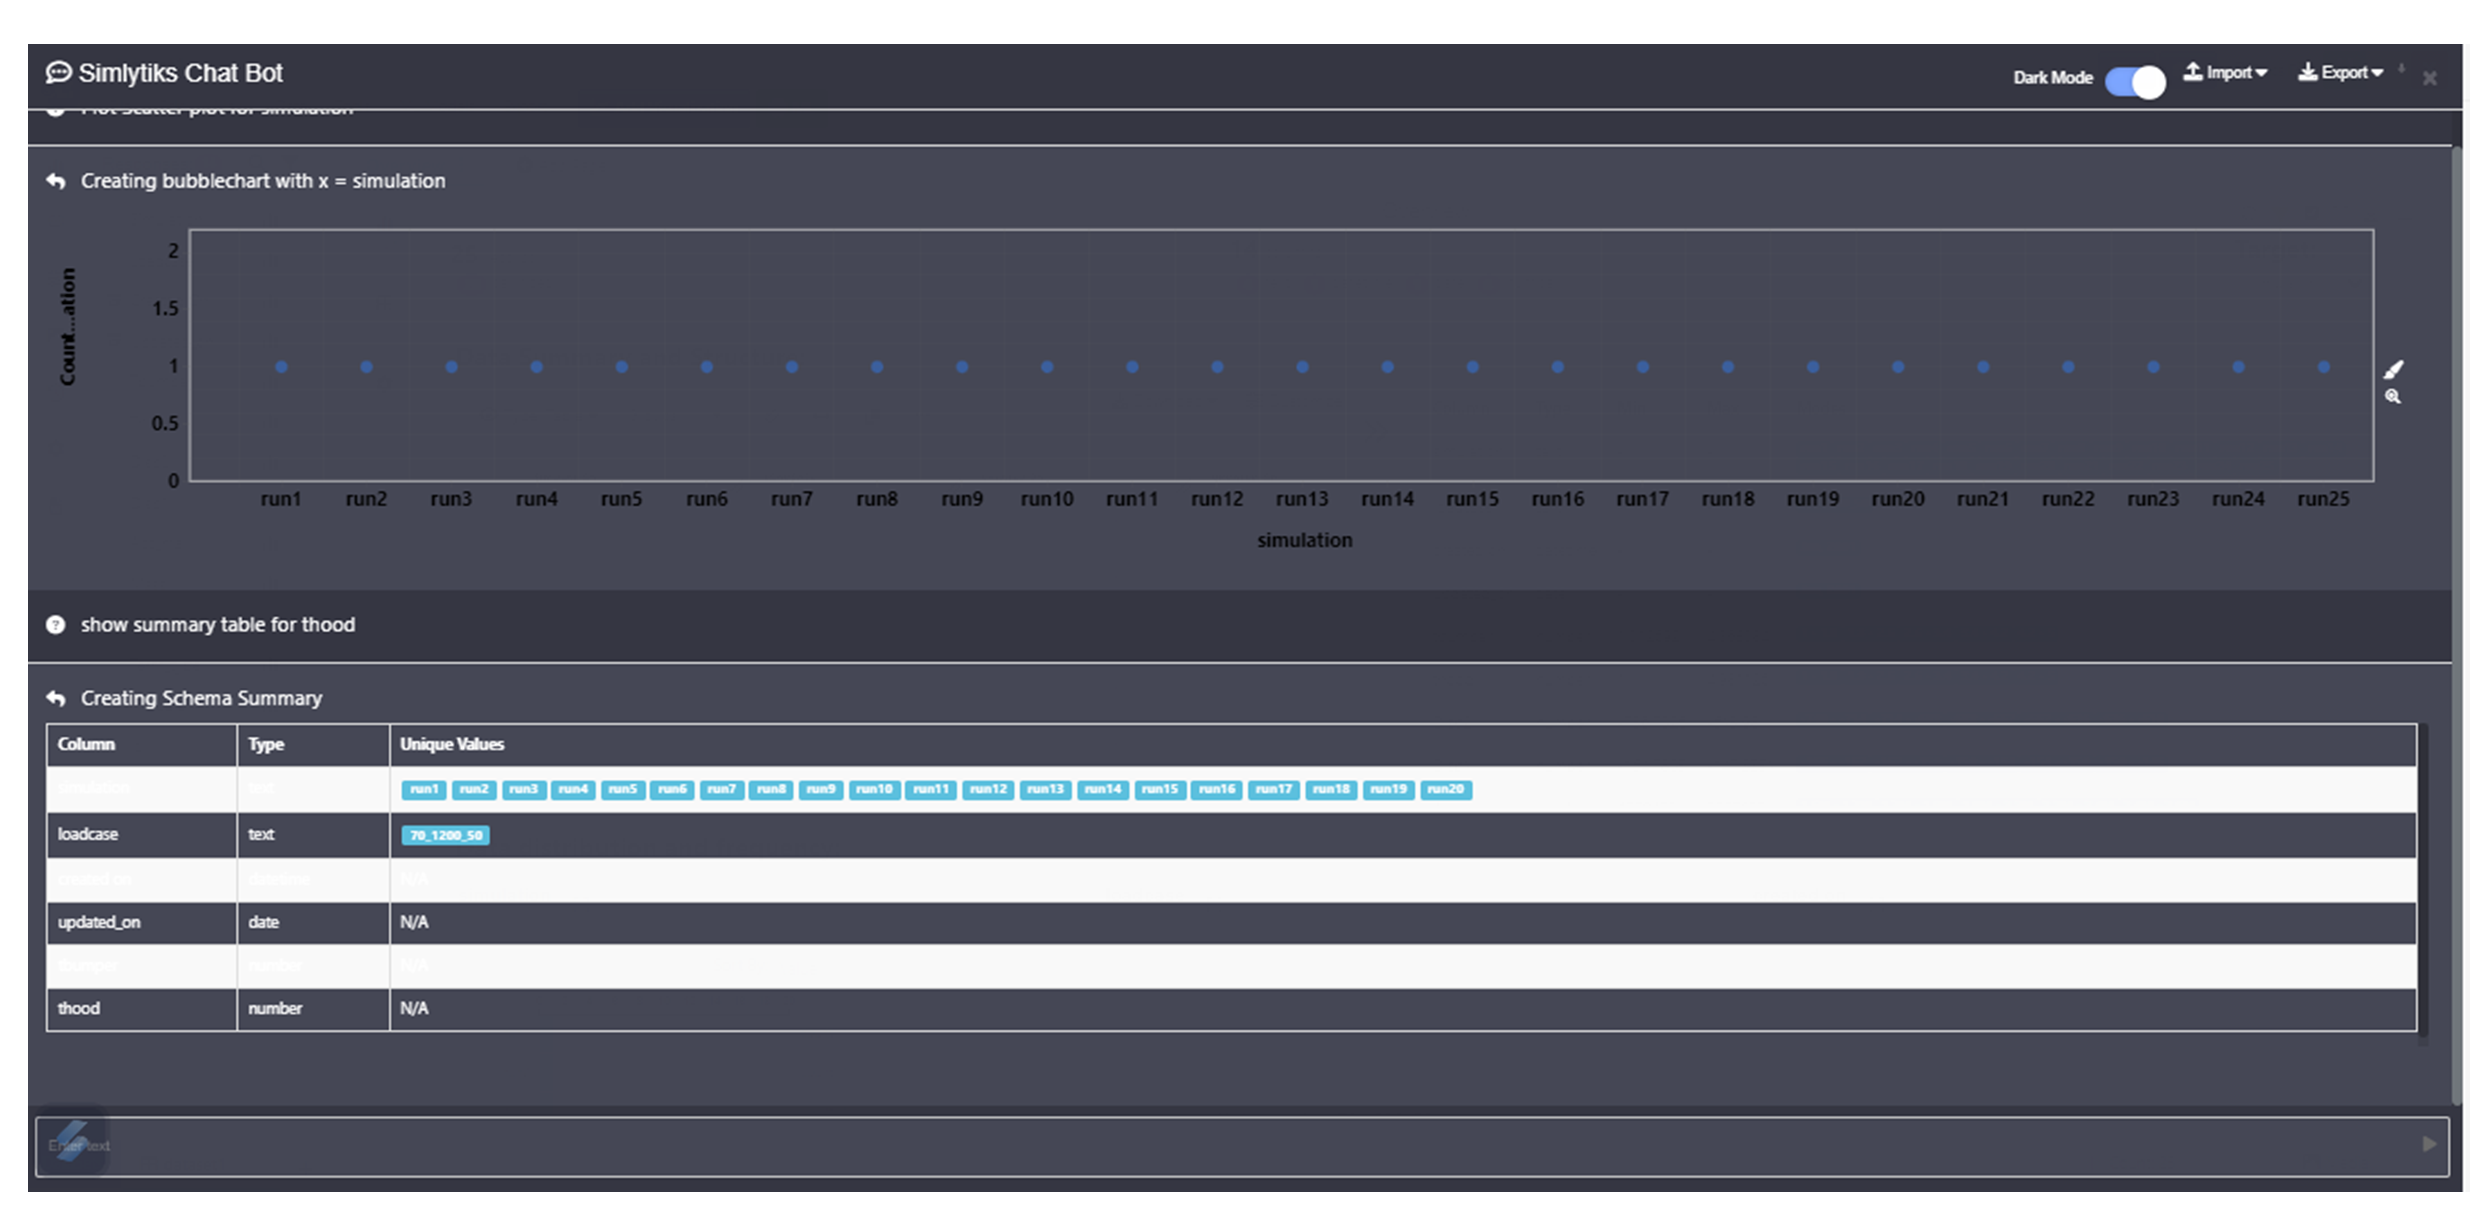
Chat API Modes
Chat API has autocomplete option for chat interaction in Simlytiks
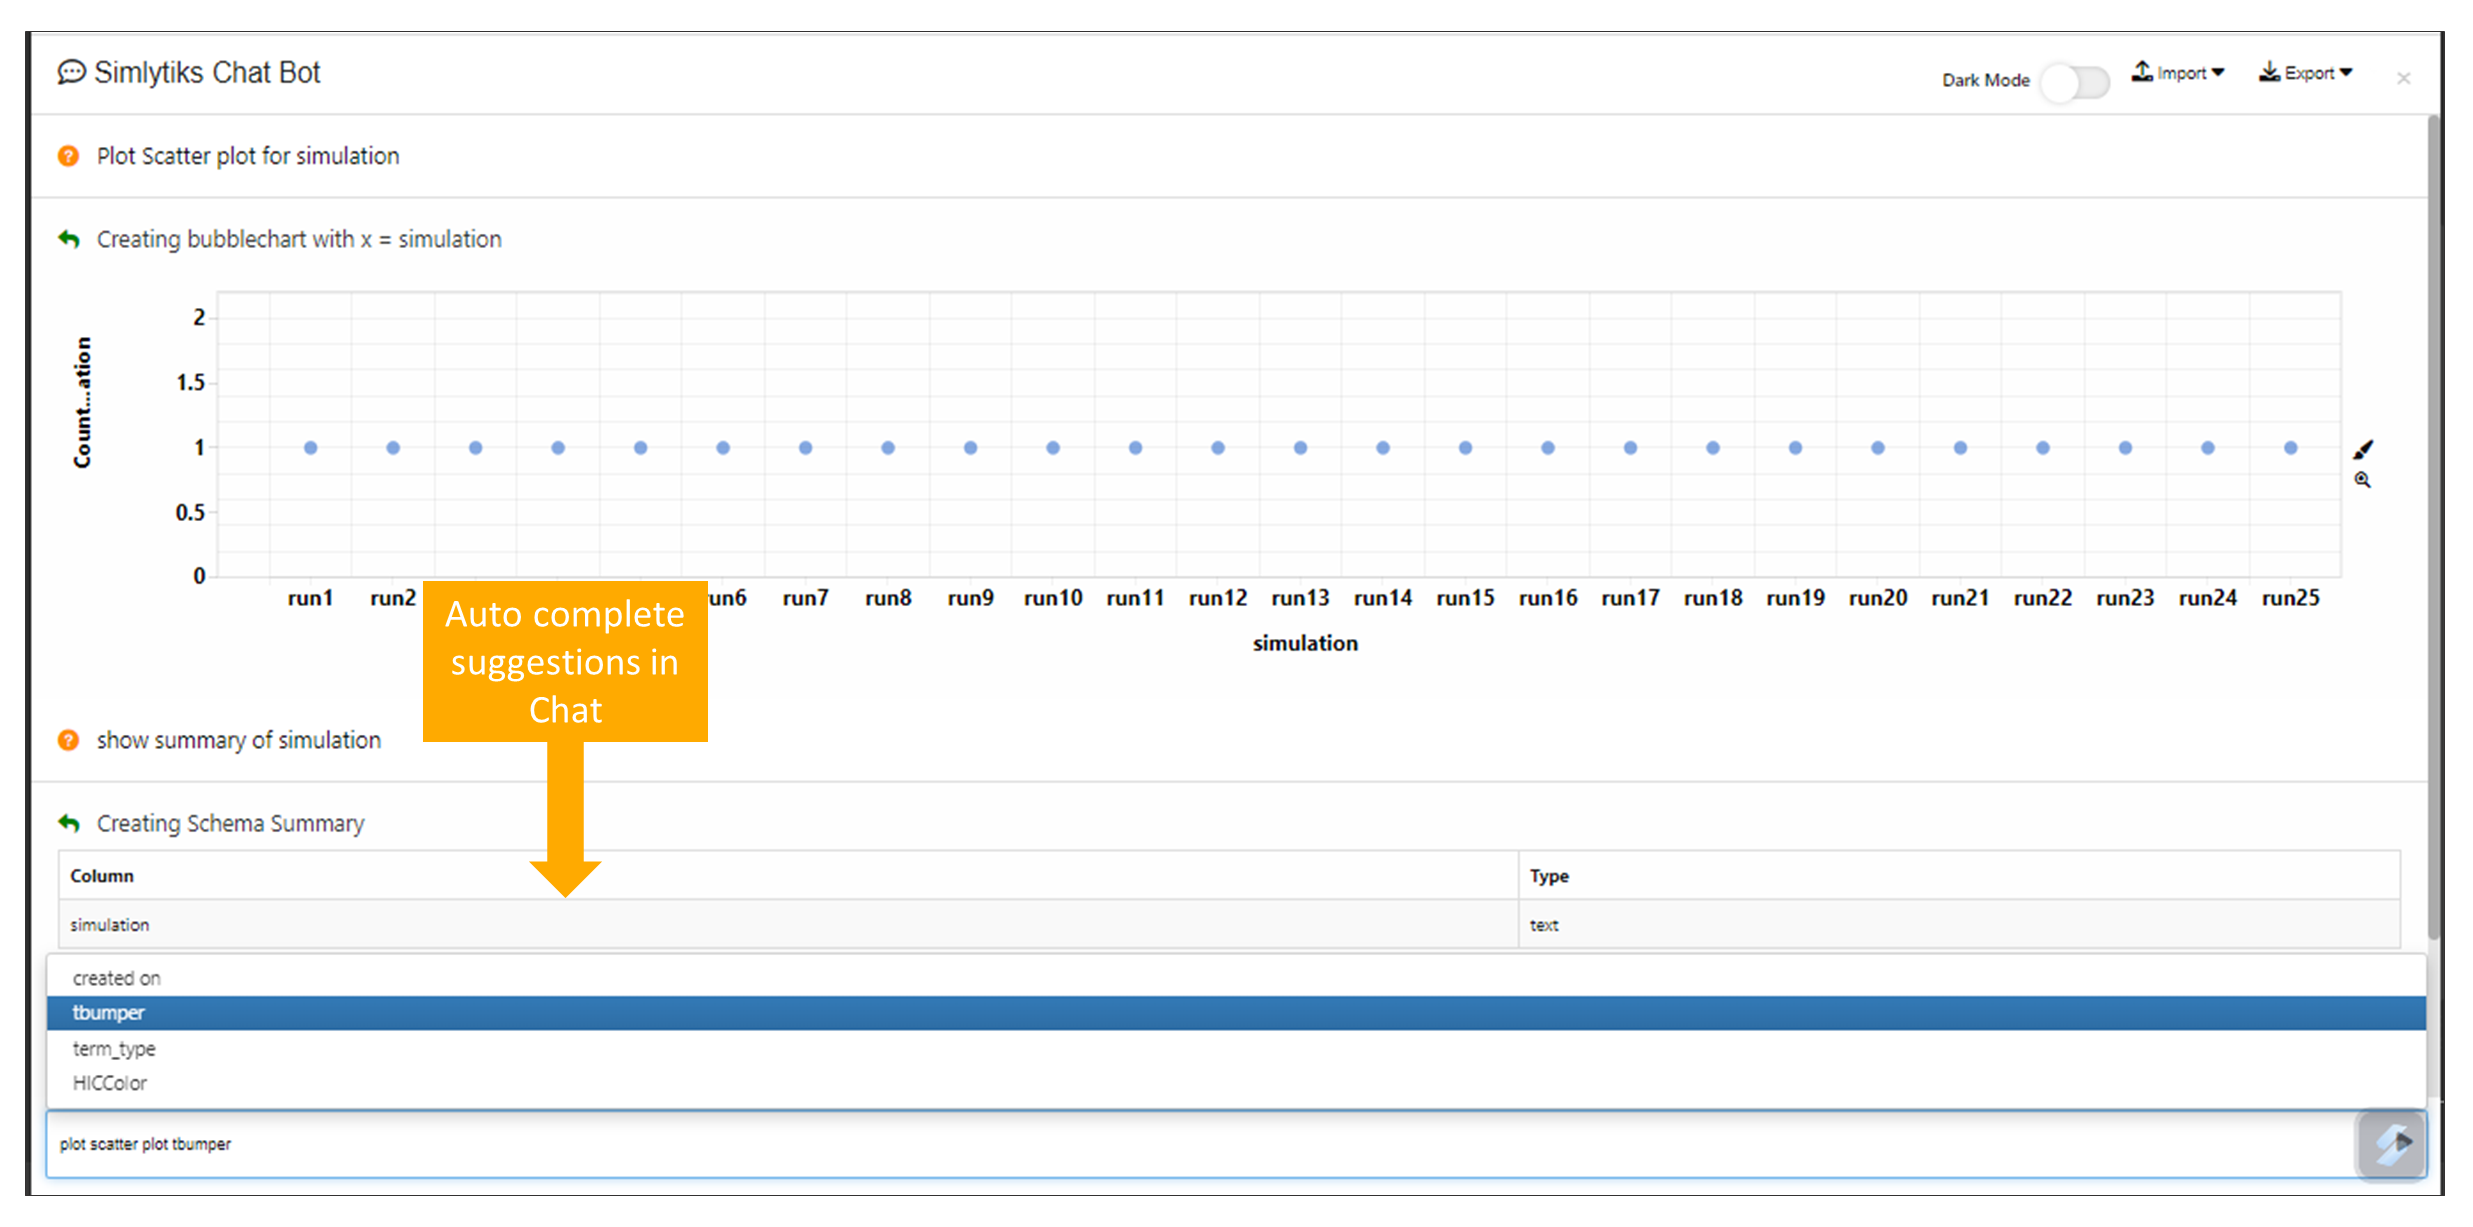
Chat API Autocomplete
Chat History in Chat API is now saved to Dataset and available when we re open dataset after saving/updating and closing the Dataset.
Comments in Simlytiks
Comments can be added to the saved datasets in Simlytiks.
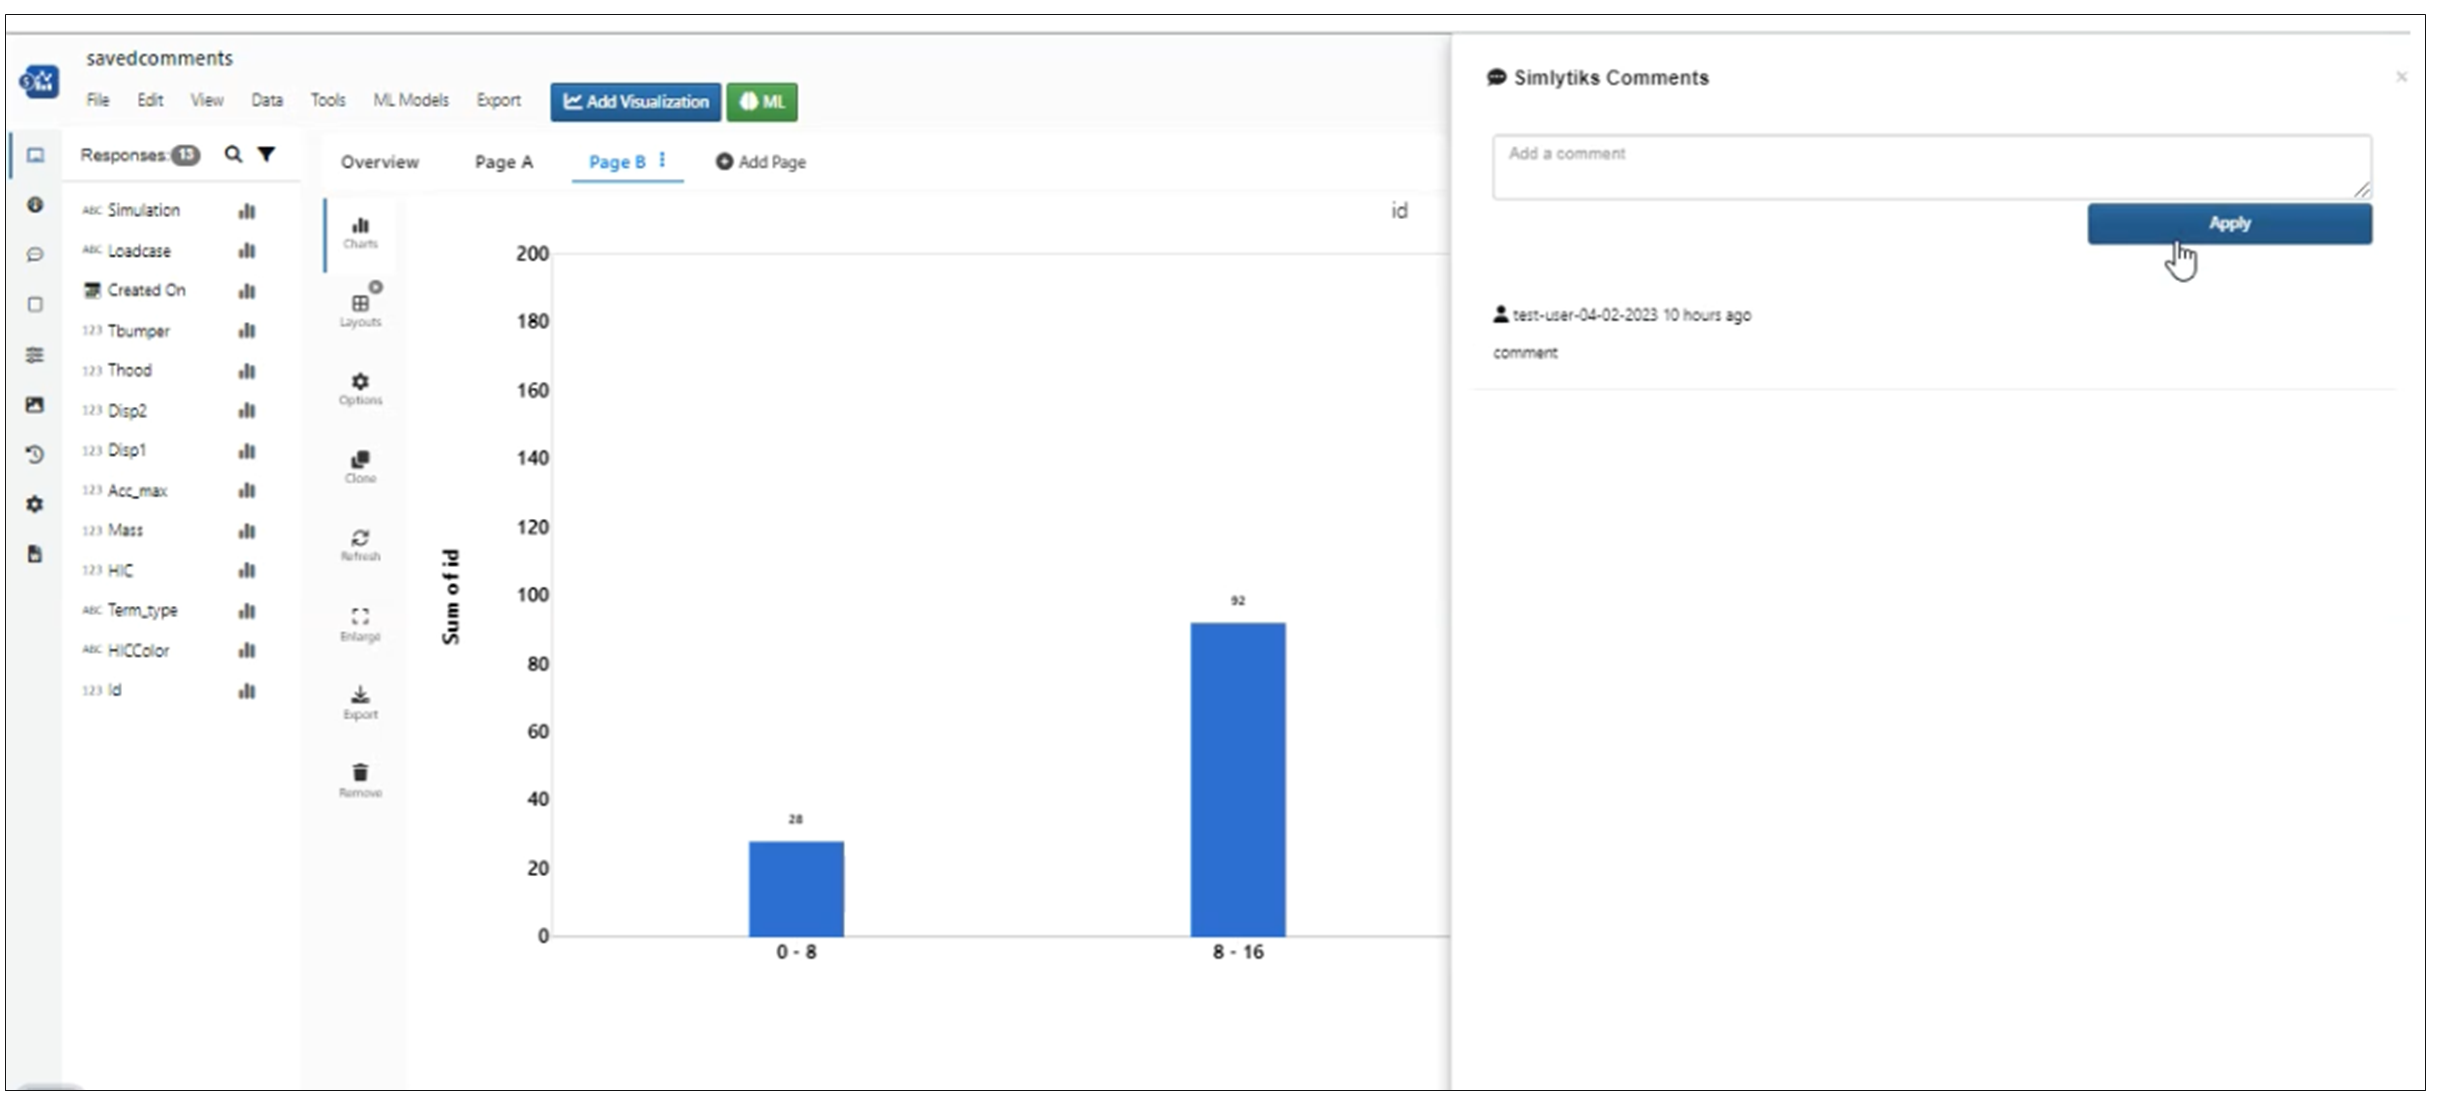
Comments in Simlytiks
Cart and Comments options UI is fitted with screen in Simlytiks.
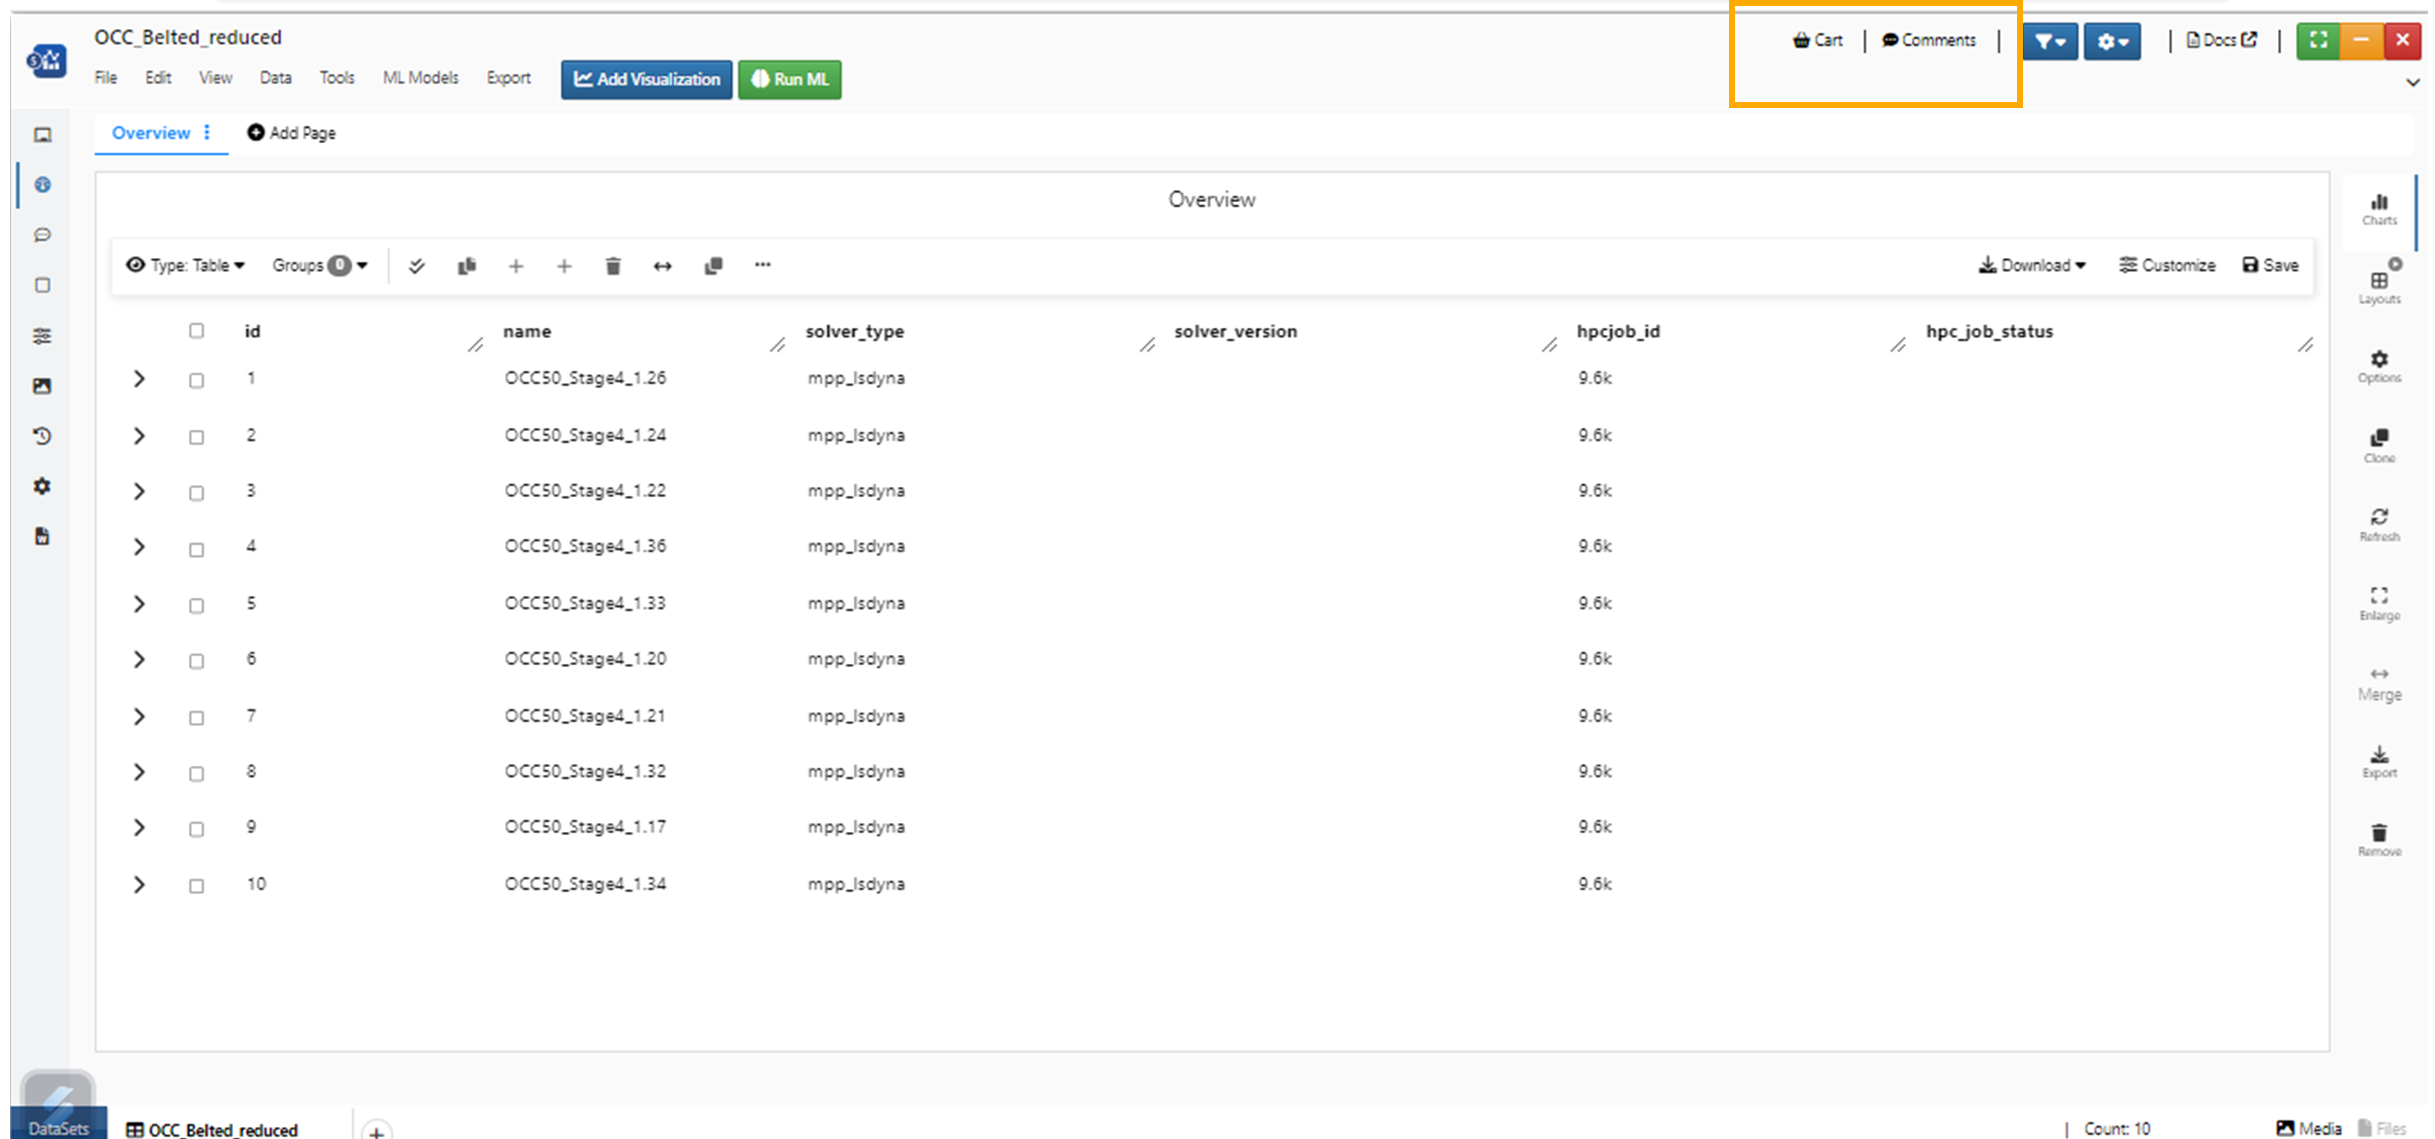
Cart and Comments in Simlytiks
Padding option in Simlytiks
New option Padding is added to settings under Tools for Simlytiks Visualizations padding.
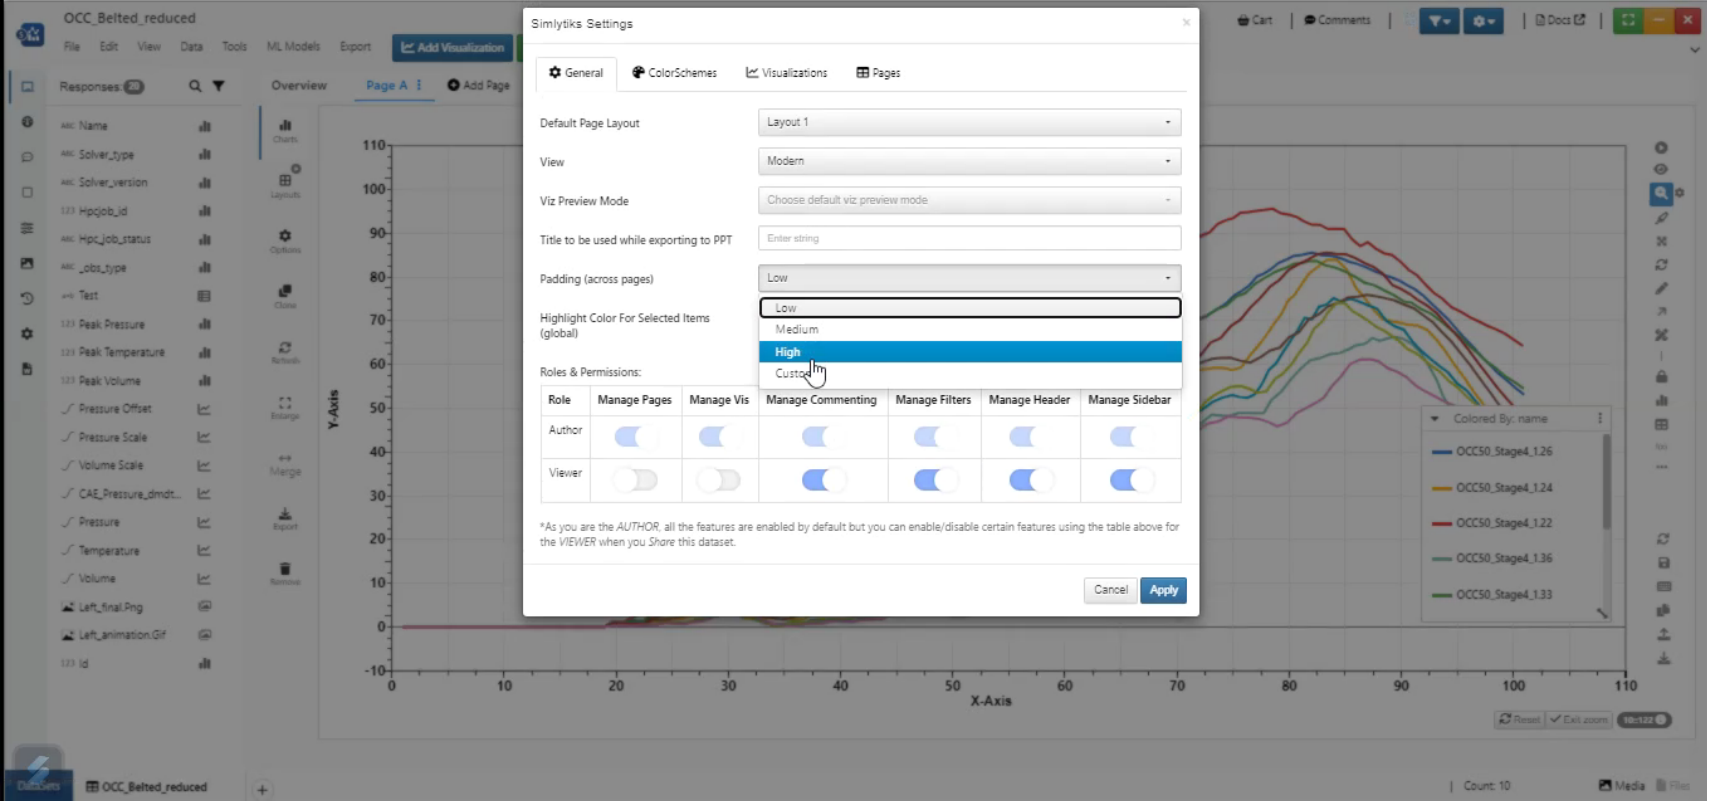
Padding option
Data Table cell editing in Simlytiks
The Datatable in Simlytiks now support Colorby options for the Table. We can color the table by Border or by the Row Background options.
In Data table, Cell editing now is smooth with 2 buttons to either cancel or confirm.
Data table Header columns can be resized.A new option is available to RESET the changed widths and save button can be used to save the setting to the Data table.
Right clicking on any header cell automatically selects it and shows the context menu right away. Also, selection of header cell columns is now through clicks and NOT dragging and selecting.
Overview table header columns have 2 new context menu options called Create Points column for curve columns and Construct Curves from numerical columns.
Included Schema Summary and Schema Statistics as chart types for Data Table in Simlytiks.
The Data Table header columns will now show Hide/Show column options.
The customizable sidebar for the Datable is updated with new UI which helps in dragging the columns and resetting them. The sidebar also allows disabling or hiding the columns.
The overview table for large datasets will now support resizing of responses side bar in Simlytiks.
Datatable views
UI updated for Datatable views :1) icons for the view types 2) setting header will now show 3 dots as a button group and the rest as a dropdown.
The datatable has new view called GRID/THUMBNAIL. This view allows us to drag and select records and it also has context menu options are available.
New view called Calendar view is now available for the Datatable.
New view called Tree view is now available in the Datatable.
Grid view records will open the record when we click on the name of the record in the view.
Pages and Responses
In Simlytiks Classic view and Slides view, we can toggle between Pages and Responses within the sidebar and the left nav menu is consistent.
The Responses can be selected and deleted in Simlytiks. These actions can be undone and redone in the dataset and saved to the Simlytiks page.
Dragging of responses in simlytiks now includes dragging anywhere on the visualization. The responses selection and deletion is done by enabling the selection available in settings of responses in Simlytiks.
Responses panel in Simlytiks now has an option in the settings dropdown to show the count for the responses on the left of each response.
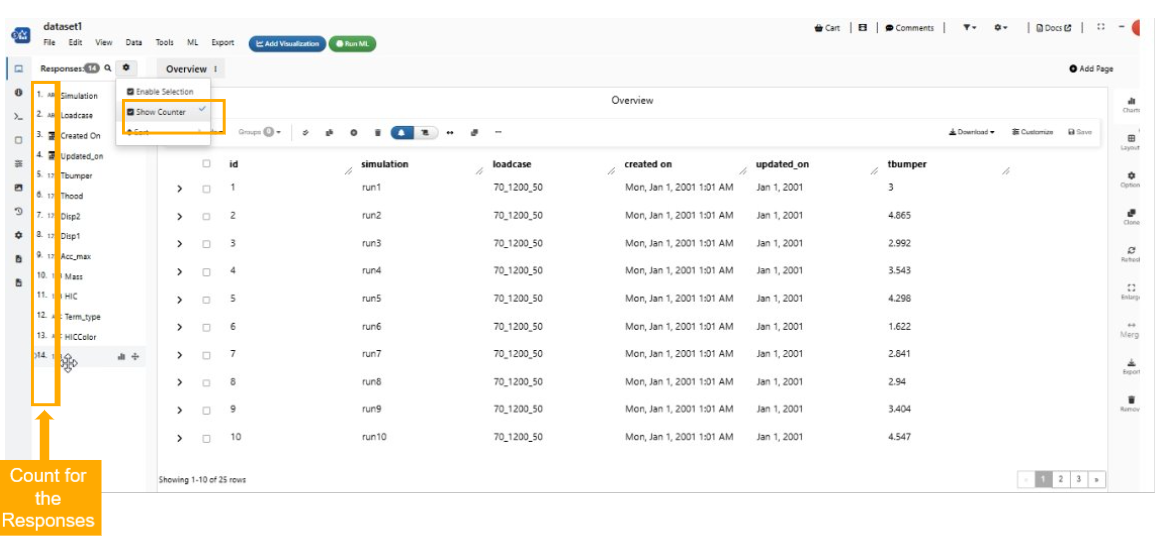
Show the count for the responses
Simulation responses now support sorting options in the settings dropdown.
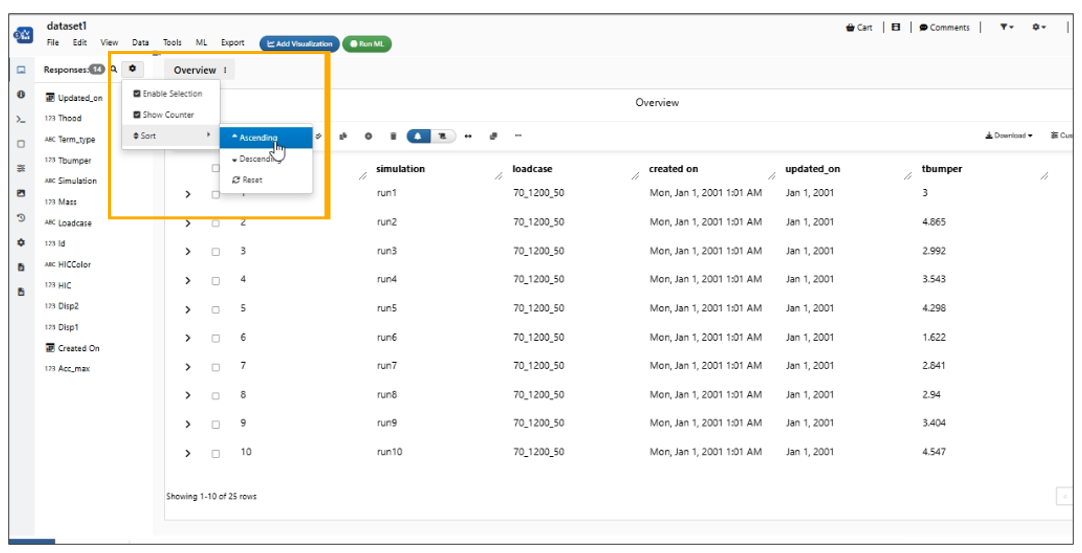
Responses sorting
Active page
The active page in Simlytiks dataset will now stay on the page either on left or on right while scrolling the pages in modern view.
UI theme
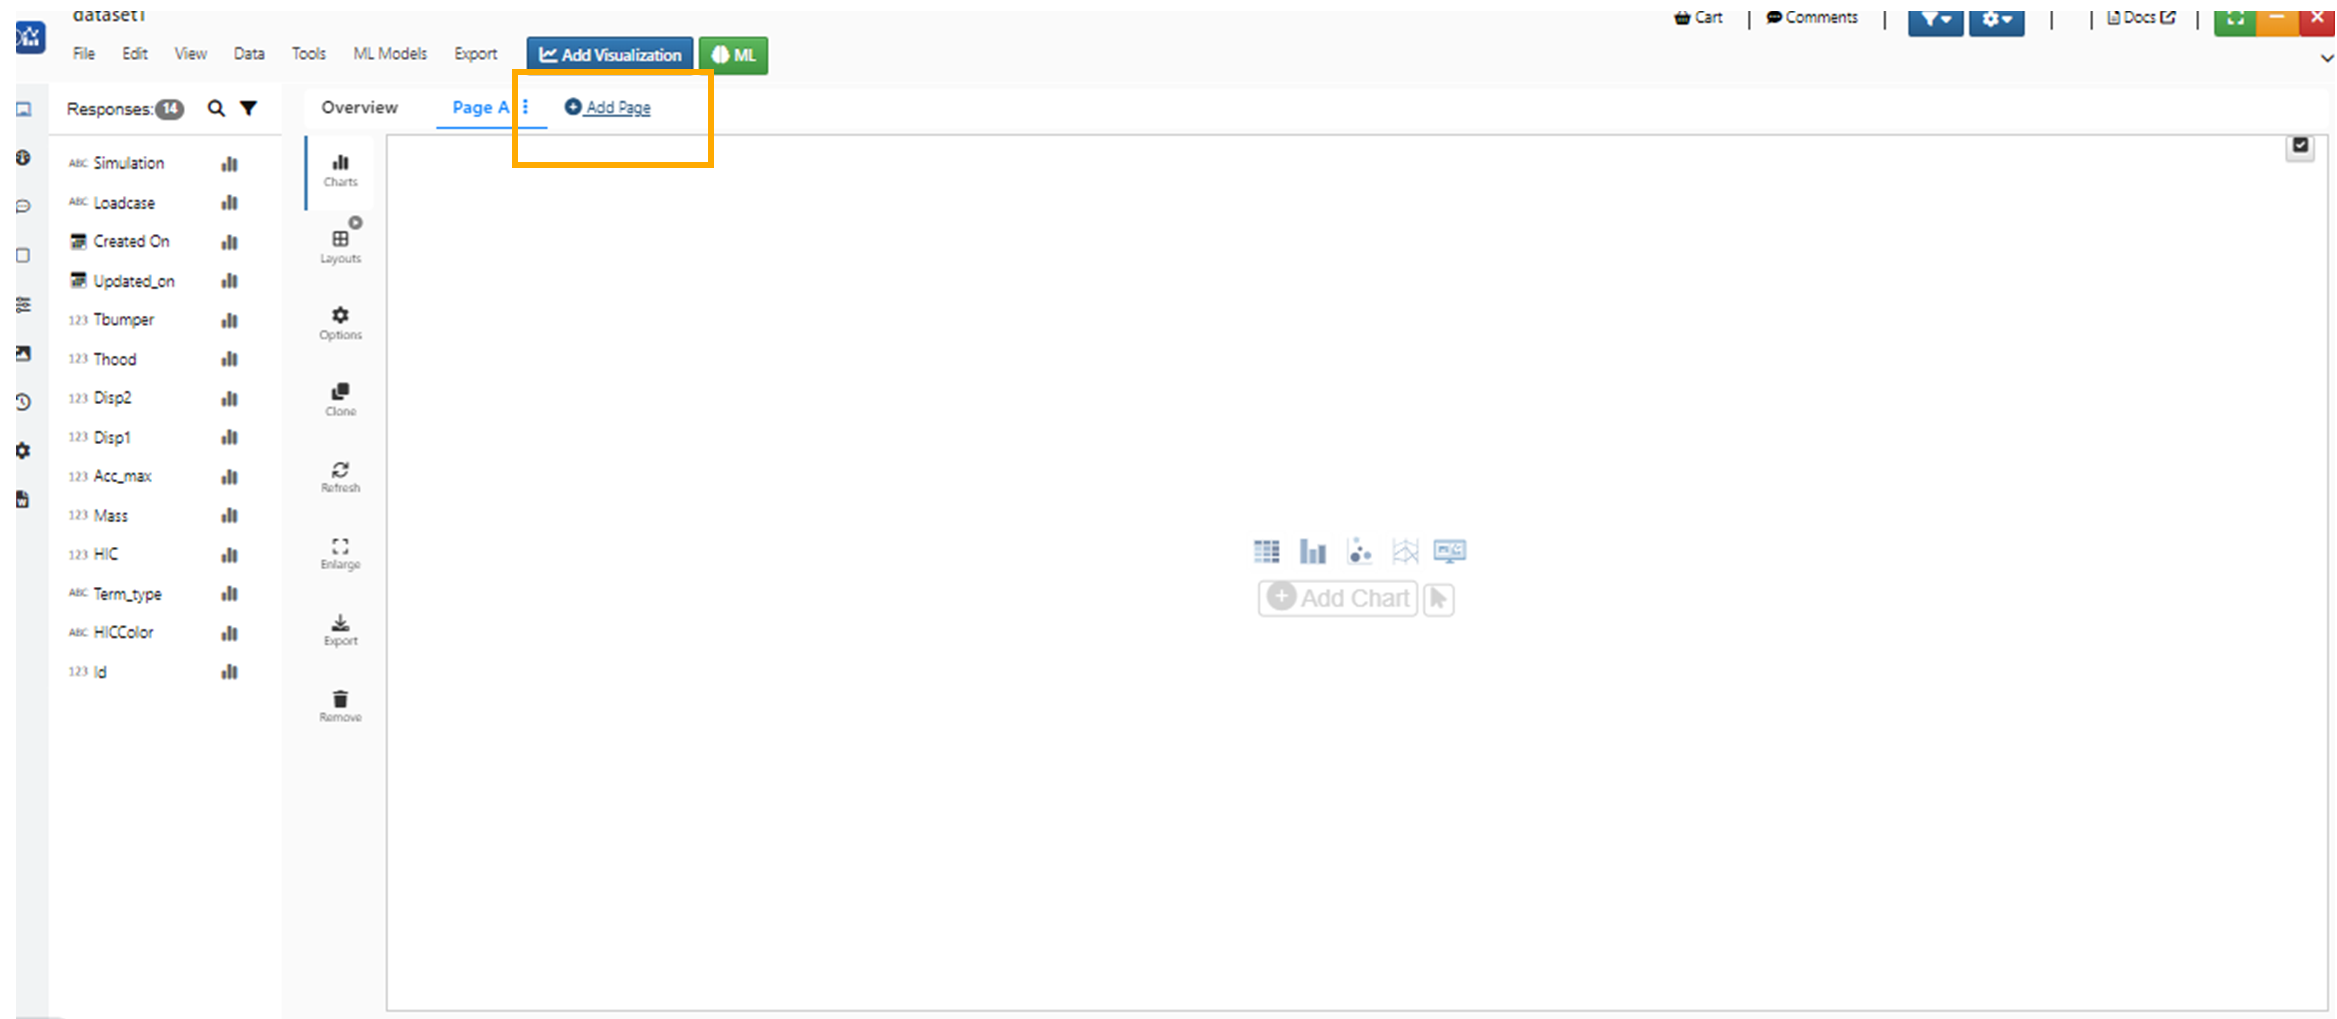
A new UI theme with Classic and Modern view options is now available under the ‘View’ tab in Simlytiks. The Modern view includes response visualizations and the Page Layout tab is now located next to the Add Page option.
Views
Side-by-Side view is now updated and available in Simlytiks dataset for the records.
In Simlytiks, the Basket and Slideshow options are now available under view tab in the header options.
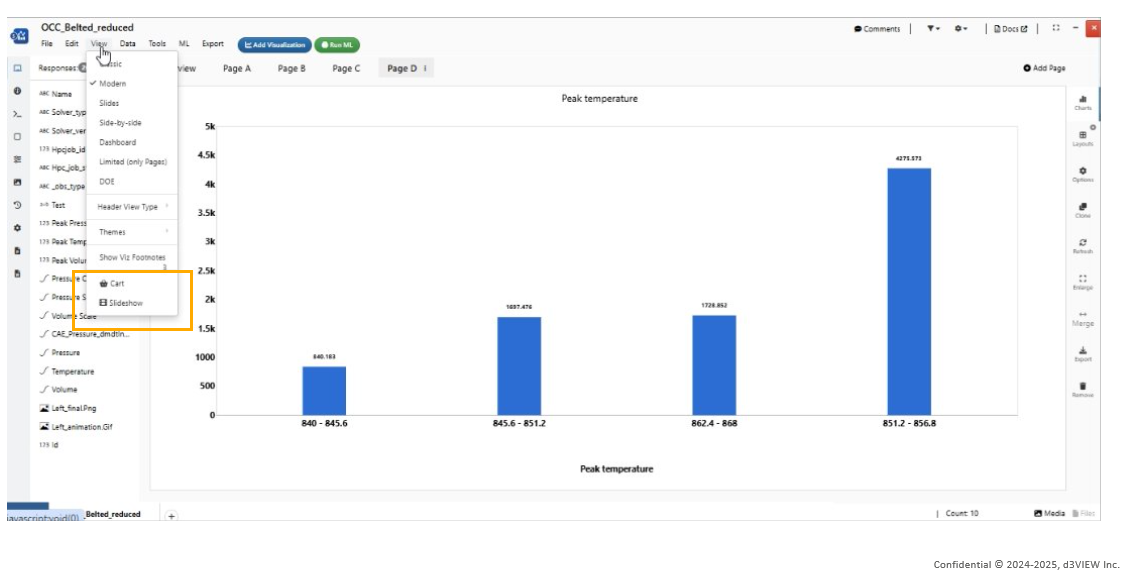
Slideshow under view
Run Workflow option
Run Workflow option is added in Simlytiks under Tools which helps us to run any workflow from a user’s account.
In Simlytiks, Tools -> Run Workflow will show columns as global variables which can be mapped to START worker inputs using the Global Variable Assigner (shows on initialize and can also be accessed using button at the bottom right of the workflow container)
Show footer
After Foot notes are saved to a Dataset, the Foot note exists whenever that particular dataset is opened in Simlytiks.
Visualization Footer notes are available as notes in the PPT when dataset is exported as PPT in Simlytiks.
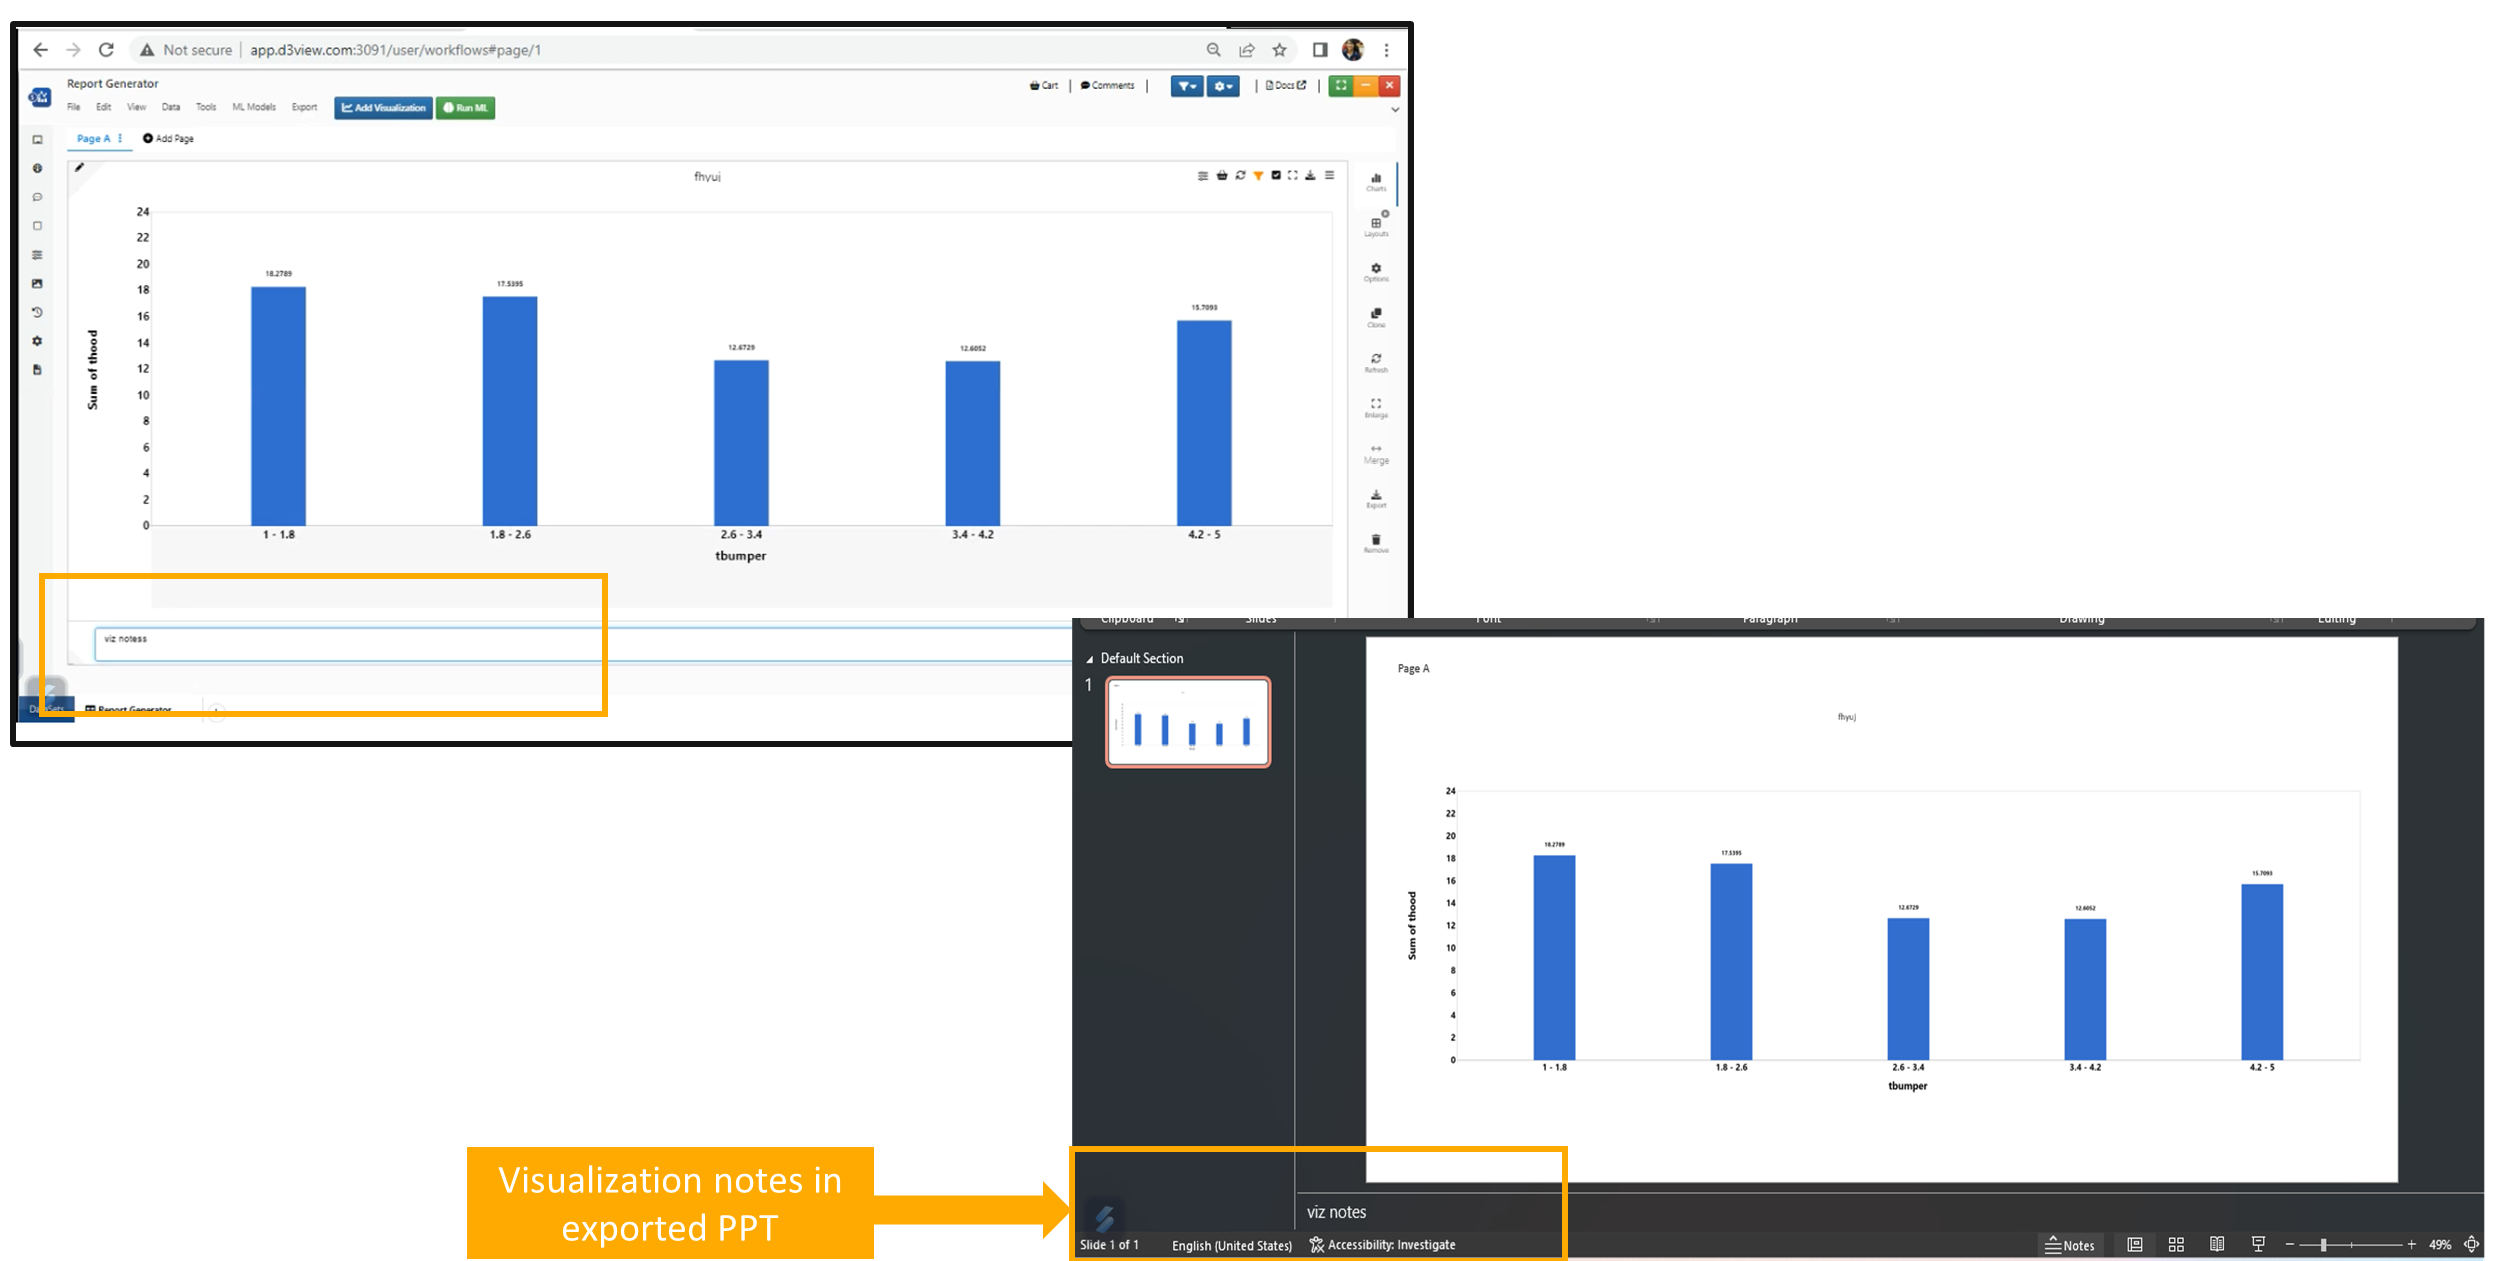
Footer notes in Exported PPT
Not-Between option
In Simlytiks, tools has a new operator filter called ‘NOT_BETWEEN’ which can be used for numerical columns.
Report Builder
Export as PPT in Report builder has new options to add Watermark and Slide Title Font selection for the slides in the PPT.
Multiselect Inputs
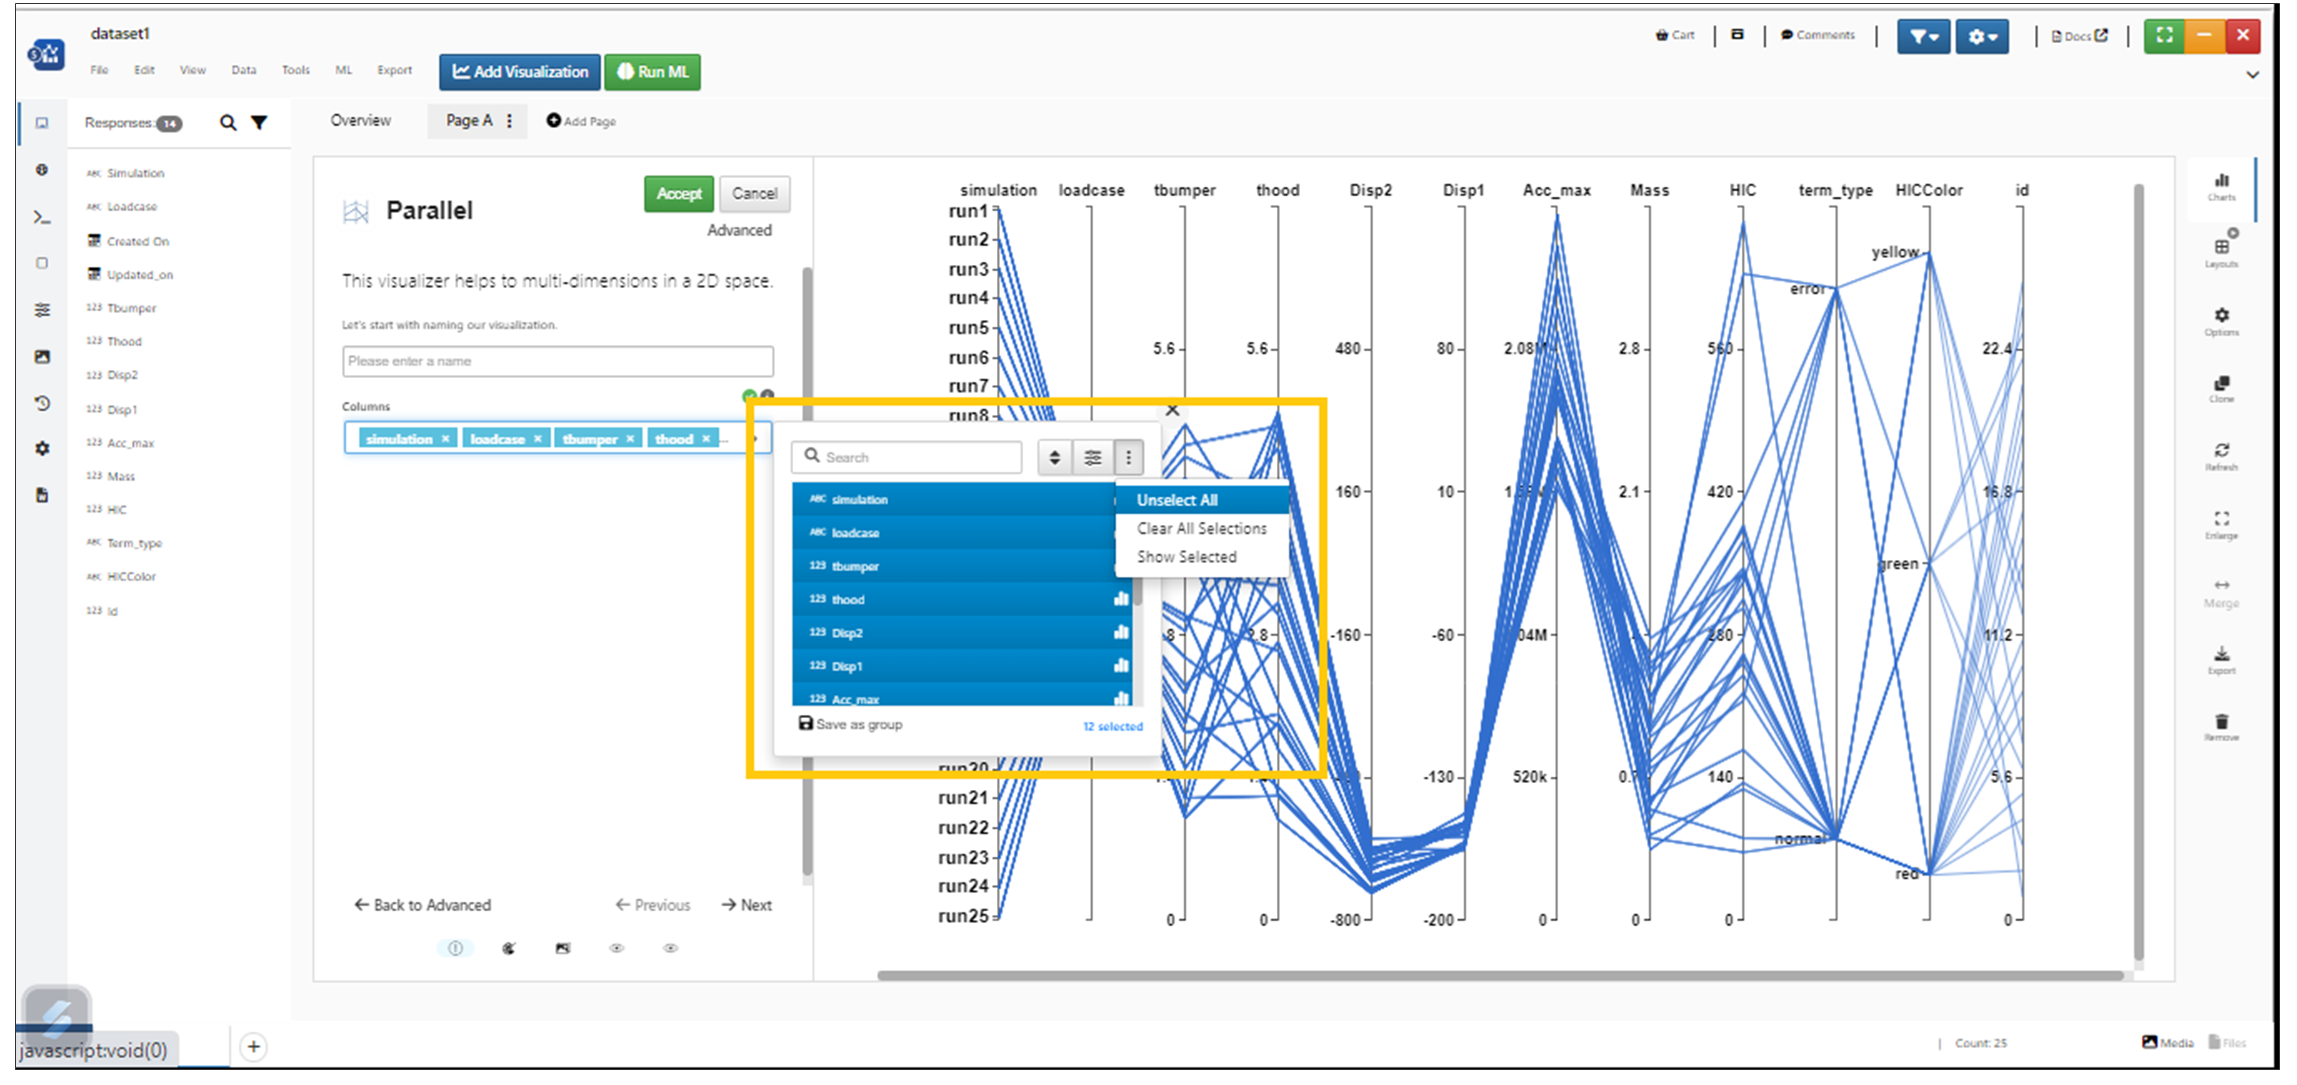
For Multiselect inputs - select all, show selection, clear selection options is shifted to the three dots on right of the input.
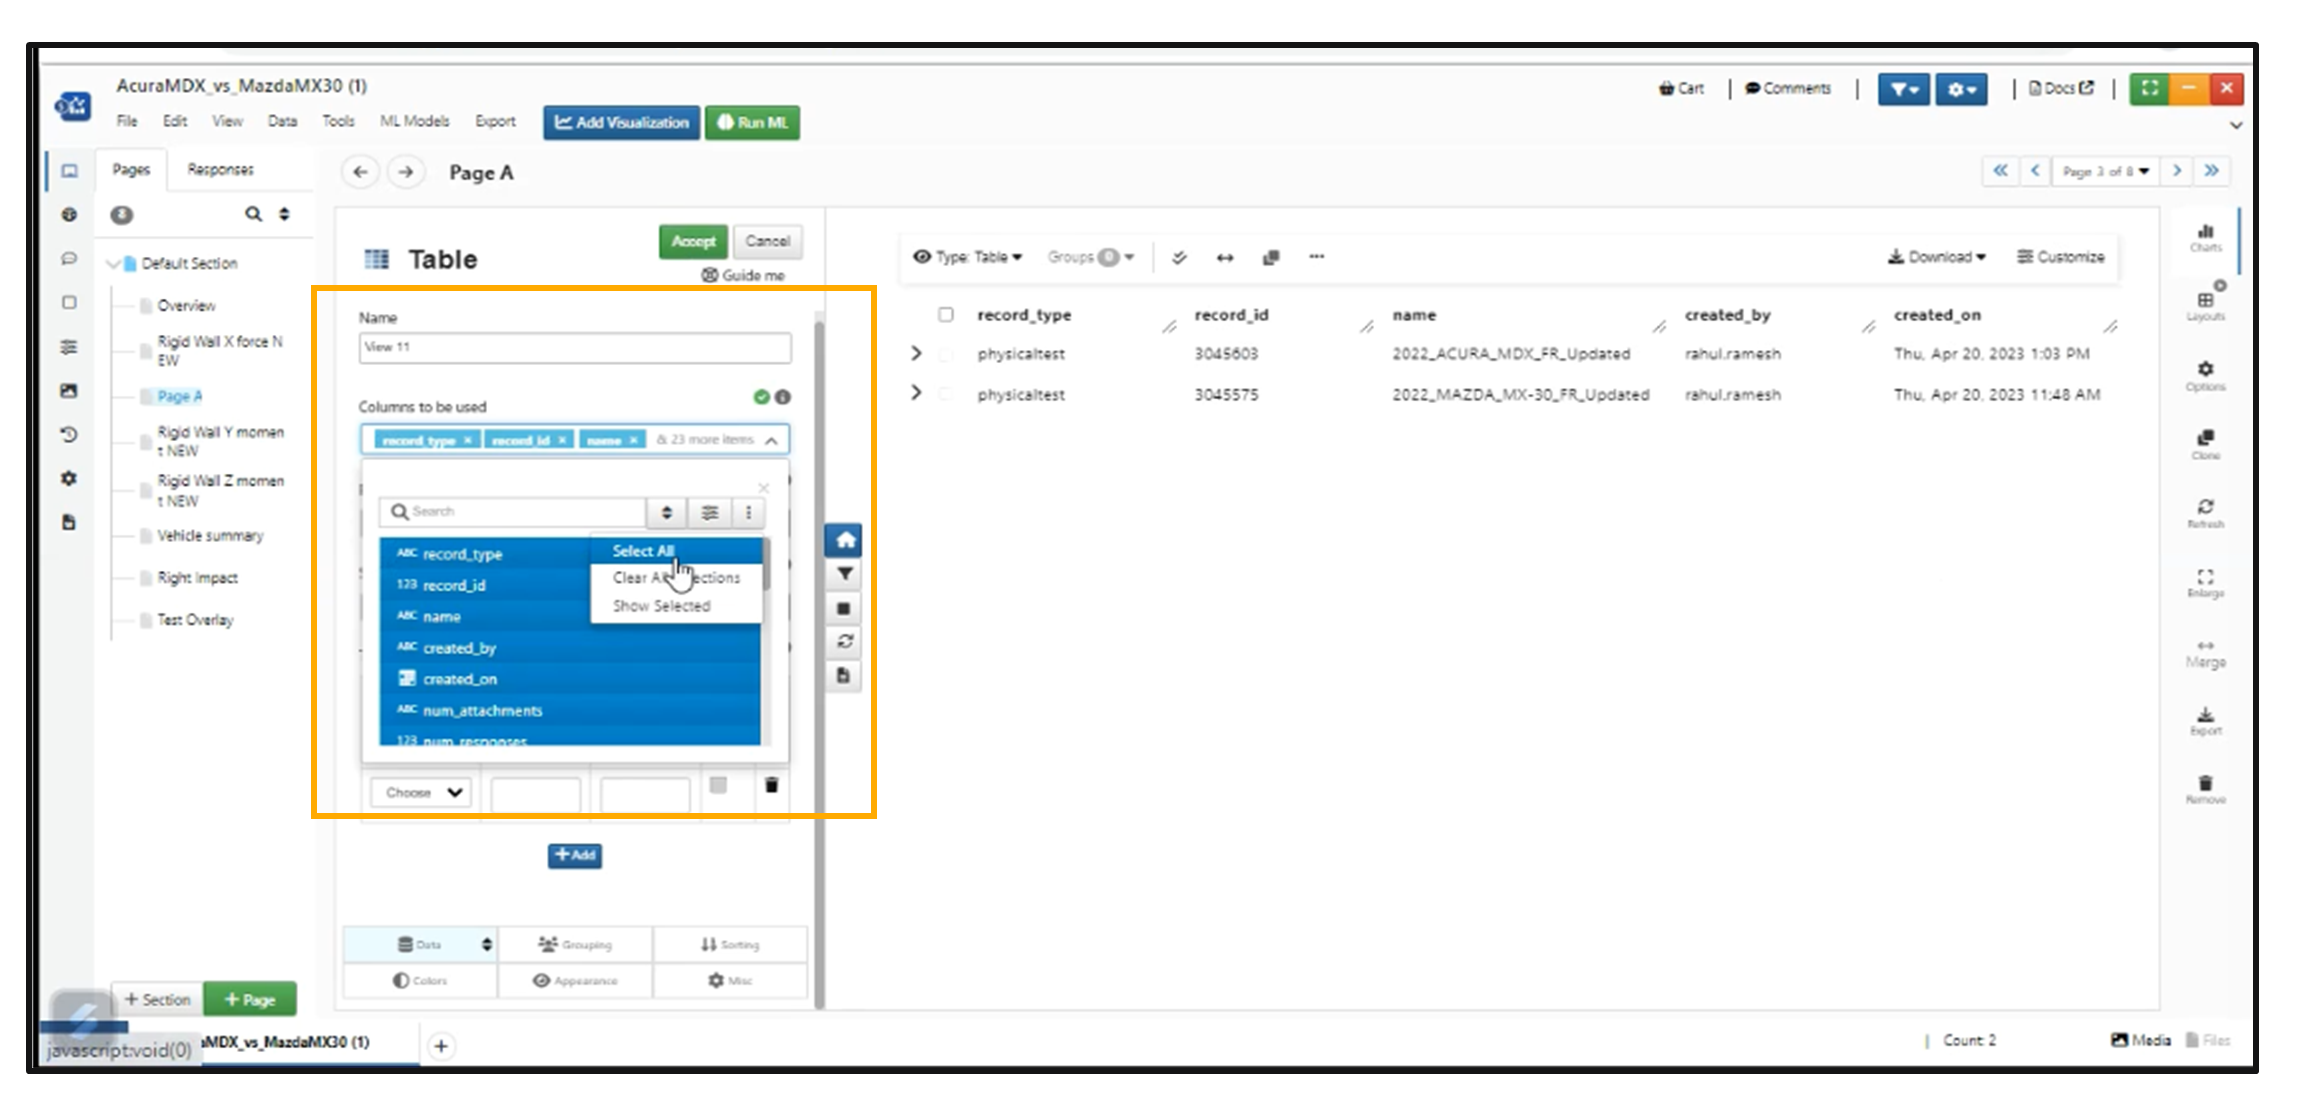
Multiselect Inputs
Multiselect dropdown will now open on the right and not within the same container as the input. This will help with 2 things: 1. No additional scrollbars within containers (this was a major UI issue in Simlytiks Viz Preview) 2. For items more than 5, the dropdown list will open to the right avoiding collision with other options.
Multiselect Inputs Selection
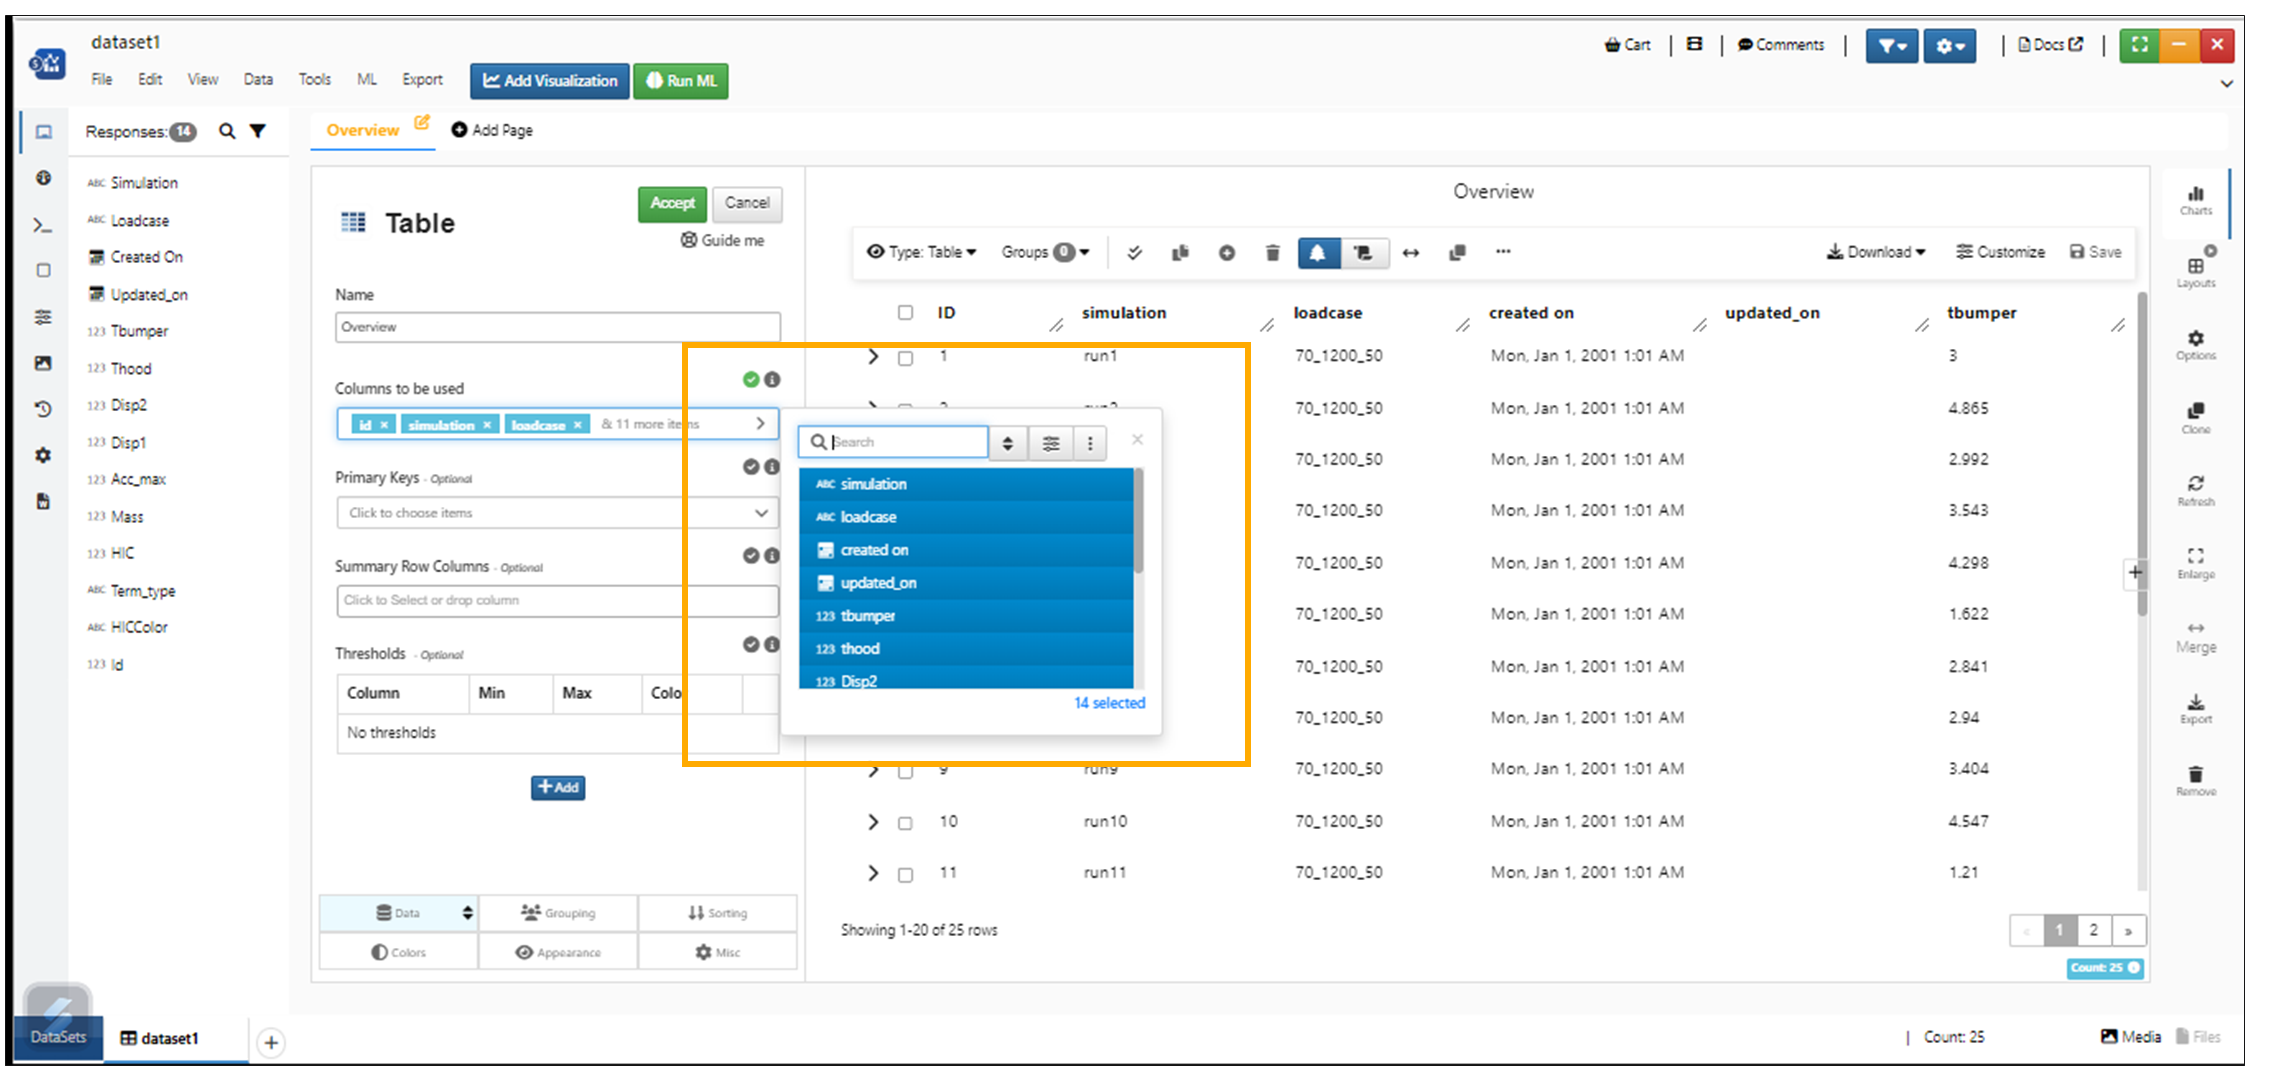
The count of selected items in Multiselect option is now shown at the bottom below the list. This can be seen in any multiselect option across the platform.
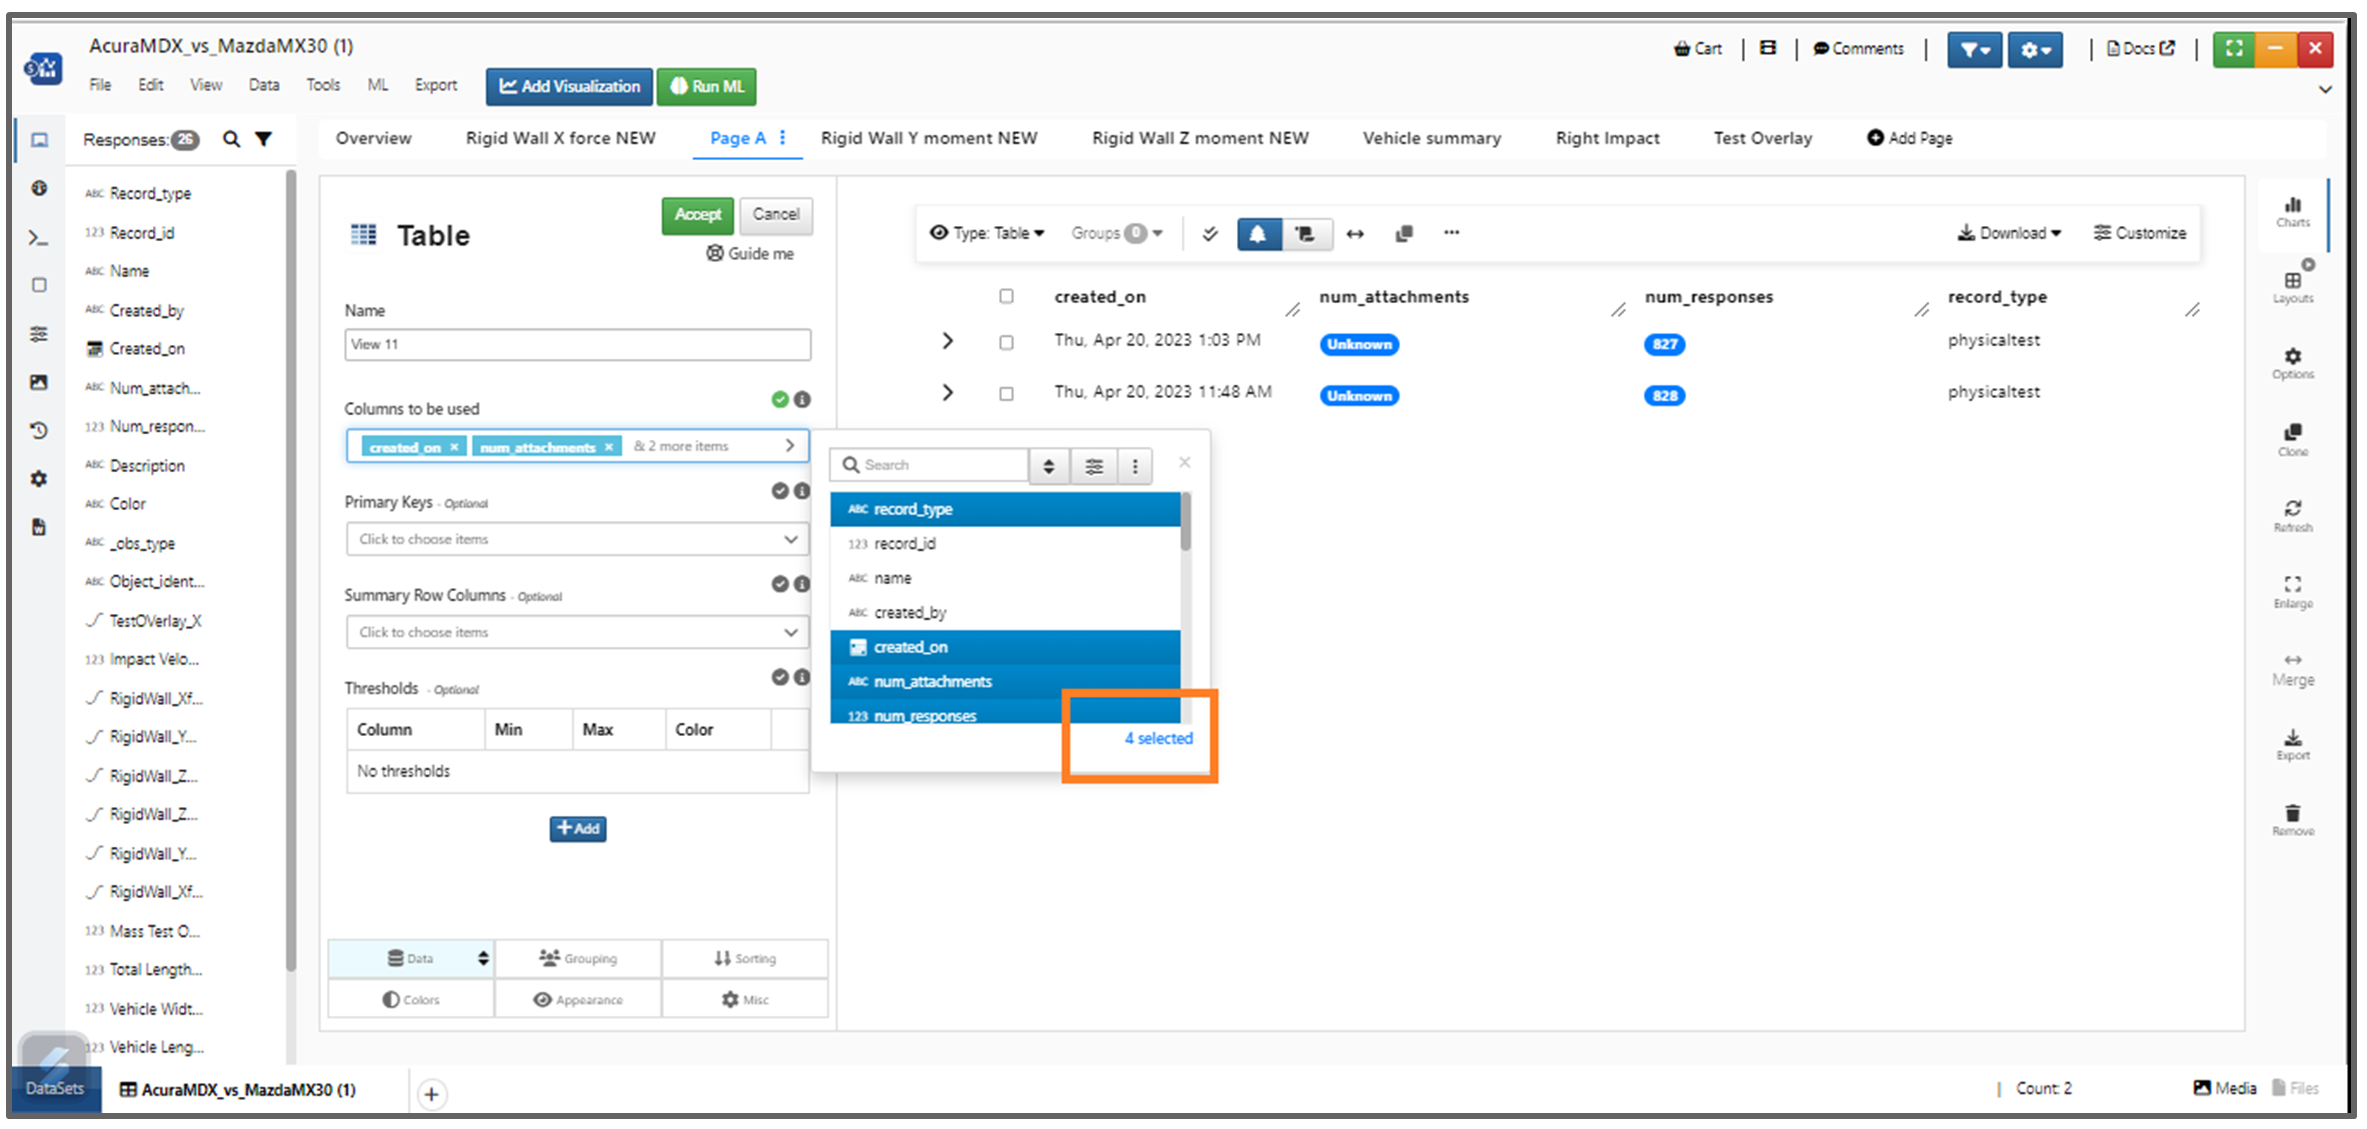
Multiselect Count
The new Multiselect dropdown now has Search option to search the inputs in Simlytiks.
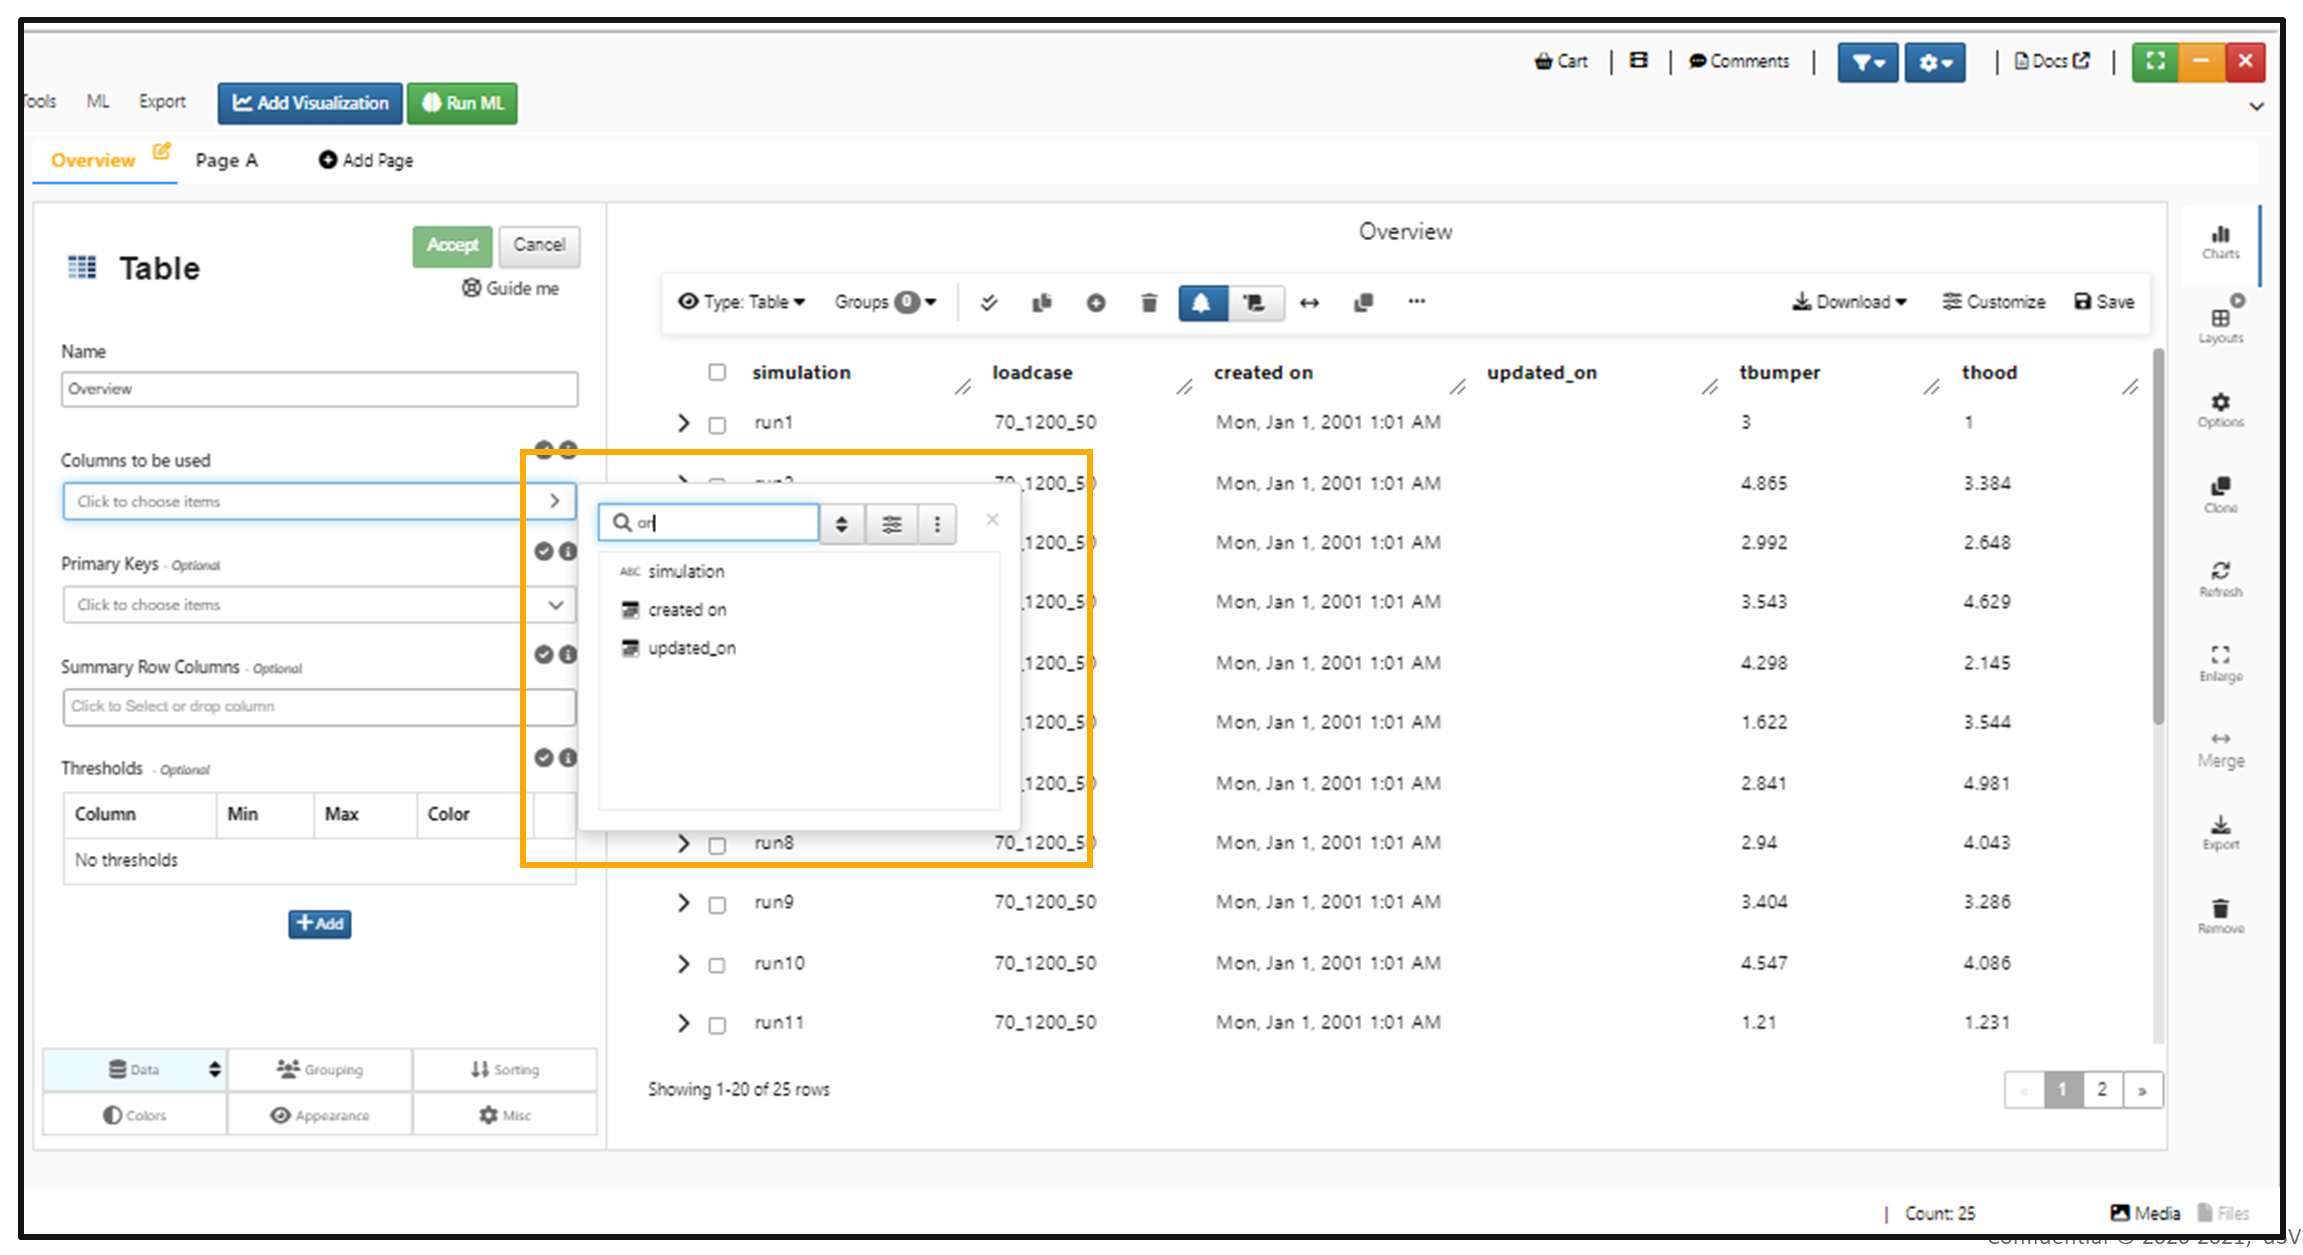
Multiselect Search
Added support for a separator in Multiselect option which can be used to search for multiple columns at once. This is a select list inside Filters dropdown in multiselect.
Multiselect now supports groups in Selection. After selecting columns, a new button will show up as Save as group which will be saved to the Simlytiks dataset.
Added support for pattern under Filters in Multiselect option.
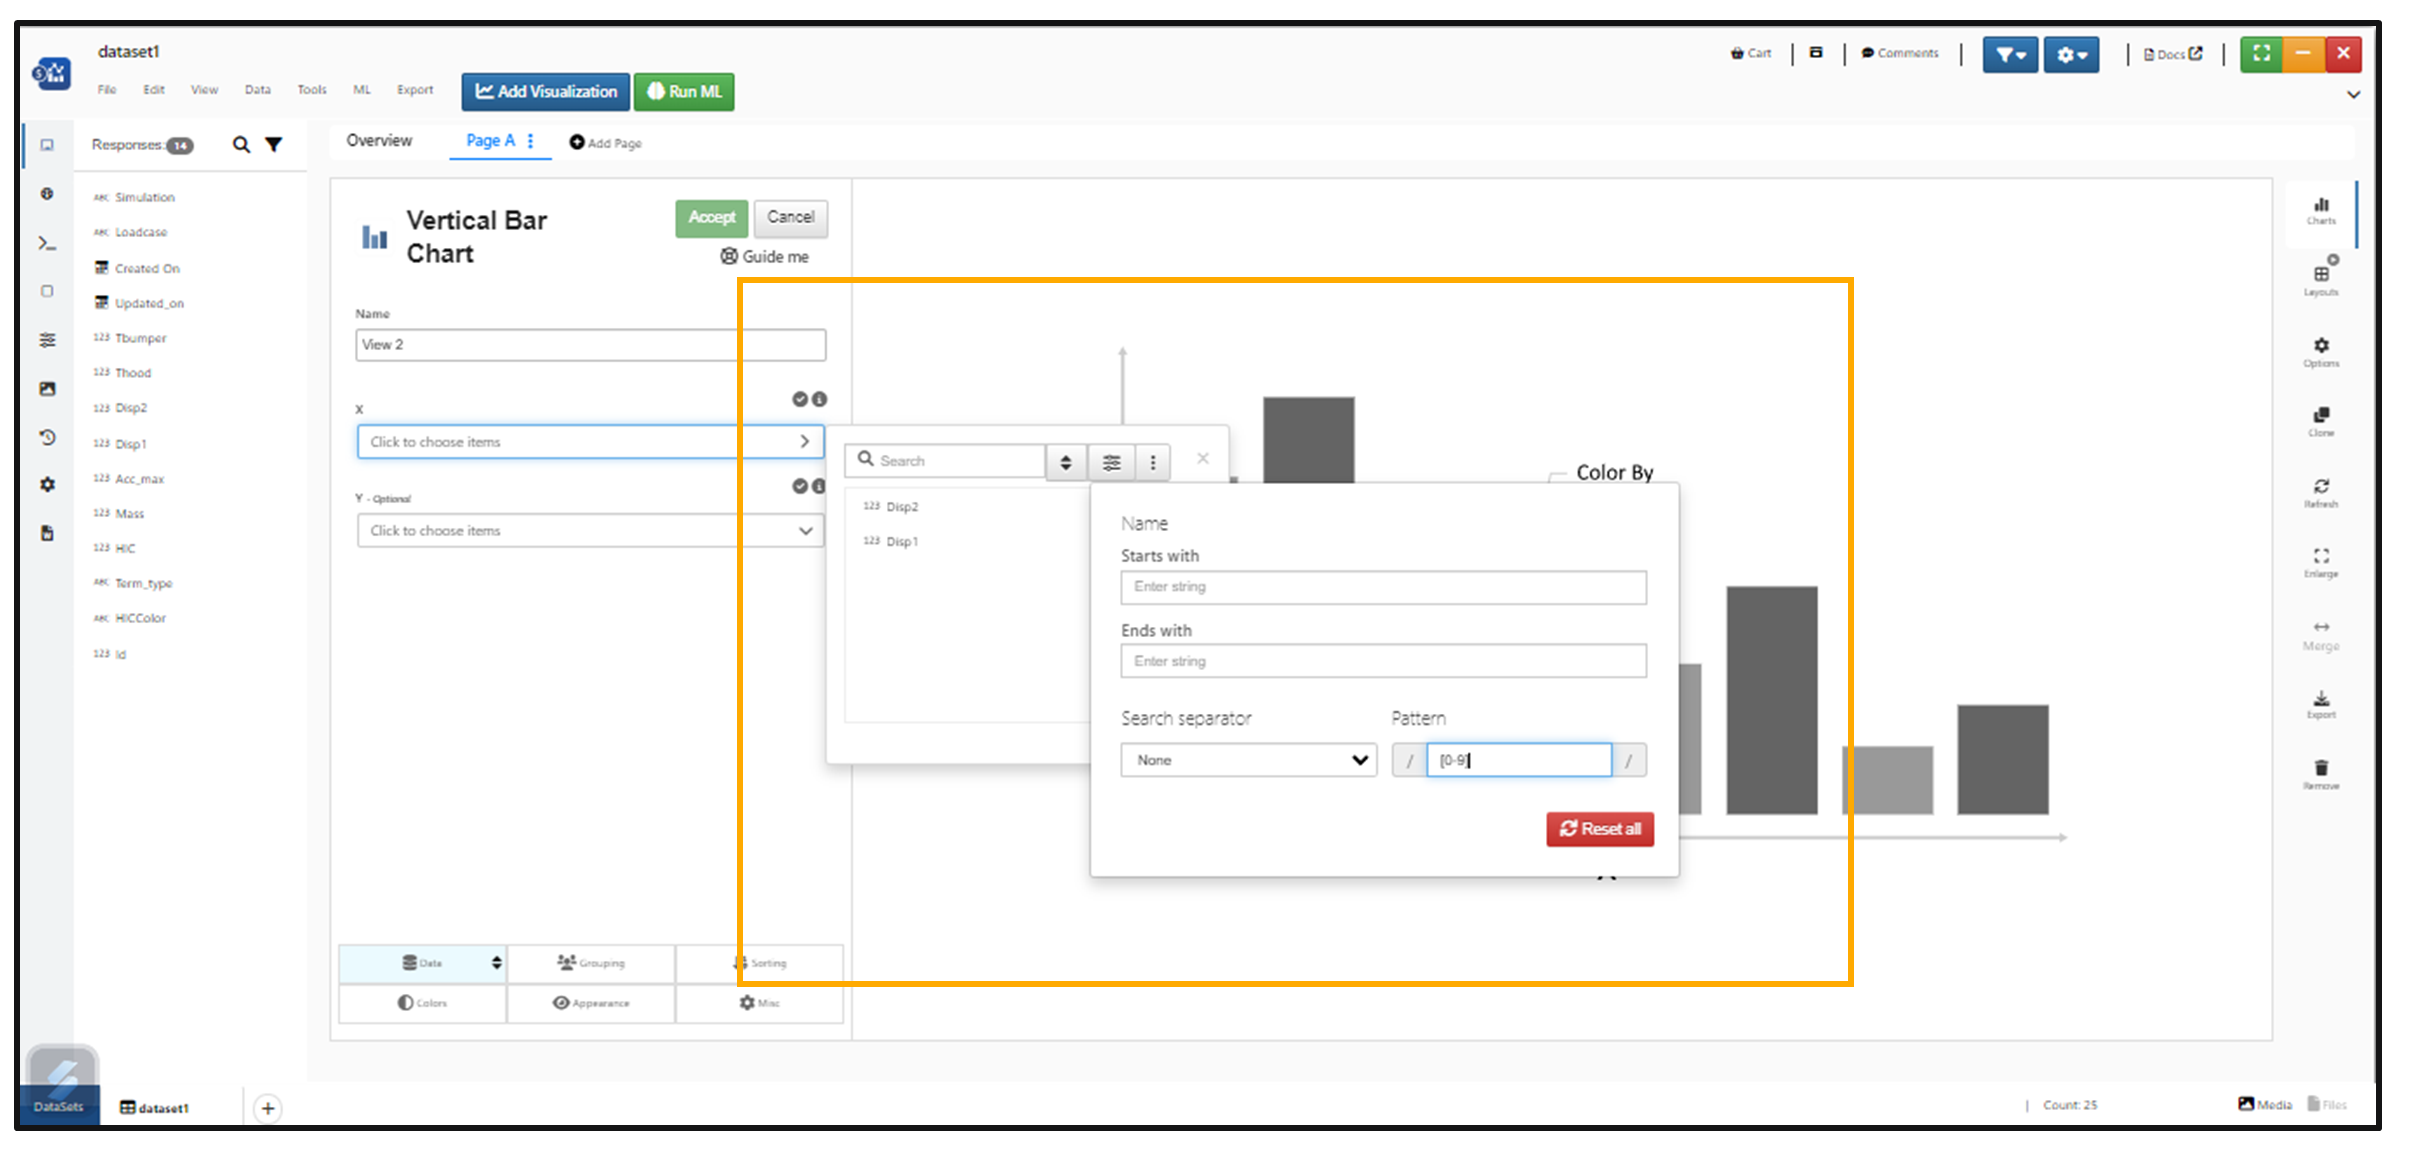
Multiselect Pattern
Multiselect in visualization preview now shows the viz icon in the list which can be clicked to view the corresponding column visualization.
Select All button in Multiselect now acts like a toggle button. We can Select All inputs and click again to De-select all.
Multiselect Toggle
The multiselect dropdown menu is now resizable and the dimensions will be saved
Multiselect update
Multiselect now has Close and Done buttons.
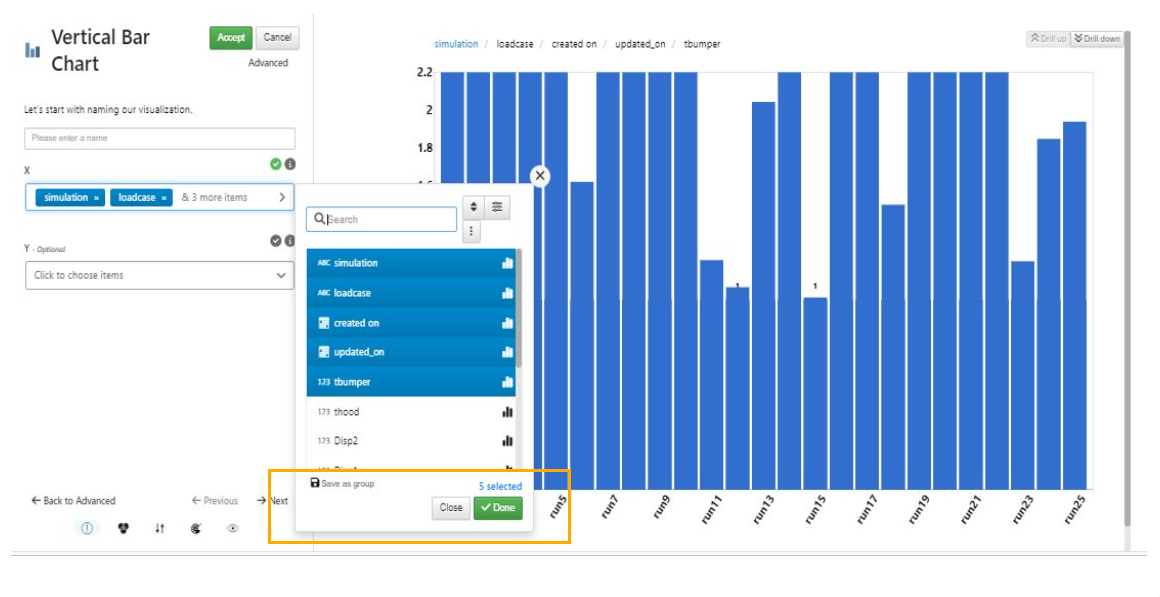
Multiselect close
- button
Multiselect will have a ‘+’ button which helps user to add more inputs.
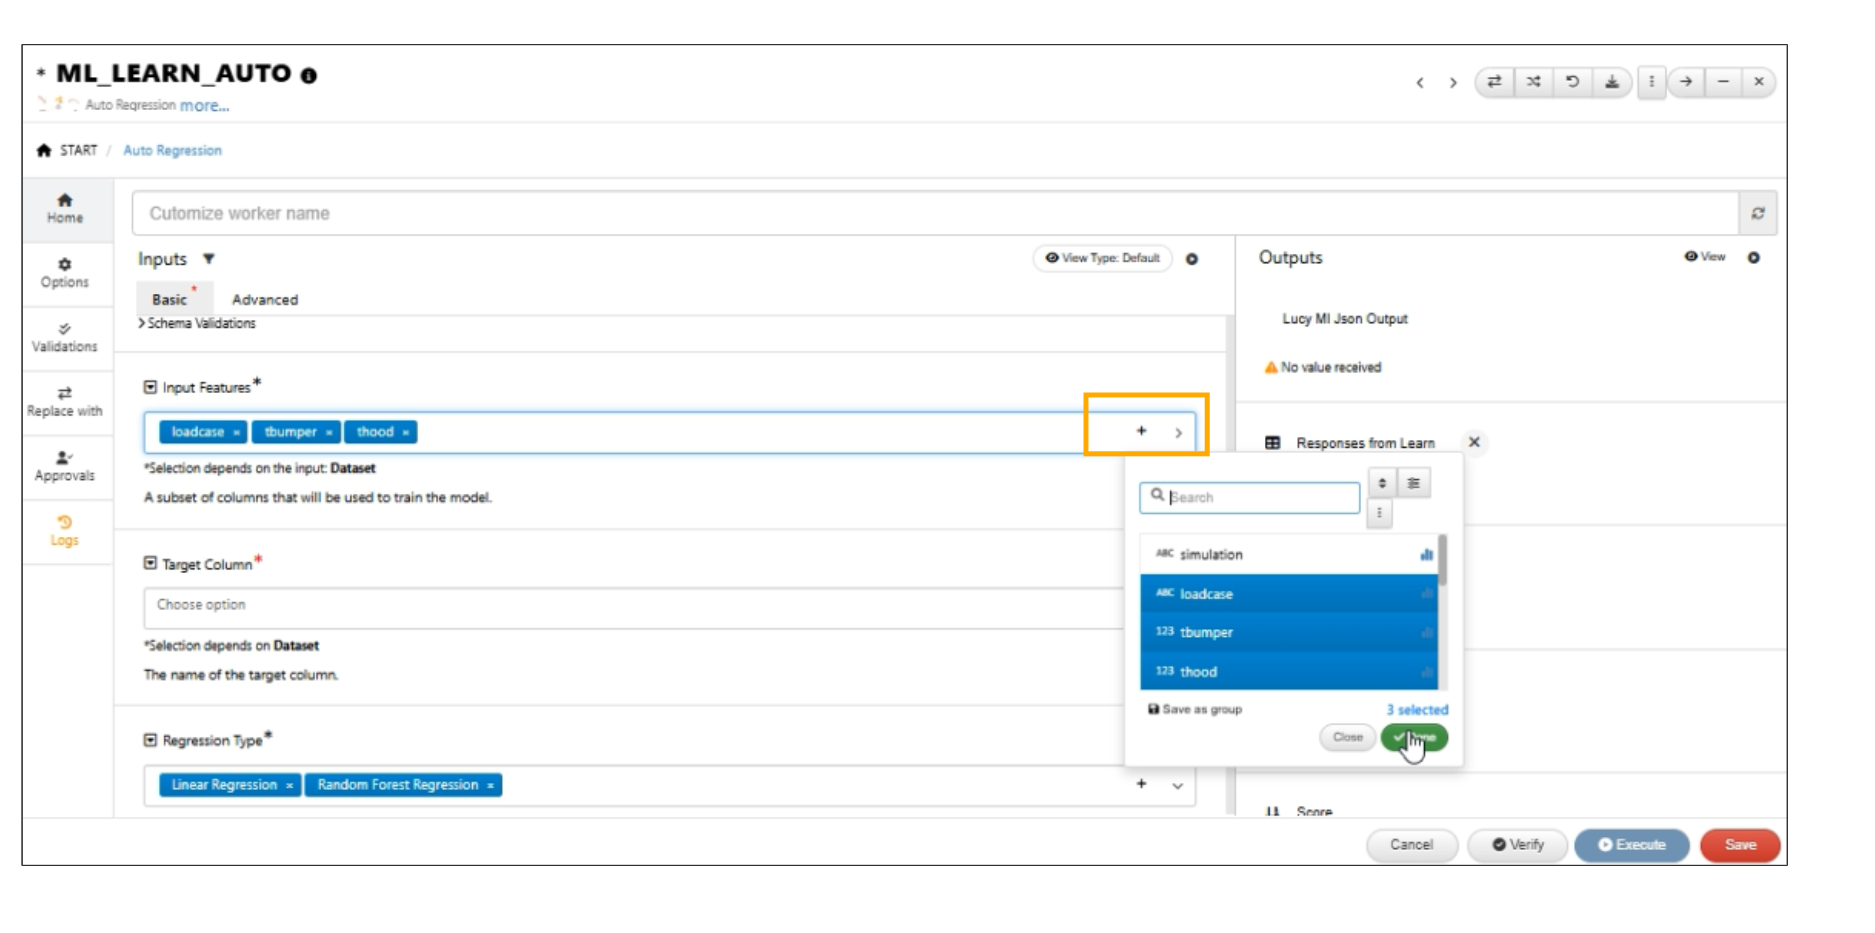
Add button
DOE VIEW
DOE View now has first 3 numerical columns selected by default for 3D Scatter and first categorical column for color By in Simlytiks. Categorical columns are now shown for color By option which will reflect in the chart.
Common settings
In Simlytiks, Tools->Settings->Visualizations tab has a new group called generic settings which are common settings applied to all charts at once. Right now, we only have 1 option to disable Y Axis & ticks for Curve Plots. Once changed and saved, a curve plot will reflect the changes. These settings are also saved to the dataset when exported/imported.
In Simlytiks, the Alias and Colors in Tools -> customize options are simplified and made more user friendly by showing only the Custom alias with autofill option for the column values.
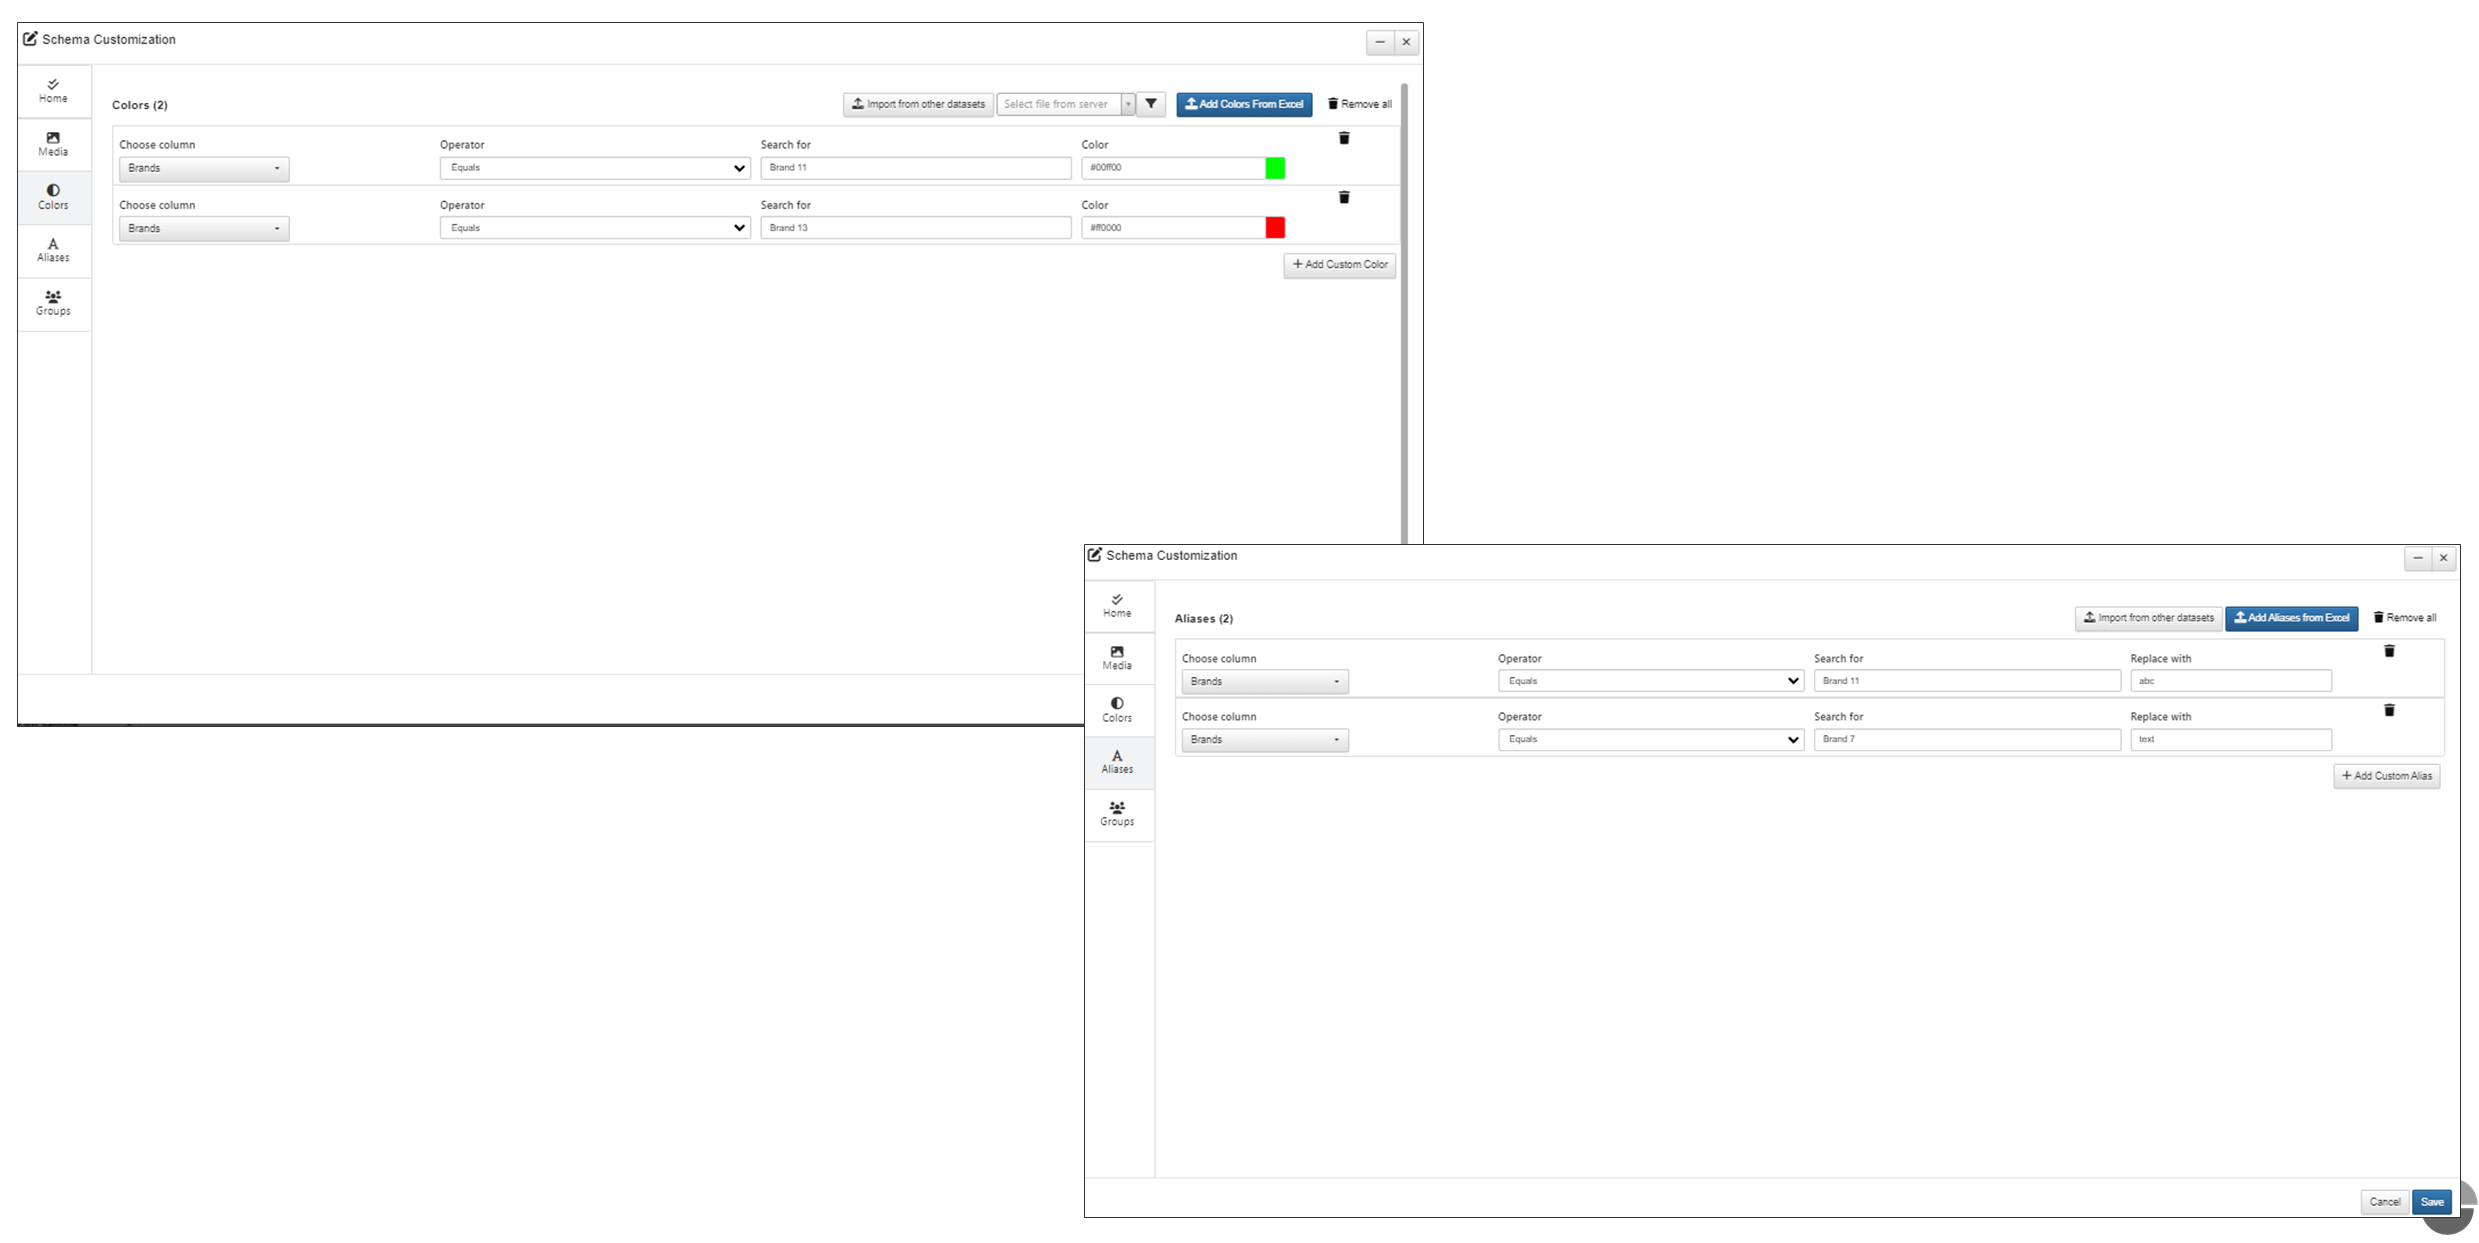
Alias Settings
Settings button in the left nav bar in Simlytiks will now show only the basic options and has Advanced button which will take the user to the full settings view in a modal.
New setting in Simlytiks ( Tools -> Settings ) to specify the columns to be used in DataProfiler.
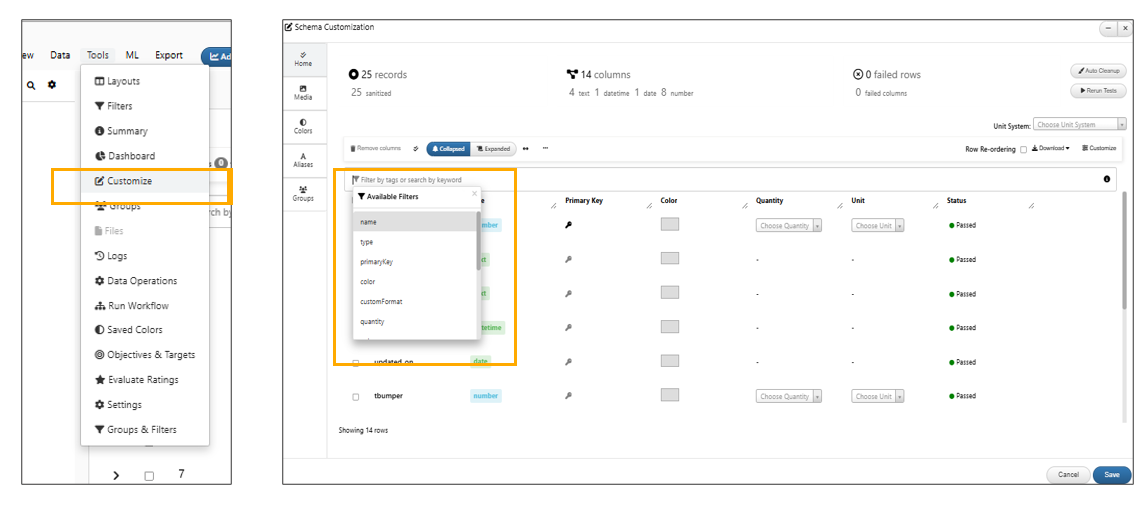
In Simlytiks, dataset with date columns will have ‘Custom format’ option in Tools -> Customize schema table which allows formatting changes for date columns and the overview table will reflect the changes.
New settings available in Simlytiks to show the page layout option as a dropdown menu.
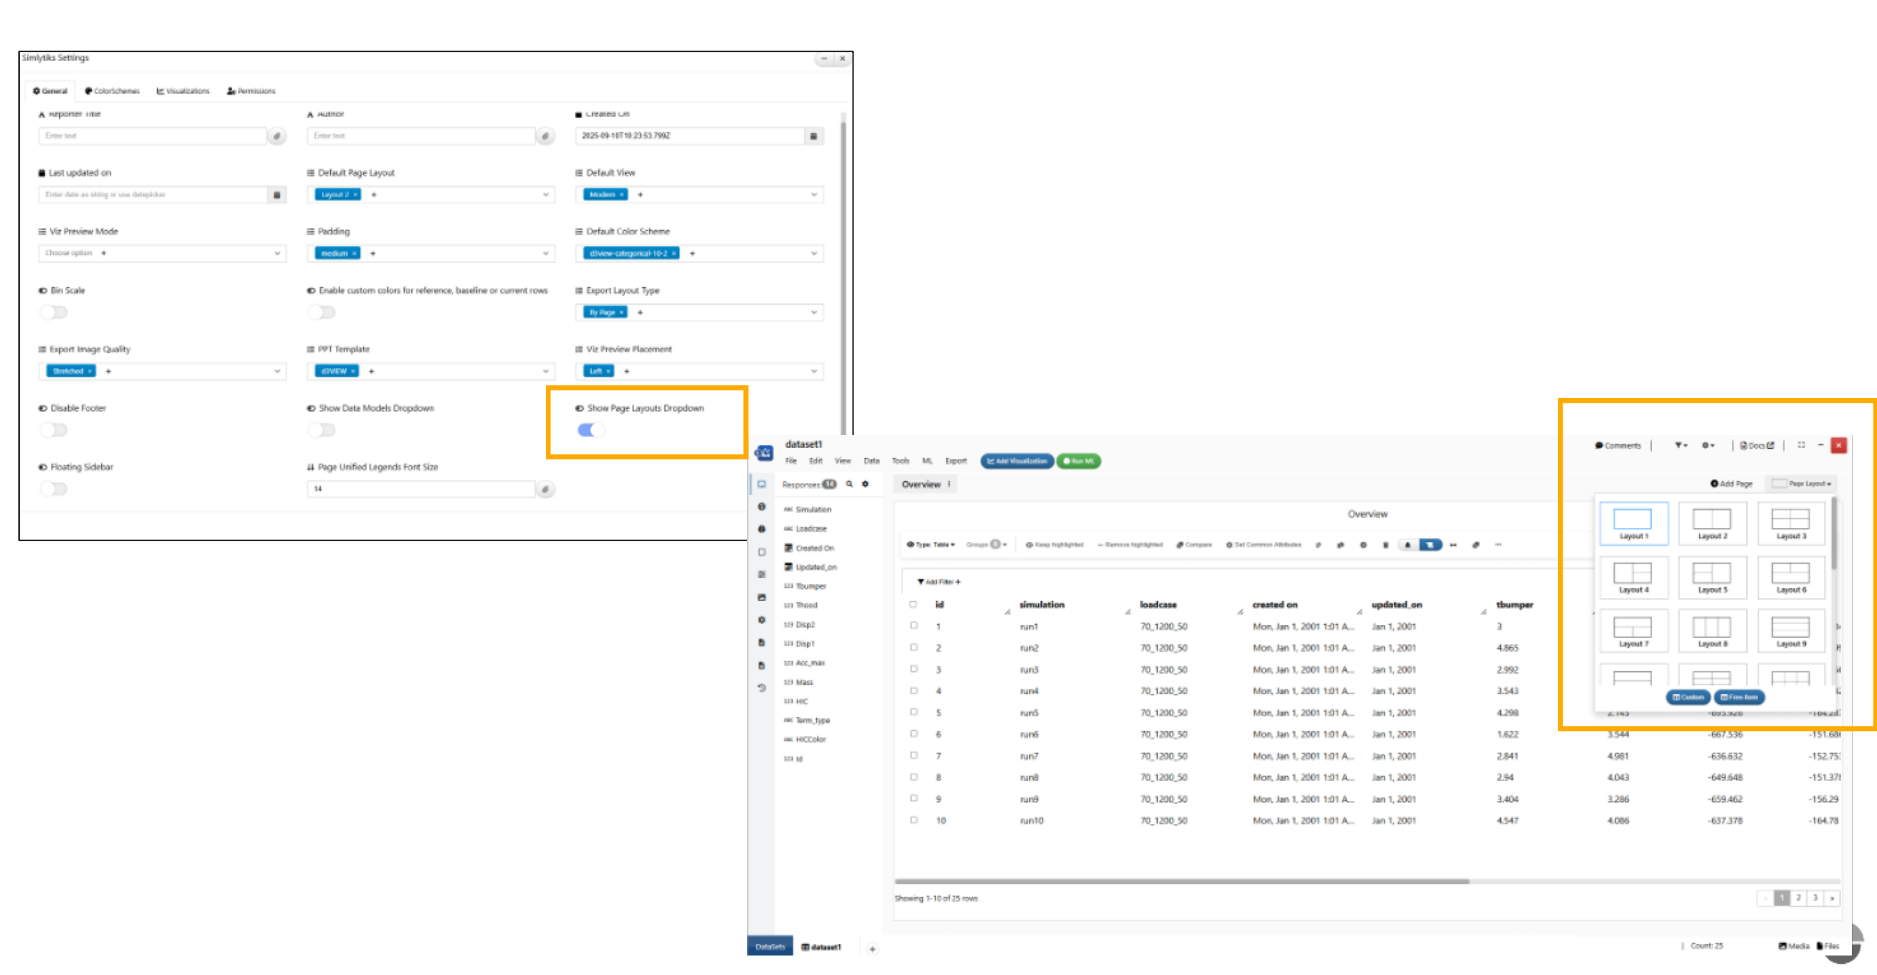
Page Layout
Simlytiks now supports a floating left sidebar option under Tools -> Settings option.
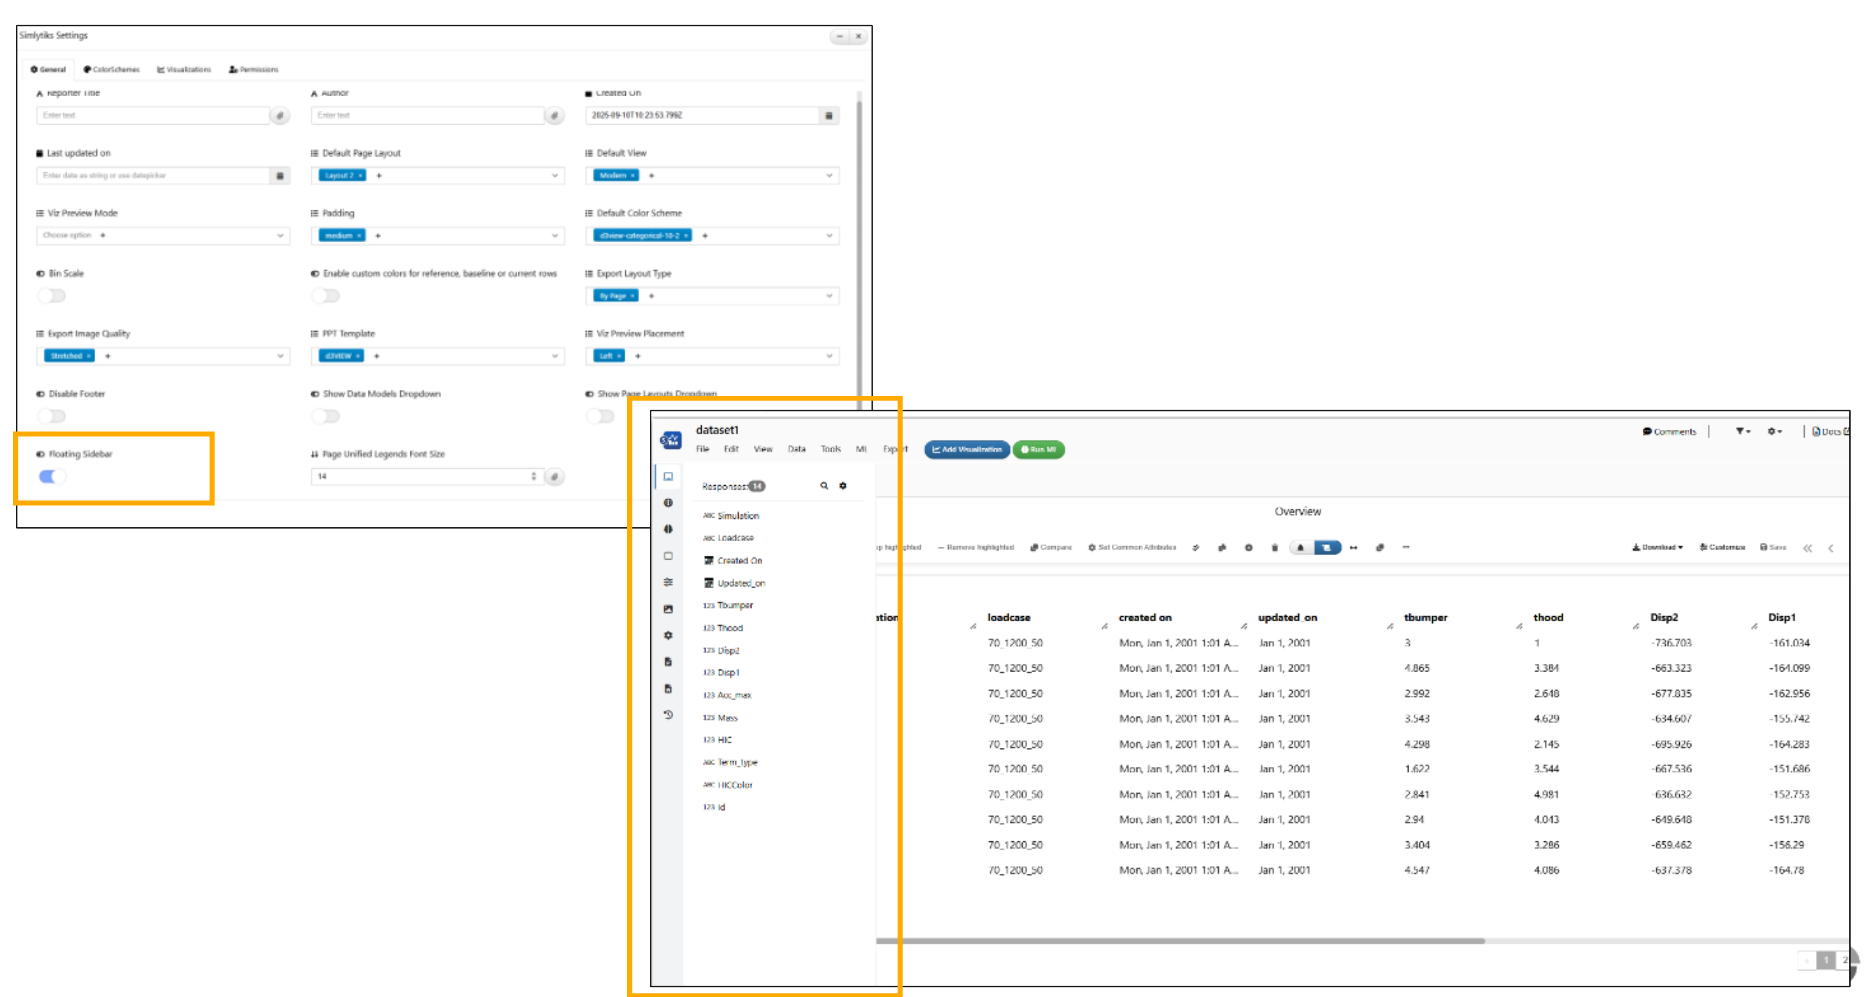
Floating side bar
Added a new setting in Simlytiks to customize the font size of unified legends at the page level.
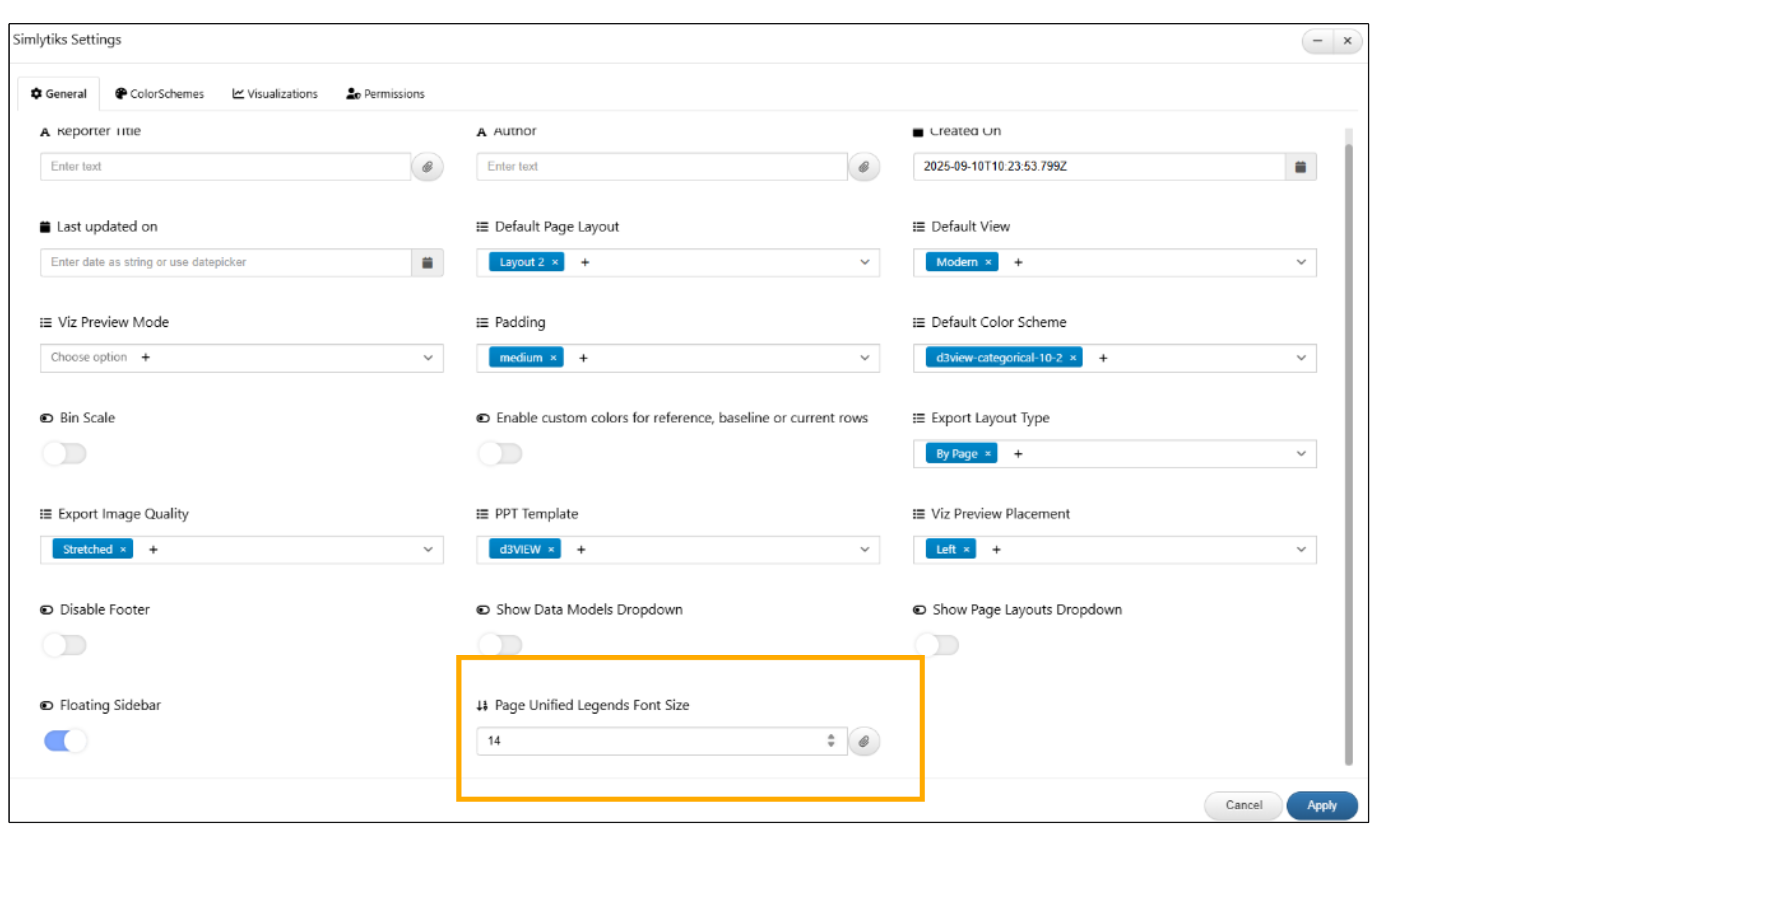
Unified Legends
Word Template export
New export option ‘Word Template’ is added in Simlytiks. Where the Page or visualizations can be dragged and dropped onto the editor and on clicking export, the entire Editor contents will be converted to a Word Document and saved.
Export to word option now allows user to provide Name for the document to be downloaded.
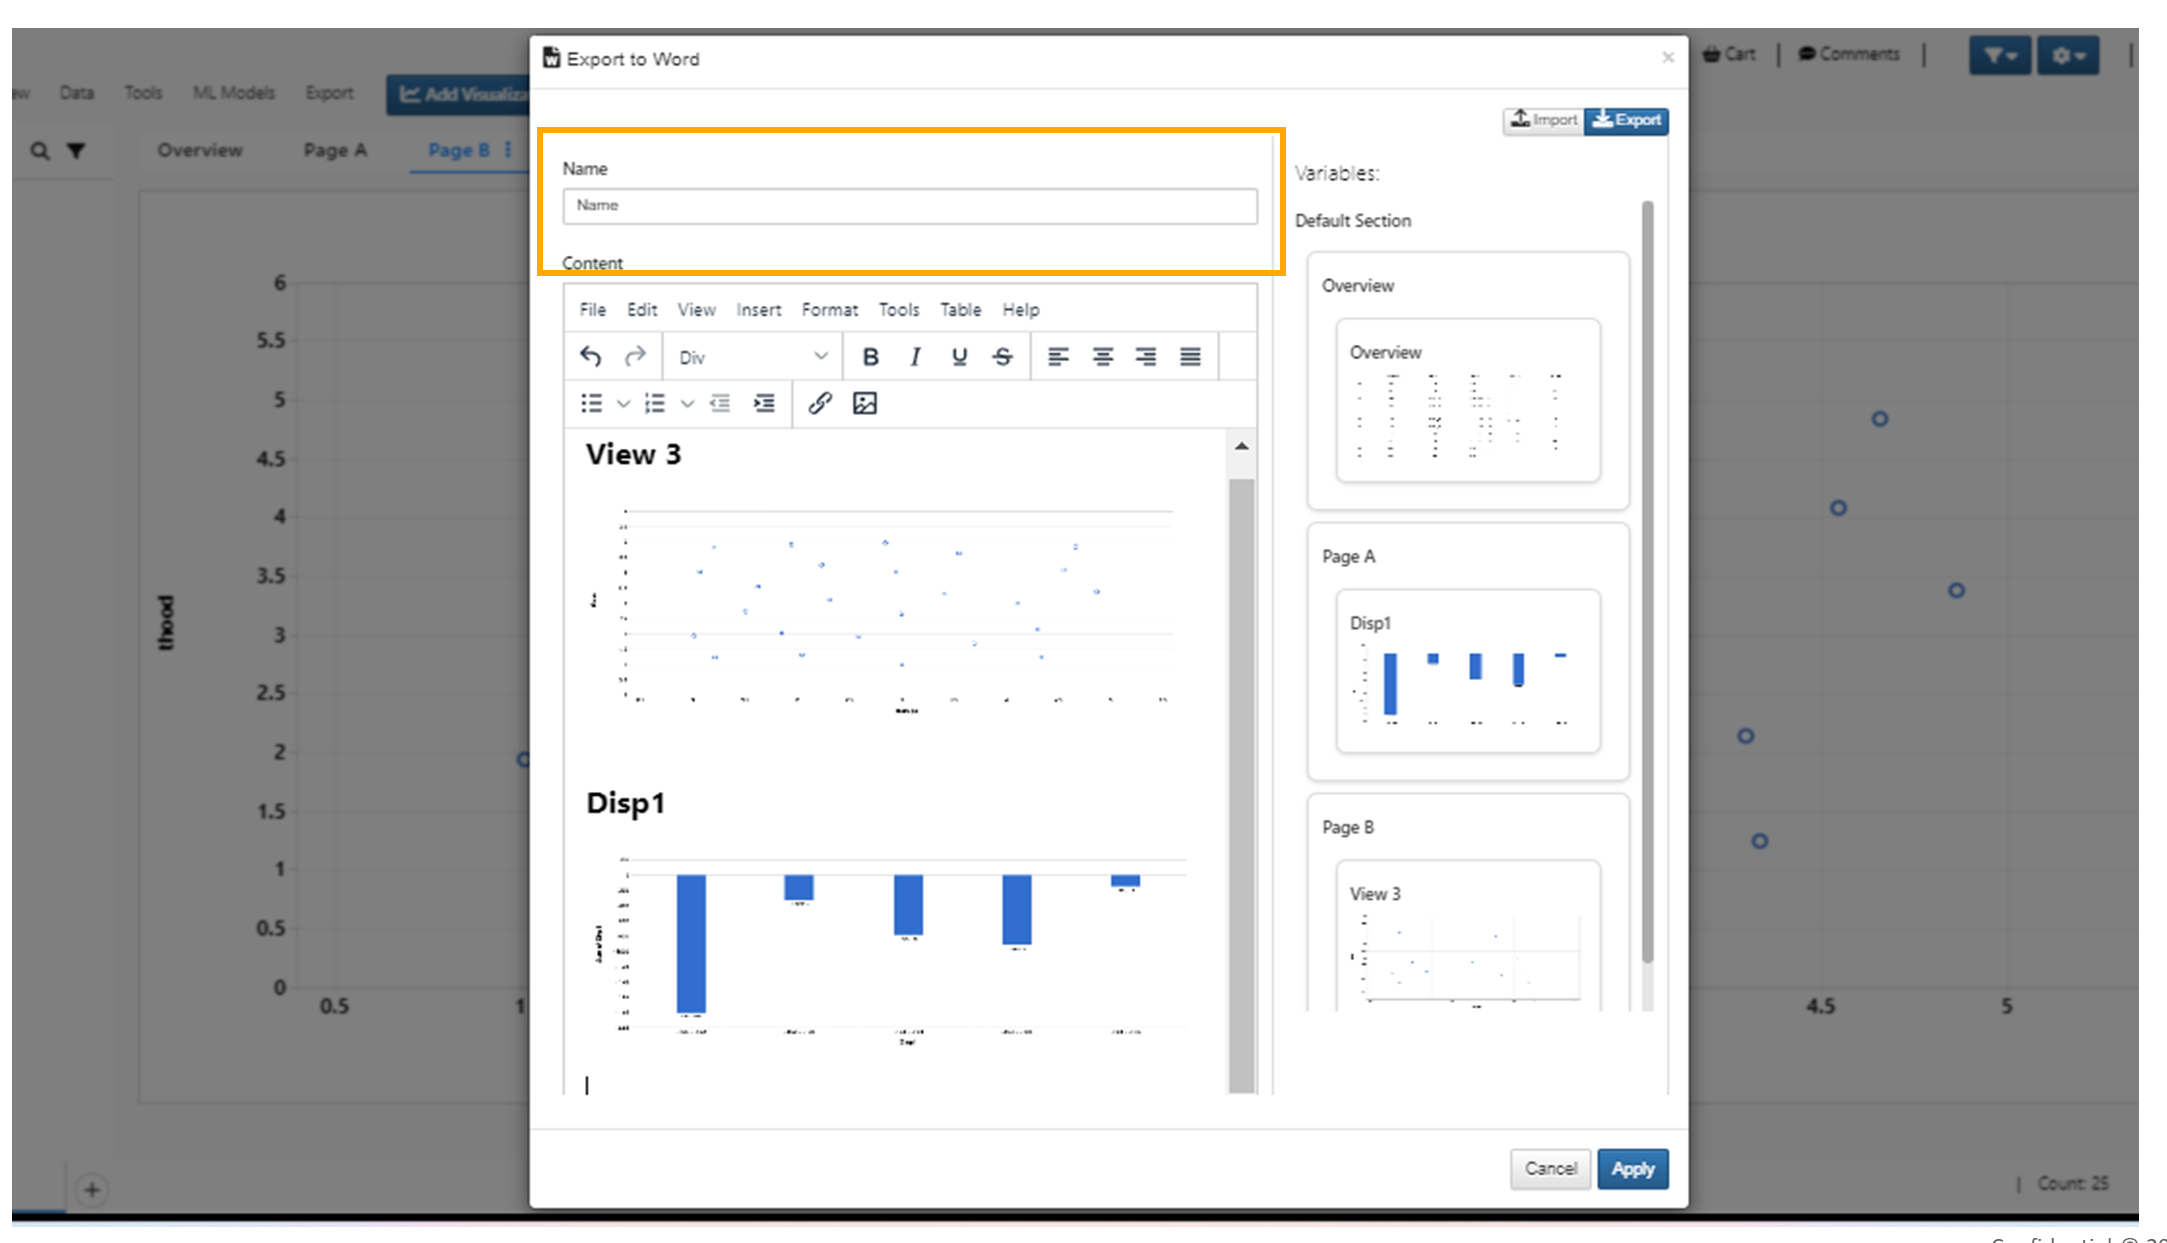
Name in Export word option
In Export to word, We can add all kinds of visualization to the word editor by using @ option.
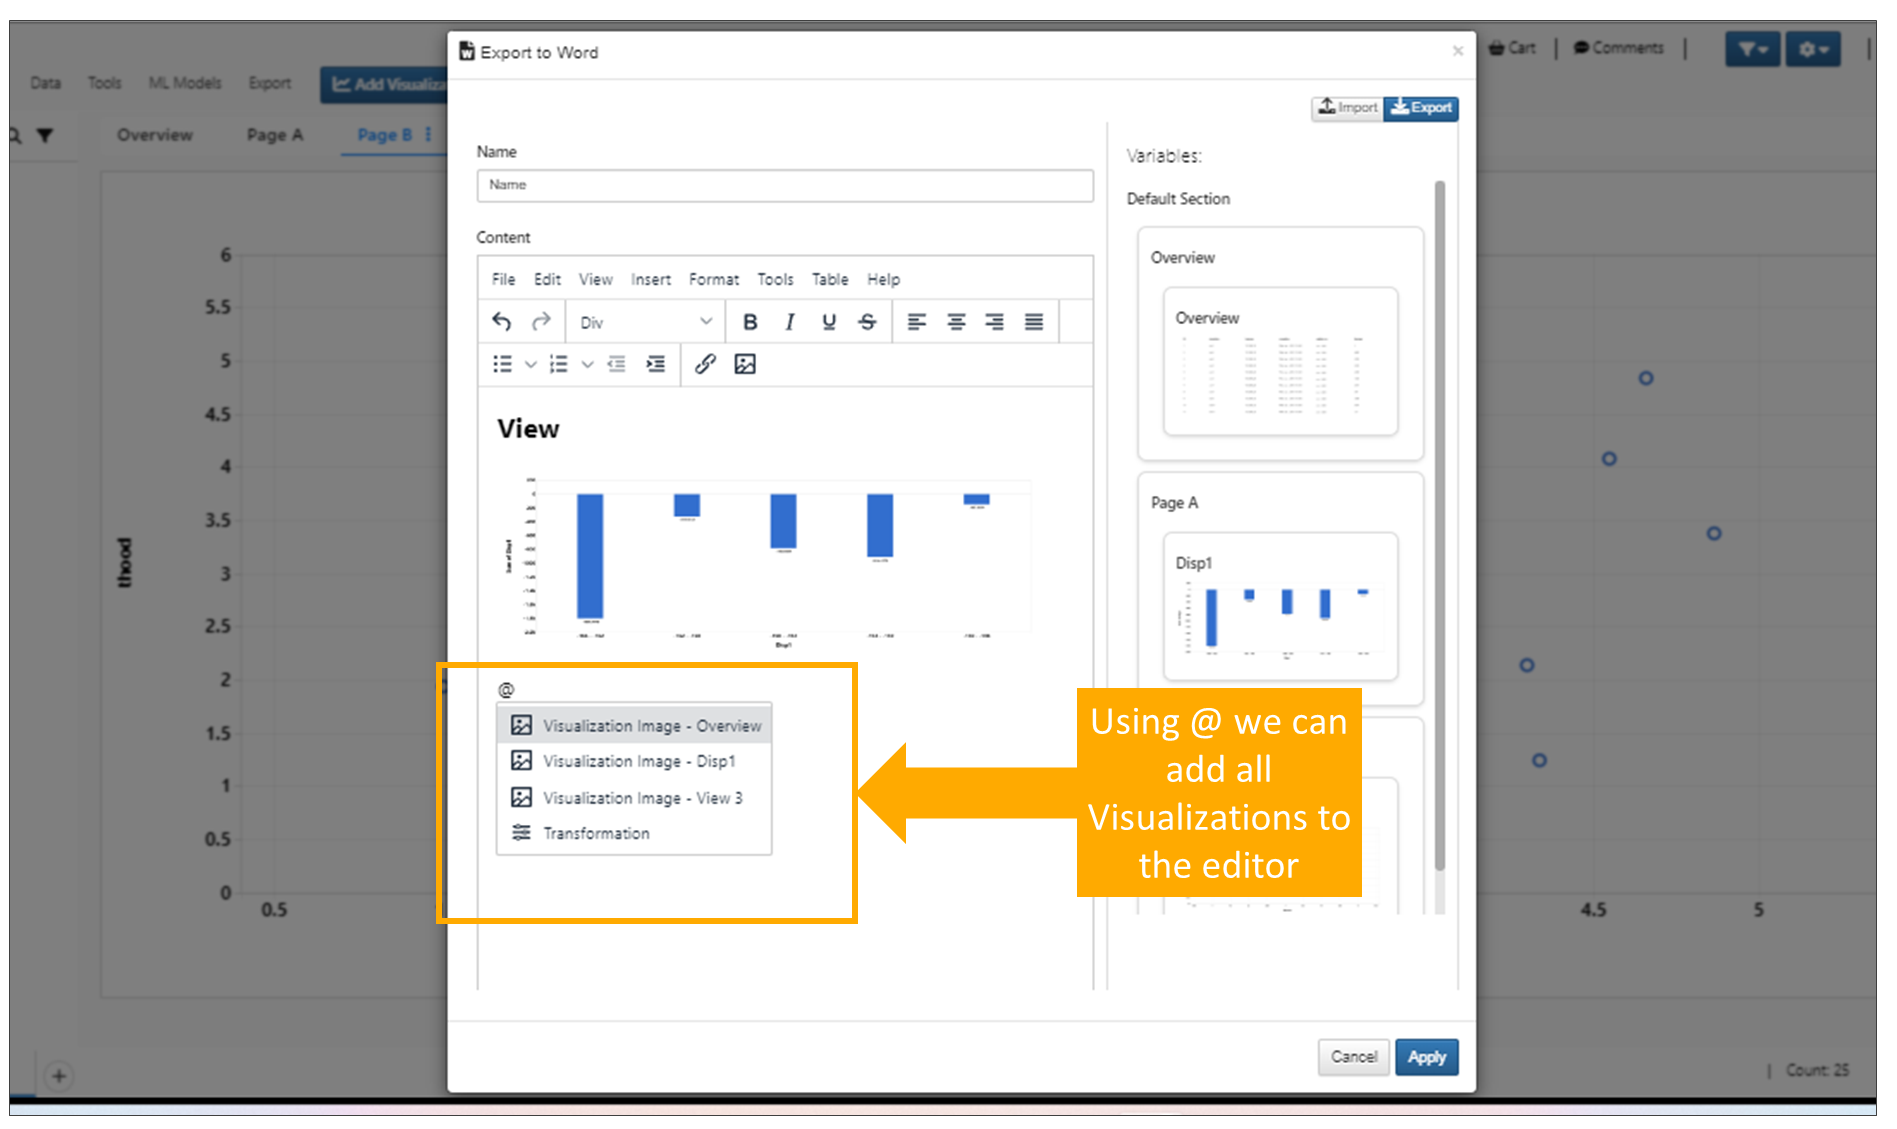
Visualizations using @ option
In Word export, use @ to also allow worker based output that has all datasets with scalar/vector outputs, either using Expression builder or a simple worker execution.
Simlytiks Export as Word template editor now has an option to Insert Table and add Visualizations to the cells in the Table.
Export as Word option in Simlytiks now has Table of contents to maintain the contents as in Word docs and Import/Export options are available to Export/Import the word Template.
Export to Word option in Simlytiks now loads quickly and we see spinner while the Thumbnails are loading. We can drag and drop the Visualizations to the Word template and Export. The template is saved to the Dataset.
Sampling Point Study Results
Sampling Point Study Results’dataset is added to sample datasets in Simlytiks
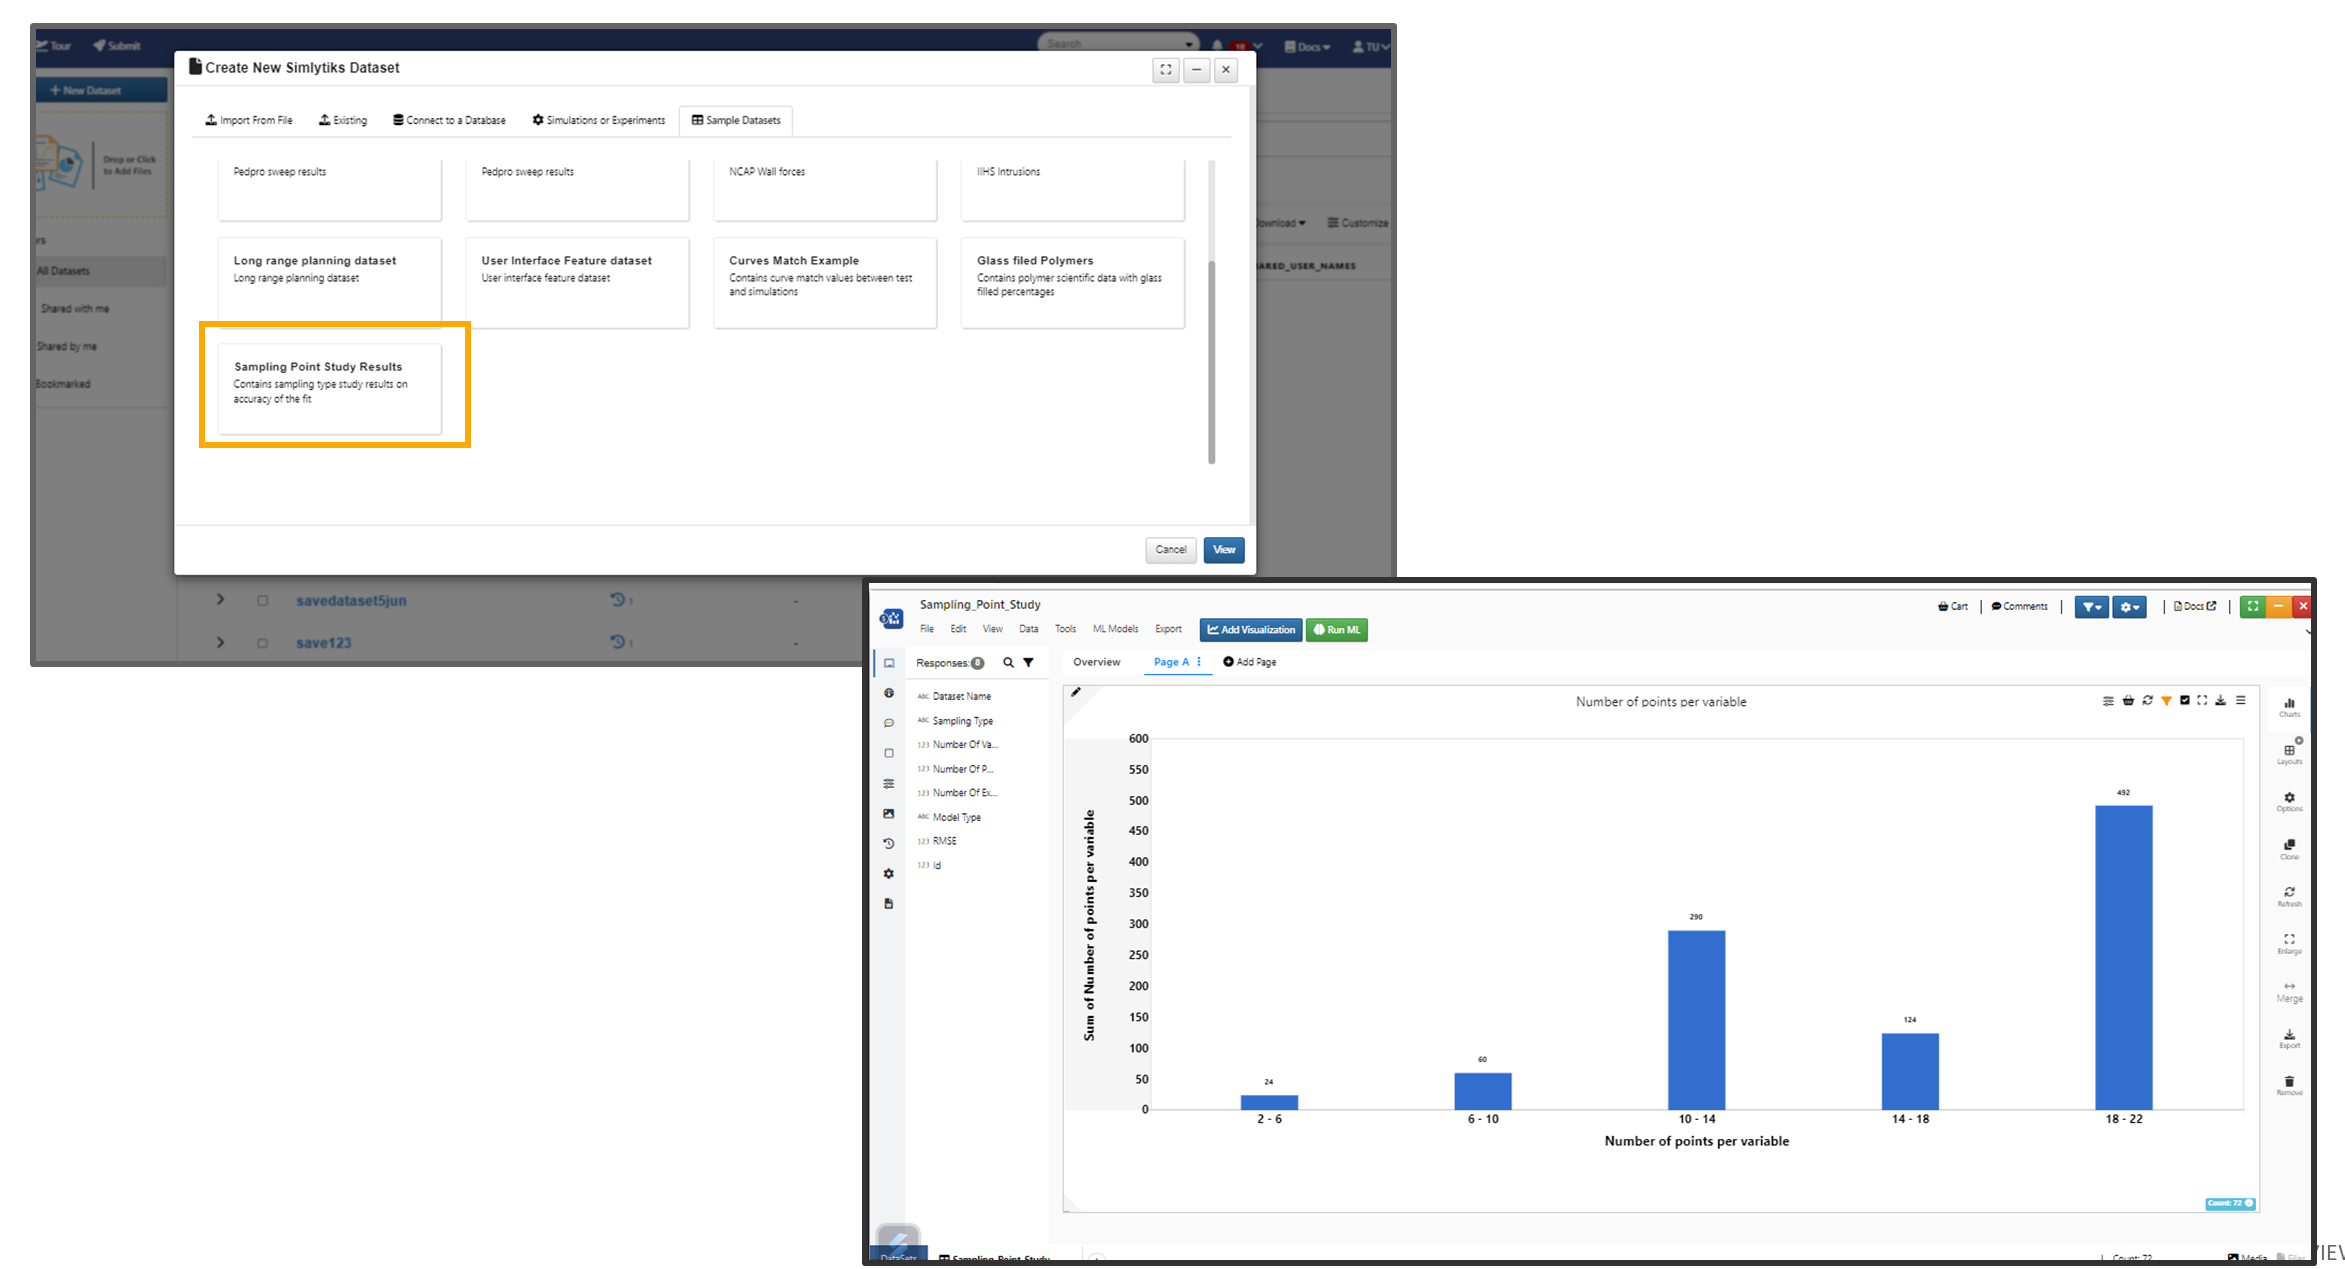
Sampling Point Stusy Results
Media files
Simlytiks Media files now include more place/auto parts
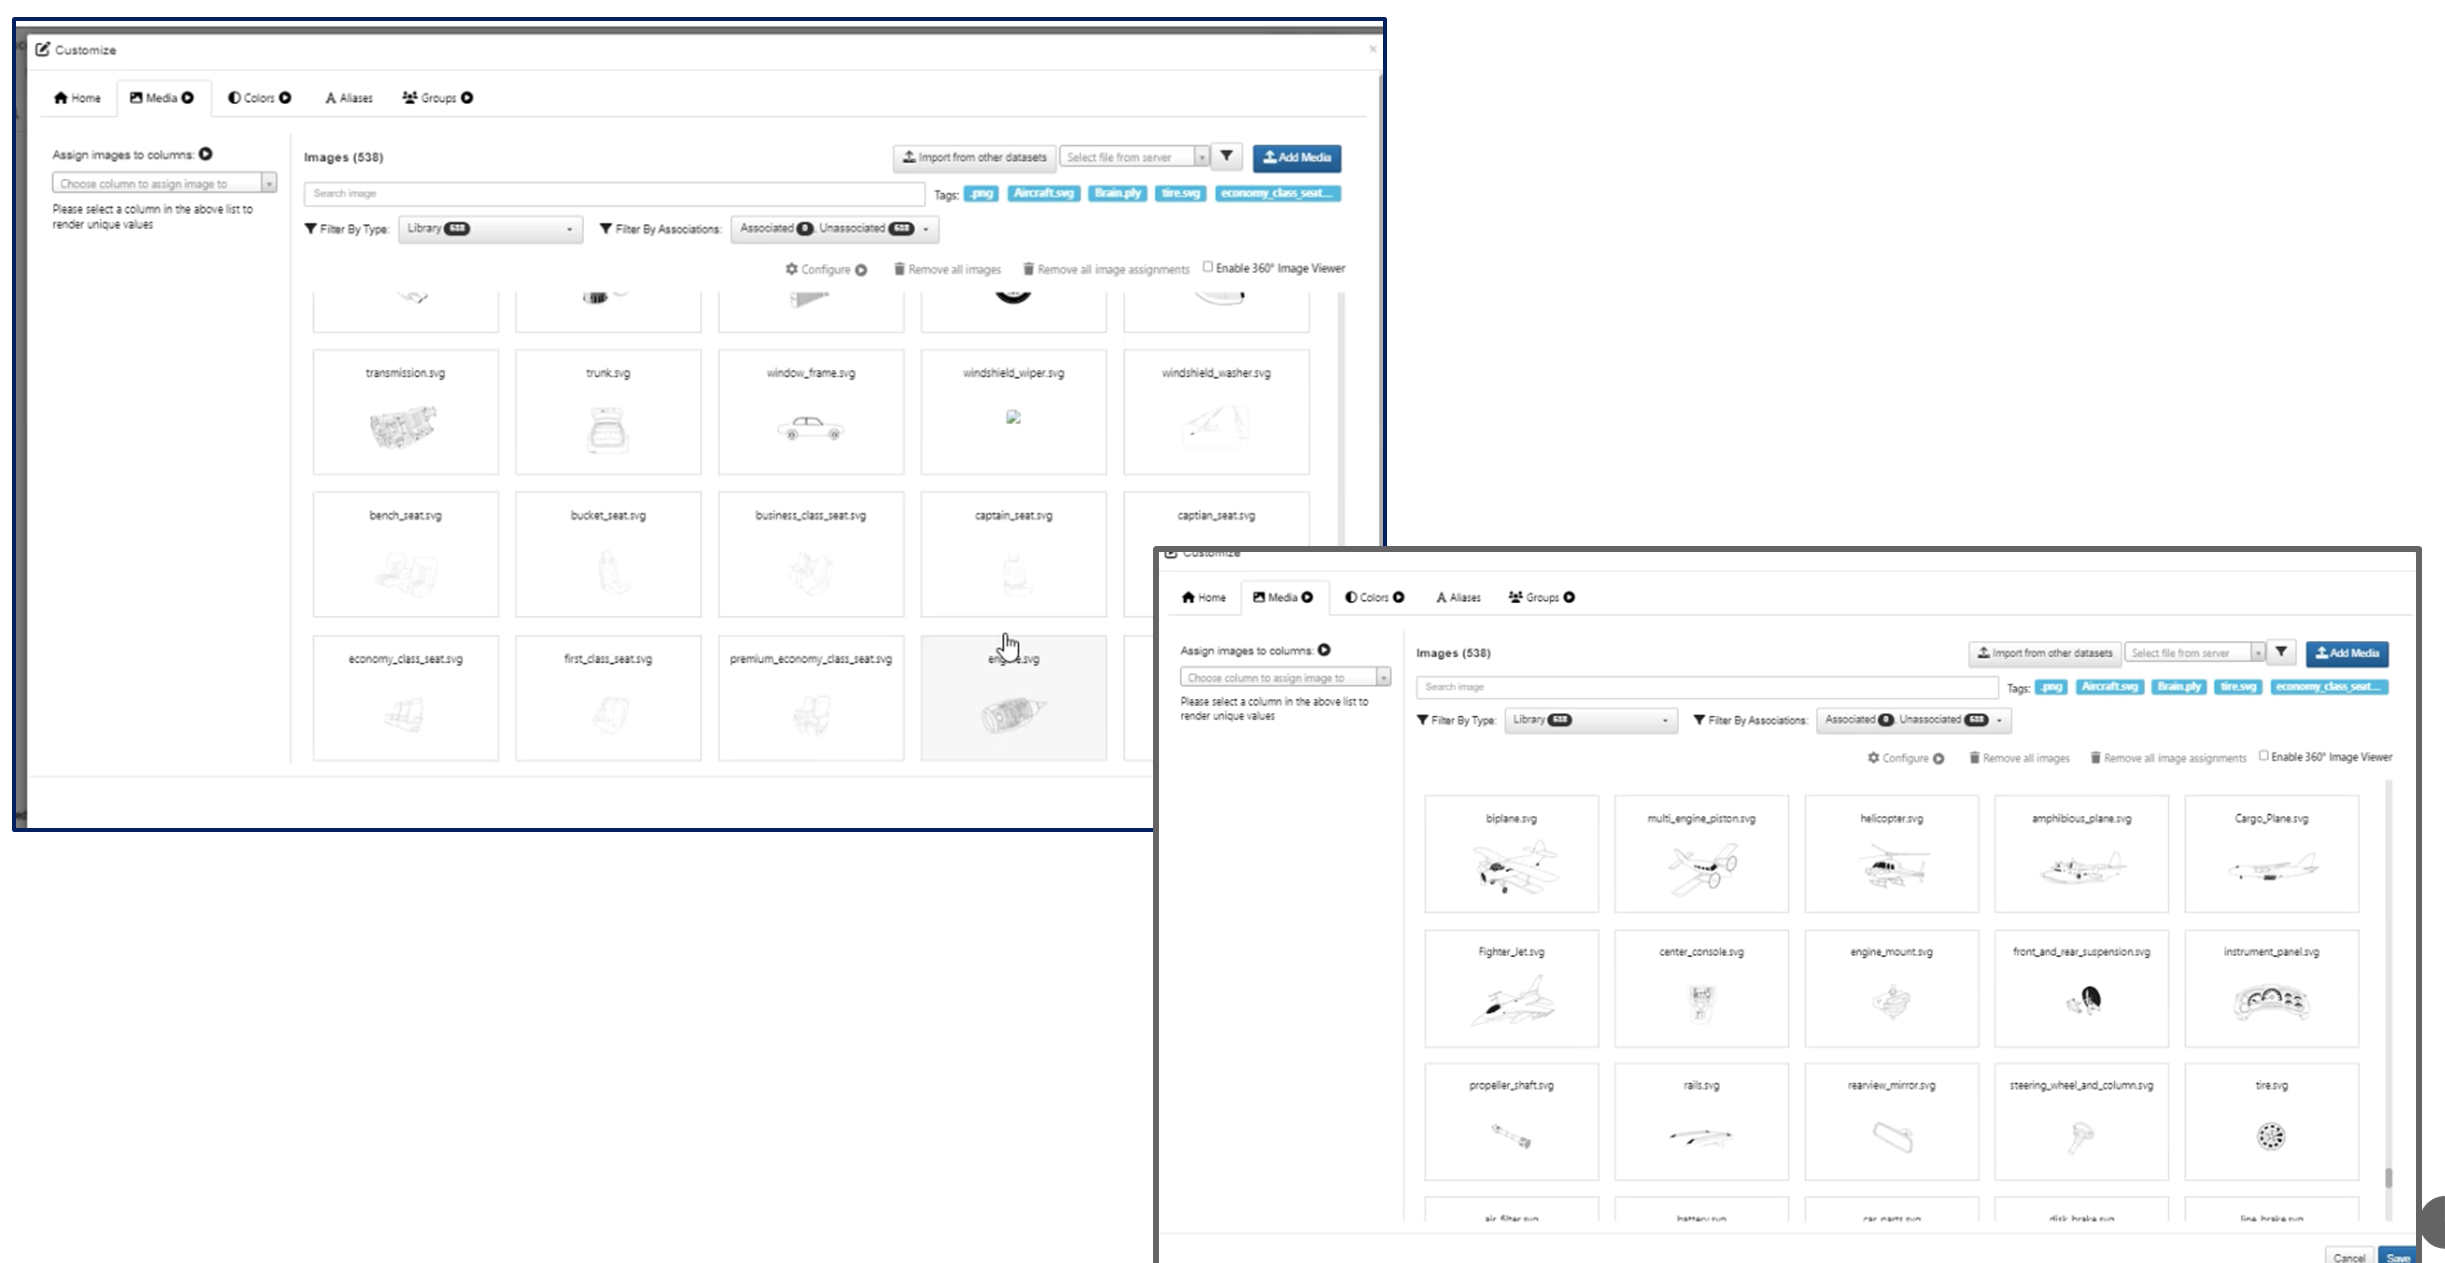
Media files
In Simlytiks, the media added under Tools Customize option will be available in exported and saved datasets even if the added images are not associated with the columns.
Slide show in Simlytiks
Simlytiks now supports slideshow. Every chart has a new icon beside Add-to-basket called Add-To-Slides which adds to the slideshow cart just like basket items. The items can be sorted, turned on/off and once hit Play, a Slideshow view (full screen) is enabled like PPT where keyboard can be used to switch between slides or arrow button at the bottom of the page. Escape key or clicking Close at the top right will close this view.
In Simlytiks,slideshow sidebar now has new options to allow animation of slides, chart interactivity,full screen , auto animation by Interval.
Add to Slideshow button is removed for each of the charts. Instead the Simlytiks header Slideshow button will now act as a Global Slideshow which means ALL the charts will be shown by default in the list which can be toggled ON/OFF and sorted amongst and then hitting play will basically open up a slideshow of all non-hidden items.
ML Visualizations
A plot within a ML page can now be edited using top right panel options. This should also get saved to the viz model until the ML page is re-executed. Scatter plot inside a Linear Regression page can be edited.
ML Worker’s Dataset input now supports columns that can accept spaces and special characters.
In Simlytiks, new visualization page can be added to ML chart by changing the layout of the ML visualization.
Append option is now available in the prediction tab in ML Simlytiks page. This option supports adding multiple predictions to the table in Simlytiks.
Prefix Responses in ML Visualizations
Now we have a new option called Prefix Responses for all the ML visualizers. Major change: All ML charts have a new common option called Prefix Responses. This is visible when you create a new ML chart. Once you add some text in it, it will be sent to Lucy as is and returned back. Now if the returned back data has some columns to be merged with original dataset (like K-means), it will use the prefix to add the newly received column and then modify the original dataset. This is useful when we have multiple ML charts within the same session trying to modify the original dataset. Default value of this prefix will be pageID if not provided by the user.
Below video shows how to add Prefix Responses and Run the ML Visualizers.
Saved ML datasets
ML is now a button in the header beside Tools . A sidebar opens up with the saved models, pagination and filter when clicked. These ML Models can now be viewed independently and can also be added as a new page in the current session.
A plot within a ML page can now be edited using top right panel options in Simlytiks.
Improved performance for Large ML datasets loading and Visualizations are created correctly.
Pagination
Added pagination information at the bottom left (if pagination is available). We can see this in the overview page of the Visualization.
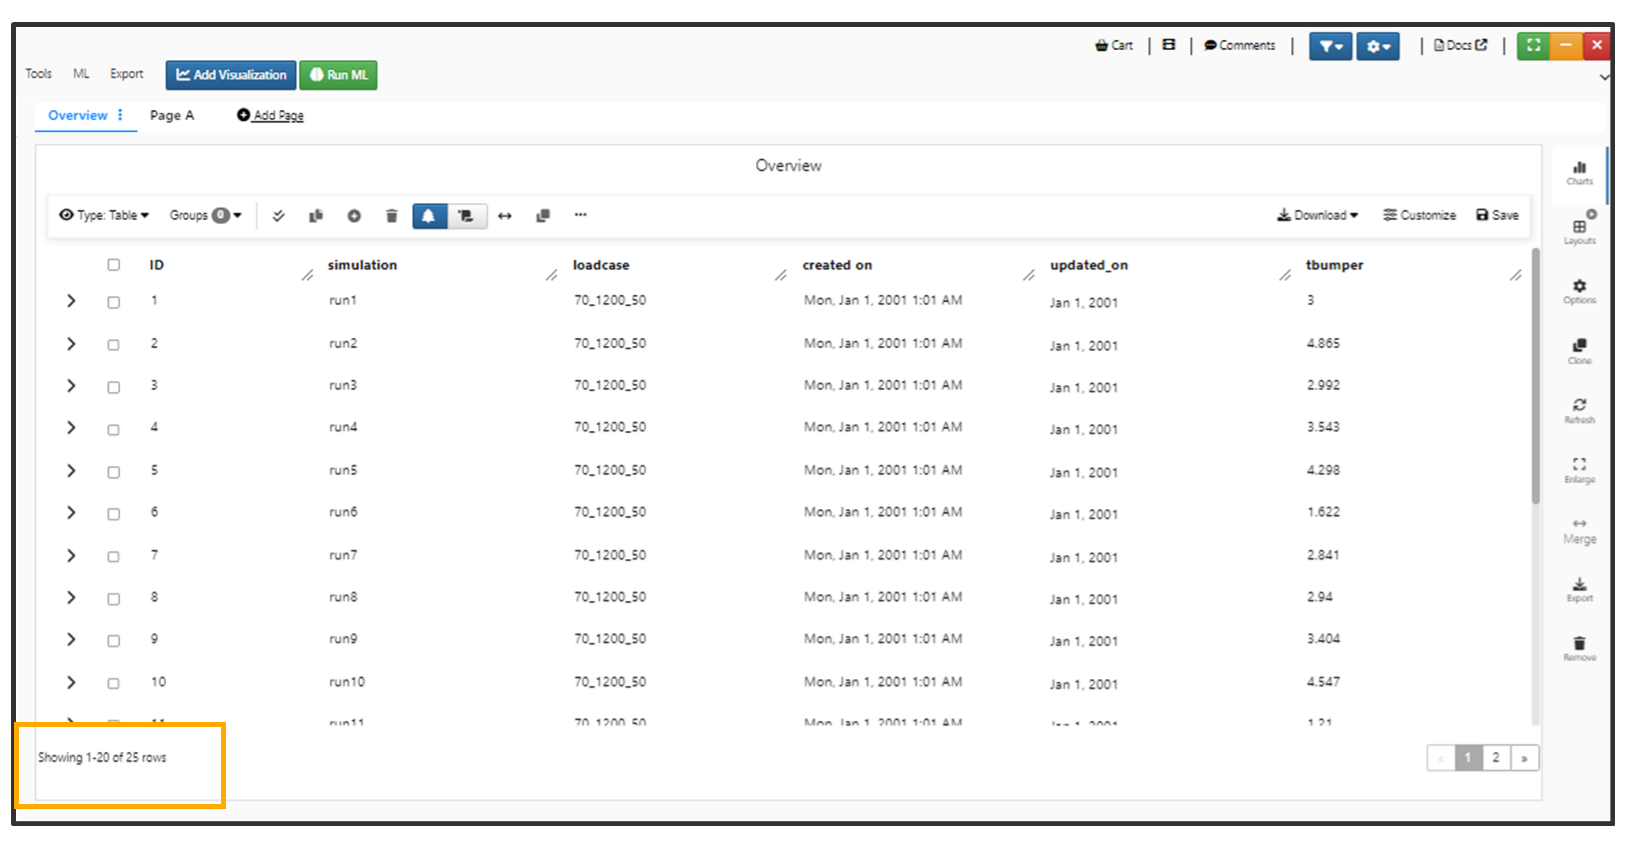
Pagination
Filters under Tools
Tools -> Filters in Simlytiks now has smarter checks for numerical columns i.e. If the input (below the slider) is changed to the original min/max values of the filter, then the Save Filter button will be disabled as a filter with the extents of the actual column is of no use.
User created filters in Simlytiks will now have a button to view the related statistics. These can be created using either Tools -> Filters or Advanced button in Quick filters dropdown in the header
The filter icon has new option called Show Stats along with Keep Highlighted and Remove Highlighted options after we brush the visualization
The filters button in the header now has Advanced toggle in its dropdown menu which will toggle between the Tools -> Filters and Quick Filters (carousel) making it easier to add/remove a filter
In Simlytiks, Filters in visualization preview has new options for Placement of the filter box and allowing the free form of the filter box around the container.
Filters
Simlytiks page Filters now has search parameter and we can search and filter the saved datasets in the page.
Random Sampler
In Simlytiks, Tools -> Settings has a new setting called Random Sampler which will now allow the user to choose random samples of the dataset and on applying all the charts will re-render based on the value.
Random Sampler option under Tools -> Settings is set to 50 by default in Simlytiks. This option will be now available for the Datasets with more than 50 rows.
Precision Points
In Simlytiks, when a dataset having curve columns is exported to either JSON or Excel, there will be a new option called Points Precision which will allow the user to define the precision for the curve points before exporting.
Duplicate Dataset
New option called Duplicate is available under File in Simlytiks which will duplicate the current dataset in a new tab and can be saved as new dataset.
New way of rendering Bar charts and Line charts is available for the Datasets in Simlytiks whose length is equal to 1.
When name of the Dataset is clicked in Simlytiks, it goes to the Overview page.
Customize Groups
Tools -> Customize option in Simlytiks will now show a search bar in the header.
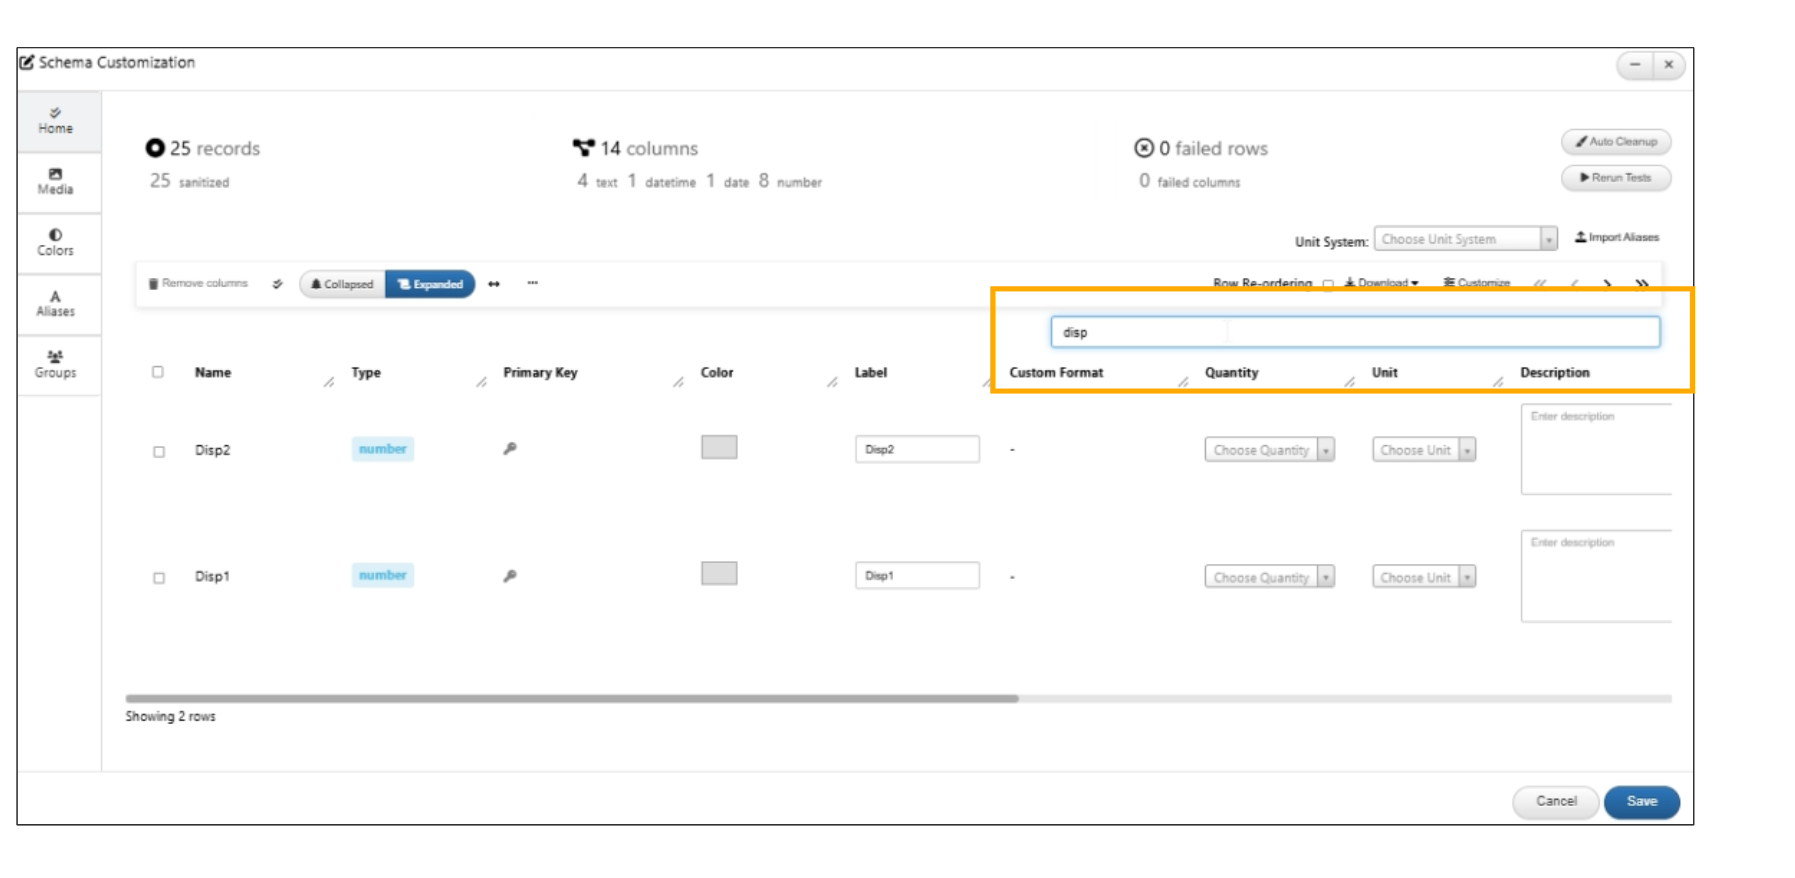
Search
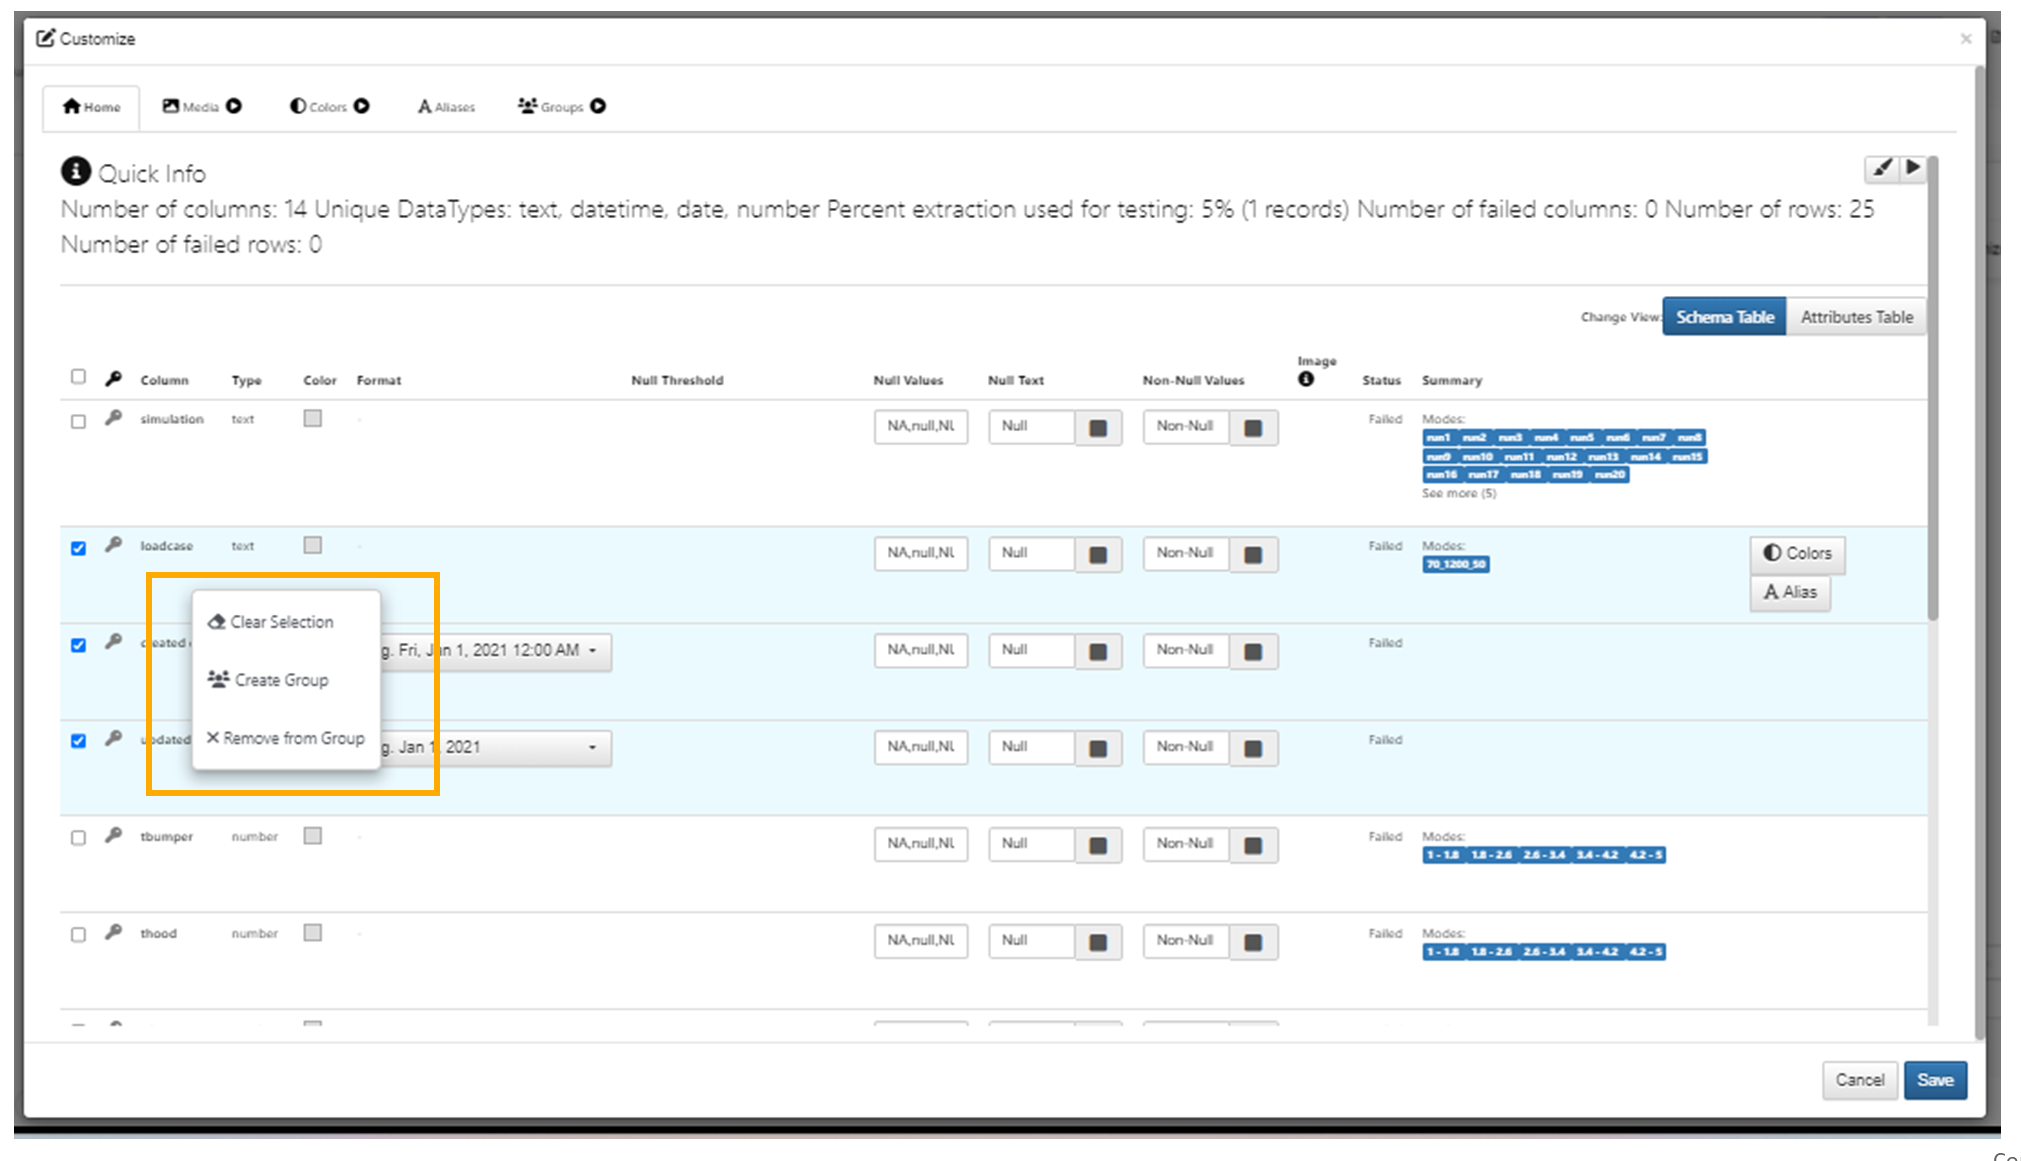
Simlytiks Tools -> Customize schema table now has right click options for the rows. Grouping of columns which once grouped will be visible in the recently added multiselect groups.
Tools -> Customize table in Simlytiks now has a separate column for primary Keys and a new column with a checkbox to select the row for several context menu options.
Primary Keys
Tools -> Customize -> primary key icon will now be black in color if enabled and gray color by default in Simlytiks.
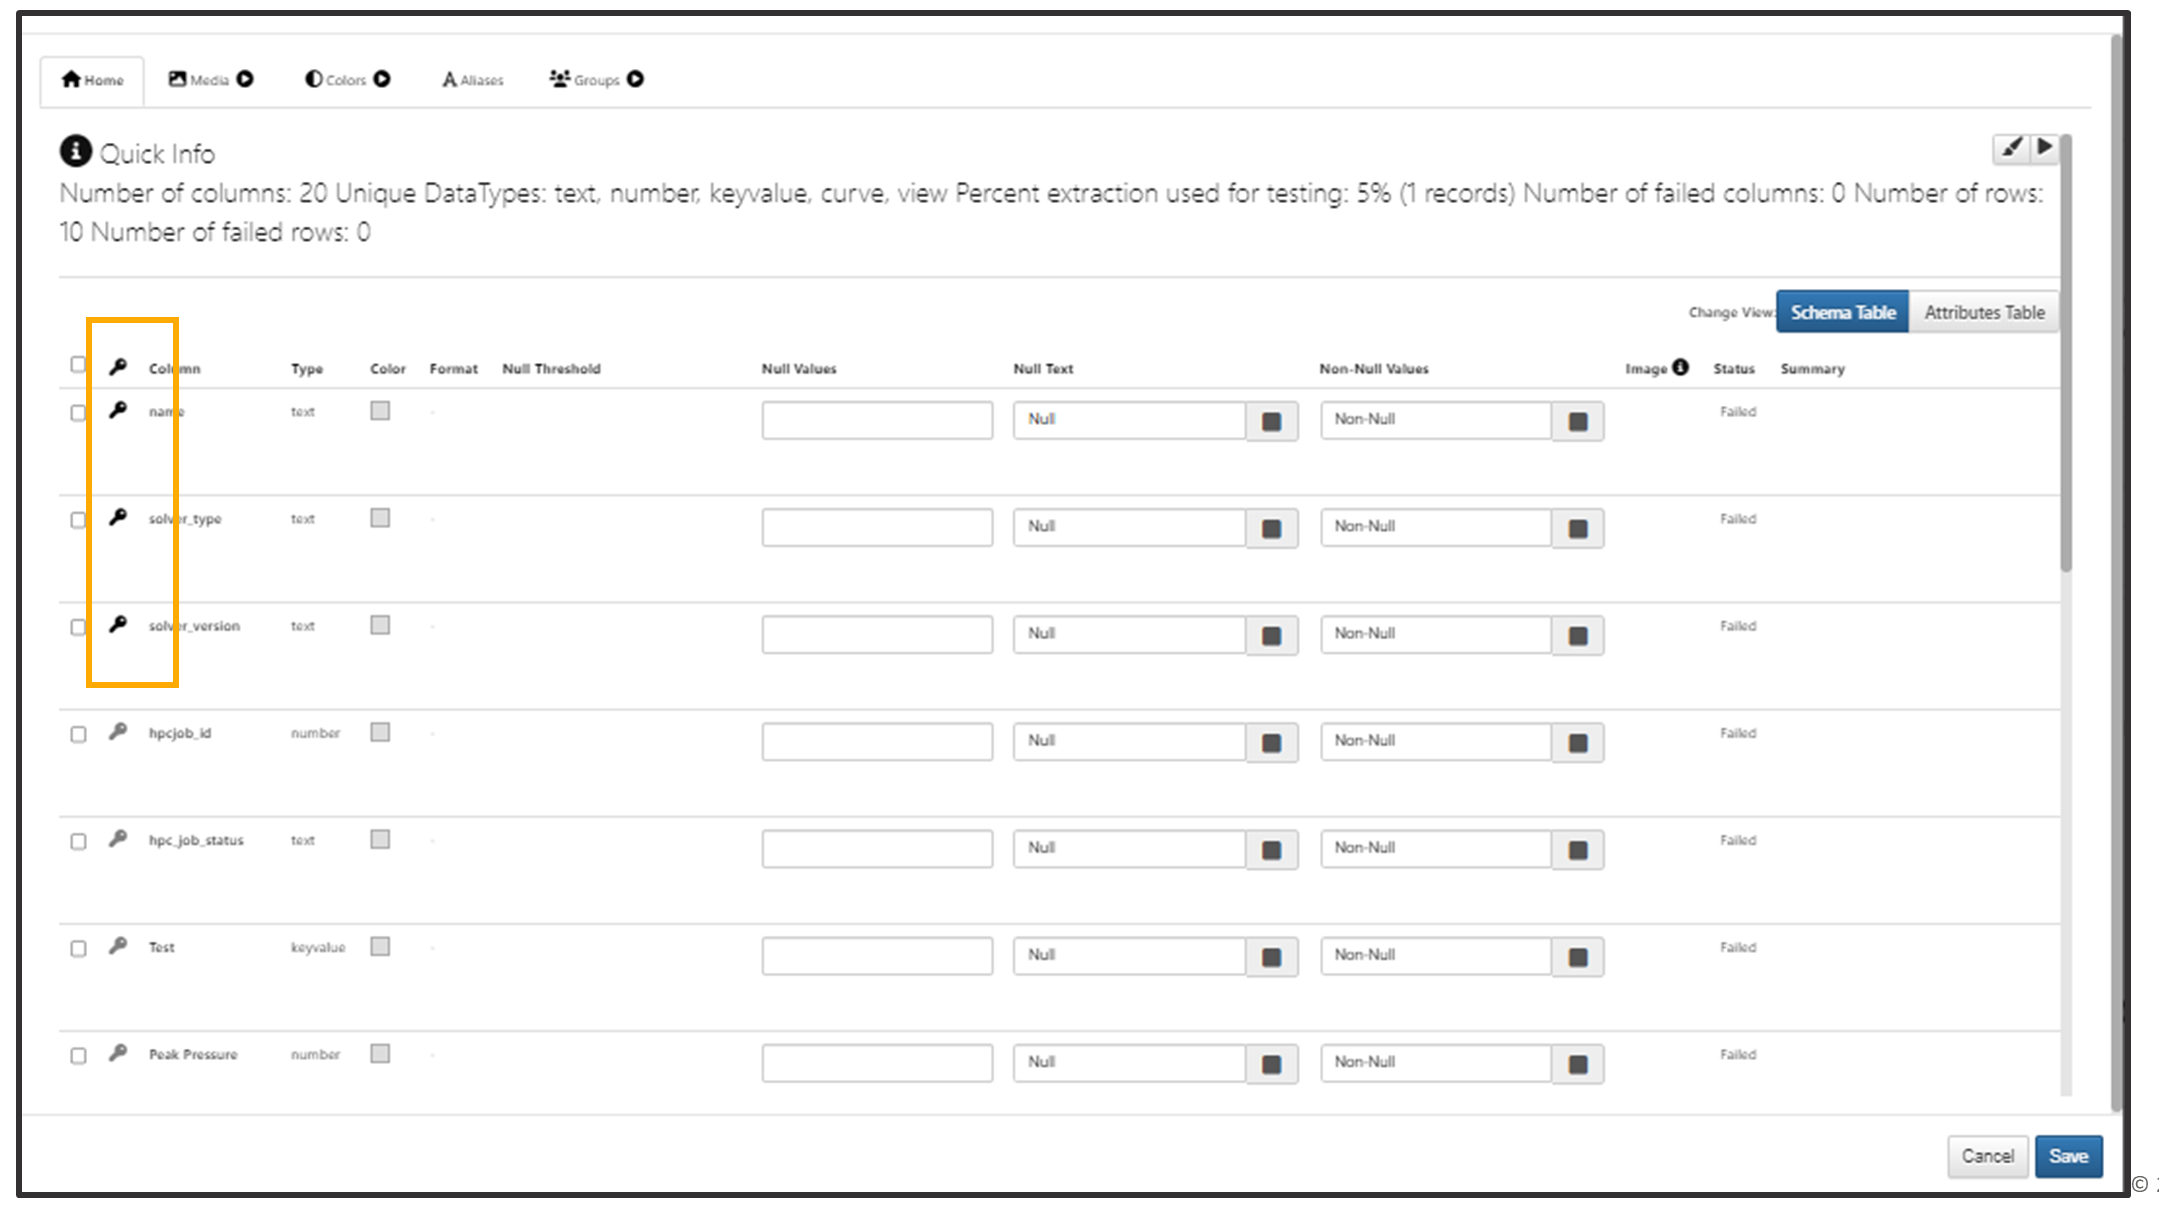
Primary Key
The legends of the Visualization shows Images when Images are added in Tools -> Customize -> Media option in Simlytiks.
Tools -> Customize -> Media now shows up a new option called Schema Columns inside the Sources list (along with Library & Uploaded). These columns though have a context menu option called Auto Assign to all which will automatically assign ALL the current values to this particular chosen schema column in Simlytiks.
In Simlytiks, Media tab in Tools → Customize will now show the Uploaded images (if any) and associated images at first. If we do not have uploaded images then it will switch to Library images.
The groups added to the columns in Simlytiks will now be applied to the vertical bar chart visualization.
Groups
Tools -> Customize in Simlytiks will now show search/filter bar in the header.
Filter
Simlytiks -> File -> Importing a Simlytiks ZIP with media/images within it will now extract all the images before moving to the Import steps
Image column
In Simlytiks, Images available in the dataset can be assigned to columns under Tools -> Customize option.
Upload Aliases
In Simlytiks, Tools -> customize now supports uploading of CSV, Excel file for ‘Aliases’ and these customized aliases will be reflected in the dataset in responses list and in the overview table.
In Simlytiks, the custom aliases added by Tools -> Customize option is now supported and showed in the axes of visualization.
In Simlytiks, Tools -> Customize option will allow user to select the units for the choose quantities for the responses which will be reflected in the visualizations
Global Filters
Any interactions done in the Global filters dropdown will be added in Tools -> Filters on clicking Apply. A new button is added within the Quick filters dropdown called Advanced which will open the Tools -> Filters modal.
Global quick filters in Simlytiks have a new button called Stats for each column which will open up a modal and show the Group Statistics.
Expanded View
New option added to the DataTable under settings to show the expanded view for the cells (curves, key values or images) in overview table.
Drag and Drop
Added support to drag an existing visualizer and drop it in any other container. This dragged chart can also be dragged over to a different page.
New option available in Simlytiks to provide Color By for the curve columns in overview table.
Export as PPT
Export as PowerPoint in Simlytiks has new UI and options to change the Tick font size and Hide Axis for the visualizations.
Export as PowerPoint in Simlytiks has new options for the slide titles such as bold, italic etc. as checkboxes.
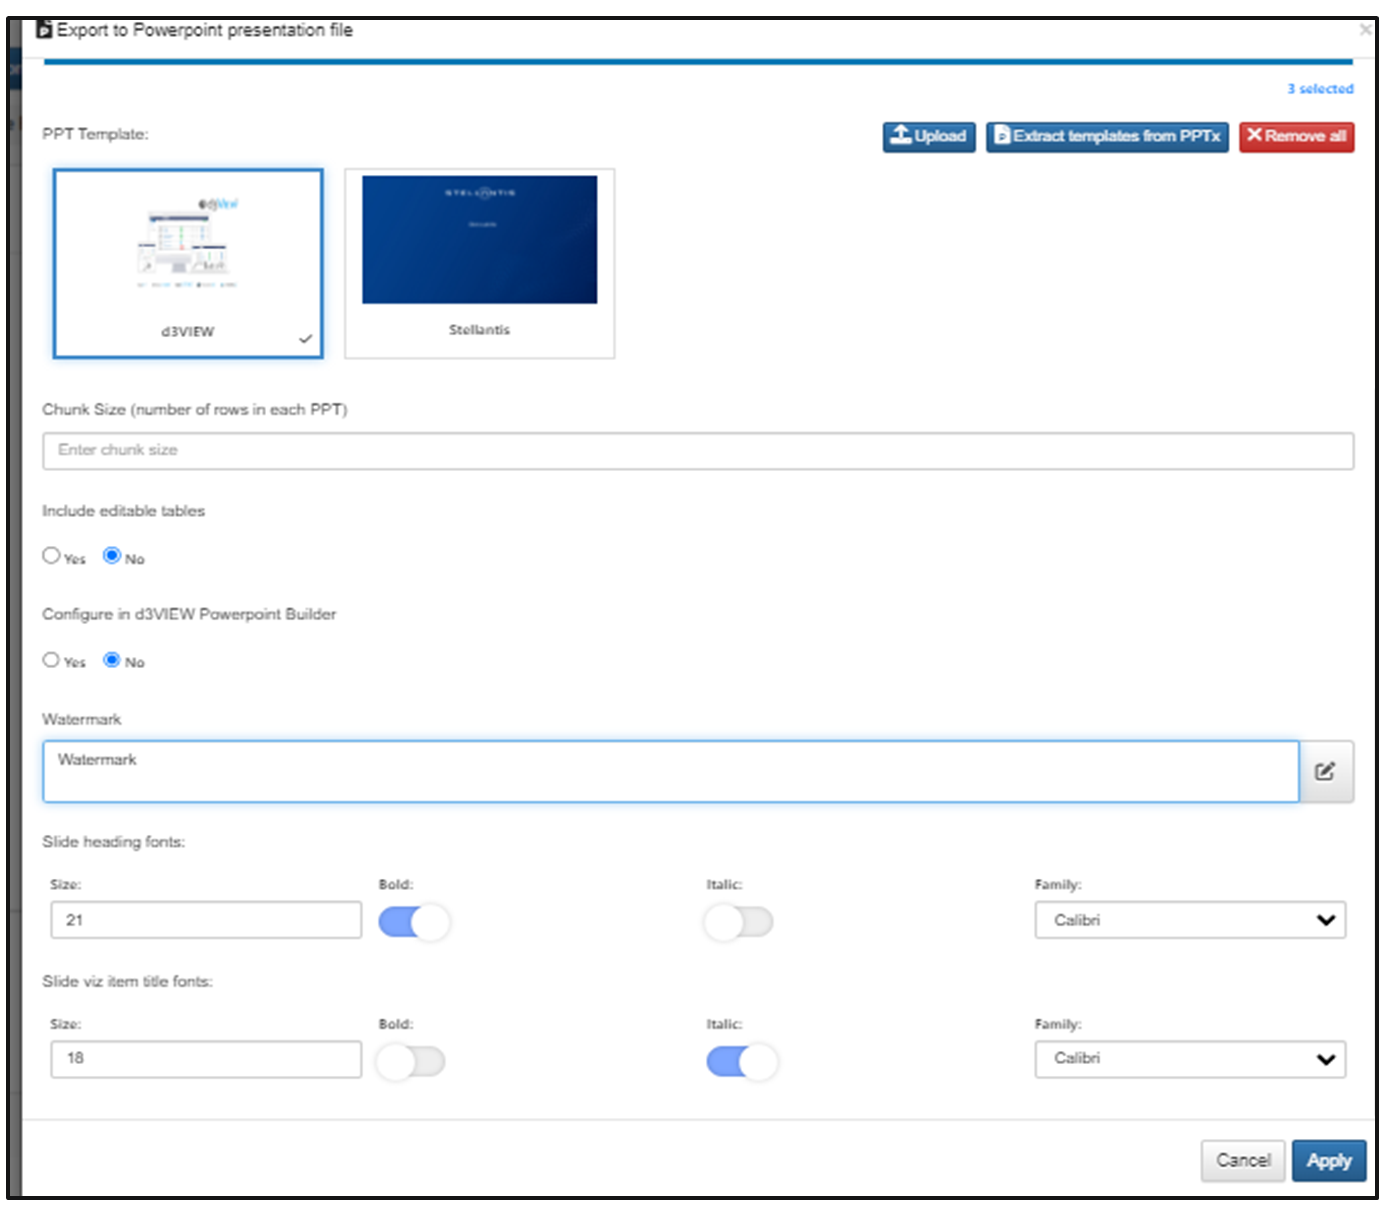
Export PPT
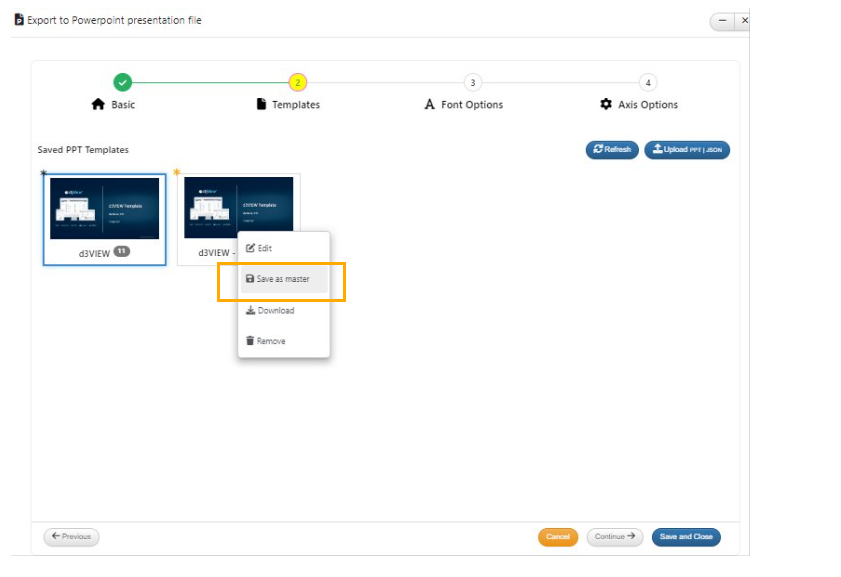
Templates available in the Export as PPT option have context menu settings to Edit, Download, Save as Master and Remove templates.
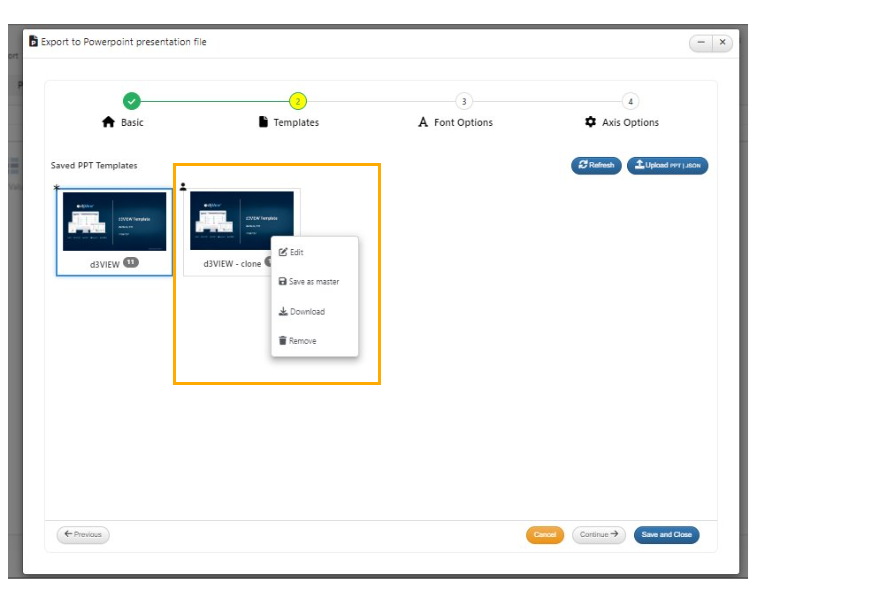
context menu settings
Templates available in the Export as PPT now has option to remove on the top right corner of the template.
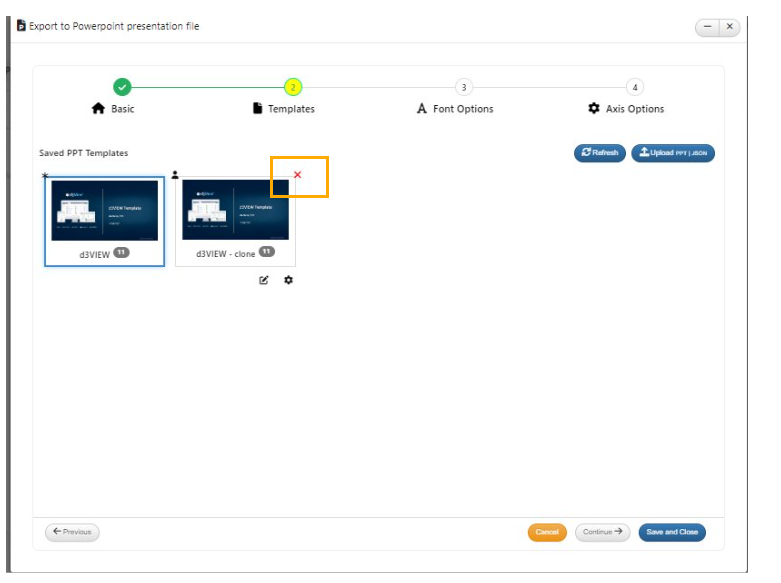
Remove Template
Templates in Export as PPT has a single upload button that will take json, d3Layout and PPT files for extraction.
Templates tab in Export to PPT now has Refresh button in Simlytiks.
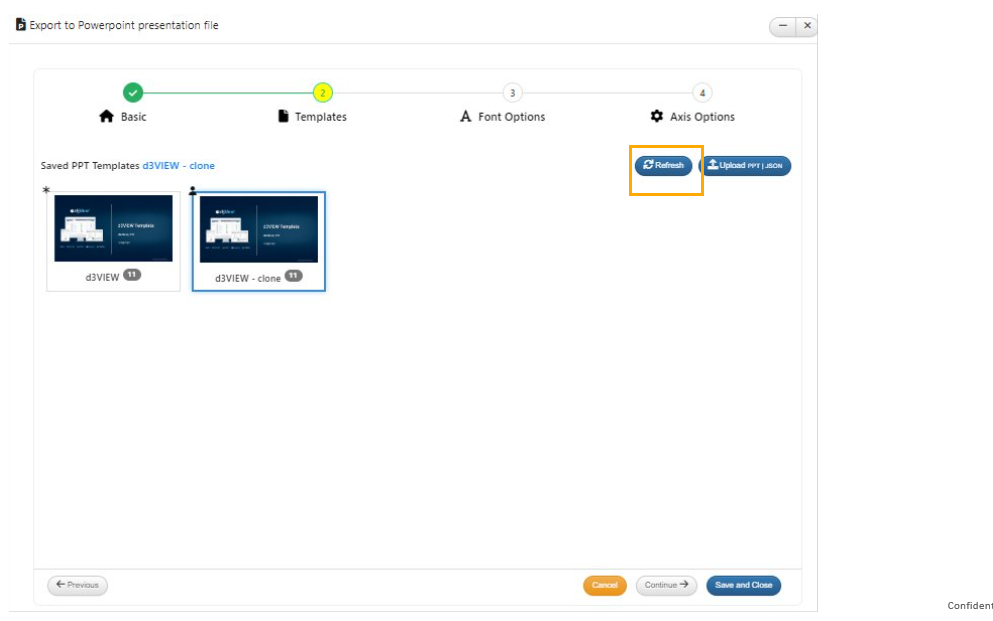
Refresh Template
The Templates in Export to PPT has source icon on the top right corner to indicate whether the default/master/user in Simlytiks.
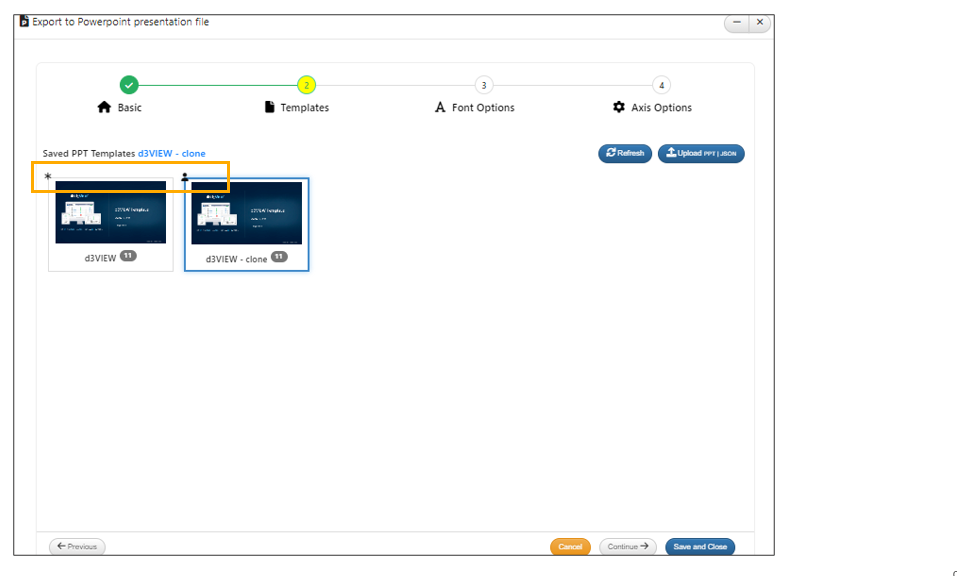
Source Icon
The Templates tab in Export as PPT now shows ‘Fetching reporter layout, please wait’ message on screen until all the templates are fetched.
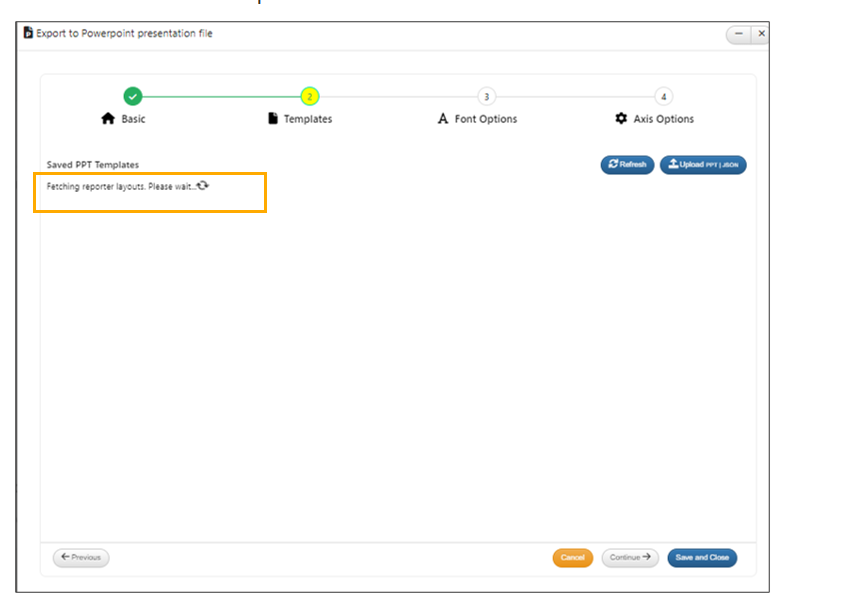
Fetching reporter layout, please wait
The Layouts in templates tab under Export as PPT can now be saved as ‘Master layout’ using context menu options.
Master layout
Layouts in Export as PPT now has Configure option to select the layout for each visualization page and save it to PPT template in Simlytiks.
Configuration of layout in Export as PPT will now provide an option to choose the default layout for non-title slides in Simlytiks. Individual pages can still have their own independent layouts.
The Template layouts in Simlytiks PPT export has edit and configure option separately below the layout and will not overlap with any other feature.
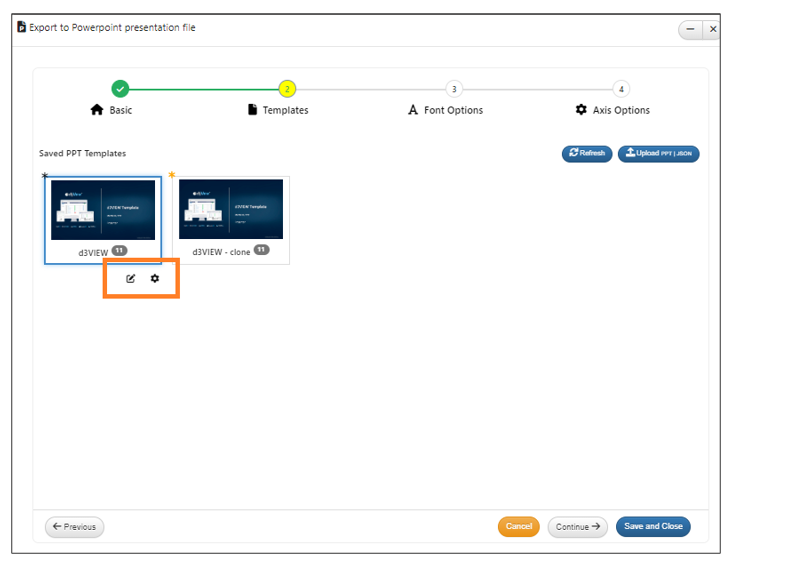
Configure options
Export curve as Workflow
The Curve visualization now supports exporting curve as a Workflow. This option is available in the right context menu of the visualization and will generate a workflow with the curves as an input in the START worker.
Export as Workflow option for Simlytiks dataset will download a workflow d3wfZIP with a dataset input in the start worker consisting of all the records.
Export as Workflow in Simlytiks dataset from Newton will now support exporting of individual curves as individual inputs in the Start worker or a single input with all curves.
Export as Workflow in Simlytiks dataset now supports choosing of either the main dataset (by default) OR a curve column as the Start worker inputs in the exported workflow
Export as workflow from Simlytiks can now contain the visualizations as separate workers which will be connected in sequence when imported in Workflow.
Data Operations
New alert pop up is available to ‘Replace records’ or to ‘Open as new modal’ when a Workflow is executed in Data Operations under Simlytiks.
The Data operators in Simlytiks filters and groups has new options called Top values and Bottom values which will provide a simple input to pick the top 10 or bottom 10 sorted values from the data.
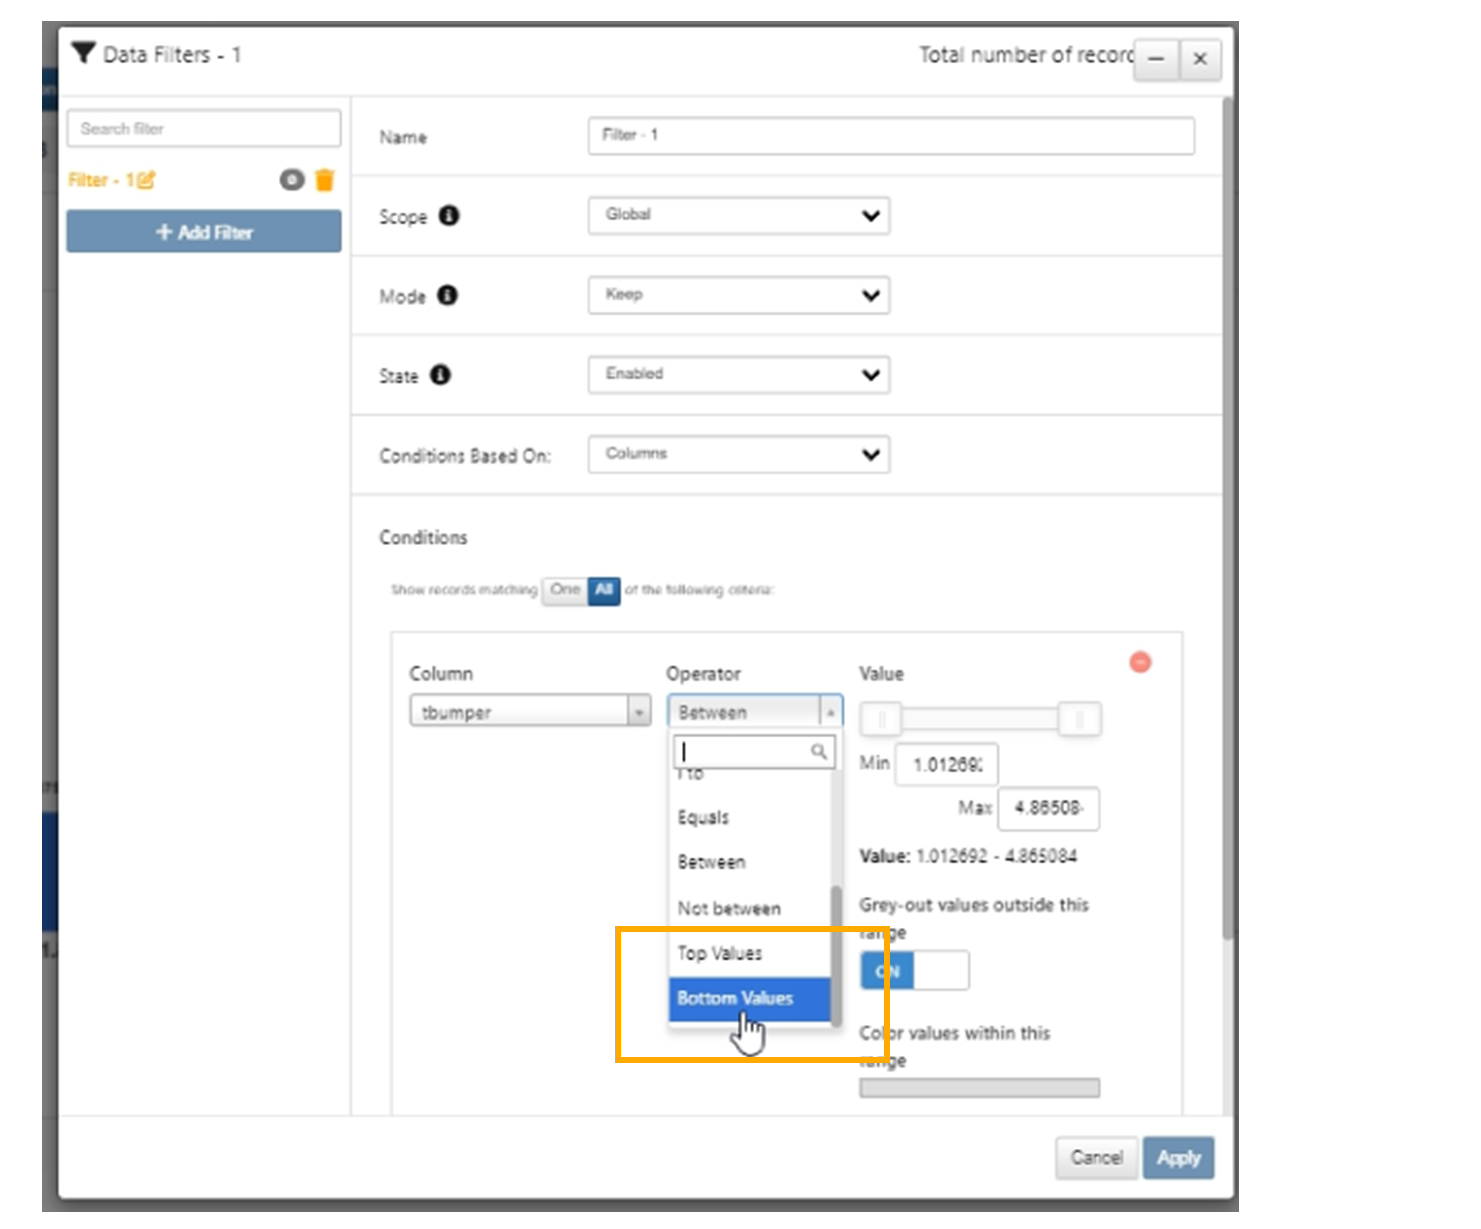
Data Operators
Data operations in Simlytiks will now have columns to map in step2 when workers like *DATASET_RENAME are added and executed. Visualizations can be re-mapped to the columns for their options depending on the new data model creating using the operations.
Data Operations in Simlytiks now provides an additional step to map the old columns used in the visualizations to the new columns in the operated dataset.
Data operations in Simlytiks now has a new step to match columns and this step also auto matches the available columns.
Add columns by conditions
Simlytiks Overview table supports ‘Add Column by Condition’ from right click options on a curve column header, a Lookup Type dropdown modal loads and applying the condition successfully adds a new column.
Simlytiks Overview table supports ‘Add Column by Condition’ from right click options on a numerical value column header. Users can enter a column name, define a condition expression with corresponding true/false values and click Apply to create the column.
Add columns by expressions
In Simlytiks, operations are available in the right-click menu of a curve column header, allowing users to add a new column by expression, enabling the creation of new curve columns using custom expressions.
In Simlytiks, operations are available in the right-click menu of a numerical column header, allowing users to add a new column by expression, enabling the creation of new curve columns using custom expressions.
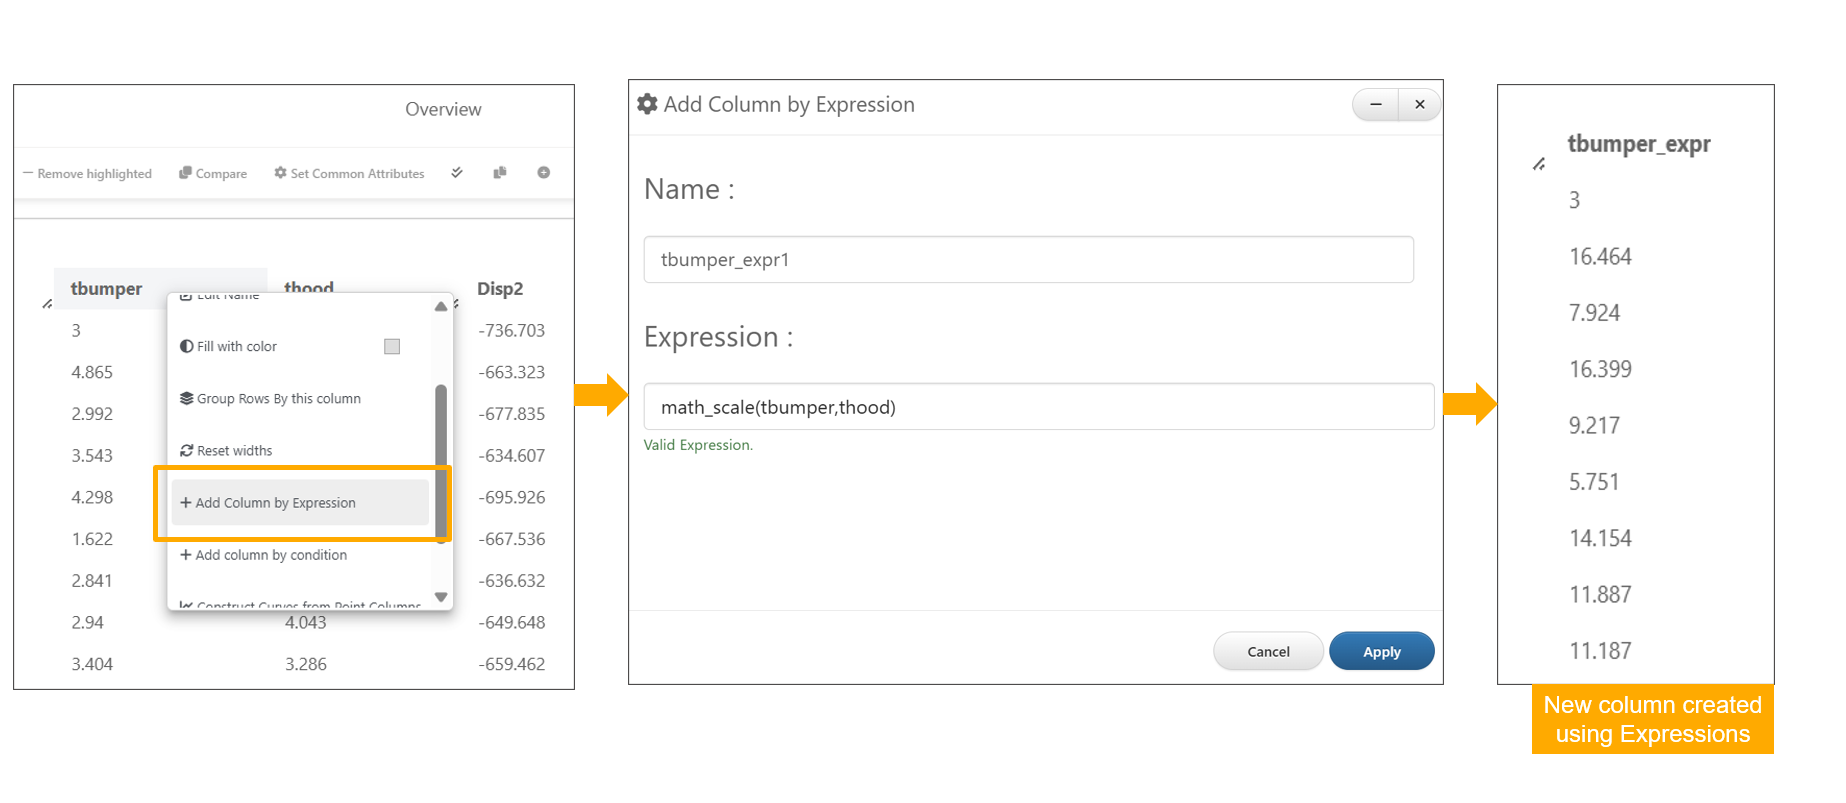
Add columns by expressions
Animation Option
The Animation toolbar at the bottom when Animate By is enabled has a new option to change the speed of the animation in Simlytiks.
Unit Conversion
New Feature Unit Conversion system is added to Simlytiks. This helps in converting the units of quantities from one system to another.
New unit system 10 is added to convert to Kg-m-ms
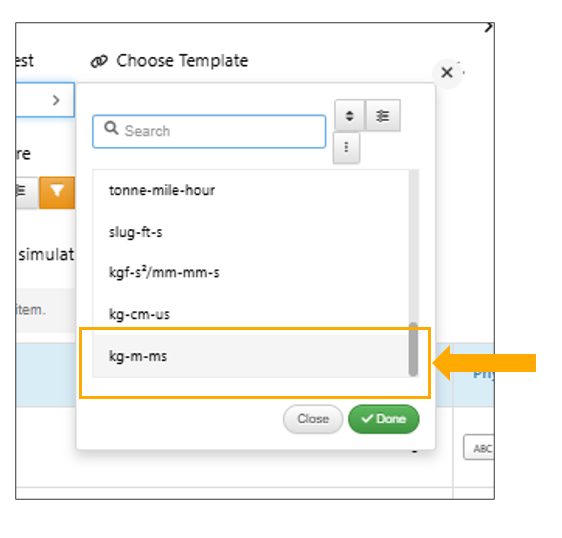
New unit system
Viz panel options
The visualization panel options are now moved to the settings dropdown for smaller screens and layouts for Visualizations.
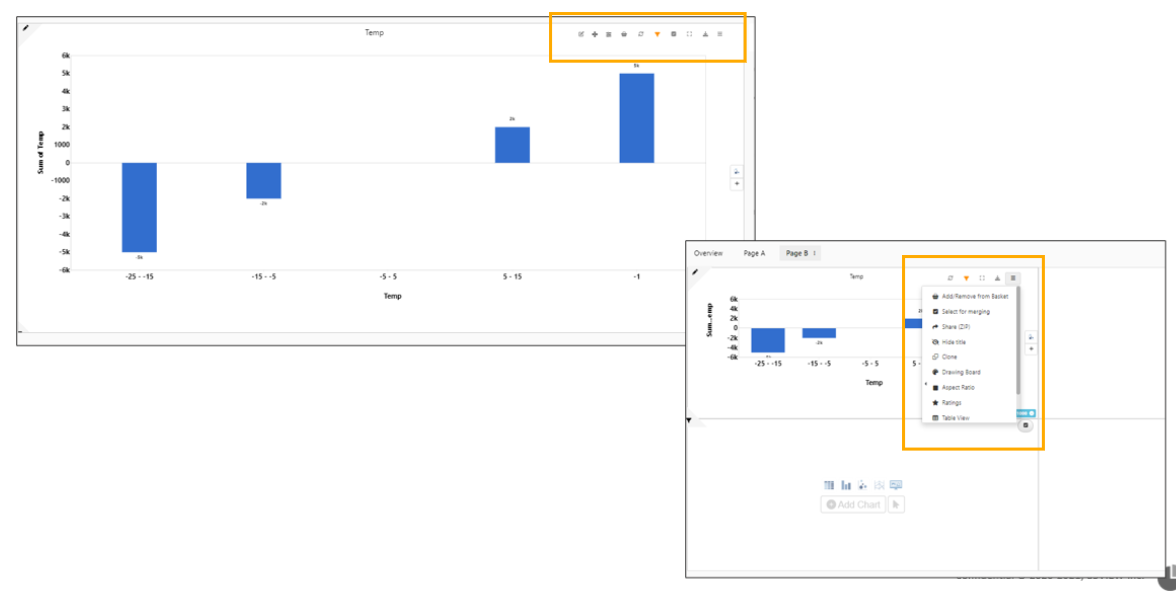
Viz panel options
Axes labels
Axes Labels are now available for different Visualizations like Hexaplot , Scattered plot , Histogram and multibox plot. These axes can be edited and saved to Visualizations in Simlytiks.
Peacock
The peacock 3D file now has a new option to set a point of rotation in context menu options.
Insert to database
When a Simlytiks dataset is inserted into a database, automatch option is initialized by default to match up the column type with the database schema.
XML files
XML files can be parsed into Simlytiks by selecting the elements and attributes and can be viewed in the dataset.
Excel references
If an Excel cell has references to other sheets for its value, it is now by default assumed as a curve column and tries to fetch all the values from the referred sheet and turns them into x, y points.
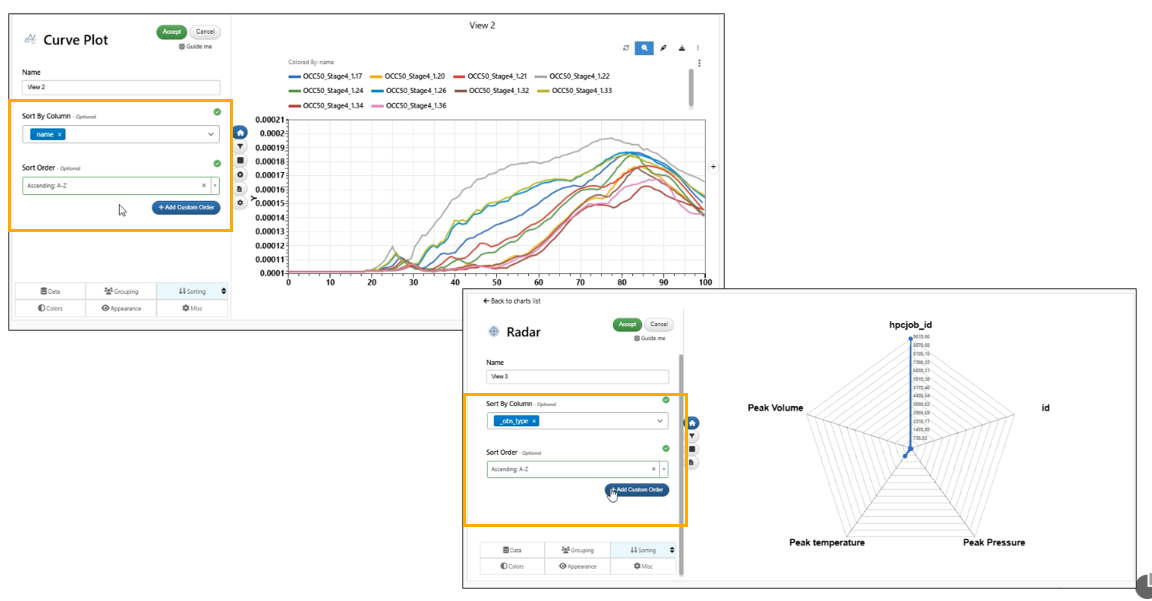
Sorting options
Sorting legends option is added to Newton and Radar visualizations in Simlytiks.
Sorting legends
Re ordering of columns
Tools -> Customize schema table now supports re-ordering of columns. We have to enable the Row re-order option in the table header and re order the columns to apply the changes.
Edit Datasetname
Simlytiks dataset name can be now edited and saved which will be reflected in the PPT exported file.
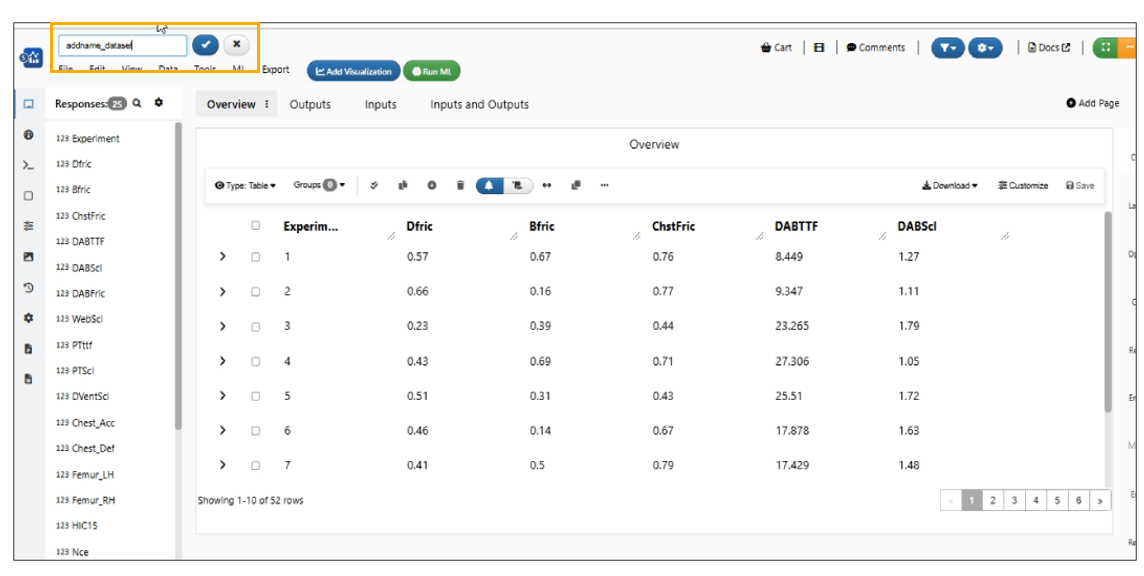
Edit Datasetname
Colorby
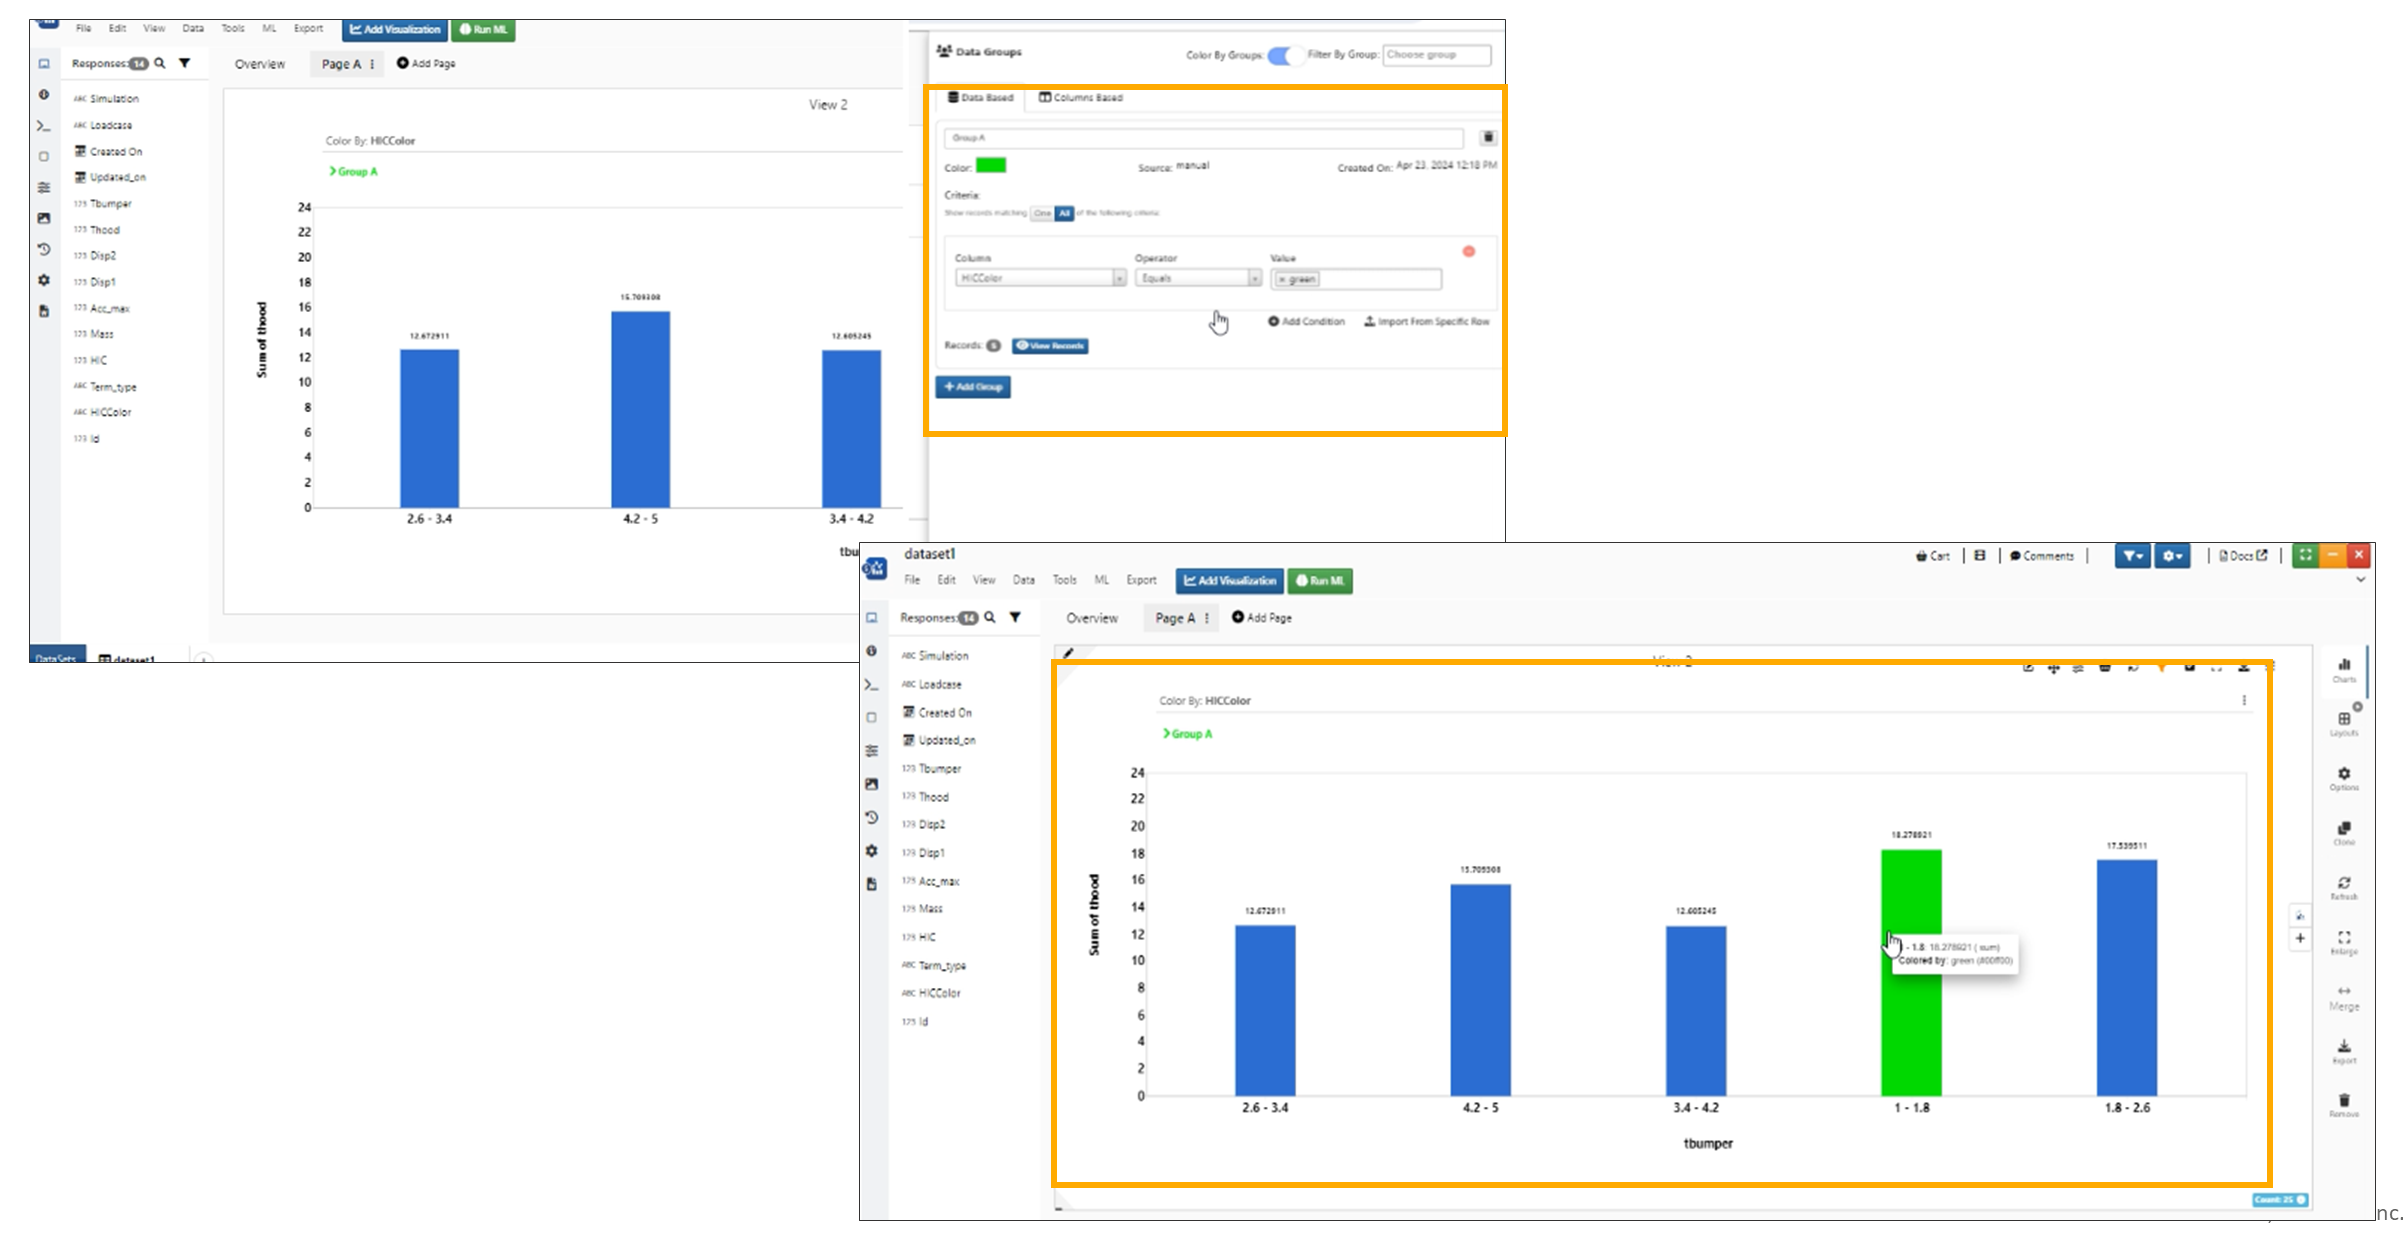
In Simlytiks, The ColorBy for categorical columns has option to color based on 5 default groups is visualization.
Color By for categorical columns will now allow a new customization option to use a fringe instead from blue/red by default but can be changed in the customization container.
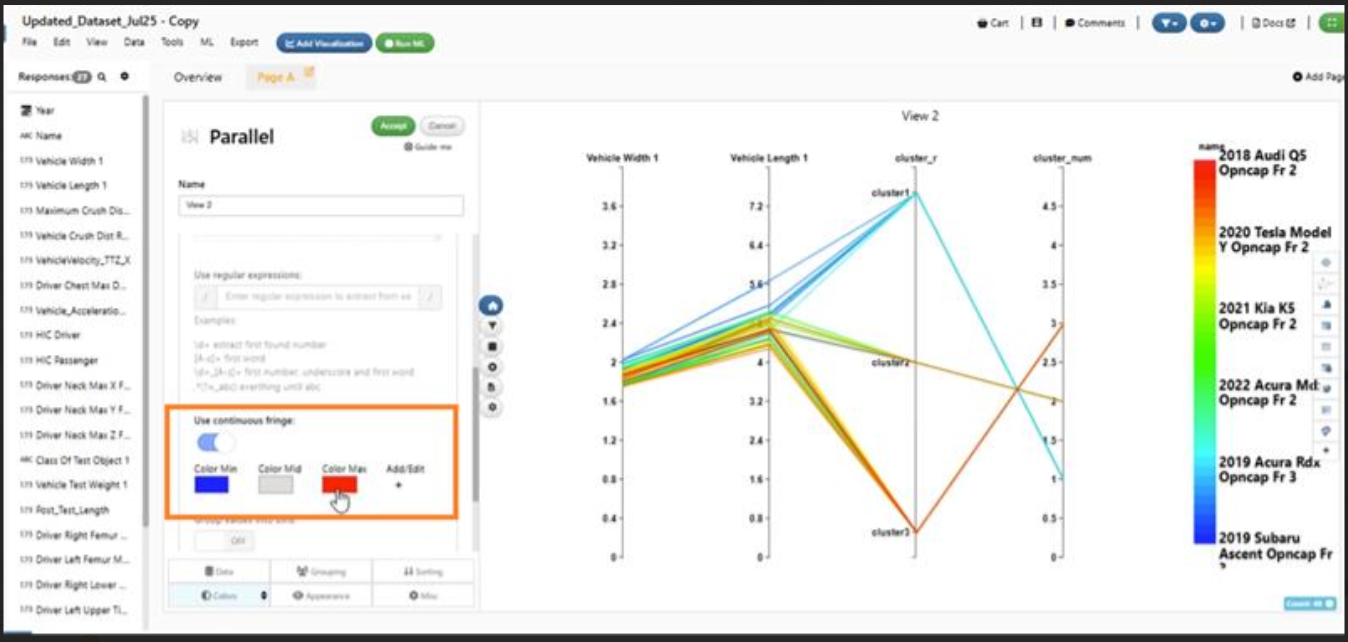
Fringe
Filters in Ovreview
The overview page in Simlytiks now has options to search and filter records.
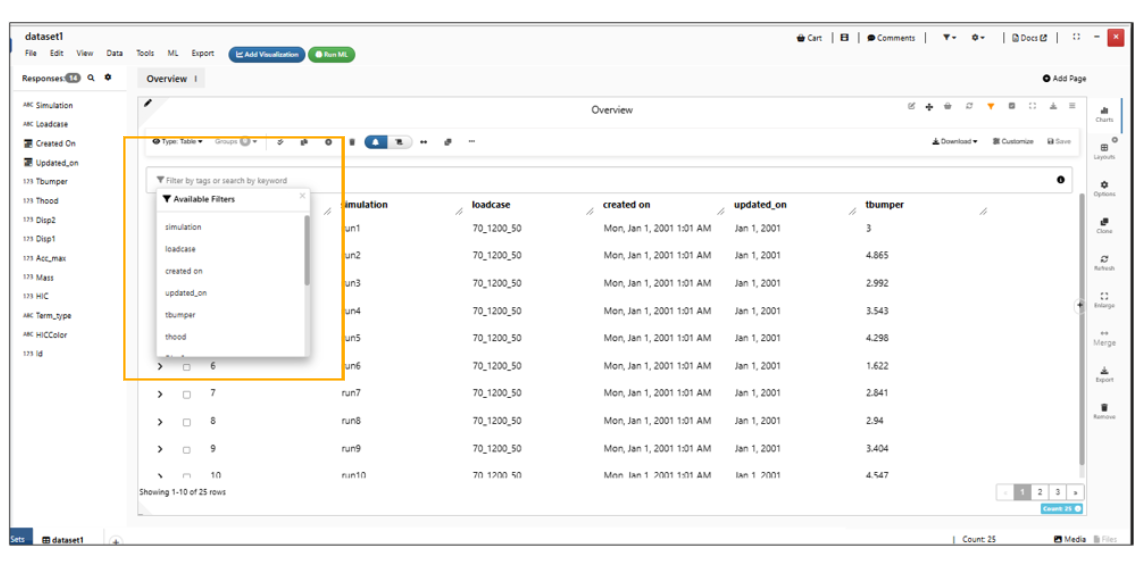
Filters in Overview
Edit Overview page
In Simlytiks, any changes made to the records in the overview table will be saved and carried over/applied to all visualizations for that dataset.
In Simlytiks, when an overview table column is sorted, we have an option to save the sorting using a header sort icon in blue. Clicking on Save sort will carry the sort order to other charts and Clear all sorts will reset order for all.
Mapper Table
Mapper table now supports exporting of mapped dataset as excel file and importing of the mapped excel file.
Merge Sheets
New feature called ‘ Merge pages from sheets’ is available in the Tools tab which allows user to merge pages from multiple sheets in Simlytiks.
Disable Footer
New option called ‘Disable footer’ is available under Tools -> Settings option in Simlytiks to disable the footer option of the newly added dataset.
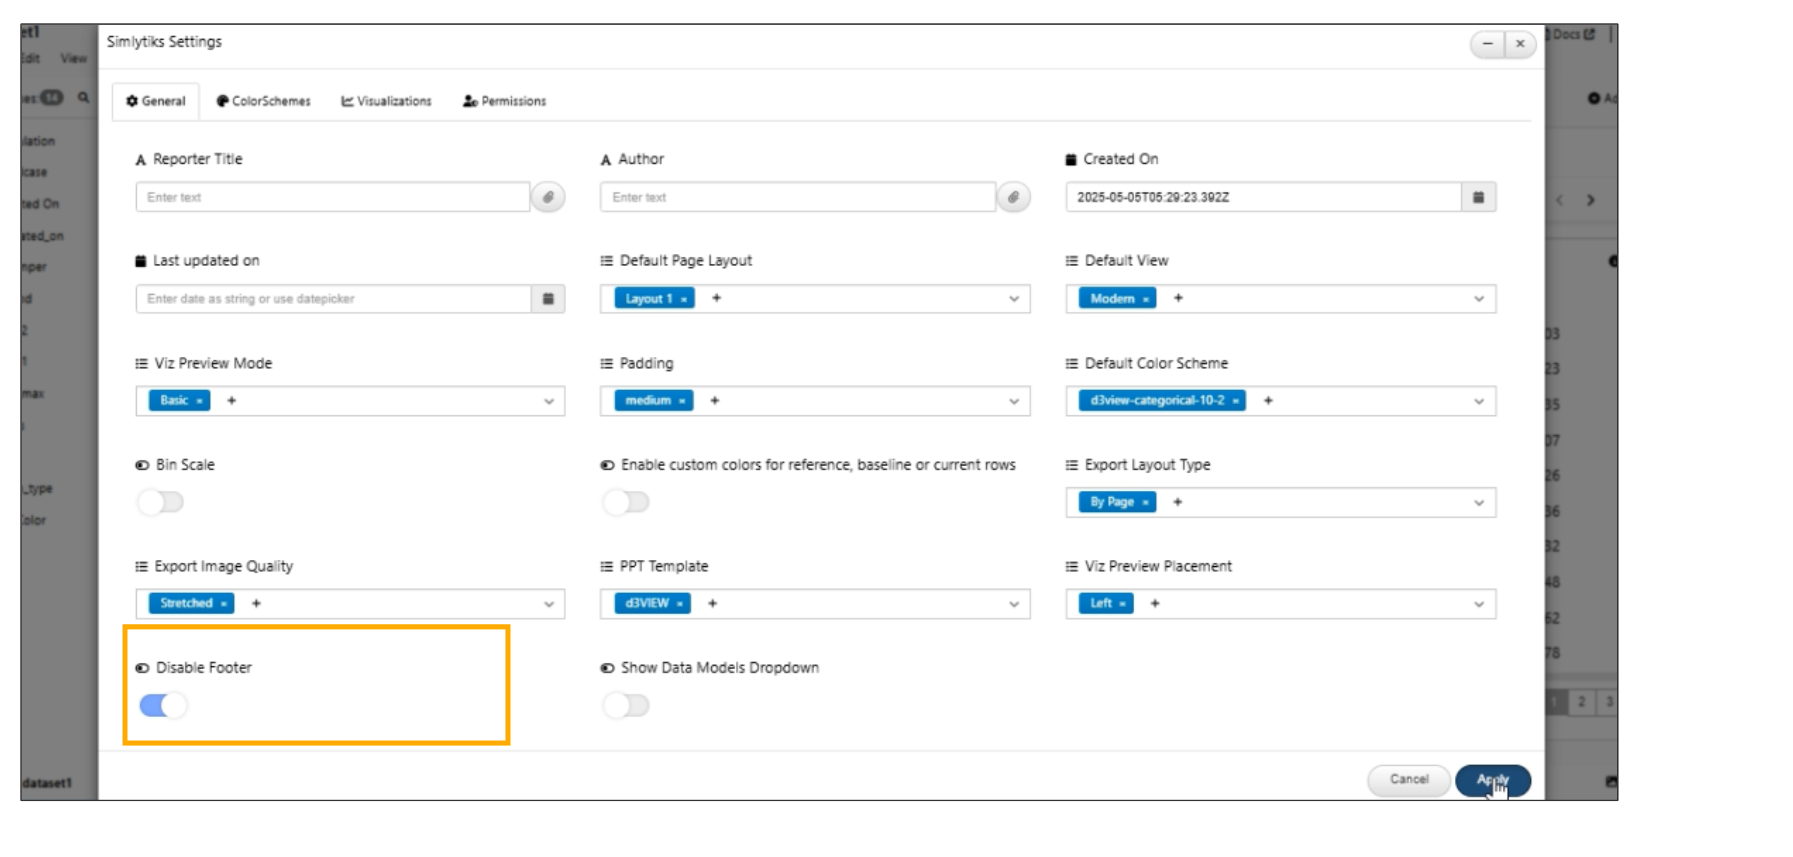
Disable footer
Edit table in sheets
The records in the overview table in Simlytiks users’ datasets can be edited in sheets using an option under page settings. The changes made can also be reset by clicking on the clear edits option in Simlytiks.
Tab Manager
Tab manager dropdown in Simlytiks modern view will now highlights and navigates to the active page opened by user in Simlytiks dataset.
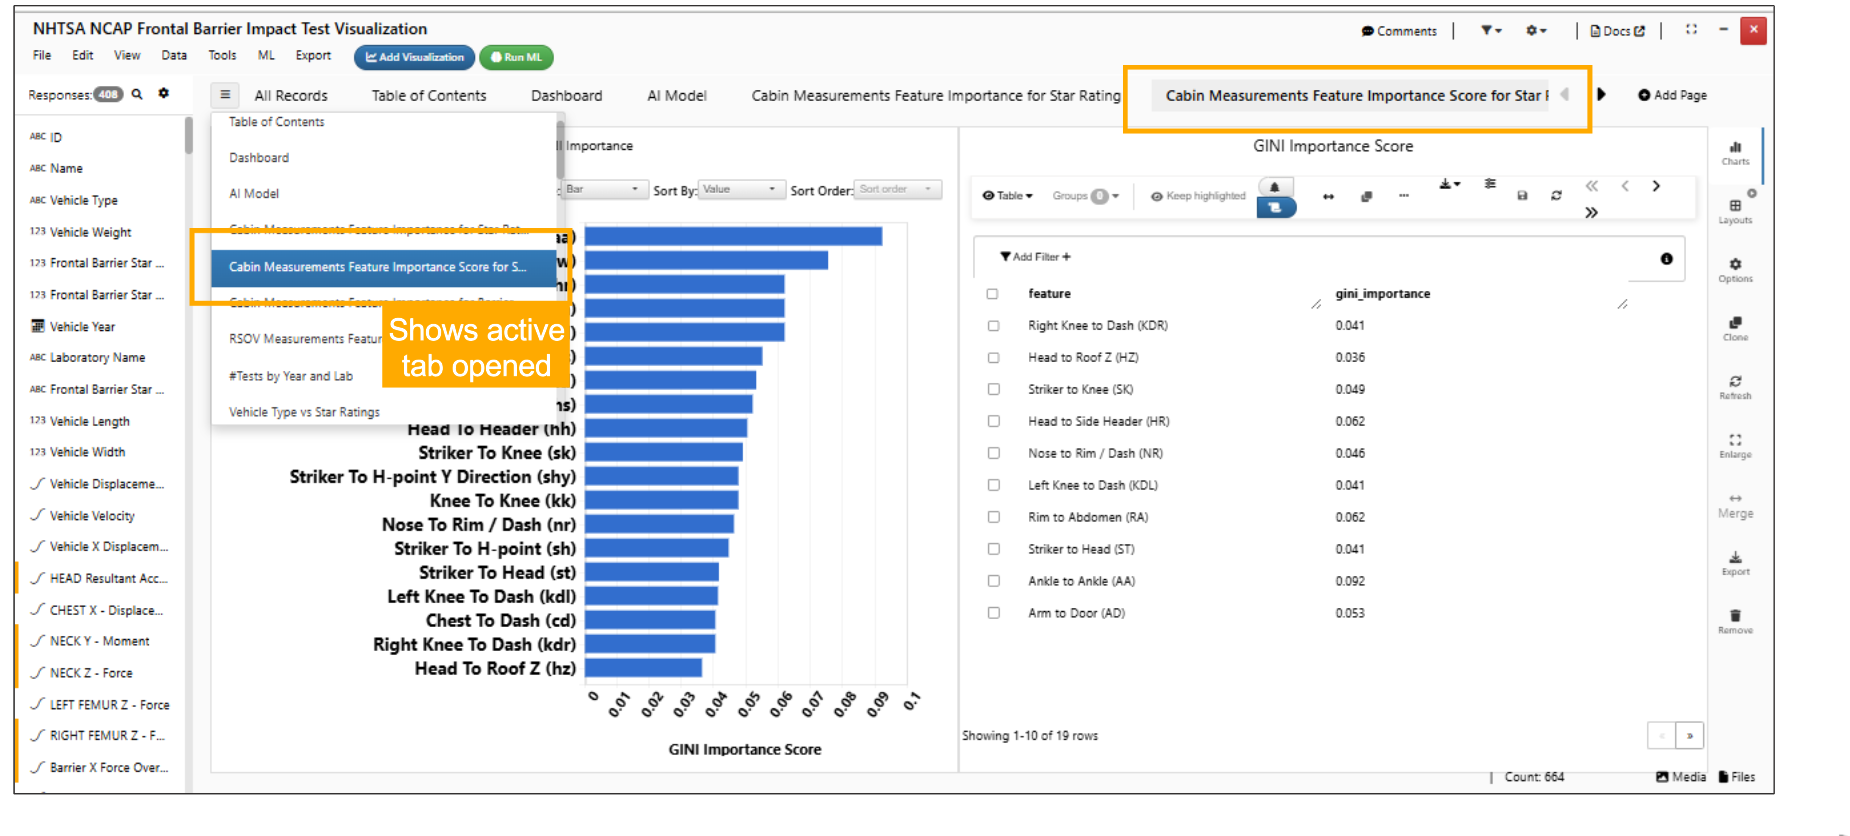
Tab manager
Agent
AI Agent in Simlytiks now supports interactive chat and visualization updates.
In Simlytiks, pages can now be removed directly in the AI Agent chat box without requiring user confirmation.
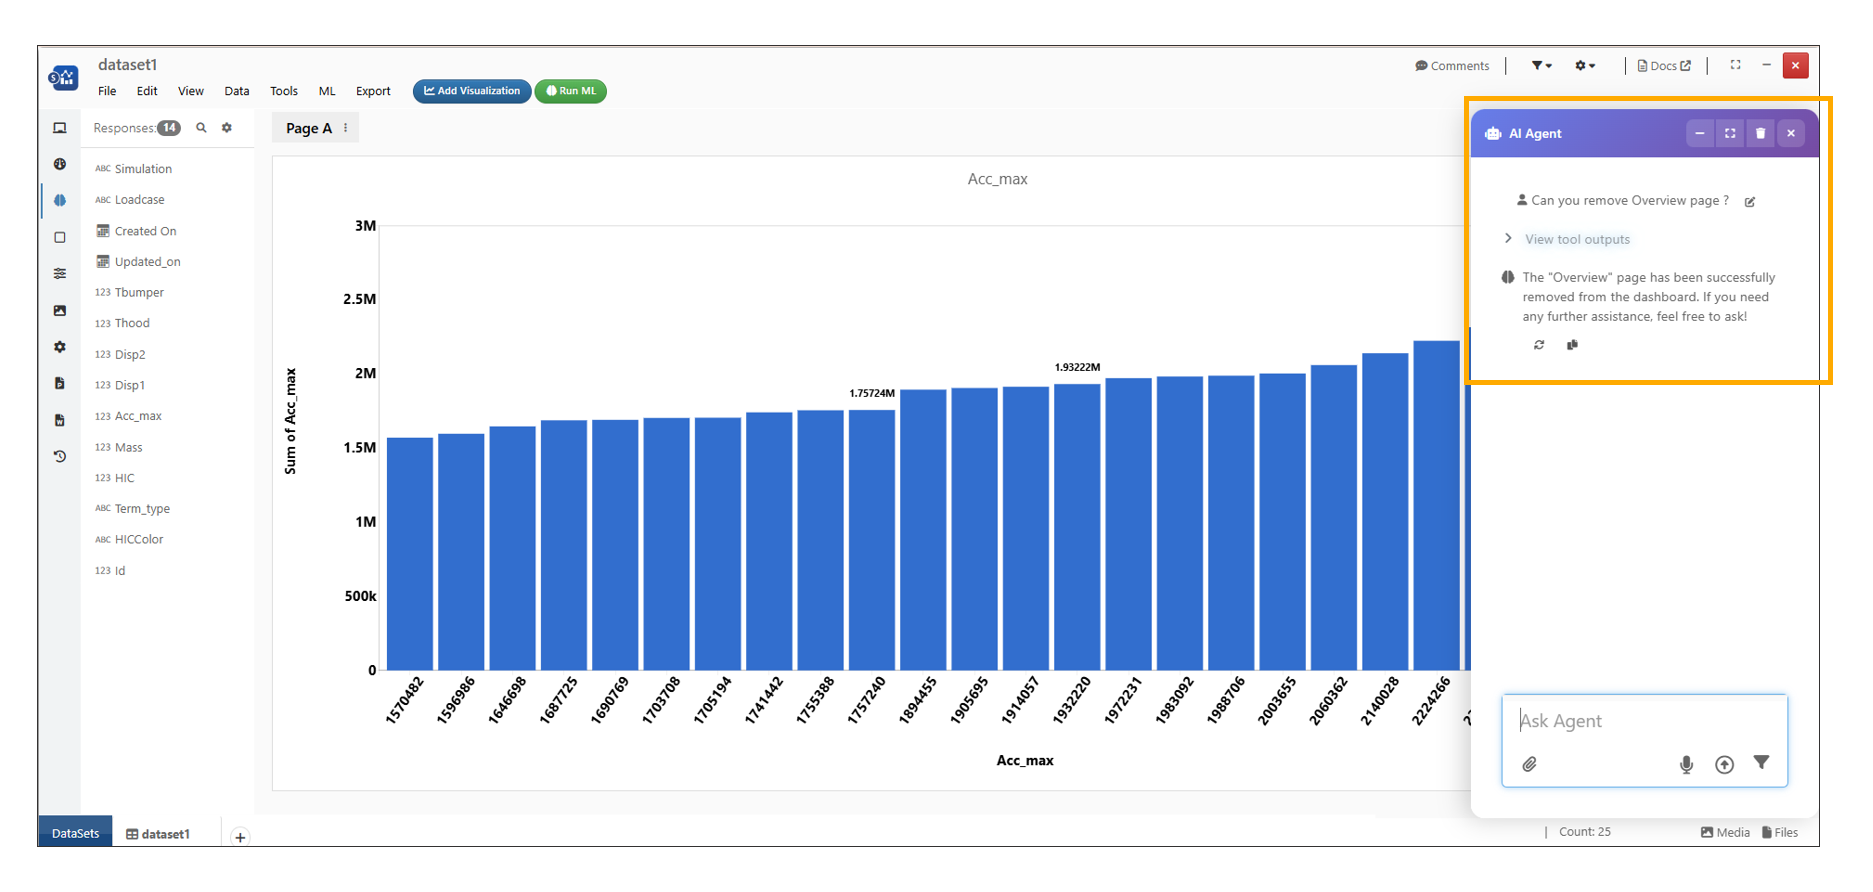
Agent Simlytiks
In Simlytiks, saved layouts can now be fetched, renamed and updated directly from the AI Agent chat box.
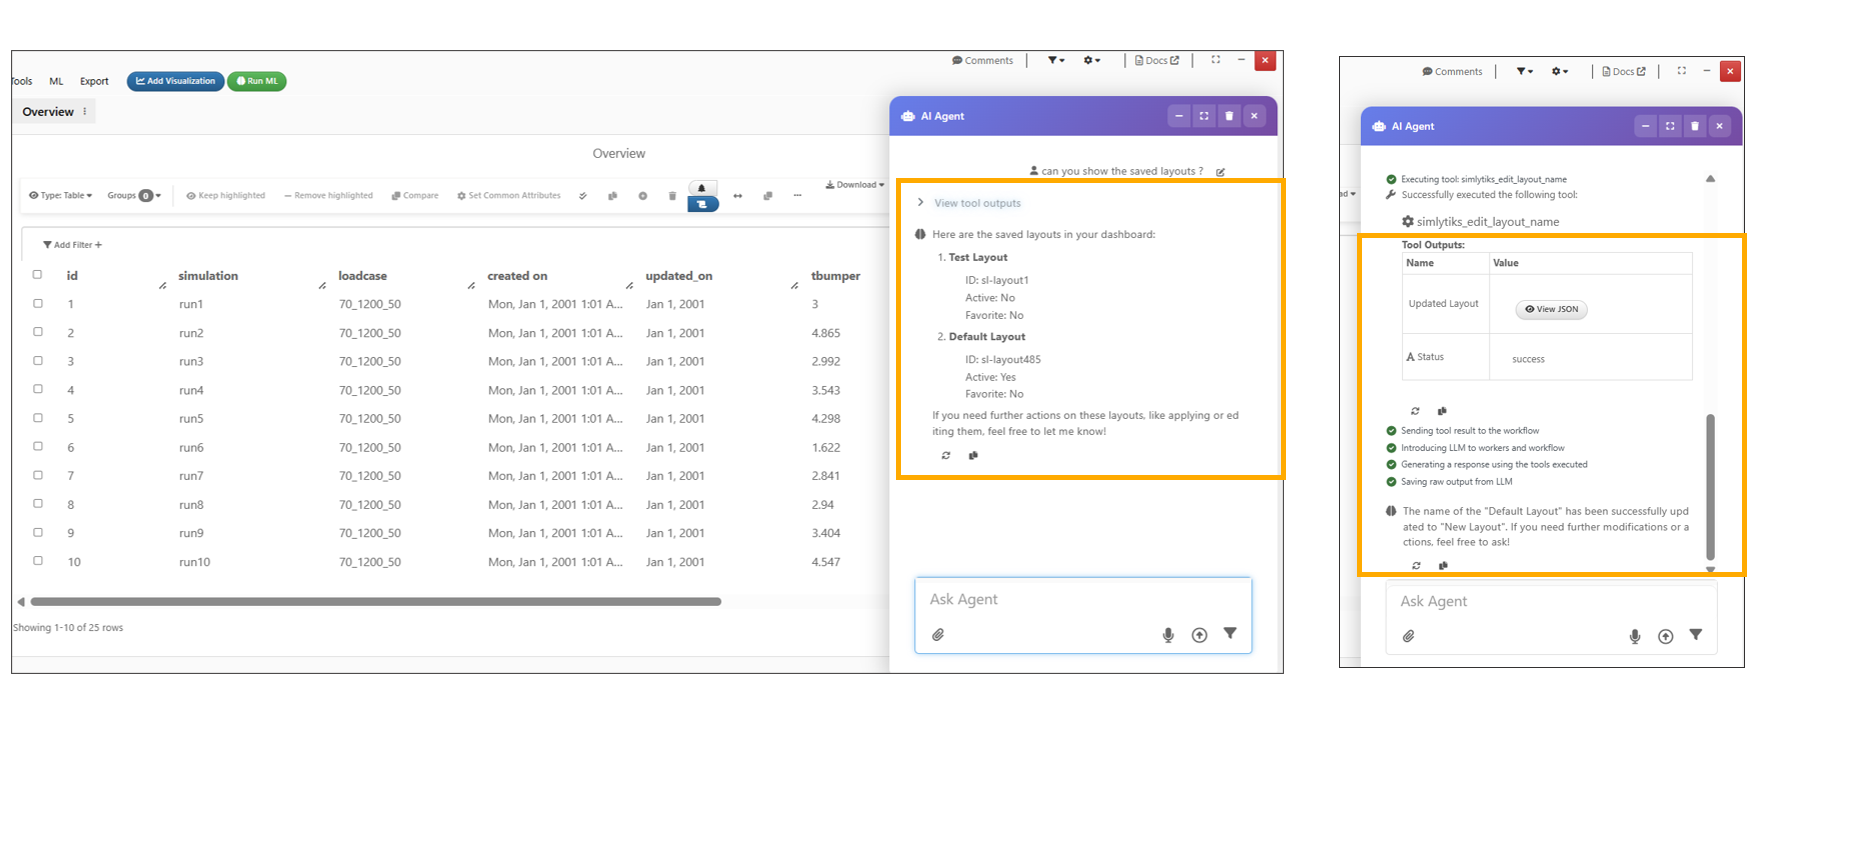
Agent Simlytiks
A new button called ‘AI Agent’ has been added beside ‘Run ML’ in the header to run AI Agent in Simlytiks. This launches the Data Science workflow in a sidebar, which can be used for summarization and queries.
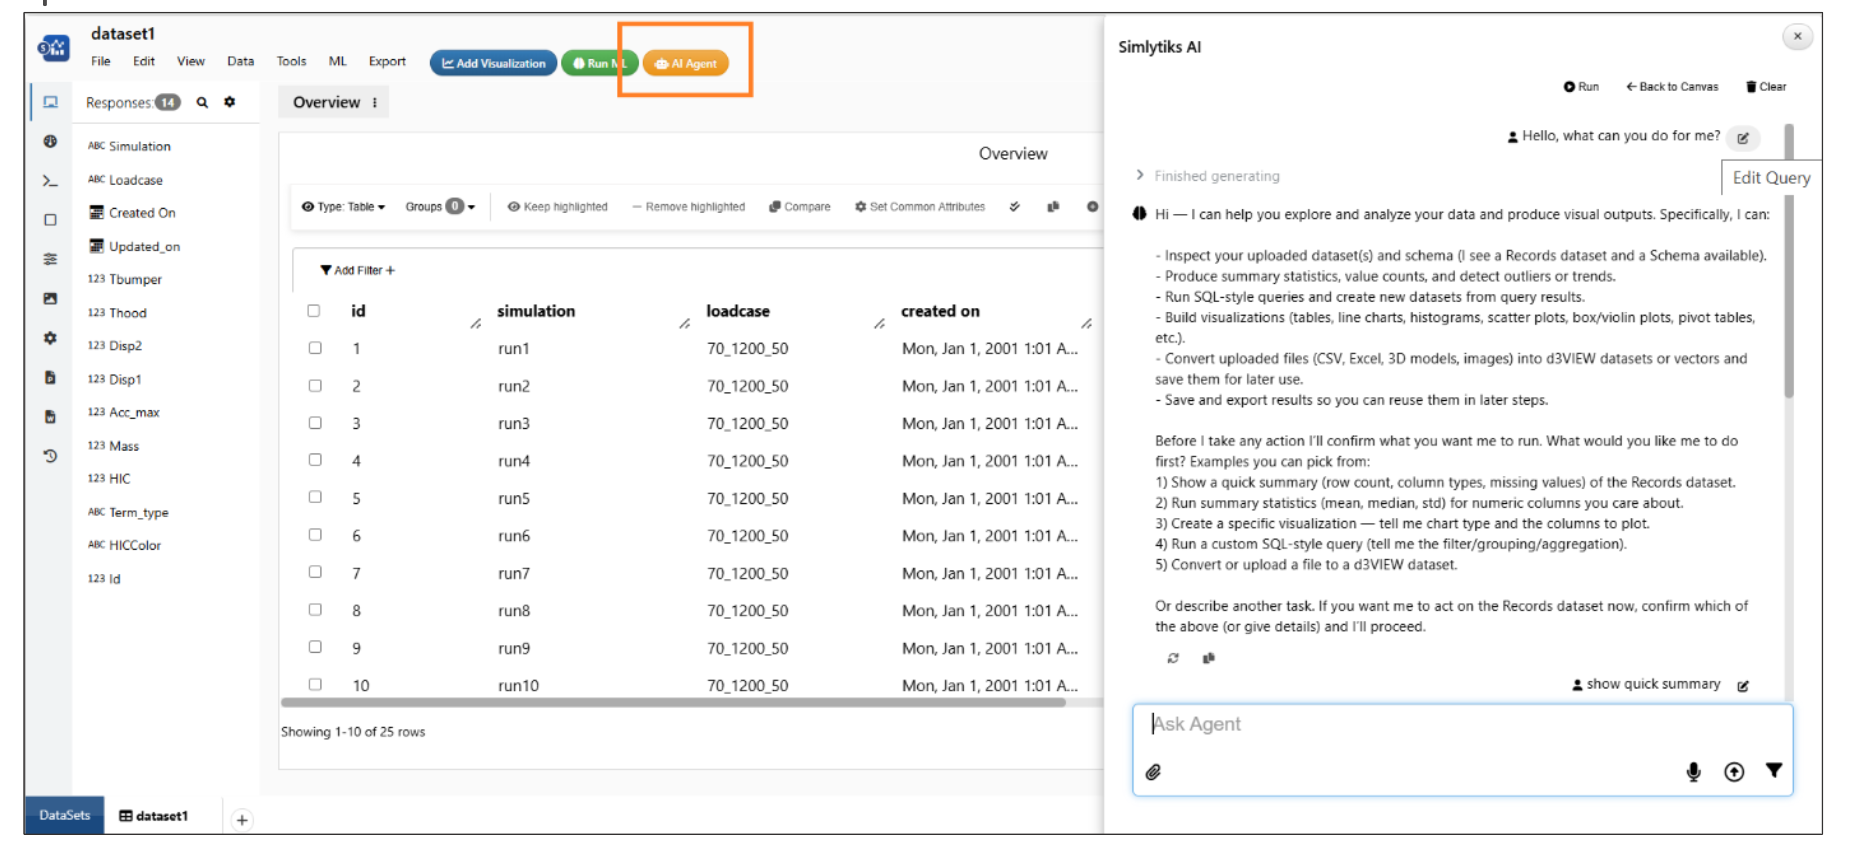
Agent Simlytiks
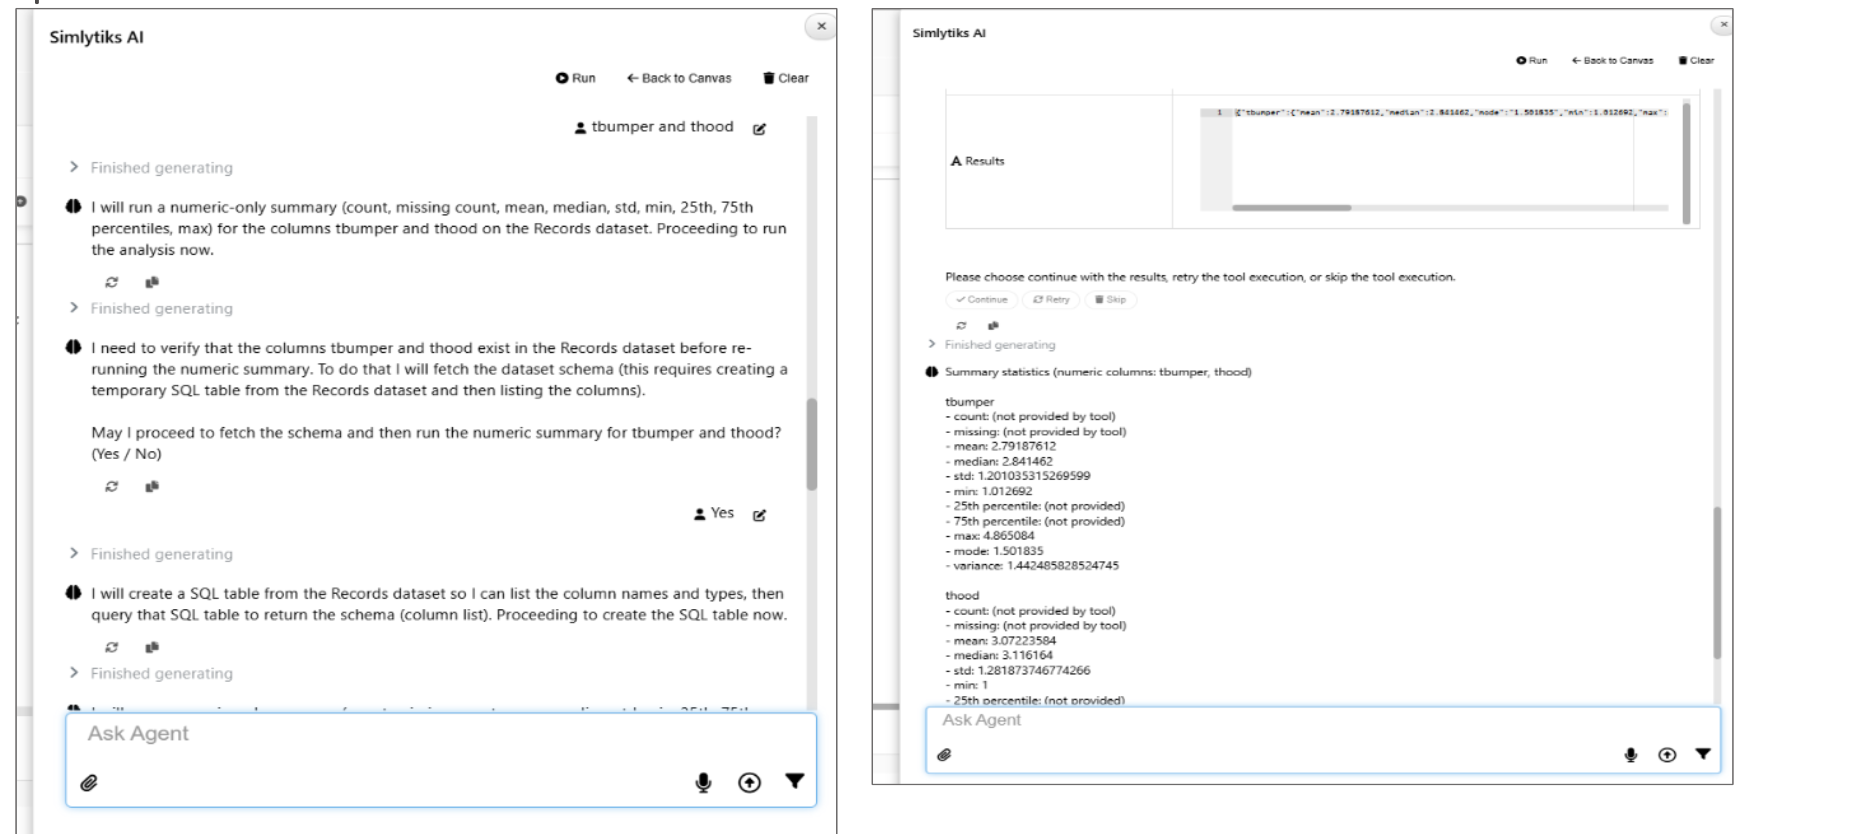
Agent Simlytiks
Operations using AI Agent
AI Agent in Simlytiks now supports removing of dataset columns. User can provide a prompt to remove the dataset columns directly and will be reflected in the overview table.
The AI Agent in Simlytiks now supports adding dataset columns, allowing users to create new columns using expressions directly through prompts, with the generated columns automatically added to the Dataset Overview page based on the defined expression.
Start Over
The File dropdown in Simlytiks now includes a new Start Over option, which brings up the landing page view for the dataset replacement within the current session.