24.  Exploration Examples
In this section, we’ll go over specific data exploration examples
Example of Dataset Exploration
Car Release
Let’s go over exploring a car release dataset.
Accessing d3VIEW and Simlytiks
Enter the URL you received in the browser. Type in your login and password.
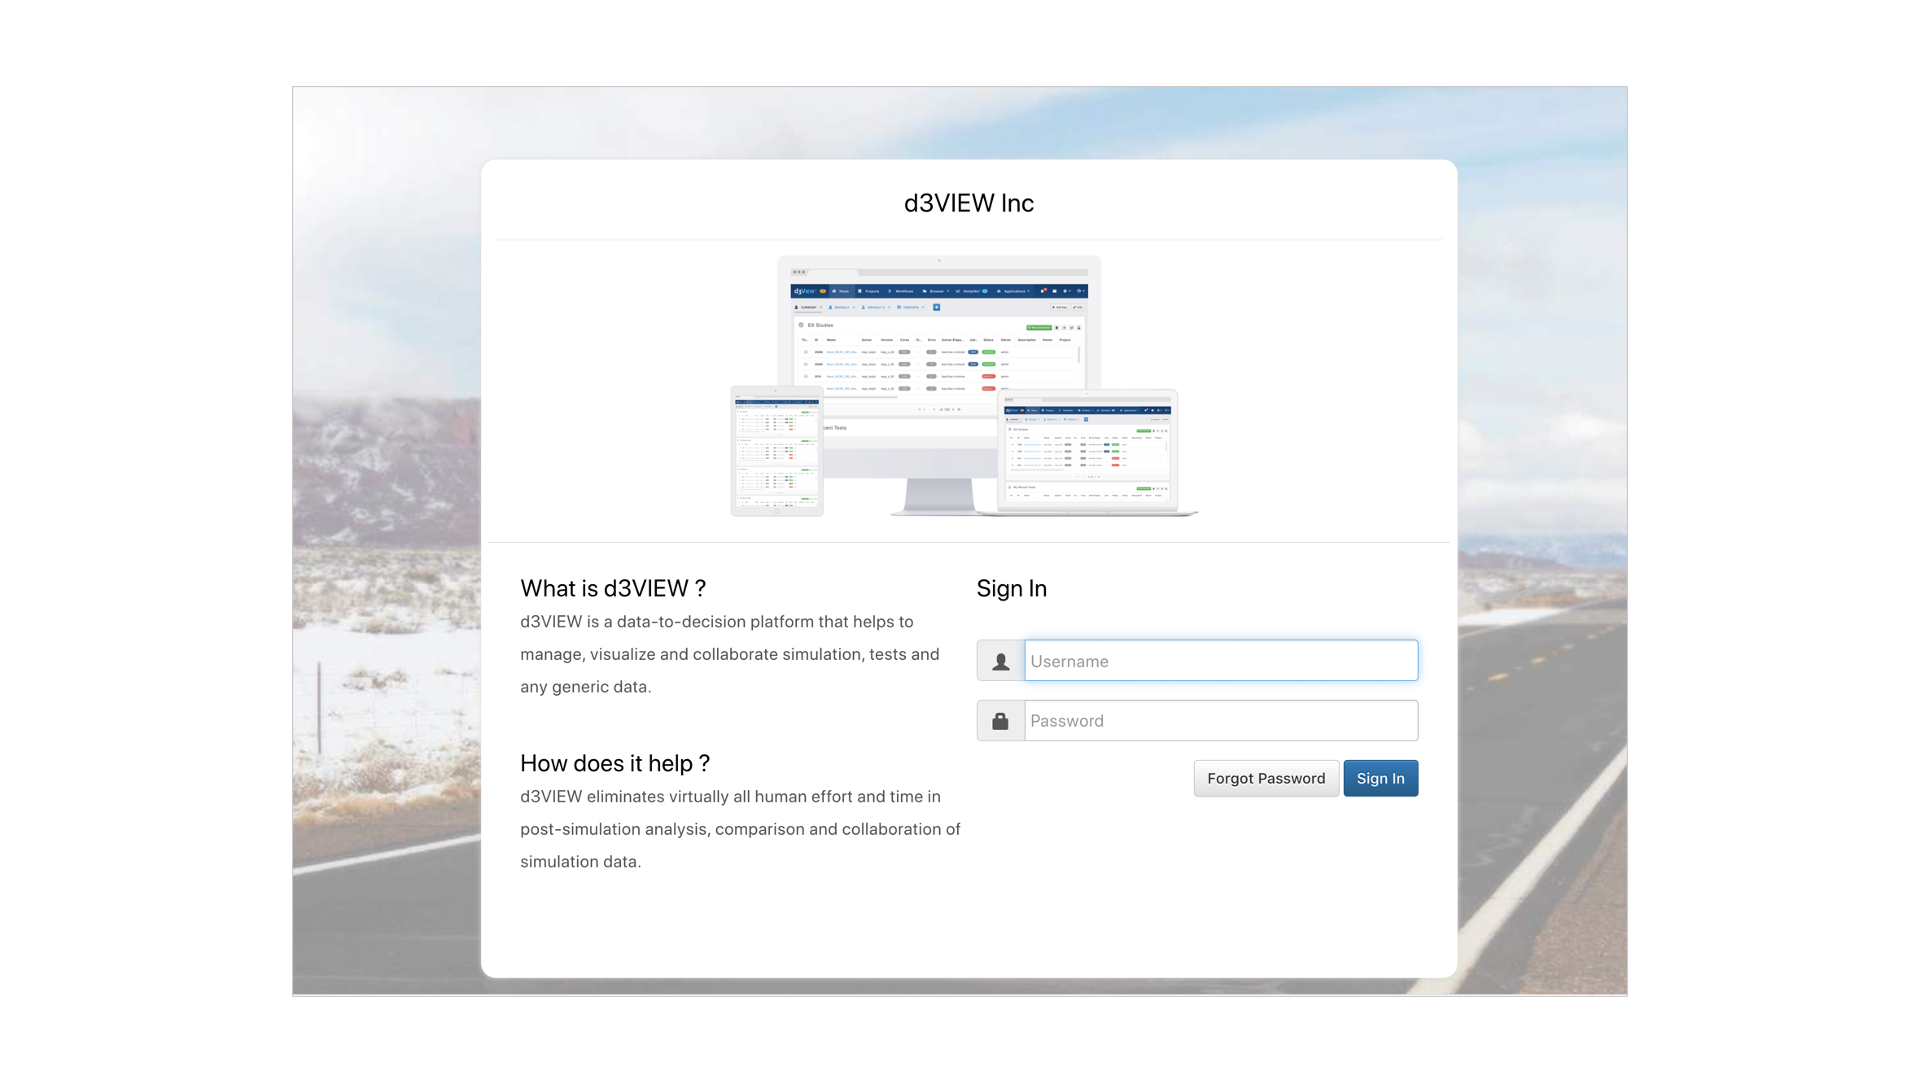
How to access d3VIEW?
Navigate to the Simlytiks page under the app menu at the top left corner of the page.
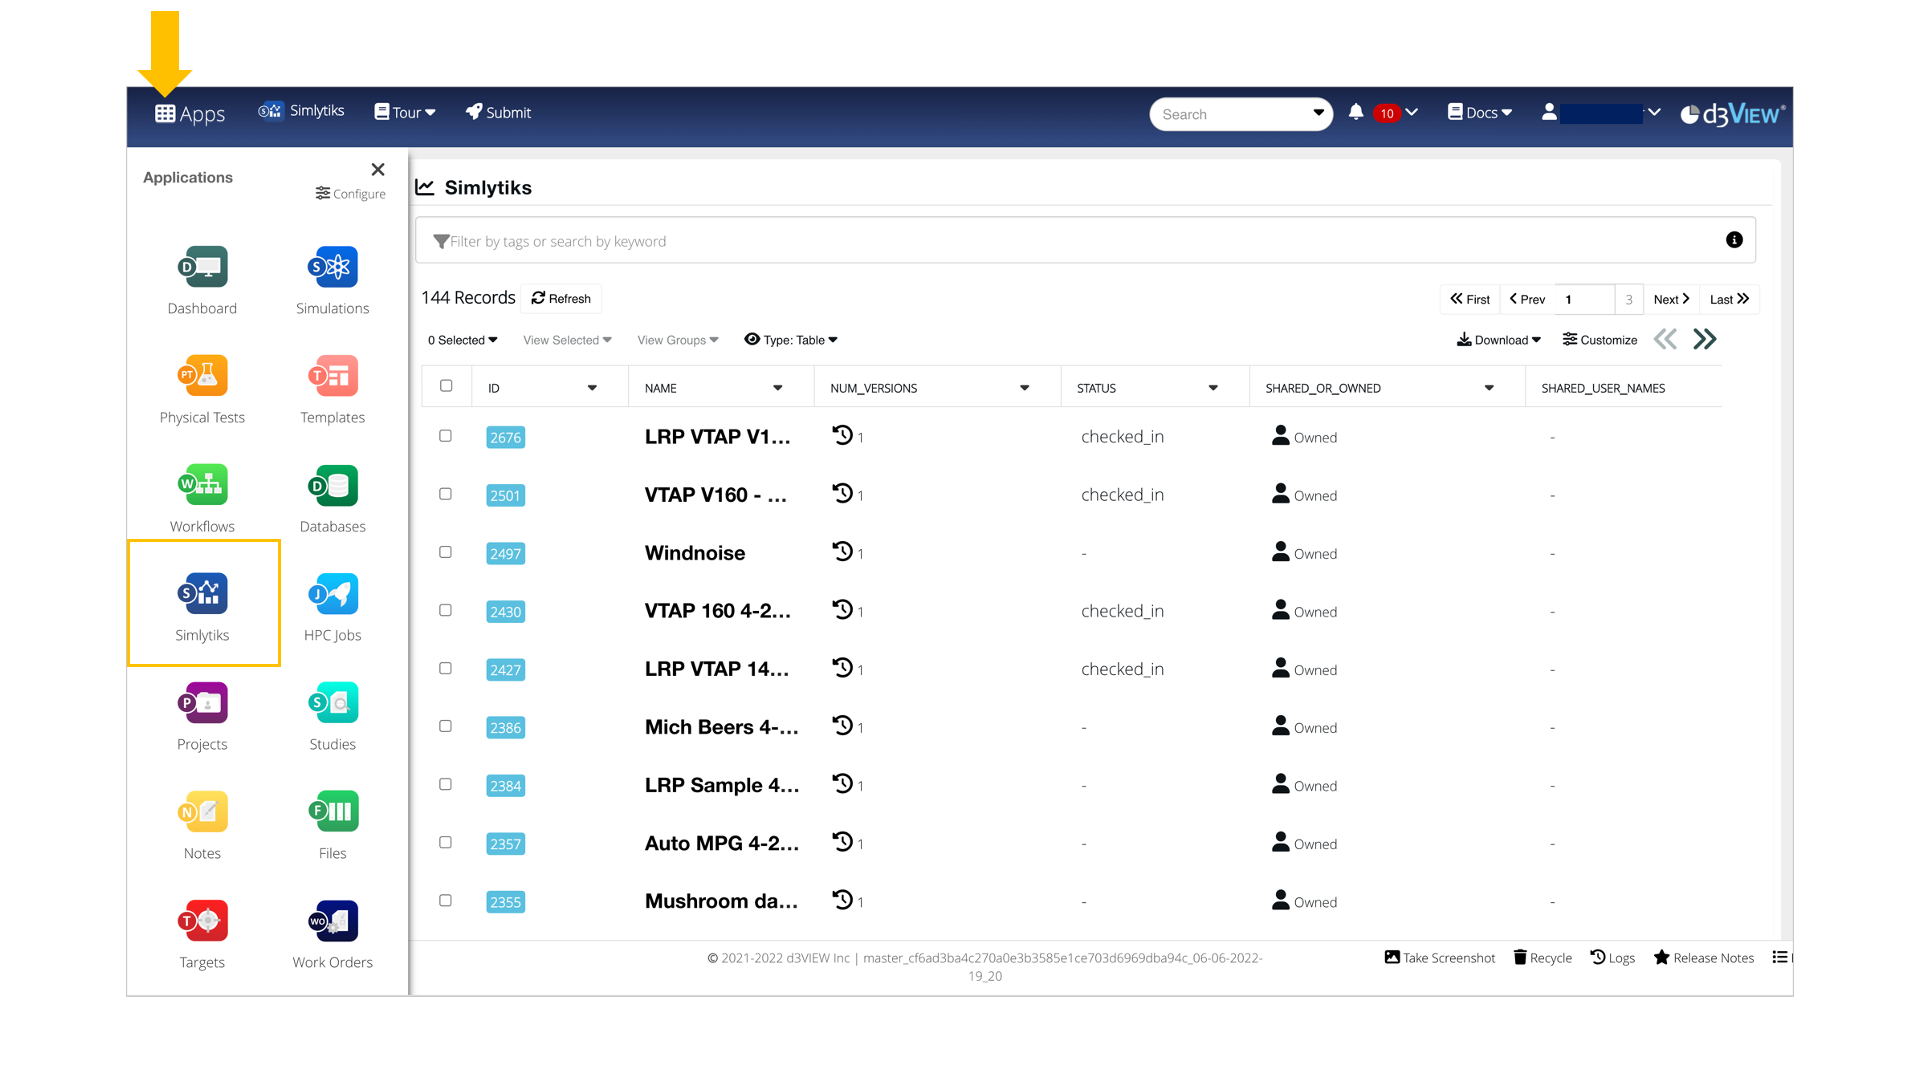
Navigate to Simlytiks Page
Importing Data
Use the drop-box on the main page to import data in Simlytiks.
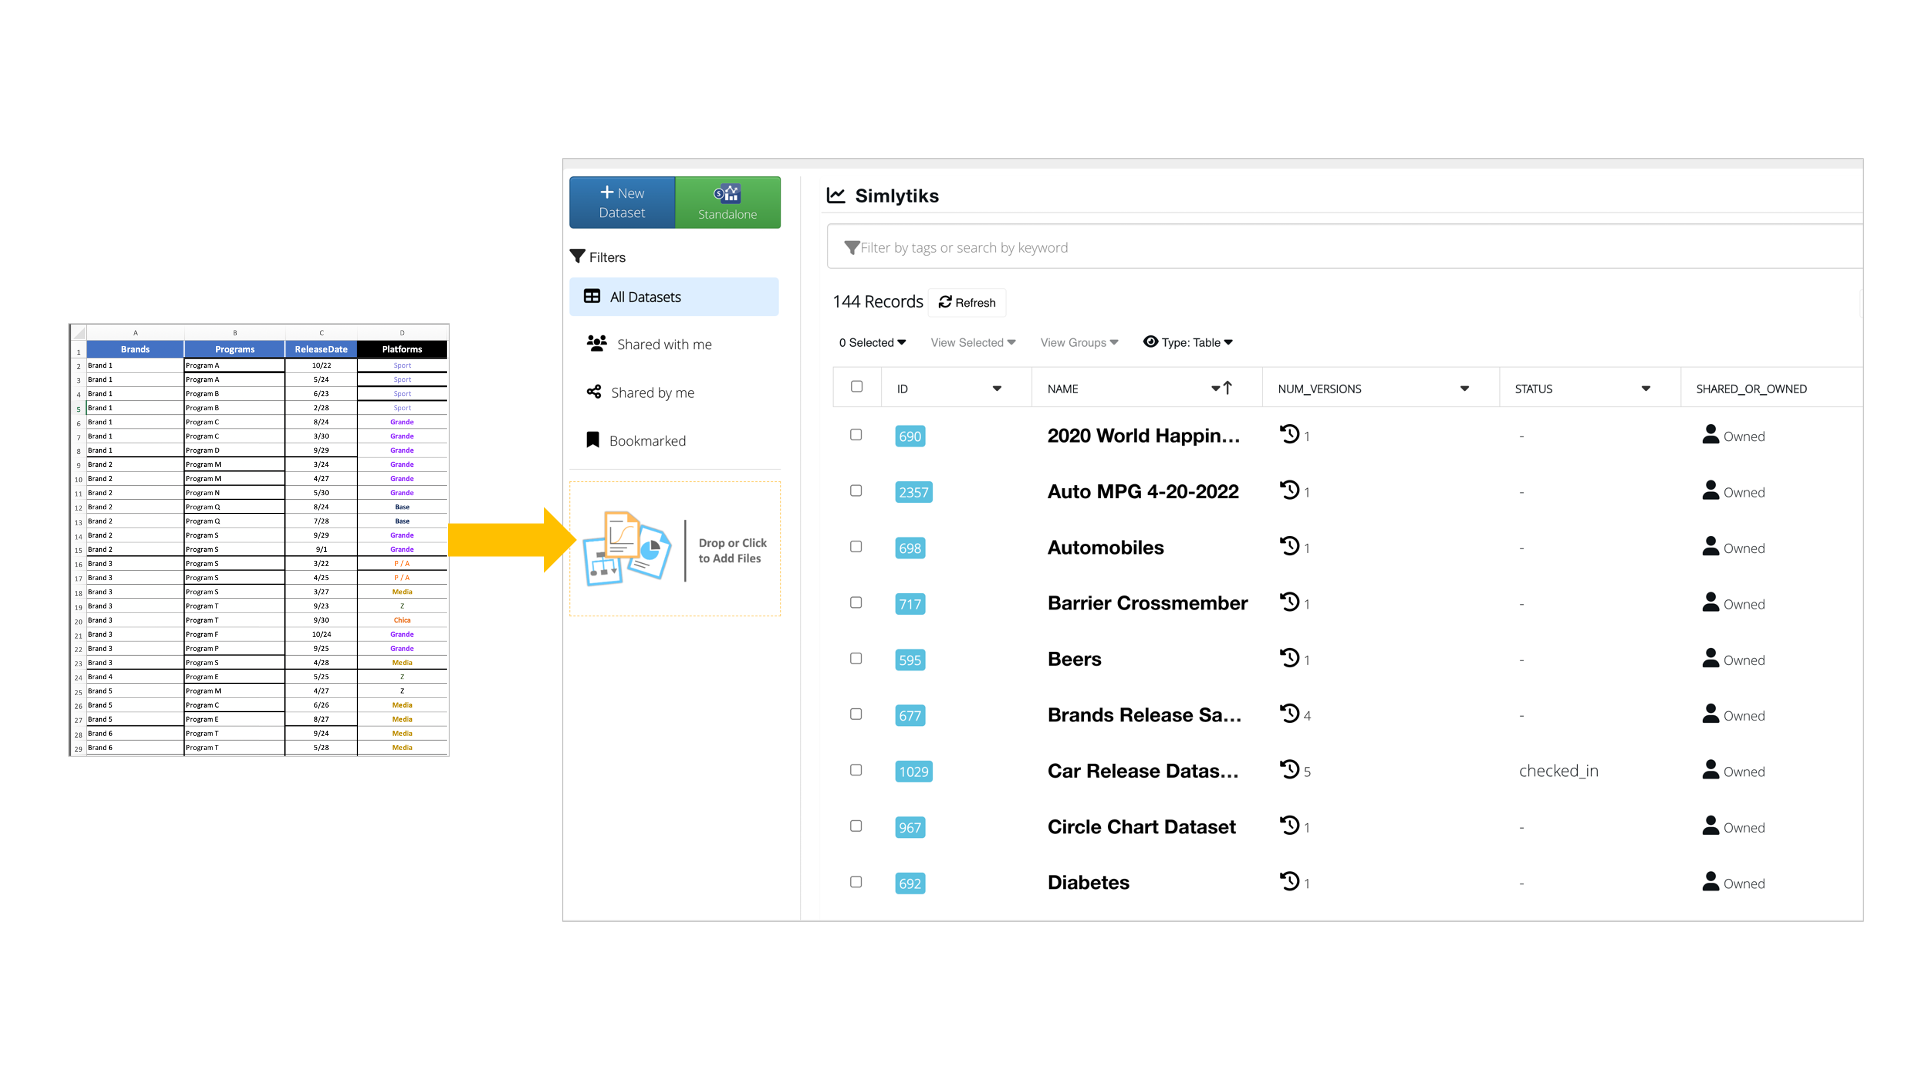
Import Excel
We’ll have a window pop up to select the cells for the dataset. Choose “Select All” and press “Ok”.
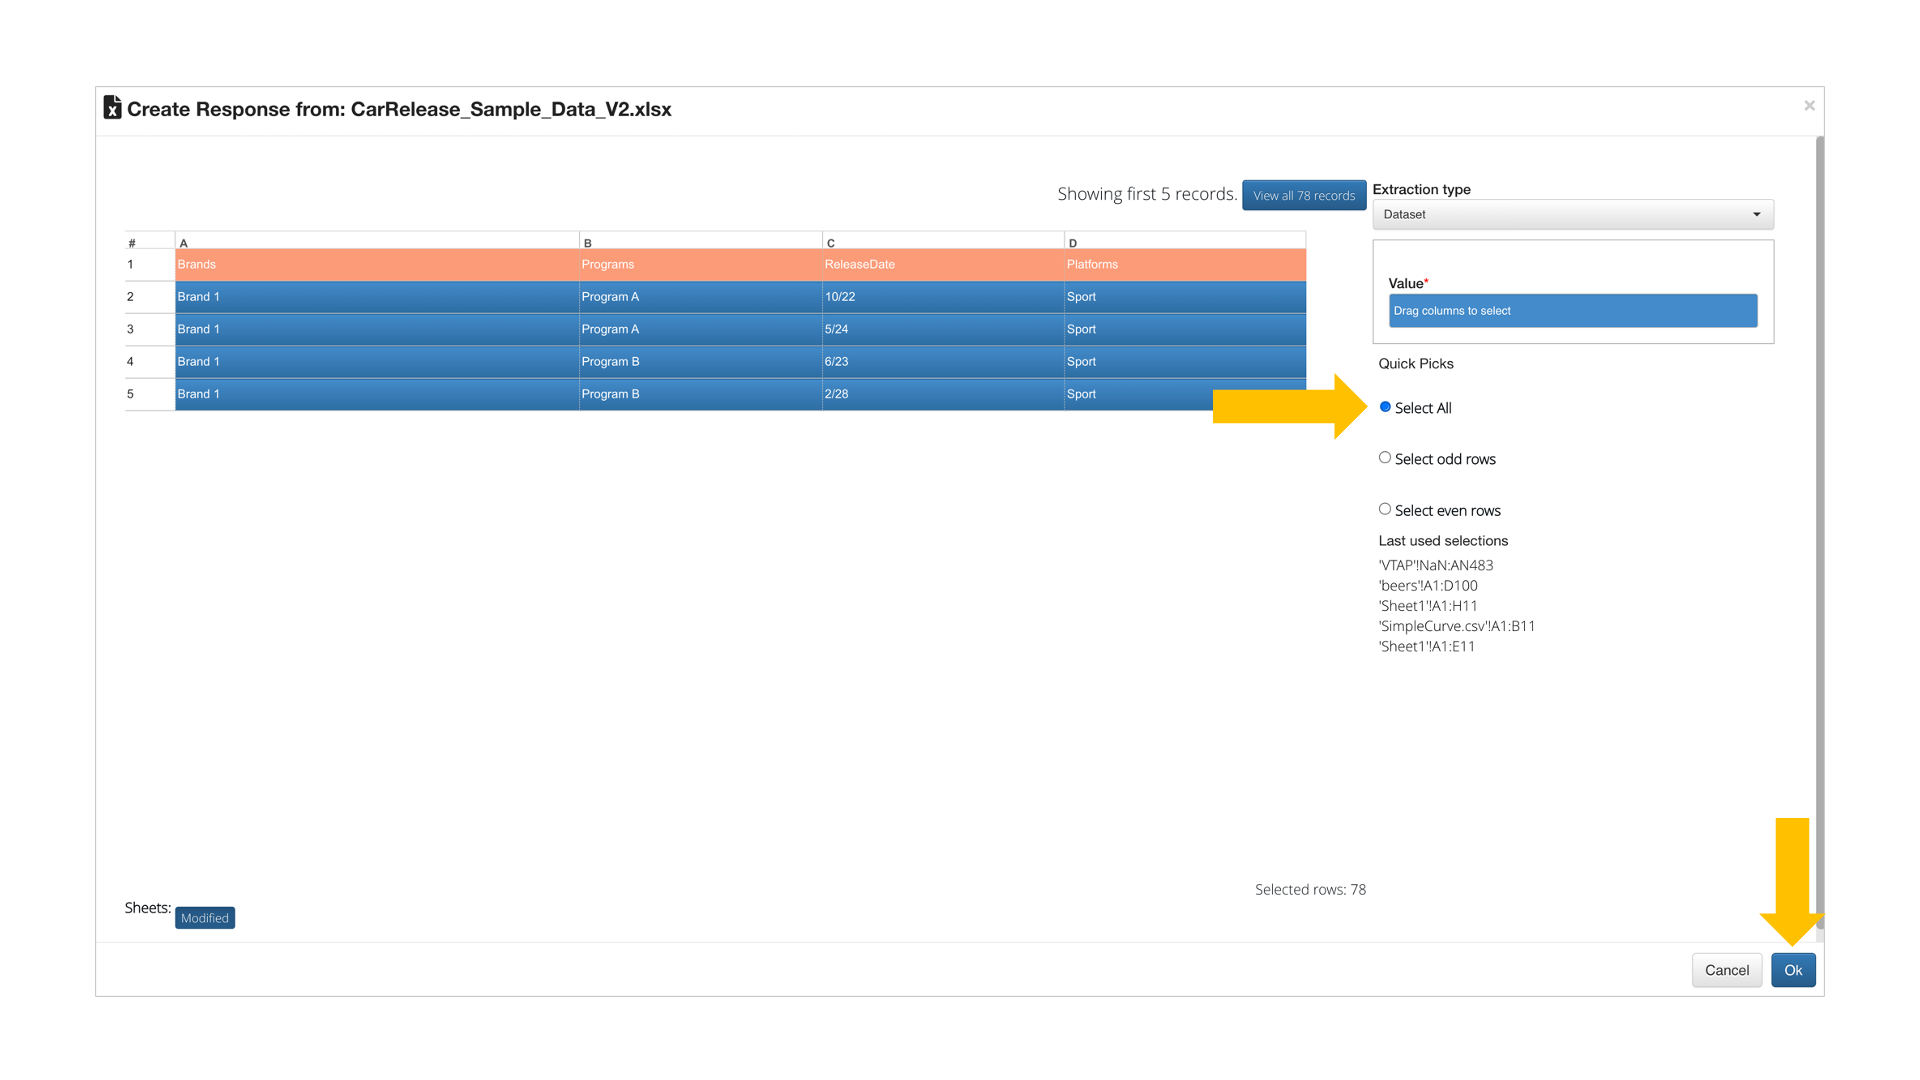
Select Data
The selected excel data will open in Simlytiks as a dataset with an Overview Table. View responses on the left hand side (Modern View); click on the bar chart icon to view comparisons between values.
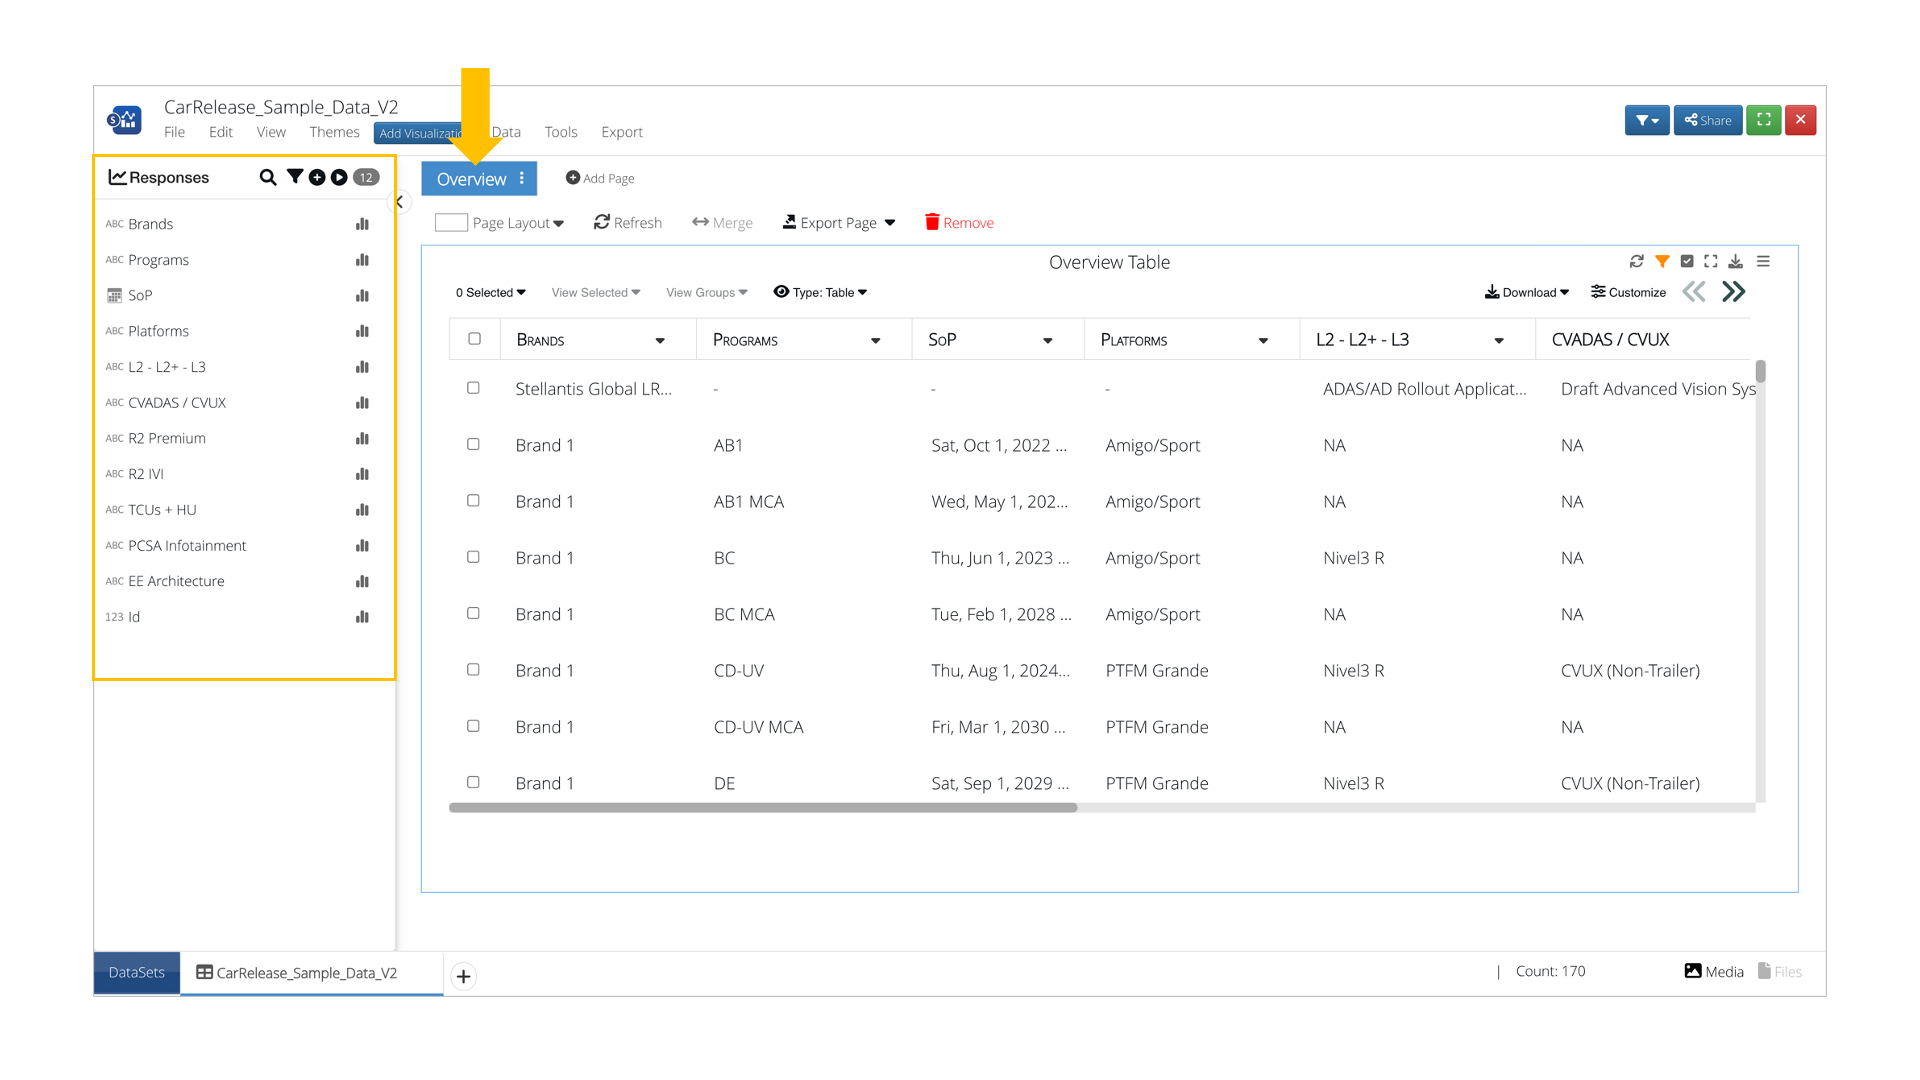
Dataset Overview
Creating Dashboards
Add pages simply by clicking the plus icon on the pages panel. This example shows this button on the top bar in Modern View.
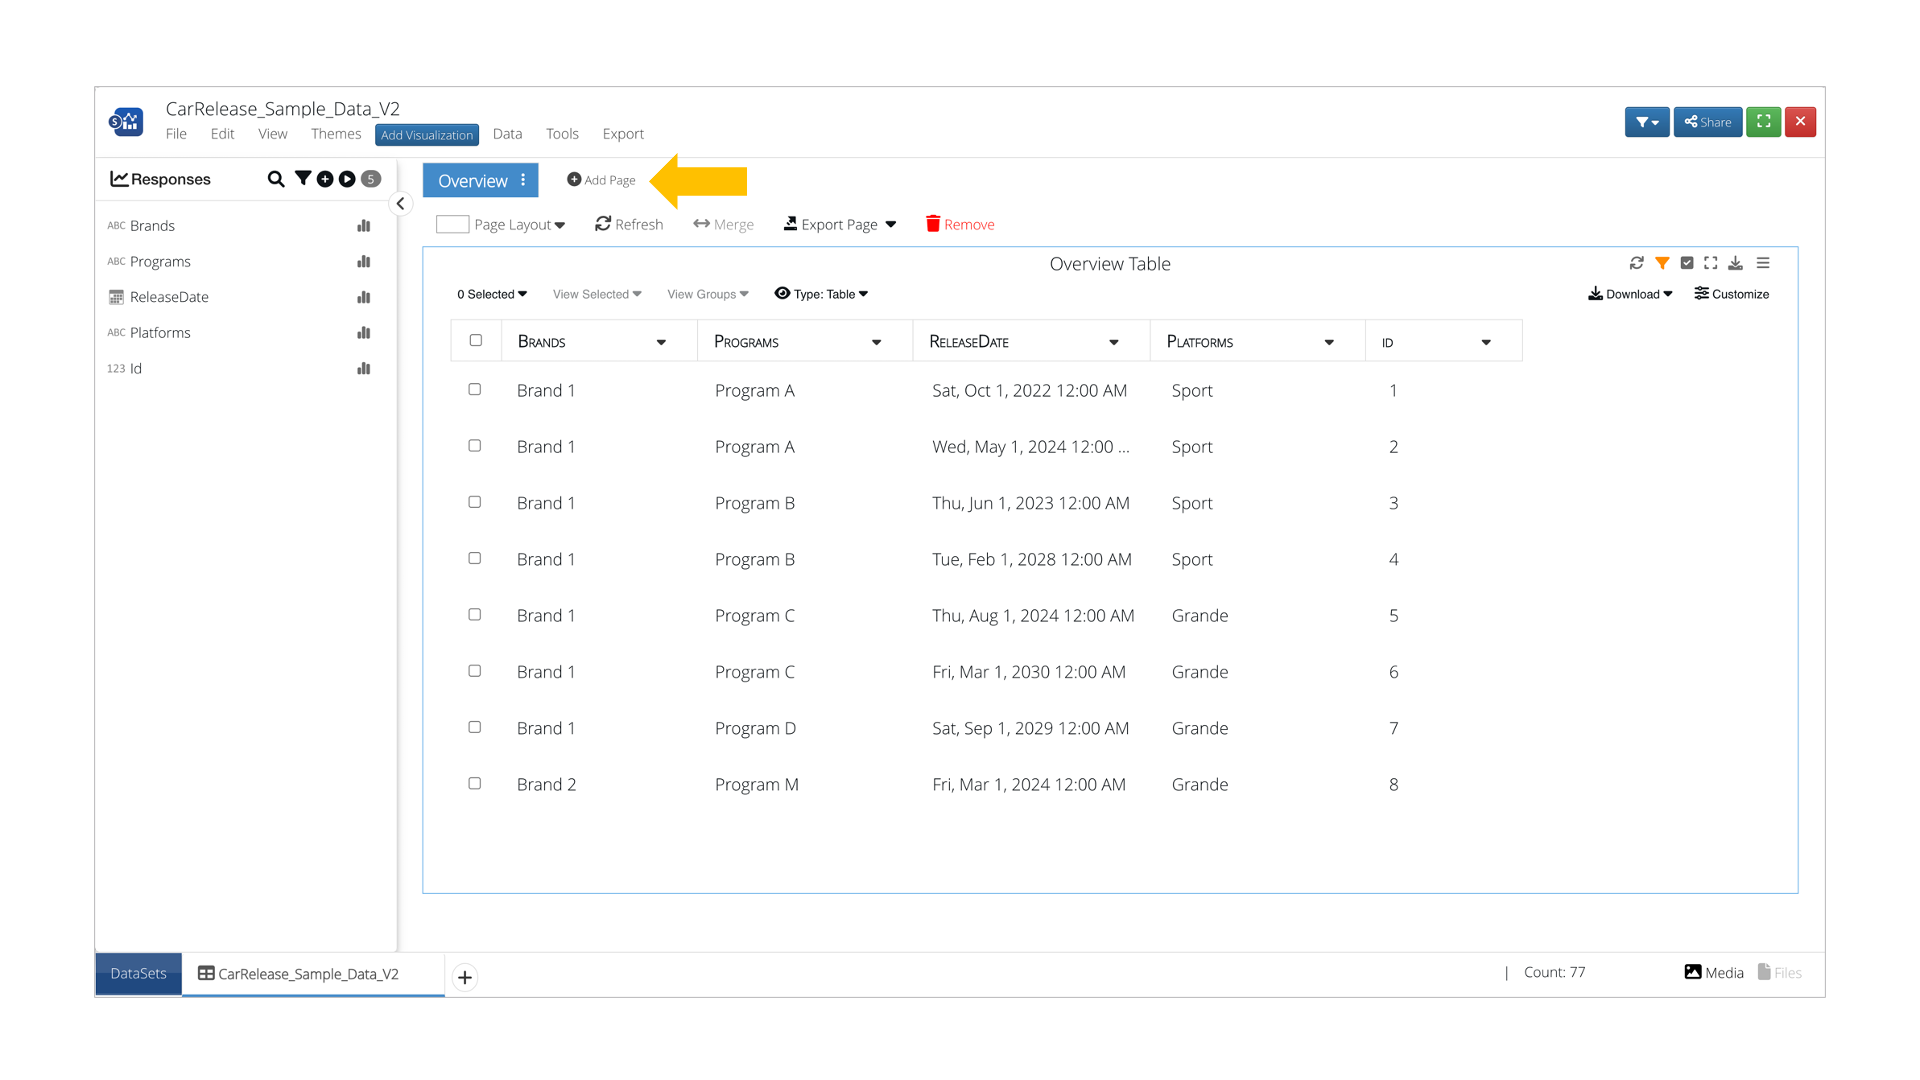
Add Page
Open the visualization menu under Add Visualization. Click on or drag-and-drop the scatter plot visualizer onto the page section.
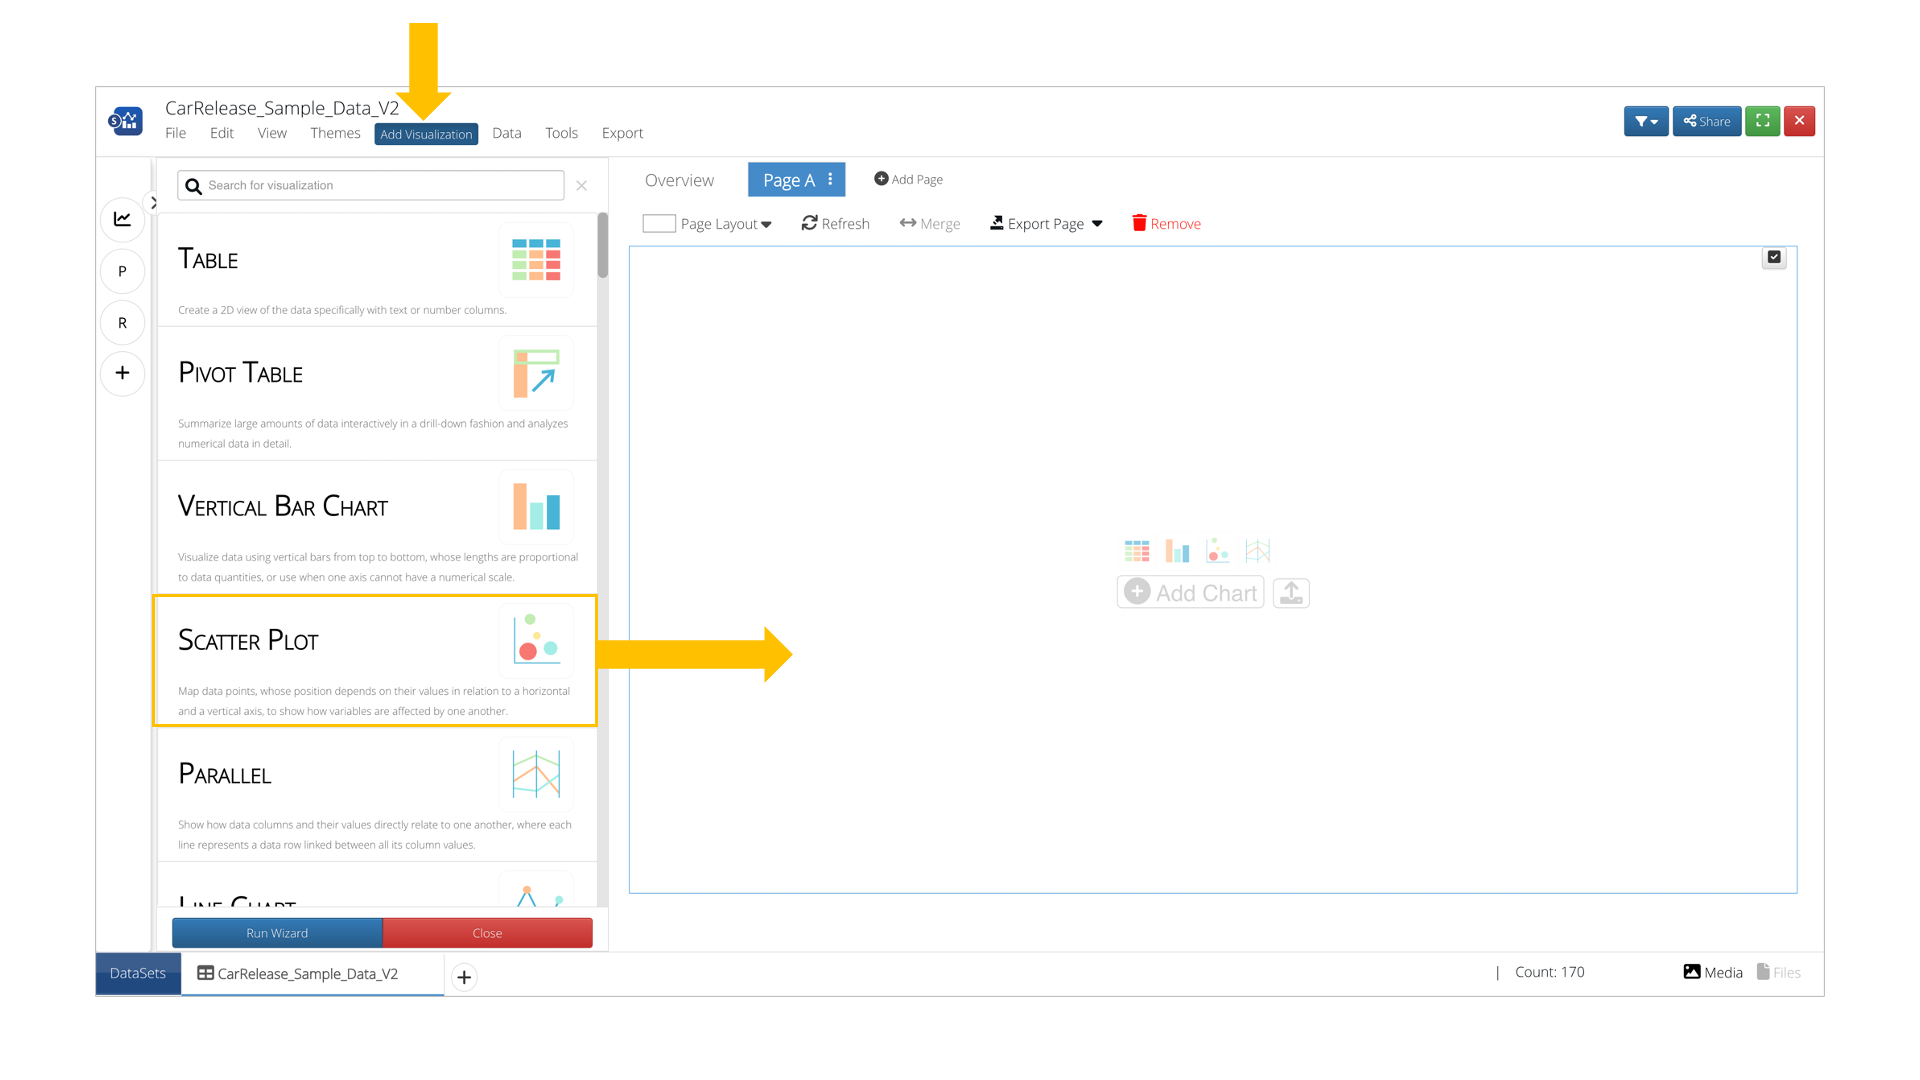
Render Simple Chart - Adding a New Chart
Choose Release Date for the X Data By and Brands for the Y Data By in simple options to render the chart. We can choose accept or click on advanced to see more options.
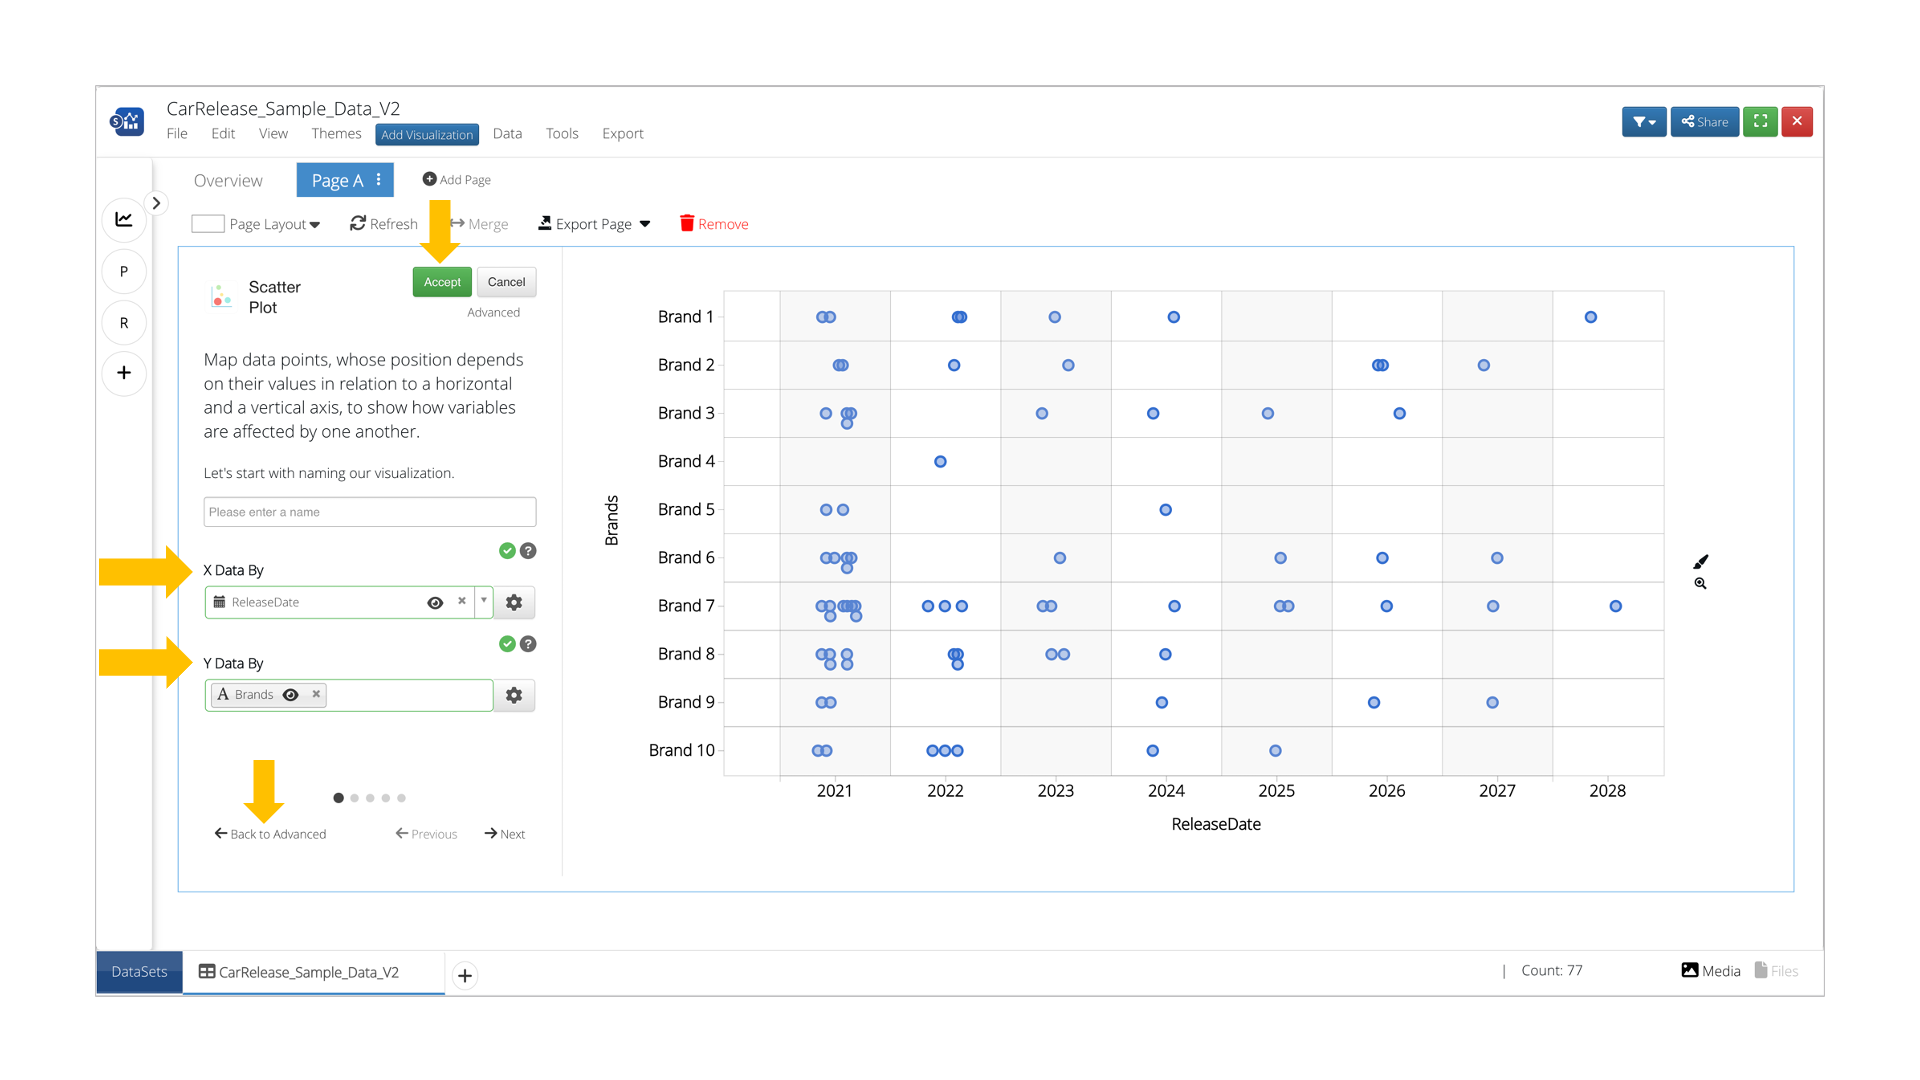
Render Simple Chart - Adding Basic Options
If we navigate to advanced, we can make customizations such as Color By Platforms. Use the 6 tabs at the bottom to review all available options.
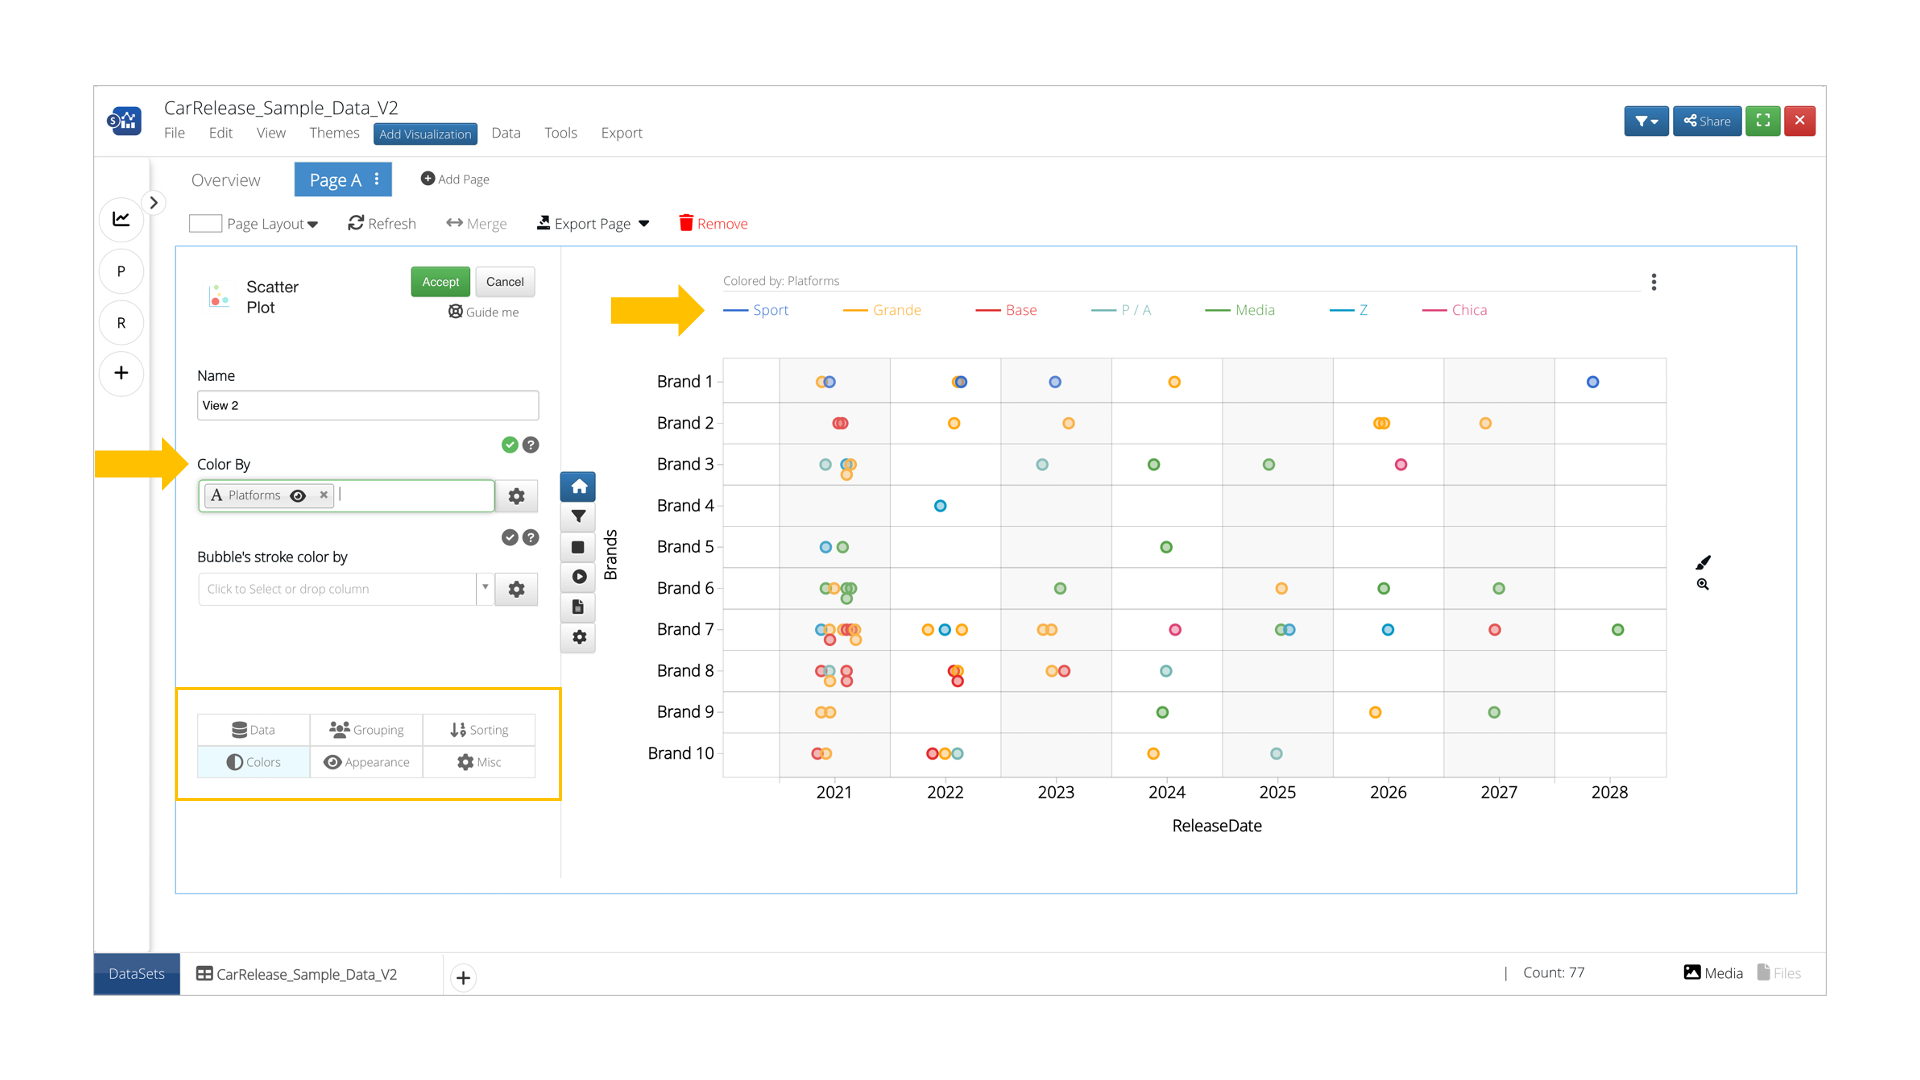
Explore Additional Options
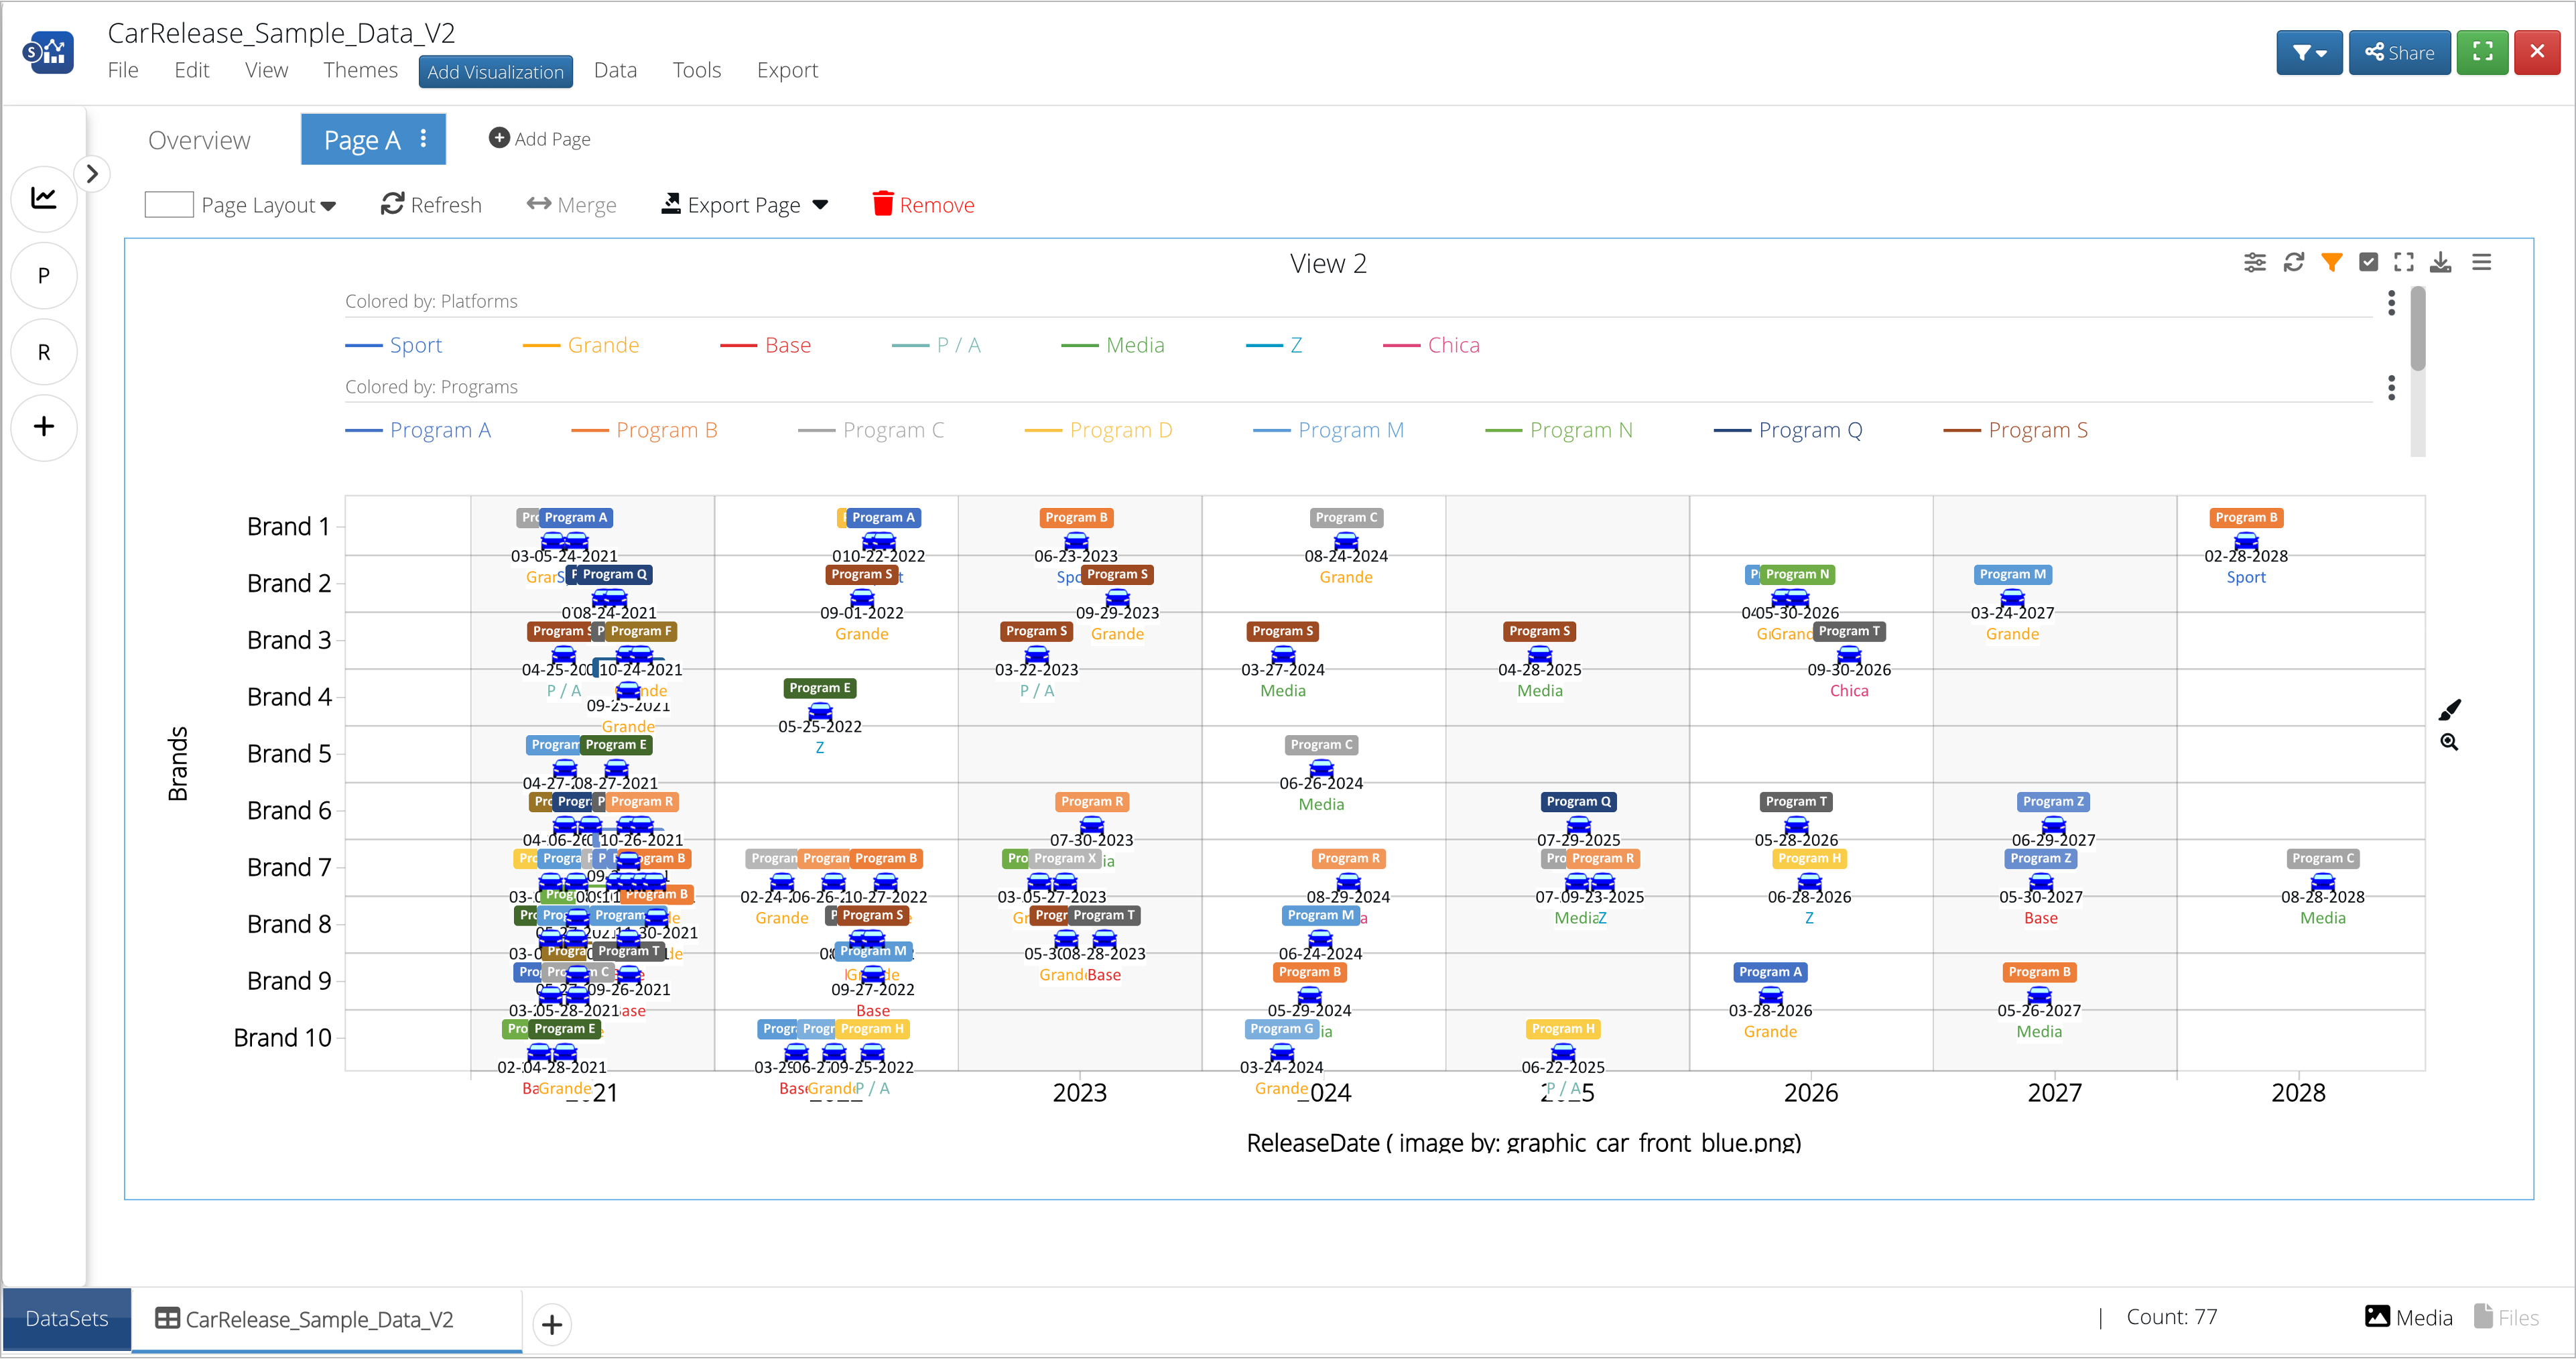
Here is an example Car Release chart.
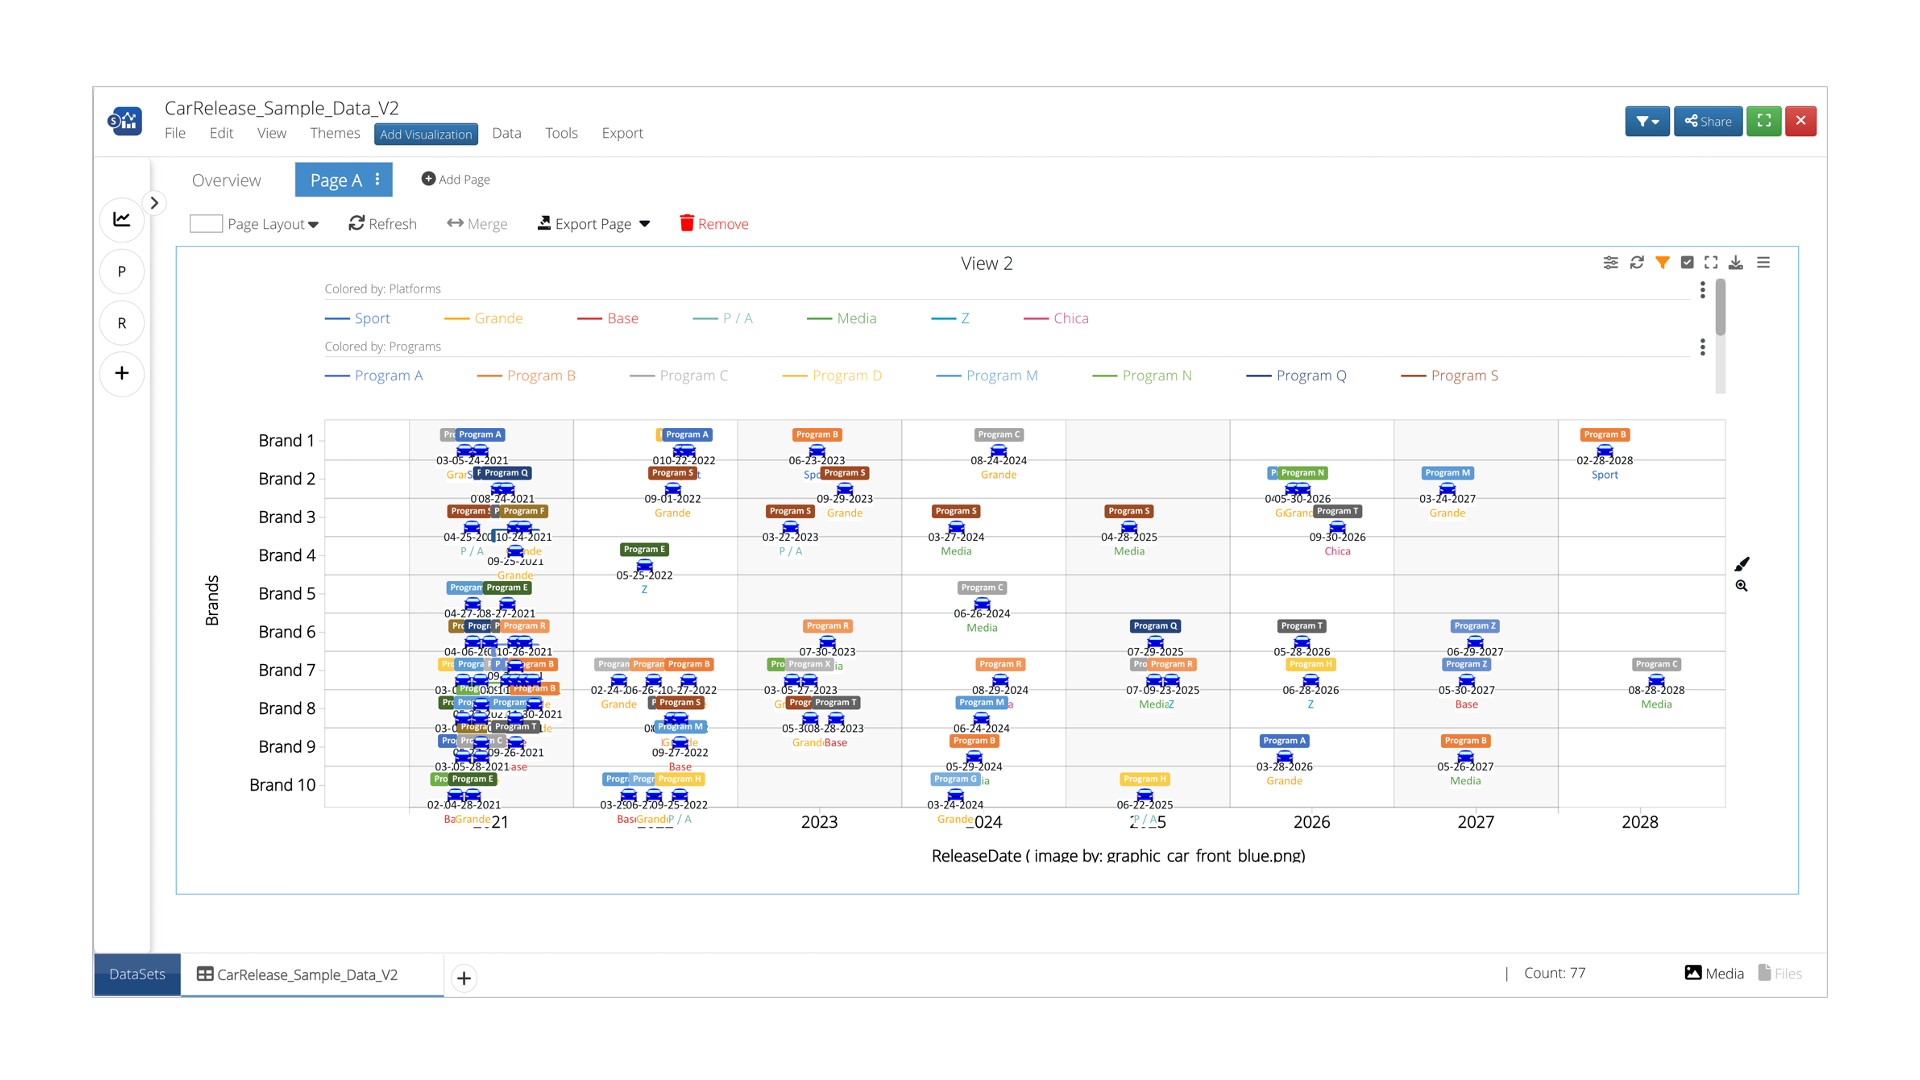
Example of a LRP Chart
Exporting, Sharing & Saving
- Find all exporting options for the dataset under the Export menu.
- Create a public link to share the full dataset to anyone.
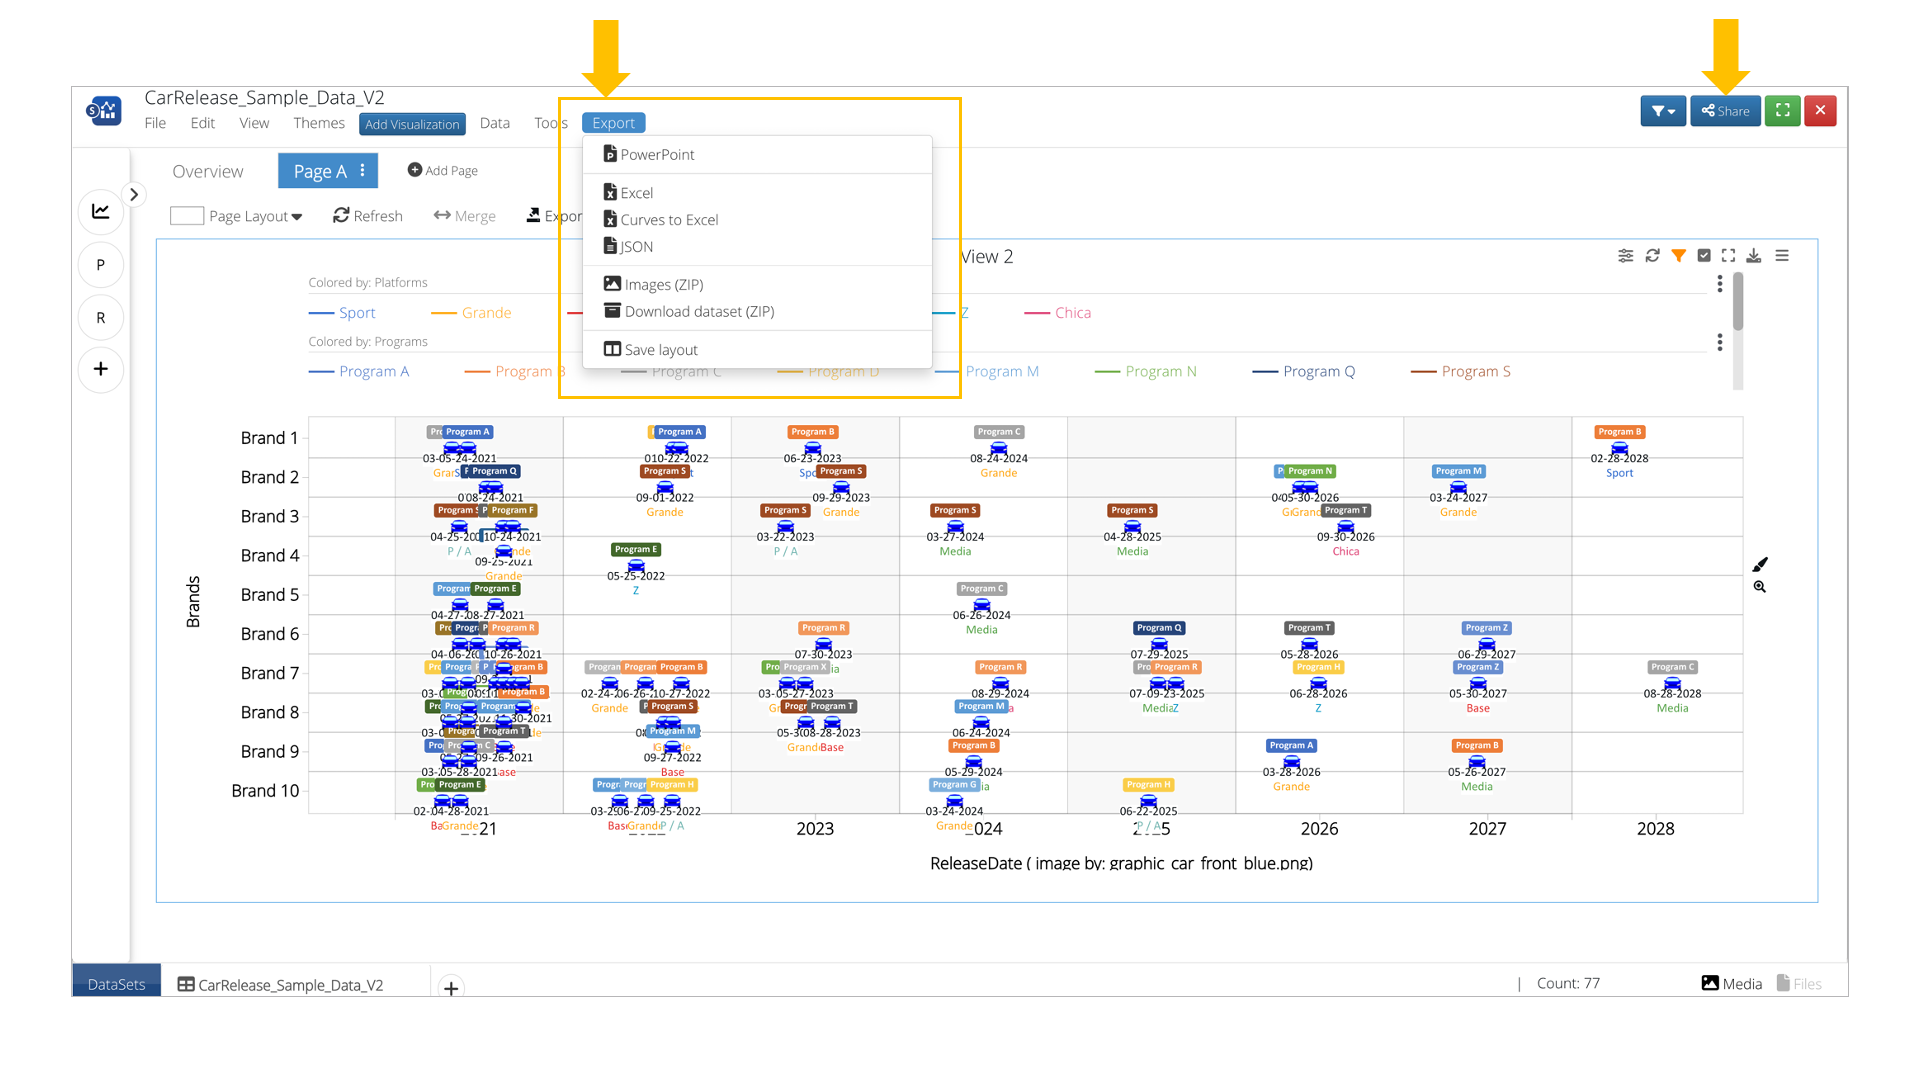
Exporting and Sharing Datasets
Choose “Share Dataset”. Fill out any desired optional specifications. Then, hit “Share”.
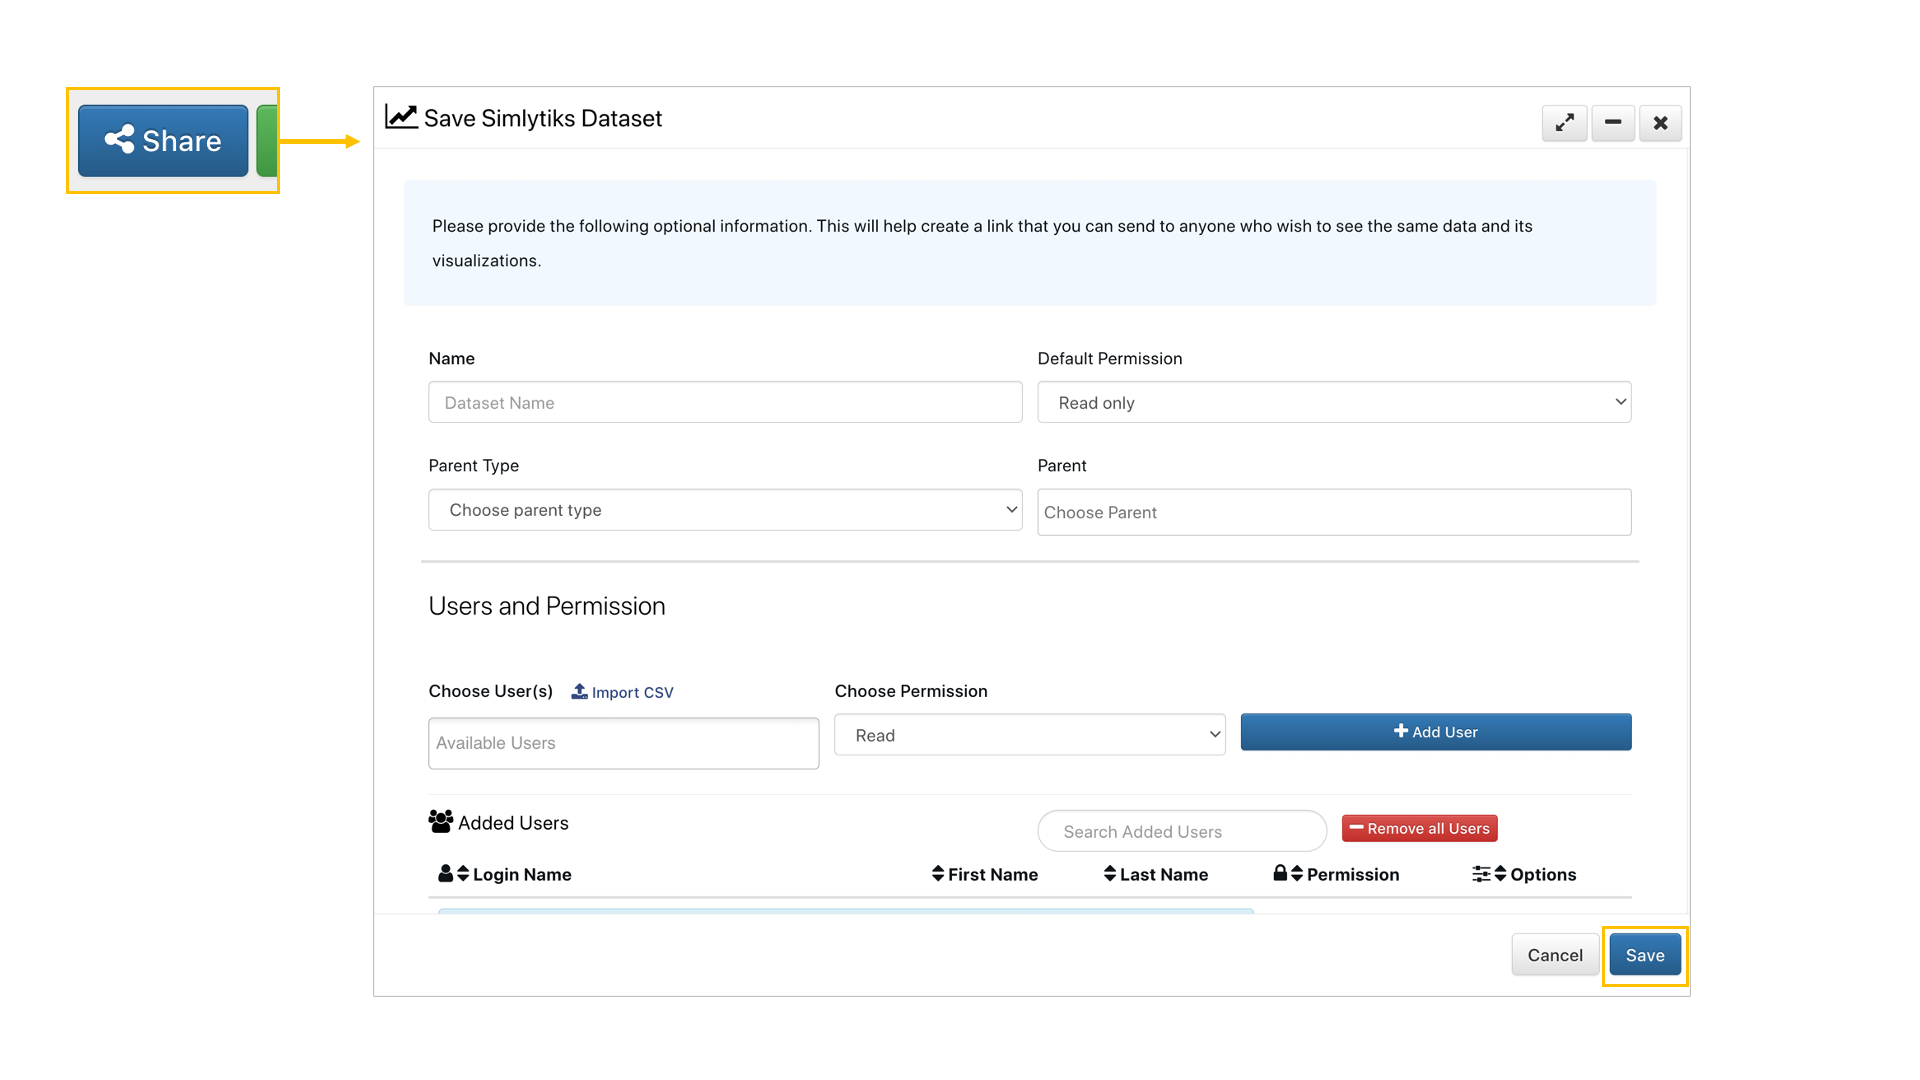
Sharing a Dataset
Copy and share the provided link with anyone.
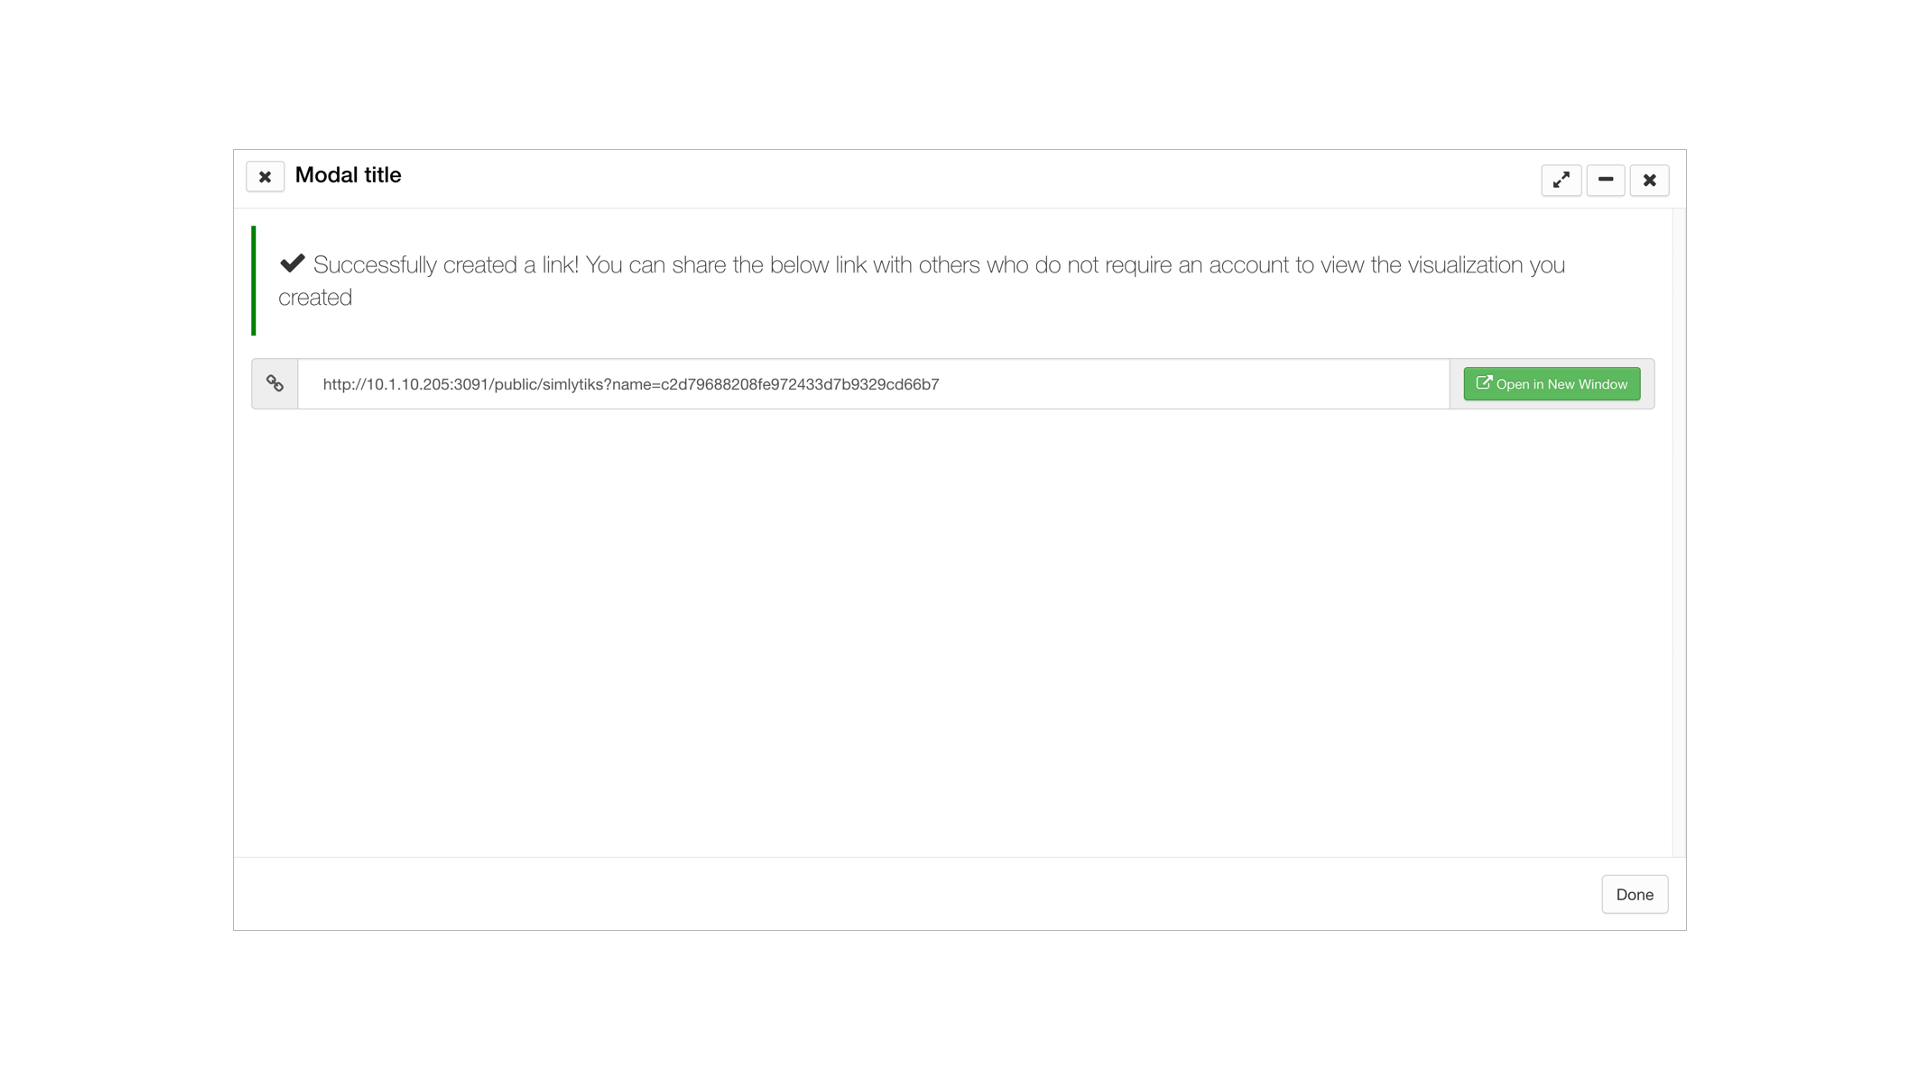
Sharing a Dataset
Save the dataset under the File Menu.
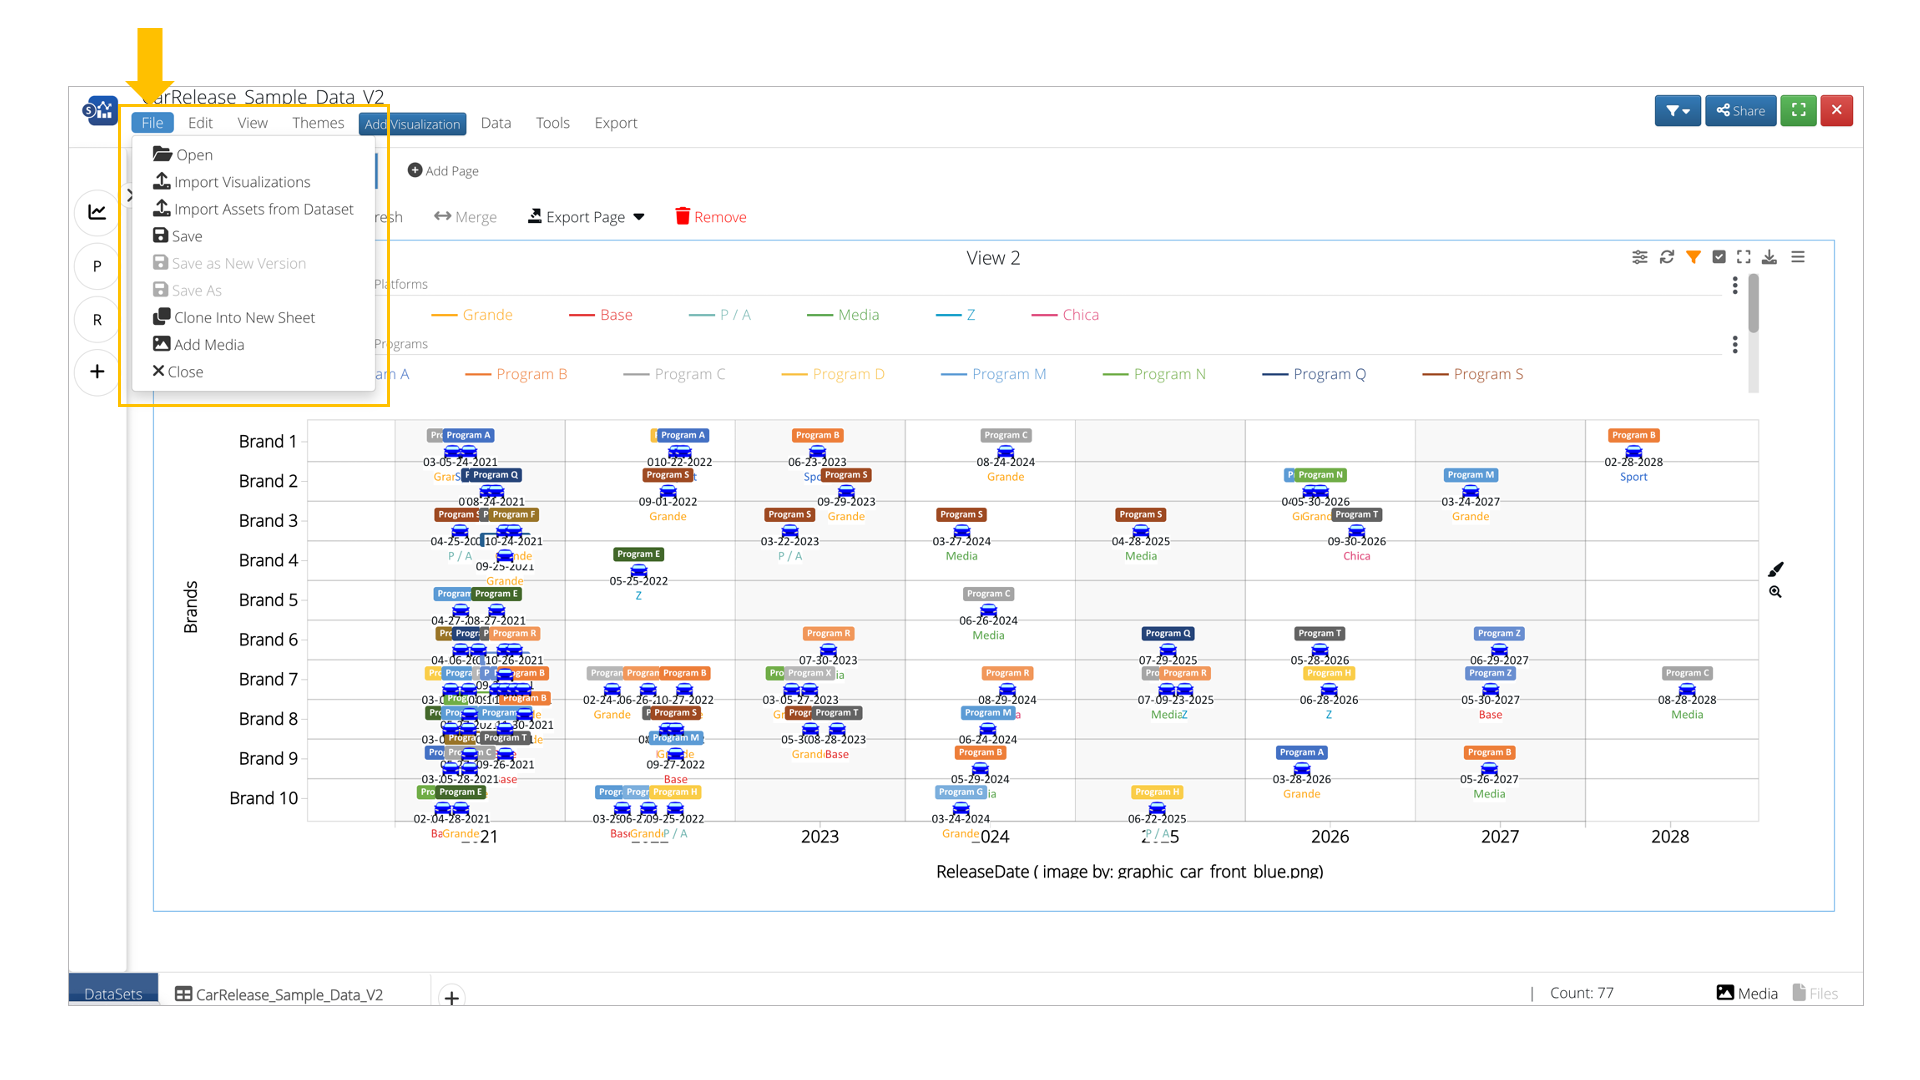
Saving the Simlytiks Exploration
Fill out specifications and choose ”Save”.
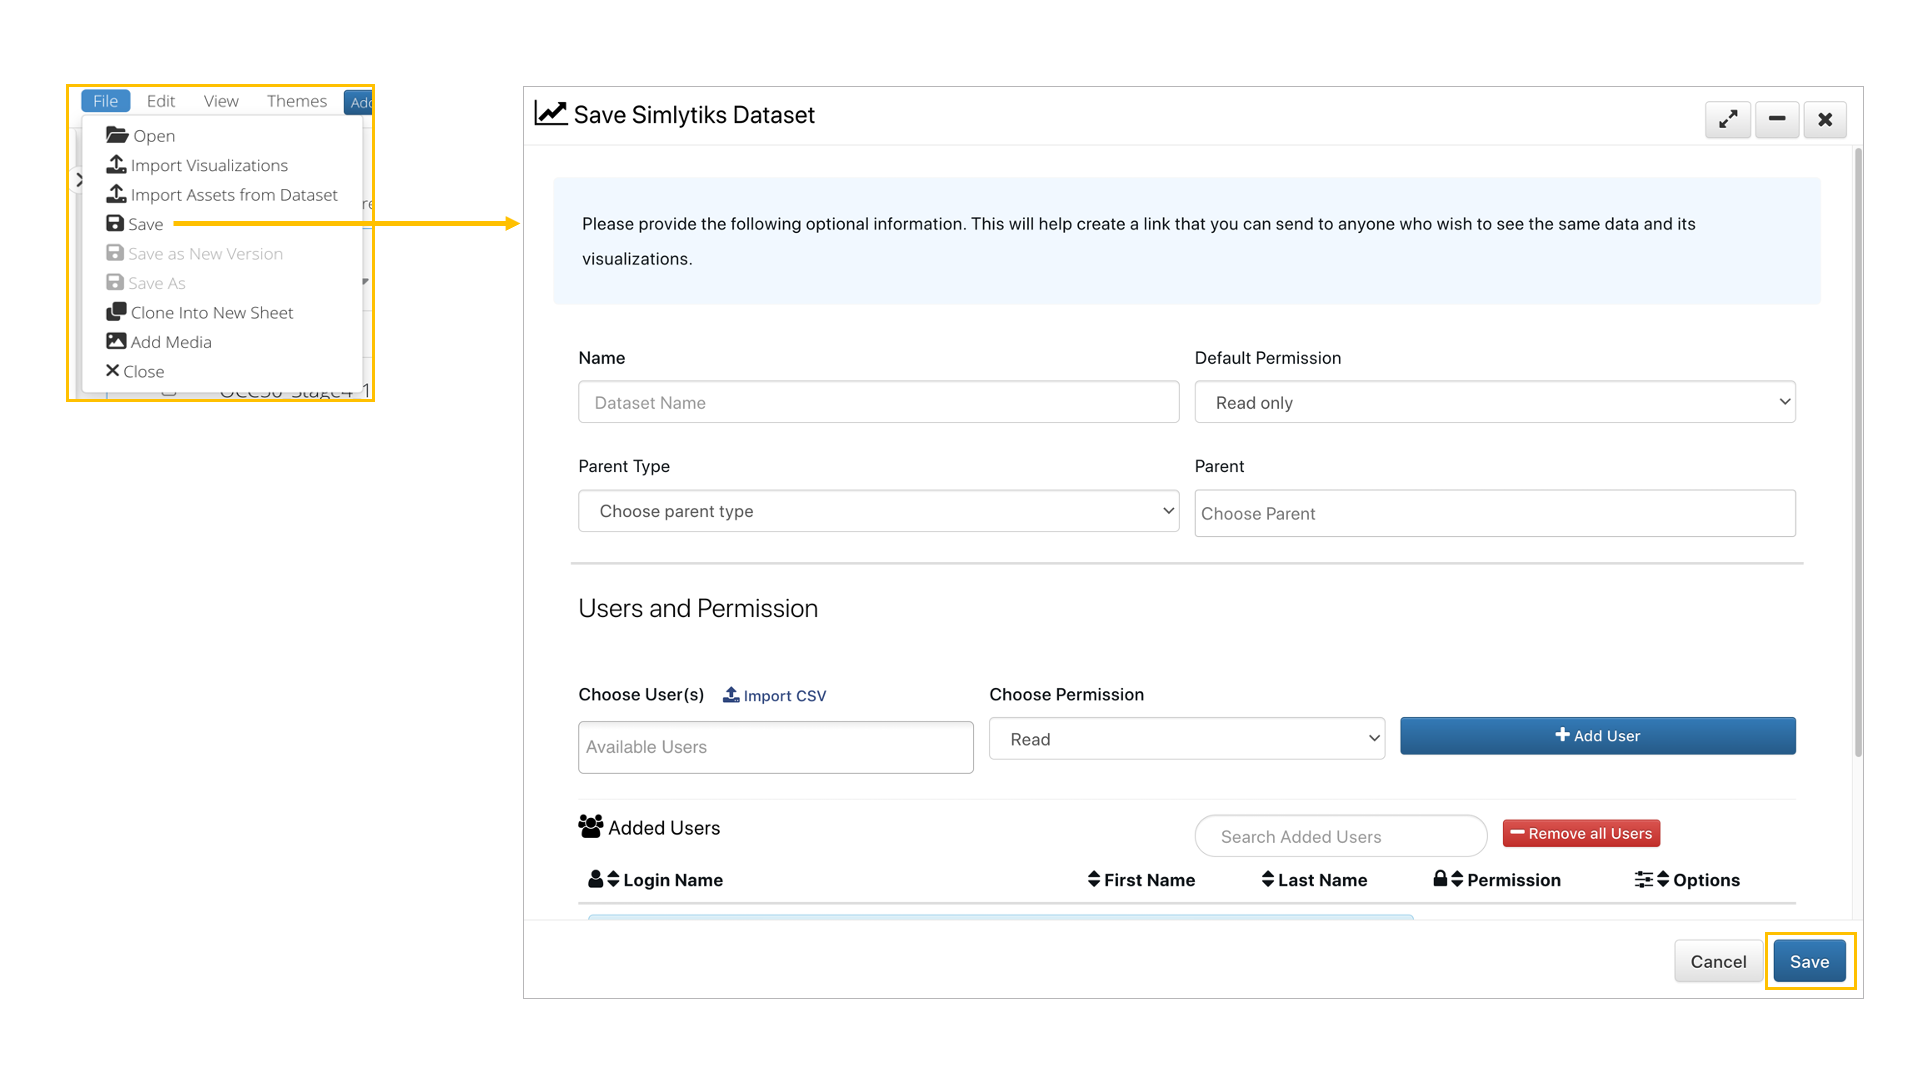
Saving the Simlytiks Exploration
How to Create a QQ Plot Data
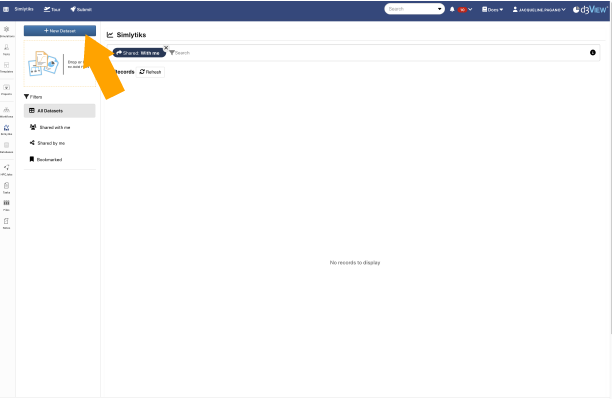
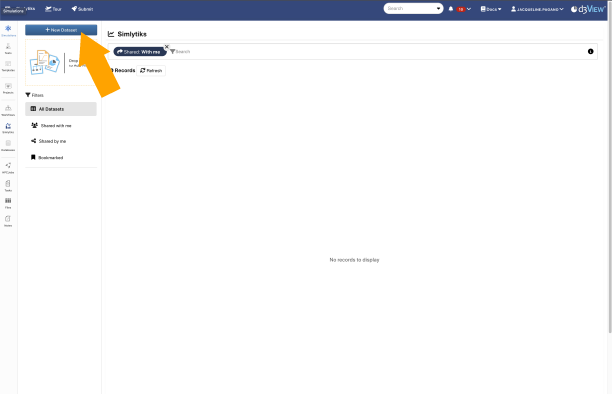
1.) In Simlytiks, click on new dataset.
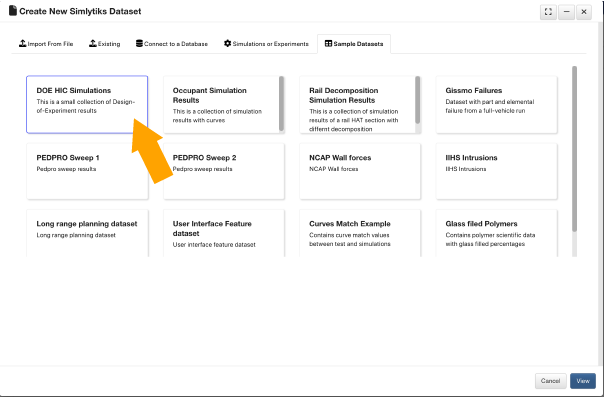
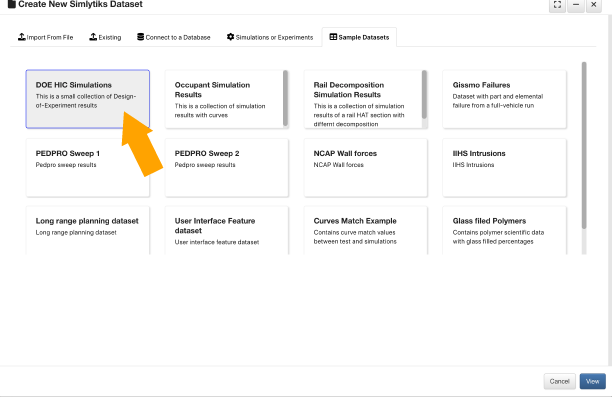
2.) Under sample datasets, click DOE HIC Simulations
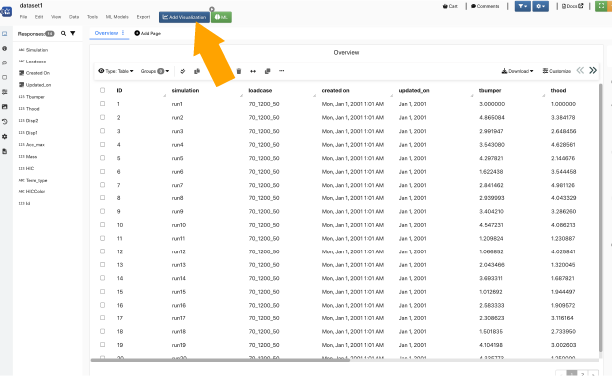
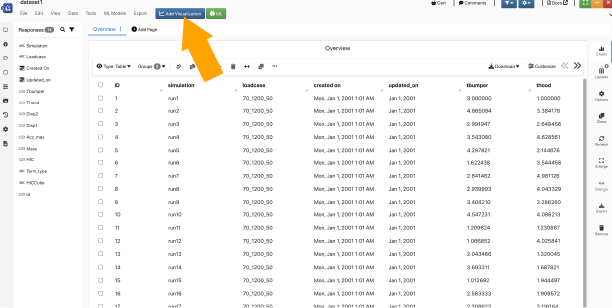
3.)Click Add Visualization
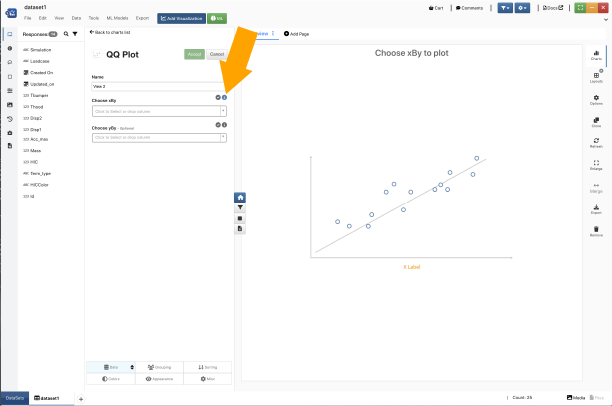
4.) Type in “qqplot” in the searcher and click QQ Plot
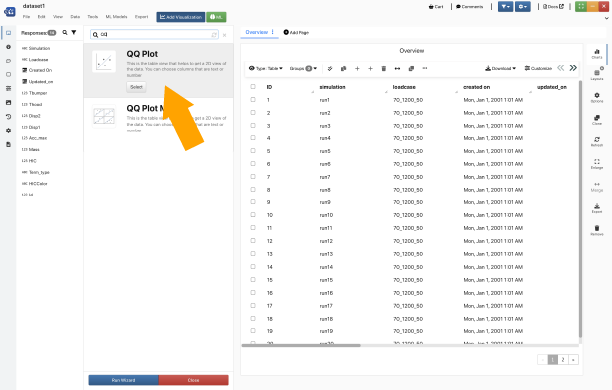
Clicking on the “I” symbol next to the “Choose xBy” bar will visualize what that option will do
How to Create 2D Contour Terrain Columns
1.) In Simlytiks, click on new dataset.
2.) Under sample datasets, click DOE HIC Simulations
3.)Click Add Visualization
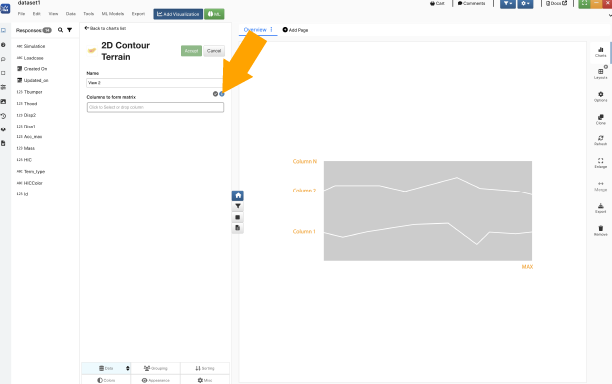
4.) Type in “2d contour” in the searcher and click 2D Contour Terrain
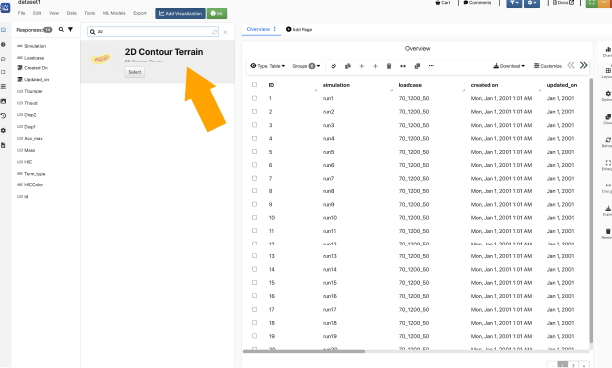
Clicking on the “I” symbol next to the “Columns to Form Matrix” bar will visualize what that option will do
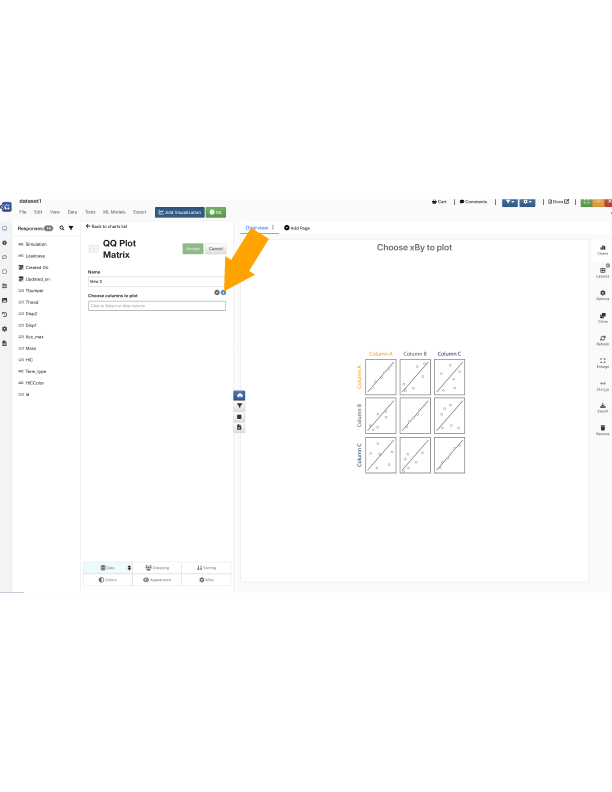
How to Create QQ Plot Matrix Columns
1.) In Simlytiks, click on new dataset.
2.) Under sample datasets, click DOE HIC Simulations
3.)Click Add Visualization
4.) Type in “qq plot” in the searcher and click QQ Plot Matrix
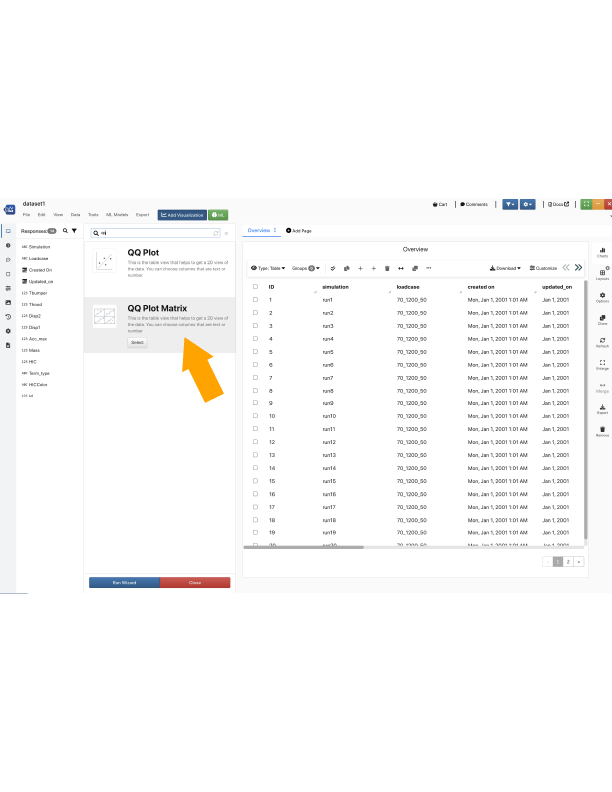
Clicking on the “I” symbol next to the “Choose Columns to Plot” bar will visualize what that option will do
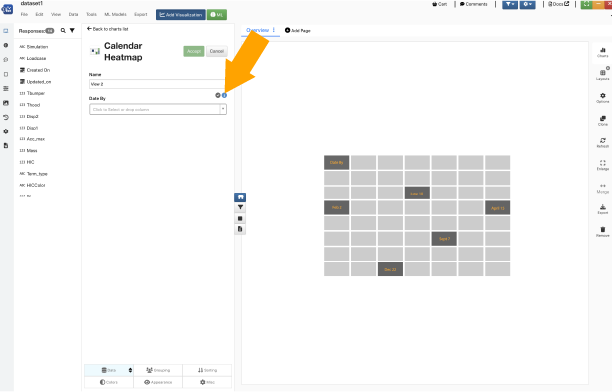
How to Create Dates for a Calendar Heat Map
1.) In Simlytiks, click on new dataset.
2.) Under sample datasets, click DOE HIC Simulations
3.)Click Add Visualization
4.) Type in “calendar” in the searcher and click Calendar Heatmap
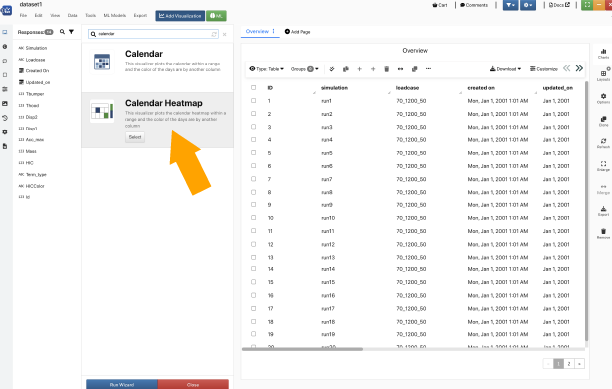
Clicking on the “I” symbol next to the “Date By” bar will visualize what that option will do
How to Create Dates for a Calendar Heat Map
1.) In Simlytiks, click on new dataset.
2.) Under sample datasets, click DOE HIC Simulations
3.)Click Add Visualization
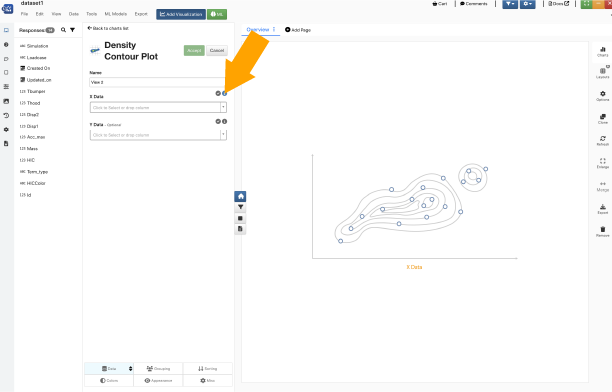
4.) Type in “density” in the searcher and click Density Contour Plot
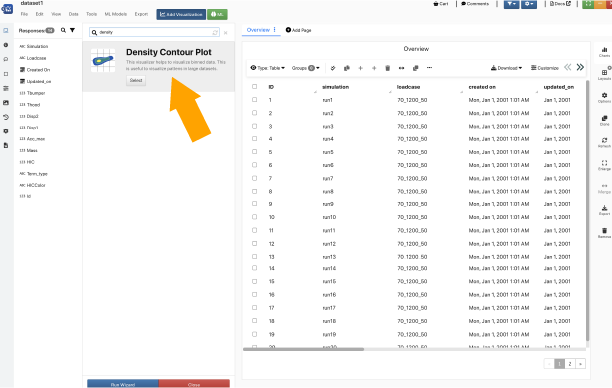
Clicking on the “I” symbol next to the “X Data” bar will visualize what that option will do