
5.  Viewing, Organizing & Customizing Datasets
For this section, we’ll be going over how to view, organize and customize our data after we import it into Simlytiks.
Viewing Fruit Dataset Data Columns
Our Dataset
For this tutorial, we’ll be exploring this simple dataset on fruits.
| Climate | Fruit | Type | Location | Percentage |
|---|---|---|---|---|
| temperate | cherry | Tart | Michigan, USA | 0.75 |
| tropical | banana | Plantain | Hawaii, USA | 0.3 |
| subtropical | orange | Navel | Florida, USA | 0.5 |
| temperate | apple | Gala | Washington State, USA | 0.24 |
| tropical | banana | Hawaii Apple | Hawaii, USA | 0.47 |
| subtropical | orange | Valencia | California, USA | 0.17 |
| temperate | blueberry | Highbush | Michigan, USA | 0.32 |
| temperate | grape | Flame Seedless | California, USA | 0.18 |
| temperate | apple | Red Delicious | Washington State, USA | 0.34 |
| tropical | banana | Cuban Red | Hawaii, USA | 0.8 |
Once we import our data, we can view it as a dataset on Simlytiks and organize it however we like. Initially, Simlytiks organizes the data into data columns (responses) and presents an overview table as the first page in the dashboard.
Simlytiks Views
Simlytiks interface can be viewed in three different ways: Modern, Classic and Slides. Modern View keeps the pages panel as tabs at the top of the page with just responses in the left-side panel; Classic contains them as a tree folder structure in the left-side panel above responses; while, Slides shows them as mini page previews in the left-side panel without responses shown by default.
Modern View
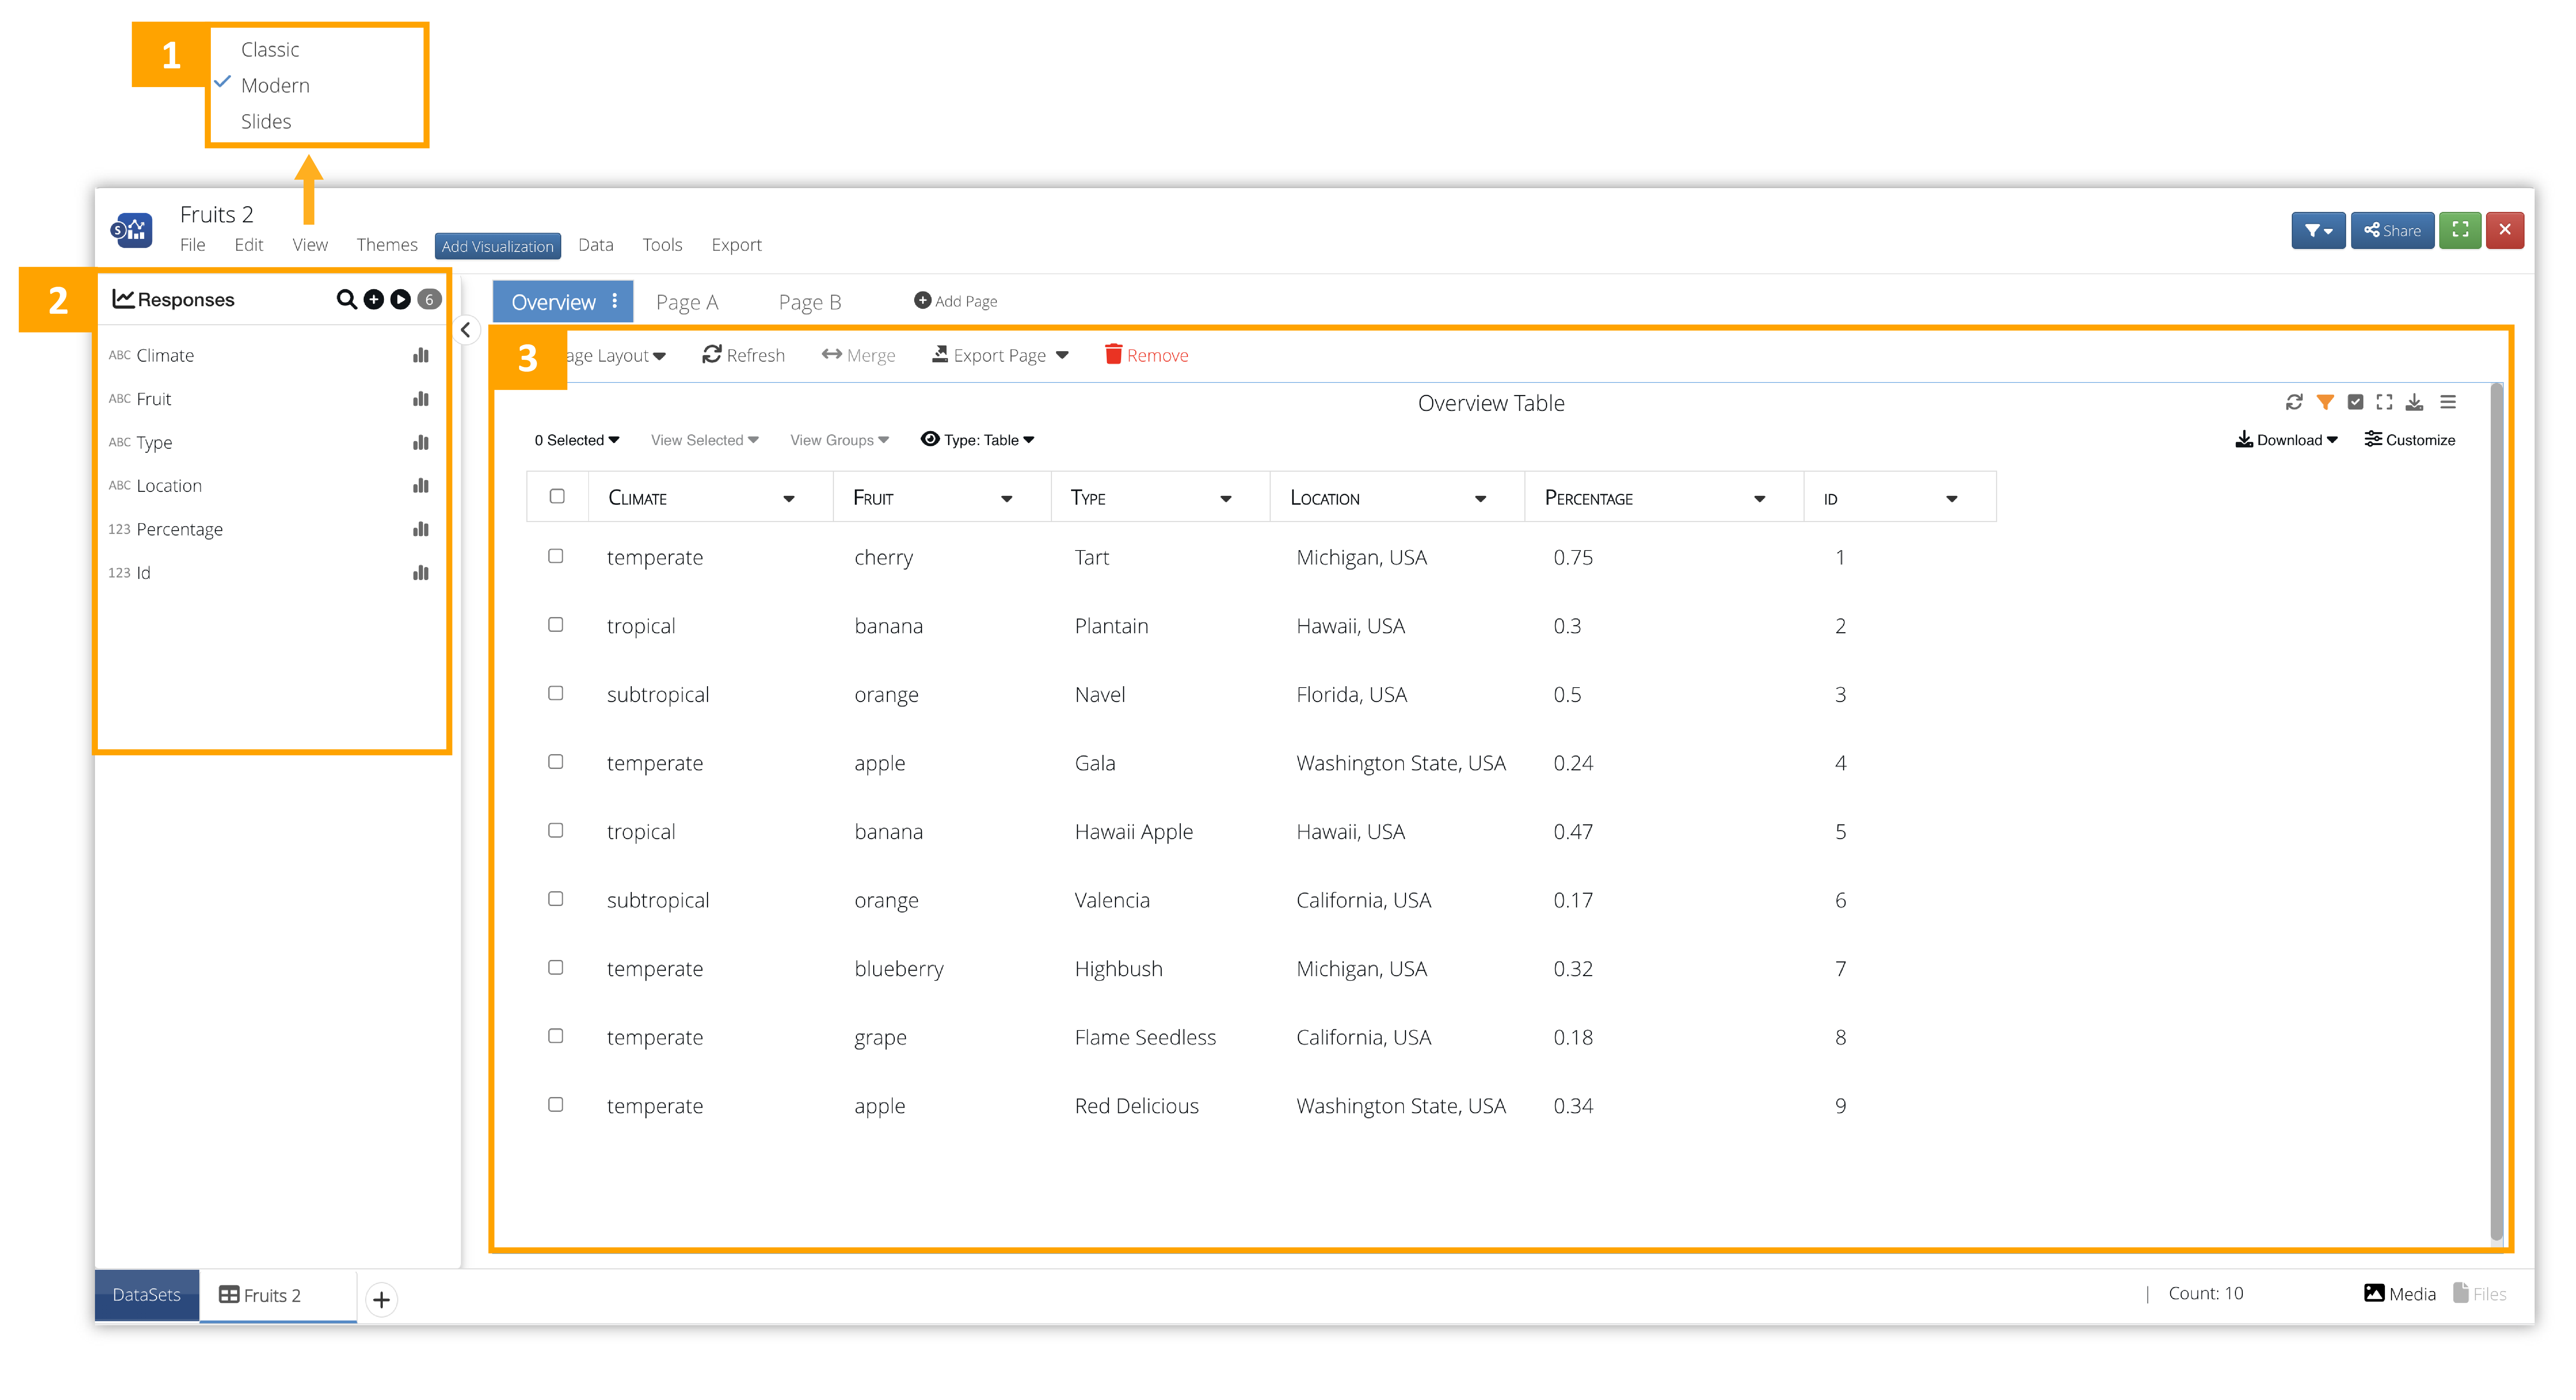
Figure 1: Modern View
- View: Change the user interface style. This is the Modern View.
- Response Panel: This shows all our data columns.
- Overview Table: This is an overview table of all our data.
Modern View also has the option to view all the responses in the dataset by clicking on play button.
Here is a video showing how it works:
Classic View
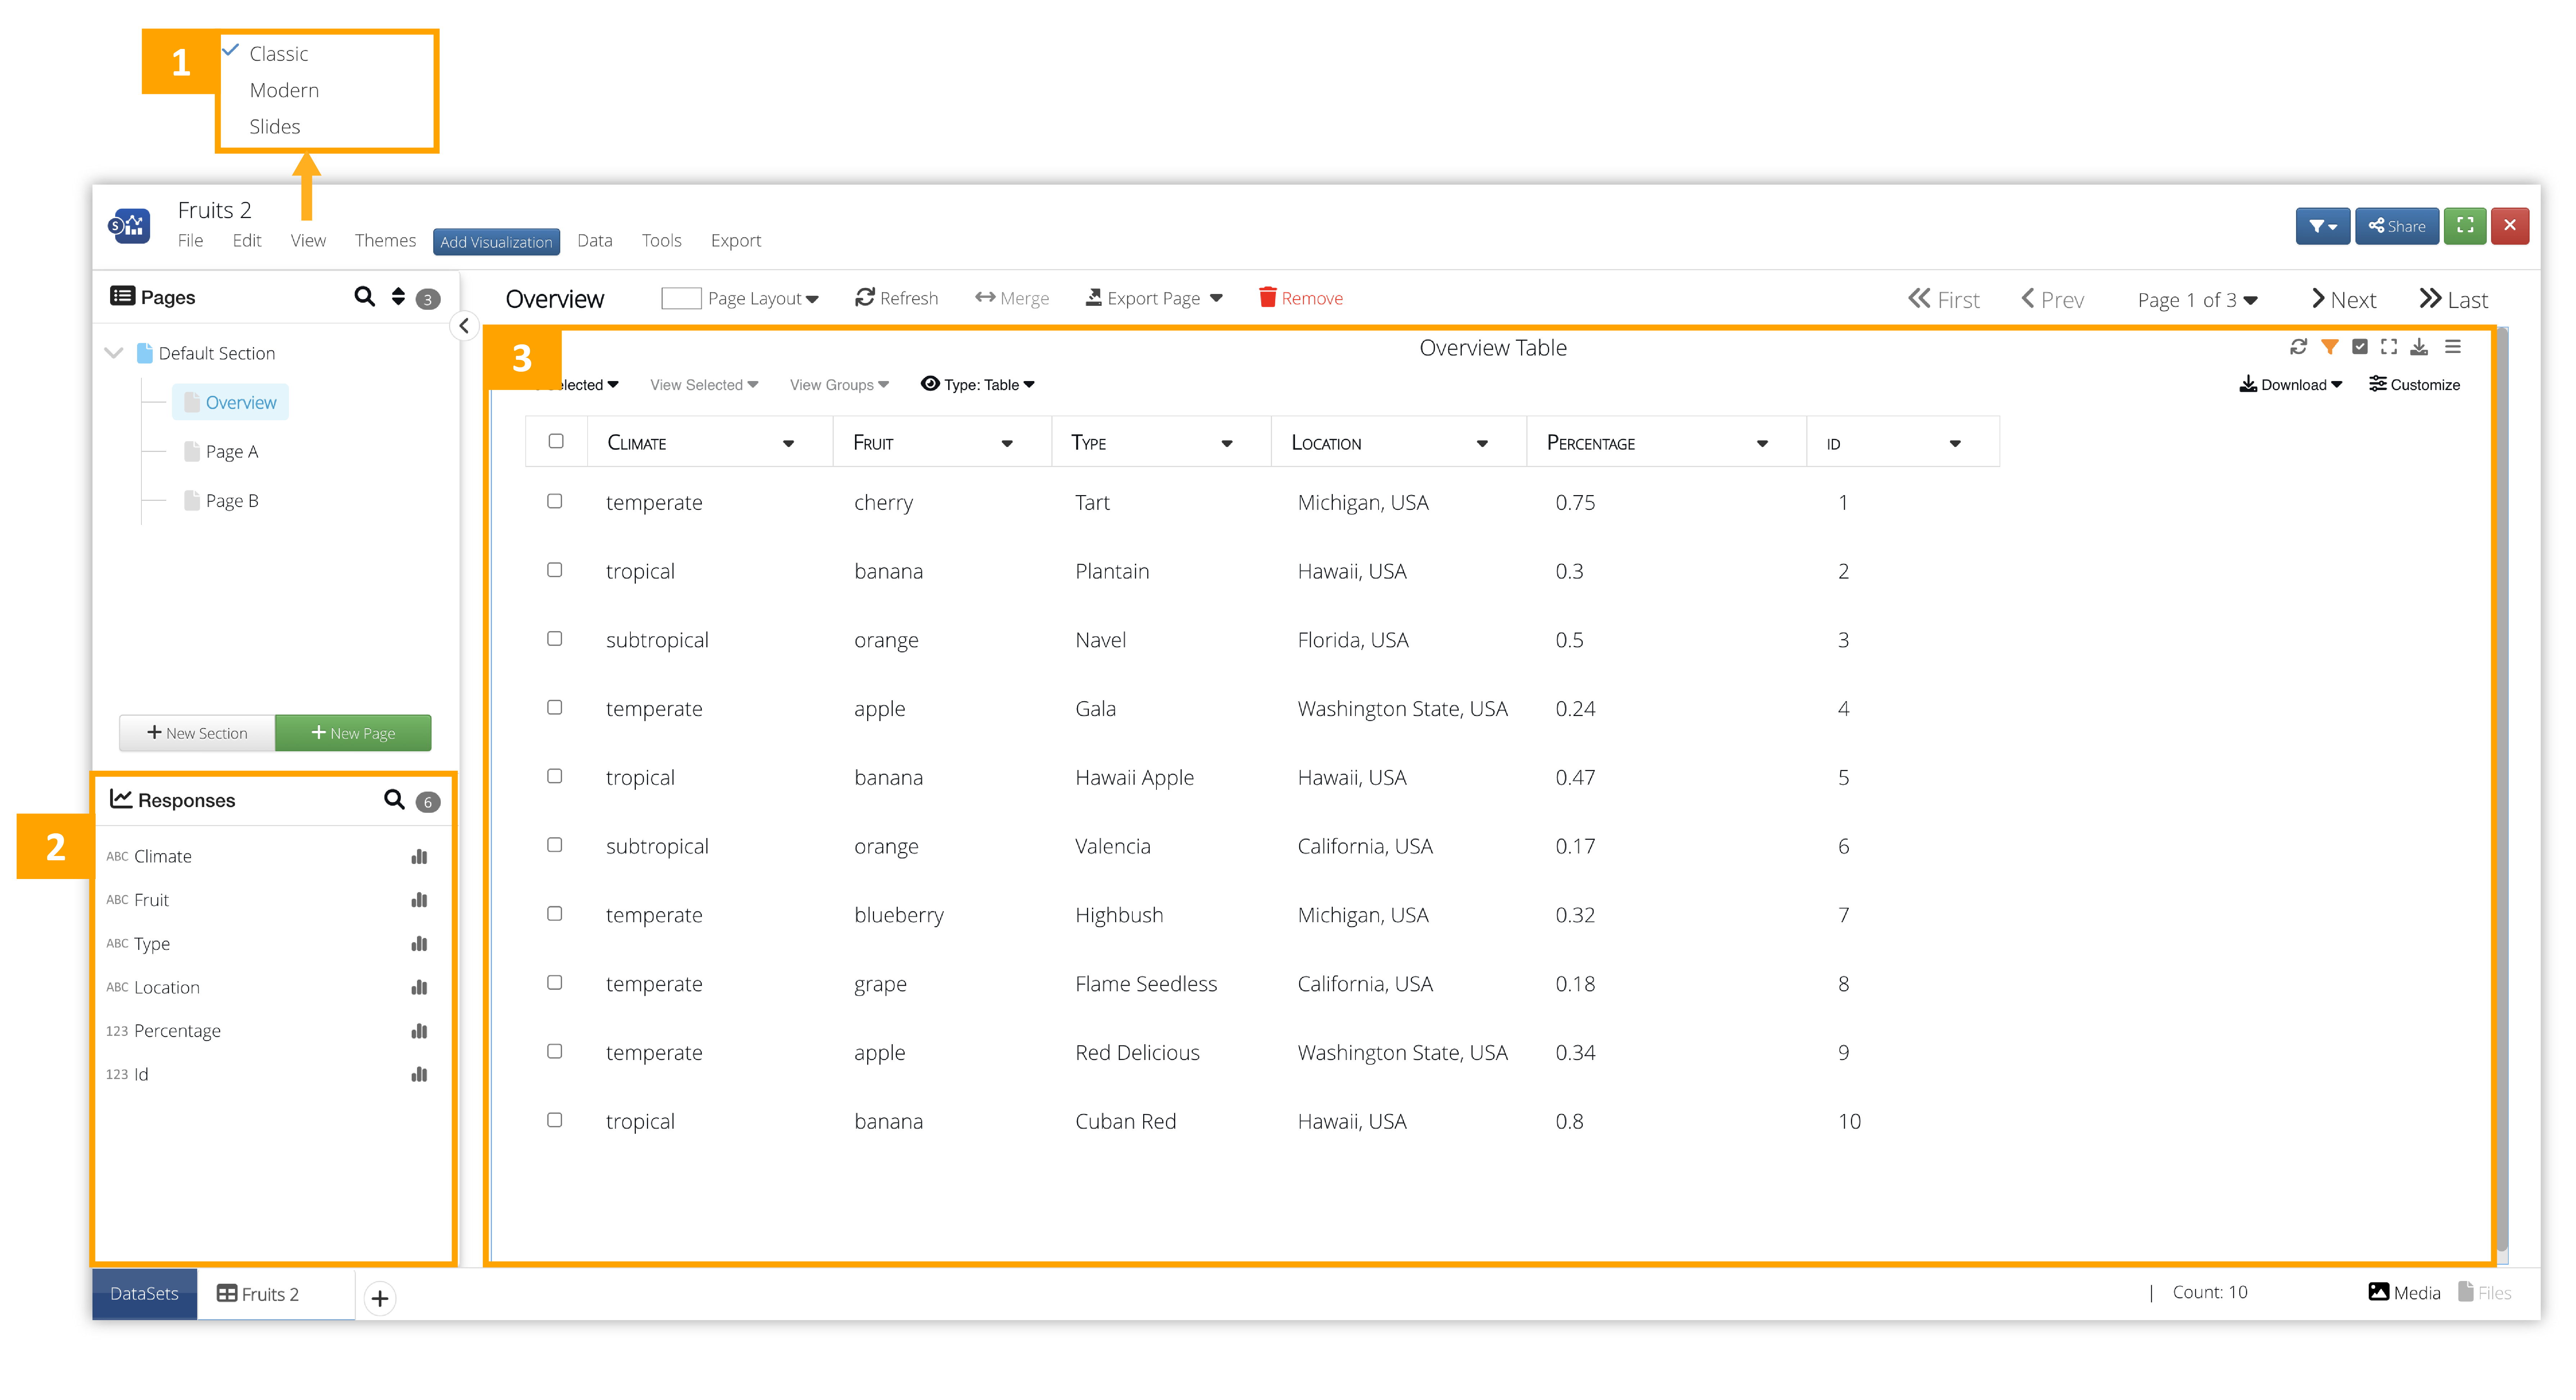
Figure 2: Classic View
- View: Change the user interface style. This is the Classic View.
- Response Panel: This shows all our data columns.
- Overview Table: This is an overview table of all our data.
Slides View
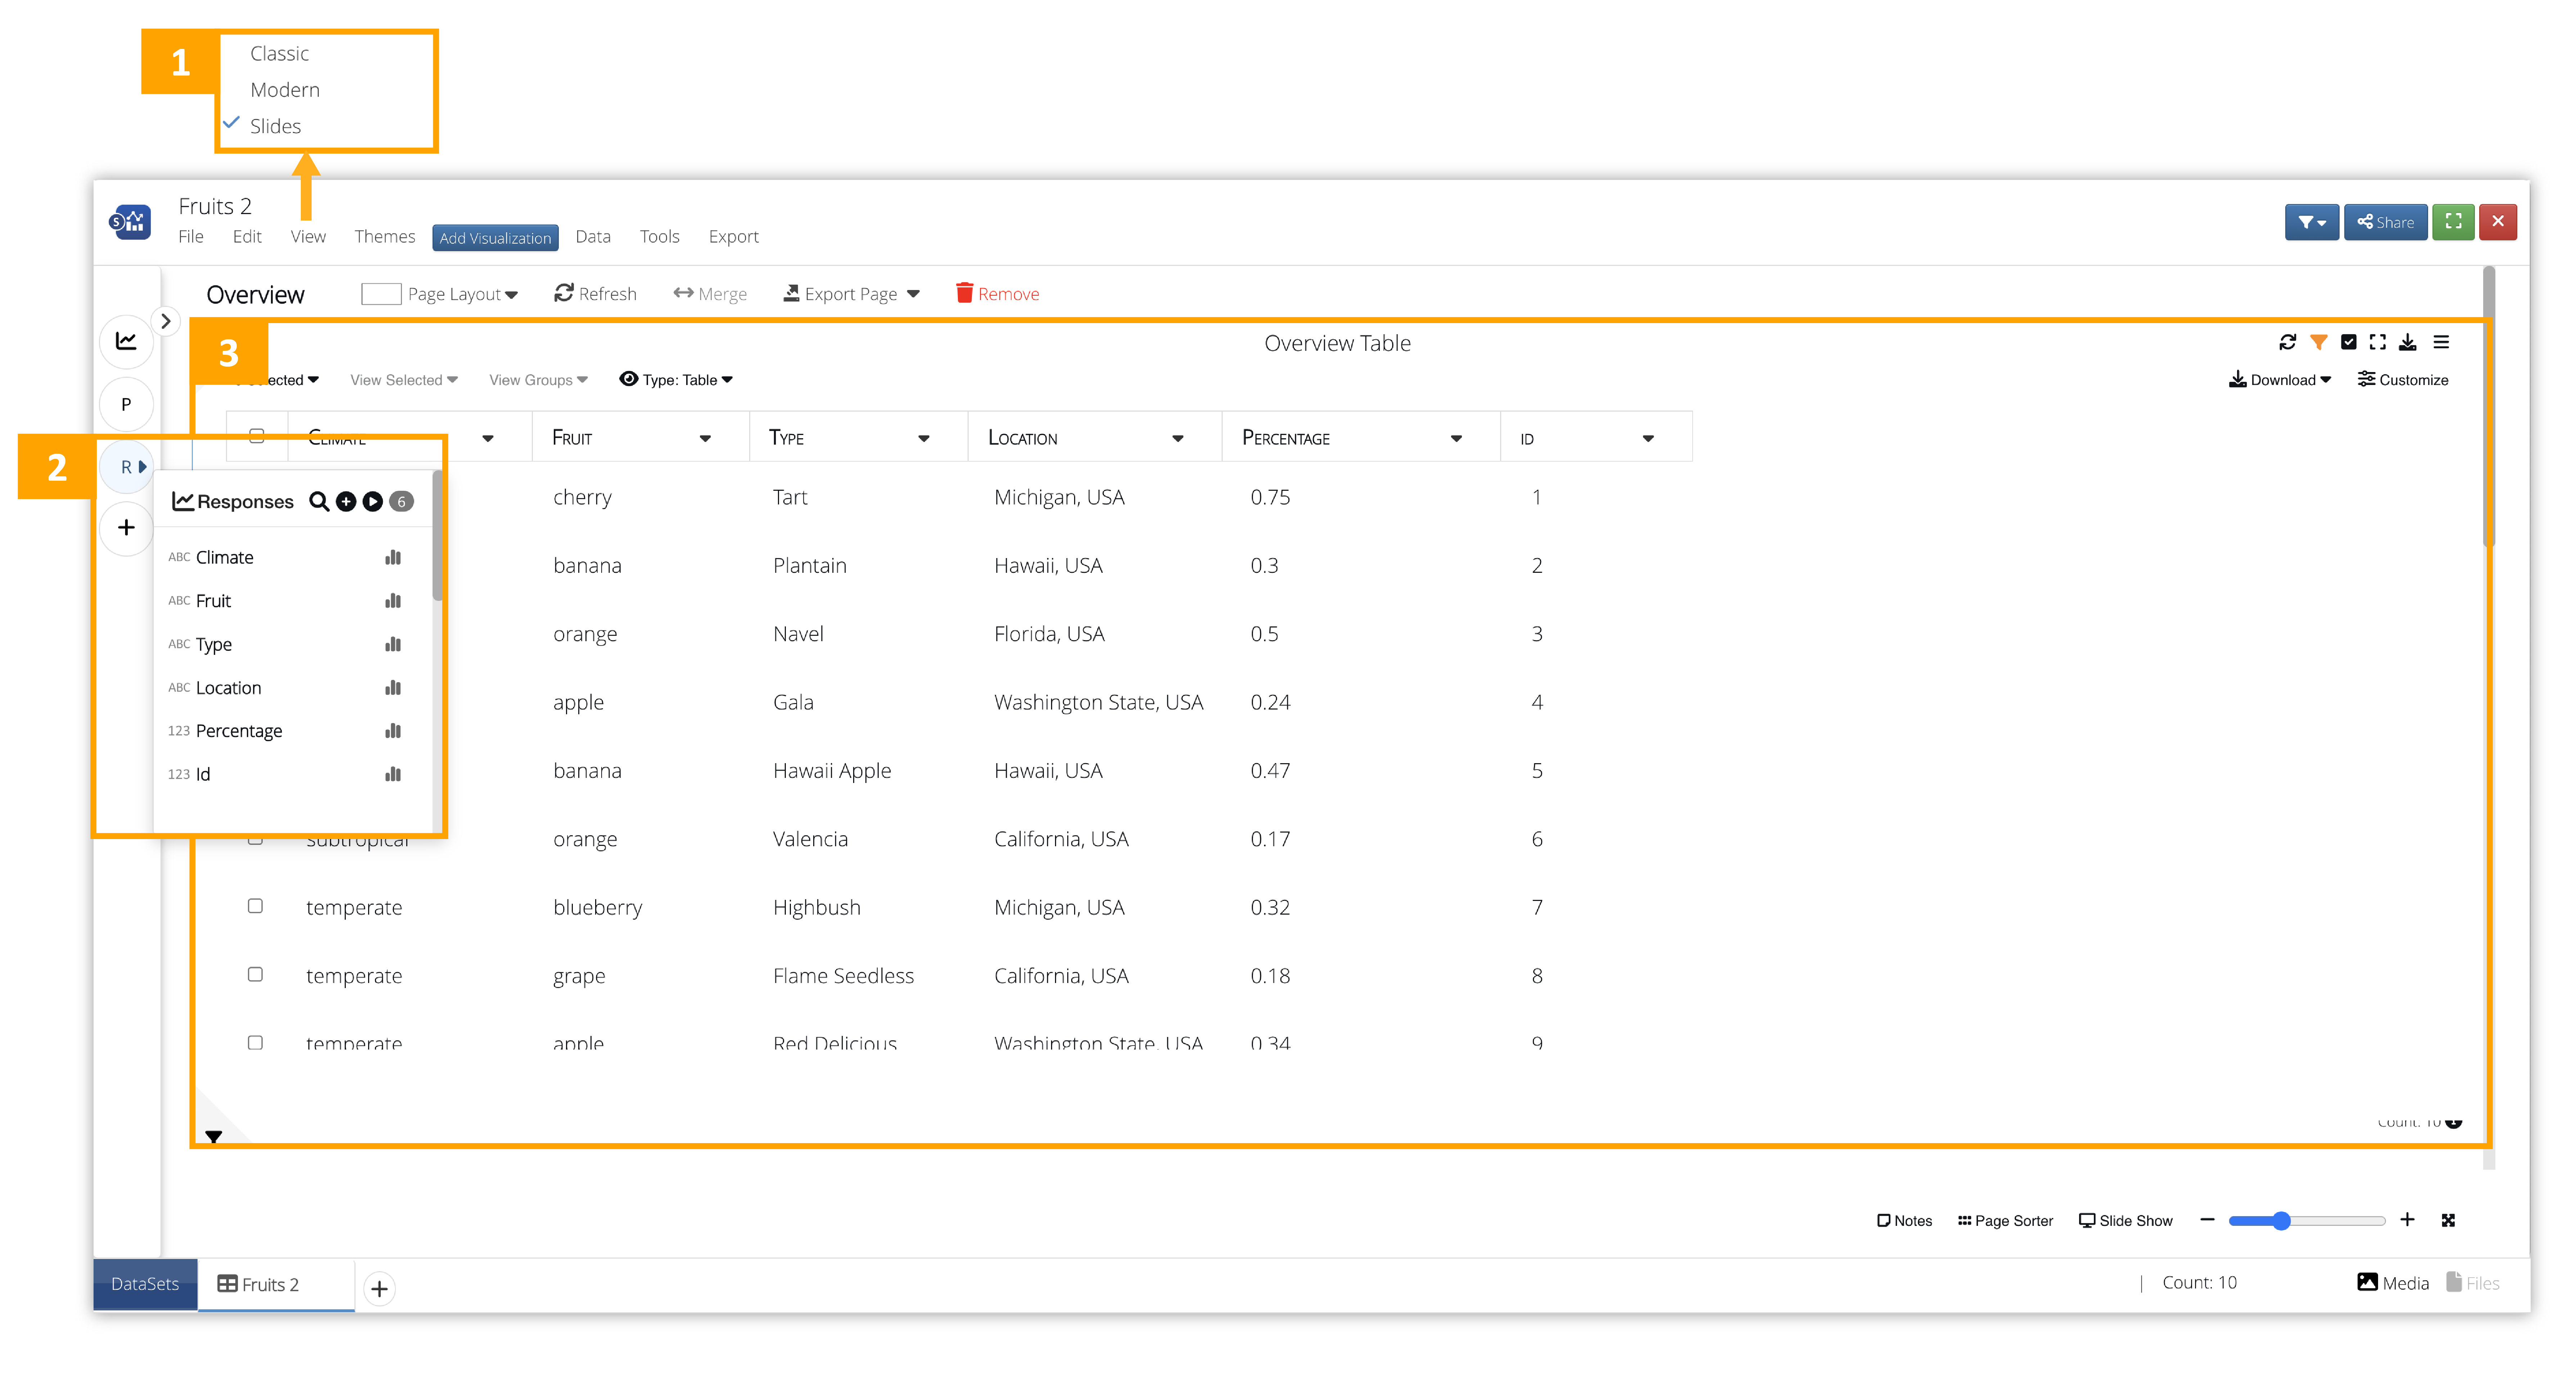
Figure 3: Slides View
- View: Change the user interface style. This is the Slides View.
- Response Panel: This shows all our data columns.
- Overview Table: This is an overview table of all our data.
Pages Full Screen
Click on the full screen view option at the top of a page to get an expanded view of it.
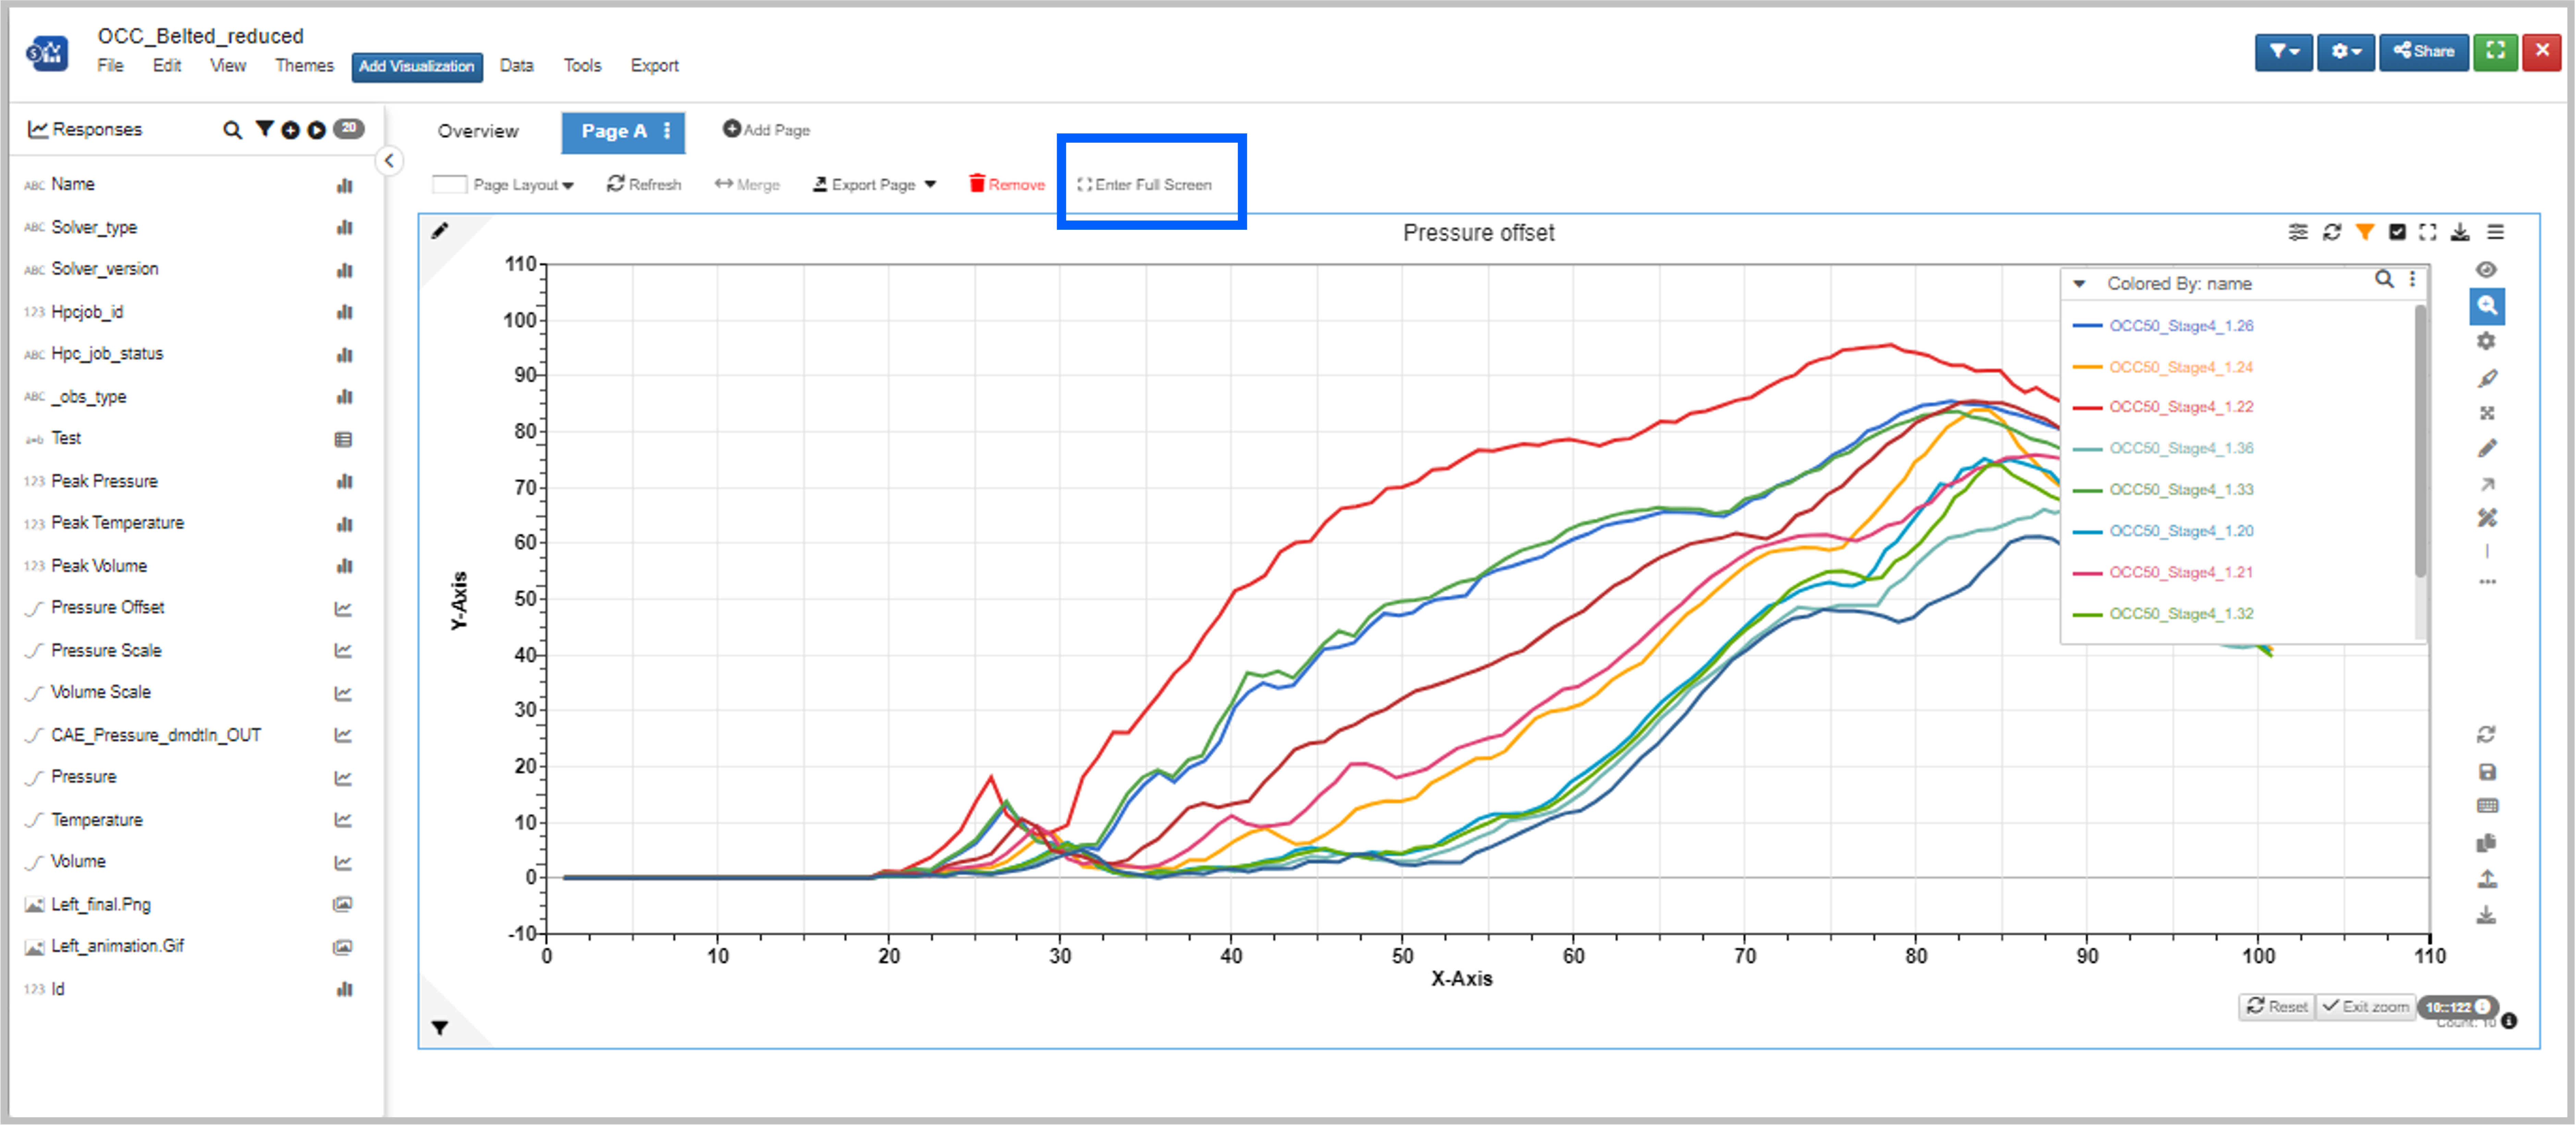
Figure 4: Pages Full Screen
Overview Table
The initial overview table presents our full dataset with all its columns and rows, unless we have a large dataset with a lot of records. These bigger datasets will instead be presented in a summary view instead of a table as shown in the image below:
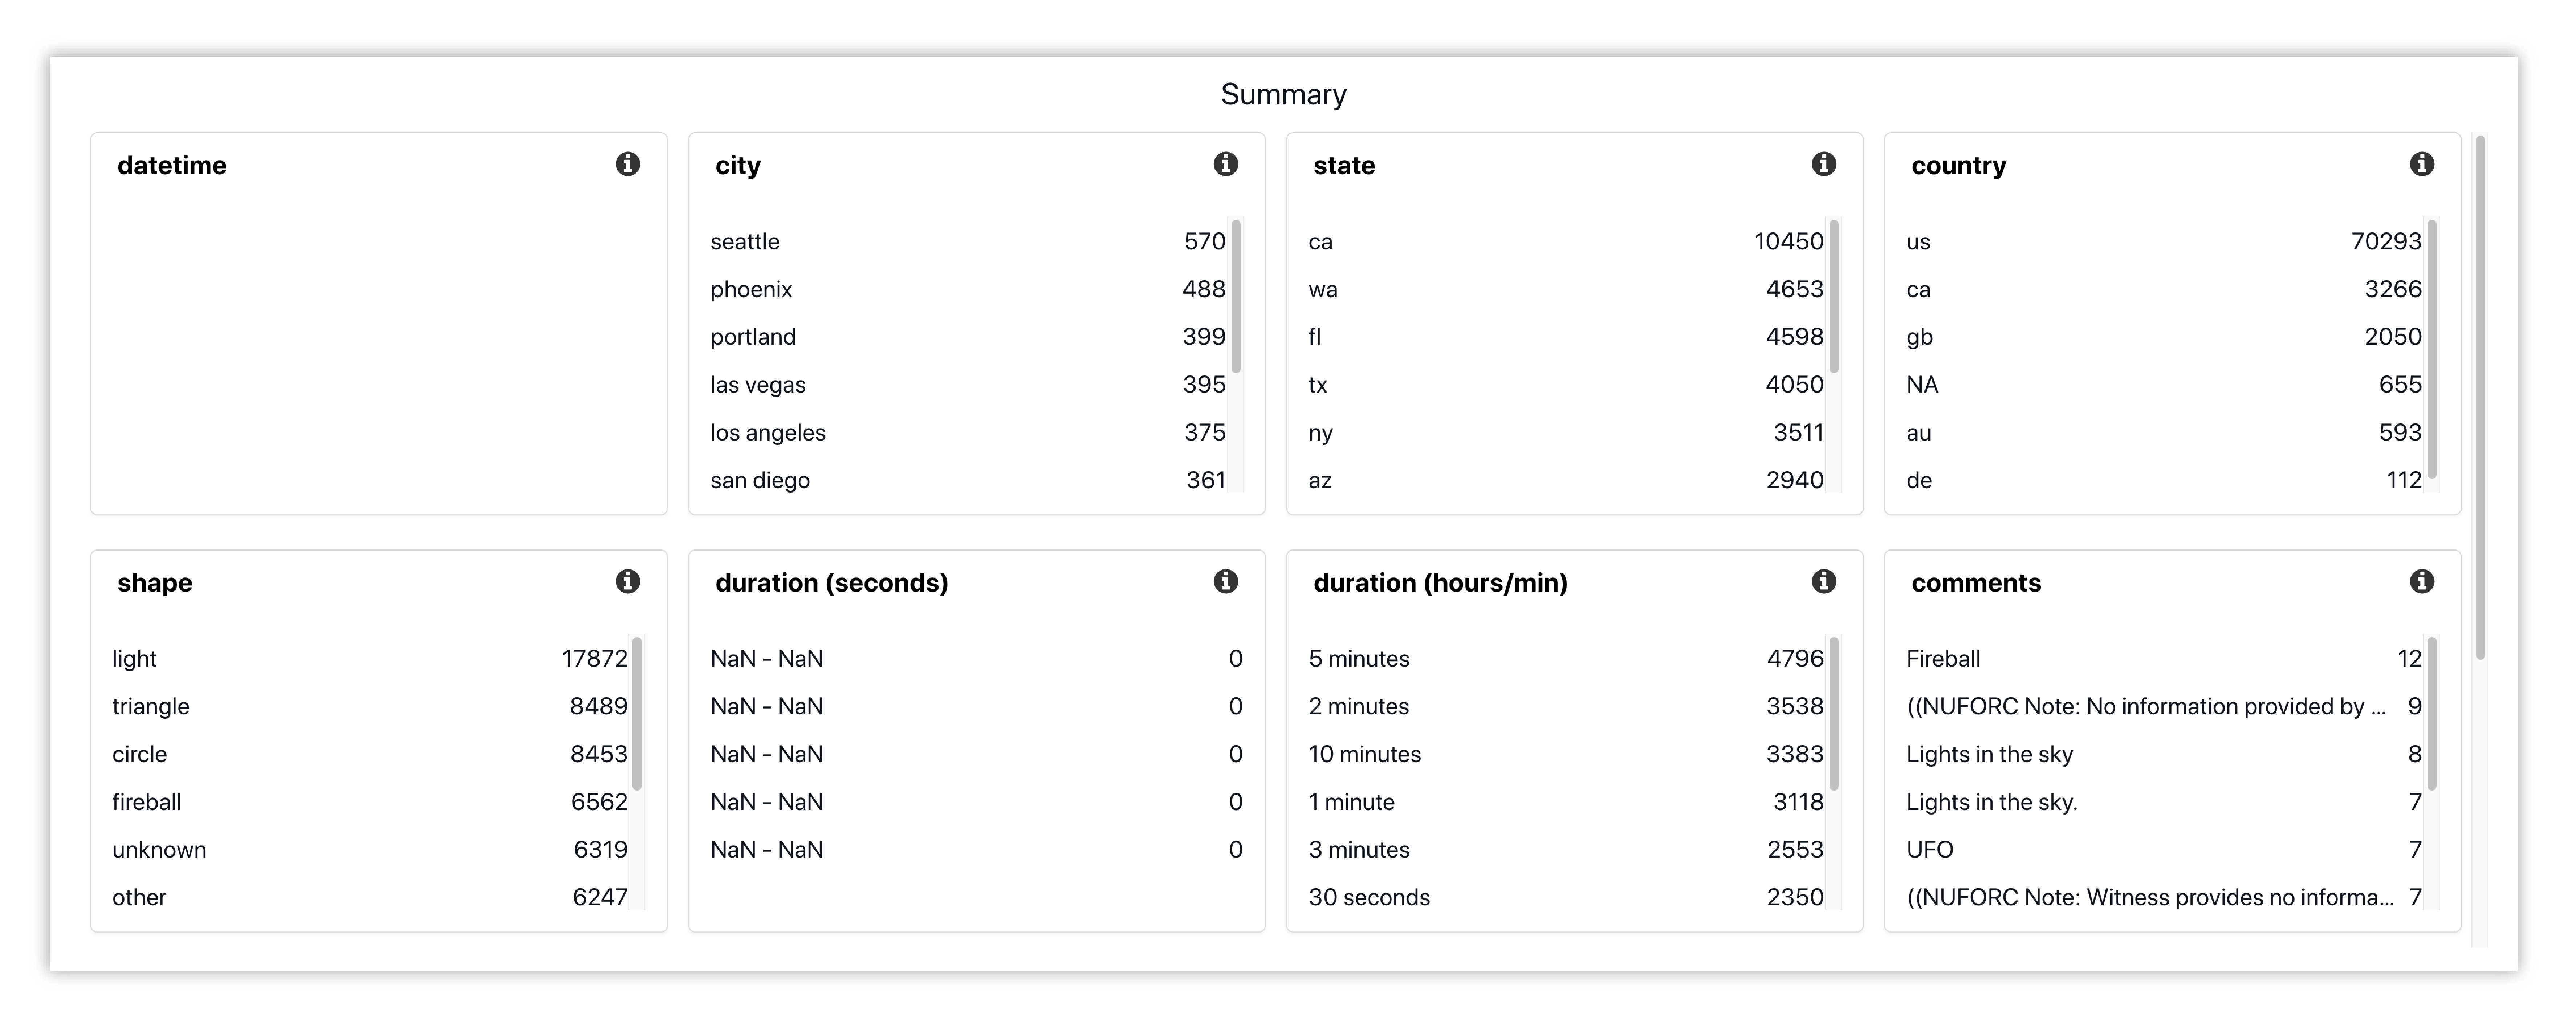
Figure 5: Summary Overview
We can change the view, download and customize our overview table.
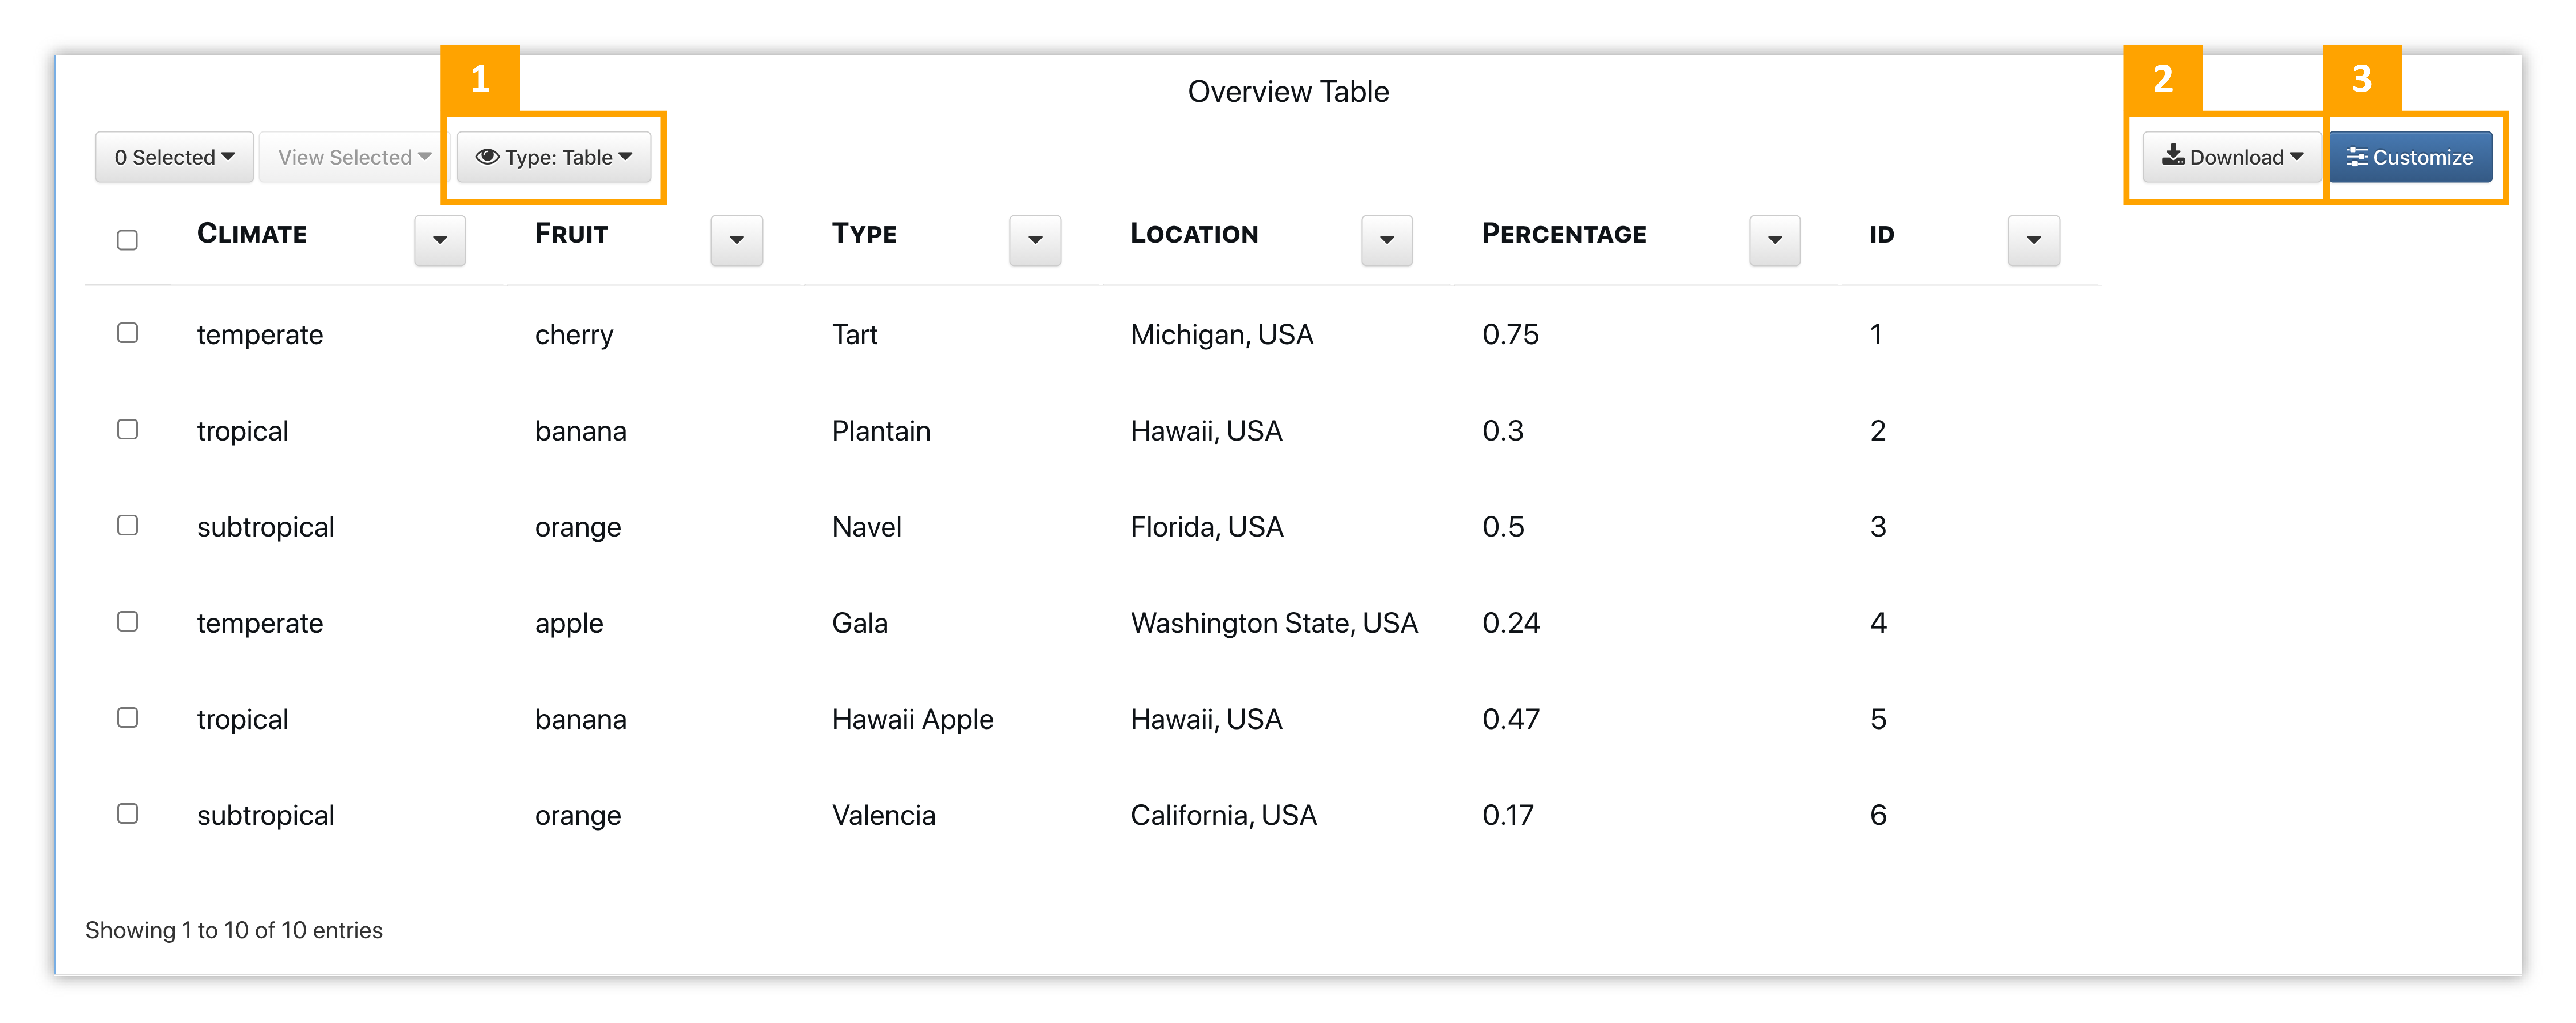
Figure 6: Overview Table
- View Type: Change the visualization of the table to view the data in a different way.
- Download: Export the table via CSV, PPT, PNG, JSON, ZIP, text or copy it to clipboard.
- Customize: Change aspects such as font size and weight, and reorder columns.
Check out this video showing how to work with the table.
Visualization Type
The Overview Table has many options for shifting the view type of our data summary. For example, we can change the view to a scatter plot.
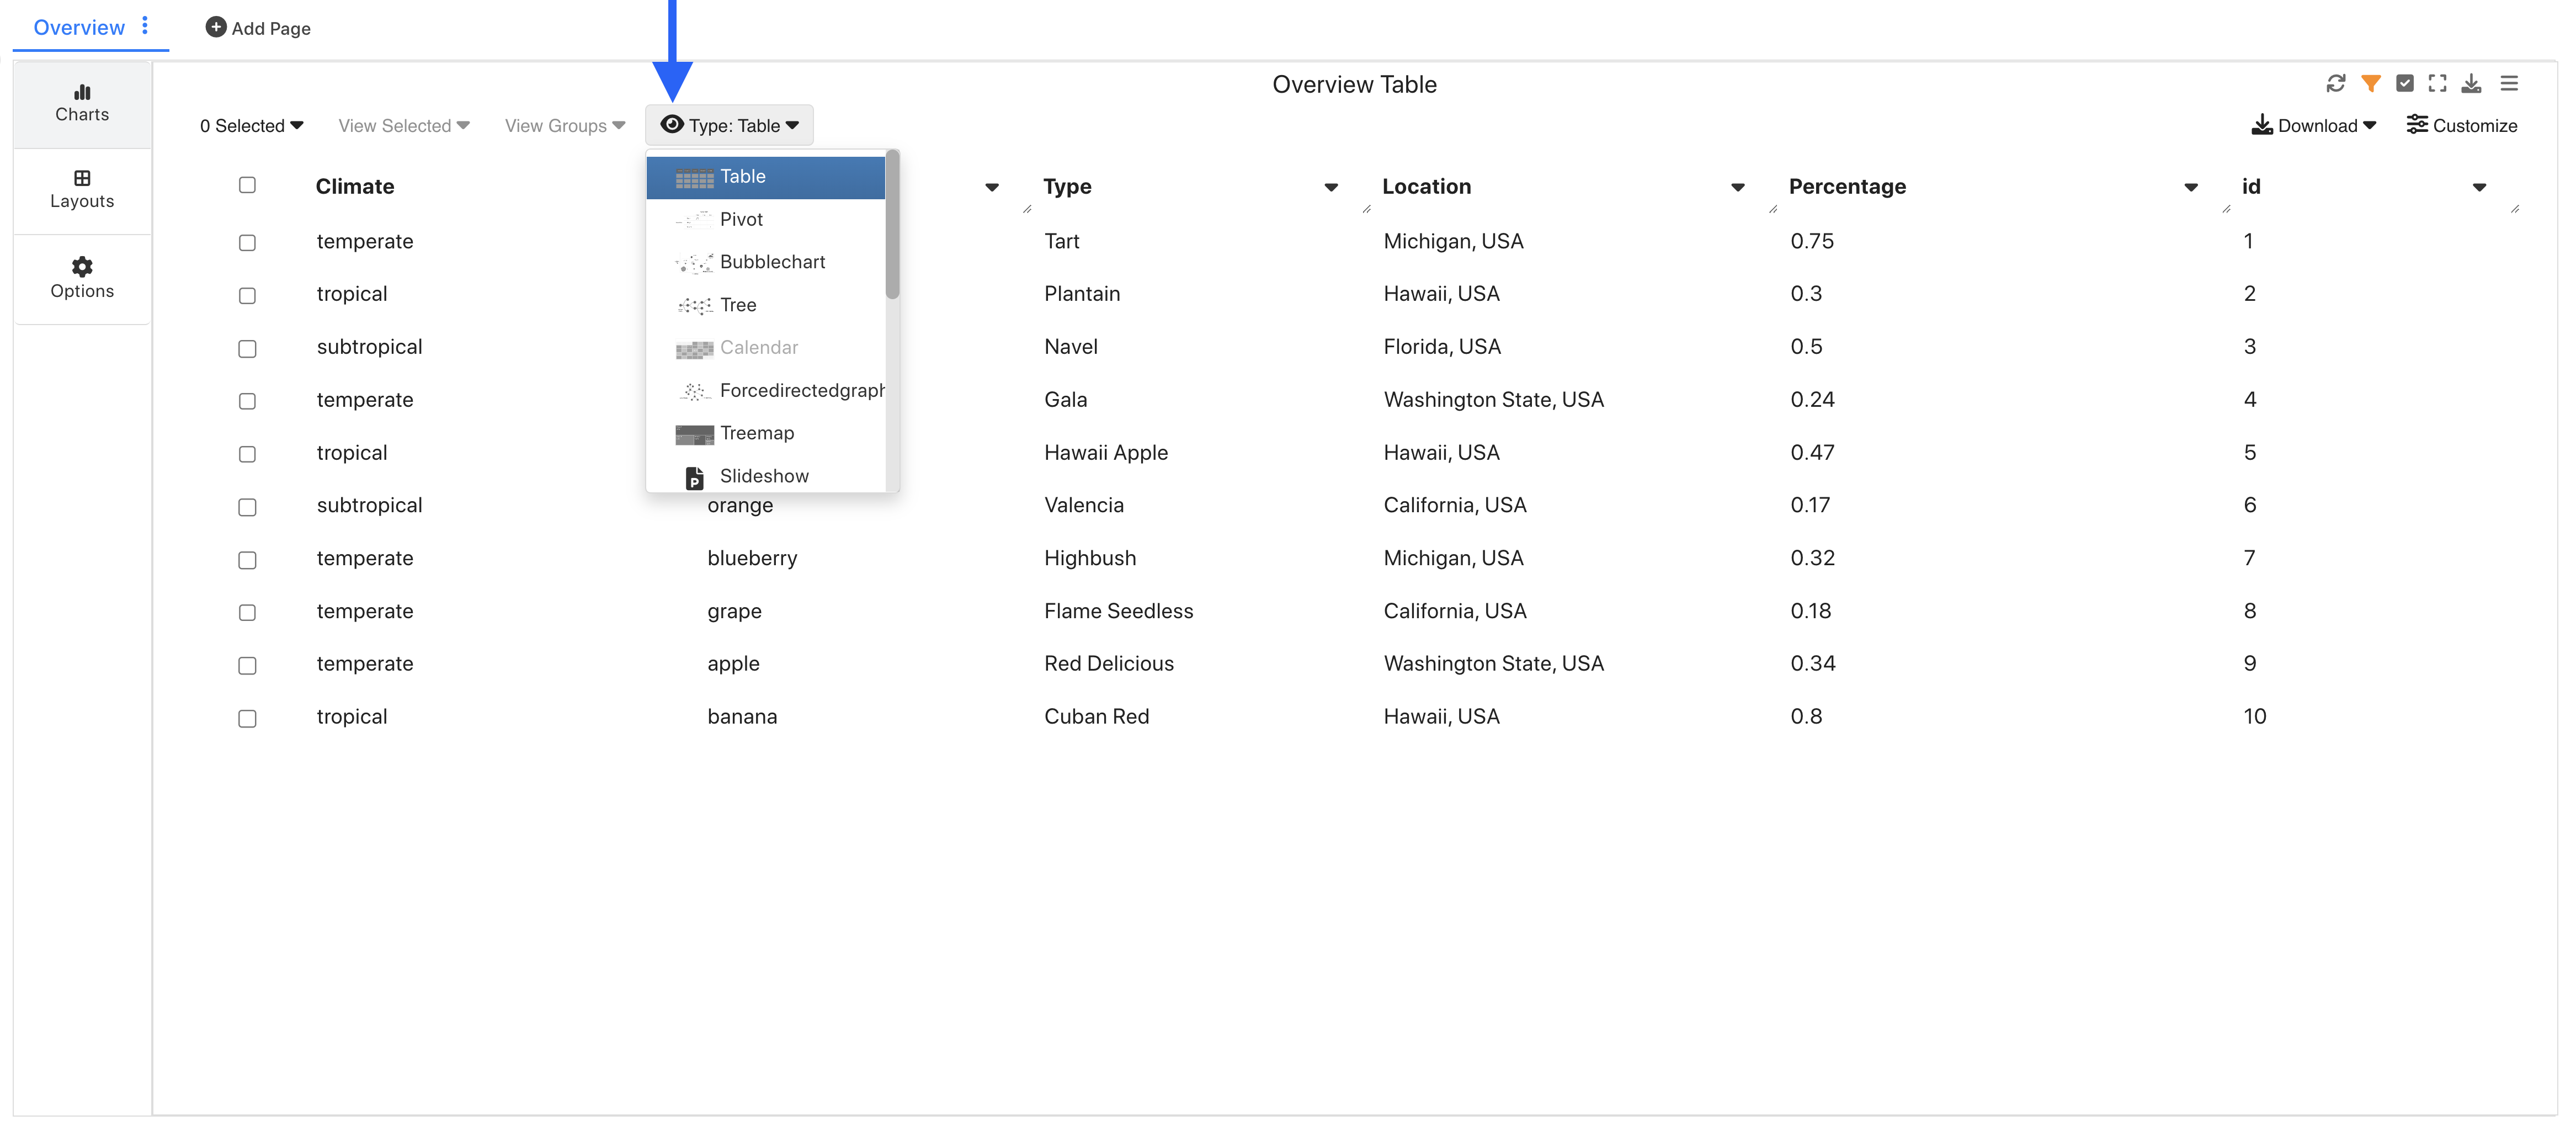
Figure 7: Overview Table Visualization Types
We’ll then be prompted to add our inputs as we do when creating visualizations, which we’ll learn in a later section (jump to that here).
Data Columns
Simlytiks finds data columns from the data source and organizes it into responses. The icon next to each data column indicates its value type. Read the Value Types section to learn more about them.
We can view data columns as charts by clicking on the curve icon that appears when hovering over it with our mouse as shown in the clip below. Once the window opens for viewing a response, we can navigate between all responses using the respected buttons at the top right.
NEW as of February 1, 2022: Responses sidebar has a context menu to preview and add bin columns in the responses list.
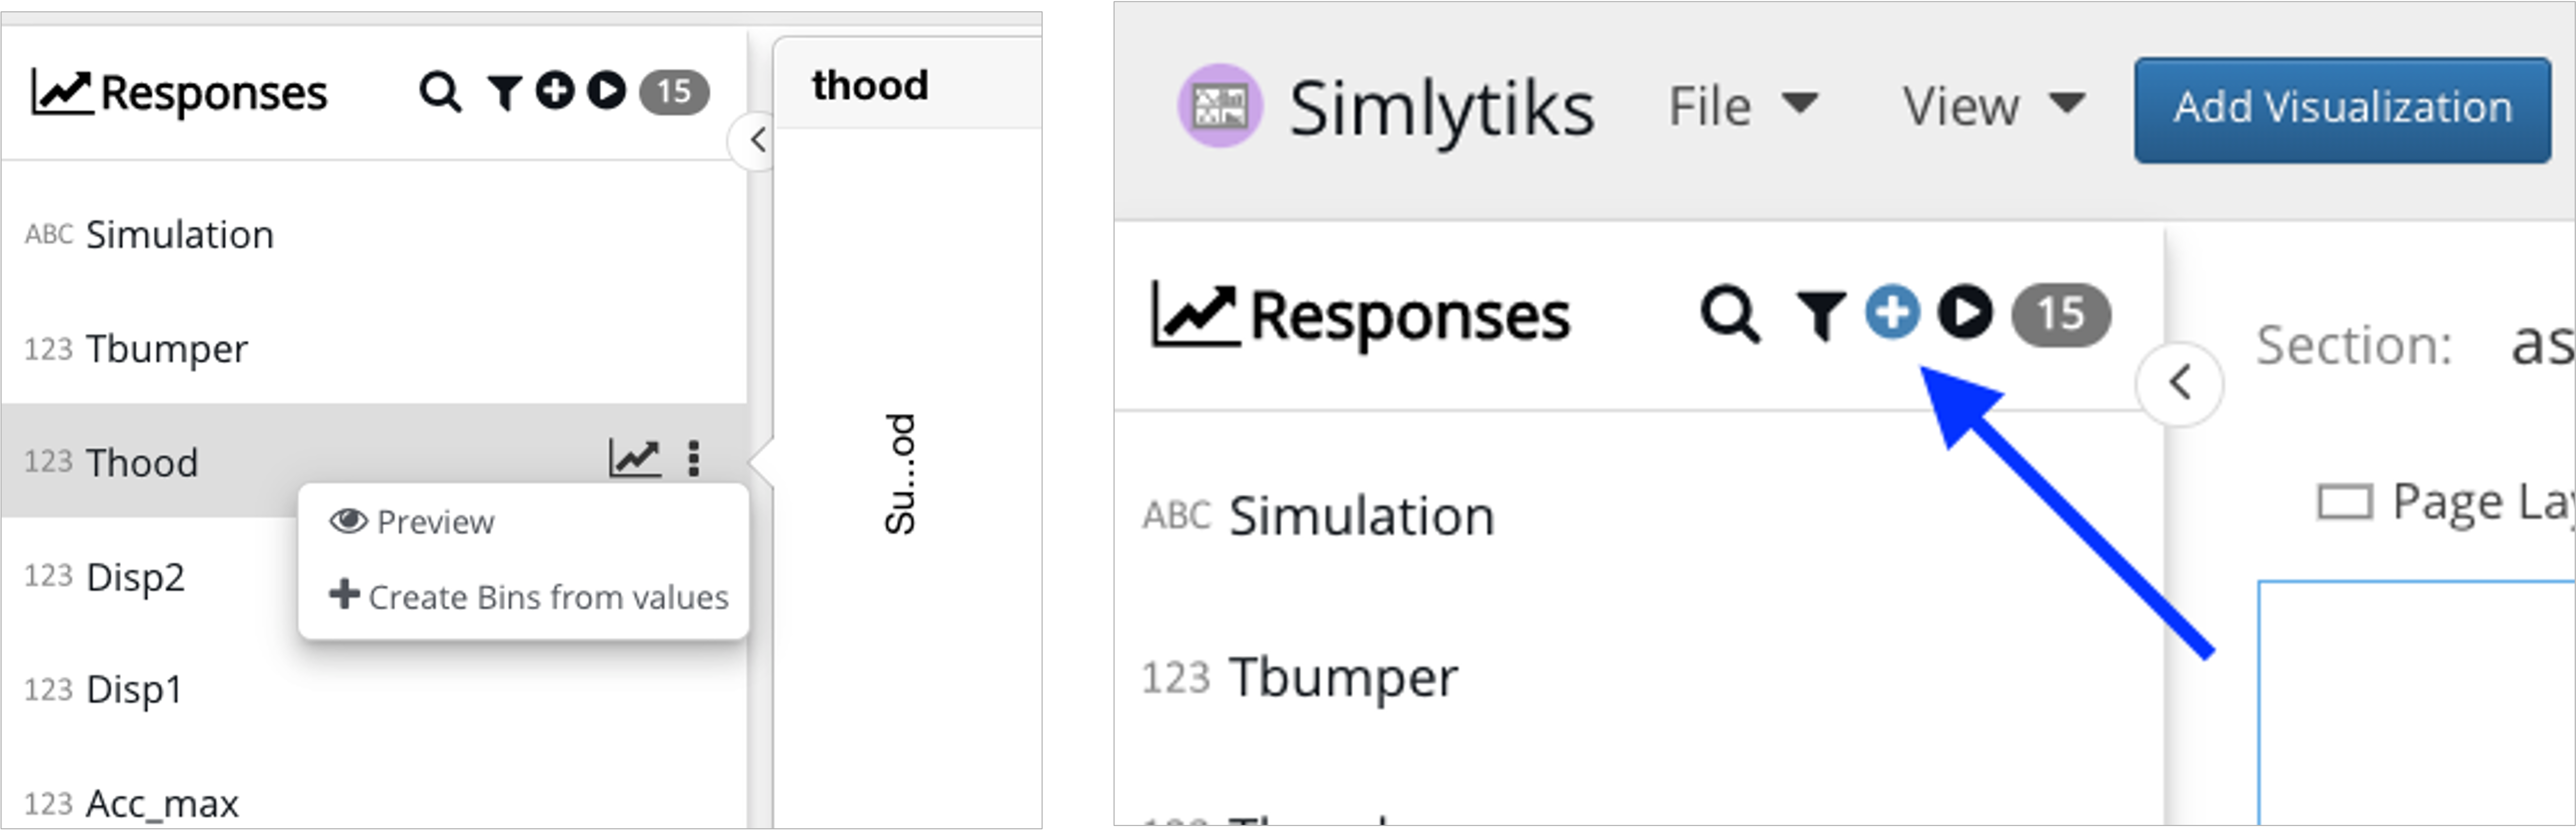
Figure 8: Responses Context Menu
We’ll build our exploration by creating new pages and adding charts to them, using our data columns as chart inputs. Jump ahead to learn about charts here and pages here.
Here is an example of two basic charts on a page for our dataset.
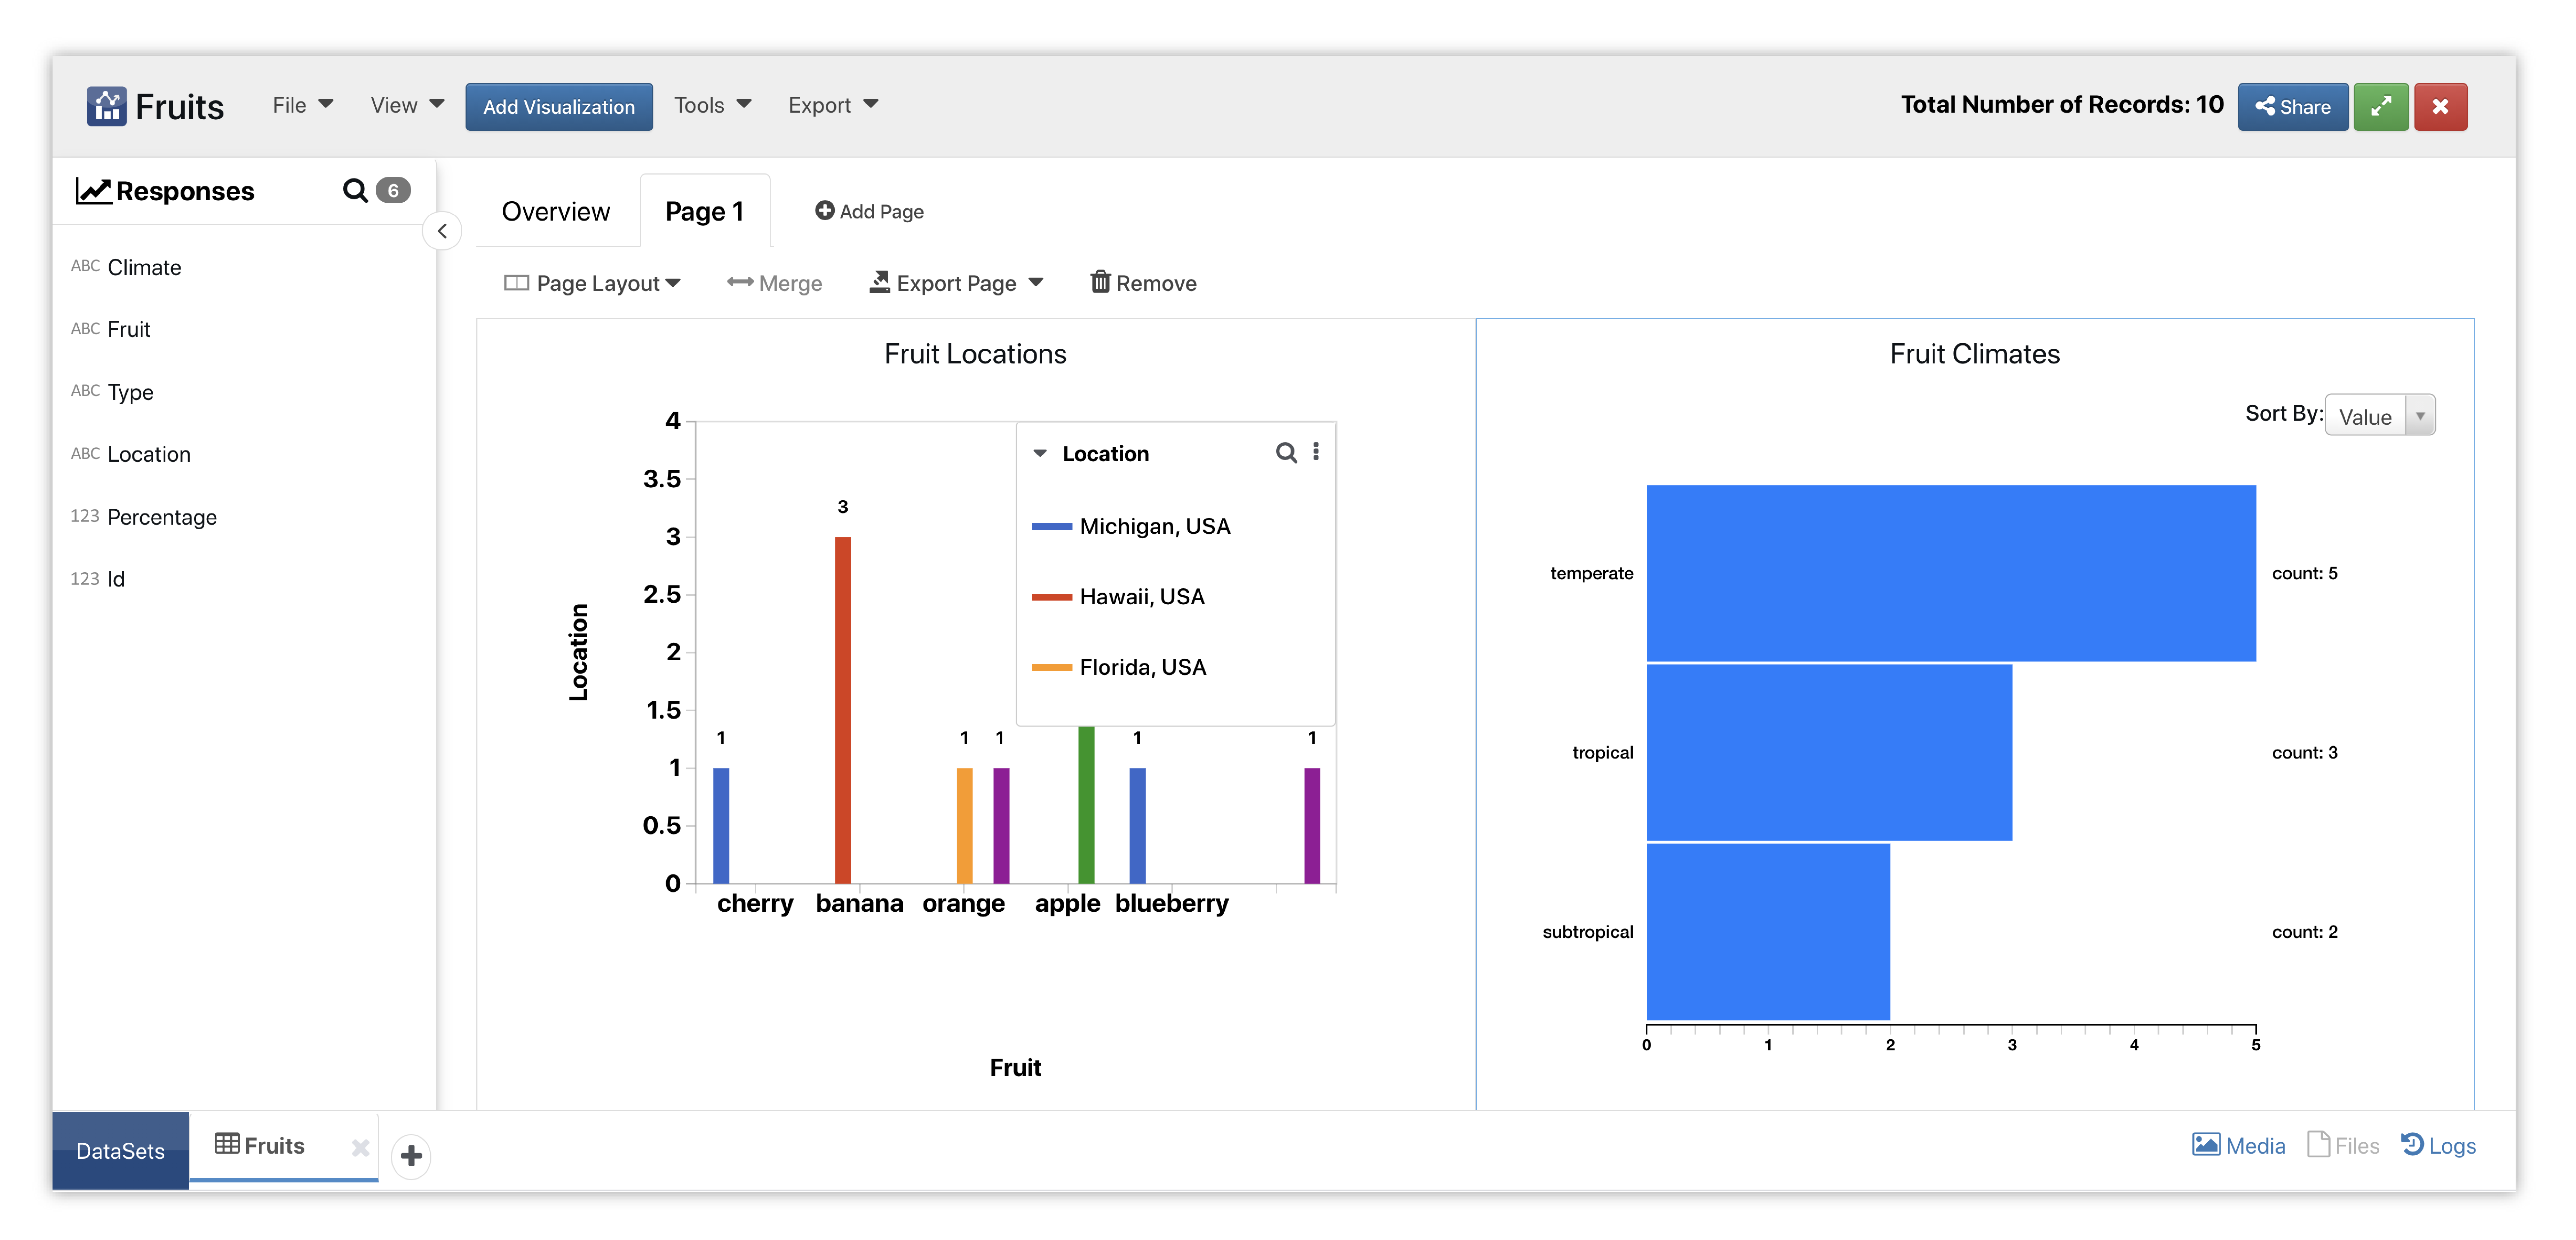
Figure 9: Basic Charts
Customizing
Simlytiks has dataset customization options to help enhance our analysis. Check out the following video for an introduction to these options and make sure to read on for some more information.
Column Schema
Go to Tools > Customize to review and update column data schema.
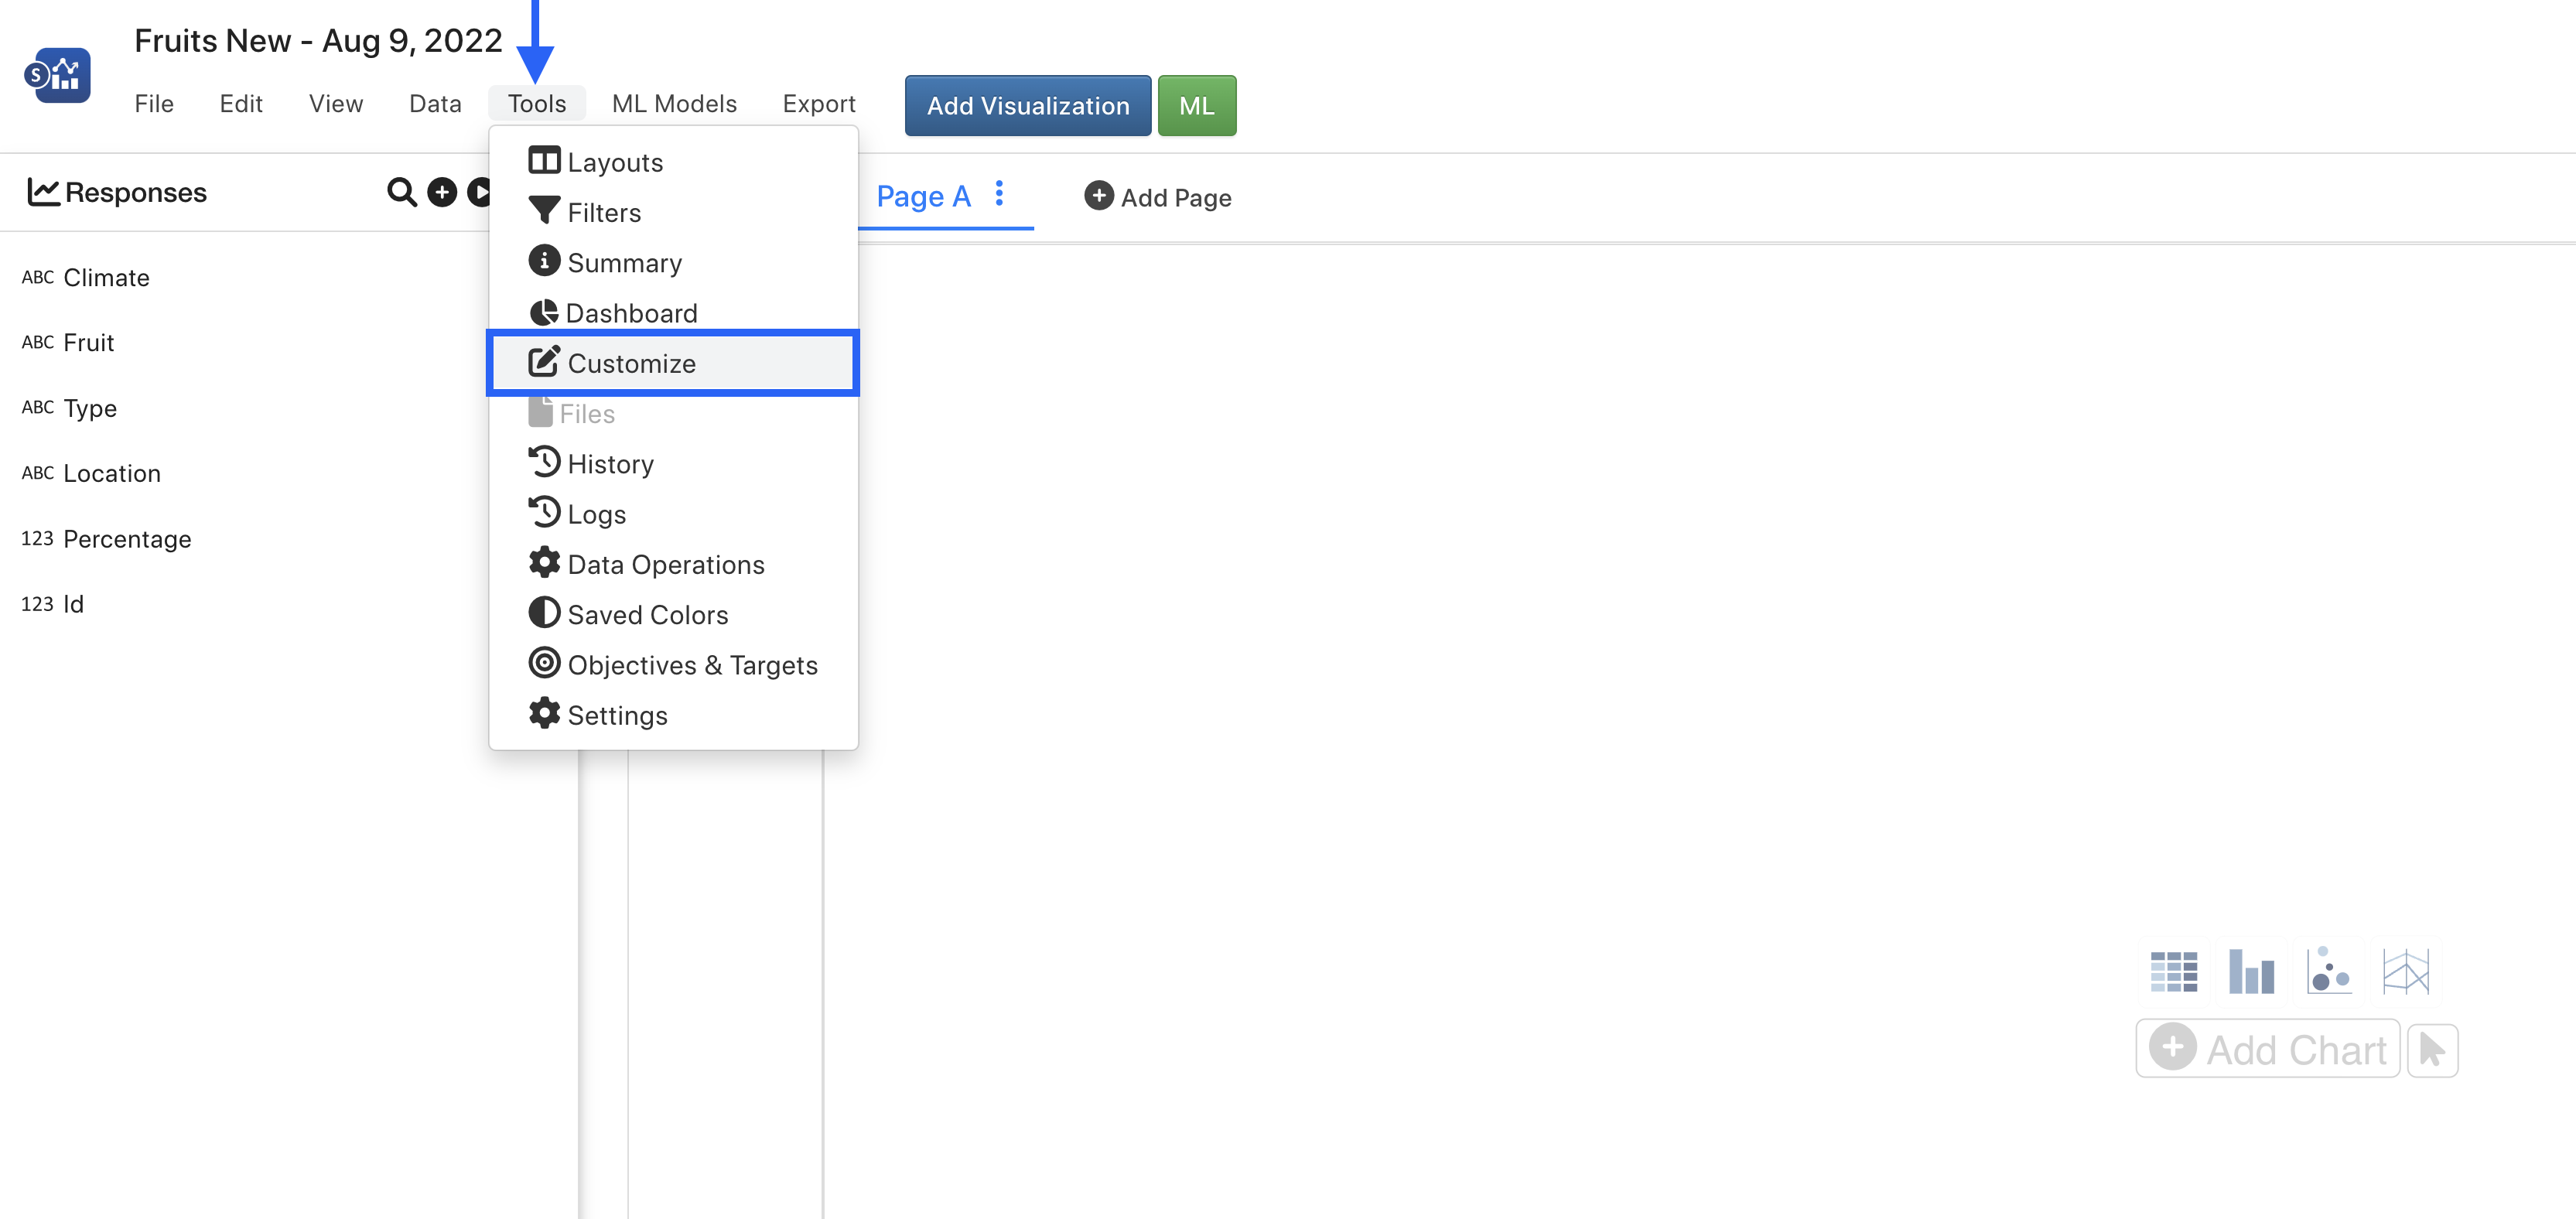
Figure 10: Tools > Customize
Under the home tab, we can add an image to a data column (1), check if the data has an errors (2), or edit alias and colors for individual records (3).
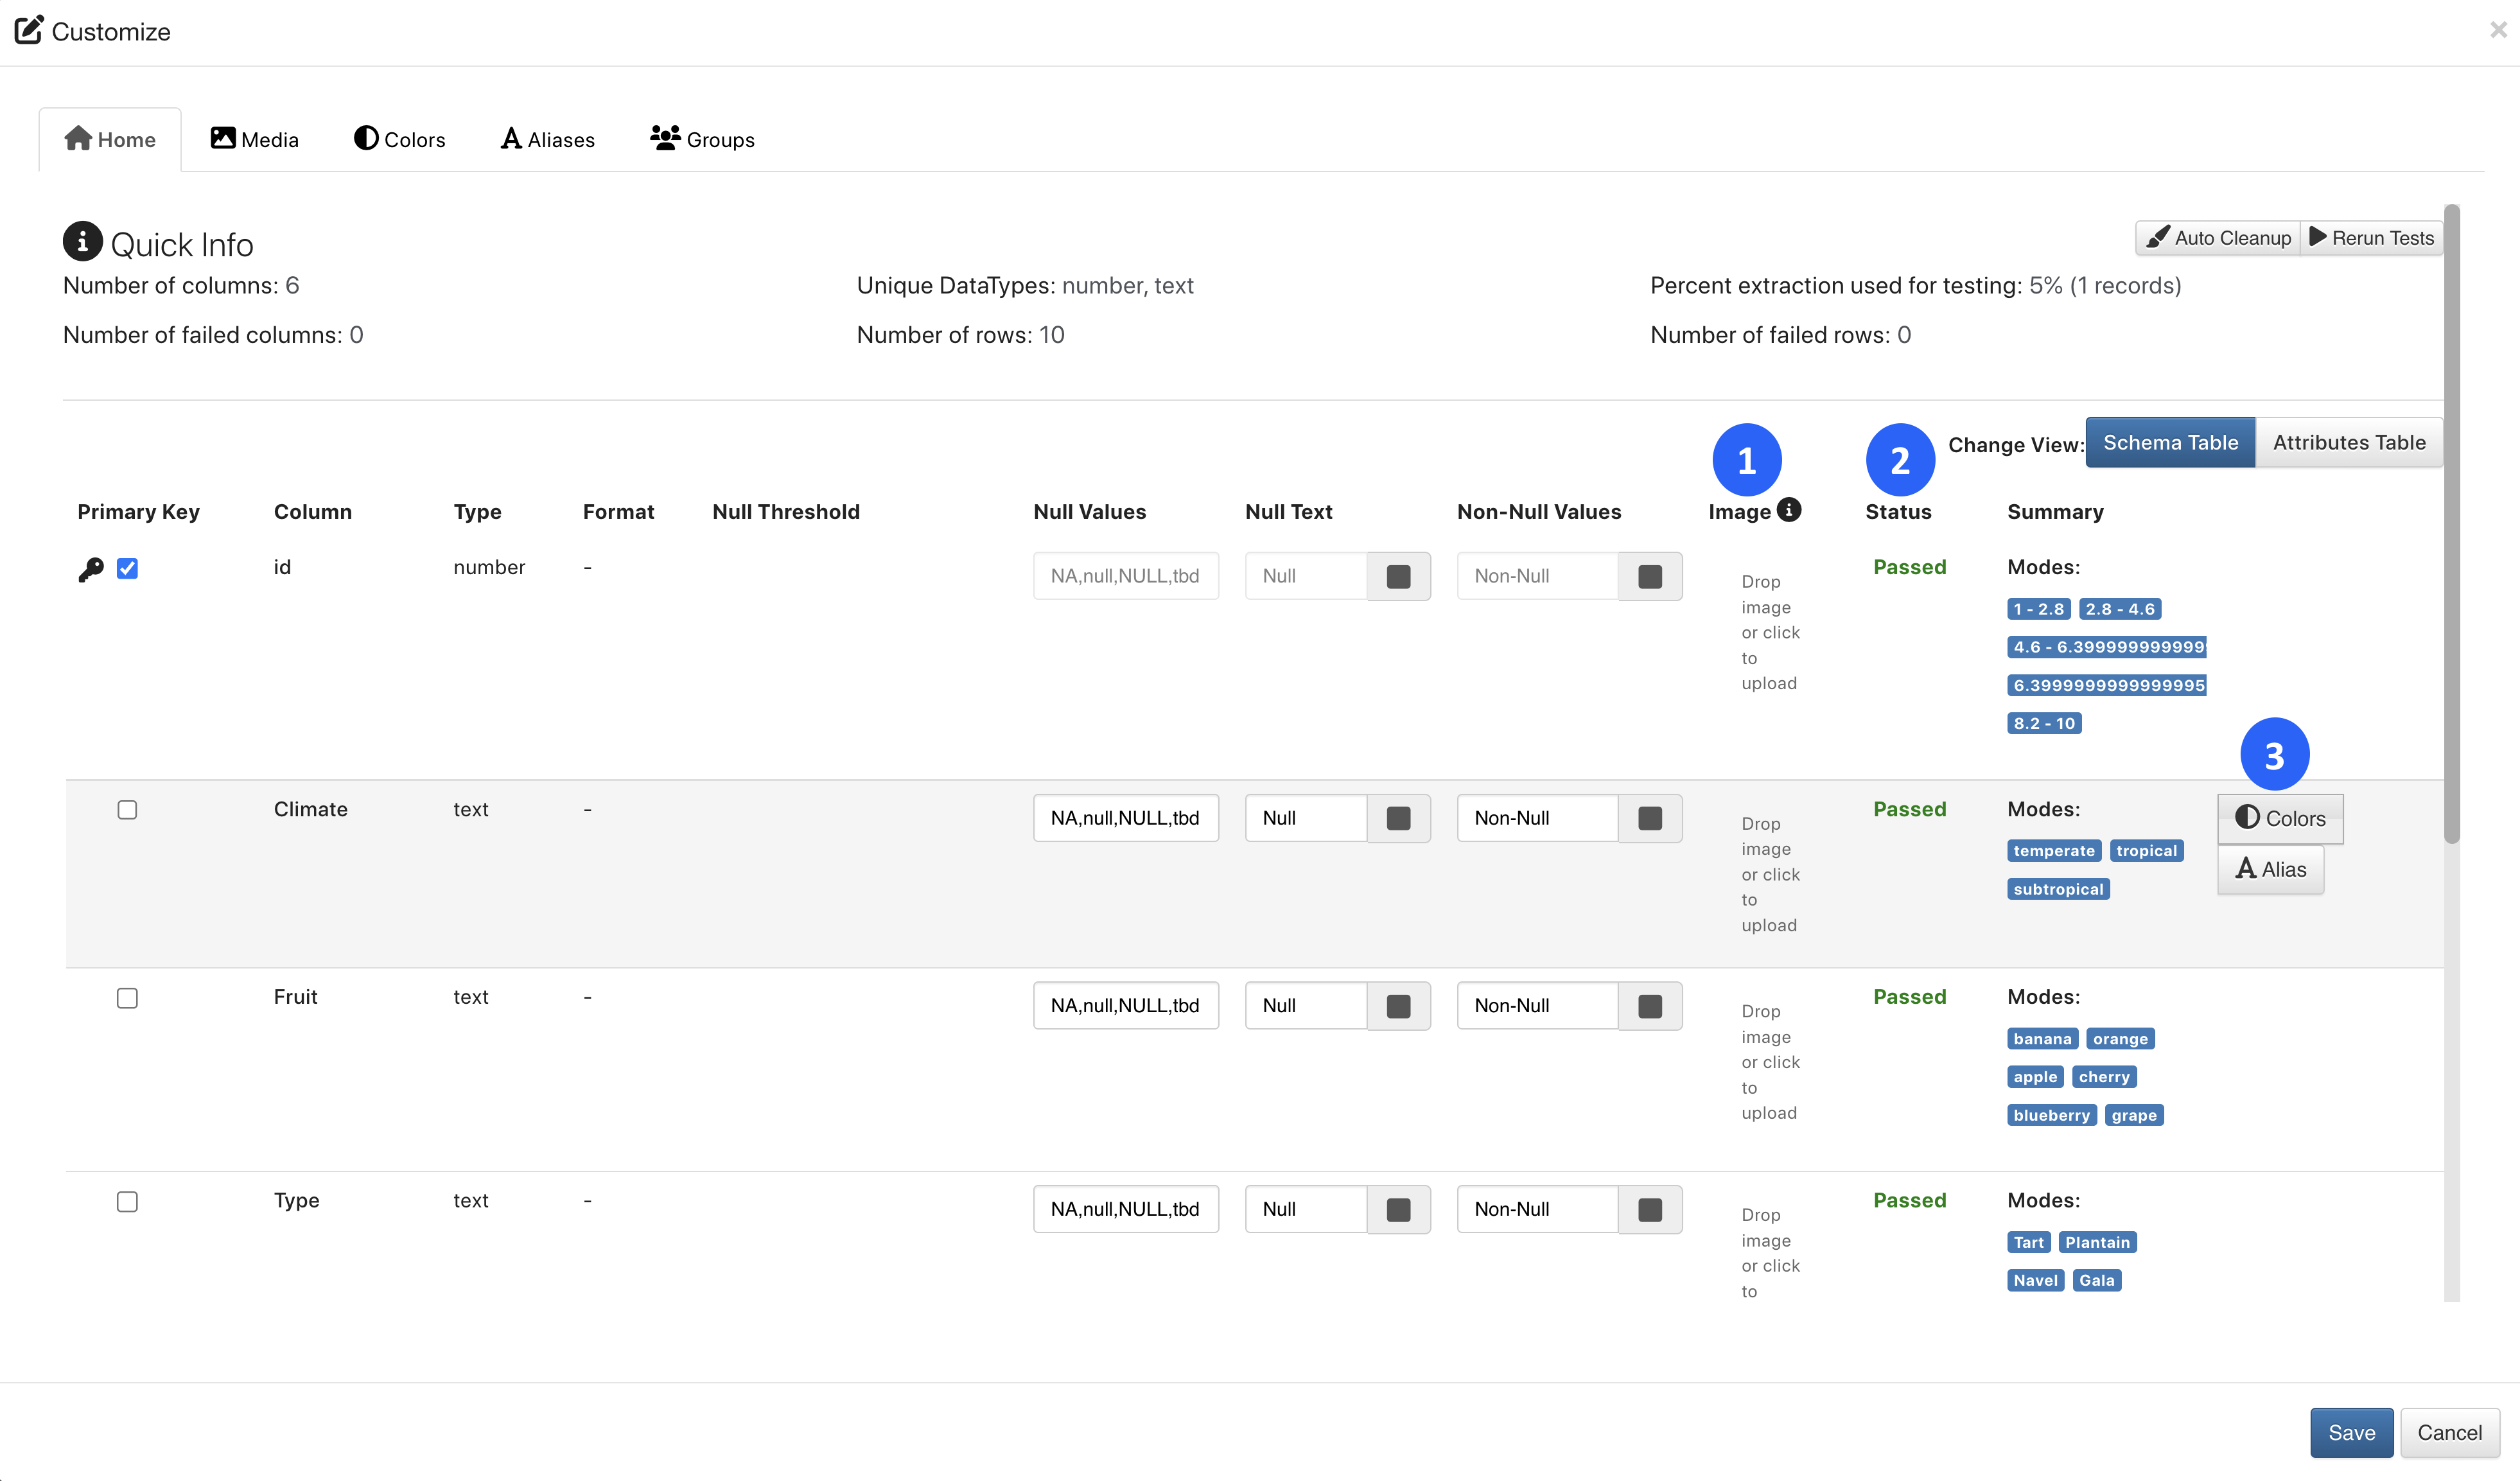
Figure 11: Edit Column Schema
Grouping Data
Under Tools -> Customize -> Groups, you can create and auto-create custom groups within a data column and specify colors for each.
There is also an option to bin data under Tools > Data Operations. Just use the “Add Column By Binning” transformation to create your new binned data column.
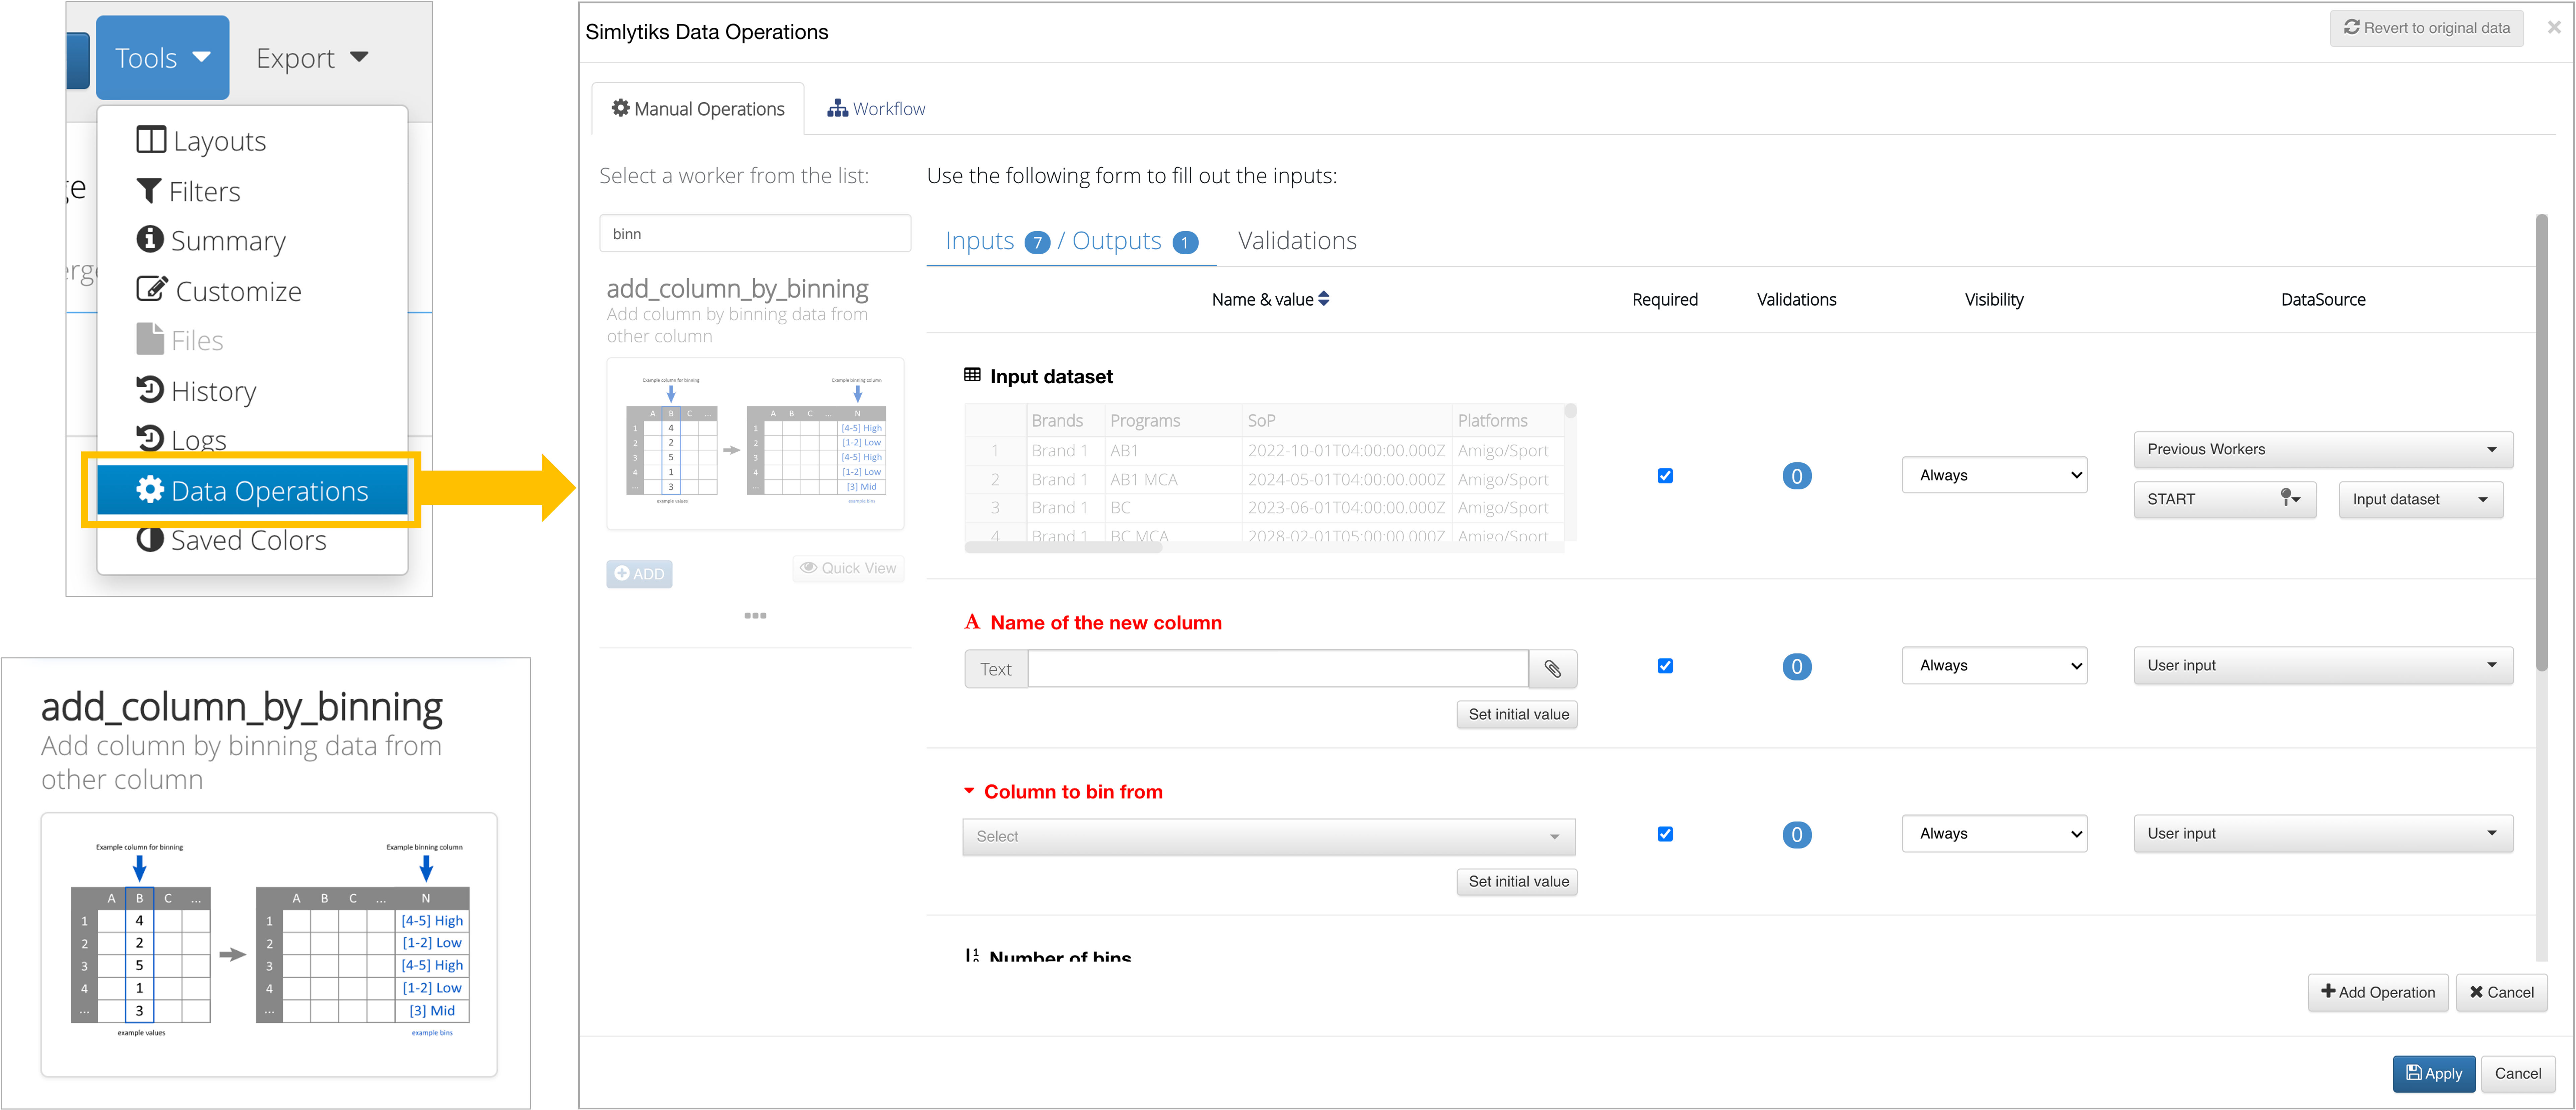
Figure 12: Add Column By Binning
We can now create Groups from Tools option in Simlytiks
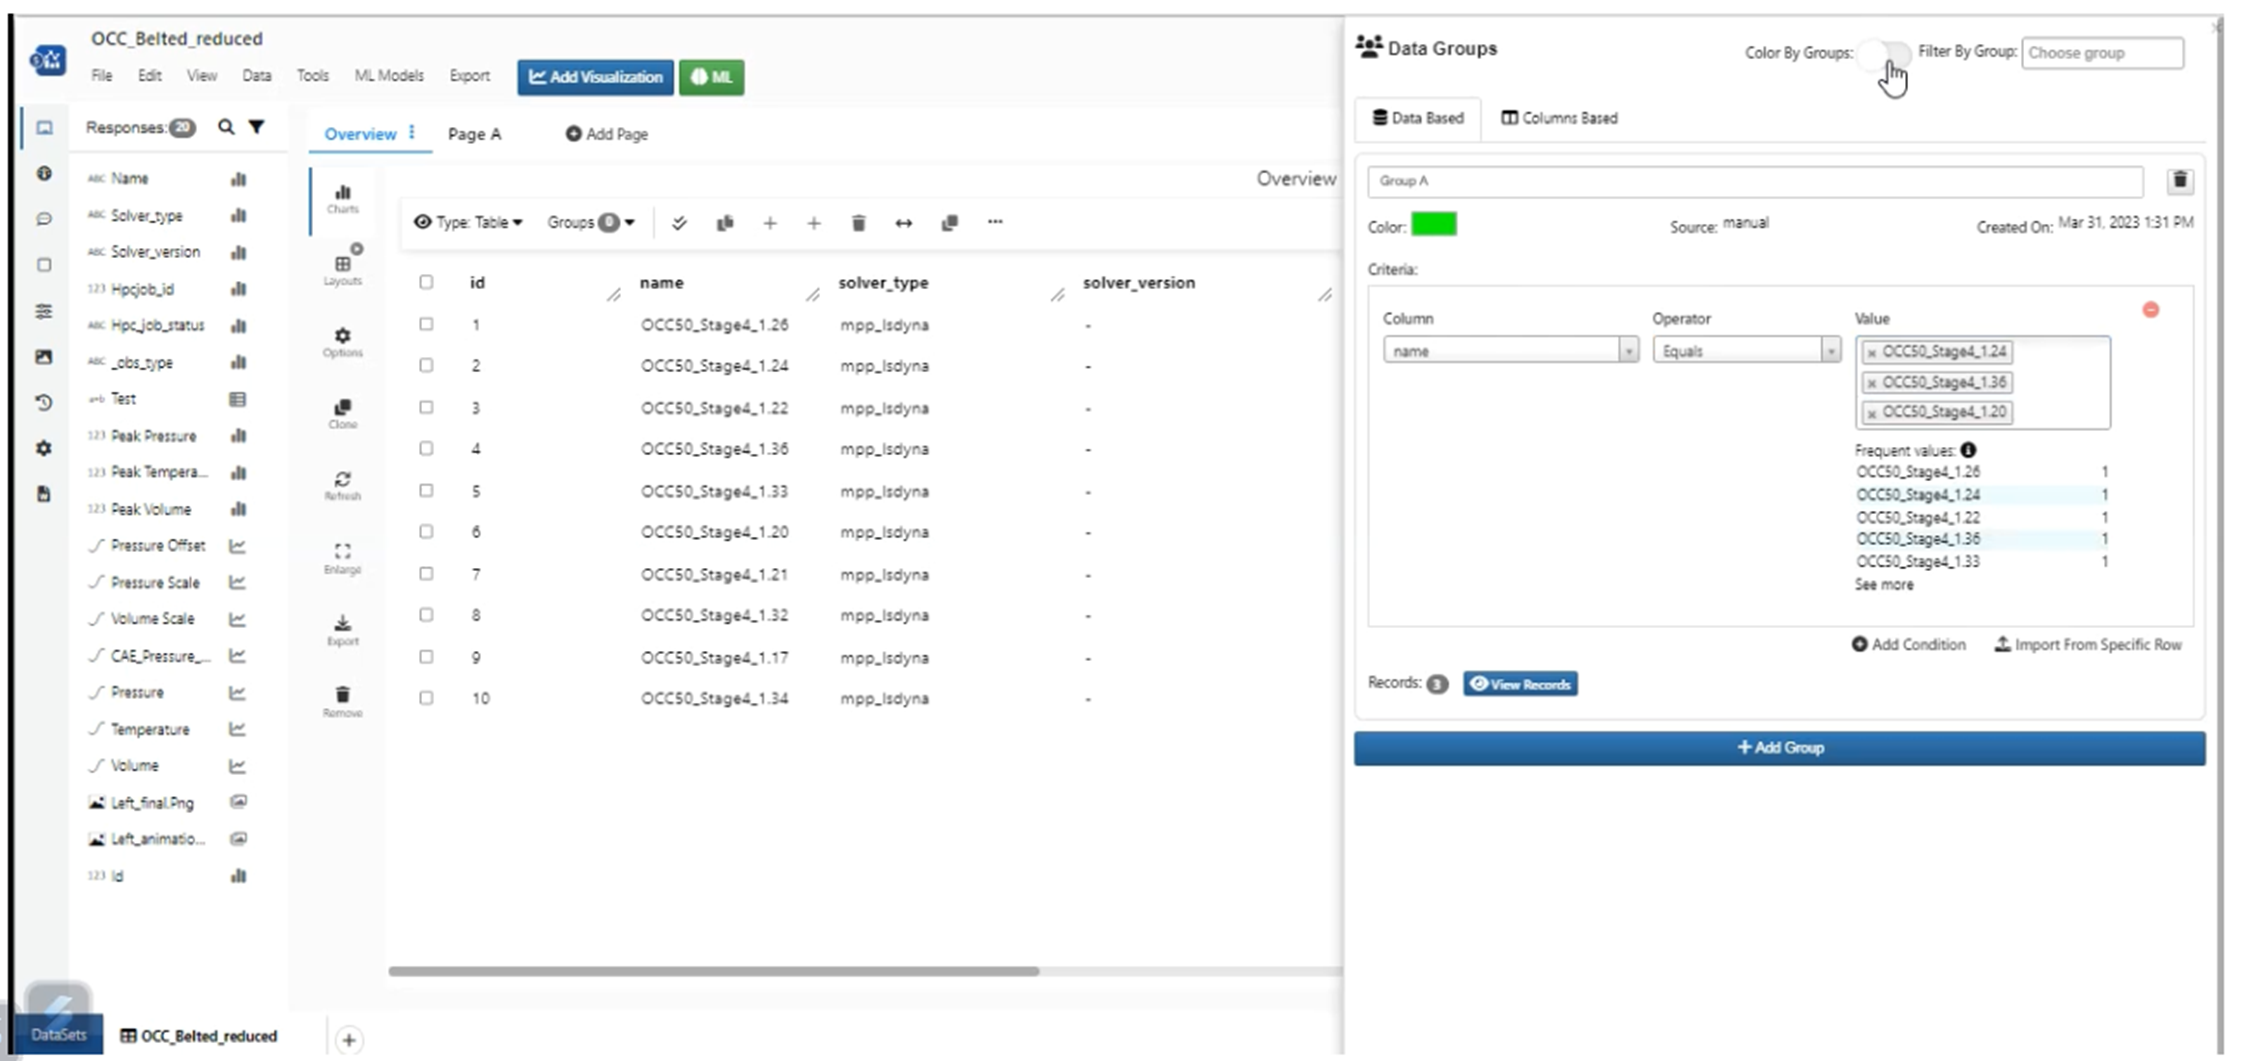
Groups
Tools & Options
There are some additional tools available for organizing and editing the dataset. Let’s go over a few.
Filtering Data
Global dataset filtering can be found at the top right corner of the page next to the settings button. You can also update specific filters under the Tools menu.
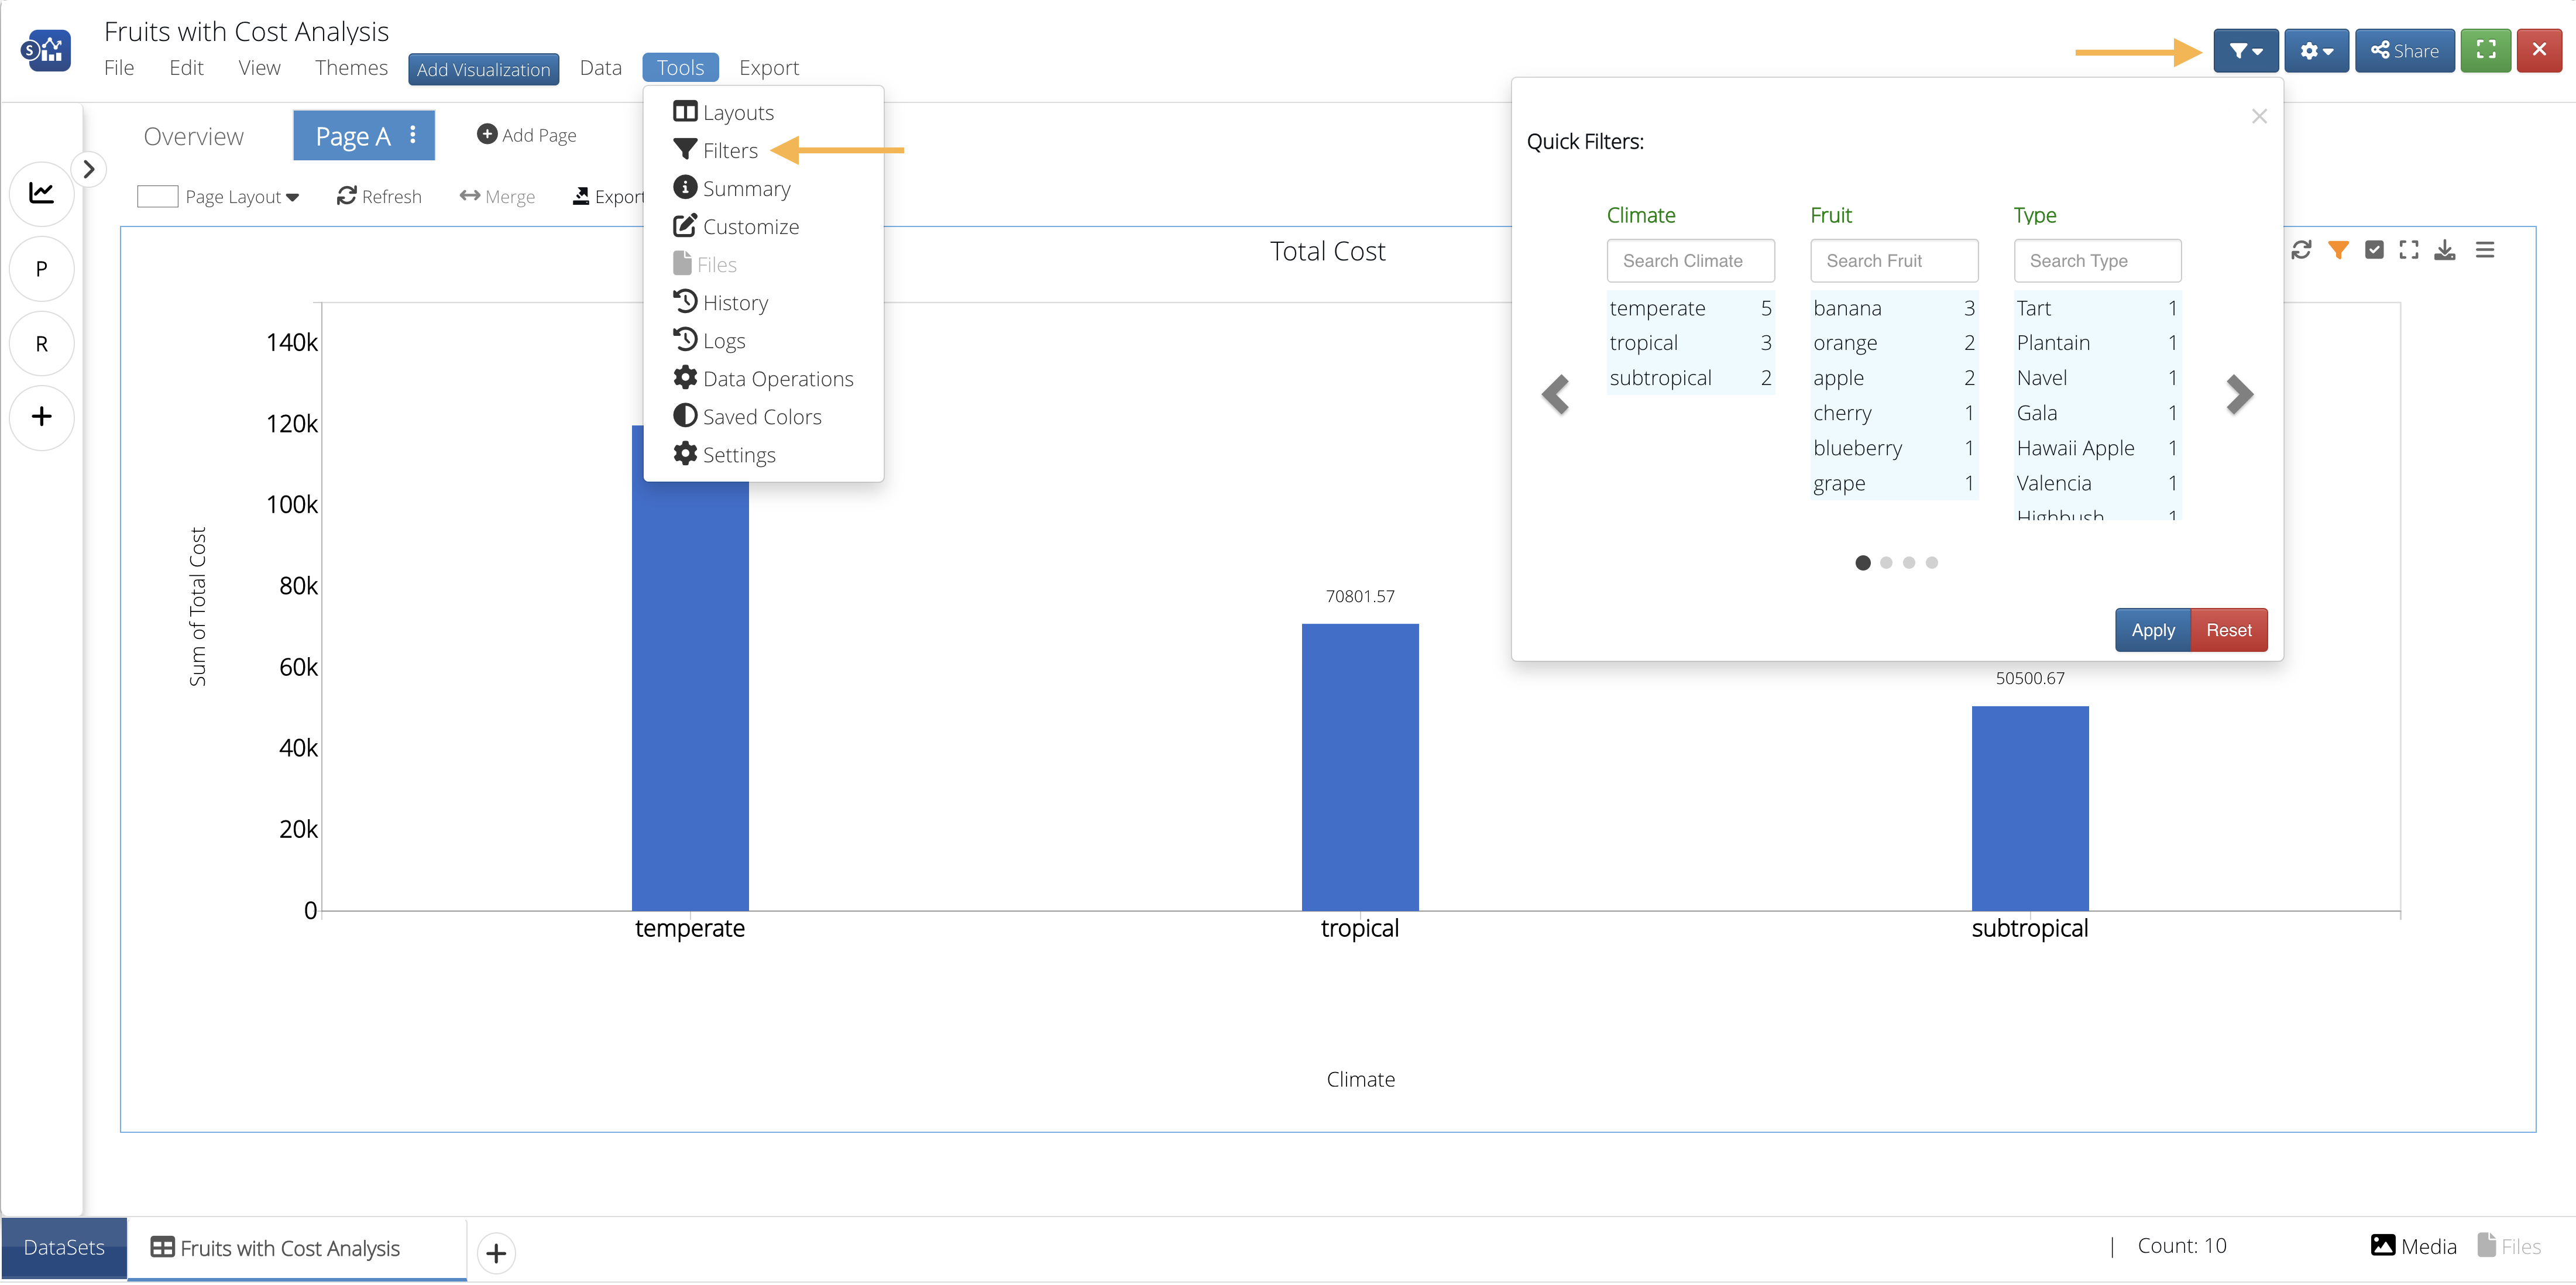
Figure 13: Dataset Filtering
Dataset Settings
Settings under the Tools dropdown helps in configuring basics like layout, names, color schemes and page settings.
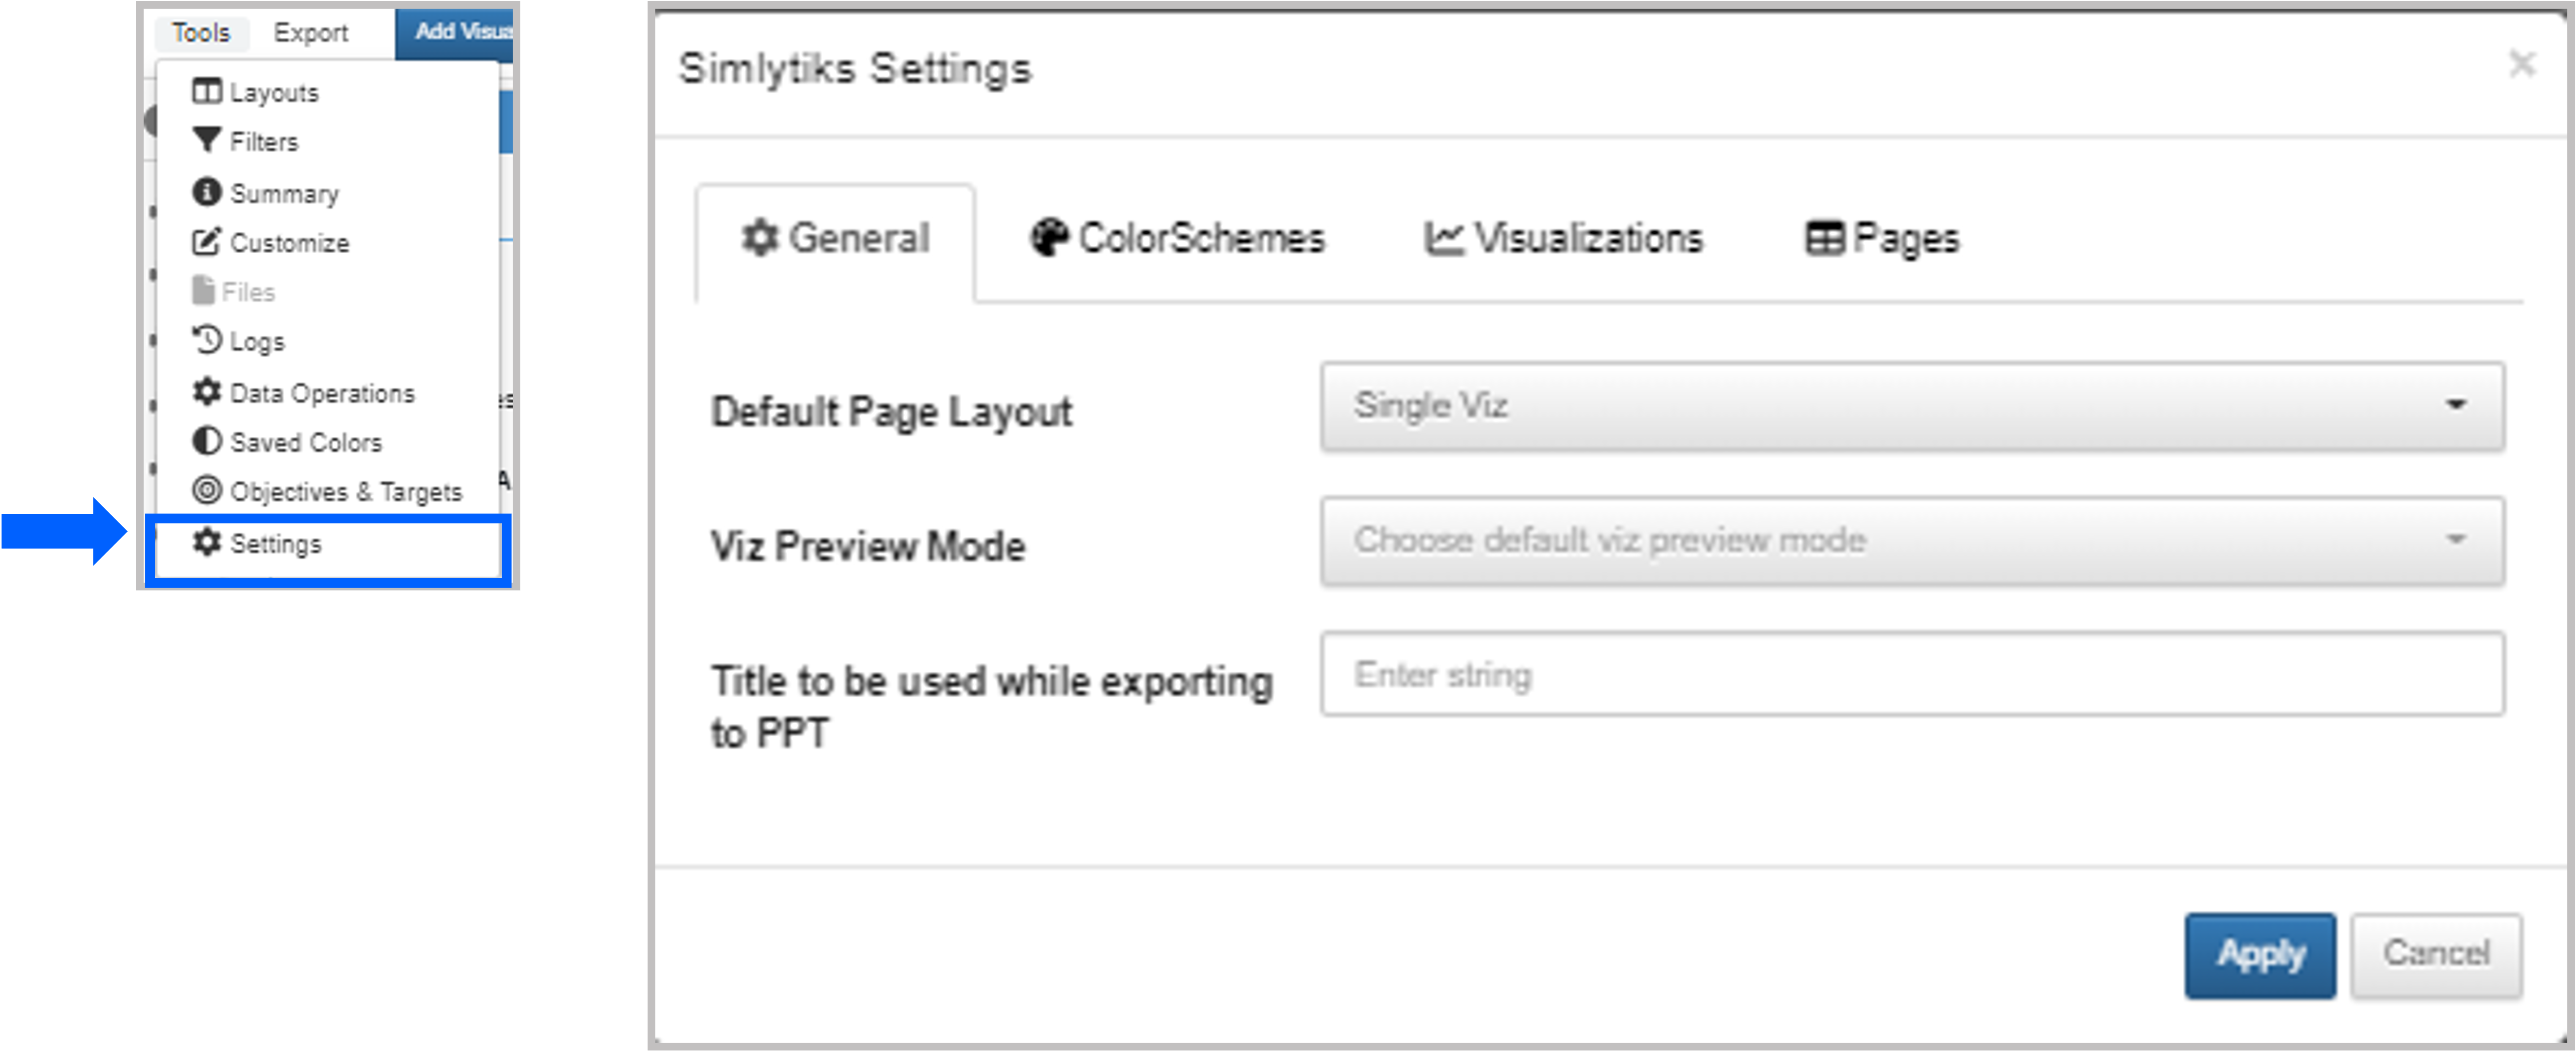
Figure 14: Dataset Settings
In Simlytiks, we can define Roles and permissions for Authors and viewers under Tools option in Settings.
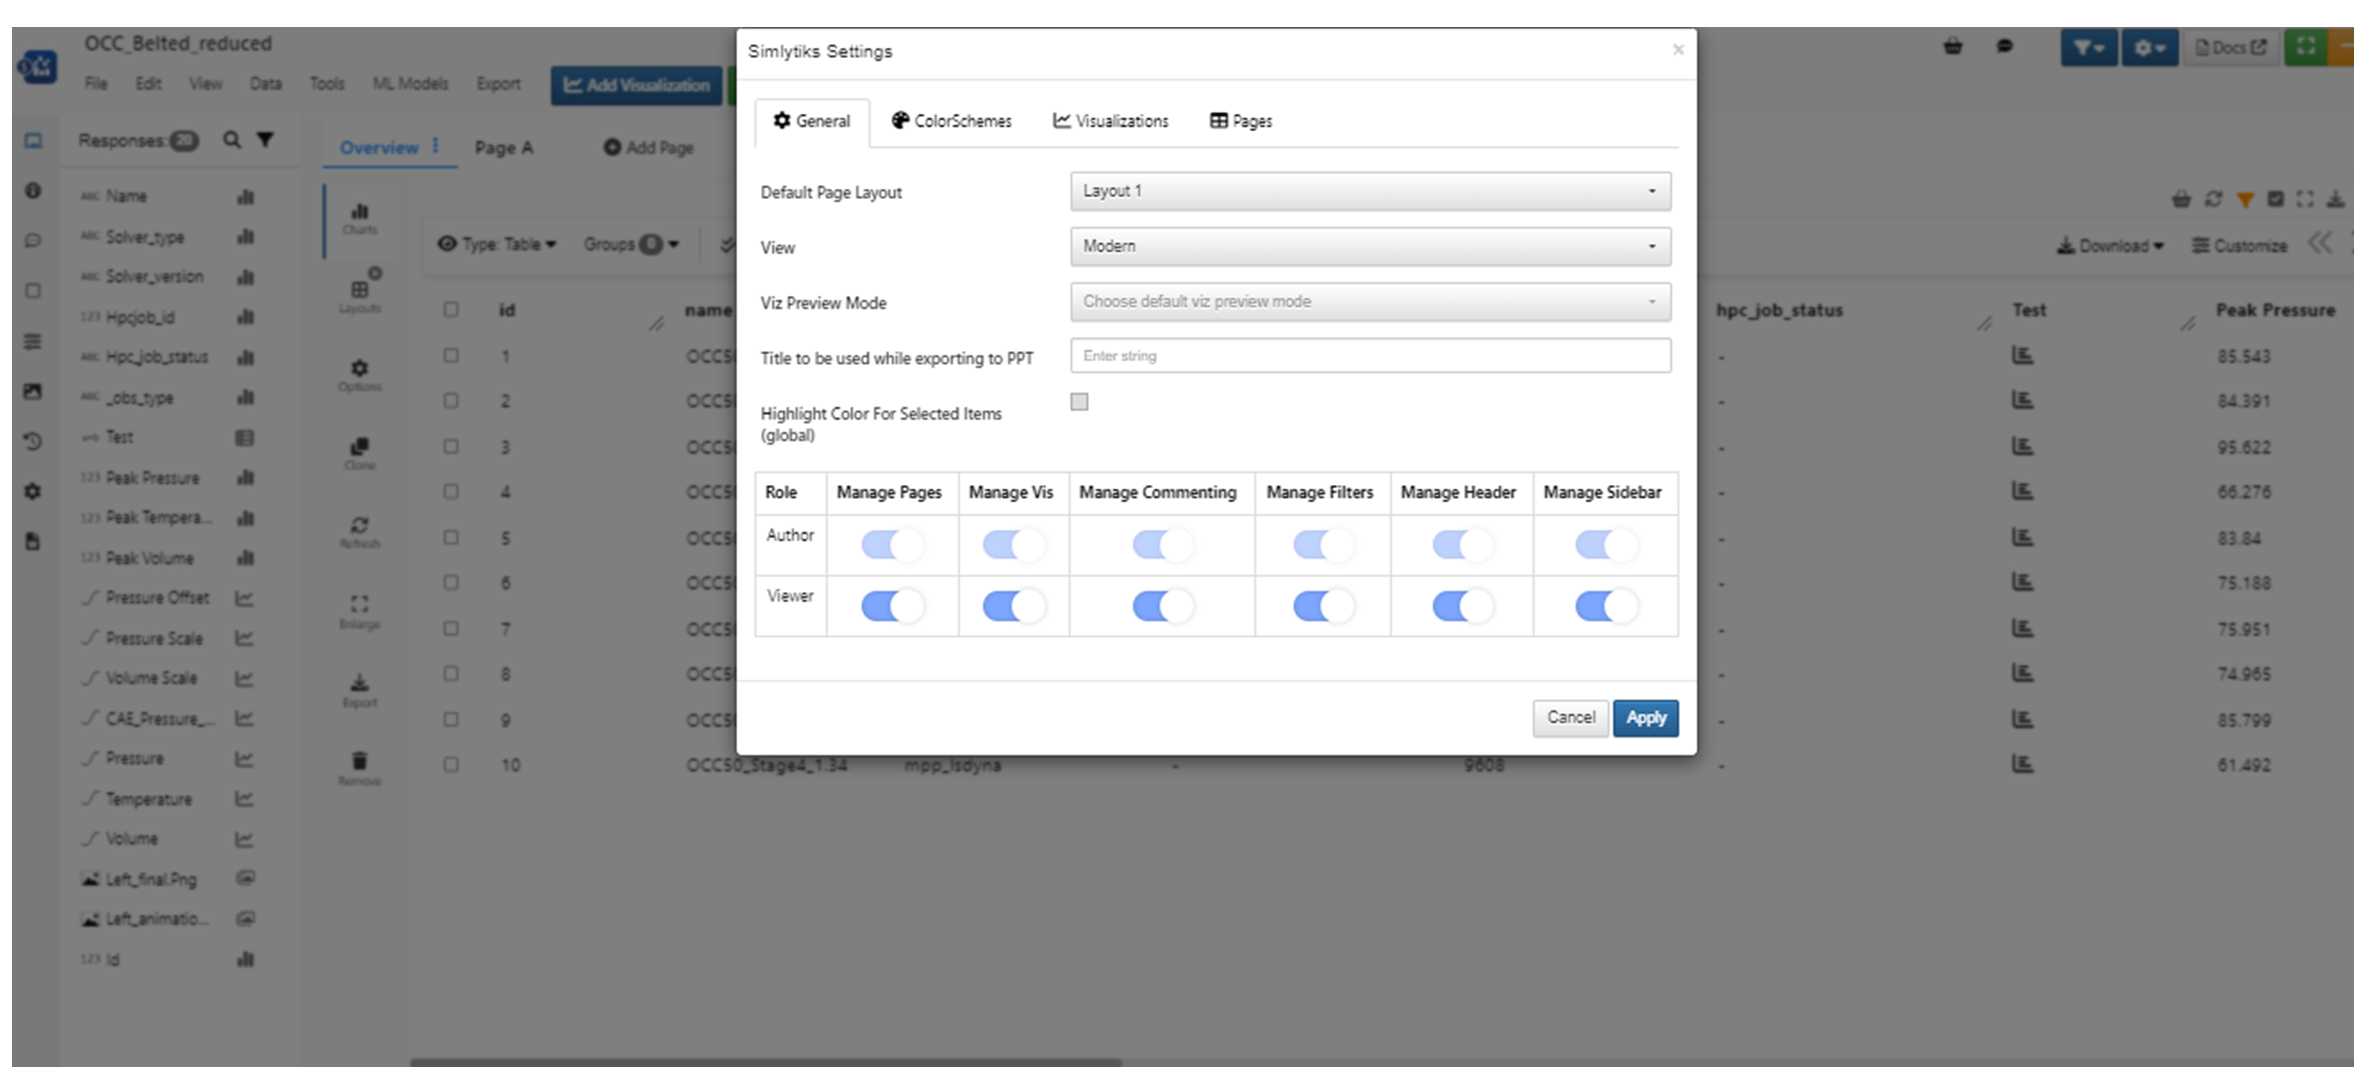
Roles and permissions
Objectives & Targets
Under the Tools dropdown, choose Objectives & Targets to help trigger particular data for the dataset.
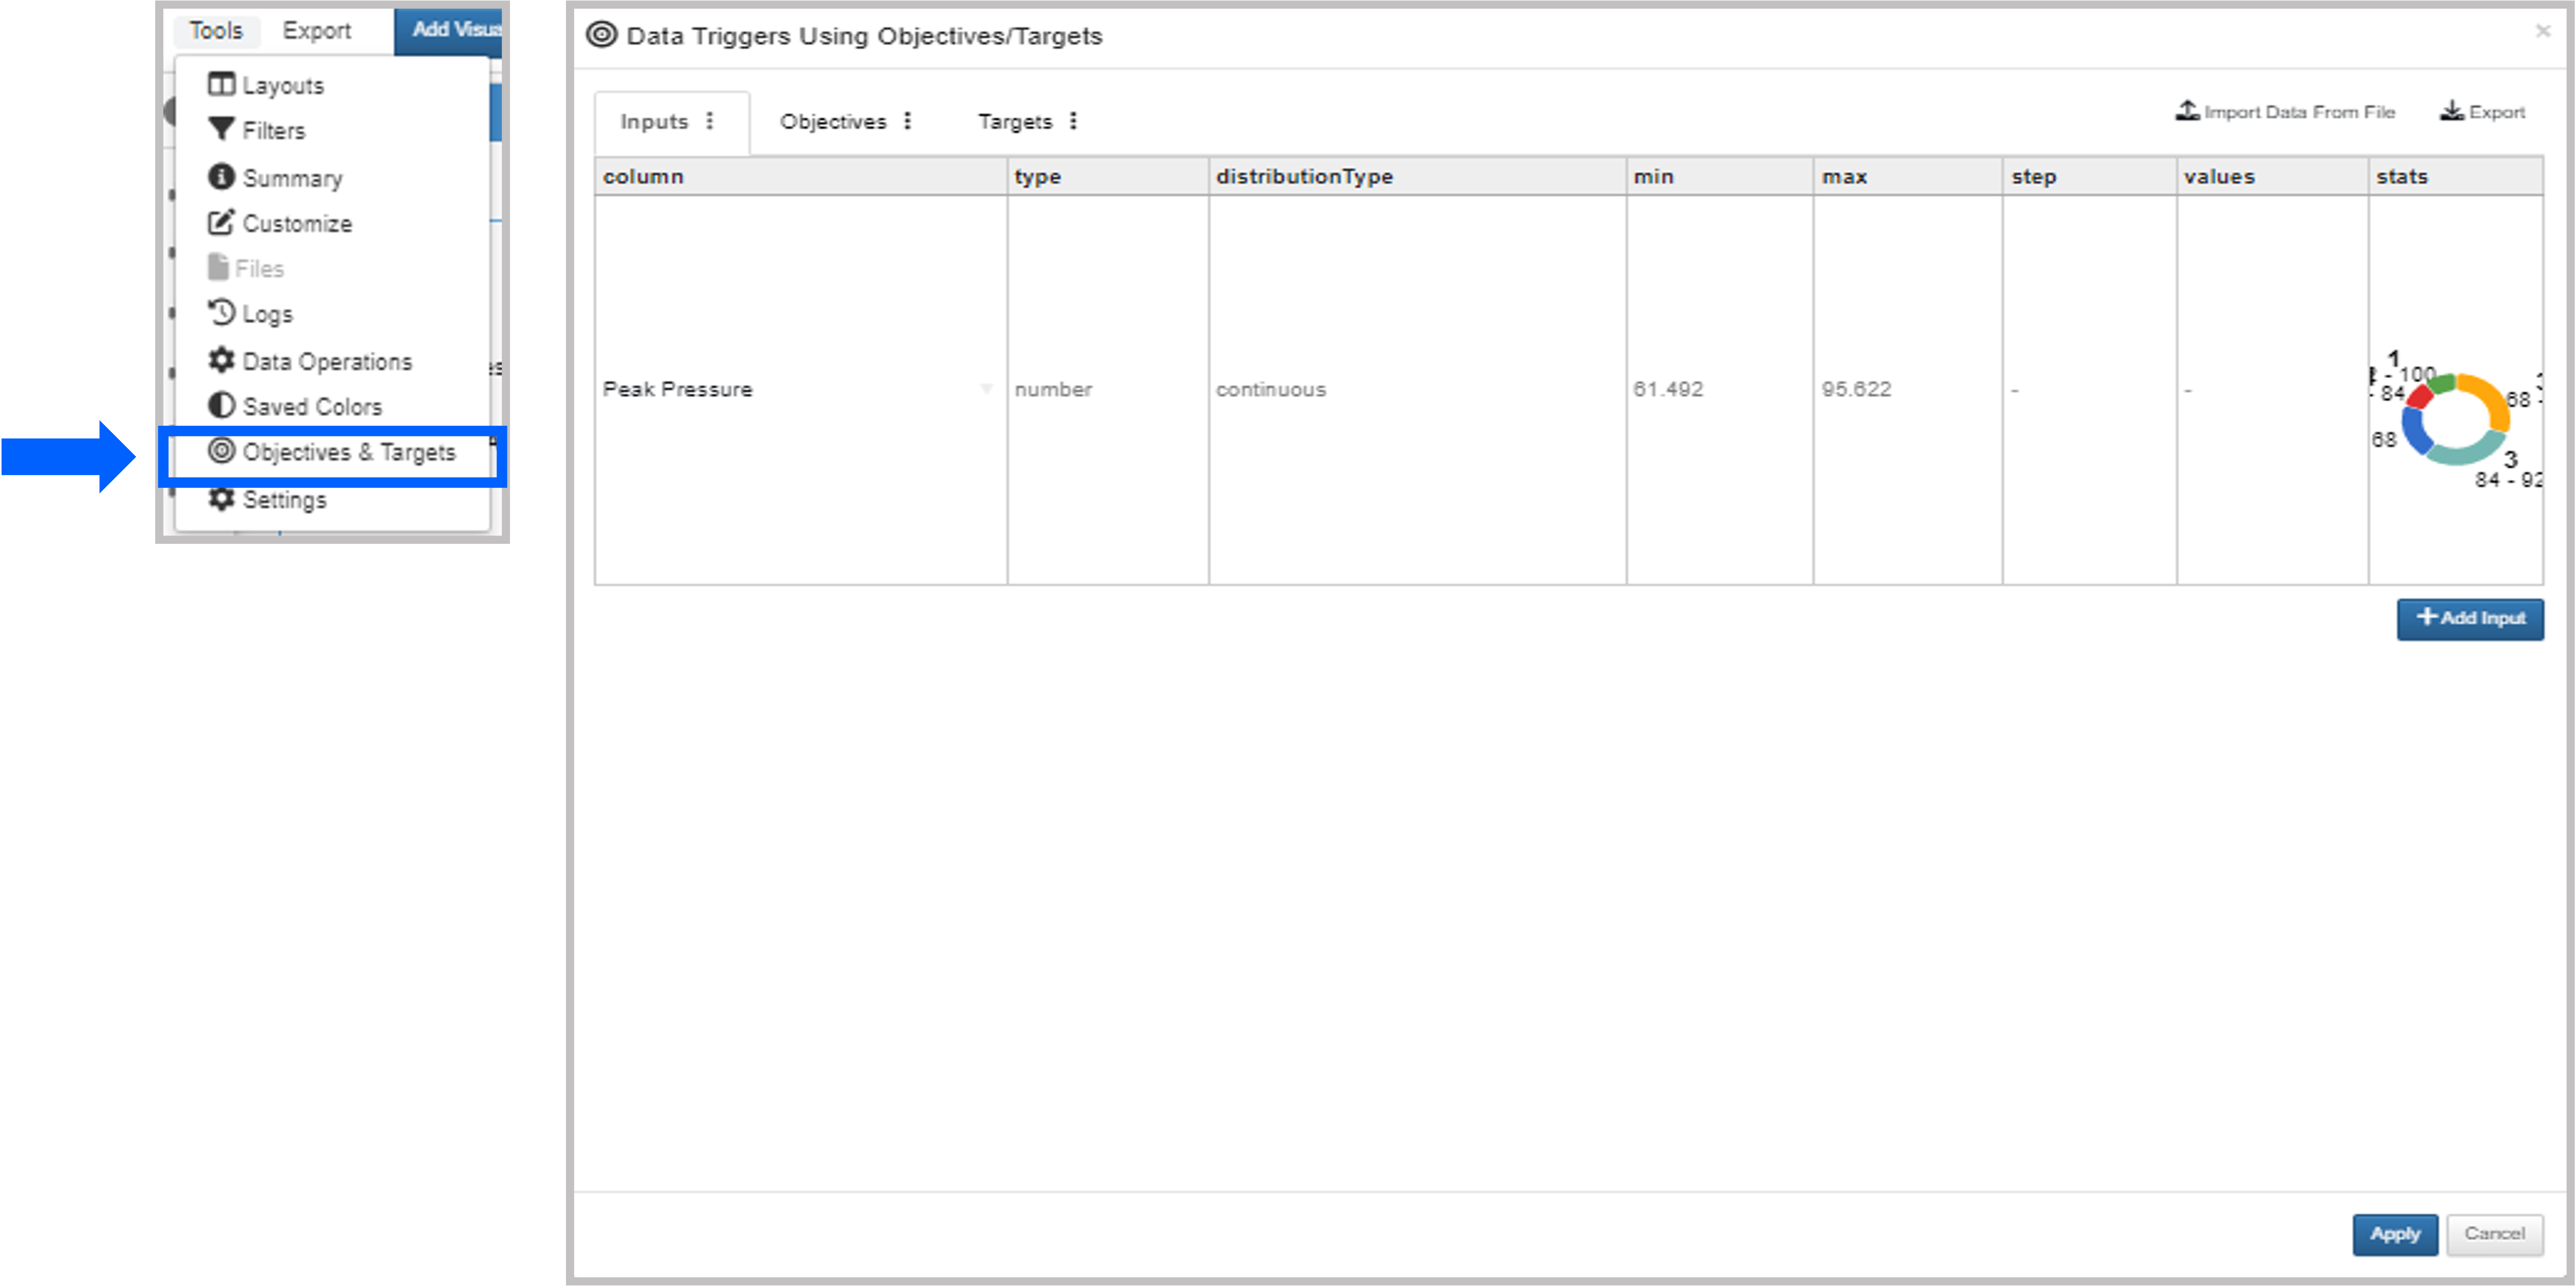
Figure 15: Objectives & Targets
Minimizing the Dataset
If we want to keep our dataset open but do something else on the platform, we can now minimize the dataset window, located at the top right next to the close button.
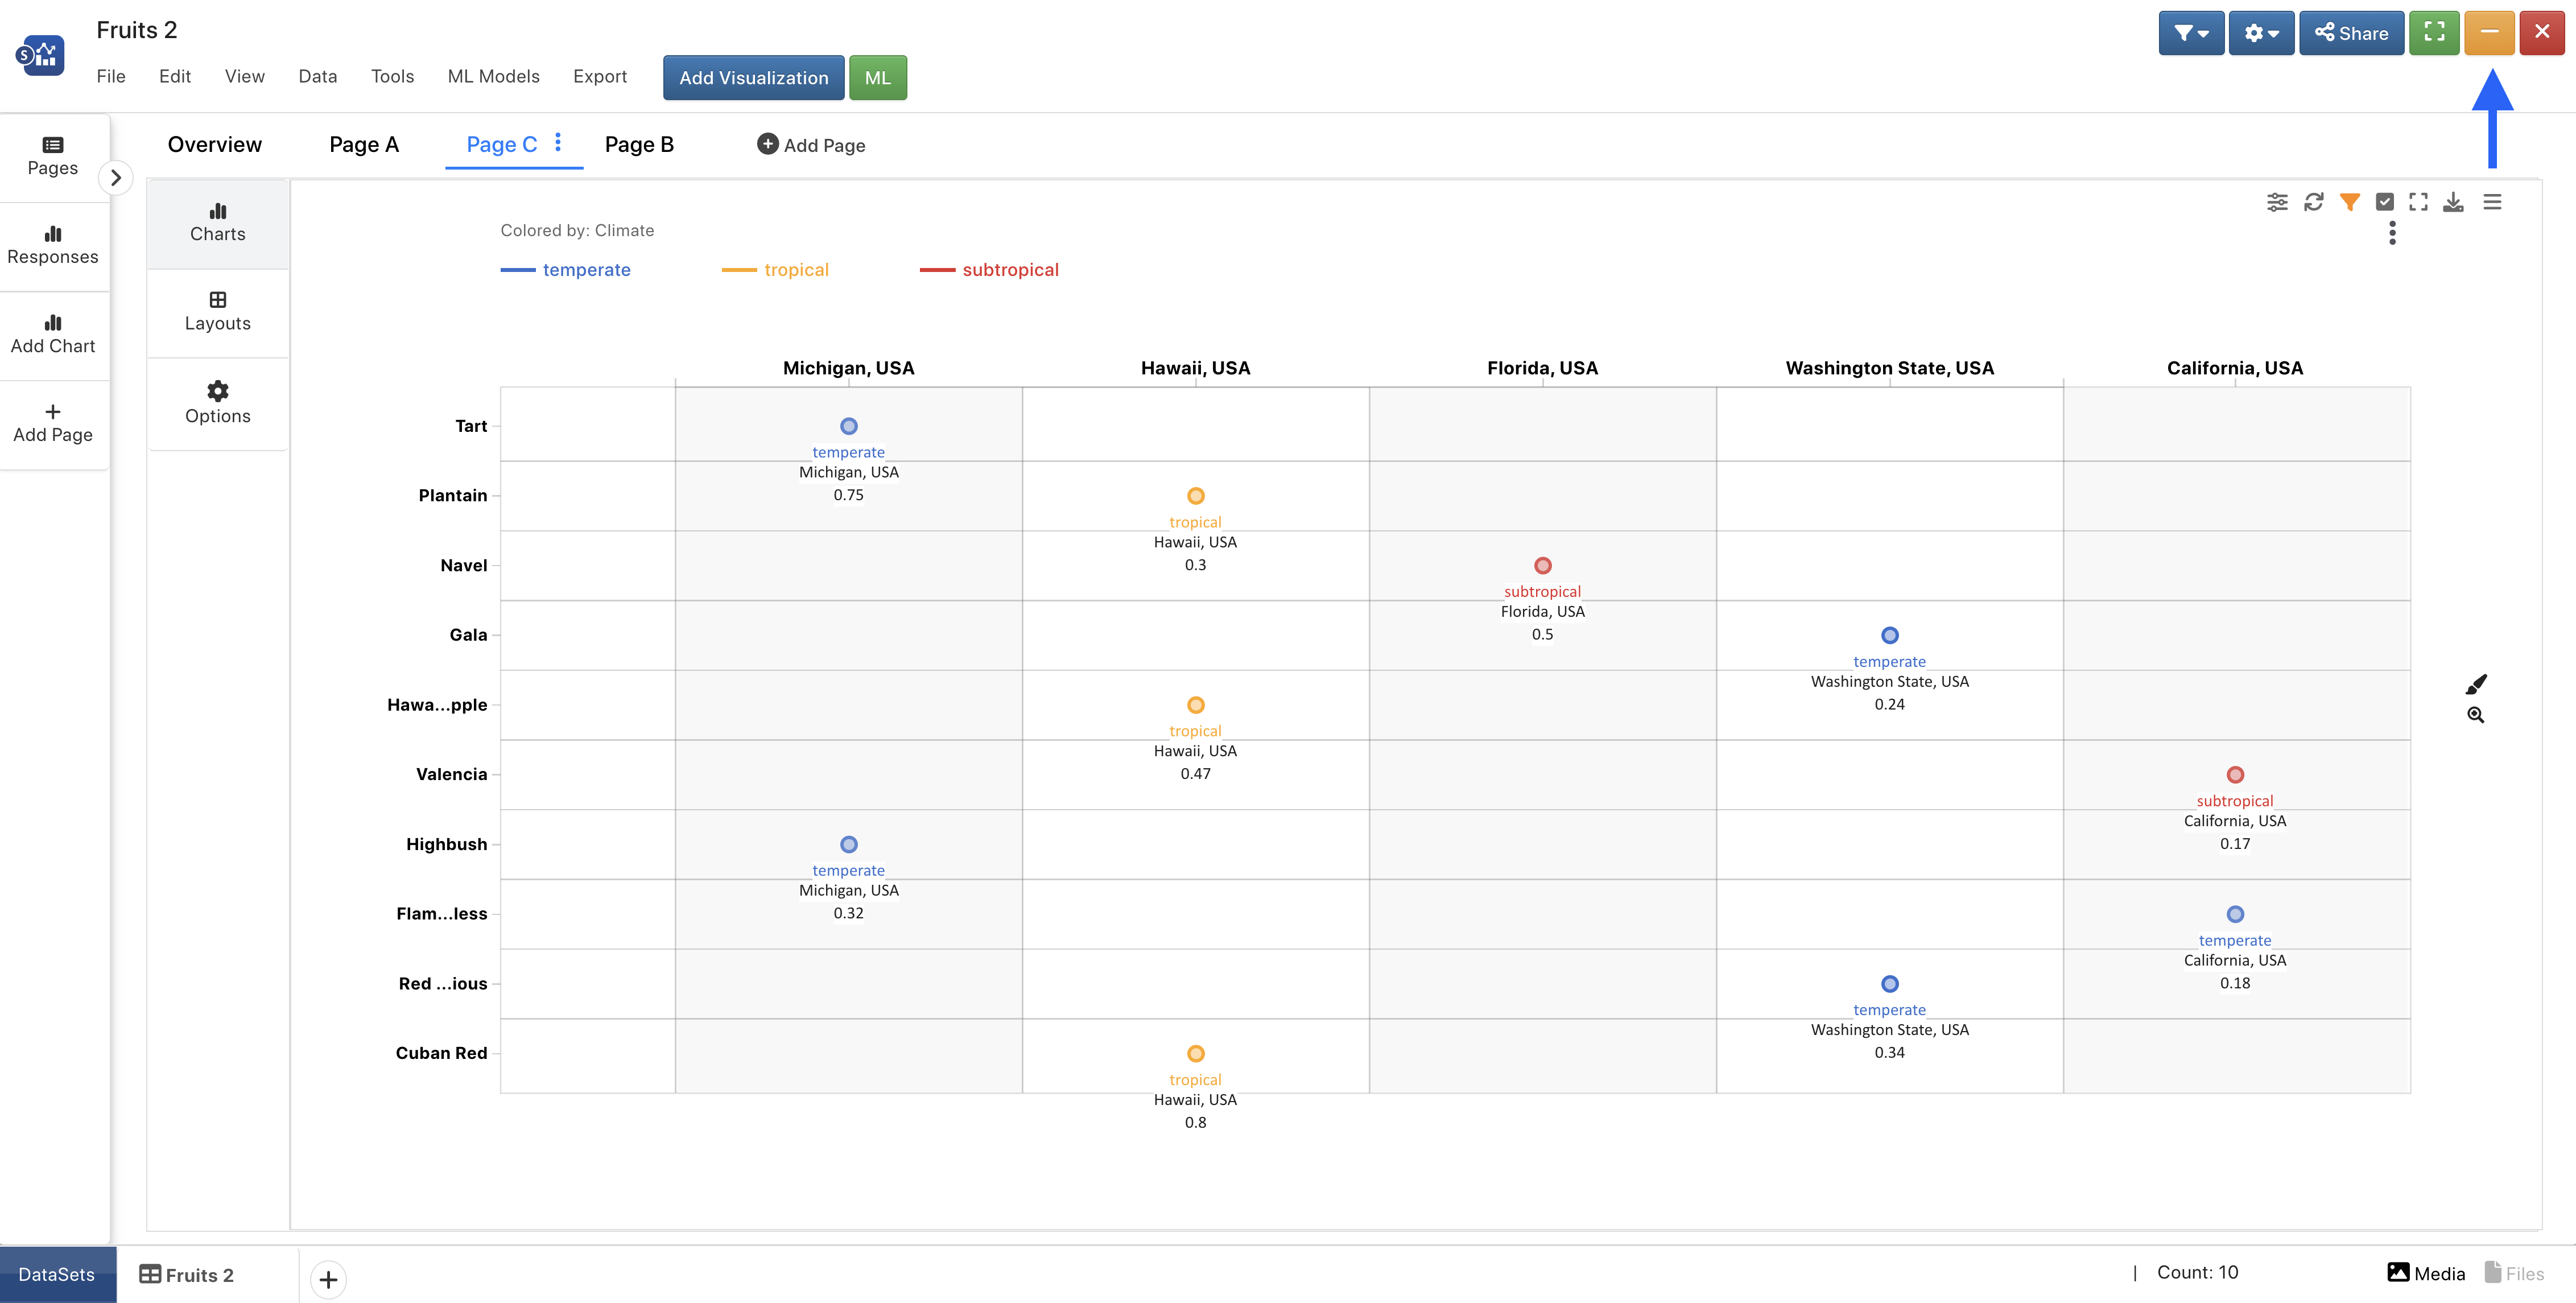
Figure 15: Minimize the Dataset
Here it is in action:
Dataset Layouts
If we have an exploration structure we’d like to save for later use either on the same dataset or in different but similar datasets, we can save it as a dataset layout. Do this under the Layouts Panel by clicking this option in the Tools Menu.
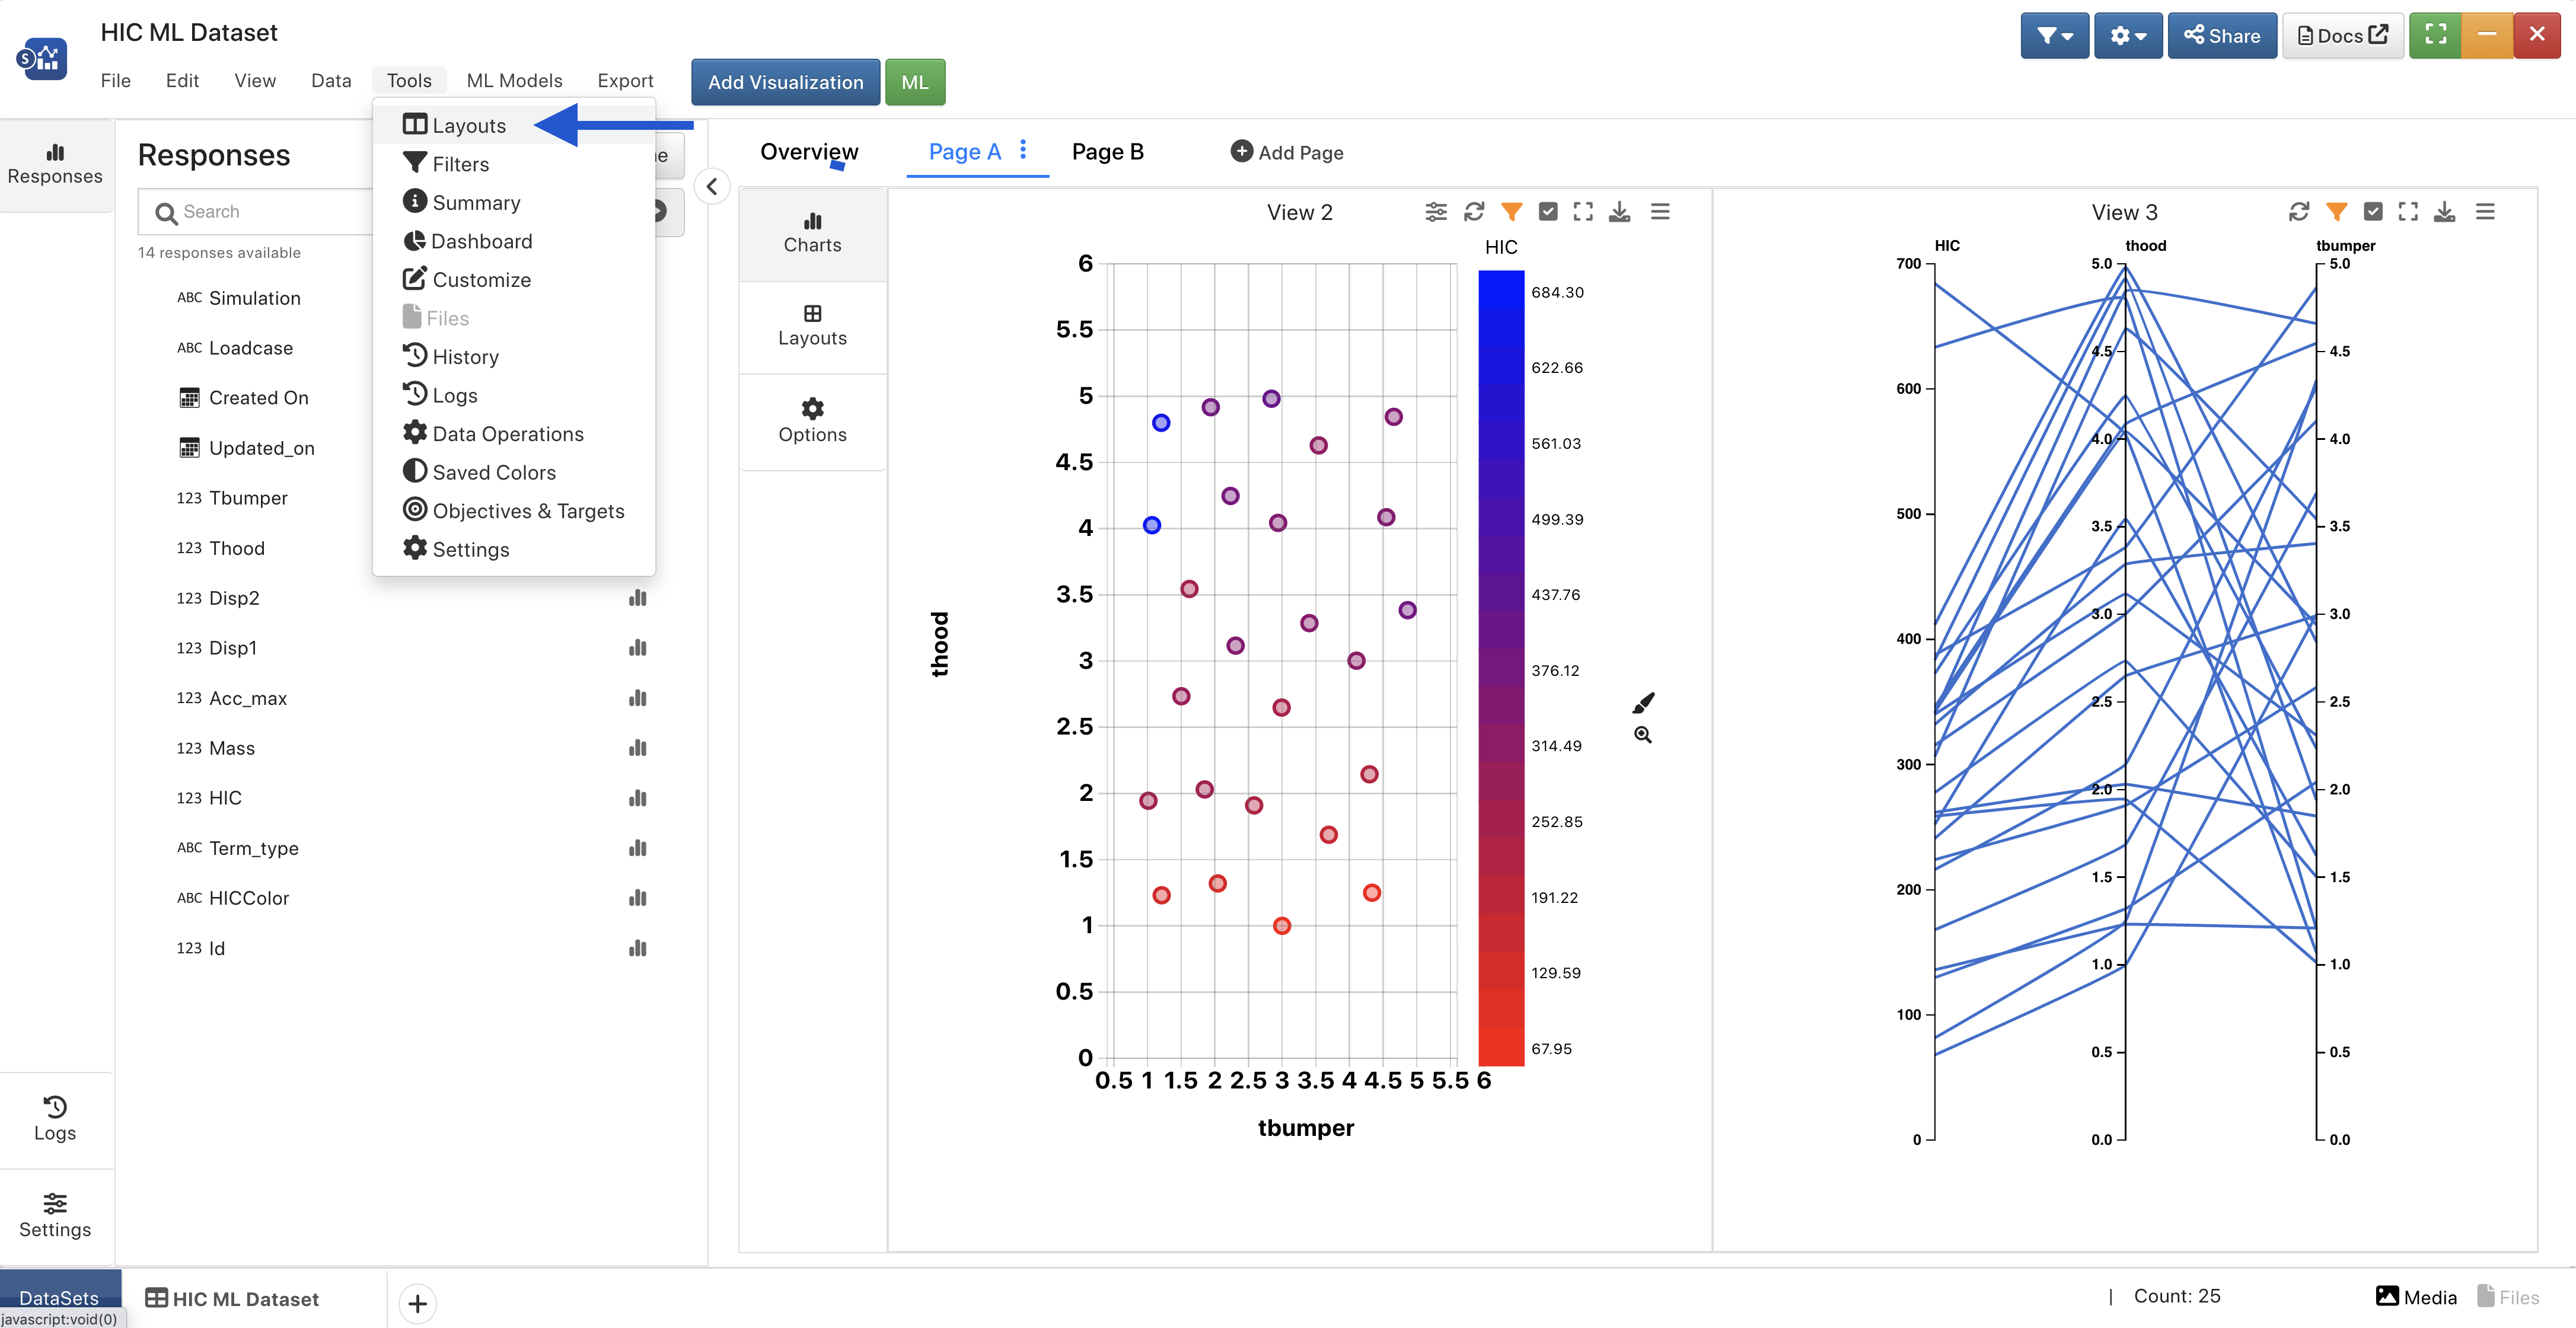
Figure 16: Tools > Layouts
Once the layout panel is open, we can save our current dataset layout (1) or apply a different layout to the current exploration (2).
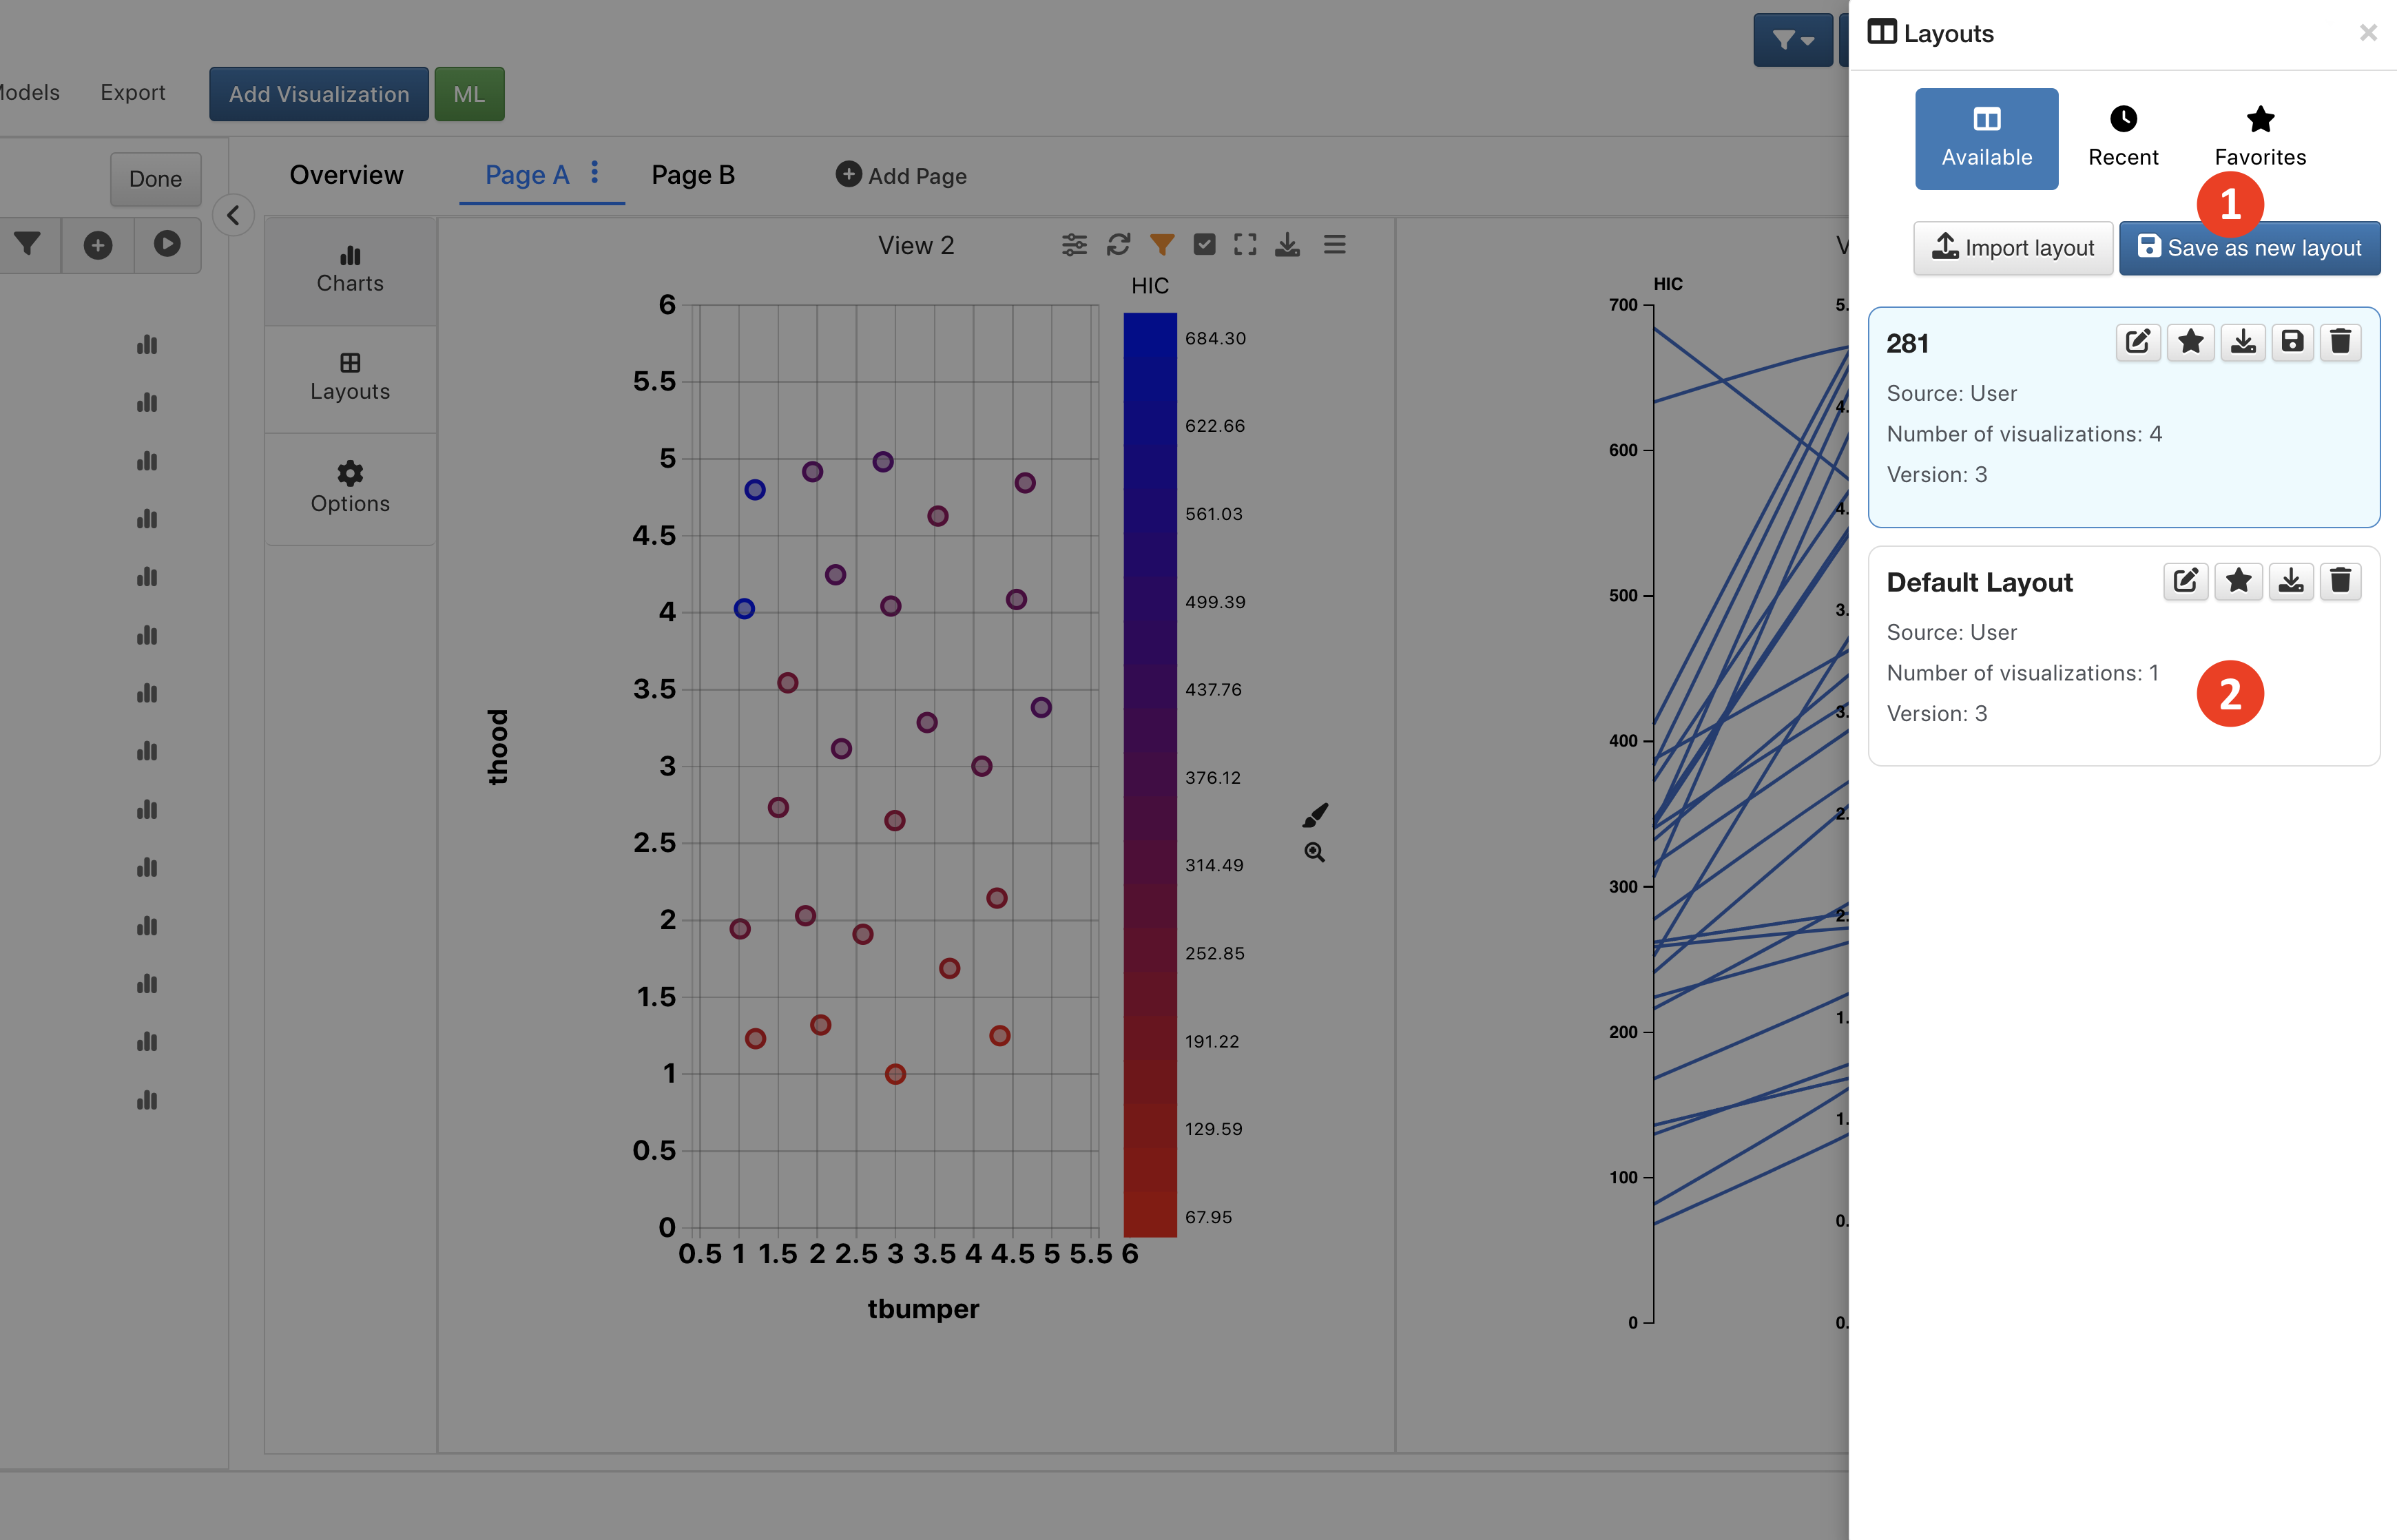
Figure 17: Layouts Panel
Watch this video to view a full explanation of how its done:
We also have an option to import a Template JSON as a dataset Layout. If we have a d3VIEW Template with a specified layout, we can download it as a JSON and then upload it back into Simlytiks as a dataset Layout. Watch the following video to see how to upload it:
Evaluate Ratings
Simlytiks has a tool to manually set up ratings for any data column allowing us to organize and calculate where we need to improve in our data. Find this options under the Tools Menu.
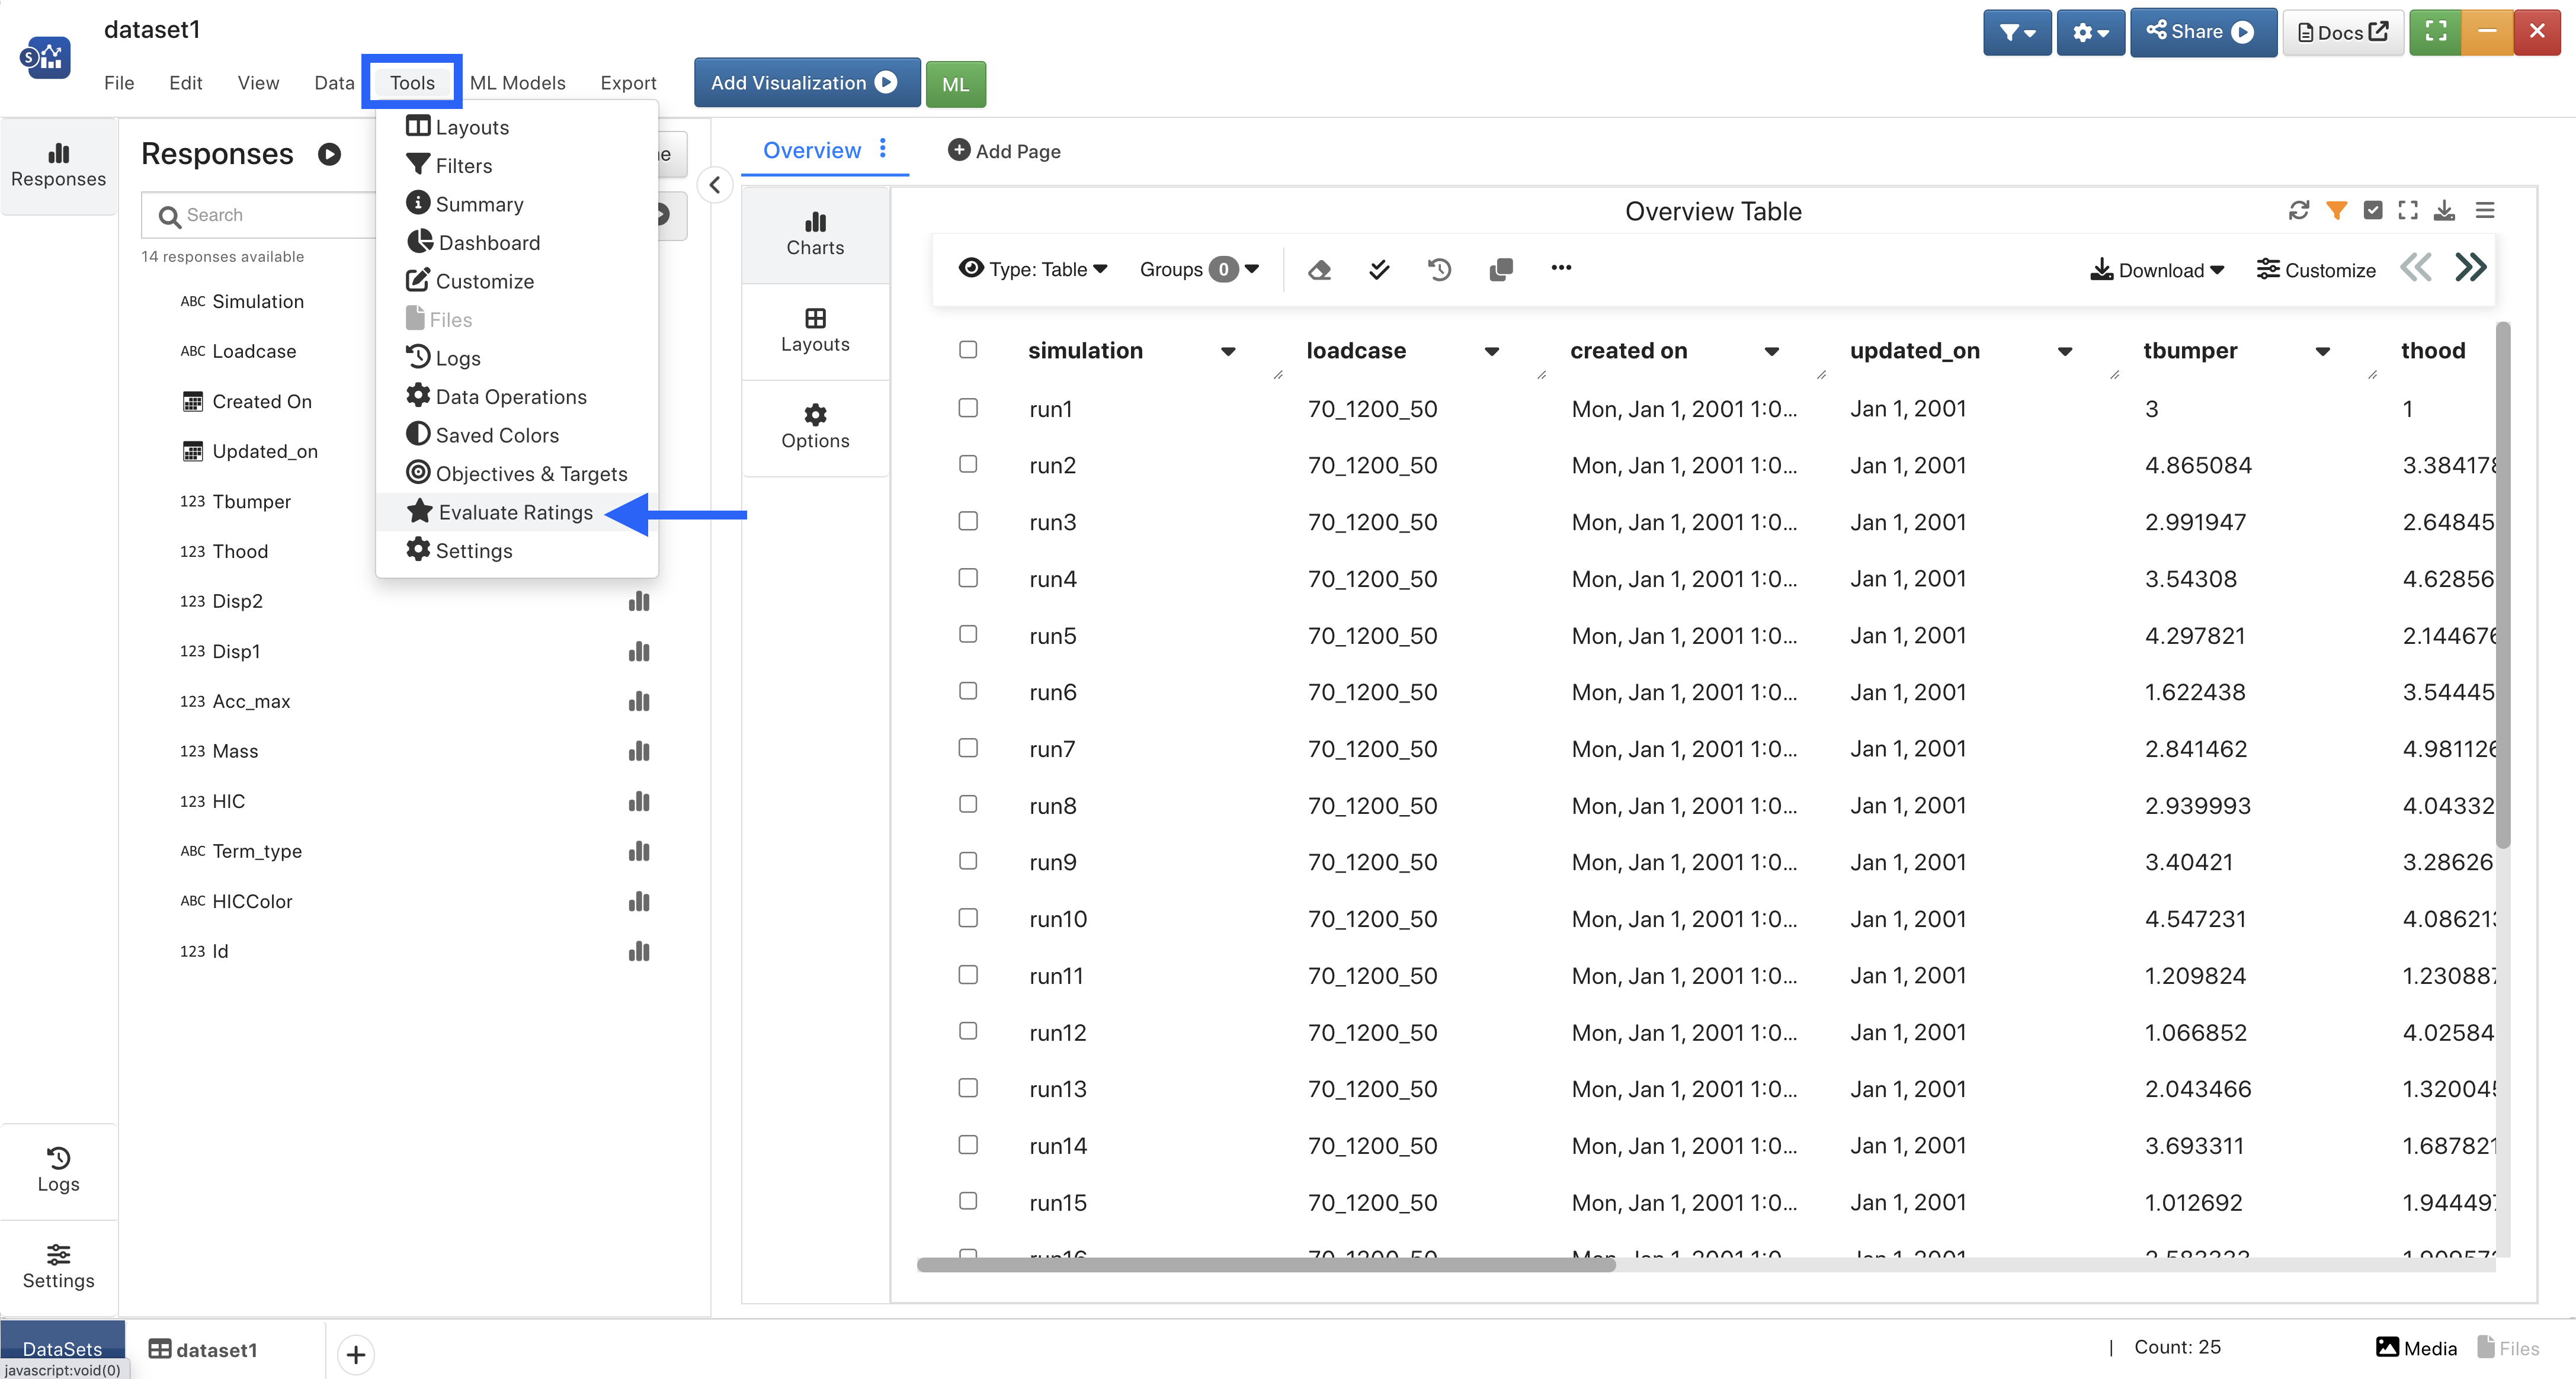
Figure 16: Tools > Ratings
With this option, we can determine the parameters such as color and value of our ratings to help keep score of our data. Watch the following video to see how it’s done using basic expression but make sure to read on for more information and detailed explanations for both basic and advanced.
Guidelines for Creating Ratings
These guidelines can be followed for both basic and advanced rating creation.
- Name of the rating should be non-empty and unique, else it will throw a name error.
- Value of rating should be non-null and unique, else it will throw a value error.
- Weight of all ratings should be 1, else it will throw an error.
- Default color of each rating is gray (#eee).
- By default, d3VIEW generates a random rating name and value, but we can modify them as desired.
Basic
Basic Rating Expression is set-up by creating rules for a specific rating. It is set-up in a list format showing all added ratings with their rules under the “Create/Edit Rules” toggle button.
The following image illustrates each option when adding a basic rating.
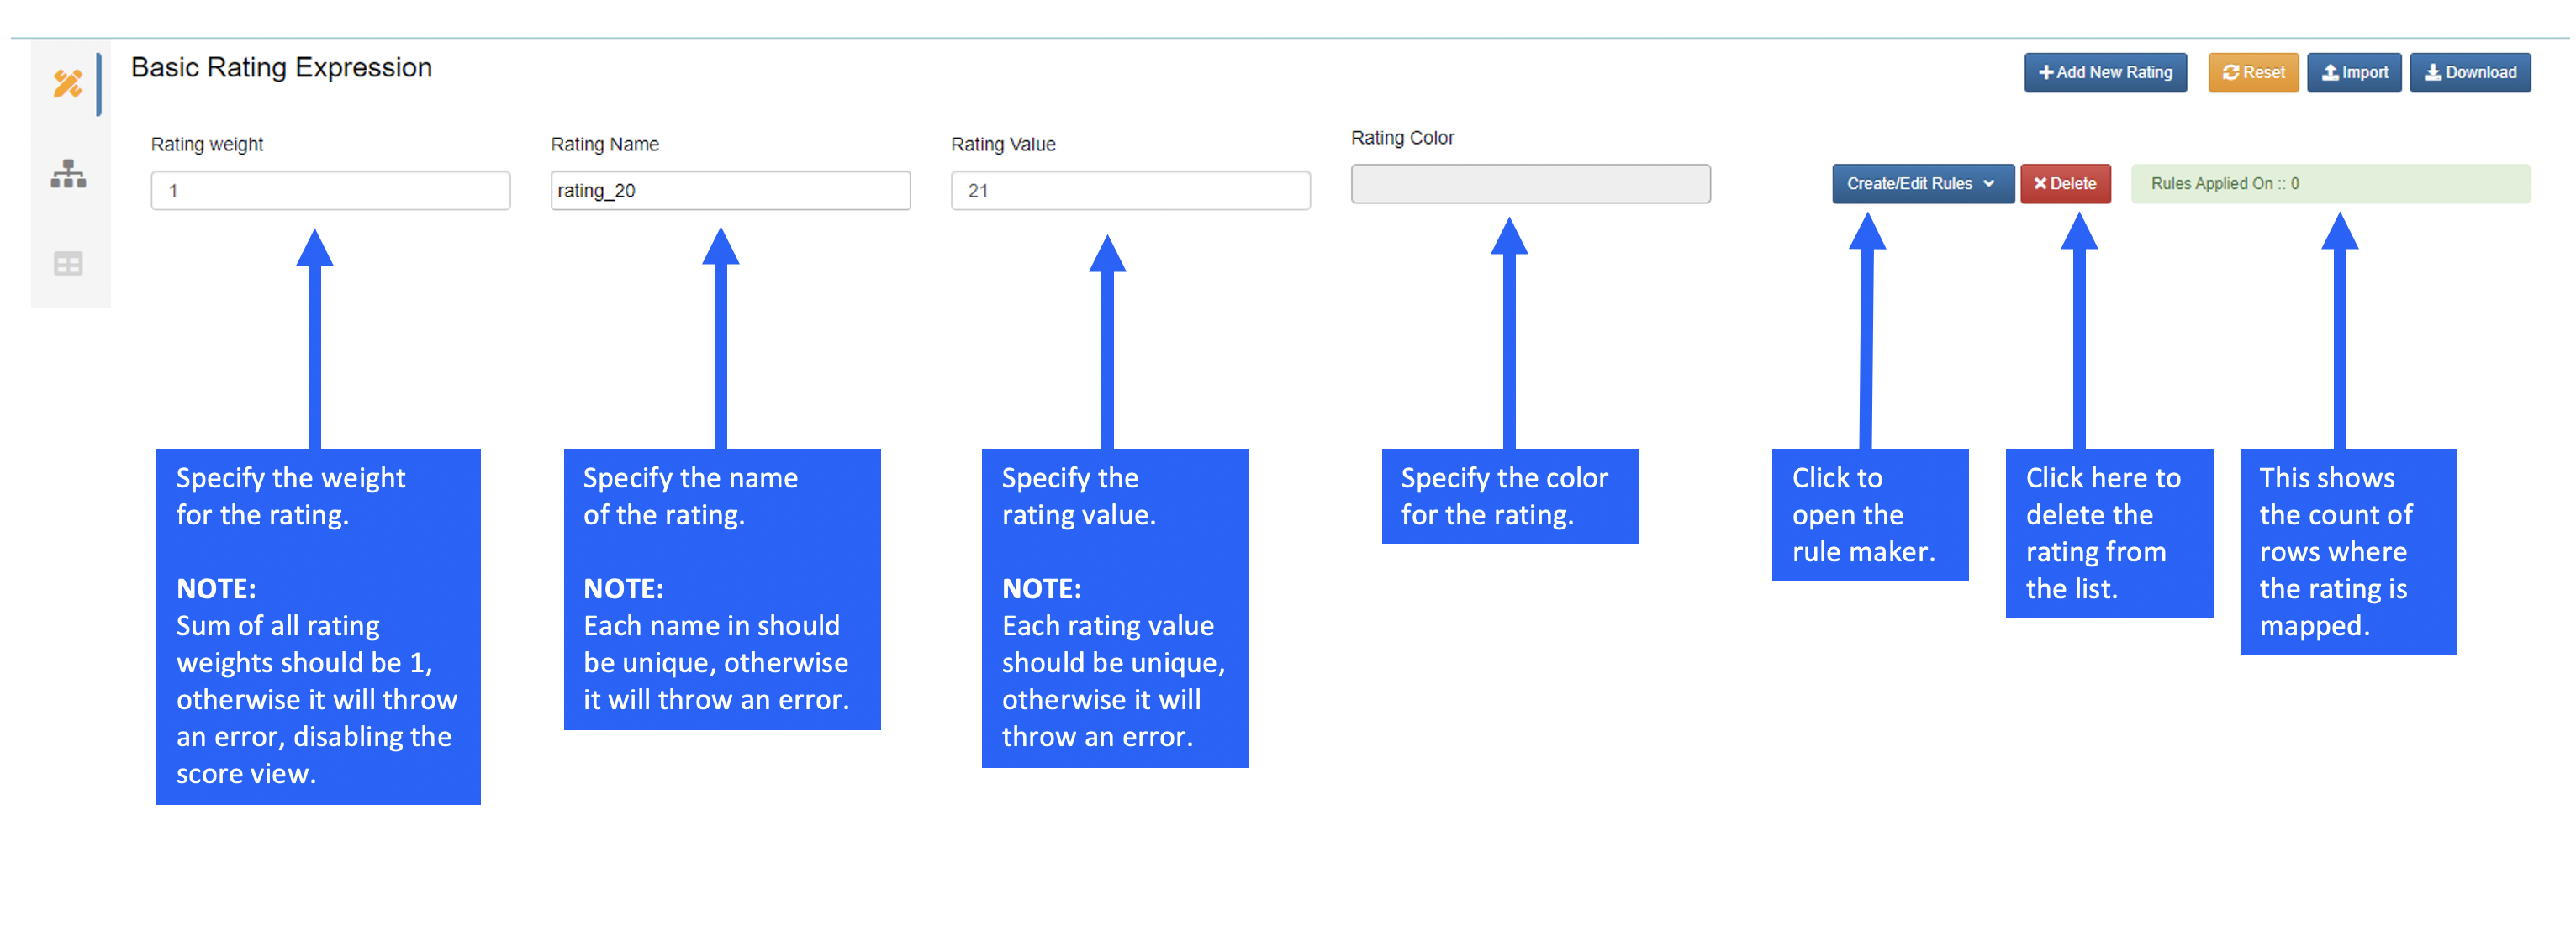
Figure 17: Basic Rating Expression
The following image illustrates each option when adding a rule to a basic rating.
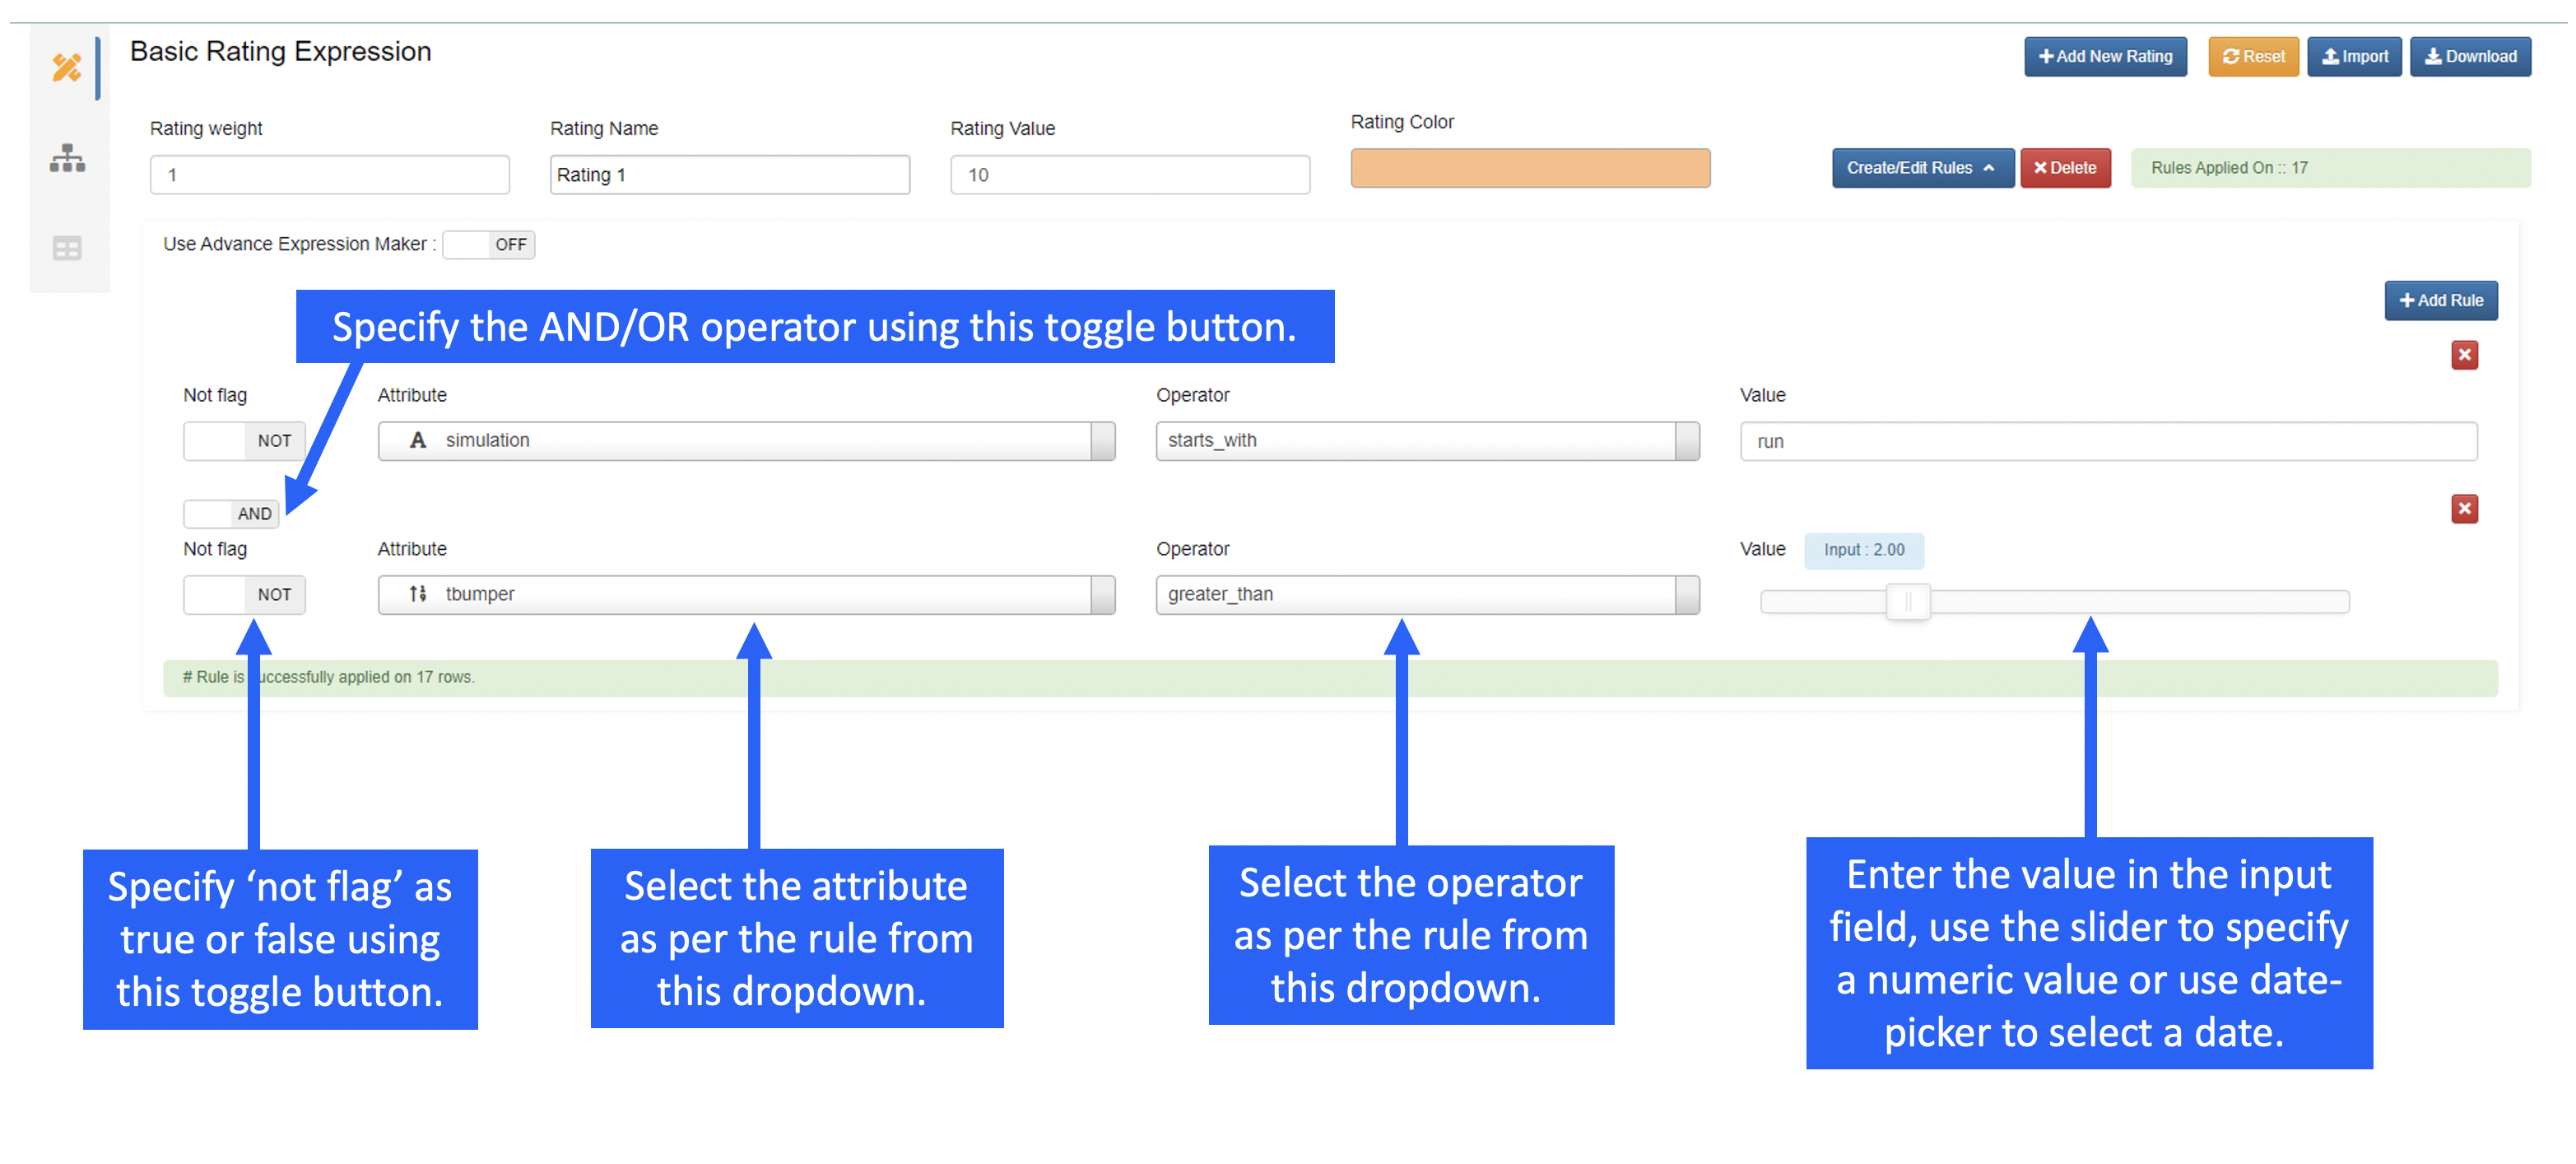
Figure 18: Basic Rating Rule
We can also use the advanced expression maker to create rules for our basic ratings. (This is different than the Advanced Rating Expression which is discussed in the following subsection).
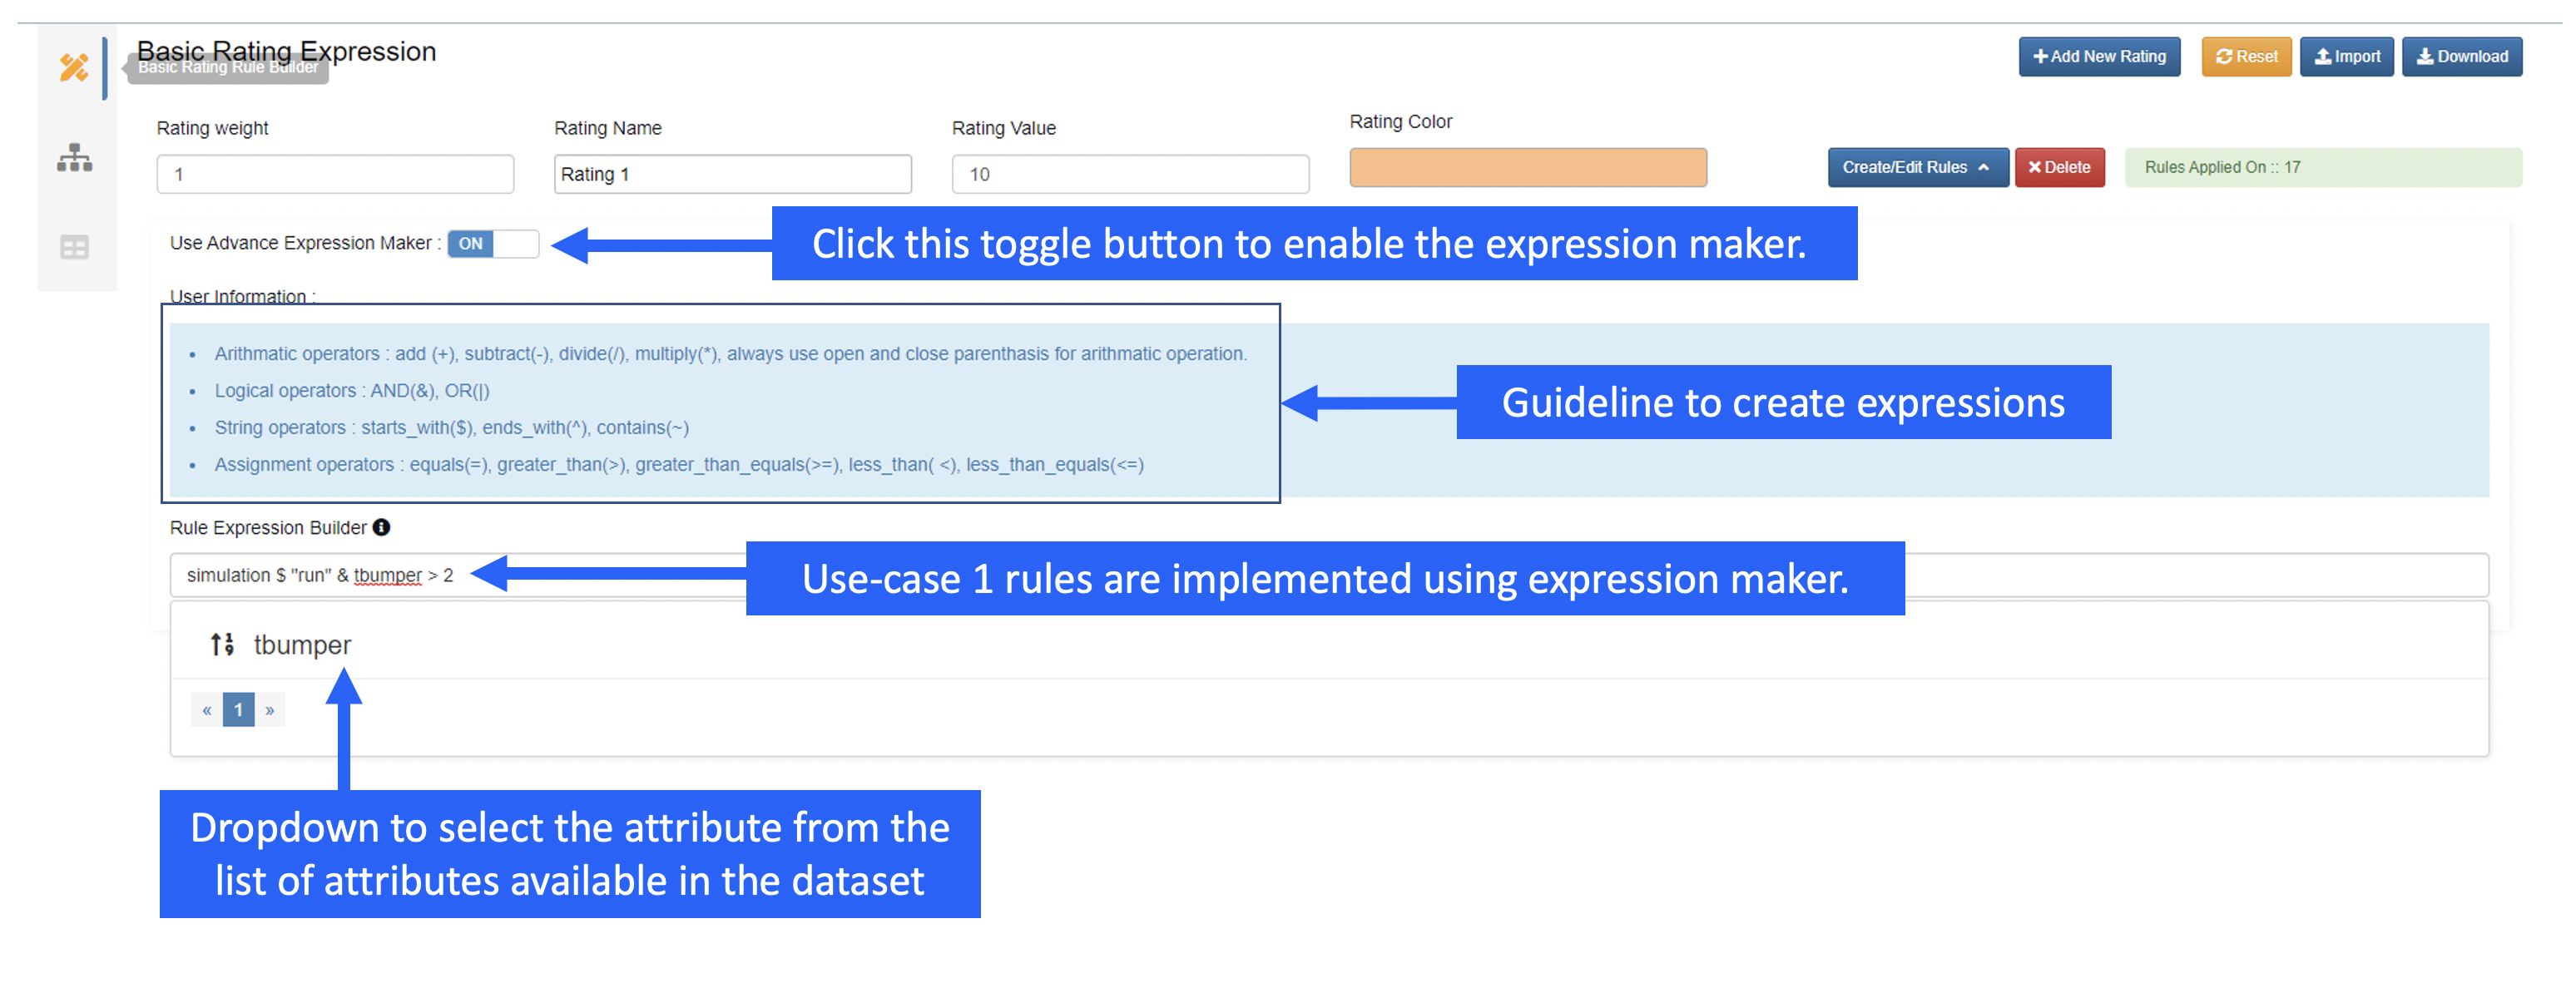
Figure 19: Advanced Expression Maker
Here is an example of basic rating set-up:
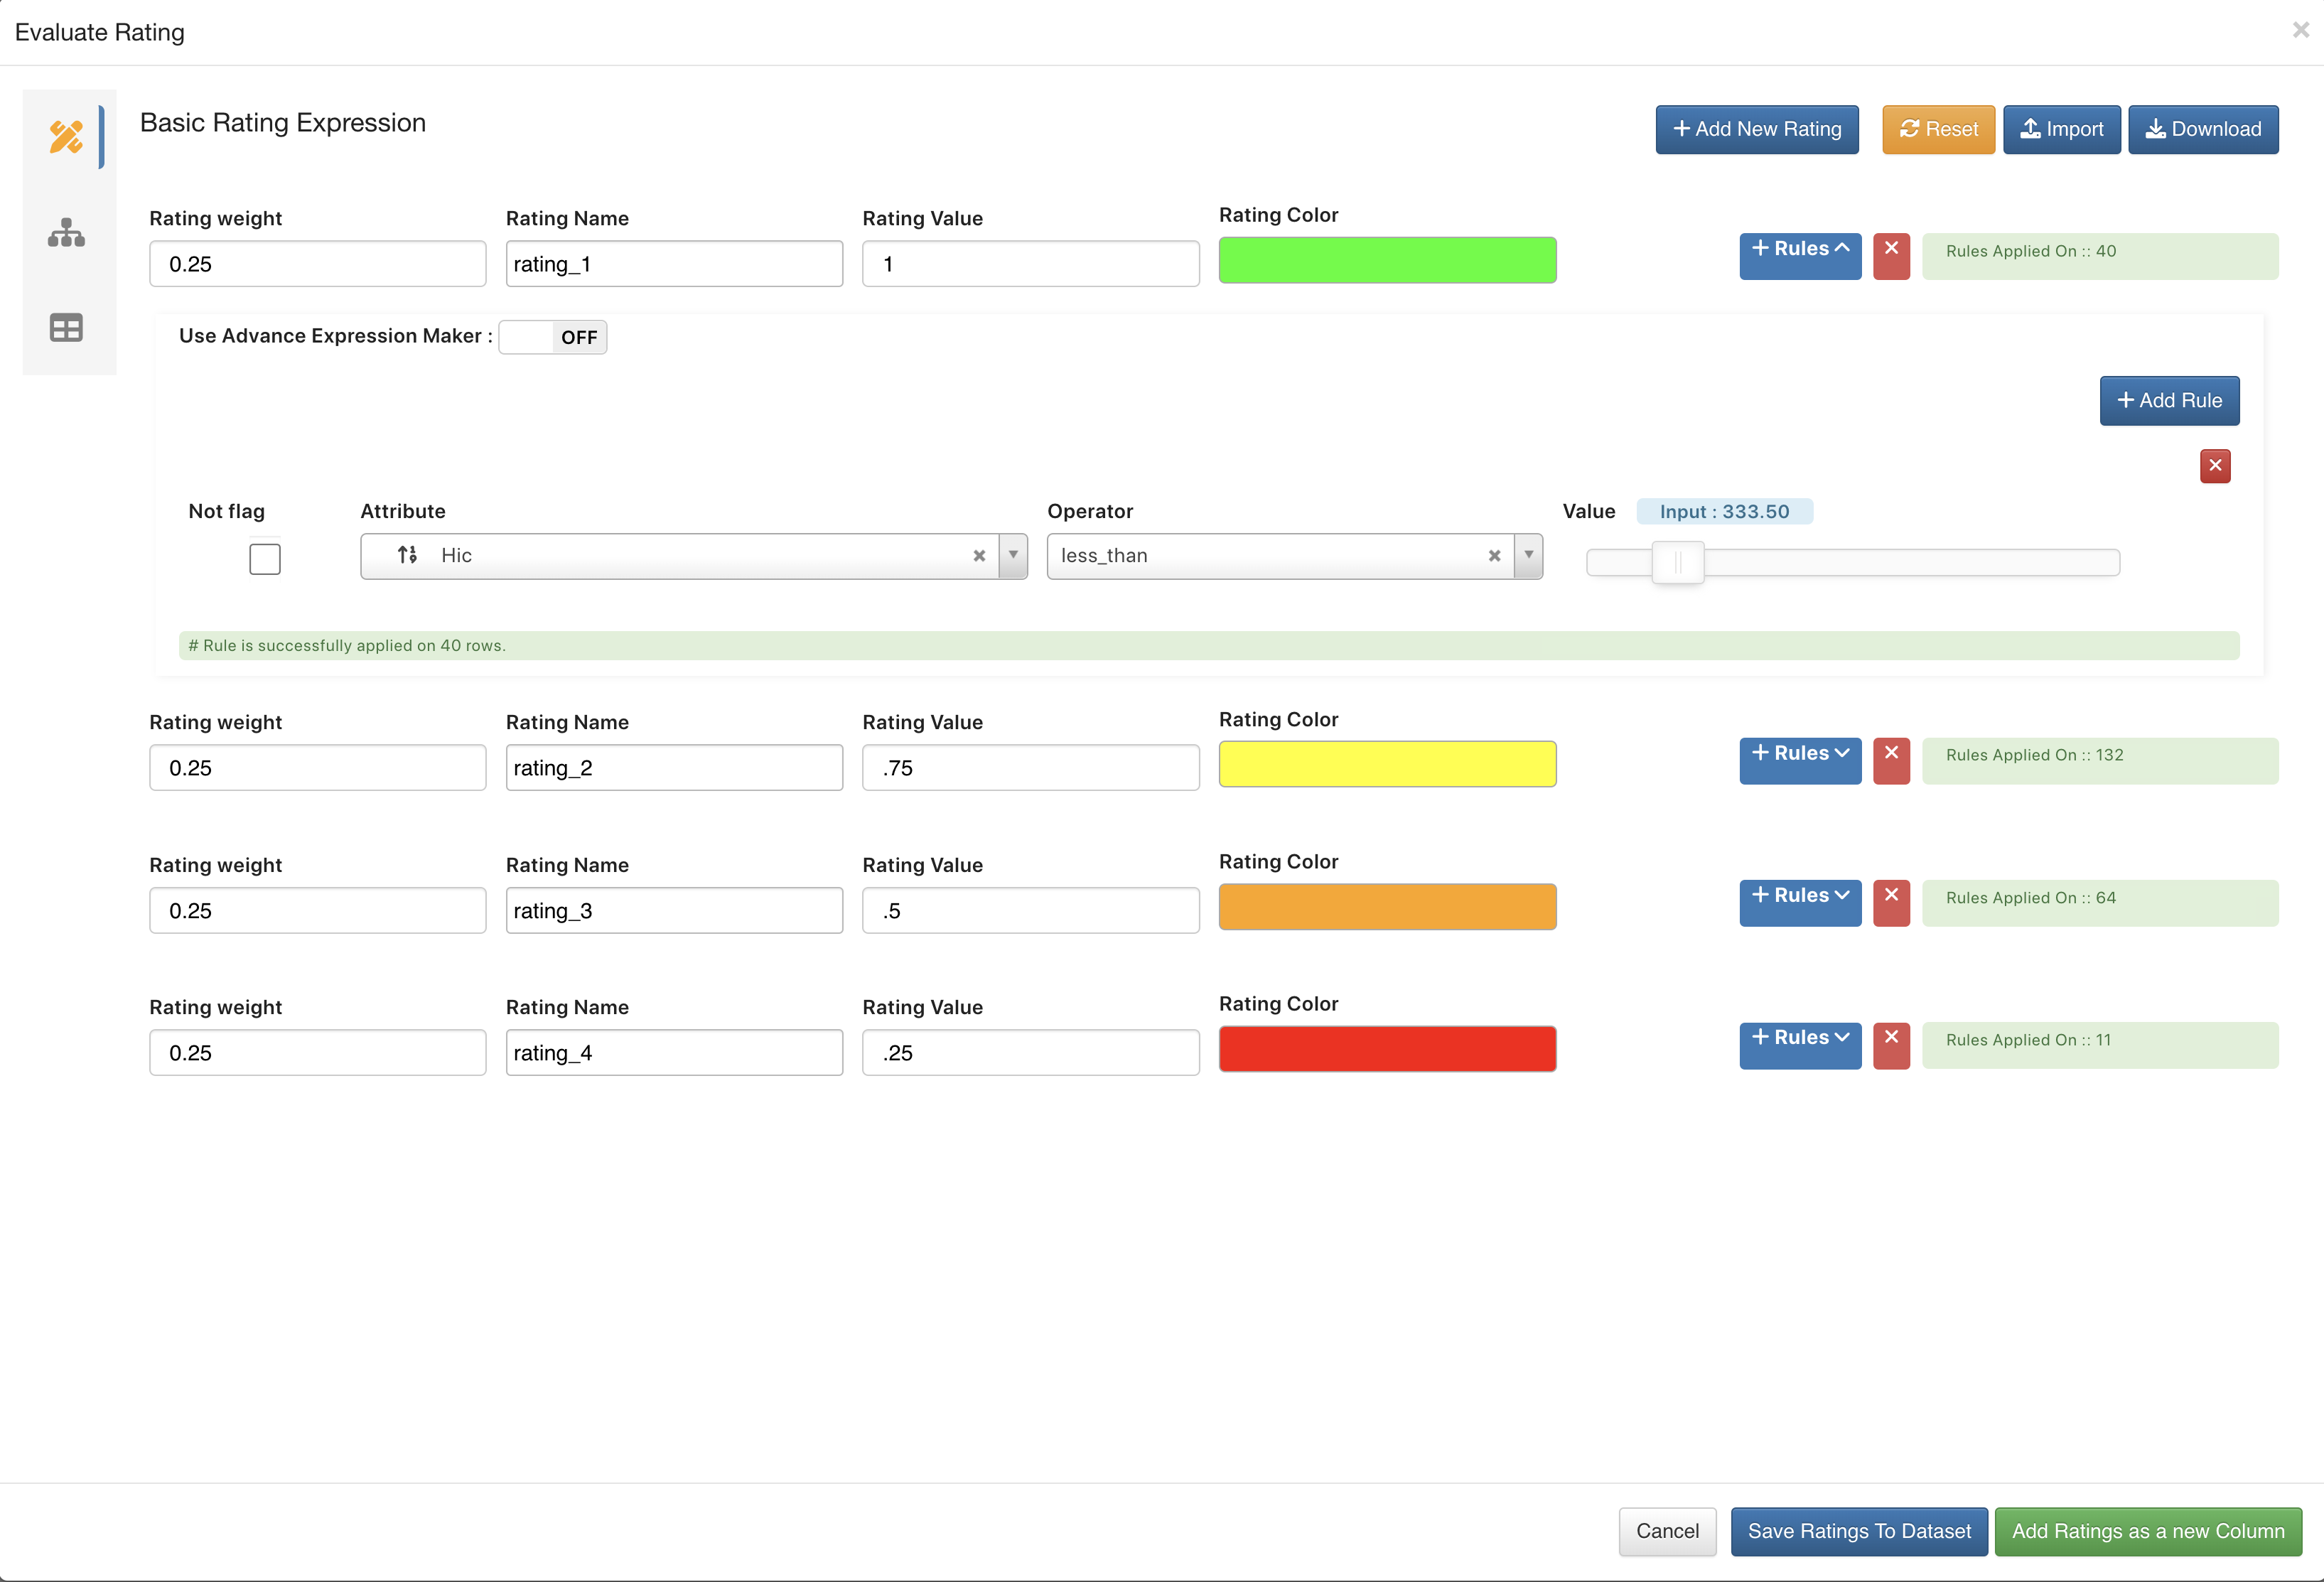
Figure 20: Basic Ratings
Advanced
Advanced ratings is set-up similar to a decision tree and is especially useful for multi-column ratings.
For the Advanced Rating Expression Maker:
- Each non-leaf node will hold a condition and the output of these condition nodes could either be true or false.
- Each leaf node will hold rating information.
- Start from the root node and traverse vertically in top-down approach to each of the leaf nodes to create the tree.
- By default, we will see a decision tree with one empty node.
The following image illustrates non-leaf and leaf nodes.
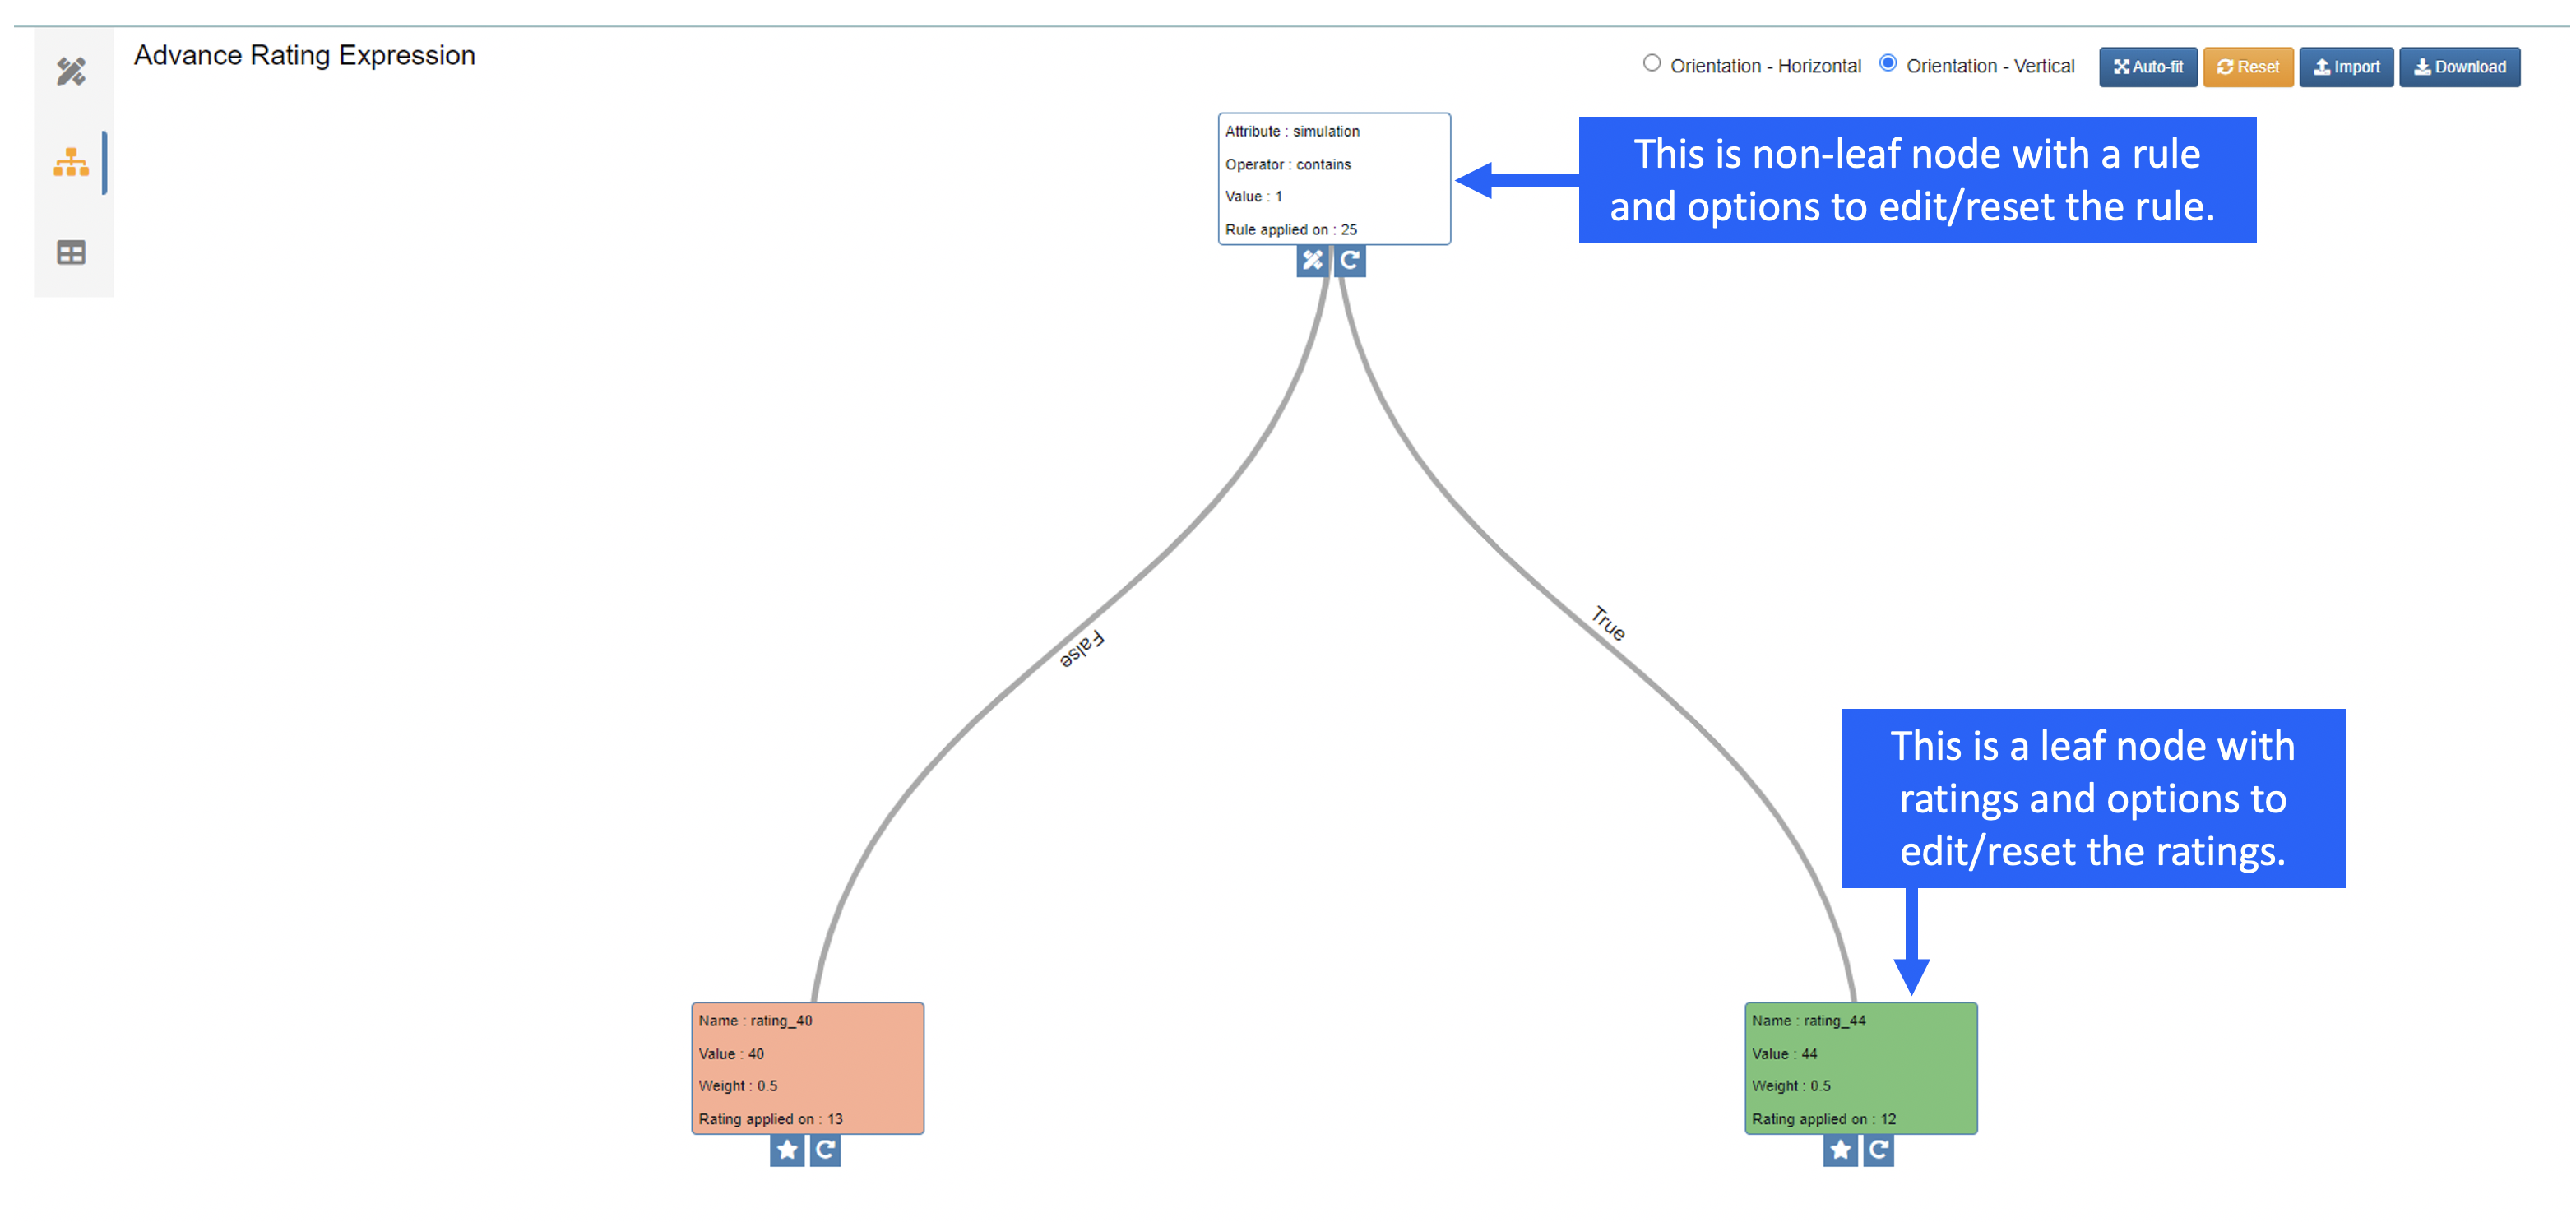
Figure 21: Advanced Rating Expression
We can do the following things in advance view:
# If it is an empty node, we can add a condition or rating using rule maker or rating maker. # If it is a non-leaf node with a condition, then we can either modify the condition or reset the node. # If it is a leaf-node with a rating, then we can either modify the rating or reset the node.
Let’s review each.
- If it is an empty node, we can add a condition or rating using rule maker or rating maker.
Figure 22: Add a Condition or Rating to Empty Node
- If it is a non-leaf node with a condition, then we can either modify the condition or reset the node.
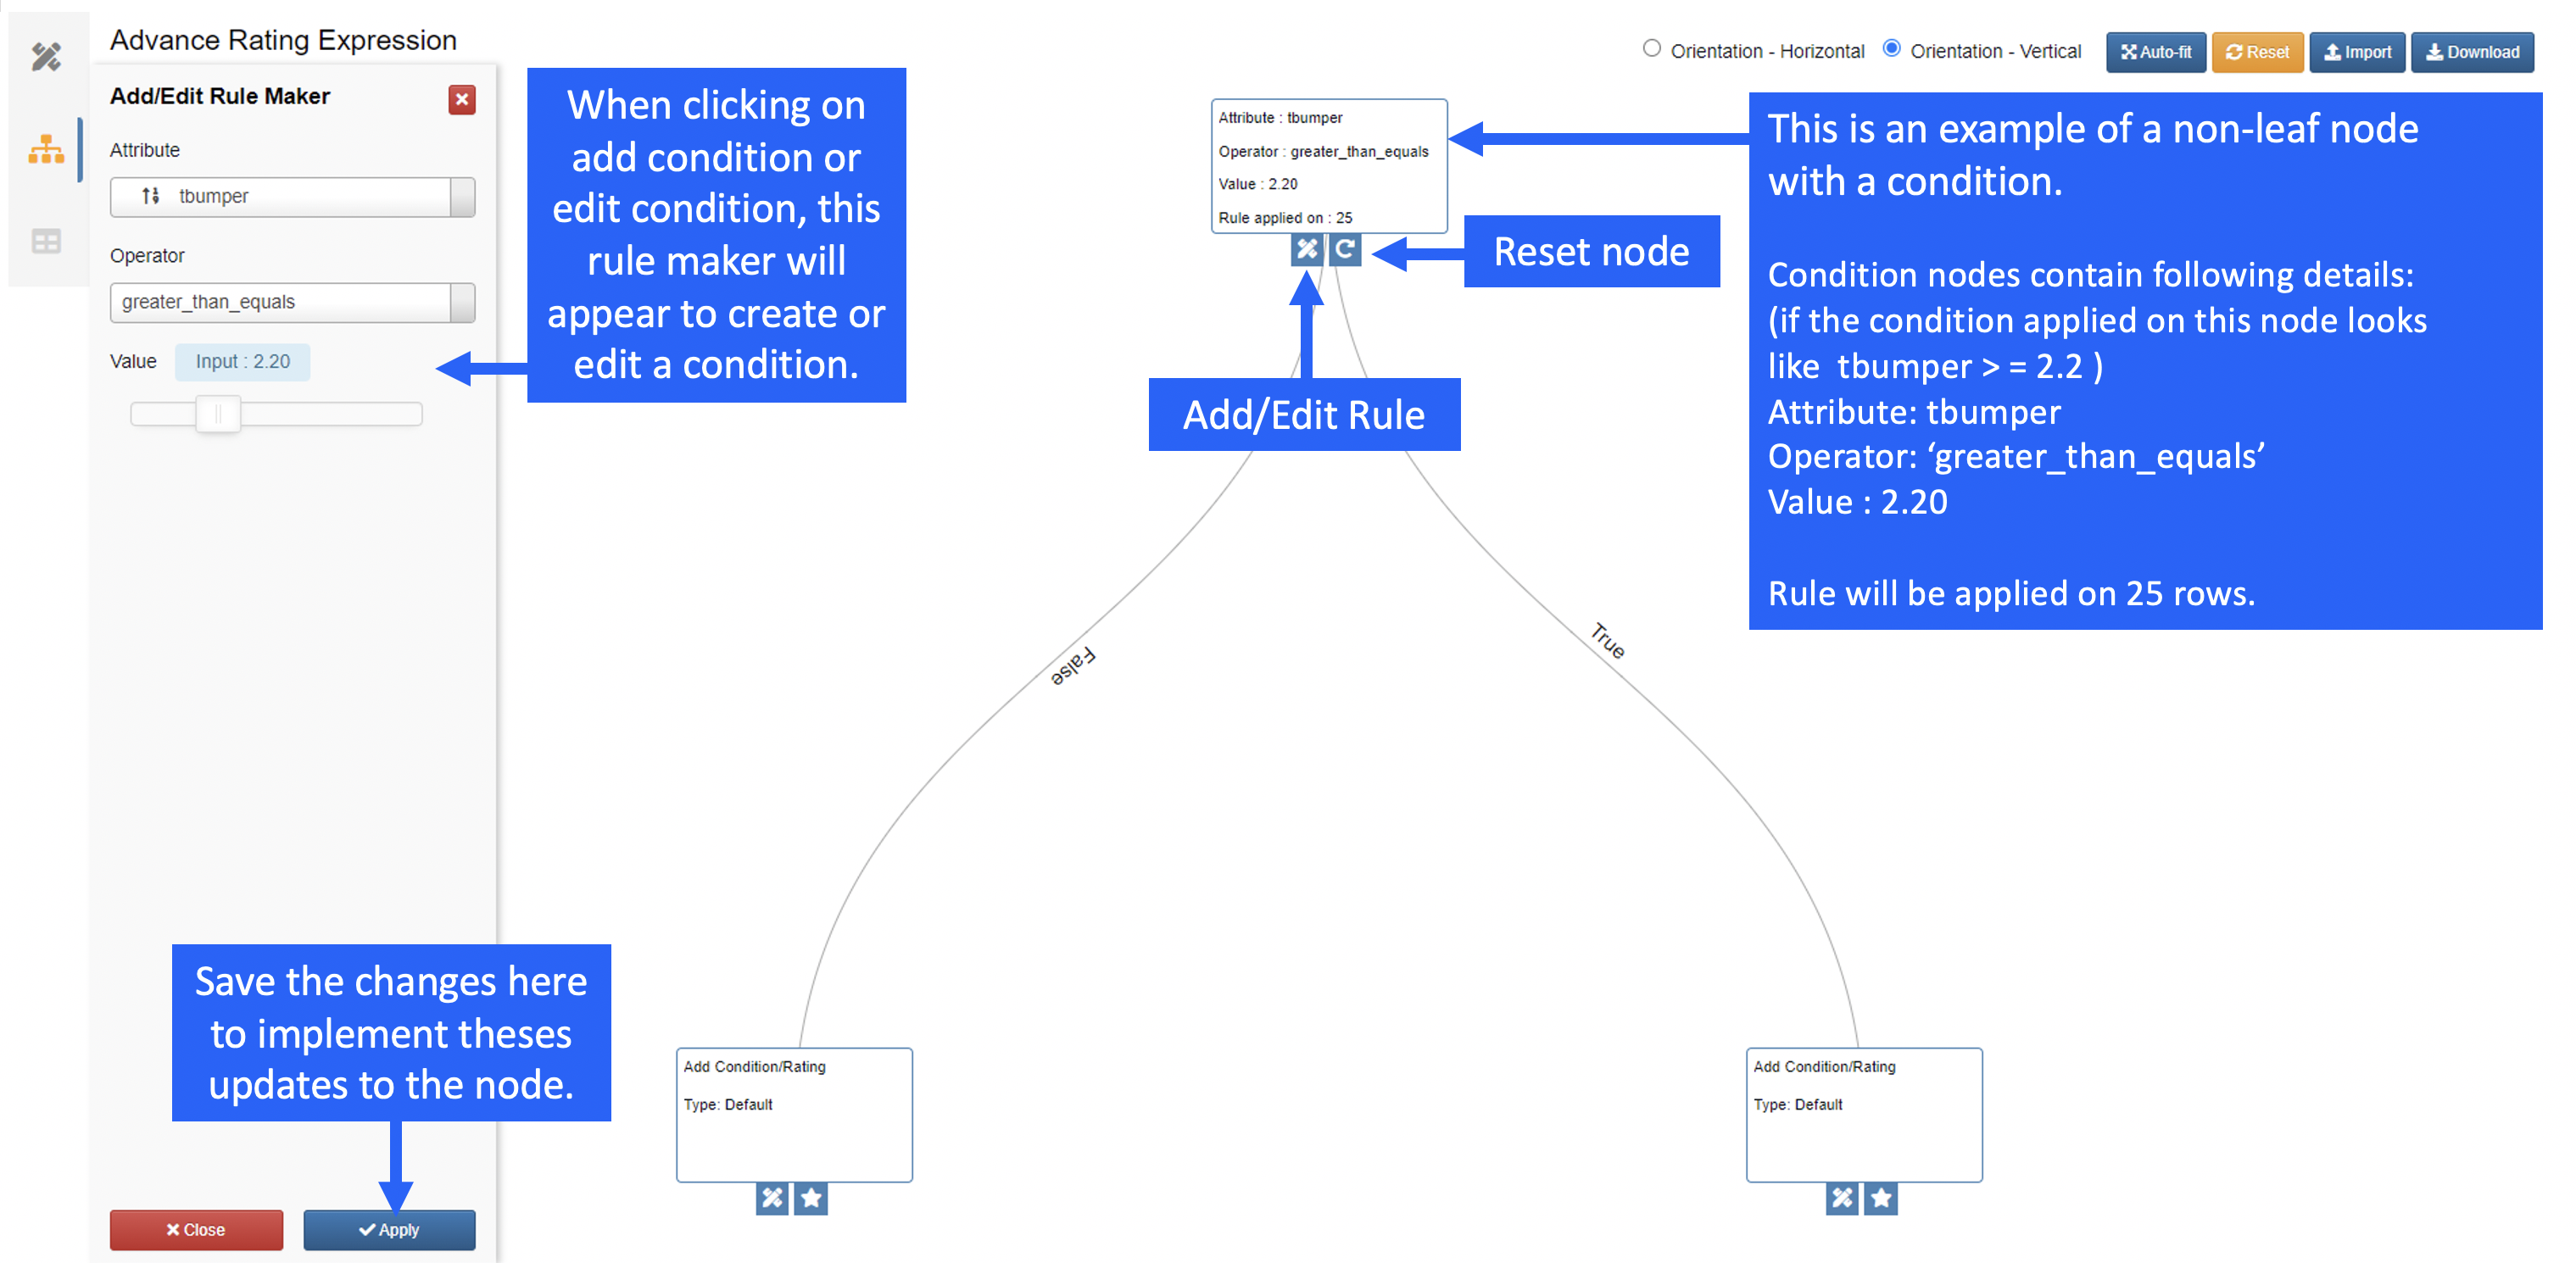
Figure 23: Modify Condition for Non-Leaf Node
- If it is a leaf-node with a rating, then we can either modify the rating or reset the node.
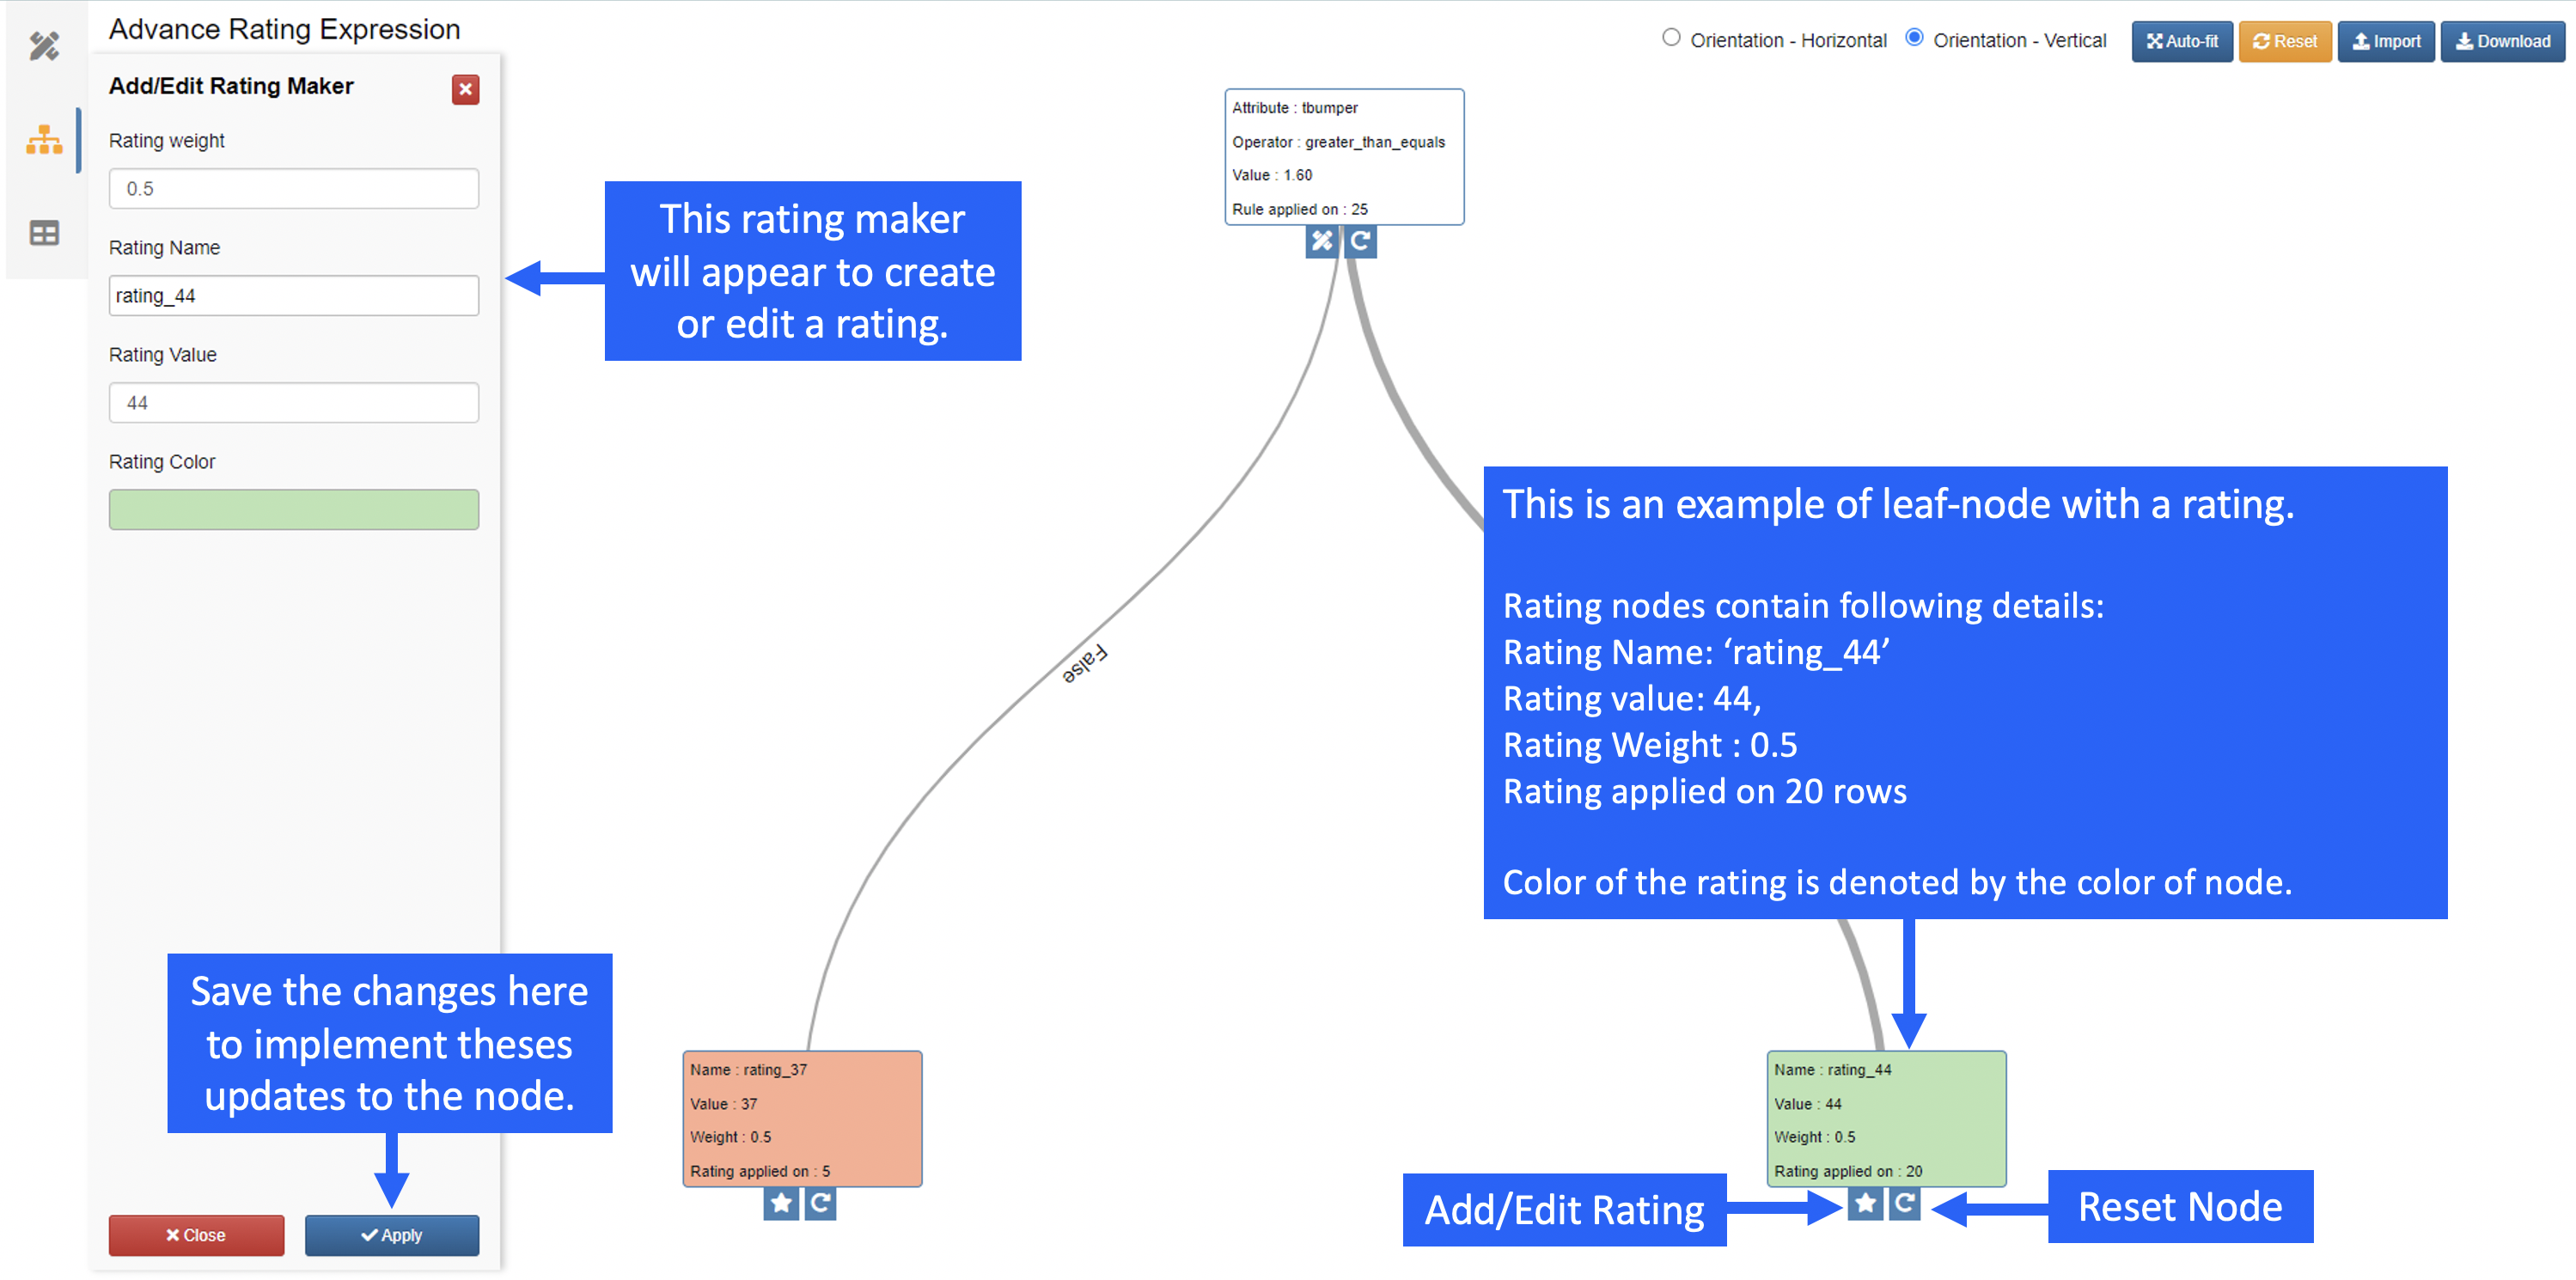
Figure 24: Modify Rating for Leaf Node
The following movie shows how to create ratings using advanced view:
Score Tables
In order to view the score table, we must have one or valid ratings added to the “Evaluate Ratings” list.
- The score is calculated using this formula:
- score = sum of (weight of the rating * value of the rating) score = w1*v1 + w2*v2…
Here is an example of a Ped Pro table with ratings and calculated score.
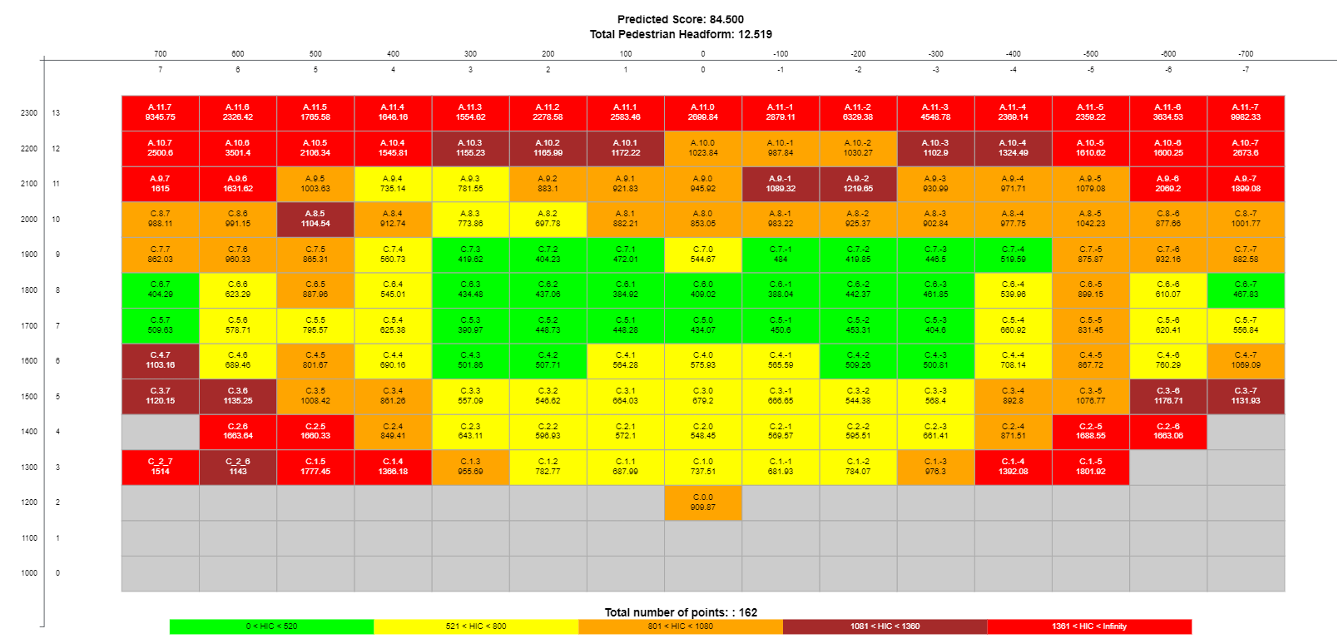
Figure 25: Ped Pro Table