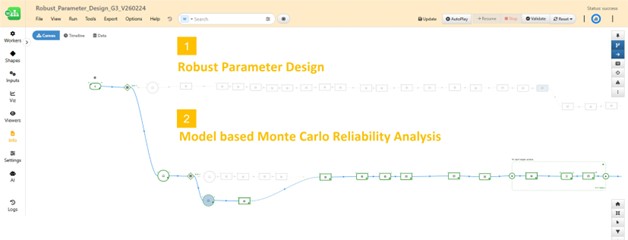
Robustness Analysis Workflow
Introduction
Data exploration and analysis is key to understanding the data and gaining insights. The Generic Data Analyzer workflow utilizes Machine Learning techniques to explore datasets and analyze data. By executing the workflow, users can choose a task and receive PPT slides summarizing findings from each task.
Robust Parameter Design (RPD) is a methodology that focuses on making designs insensitive to noise factors. Noise factors are variables whose values cannot be consistently controlled. Instead of eliminating these factors, RPD seeks control factor settings that minimize variation across noise ranges while optimizing the mean response for target responses.
Model-based Monte Carlo Reliability Analysis (MMCRA) estimates the probability that a design will meet requirements under uncertainty caused by noise. A machine learning model is trained to represent system behavior, while uncertain inputs are sampled from probability distributions. A large number of random samples are propagated through the model to evaluate target variable performance.
Pre-requisites
To use this workflow, a general overview of Workflow applications and Workers is recommended, along with knowledge of robustness and reliability analysis and machine learning principles.
Please contact support@d3view.com for more information.
Main Tasks
The workflow provides the following two tasks:
- Robust Parameter Design (RPD)
- ML Model Based Monte Carlo Reliability Analysis (MMCRA)
Workflow Inputs
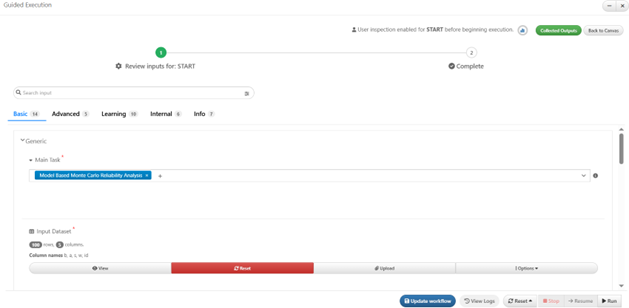
When executing the workflow, the START worker prompts users to update inputs and settings.
Inputs are grouped into three main groups:
- Generic Inputs
- Robust Parameter Design Inputs
- Model Based Monte Carlo Reliability Analysis Inputs
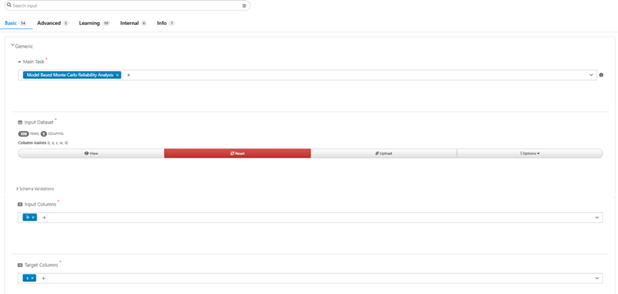
Generic Inputs
A set of required inputs for all tasks.
| Input | Description |
|---|---|
| Main Task | Task to perform |
| Input Dataset | Dataset used for DOE optimization (RPD) and ML training (RPD and MMCRA) |
| Input Columns | Columns representing input variables |
| Target Columns | Columns representing output variables |
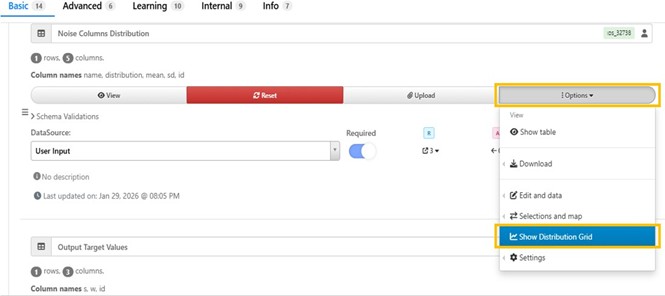
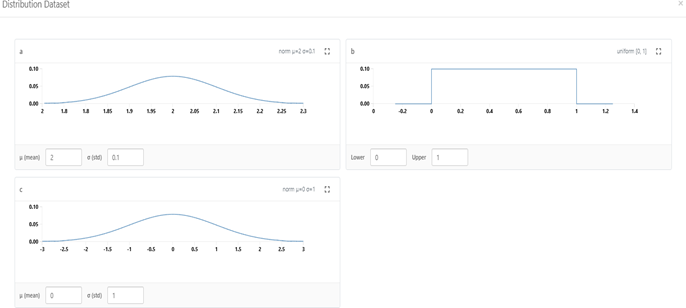
Robust Parameter Design Inputs
The following inputs are used for the RPD task.
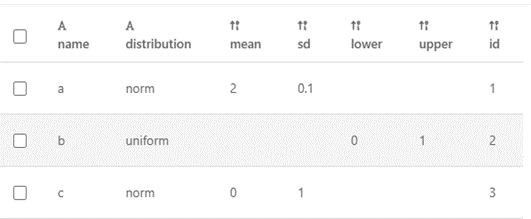
A quick preview of the provided distribution can be found by the “Show Distribution Grid” option.
Model Based Monte Carlo Reliability Analysis Inputs
The following inputs and settings are used MMCRA task. For MMCRA task, we are interested in how the target values get affected by the noises near the same point with noises in the input values. The standard deviation for the probability is usually set to be a relatively small value to simulate the noises. Ideally, the vast majority of the sampling points target values should be falling into the threshold defined by the “Target Variables Lower and Upper Bounds” input dataset.
Advanced Options
Sequential Reduction Optimization (SRO) is performed for RPD task. SRO settings can be found in the “Advanced” tab.
The “Advanced” tab also includes other options that can facilitate the robustness analysis.
| Option | Description |
|---|---|
| Include Input Dataset for Analysis (MMCRA) | Sampling points only, input points only, or both |
| Number of Bins for Histogram | Number of bins for histogram plots |
| alpha | Confidence level (e.g. 0.90 = 90%) |
| Reliability P | Reliability level (e.g. 0.95 = 95%) |
| Reliability Sides | Two sided, lower, or upper limit |
Learning Inputs
These parameters control machine learning model training.
| Option | Description |
|---|---|
| Save MathModel As | Name of saved ML model |
| Include Curve X Values For Learning | Include curve X values as targets |
| Normalization Option | Normalize input columns |
| Cross Validation Option | Use cross validation to select best model |
| Train Test Split Train Ratio | Percentage used for training |
| Grid Search Option | Hyperparameter tuning |
| Cross Validation Score Type | Score metric for cross validation |
| CV Option for Grid Search | Cross validation strategy |
| Grid Search Score Type | Scoring metric for grid search |
| Drop Training Data in Model | Skip saving training dataset in model |
| ML Models to Consider | Candidate ML models |
Workflow Outputs
After execution, a summary report is generated and exported as PPT slides.
Robust Parameter Design Outputs
The RPD report includes:
- Iteration history of target mean
- Iteration history of target standard deviation
- Input values evolution
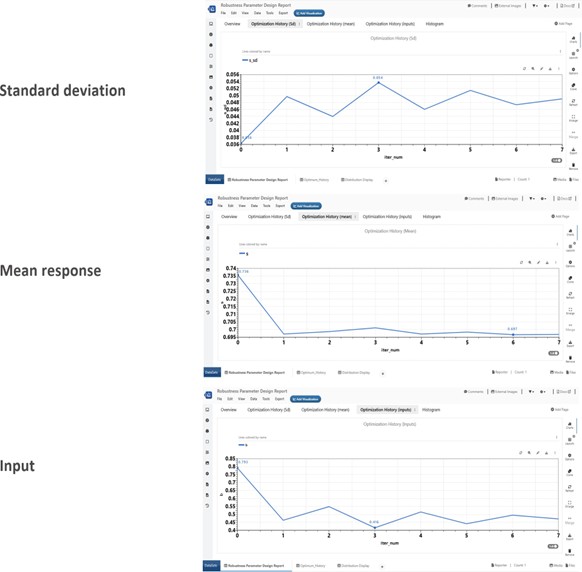
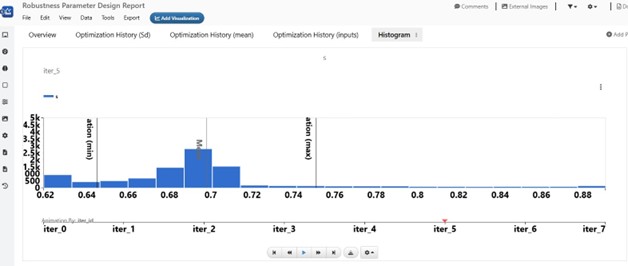
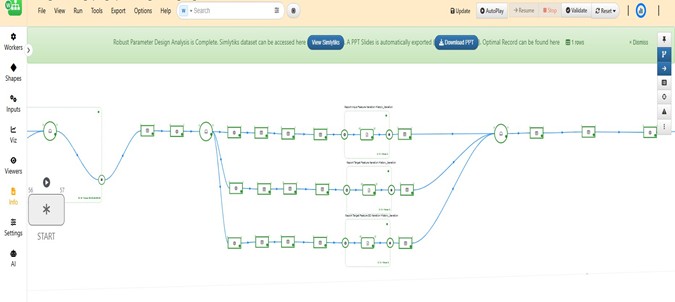
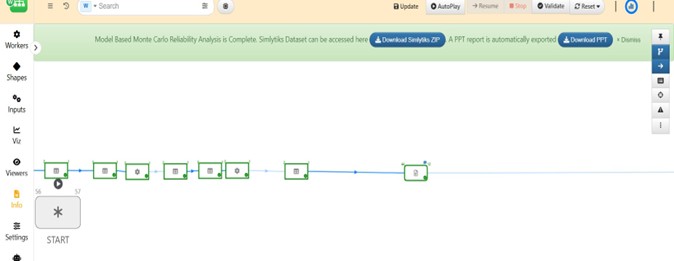
When the workflow execution is complete, a notification message with direct access to Simlytiks Dataset, PPT Slides, and the robustness optimal record will be showing on the banner at the top of the canvass for easy access. The Simlytiks Dataset include animation of the target histogram from each iteration to demonstrate target value and standard deviation changes throughout of the optimization process.
Model Based Monte Carlo Reliability Analysis Outputs
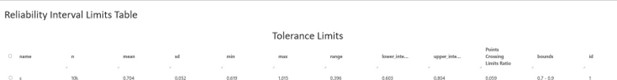
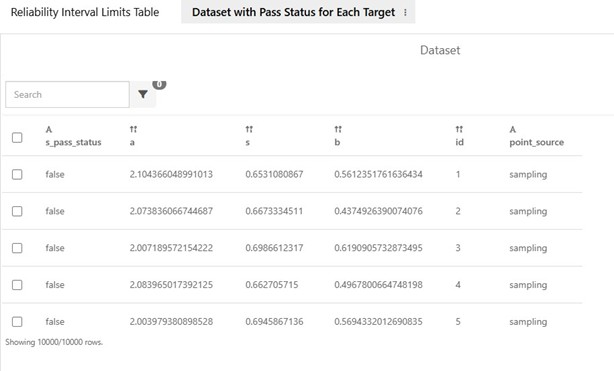
MMCRA generates a large number of new sampling points around the DOE optimal record. Based on the provided or trained ML model, we get the predicted values for each target variables. This new dataset can be used for evaluating how robust the solution is to noises. A summary table is available on the first page of the analysis report. It includes summary statistics as well as the tolerance lower and upper limits for each target variable. In addition, it shows the ratio of the points which crossed the tolerance limits.
The second table includes all data points used for analysis for users’ further exploration. This table includes the input and target variable values as well as the pass status indicating if the point falls out of the specified lower and upper bounds. This table can be interactively inspected when it is opened in d3VIEW Simlytiks application.
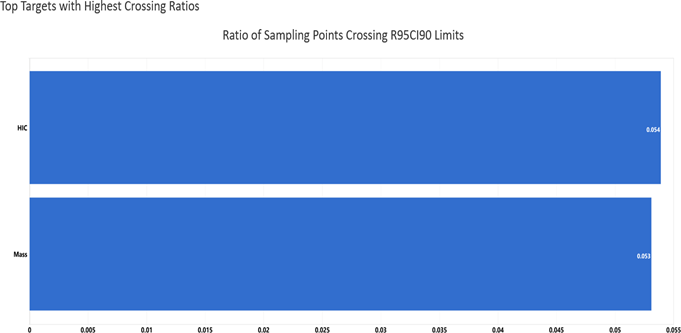
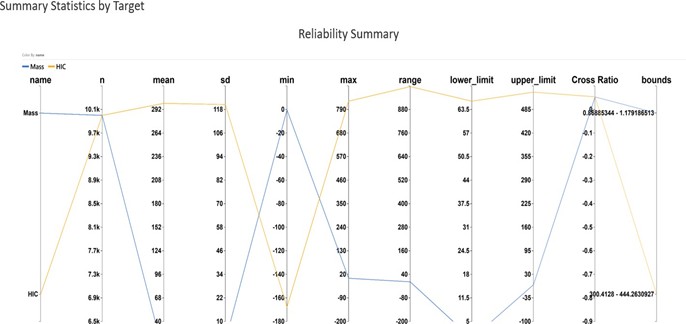
A bar chart is available to show the top features that has the highest “Ratio of points crossing tolerance limits” and a parallel chart is available to visualize the reliability summary statistics.
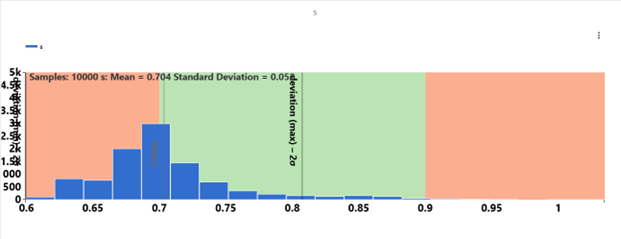
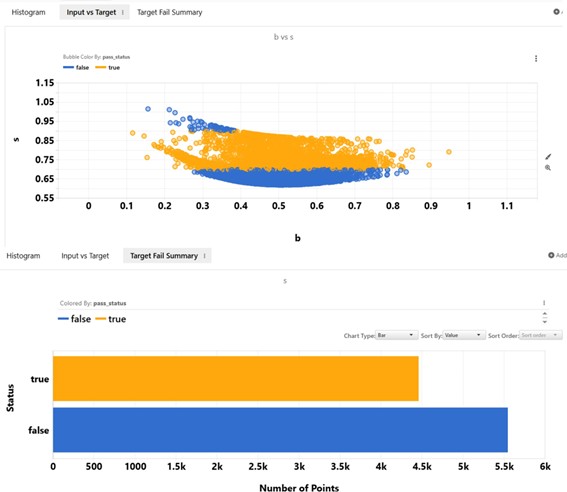
A histogram of each target variable will be shown in the MMCRA report. Mean and 1 sigma is labelled in the histogram for users’ convenience. We can compare the distribution to the threshold for each target variable to evaluate the performance for each target variables.
Additional visualizations are included in the analysis report for a quick summary of the sampling points and their status whether they fall inside (Good/true) or outside (Fail/false) the threshold.
When the workflow execution is complete, a notification message with direct access to the Simlytiks Dataset and the PPT Slides will show up on the banner at the top of the canvas.
Workflow User Interface
The workflow is designed so the user mainly interacts with the START worker.
START Worker
The START worker is identified as shown below and contains inputs and options for the whole workflow. Once user provides required inputs and options, clicking on the “Run” button at the bottom will start execution of the workflow.
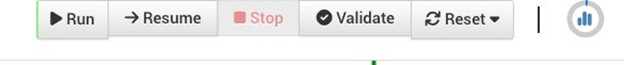
Execution Panel
The execution panel includes the following controls.
| Button | Description |
|---|---|
| Run | Start workflow execution |
| Resume | Continue from stopped point |
| Stop | Pause execution |
| Validate | Check inputs before execution |
| Reset | Reset workflow to initial state |
Frequently Asked Questions
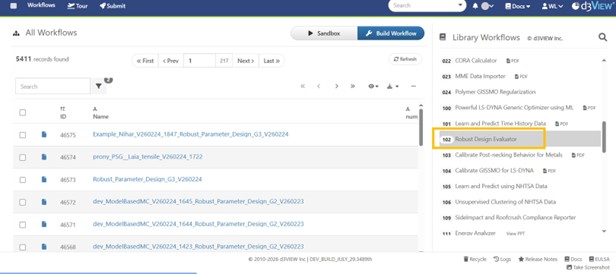
Q1. Where can I find this workflow?
The workflow with ID 102 can be found in the Workflow Library.
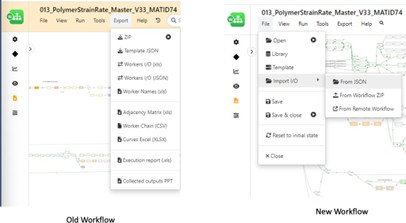
**Q2. How can the data from an old Workflow be imported into a new Workflow in the library
To allow data migration from an old workflow to a new workflow, the data from the old workflow can be exported using Export/Worker IO which will save the old workflow data into a file of the format JSON. Once this file is available, we can use the Tools/Import/WorkflowIO JSON in the new Workflow to overwrite its values with the values saved in the JSON file.
References
- d3VIEW documentation from https://www.d3view.com