4. Introduction
4.1. About d3VIEW
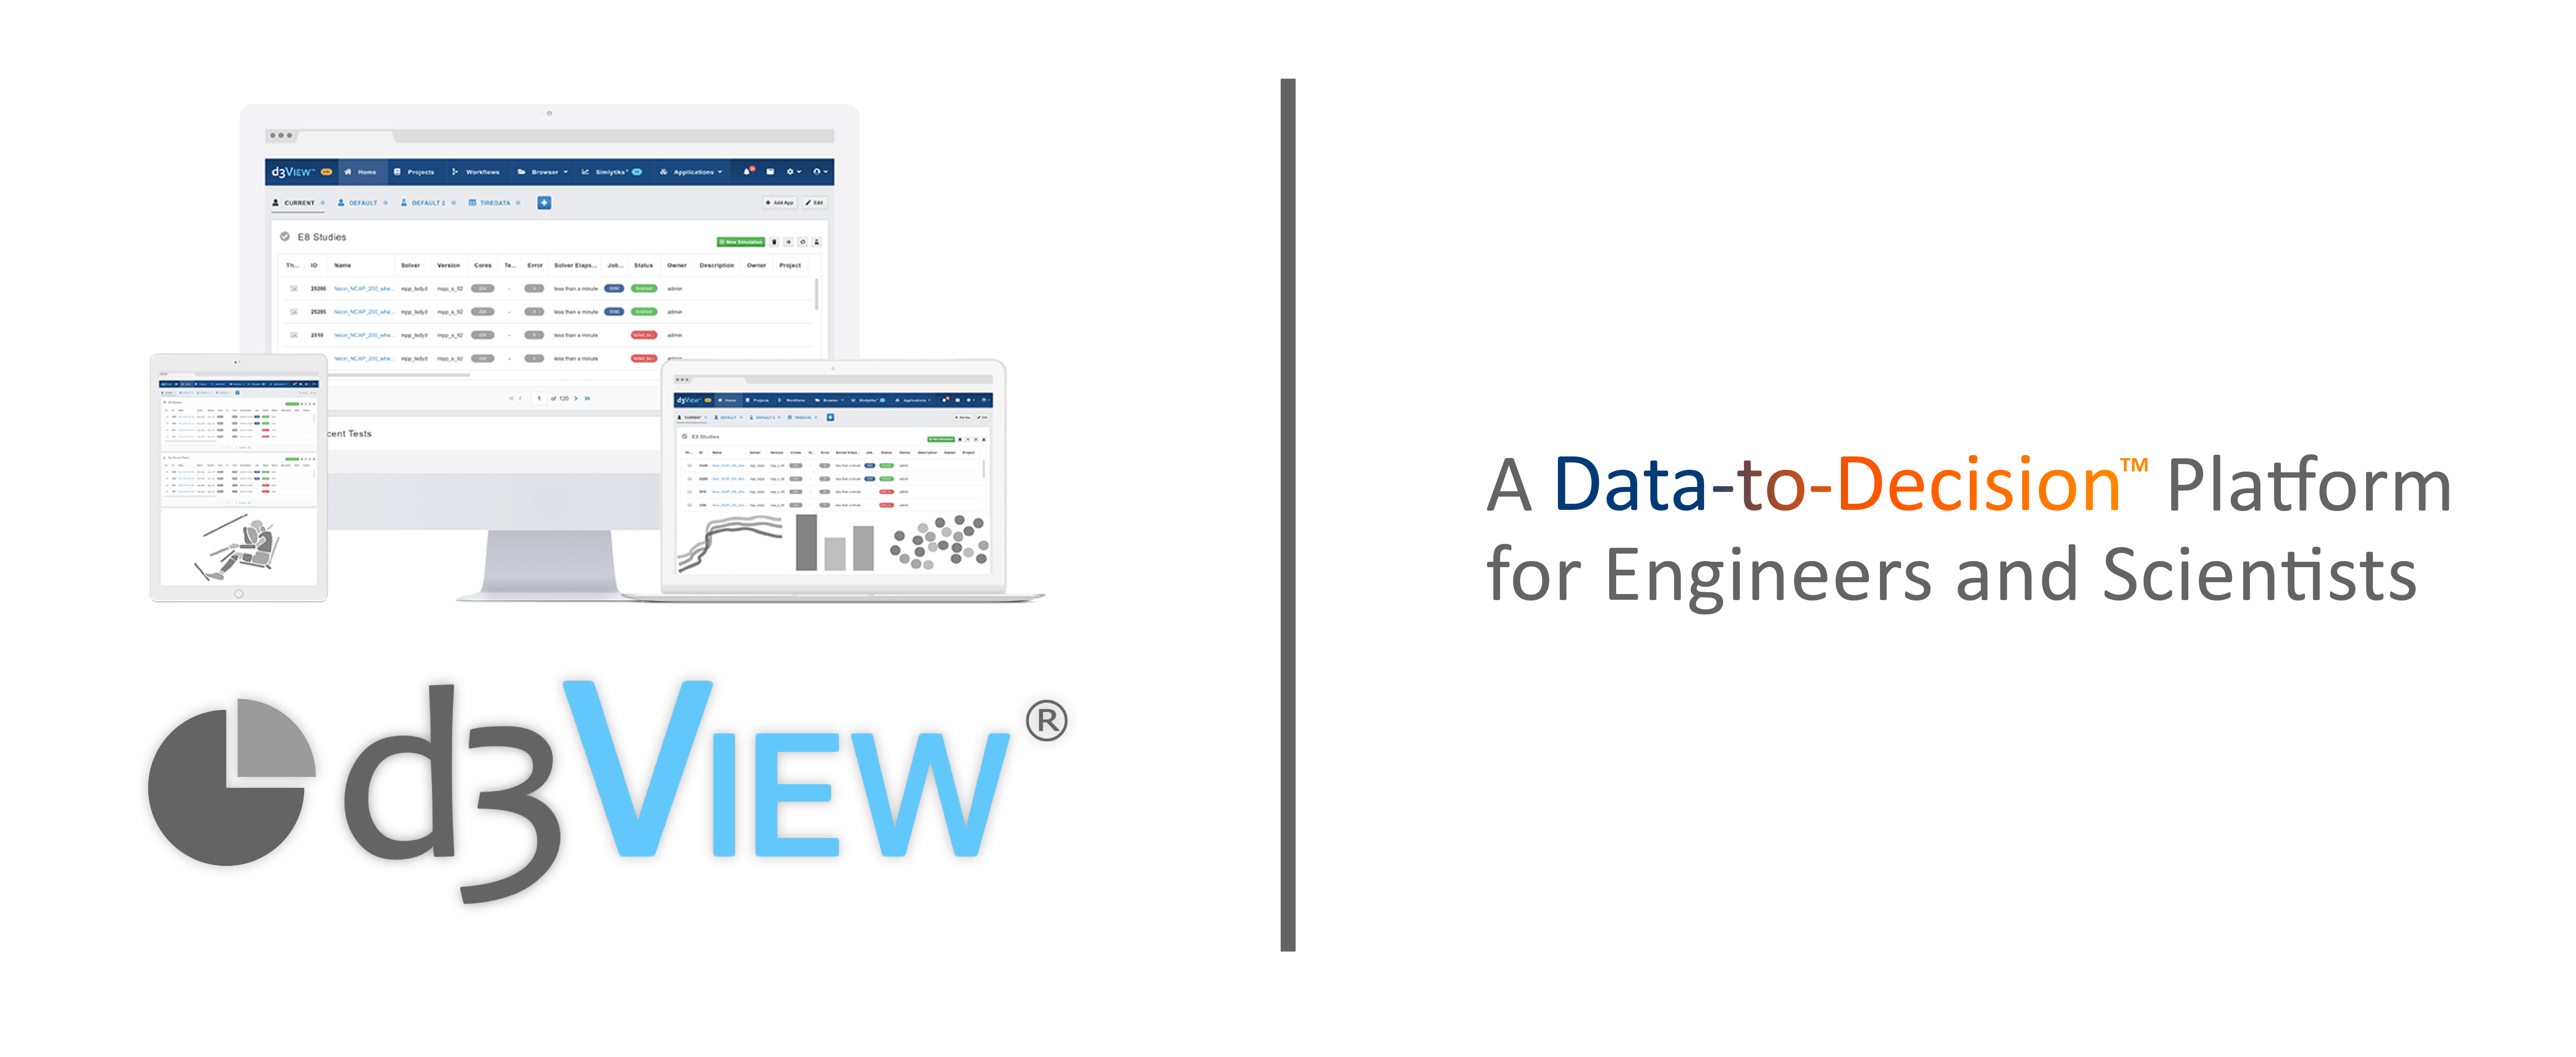
d3VIEW is a data to decision platform that provides out-of-the box data extraction, transformations and interactive visualizations. Using d3VIEW, you can visualize, mine and analyze the data quickly to enable faster and better decisions. It can integrate with any High Performance Computing (HPC) systems to submit and track jobs, perform complex data transformations using a rich library of templates that can help turn data to information, help visualize thousands of data using rich powerful visualizations, export to reports to share and collaborate.
Hardware
d3VIEW has two options for hardware each with a d3VIEW environment set-up and HPC Cluster set-up, illustrated in the following image:
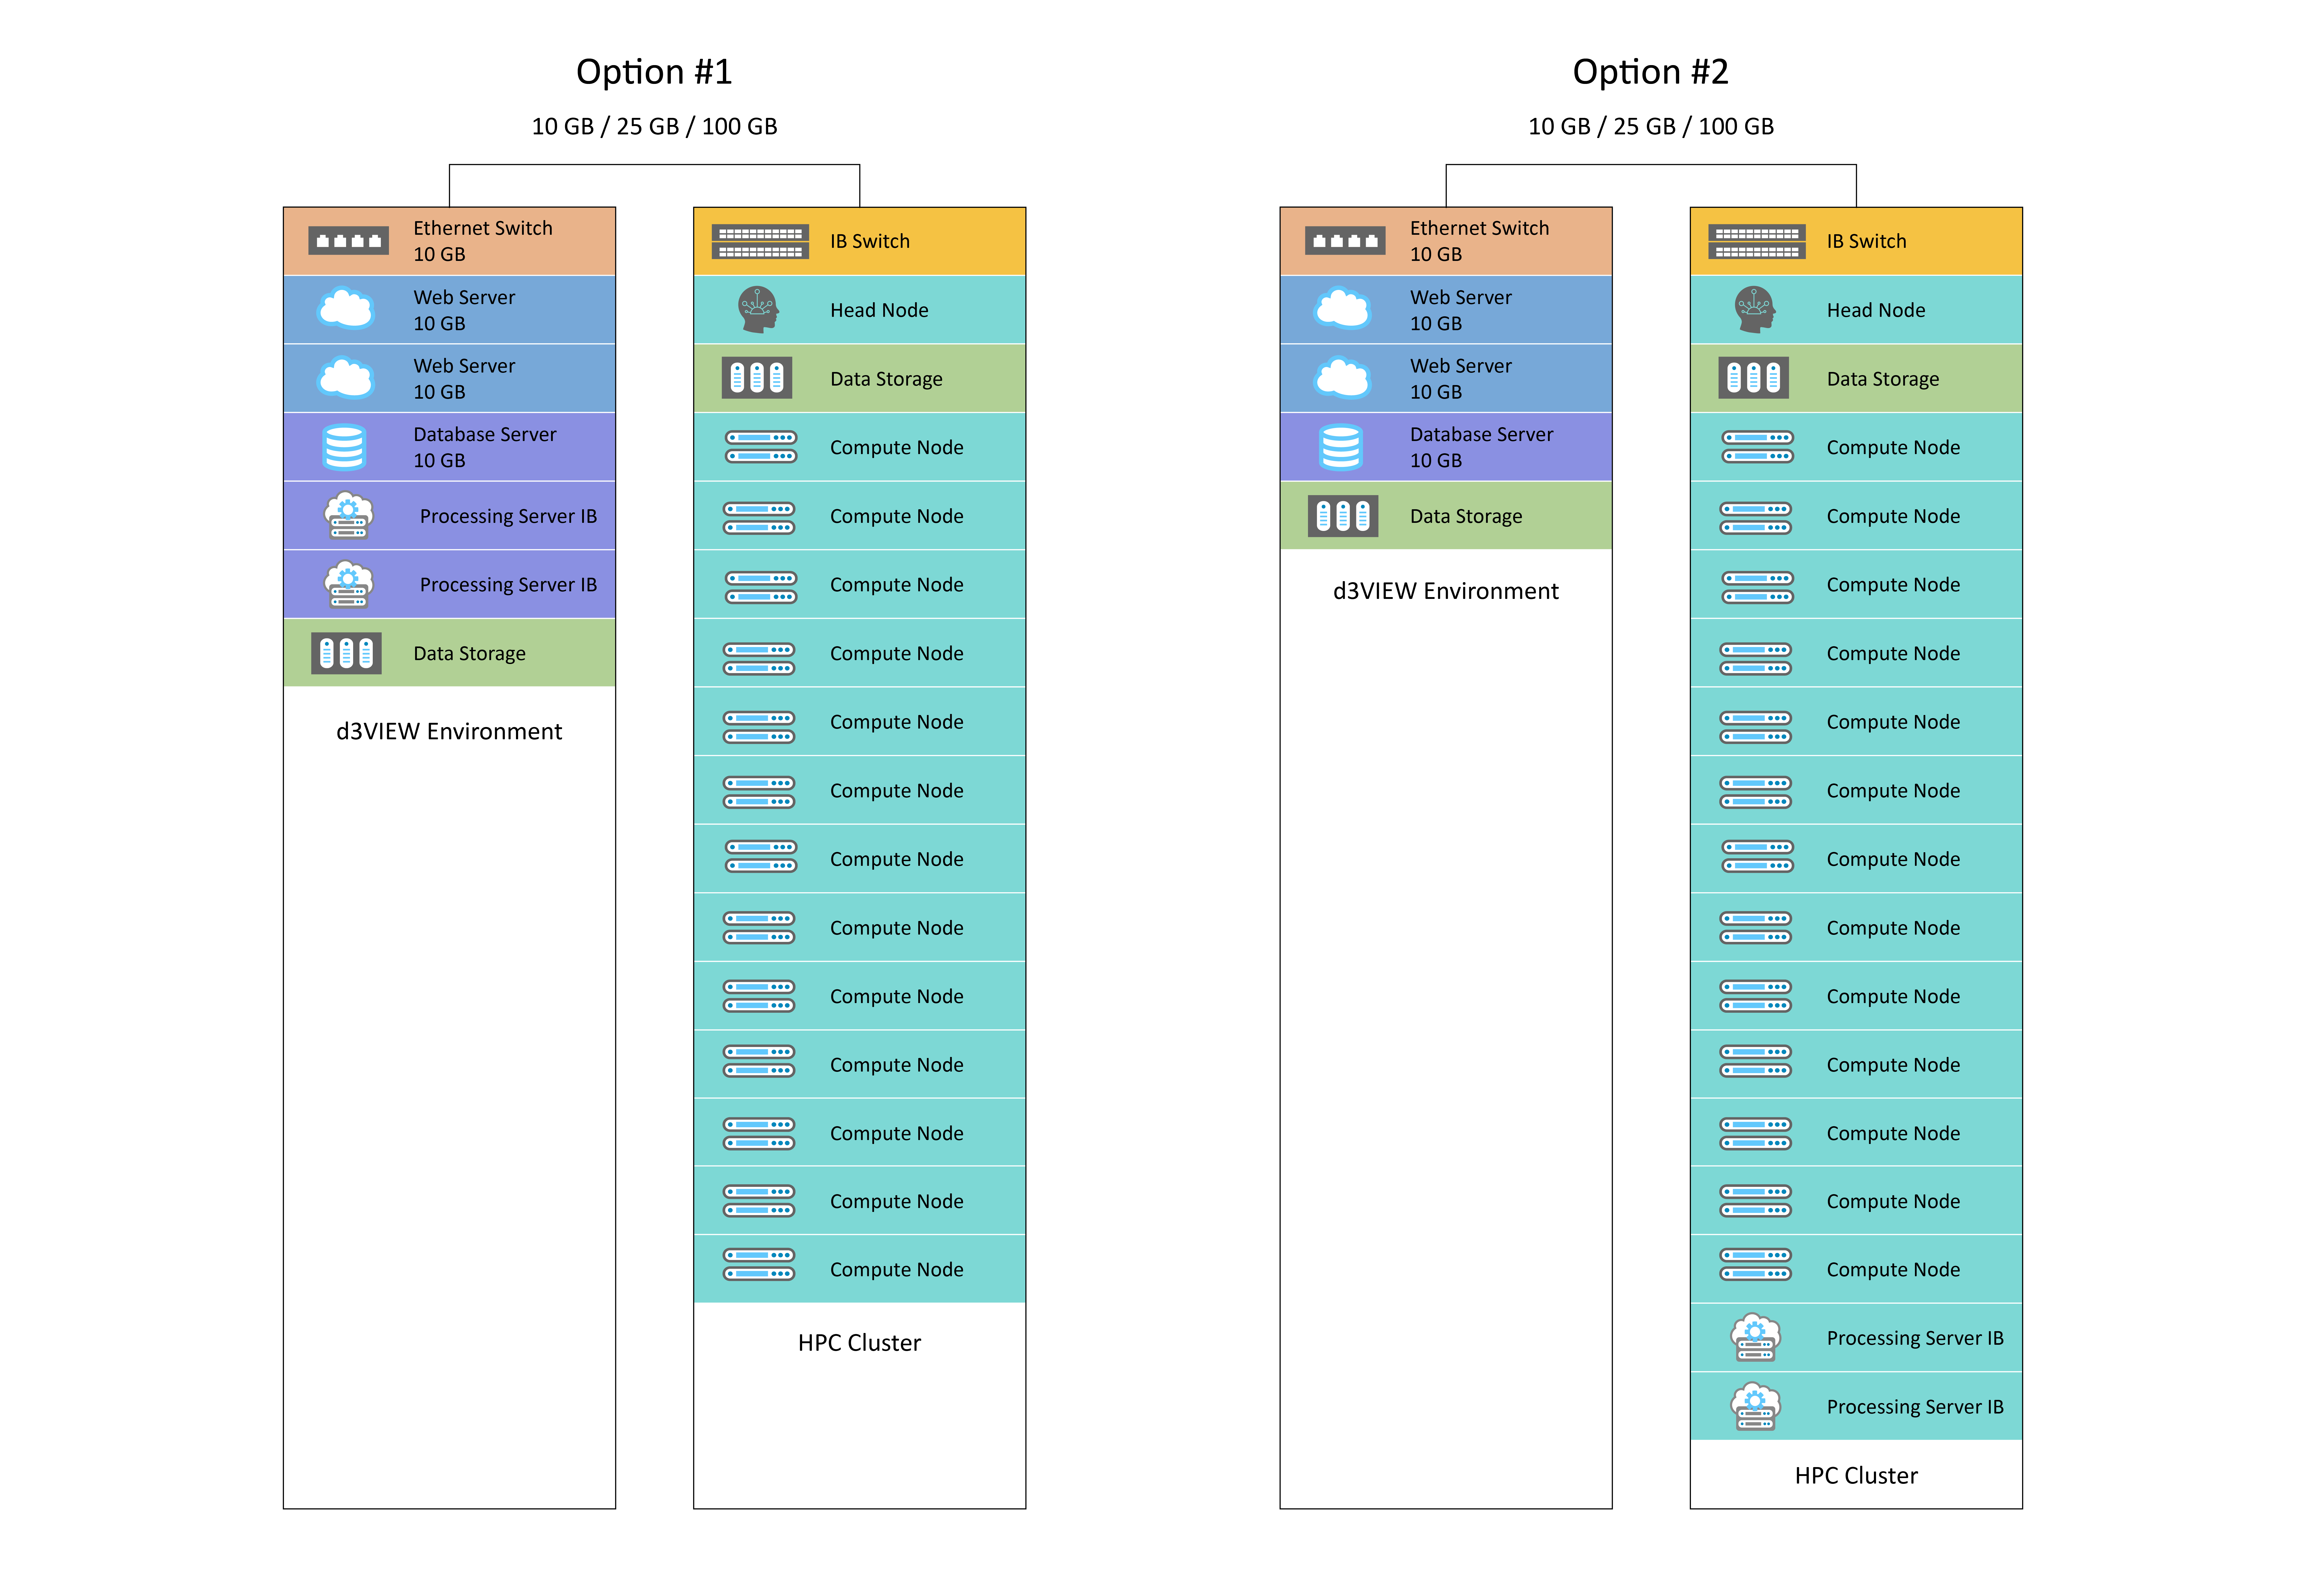
Figure 1: d3VIEW Hardware Options
The HPC Cluster can also be broken down as such:
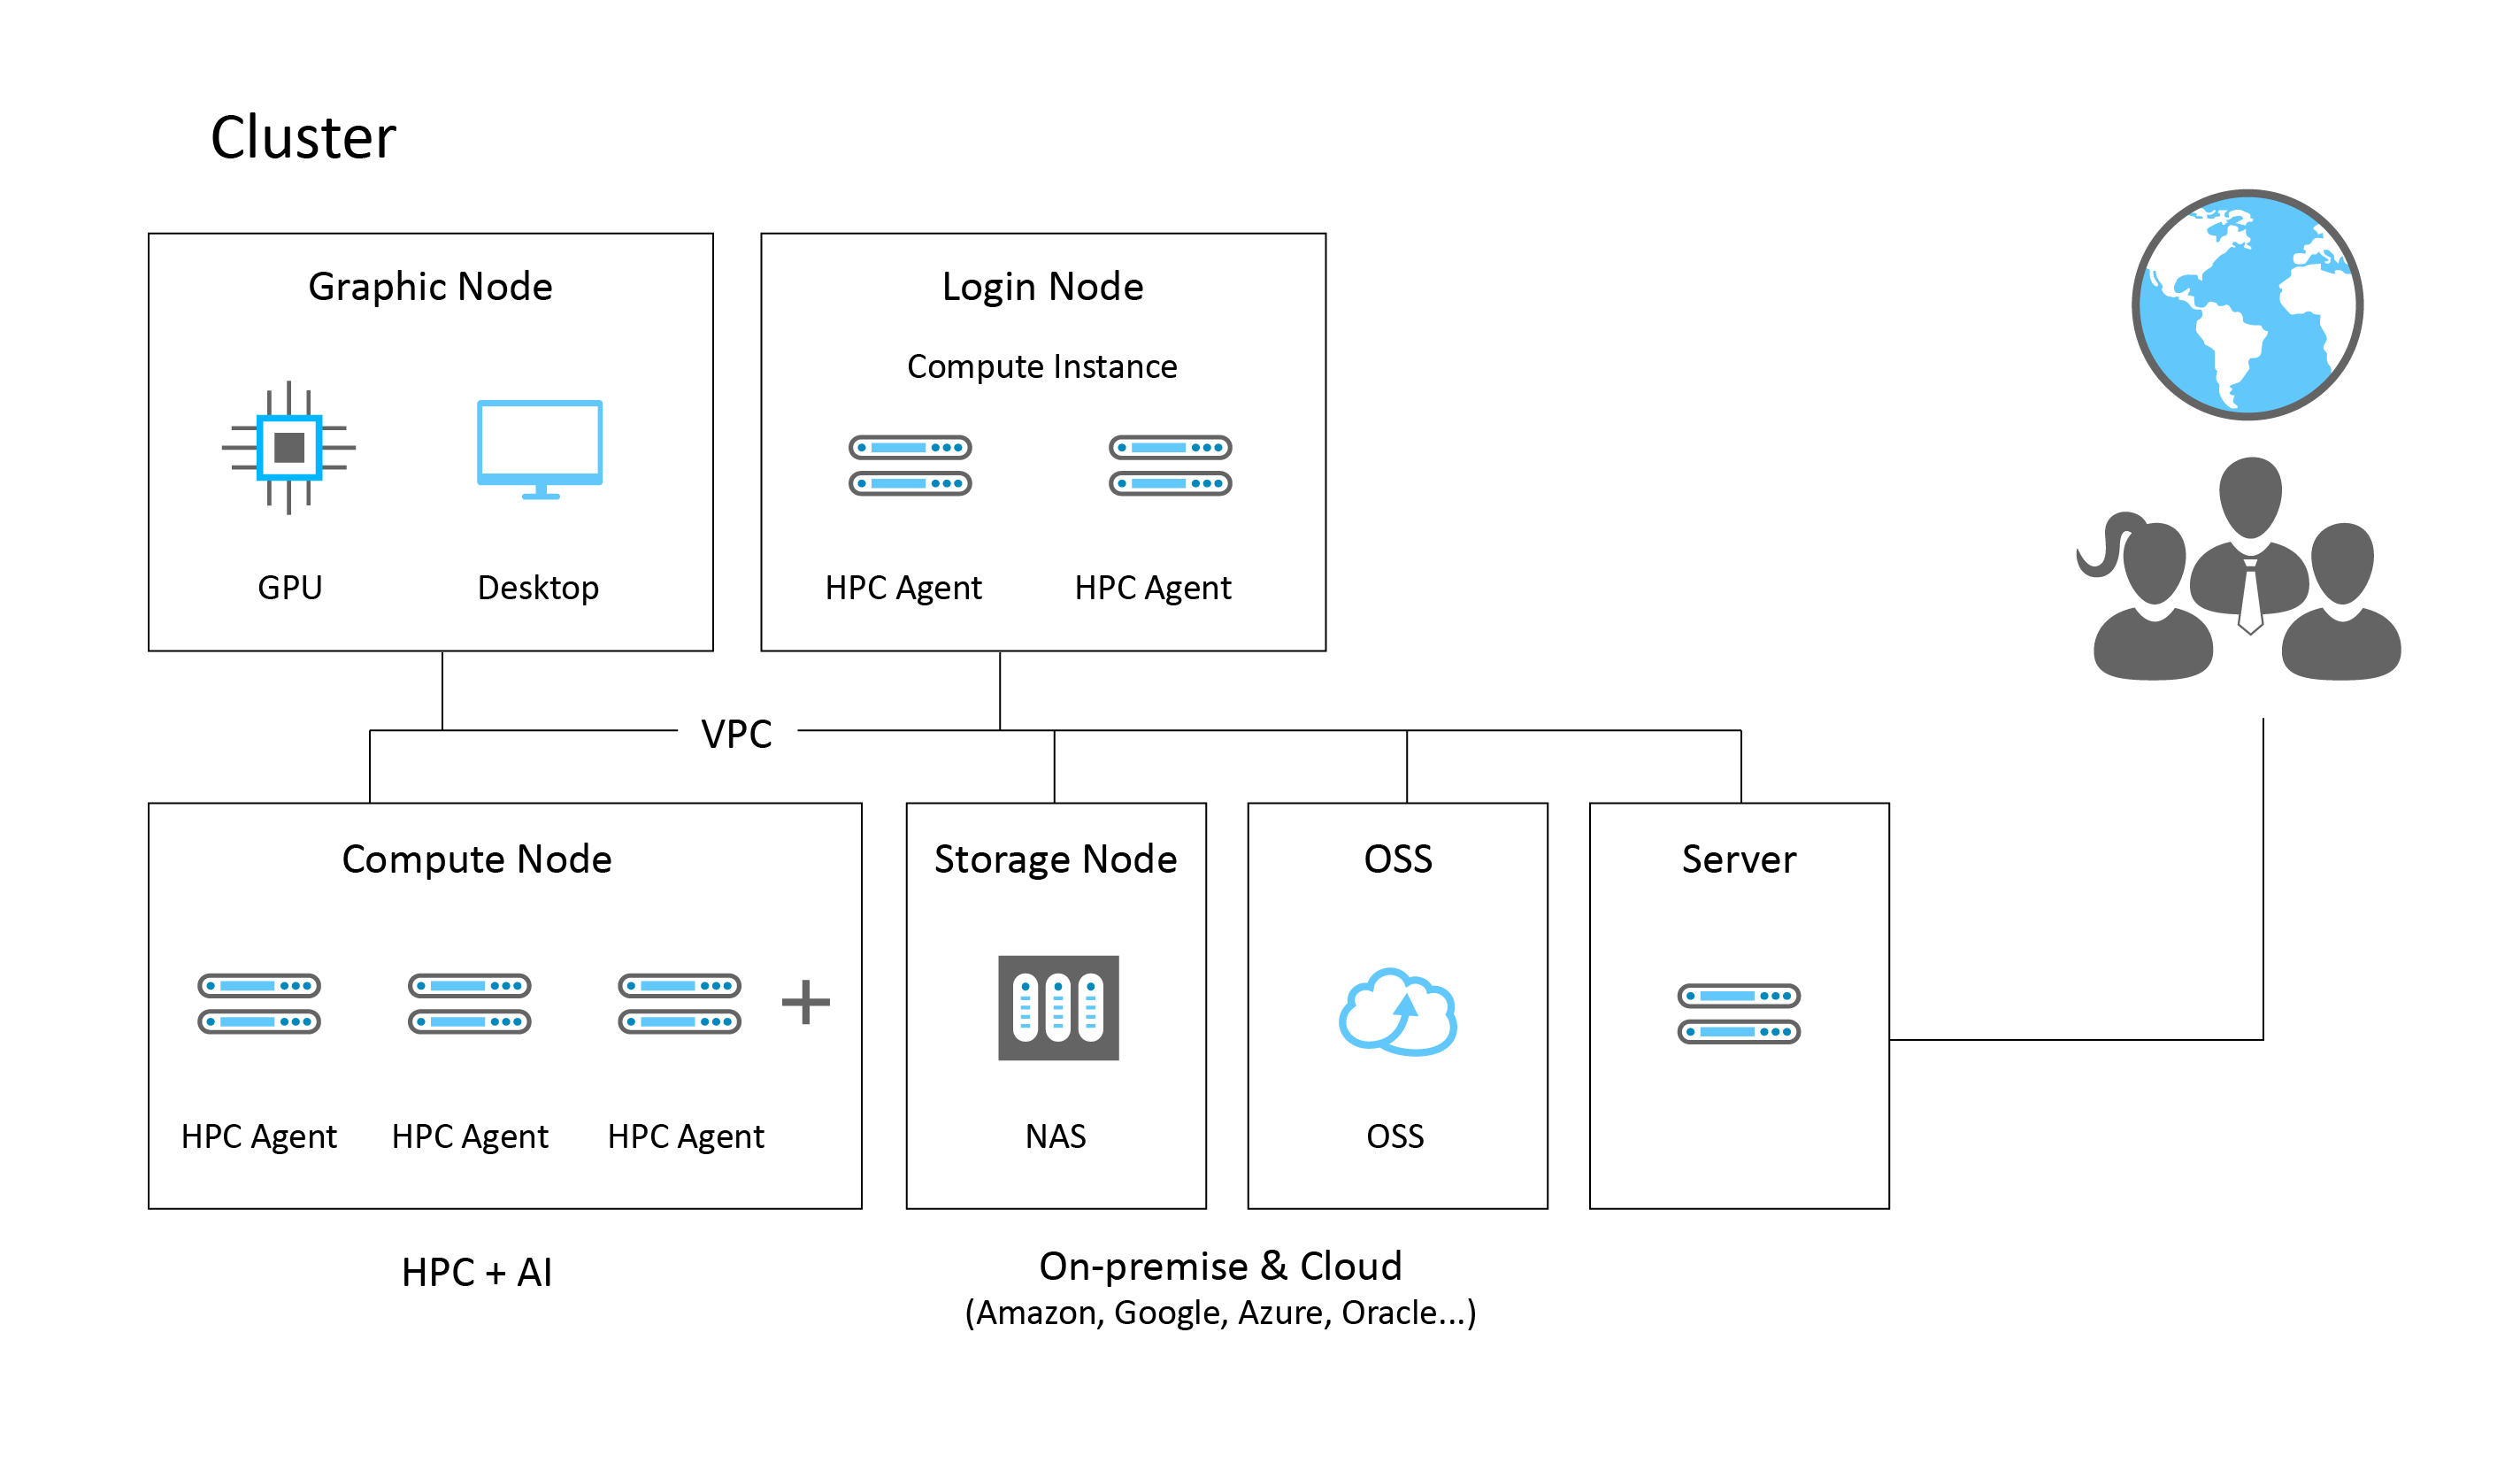
Figure 2: d3VIEW HPC Cluster
Data Storage
Data gets stored on dedicated cloud or database servers. Larger amounts of data will often be stored to a NAS or SAN system within the server network. NAS and SAN systems are often also servers or clusters of servers dedicated to storage, and, in simple terms, transparently provide disk space to a local machine.
4.2. Login to your d3VIEW account
Enter the URL you received in the browser to go to the login page of your d3VIEW account. Fill up your login credentials to access your account. Please contact your administrator if you have not received a URL, login or password.
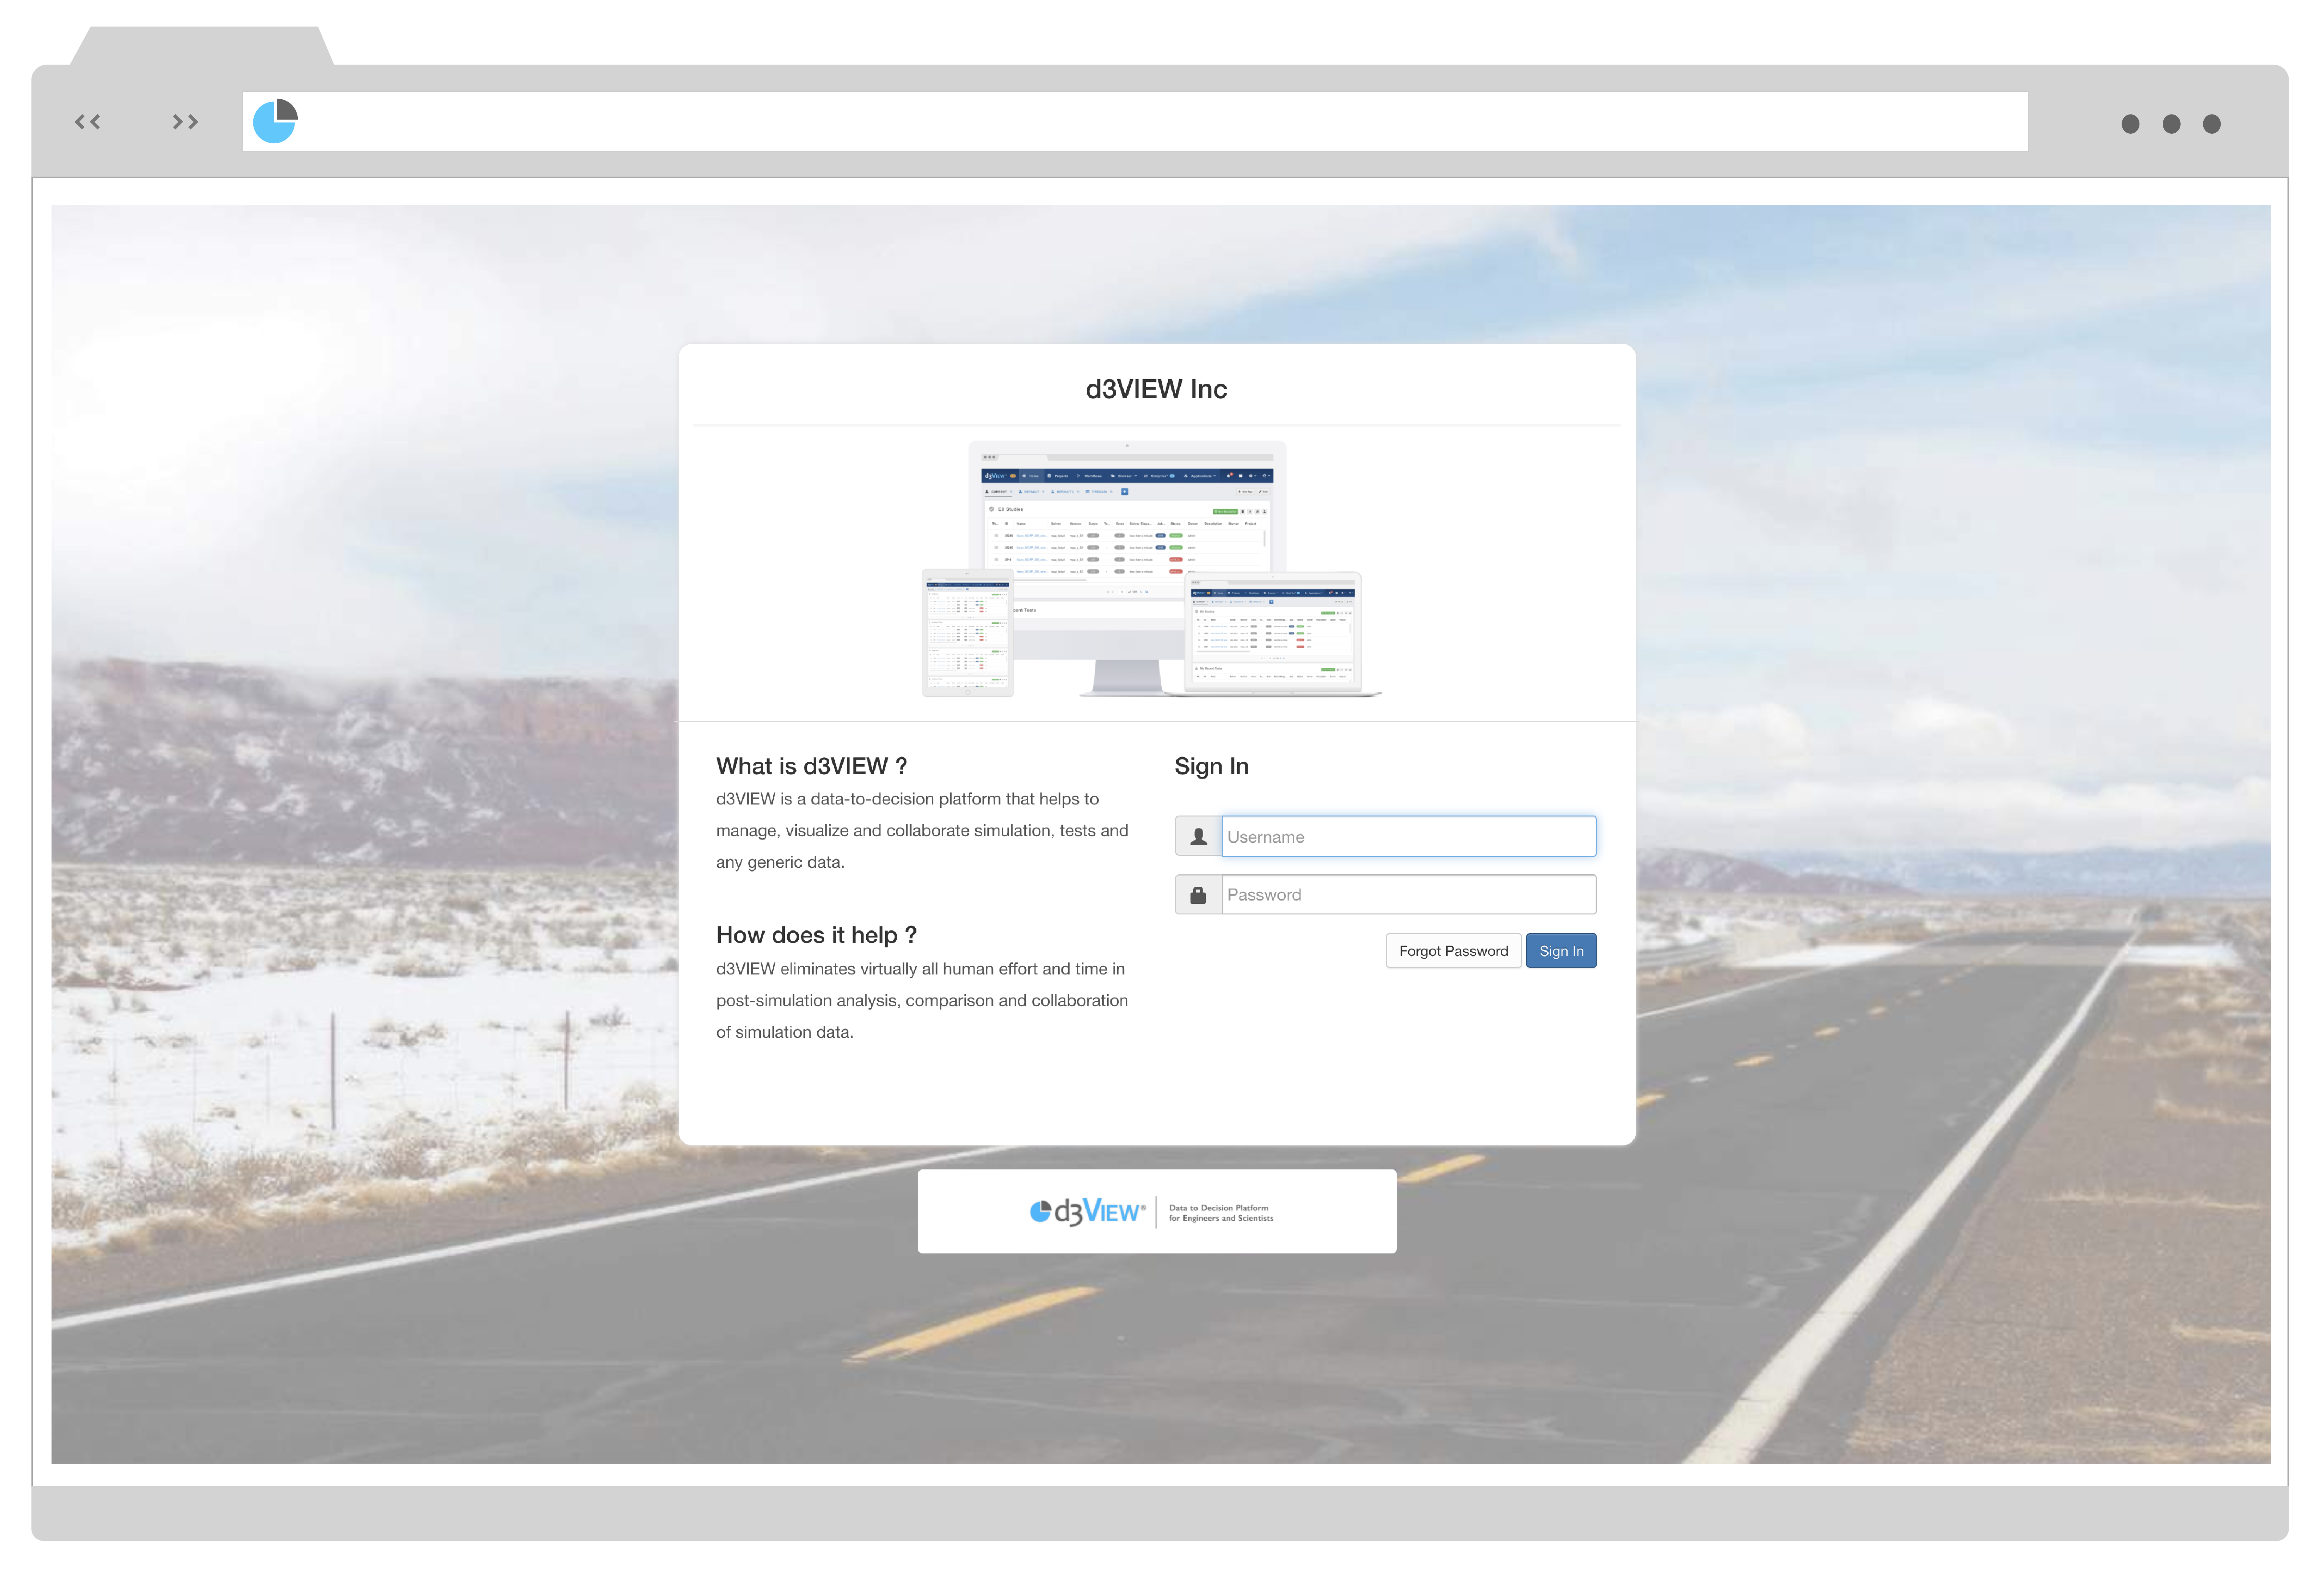
Figure 1: Log Onto d3VIEW
Welcome to d3VIEW!
Your first sign in on d3VIEW will default to Dashboards. Next time you sign in, you will be directed to the last application you were using in your last session. d3VIEW’s extensive list of applications that make up our complex decision-making platform is easily accessible at anytime during your explorative experience on the interface in the left panel menu.
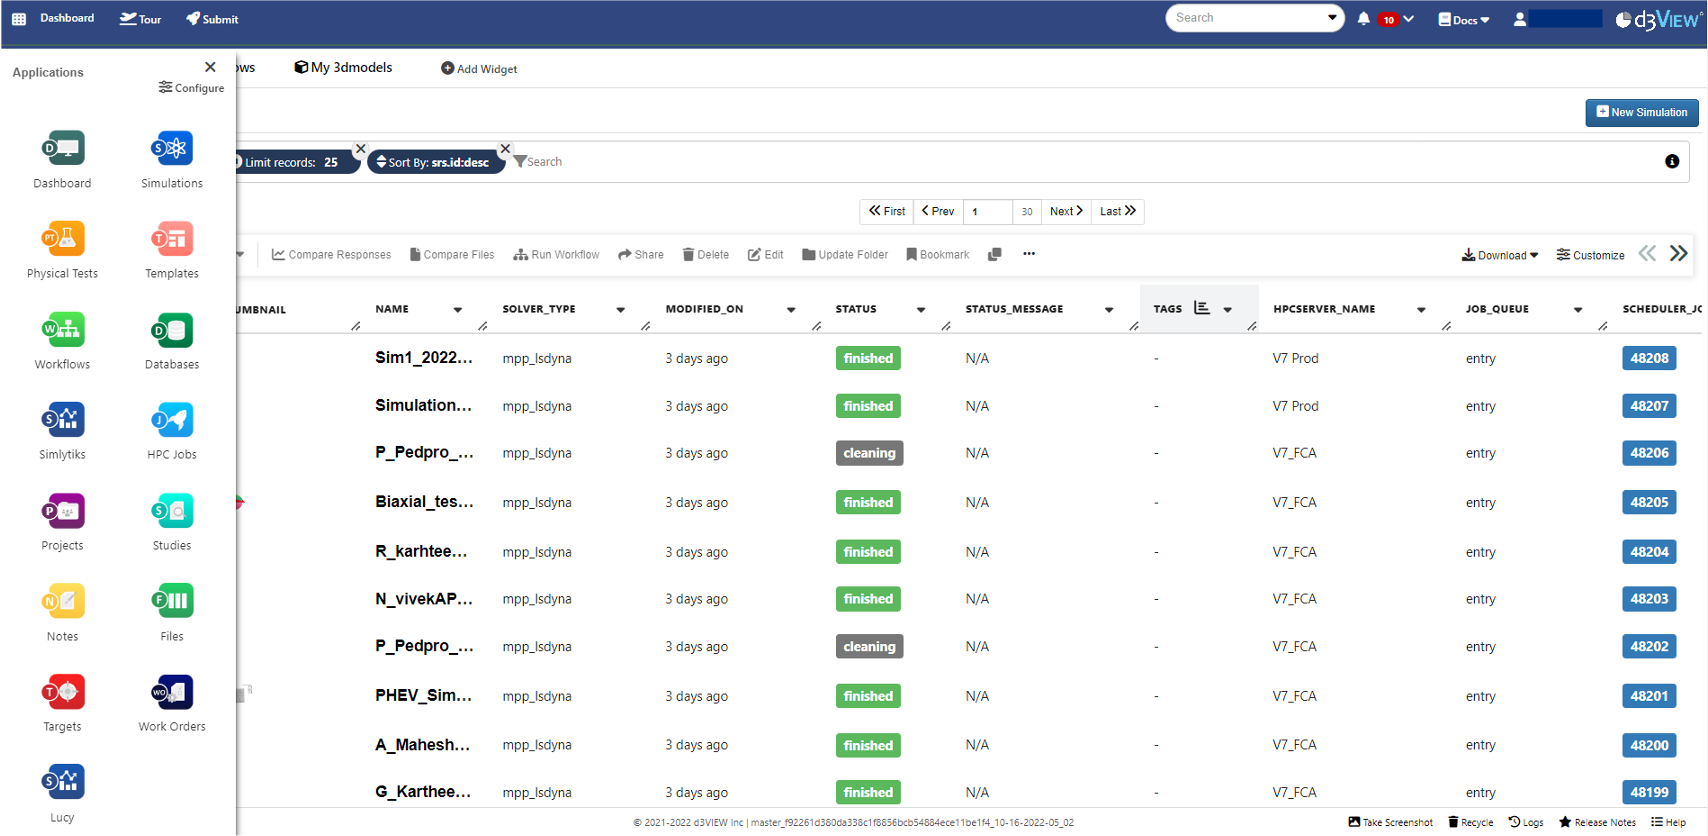
Figure 2: Applications Menu
4.3. Dashboards
Dashboard provides a flexible way to organize and visualize all your simulations, Physical Tests, Templates and Studies in your workspace. Every user can create a custom layout suitable to his needs to access required information in short amount of time.
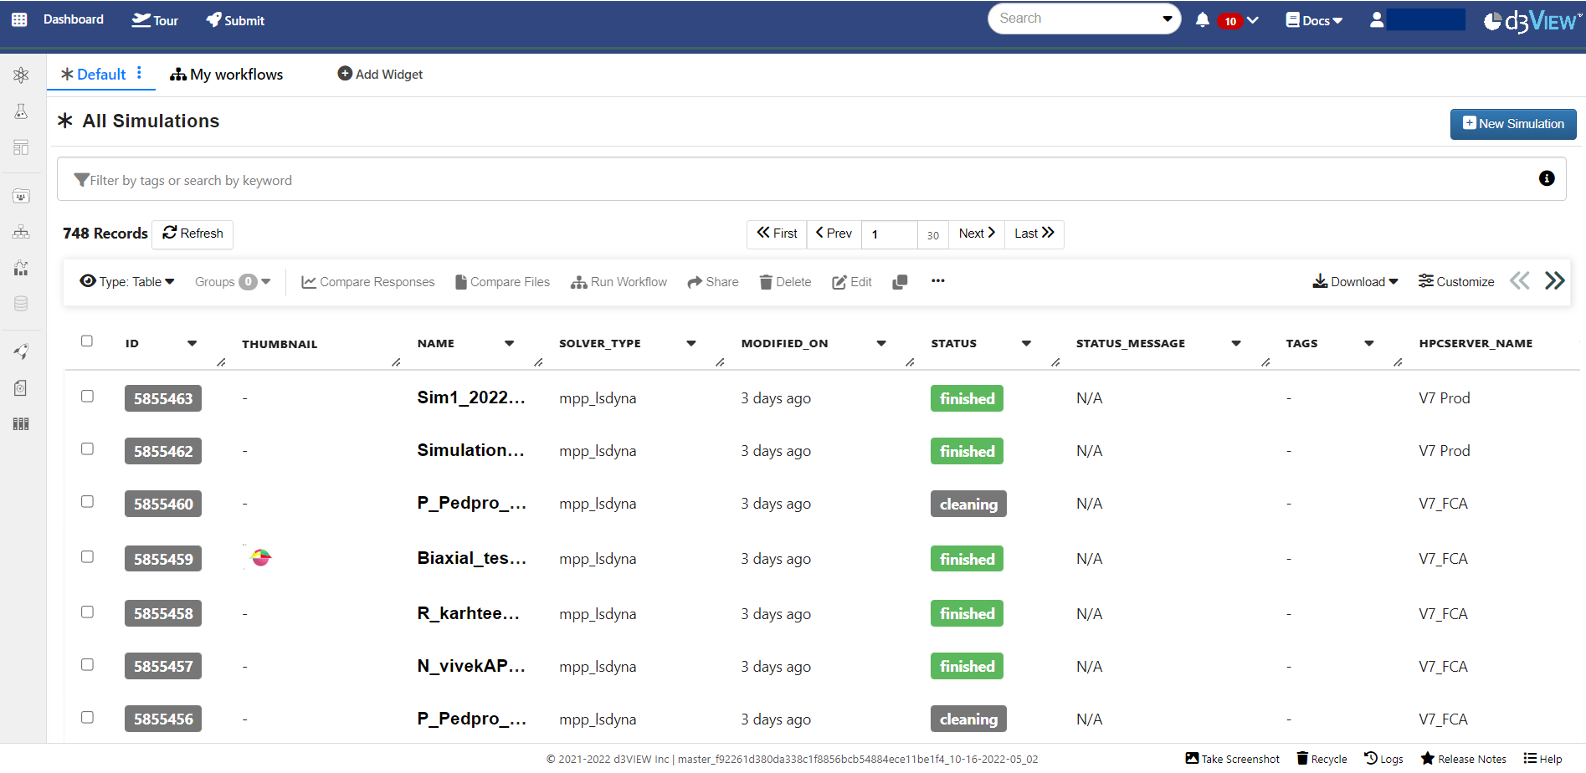
Figure 1: Dashboards
Create a New Dashboard
Click on “Add Widget” at the top of your current dashboard screen next to “Default” (or already added dashboards).
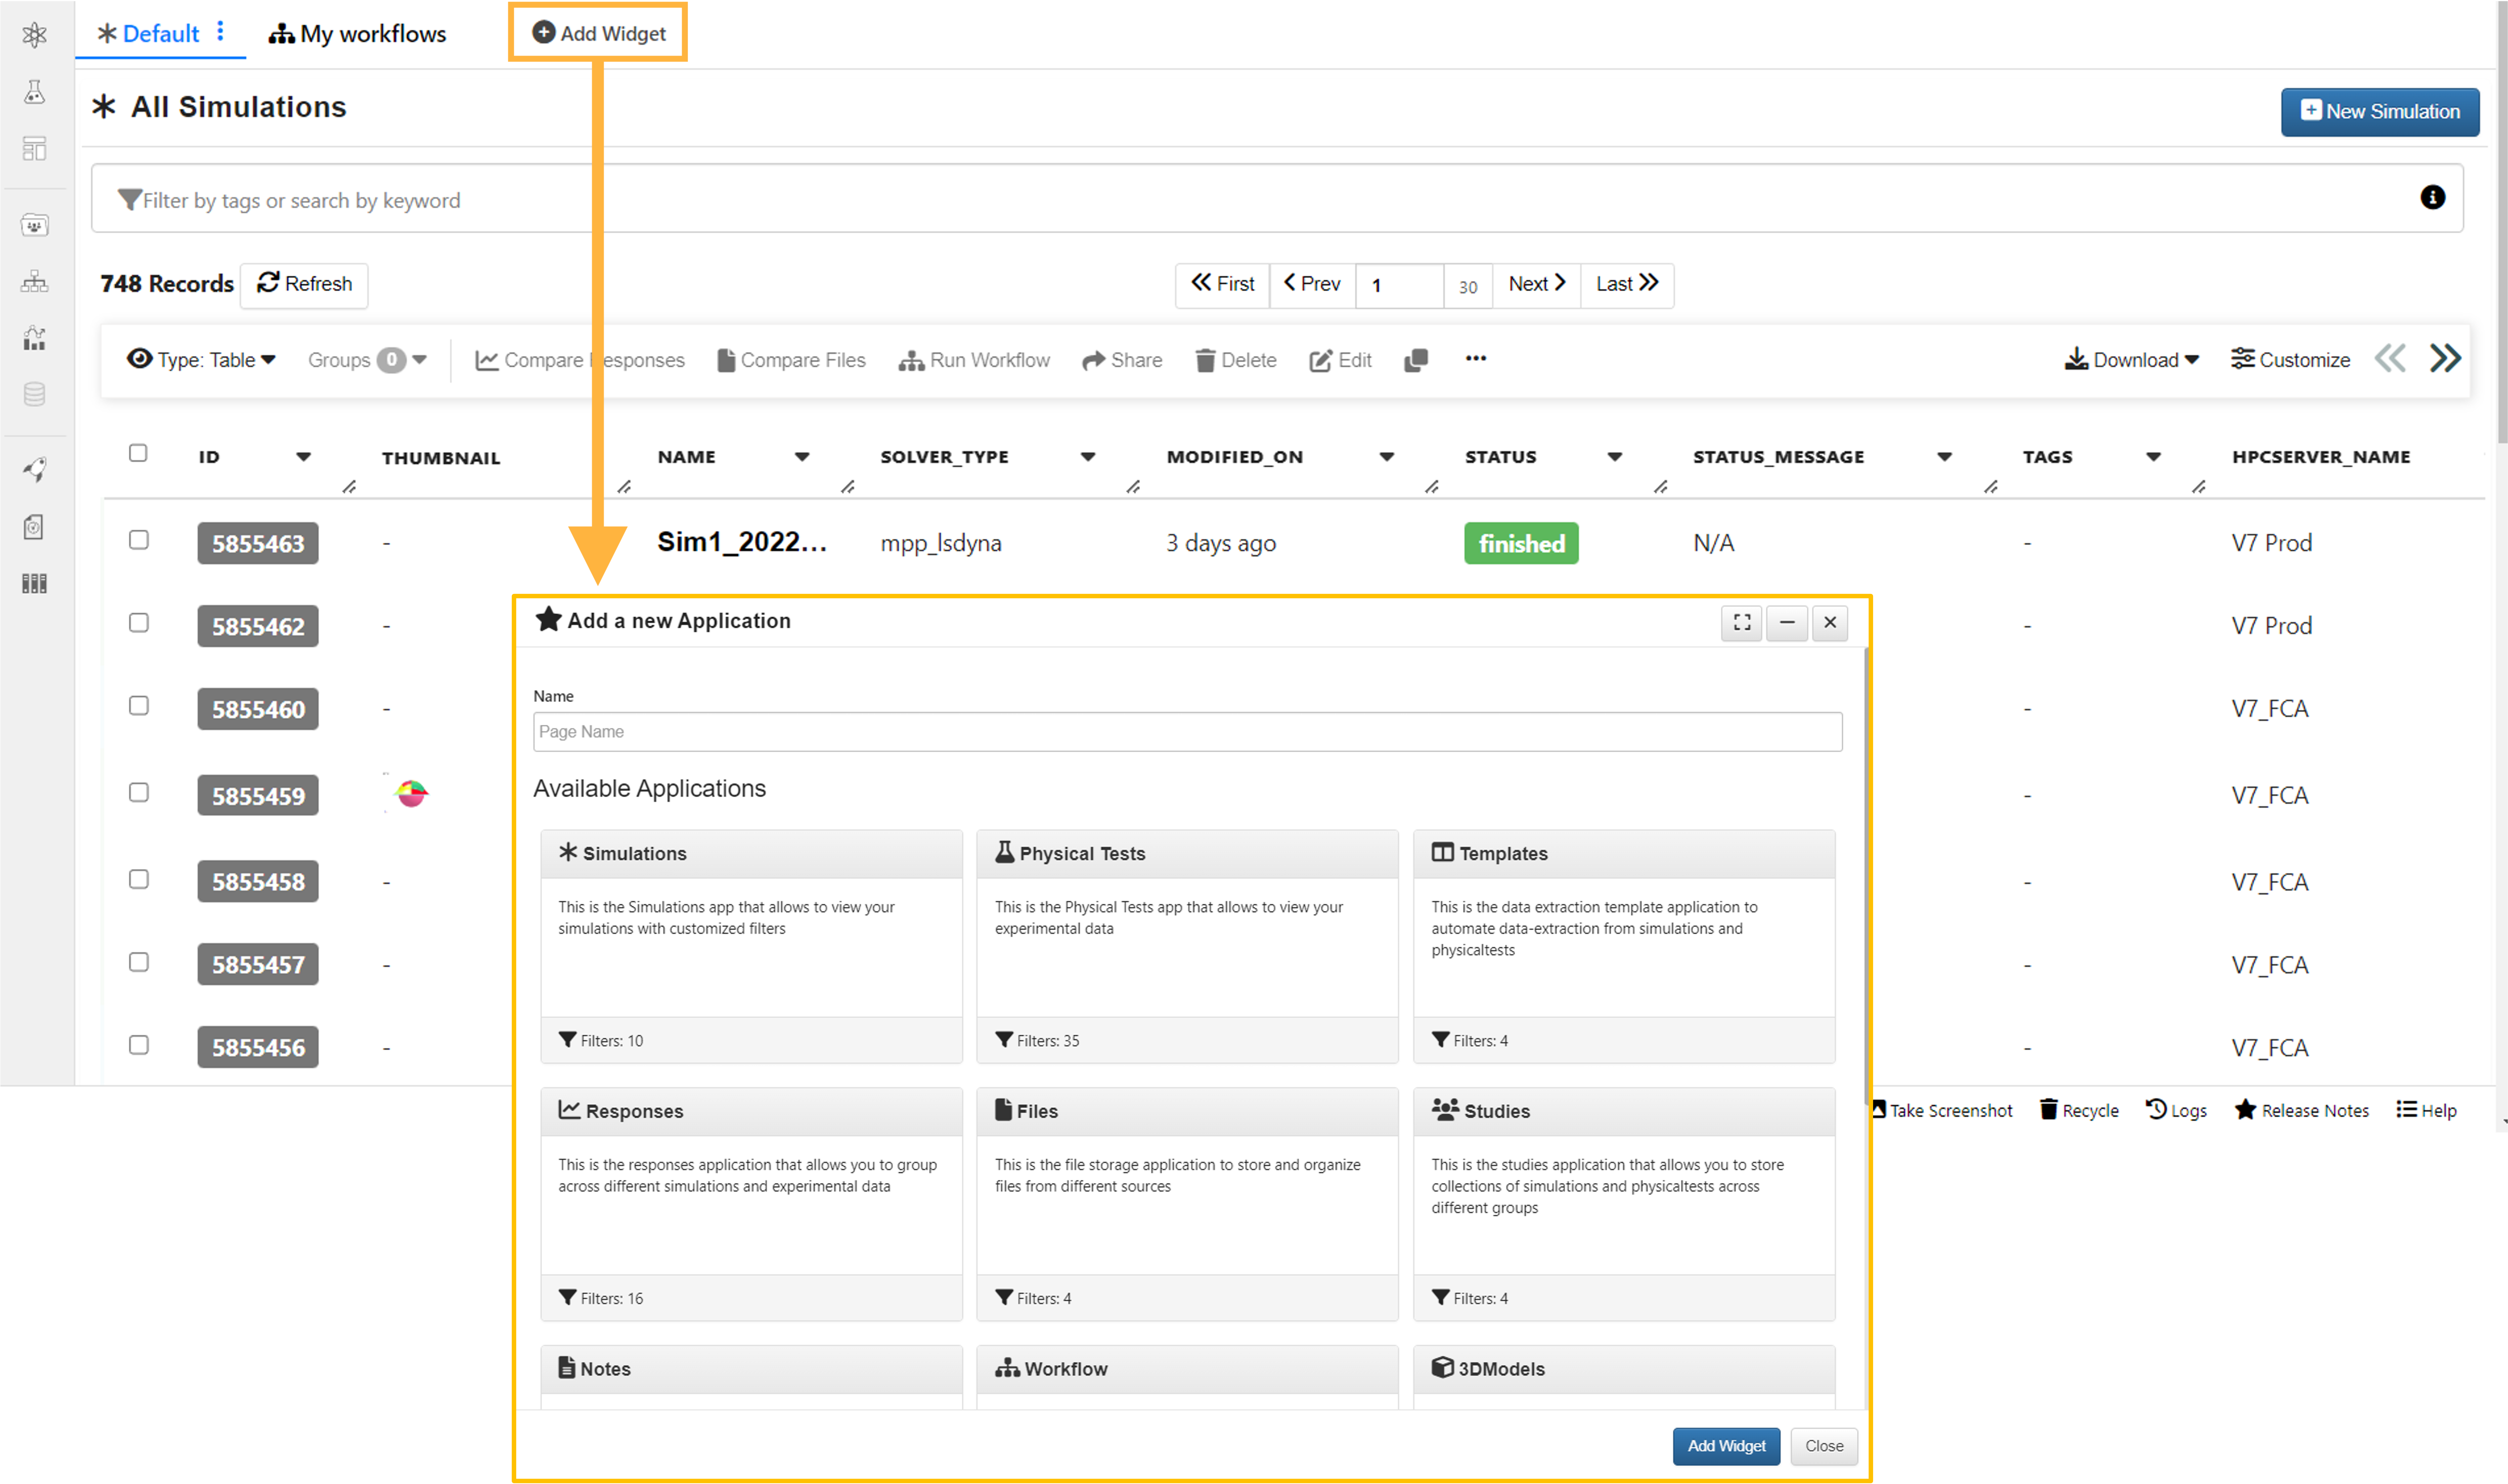
Figure 2: Add Widget
Specify a name, layout, icon and description for your new Dashboard. Make sure to select which application you would like to have at the bottom.
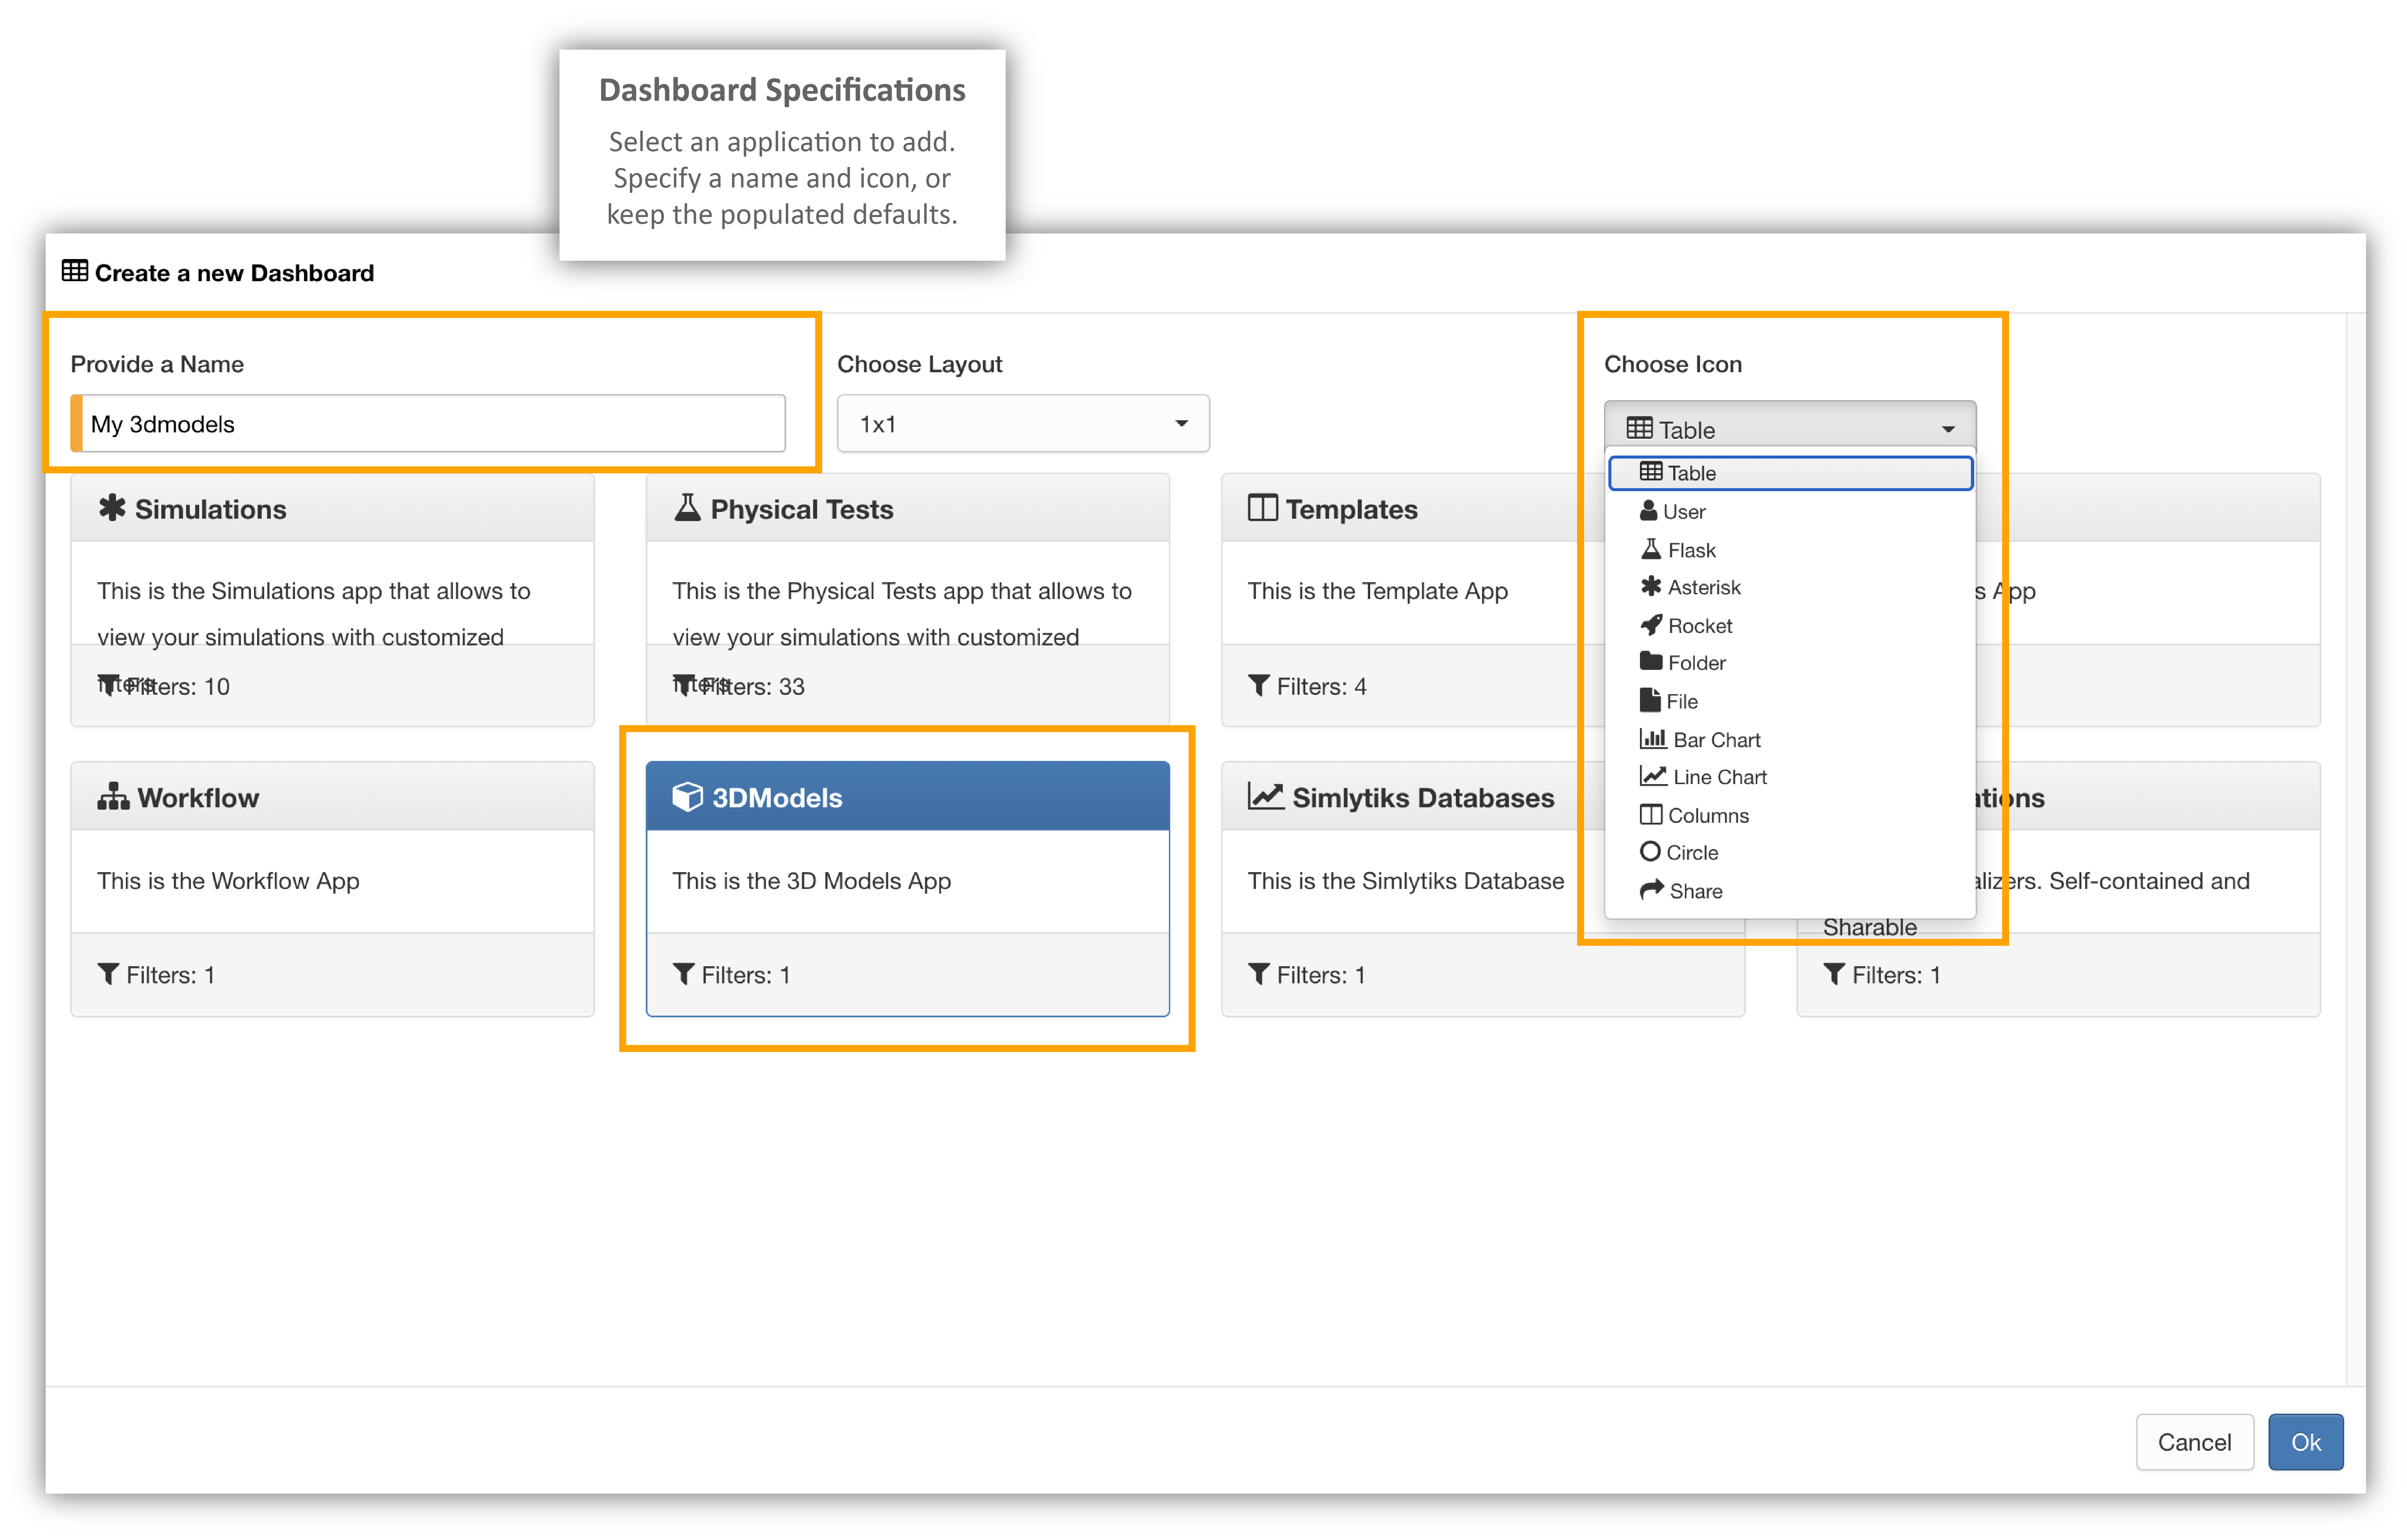
Figure 3: Dashboard Specifications
Edit Your Dashboard
Each and every applications has its own filters. Every dashboard is unique in its own way, customized to enhance the user experience. Edit a dashboard by clicking on the pencil icon next to its name on the dashboard panel. You can edit just the name of a dashboard by clicking on it at the top of its page.
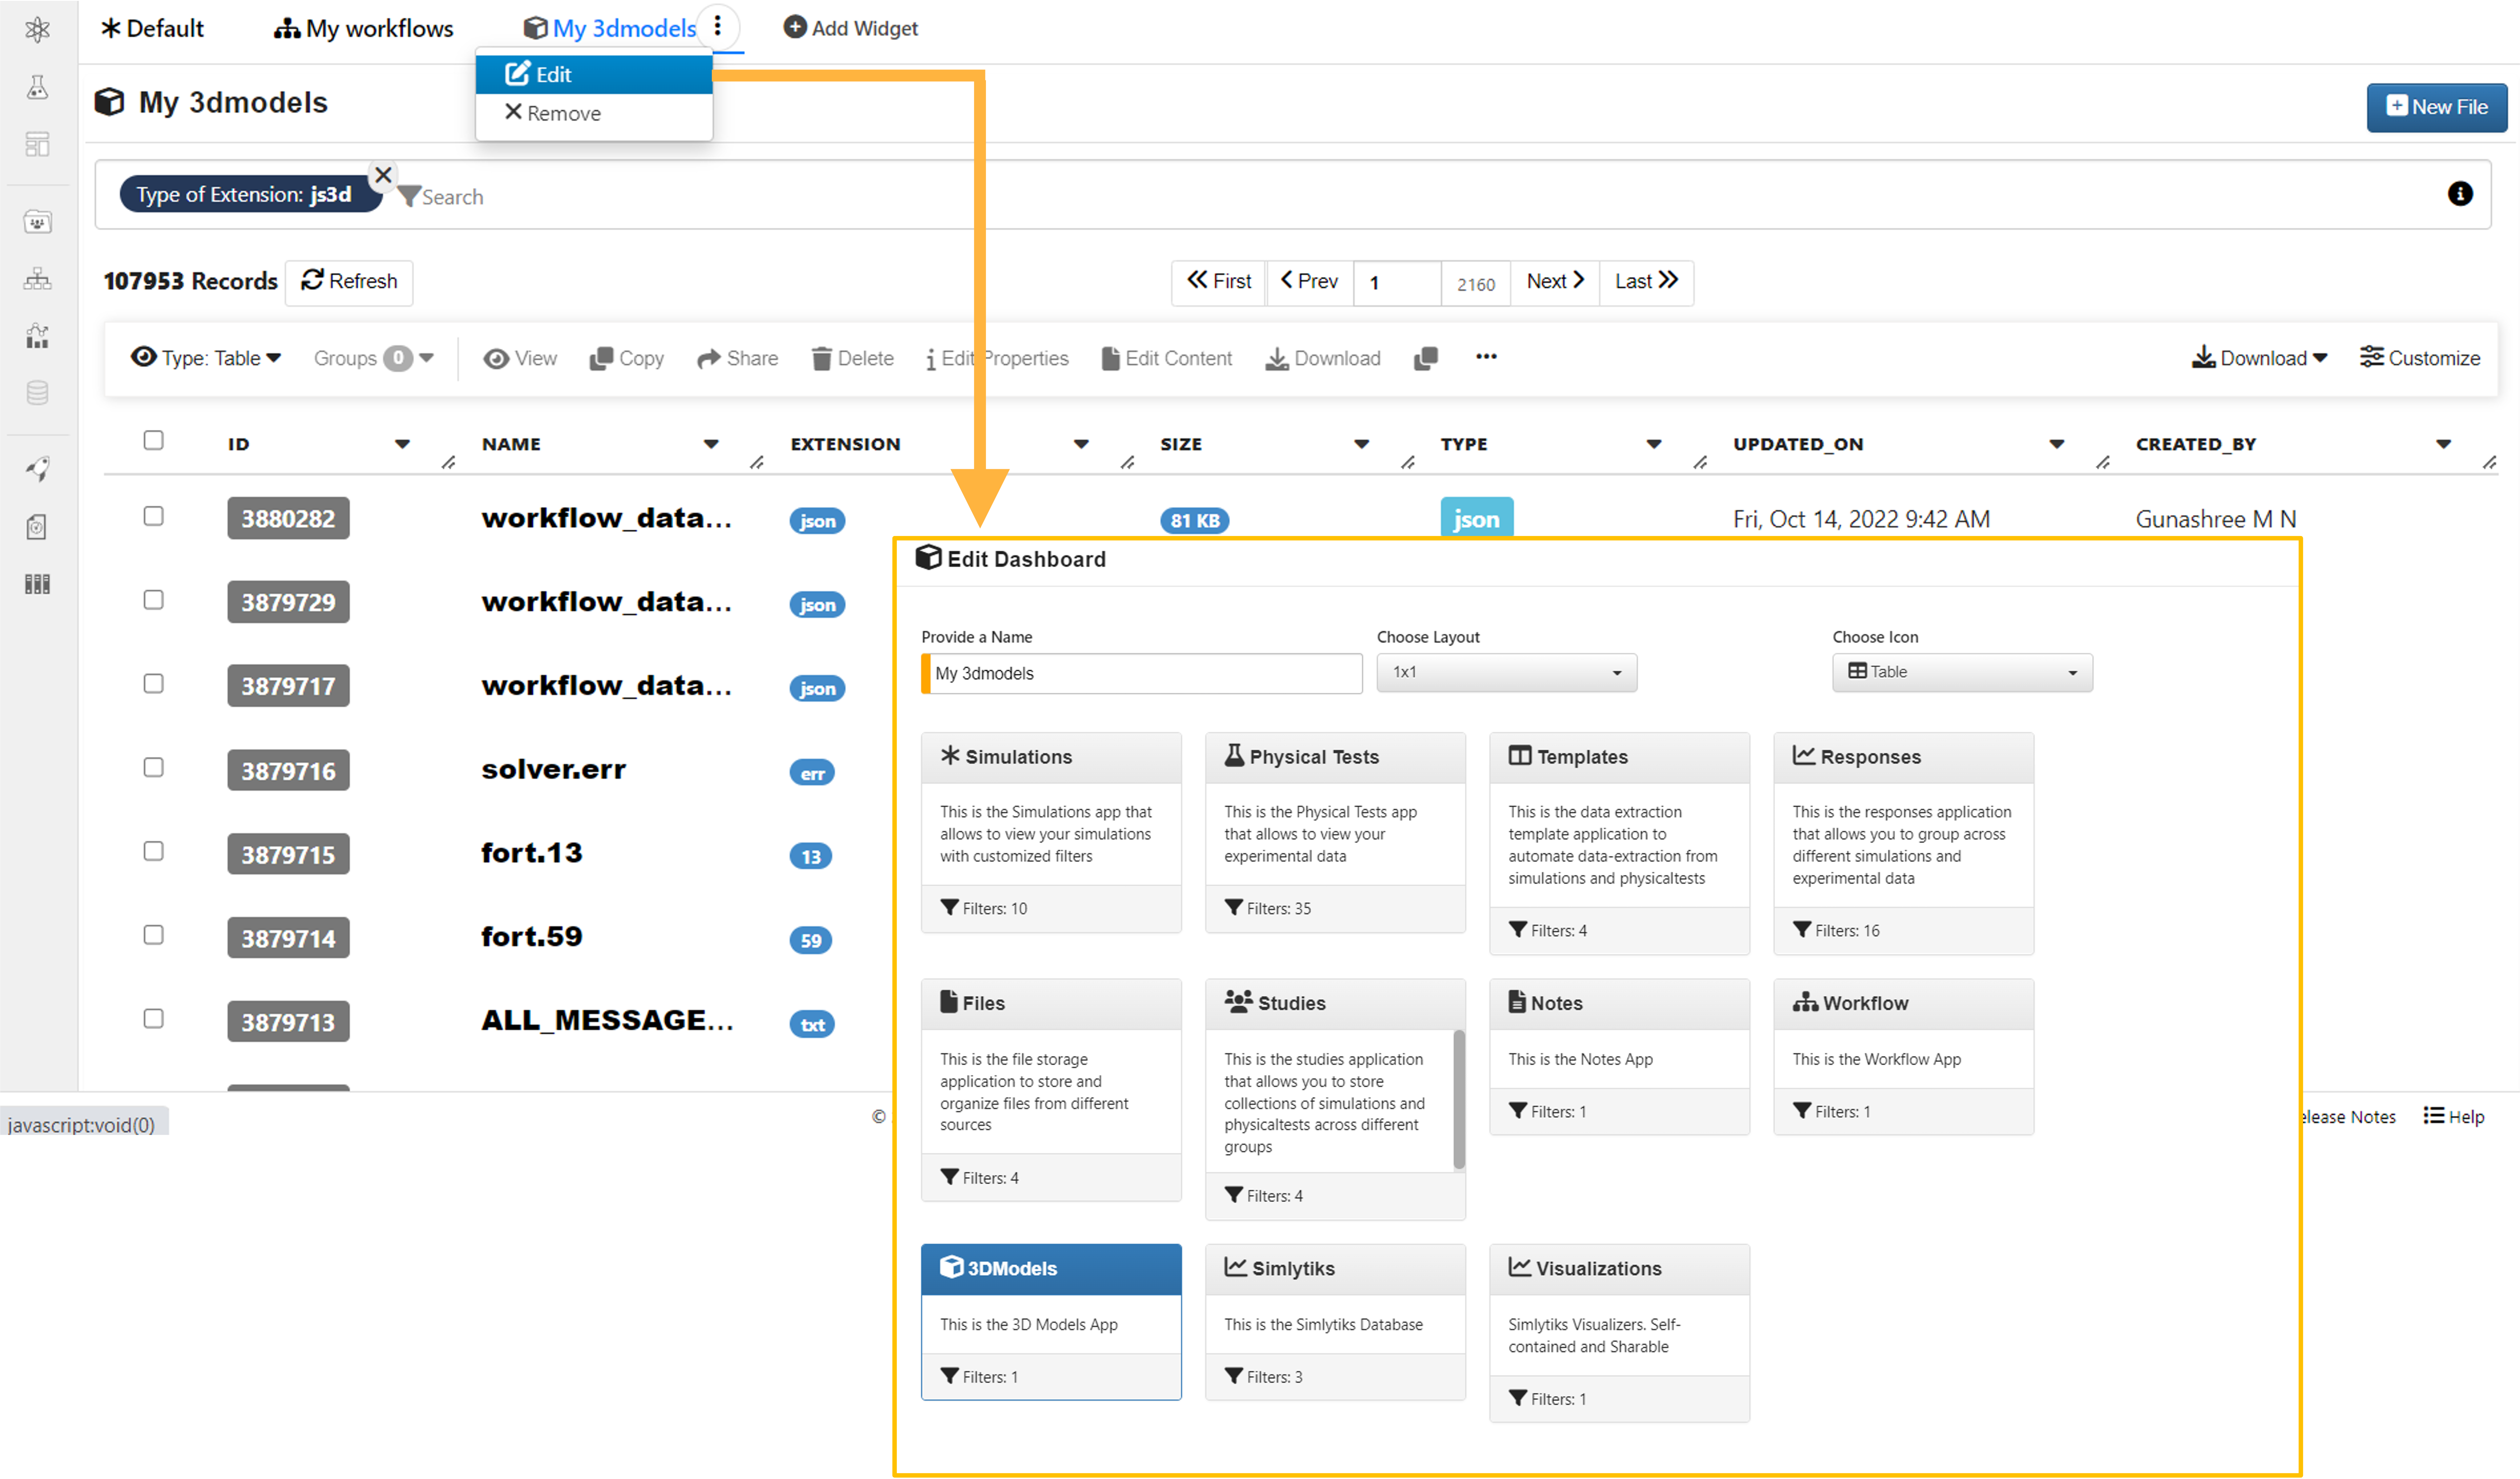
Figure 4: Editing Dashboards