11. GraphR
GraphR provides users a highly flexible environment to view, transform and compare scientific data to compare simulations, tests, workflows. It is built on top of all existing applications available in d3VIEW to provide users a comprehensive environment for data visualization and analytics.
GraphR is now available under applications.
GraphR
The Application provides quick access to the diffrent options available for response extraction and viewing.
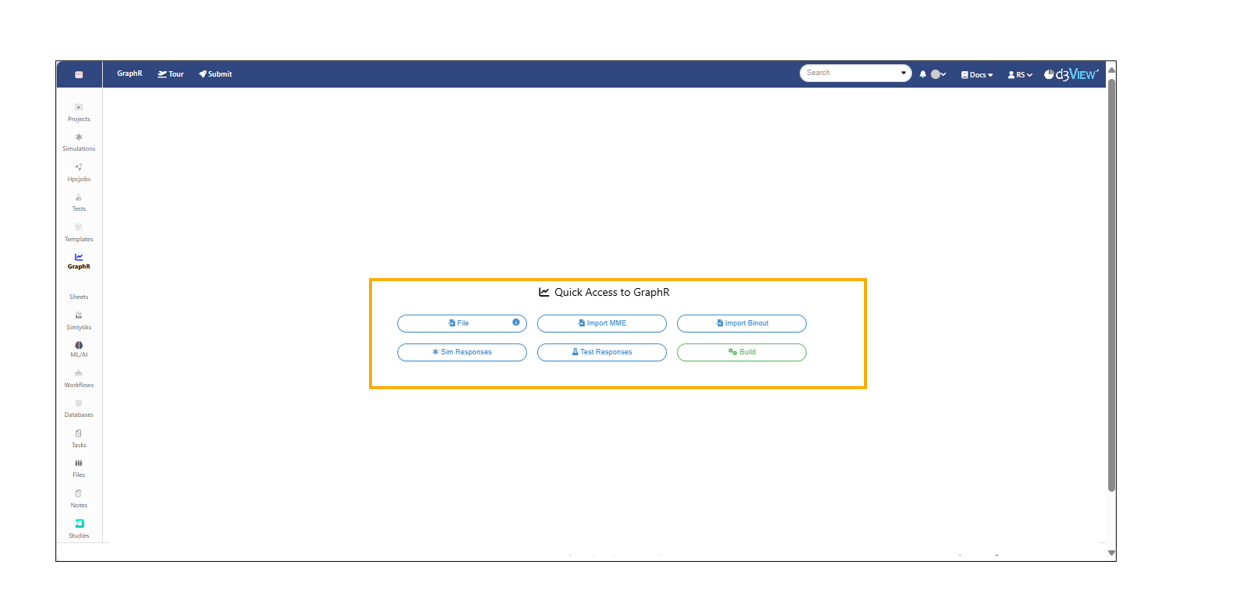
Quick access
11.1. Import Options available on GraphR
The responses can be imported from diffrent means to GraphR application.
The list shows the available options for import:
- Import from file
- Import from MME file
- Import from Binout file
- Import from saved Simulations
- Import from saved Physical tests
- Build ( where user can build the visualizations )
let us see some examples for all the options above
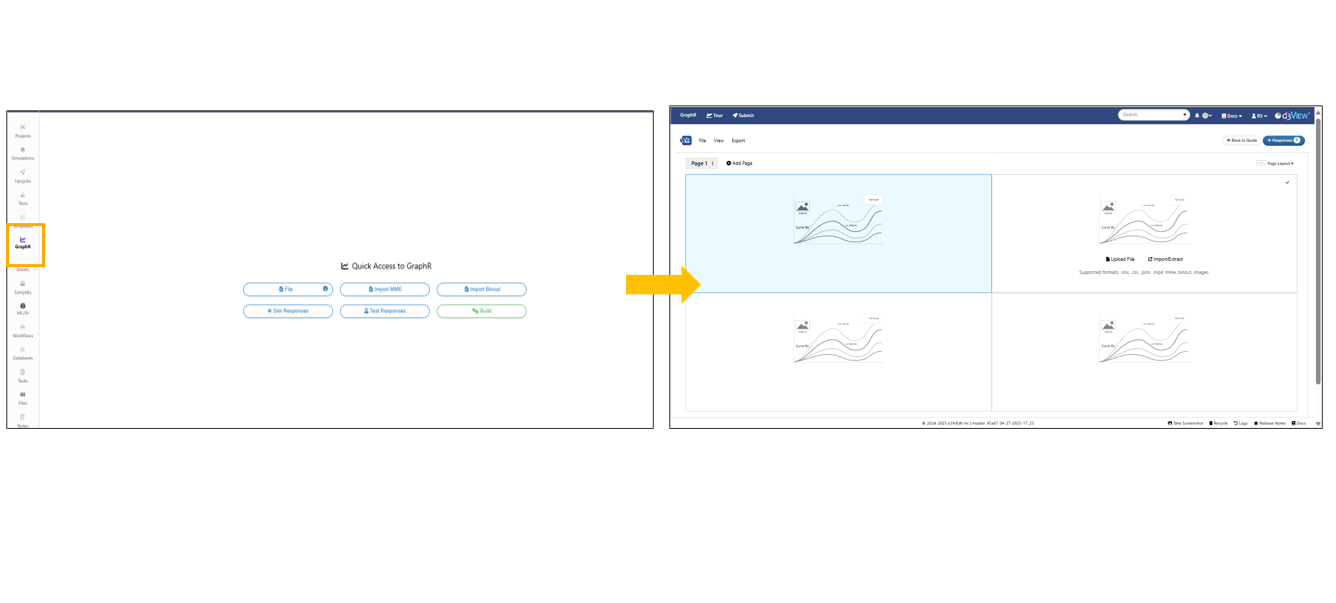
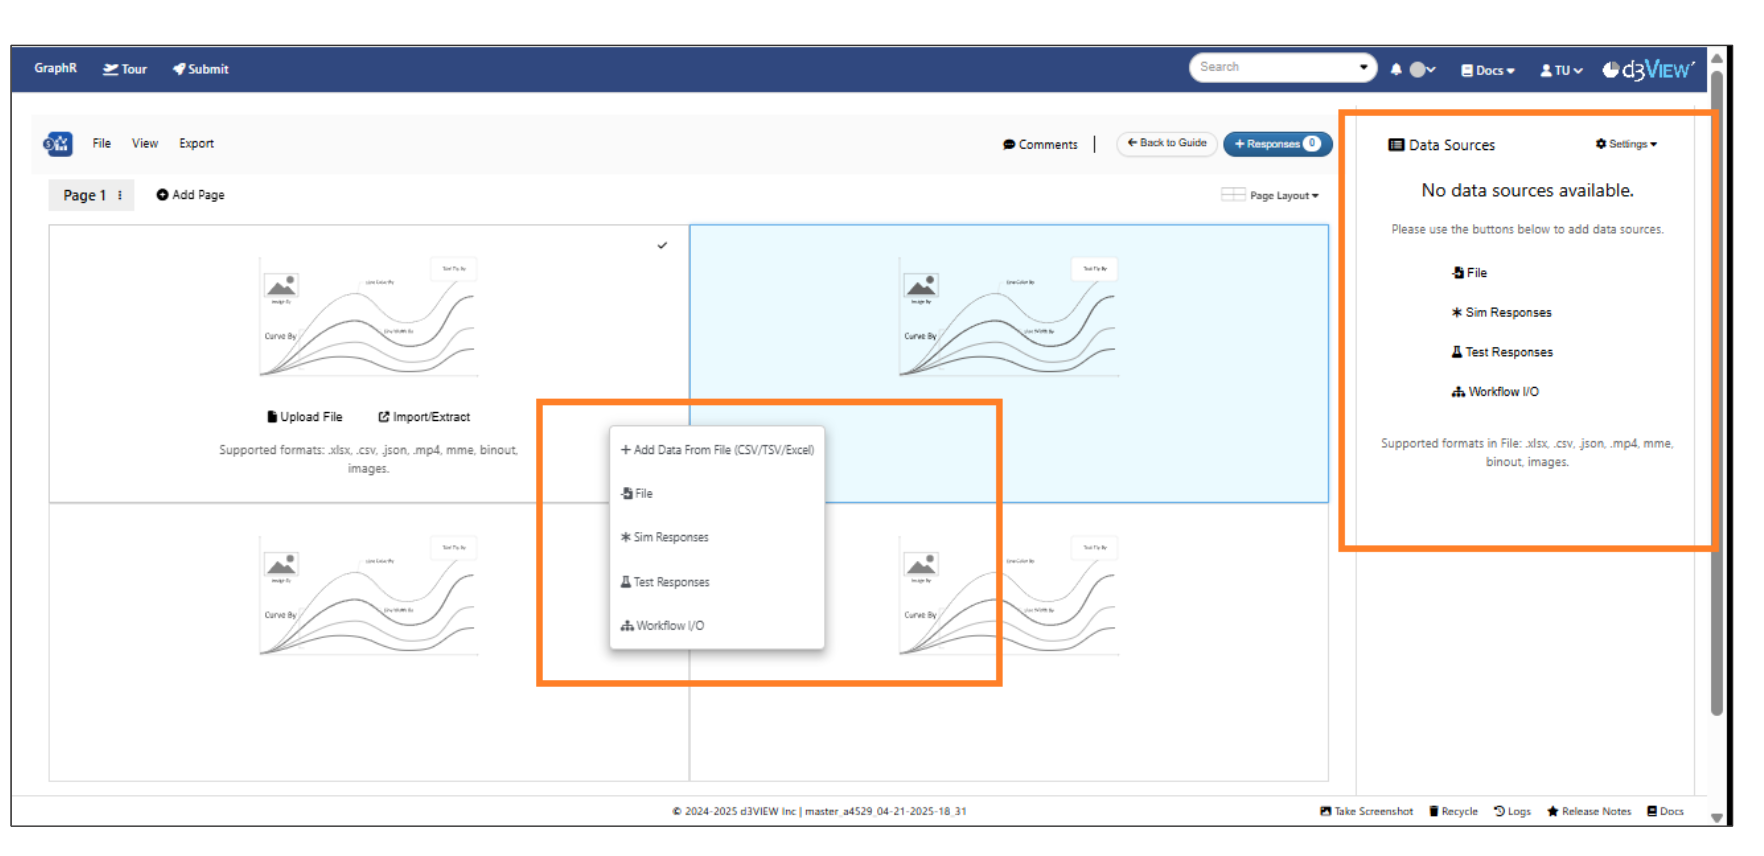
Import from file
We can import the responses by uploading any CSV file from the local system. The responses can be added to GraphR visualization containers just by clicking on add button after importing the response.
The pictures below shows how to import response from a File.
Import from file
Import from file
Import from MME file
Users can import the responses and view them in GraphR using MME zip file. MME zip file uploads the file and import the responses from the file and show them in the responses tab. These responses can be added to the containers either by clicking on ‘Add’ button or by dragging and dropping the response on to the container.
Below picture shows us how to import the responses from MME zip file.
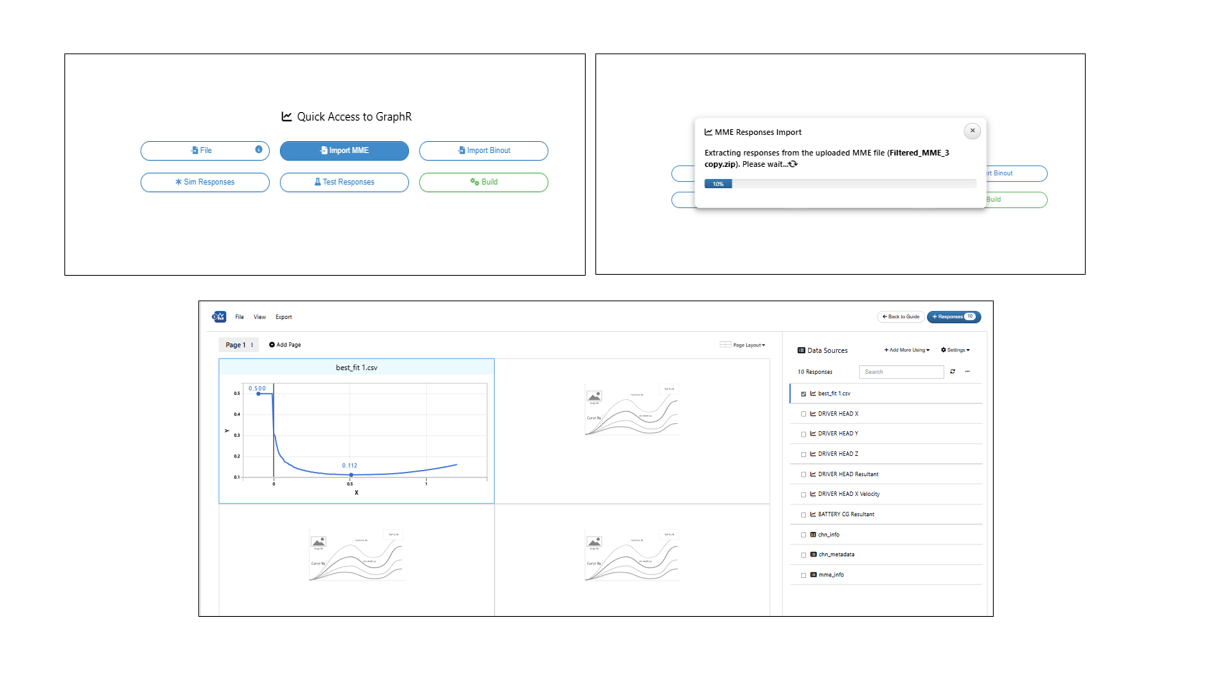
Import from MME
Responses from MME files can be imported in GraphR application and can be overlayed with colors. The responses also have option to append or prepend to the GraphR page.
Import from Binout file
Users can import the responses and view them in GraphR using Binout files. Binout files will create simulation internally and allows user to extract responses using binout extractor worker. these responses can be added to the containers either by clicking on ‘Add’ button or by dragging and dropping the response on to the container.
Below picture shows us how to import the responses from Binout file.
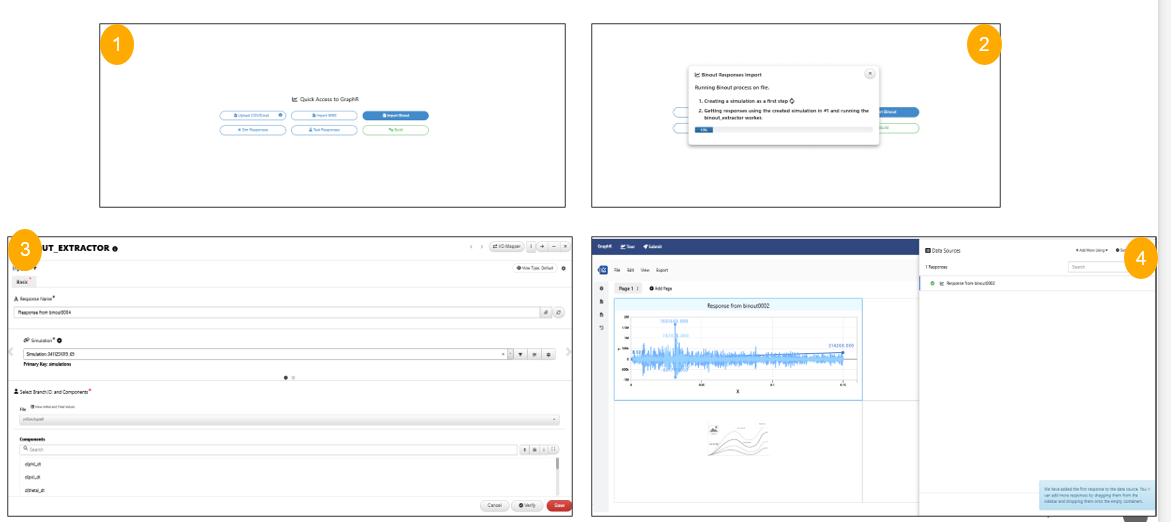
Import from Binout file
Import file from GraphR
Import from MME and Binout options are merged to ‘File’ import in GraphR application.
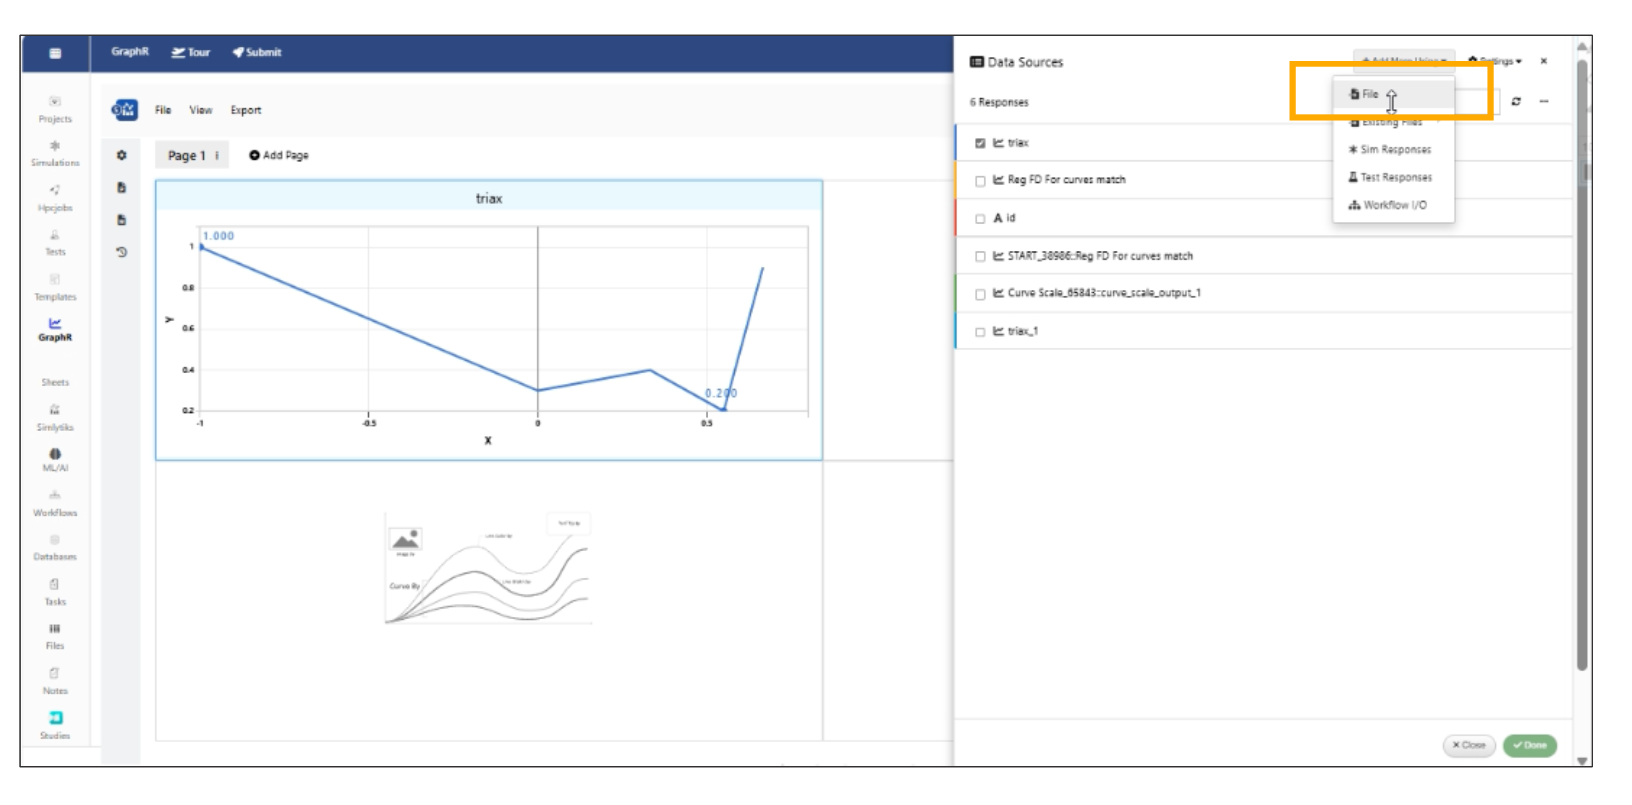
File
Import from saved Simulations
We can import responses from saved simulations to GraphR application.
Below picture shows us how to import the responses from simulation.
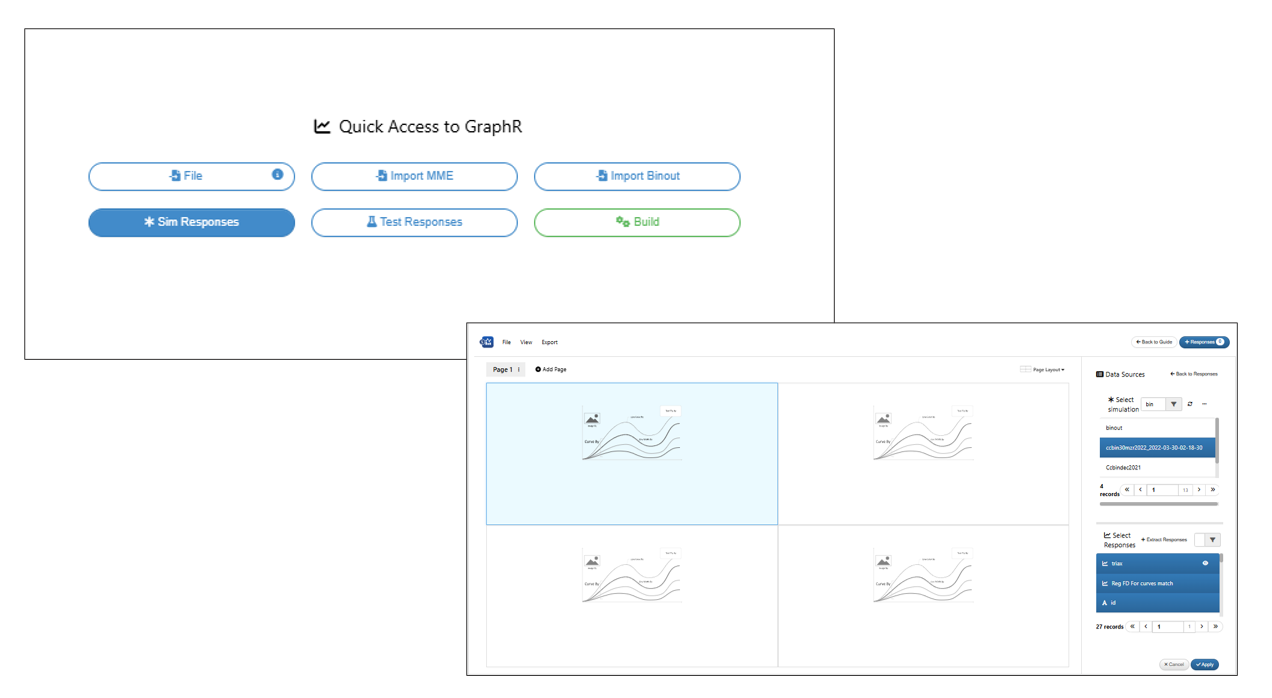
Import from saved Simulations
Import from saved Tests
We can import responses from saved Physical tests to GraphR application.
Below picture shows us how to import the responses from Test.
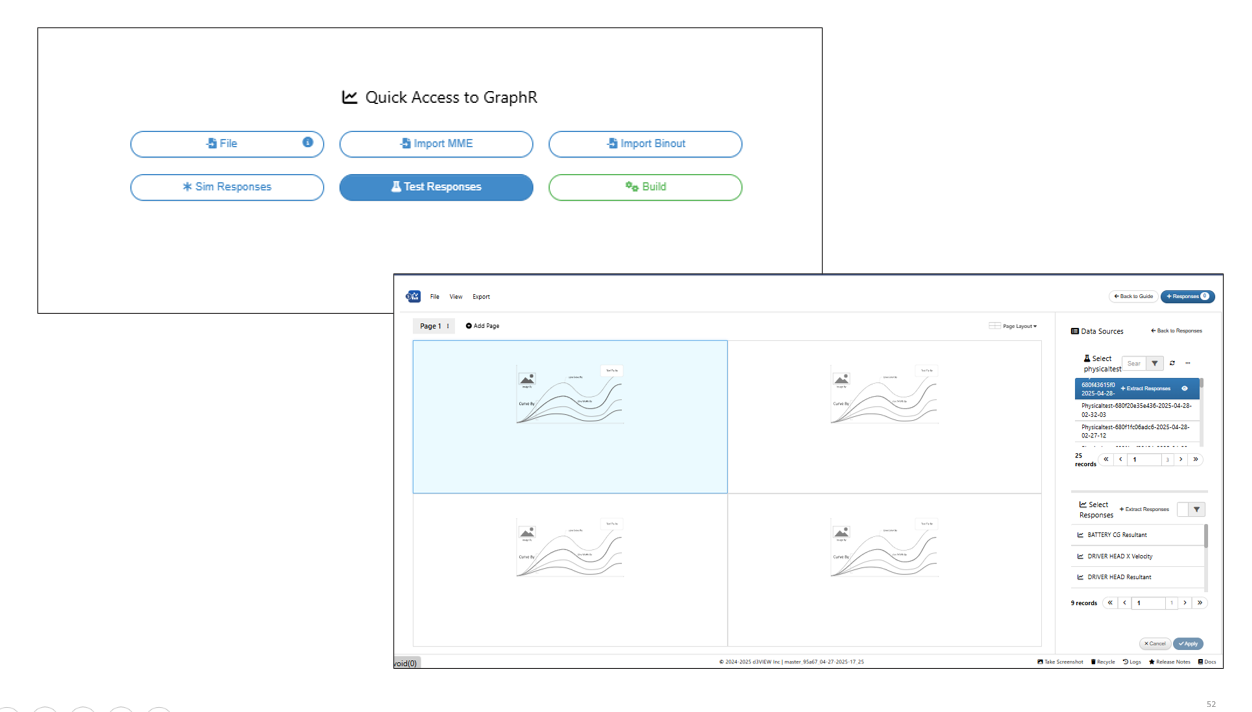
Import from saved Test
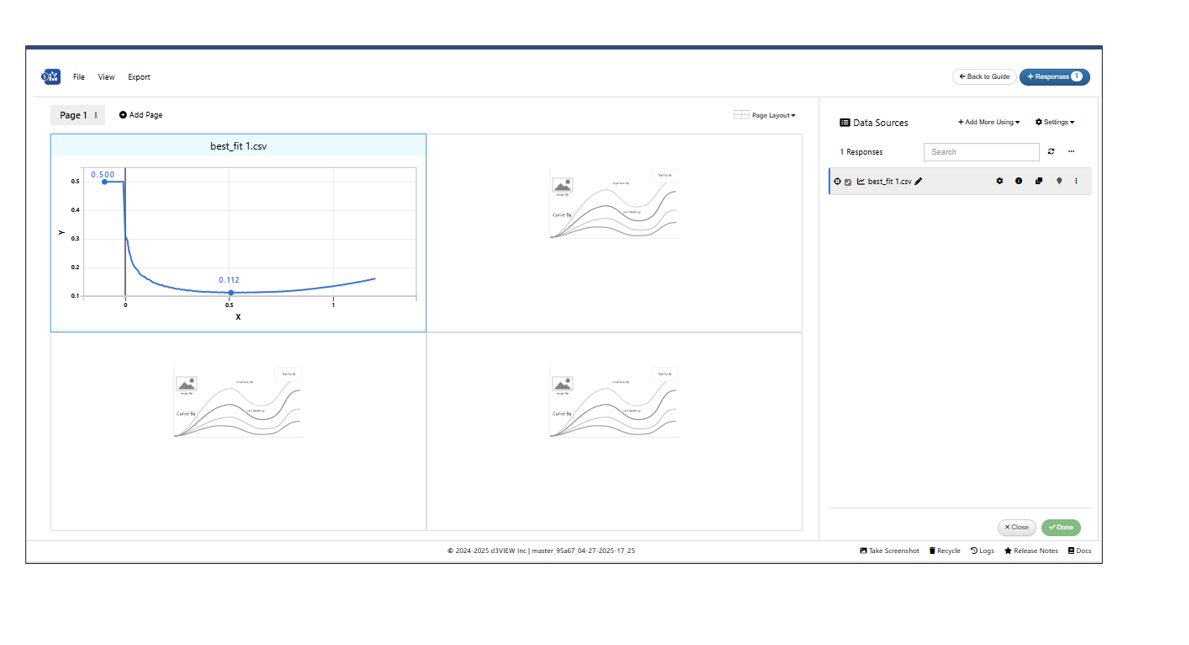
Build GraphR
When user clicks on GraphR, the user will observe the visualization containers where responses can be manually added using all the options available above.
The user can click on responses on the top header option or go back guide by clickng on back to guide button.
Below picture represents the build GraphR data using responses button in header.
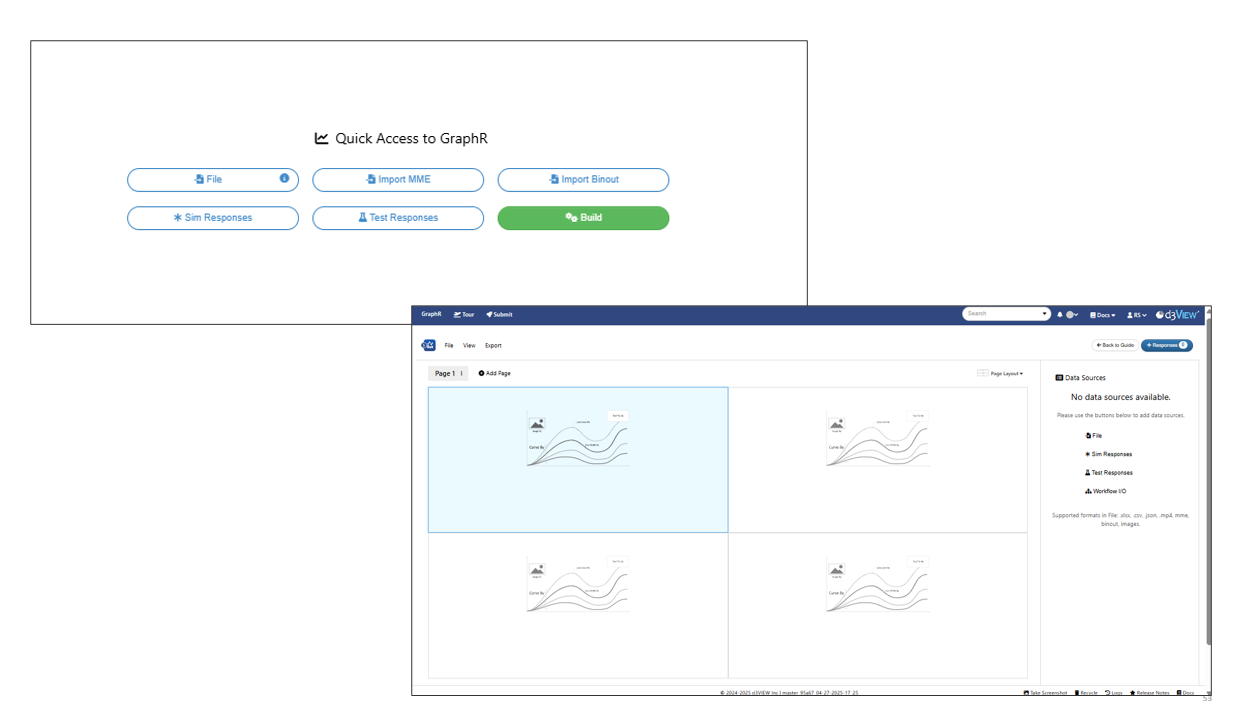
Build
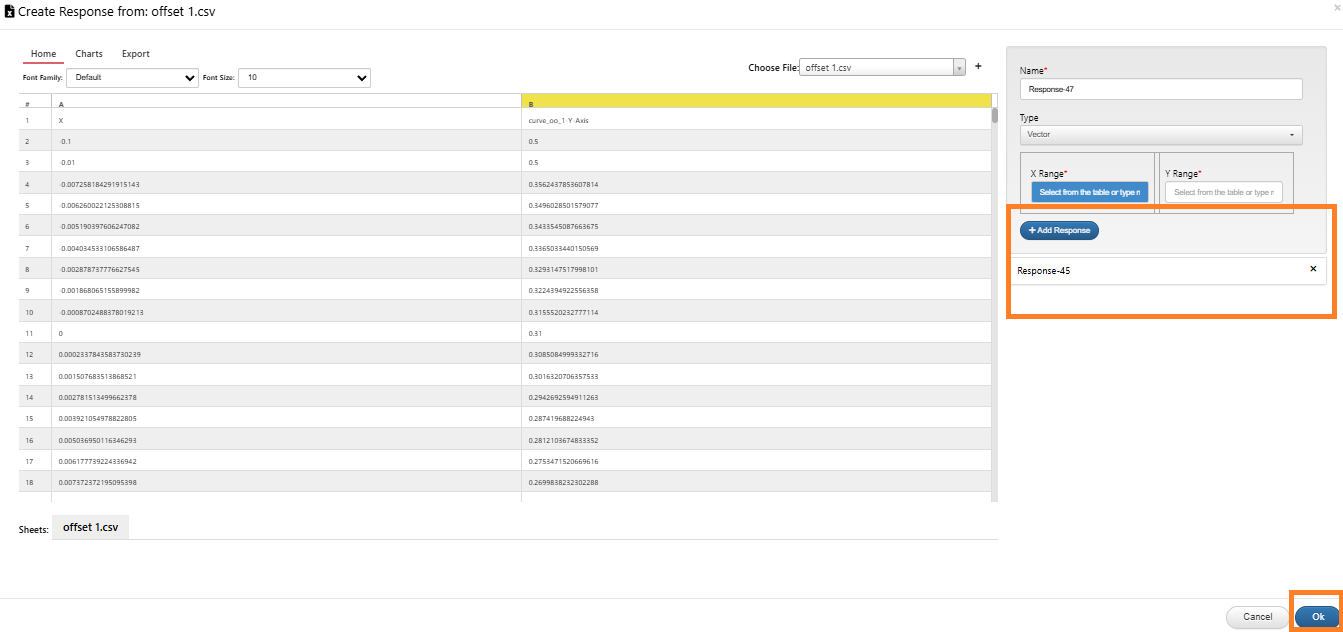
11.2. Add responses
Responses can be added using the button available in the header to the visualization containers. The reponses button will show up all options available to import the responses.
User can choose the type of responses required to add to the container and view them.
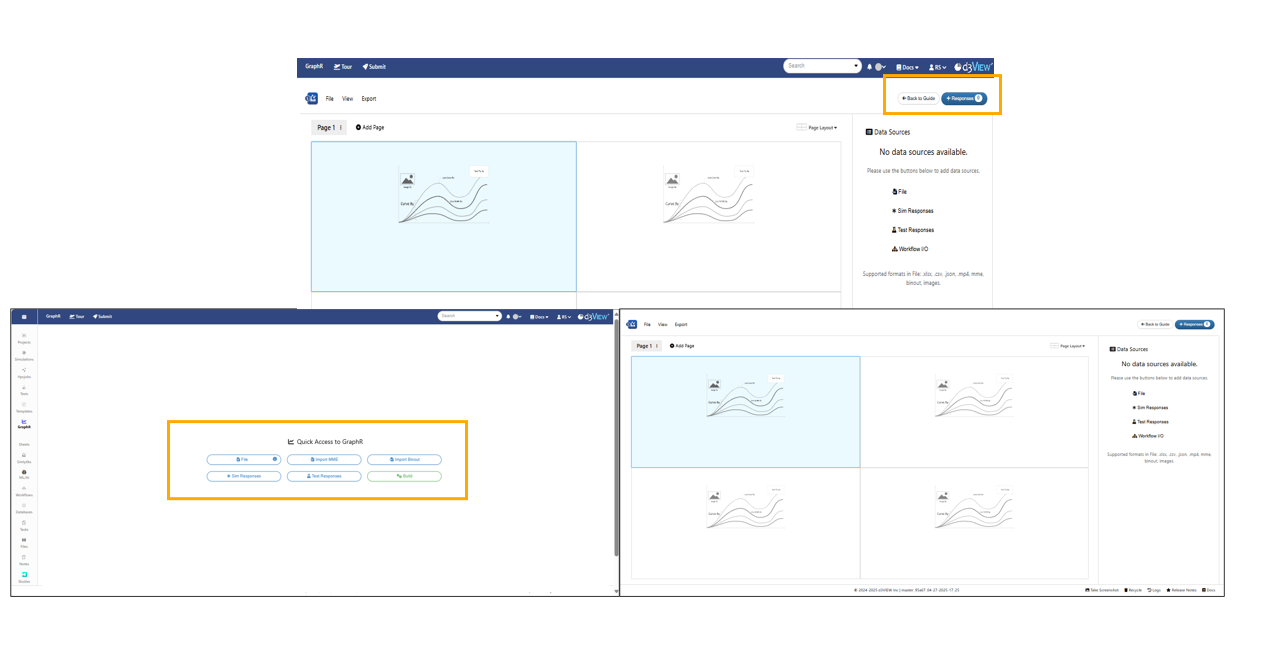
Responses
In GraphR application we have ‘Add Responses’ , ‘Back to Guide’ and ‘Clear Data’ options in header. Add Responses will show the existing responses and when there are no responses then it will show import option as in guide.
In GraphR application, dragging and dropping responses from the response table to containers with existing visualizations will now ask user to either replace or overlay in addition to various other options. All the options are available before adding responses to already existing container.
Movies/images can be added to the empty containers in the GraphR application.
Curves overlay in GraphR application will now provide context menu options to detach and remove an attached data source. Newton curves can be detached from the container using context menu options.
Responses
GraphR application responses tab now supports a dropdown of options to import the responses from different sources.Responses can be imported from saved workflows using this option.
The responses in the Graphr application will have context menu options.
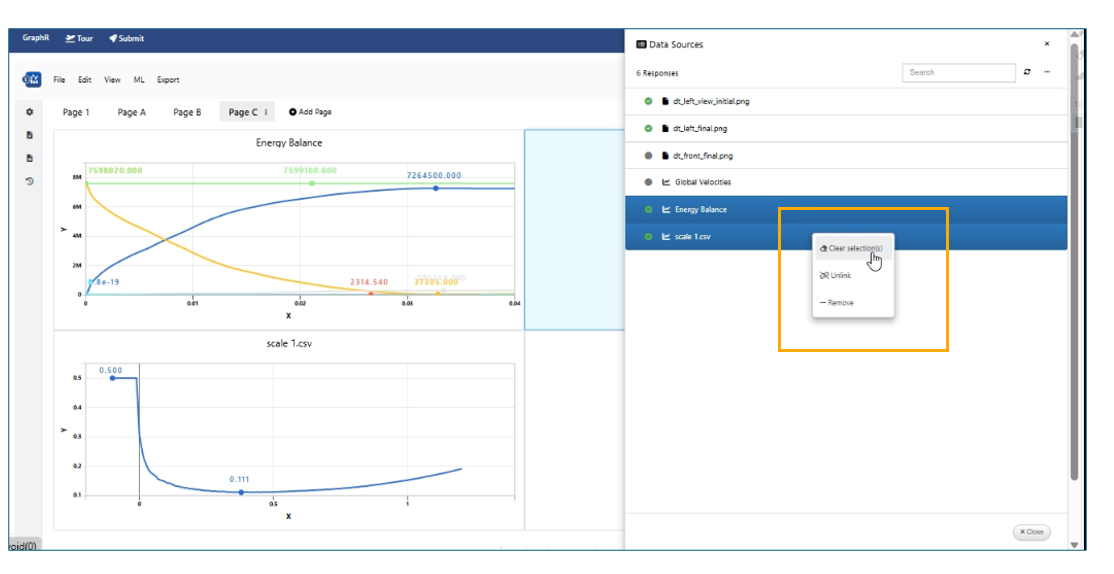
Responses Context menu
Data sources in GraphR application will show info icon which will display all the details of the response.
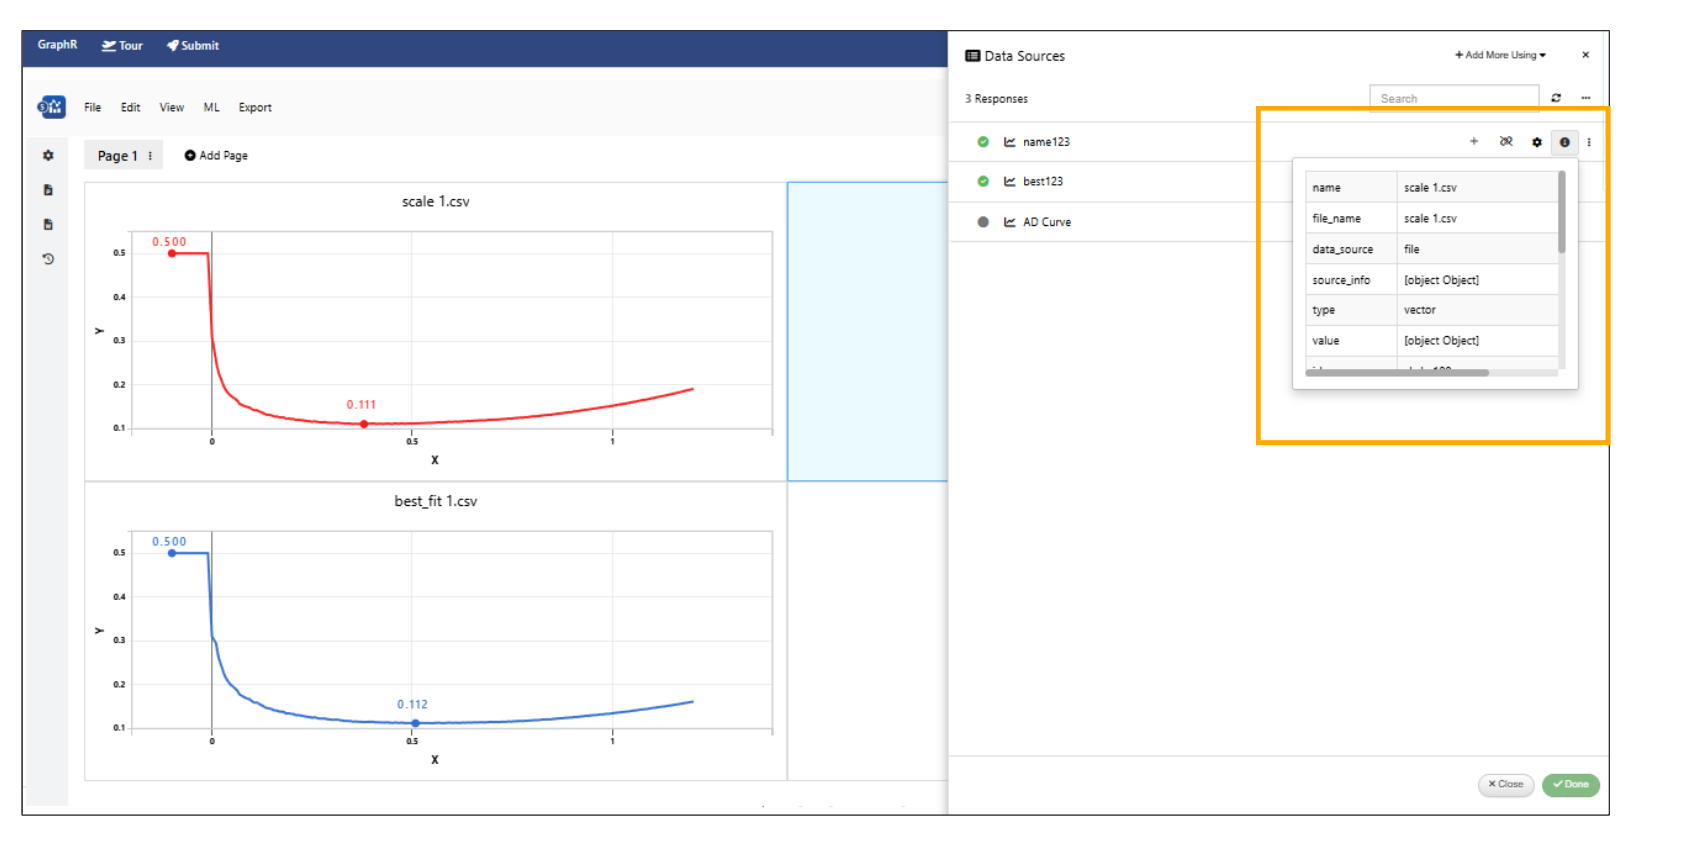
Info
The Information available for the responses in GraphR application will open the data source ( Simulation or Physical test ) when clicked on the ID in the Info.
Newton responses in GraphR application now supports Transformations which will save the transformed curve as a new response in the responses list.
In GraphR application , the responses added from CSV files will show file name or sheet name for responses imported.
We can extract a response from already existing files in GraphR application under add more option.
Responses can be cloned and added to the containers in GraphR application
Upload button in the GraphR container enables addition of multiple responses to the same container.
Newton responses in GraphR application have edit option in the context menu of legends to edit the curve settings.
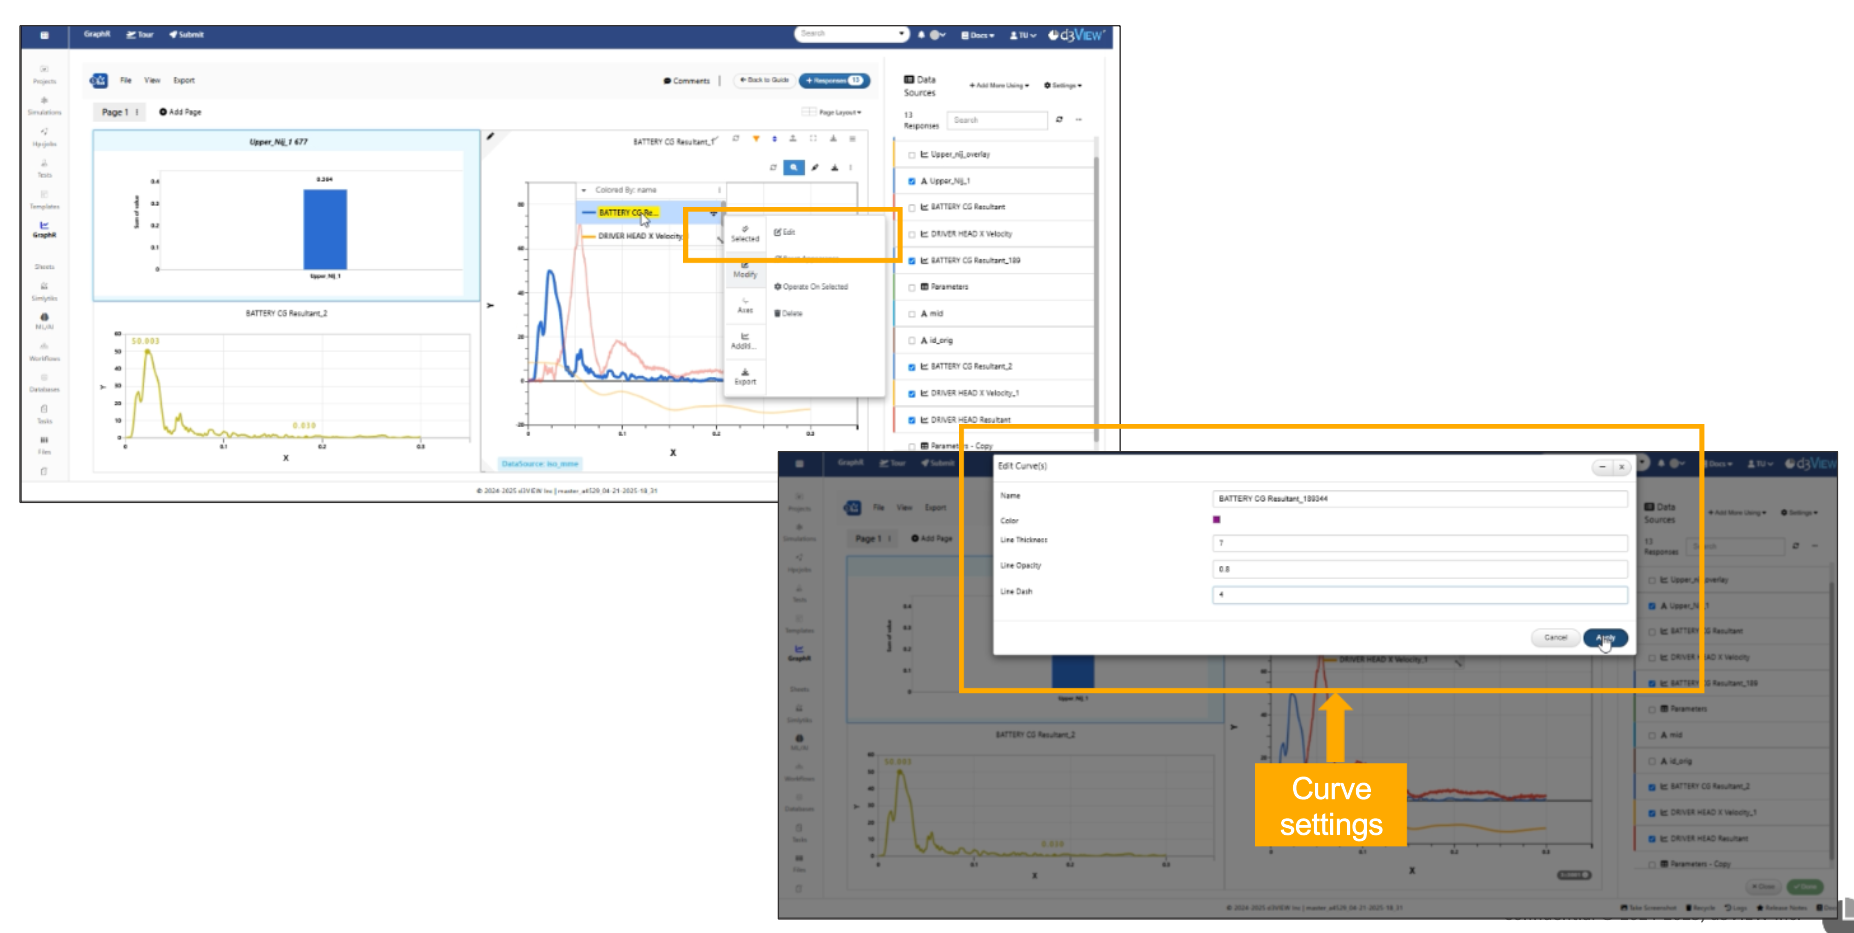
Responses edit
New text editor is available to edit the ‘Title’ of the visualizations in GraphR application
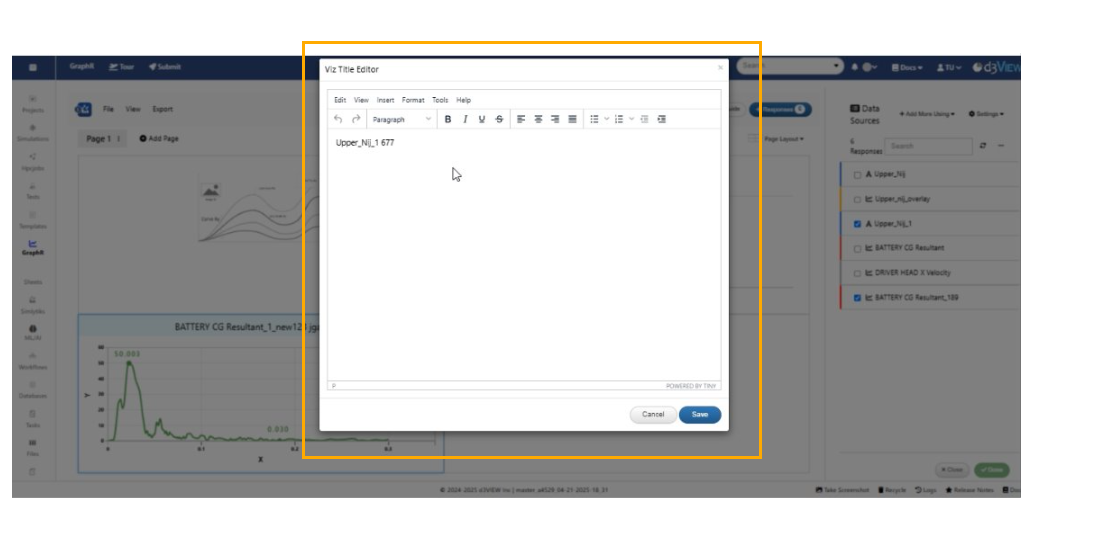
Title editor
GraphR responses side bar can be resized and the containers will be updated accordingly.
Re locate visualization
In GraphR application, newton responses can be relocated using context menu available in the legend of the visualization.
The responses in the GraphR containers can be moved to other sources/containers using context menu options.
Column type
CSV/Excel file uploaded in GraphR application supports a new extraction type called as COLUMN which acts similar to scalar type for column.
Layout
Layout option from Simlytiks is now available in the GraphR application. The visualization container’s layout can be changed using this option
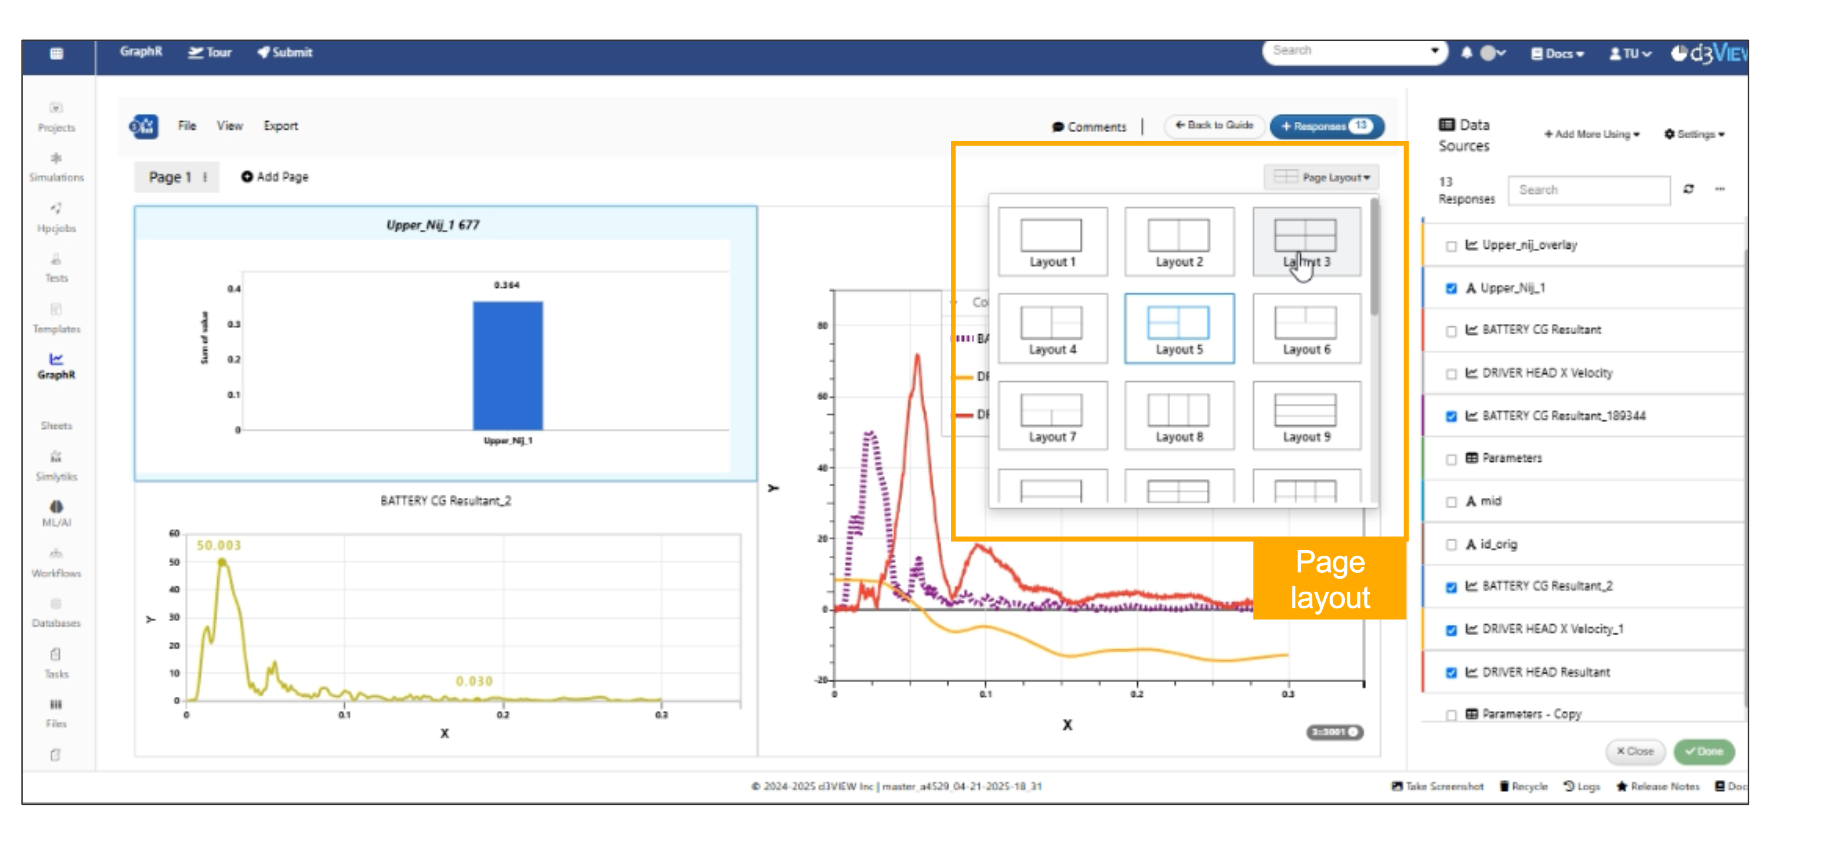
Layout
Responses edit configuration
GraphR application responses can be edited with respect to name, color and thickness. These will be reflected in the visualizations.
Export/Import responses.
GraphR application dataset can be exported and Imported to the new page with all responses.
The datasets can be exported and then imported to new graphR application.
In GraphR application, The context menu options of the visualization container will show same import options as in responses tab.
Context menu of containers
Saving GraphR
GraphR application now supports opening of saved GraphR dataset from simlytiks page.
Transformations
Certain operations can be performed on selected GraphR Newton responses. The transformed curve response will then be added to the list of responses.
Multiple operations can be performed on responses added in GraphR application and these transformed responses will be added to the responses list
MP4 videos
Videos in GraphR application added to same container can now be overlaid and synced with each other.
PHYSICALTEST_IMPORT_MME_DATA worker output
The GraphR responses output of PHYSICALTEST_IMPORT_MME_DATA worker will show first five responses in the container.’
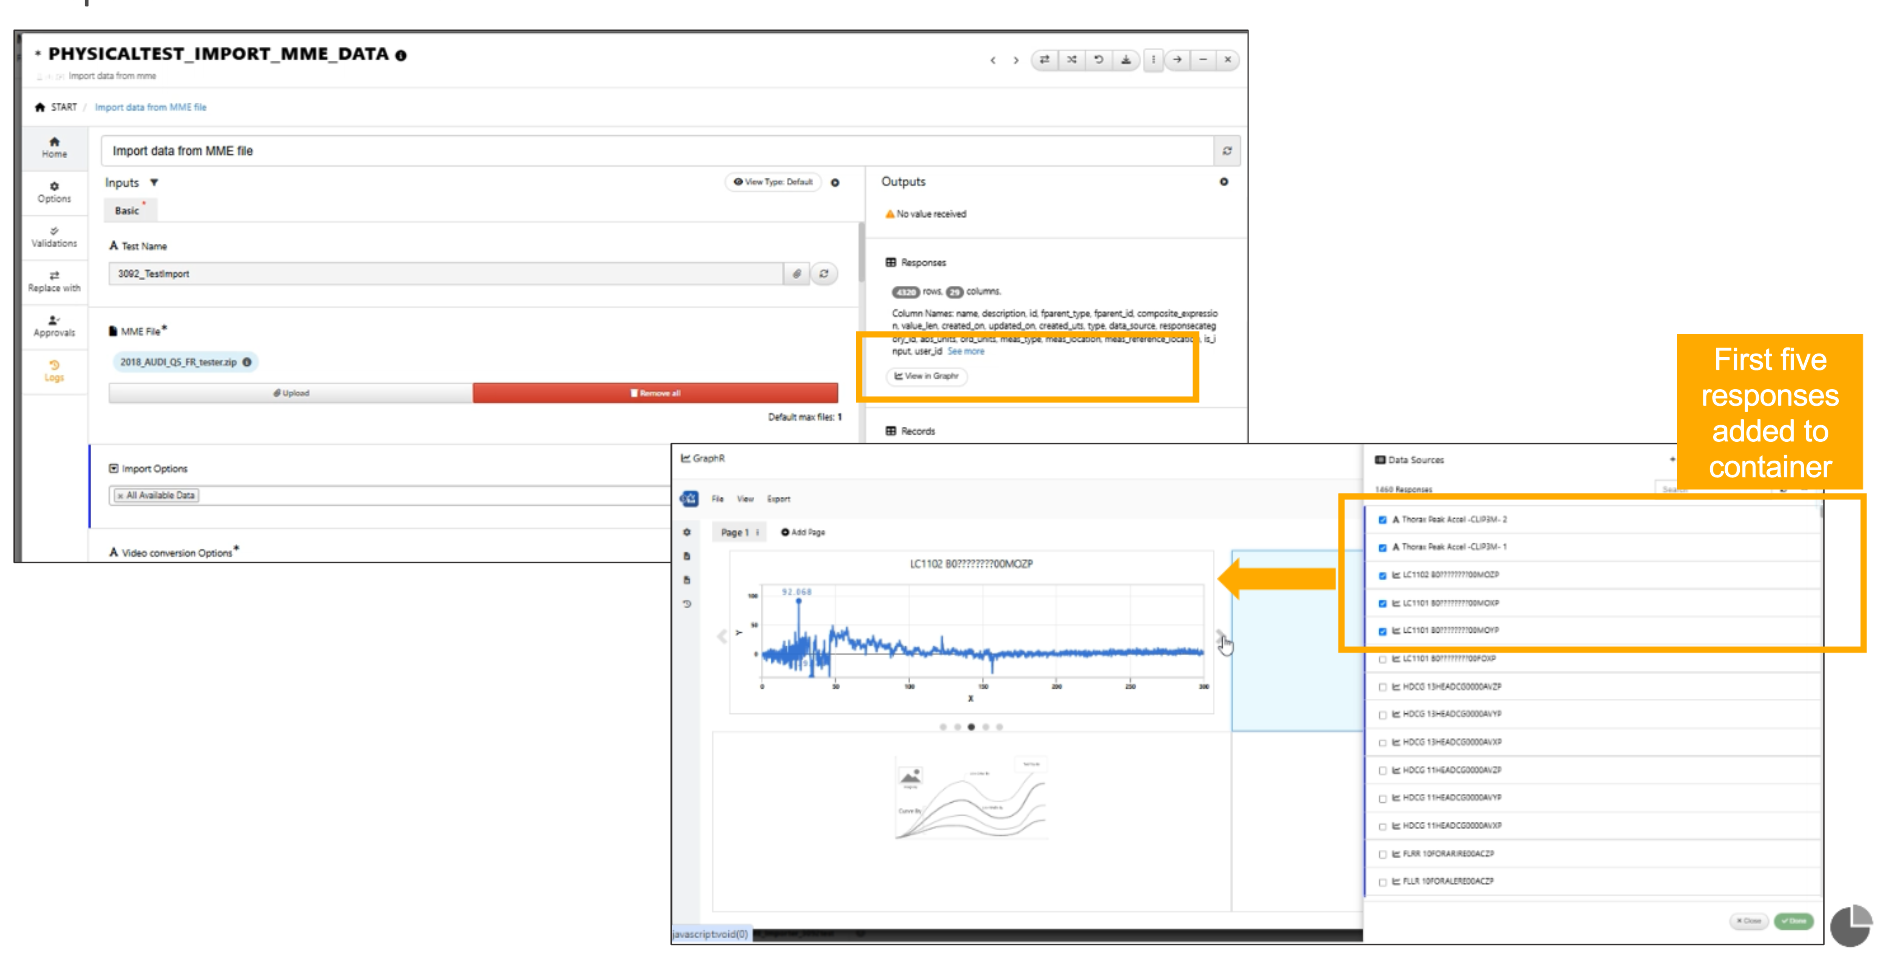
GraphR responses output
11.3. Datasets
Added new option called Datasets in the GraphR application, which displays all available Simlytiks saved datasets that can be selected and viewed directly within GraphR.
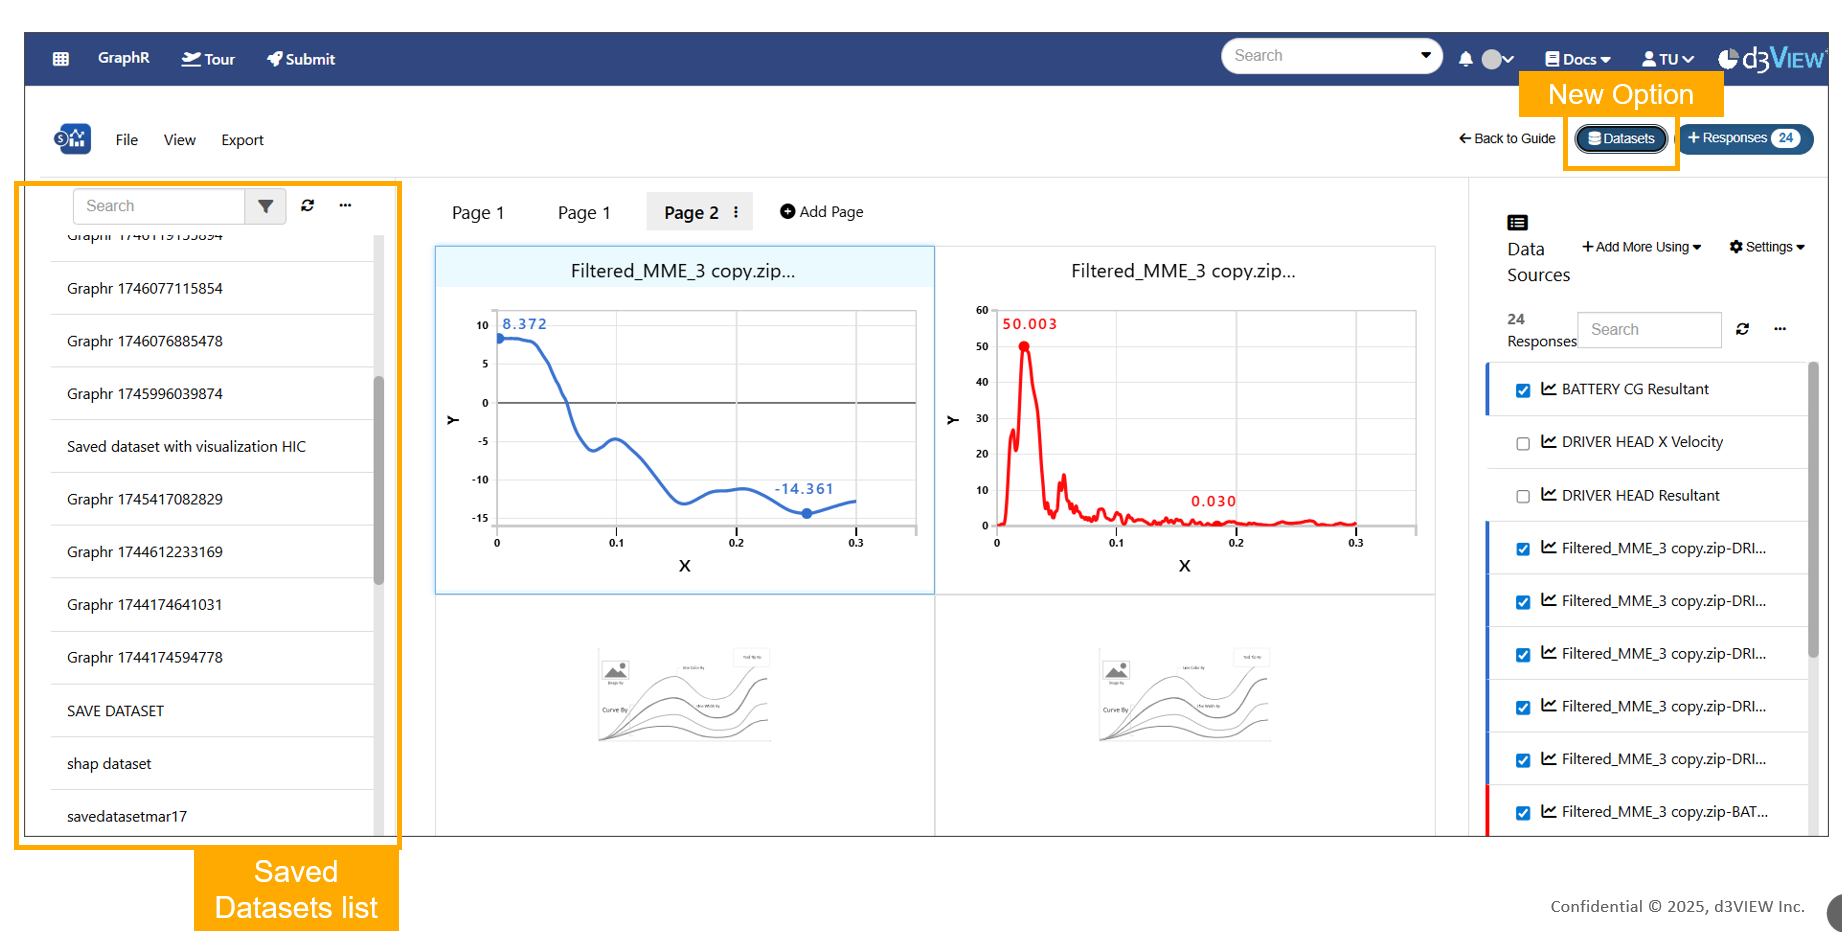
Datasets in GraphR