9. Physical Tests
“Physical Tests” supports storing, organizing and visualization of experimental data. Keep your “real-world” testing data all in one place, manage all of your experimental results and compare them with other records including your simulations.
What Will Be Covered
- Importing New Tests
- Exploring Contents of Tests
- Comparing Tests with other Records
Accessing
Open the application menu at the top left corner, and click on the Physical Tests icon or name to navigate to the page.
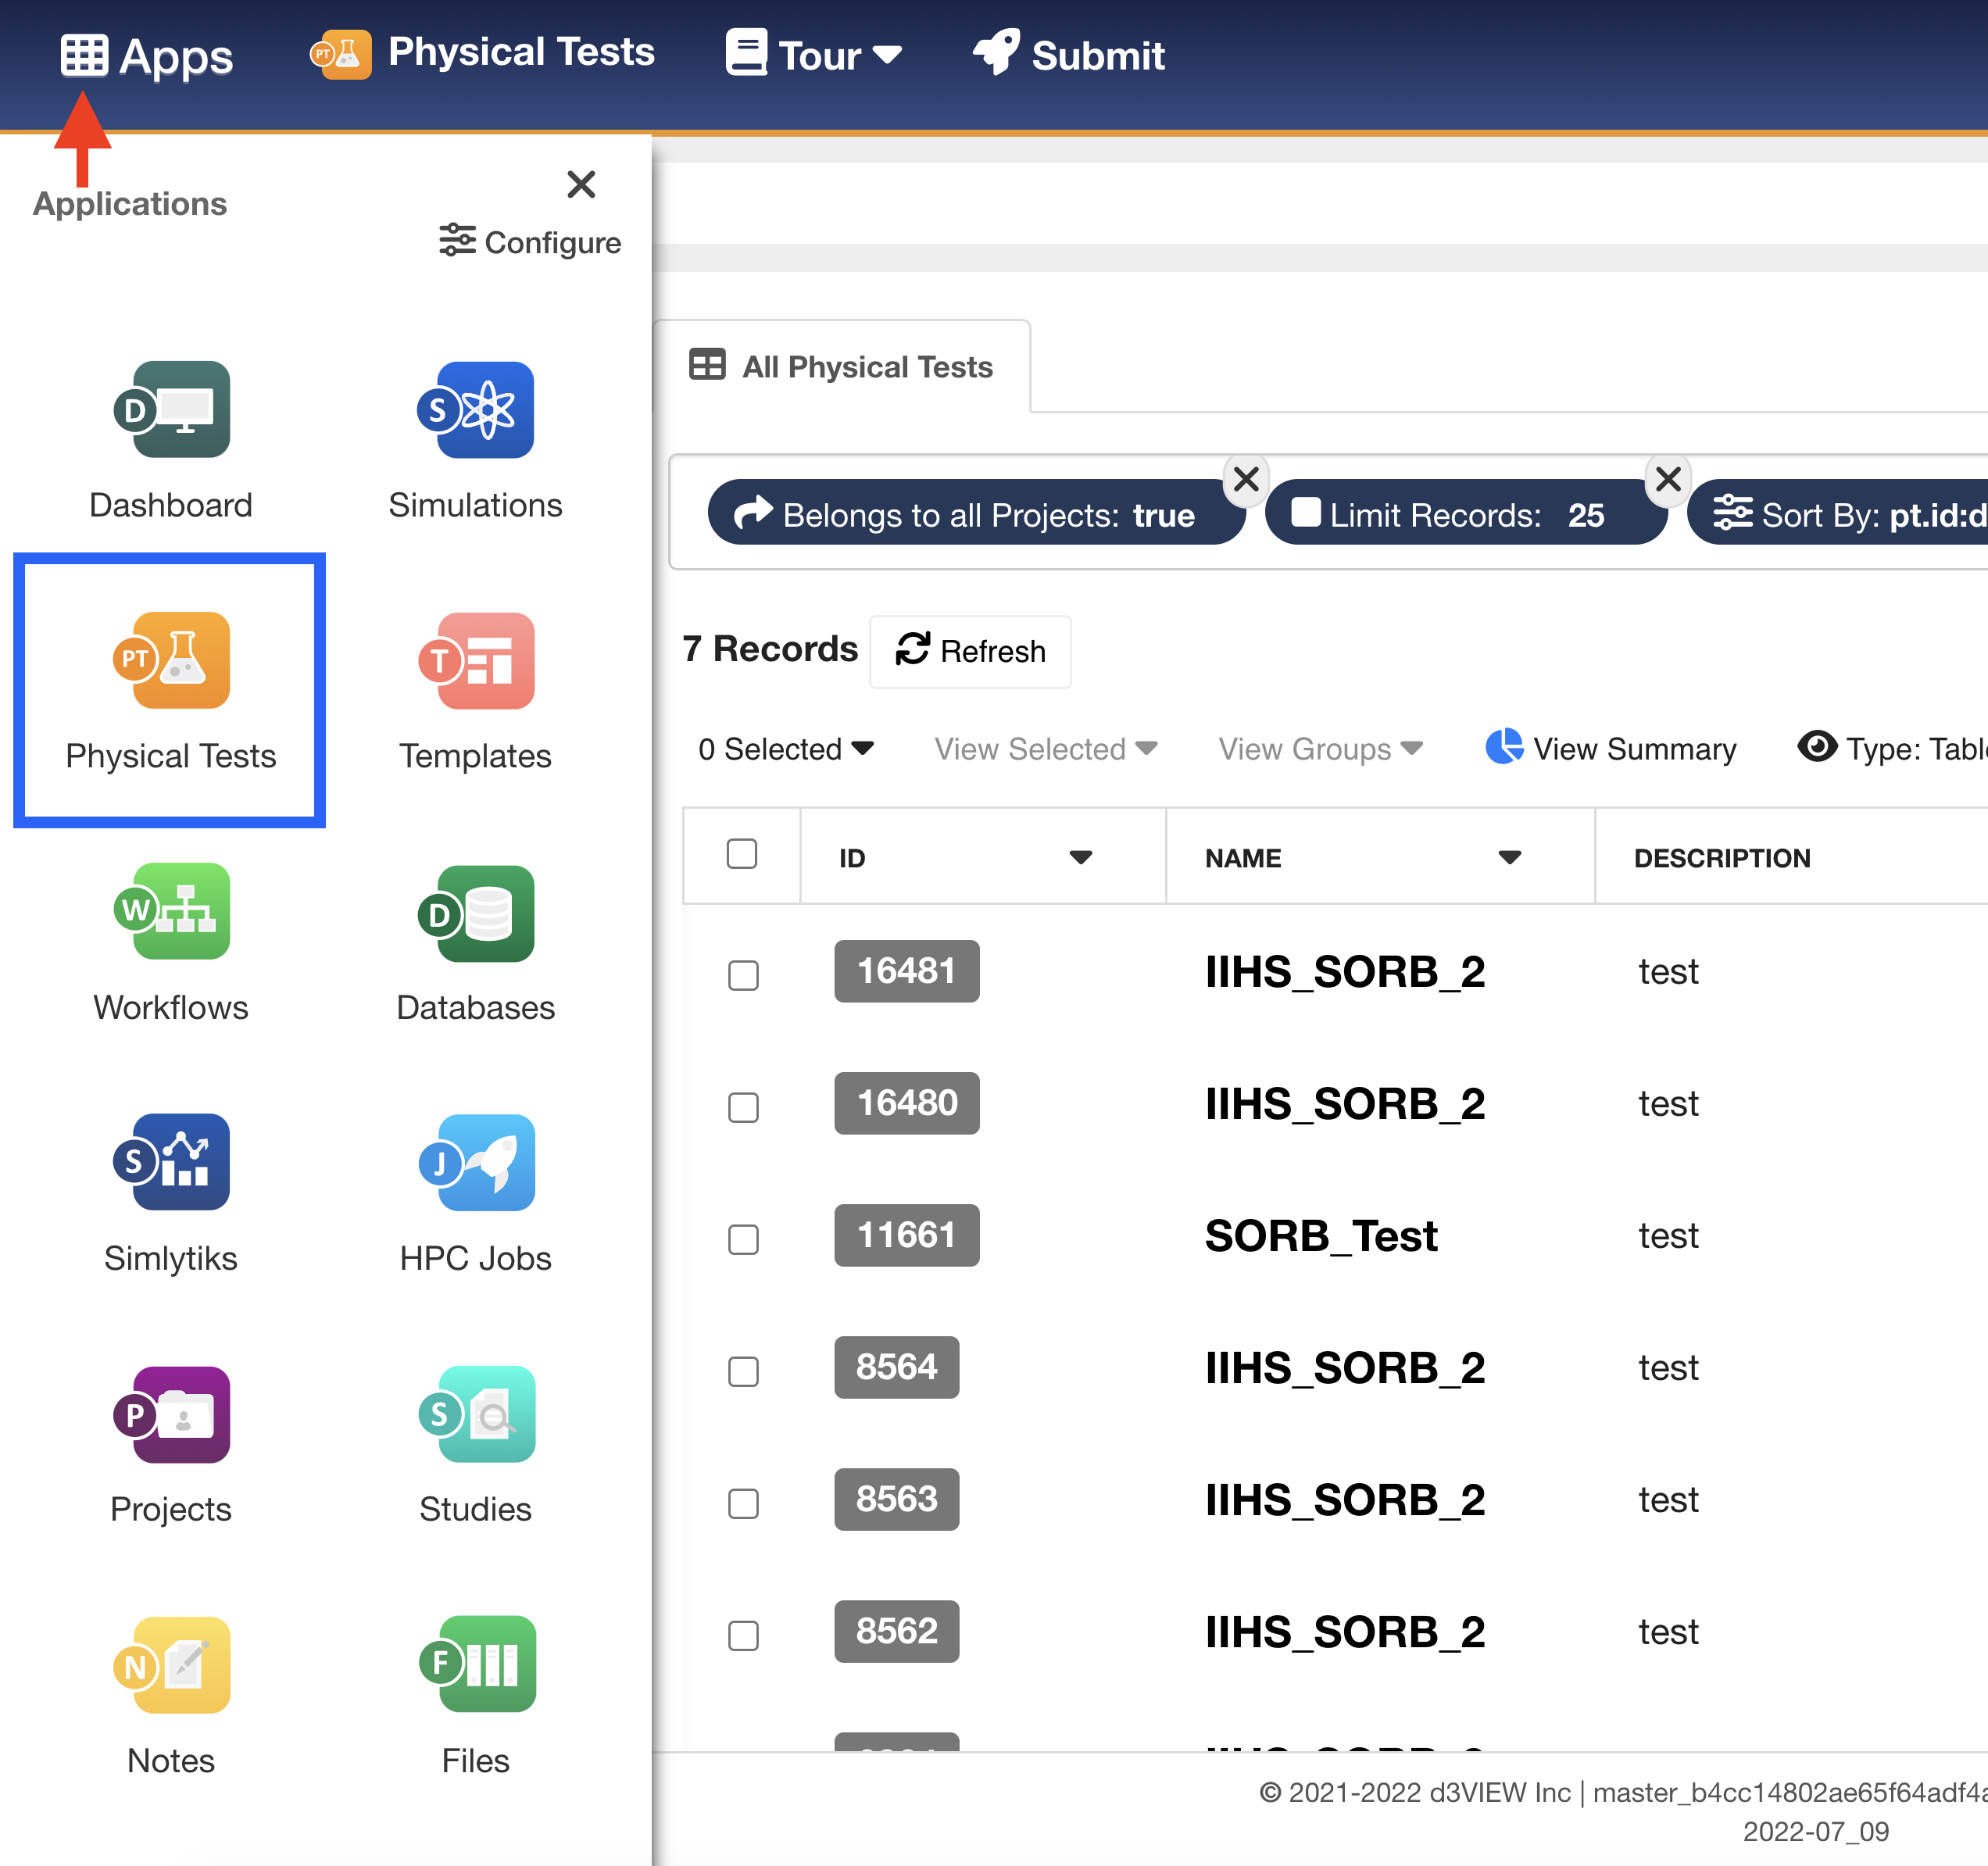
Access Physical Tests Page
9.1. Importing New Tests
Importing new tests is fairly simple. In order to get the most out of your physical tests with the platform, make sure to stick to these recommended file sources.
Importable files for Physical Tests include:
- Excel
- CSV
- BMS
- SSV
- DAT
Importing One
Click on “New Test” in the upper right-hand corner of your screen on the Physical Tests main page.
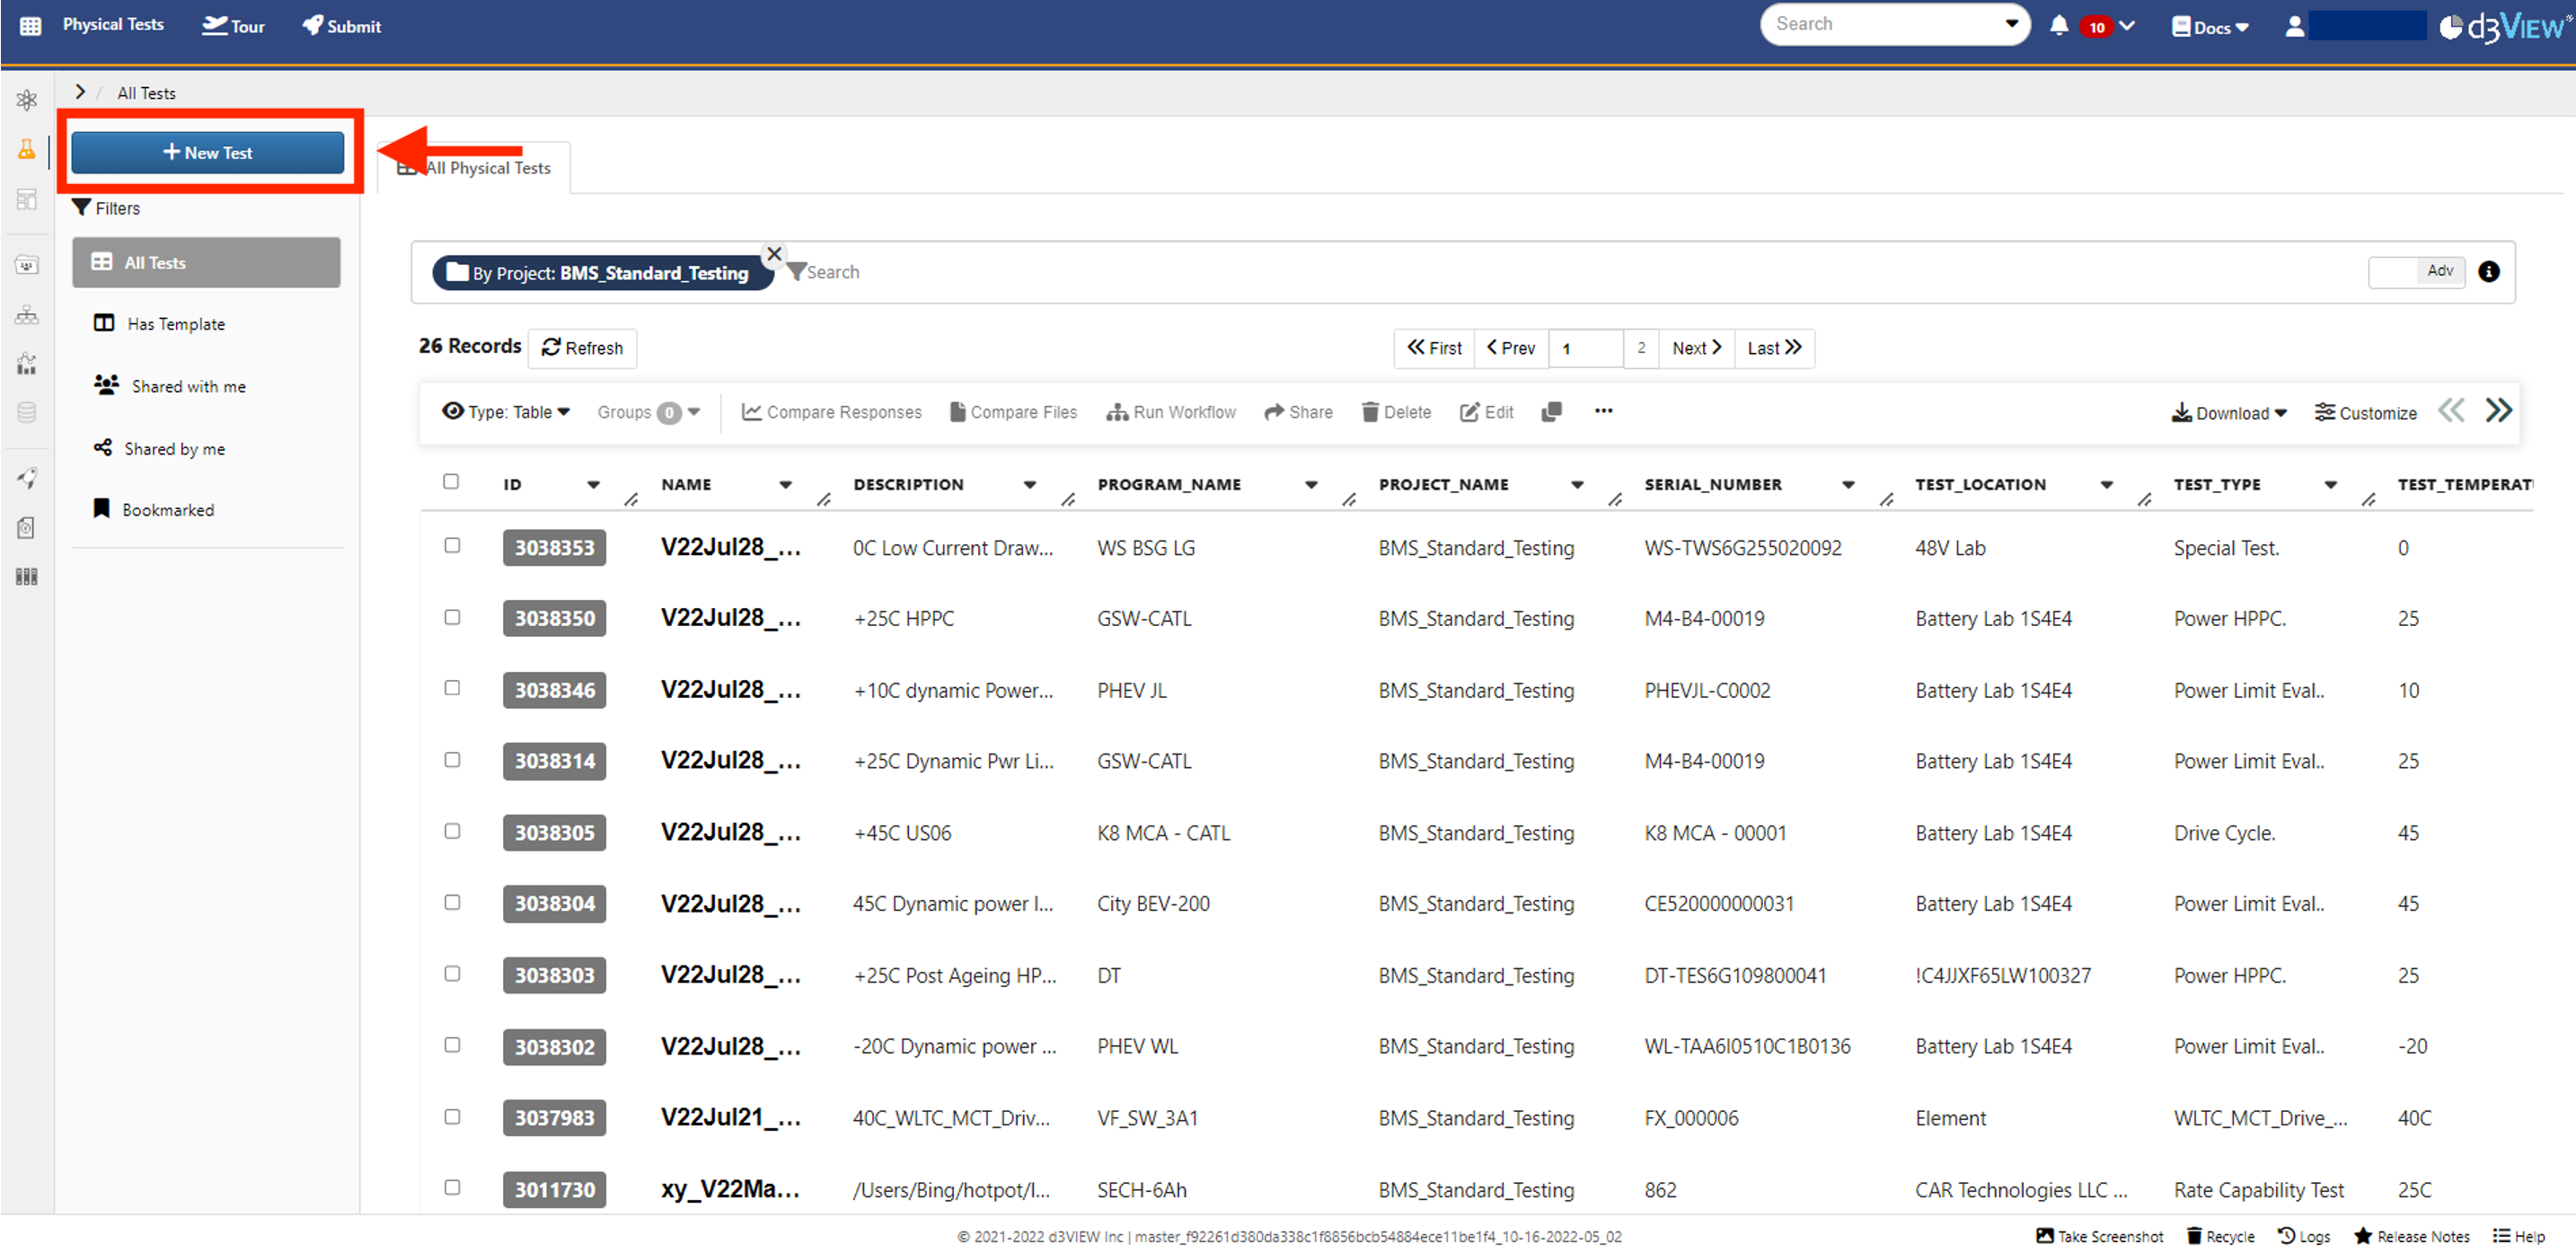
Figure 1: Opening New Test Window
Upload a file or multiple files from your computer by drag-and-dropping or clicking on the orange dotted line box (1). You can also browse the server files (2) by clicking on the associated link. Multiple files will upload as one test on this tab.
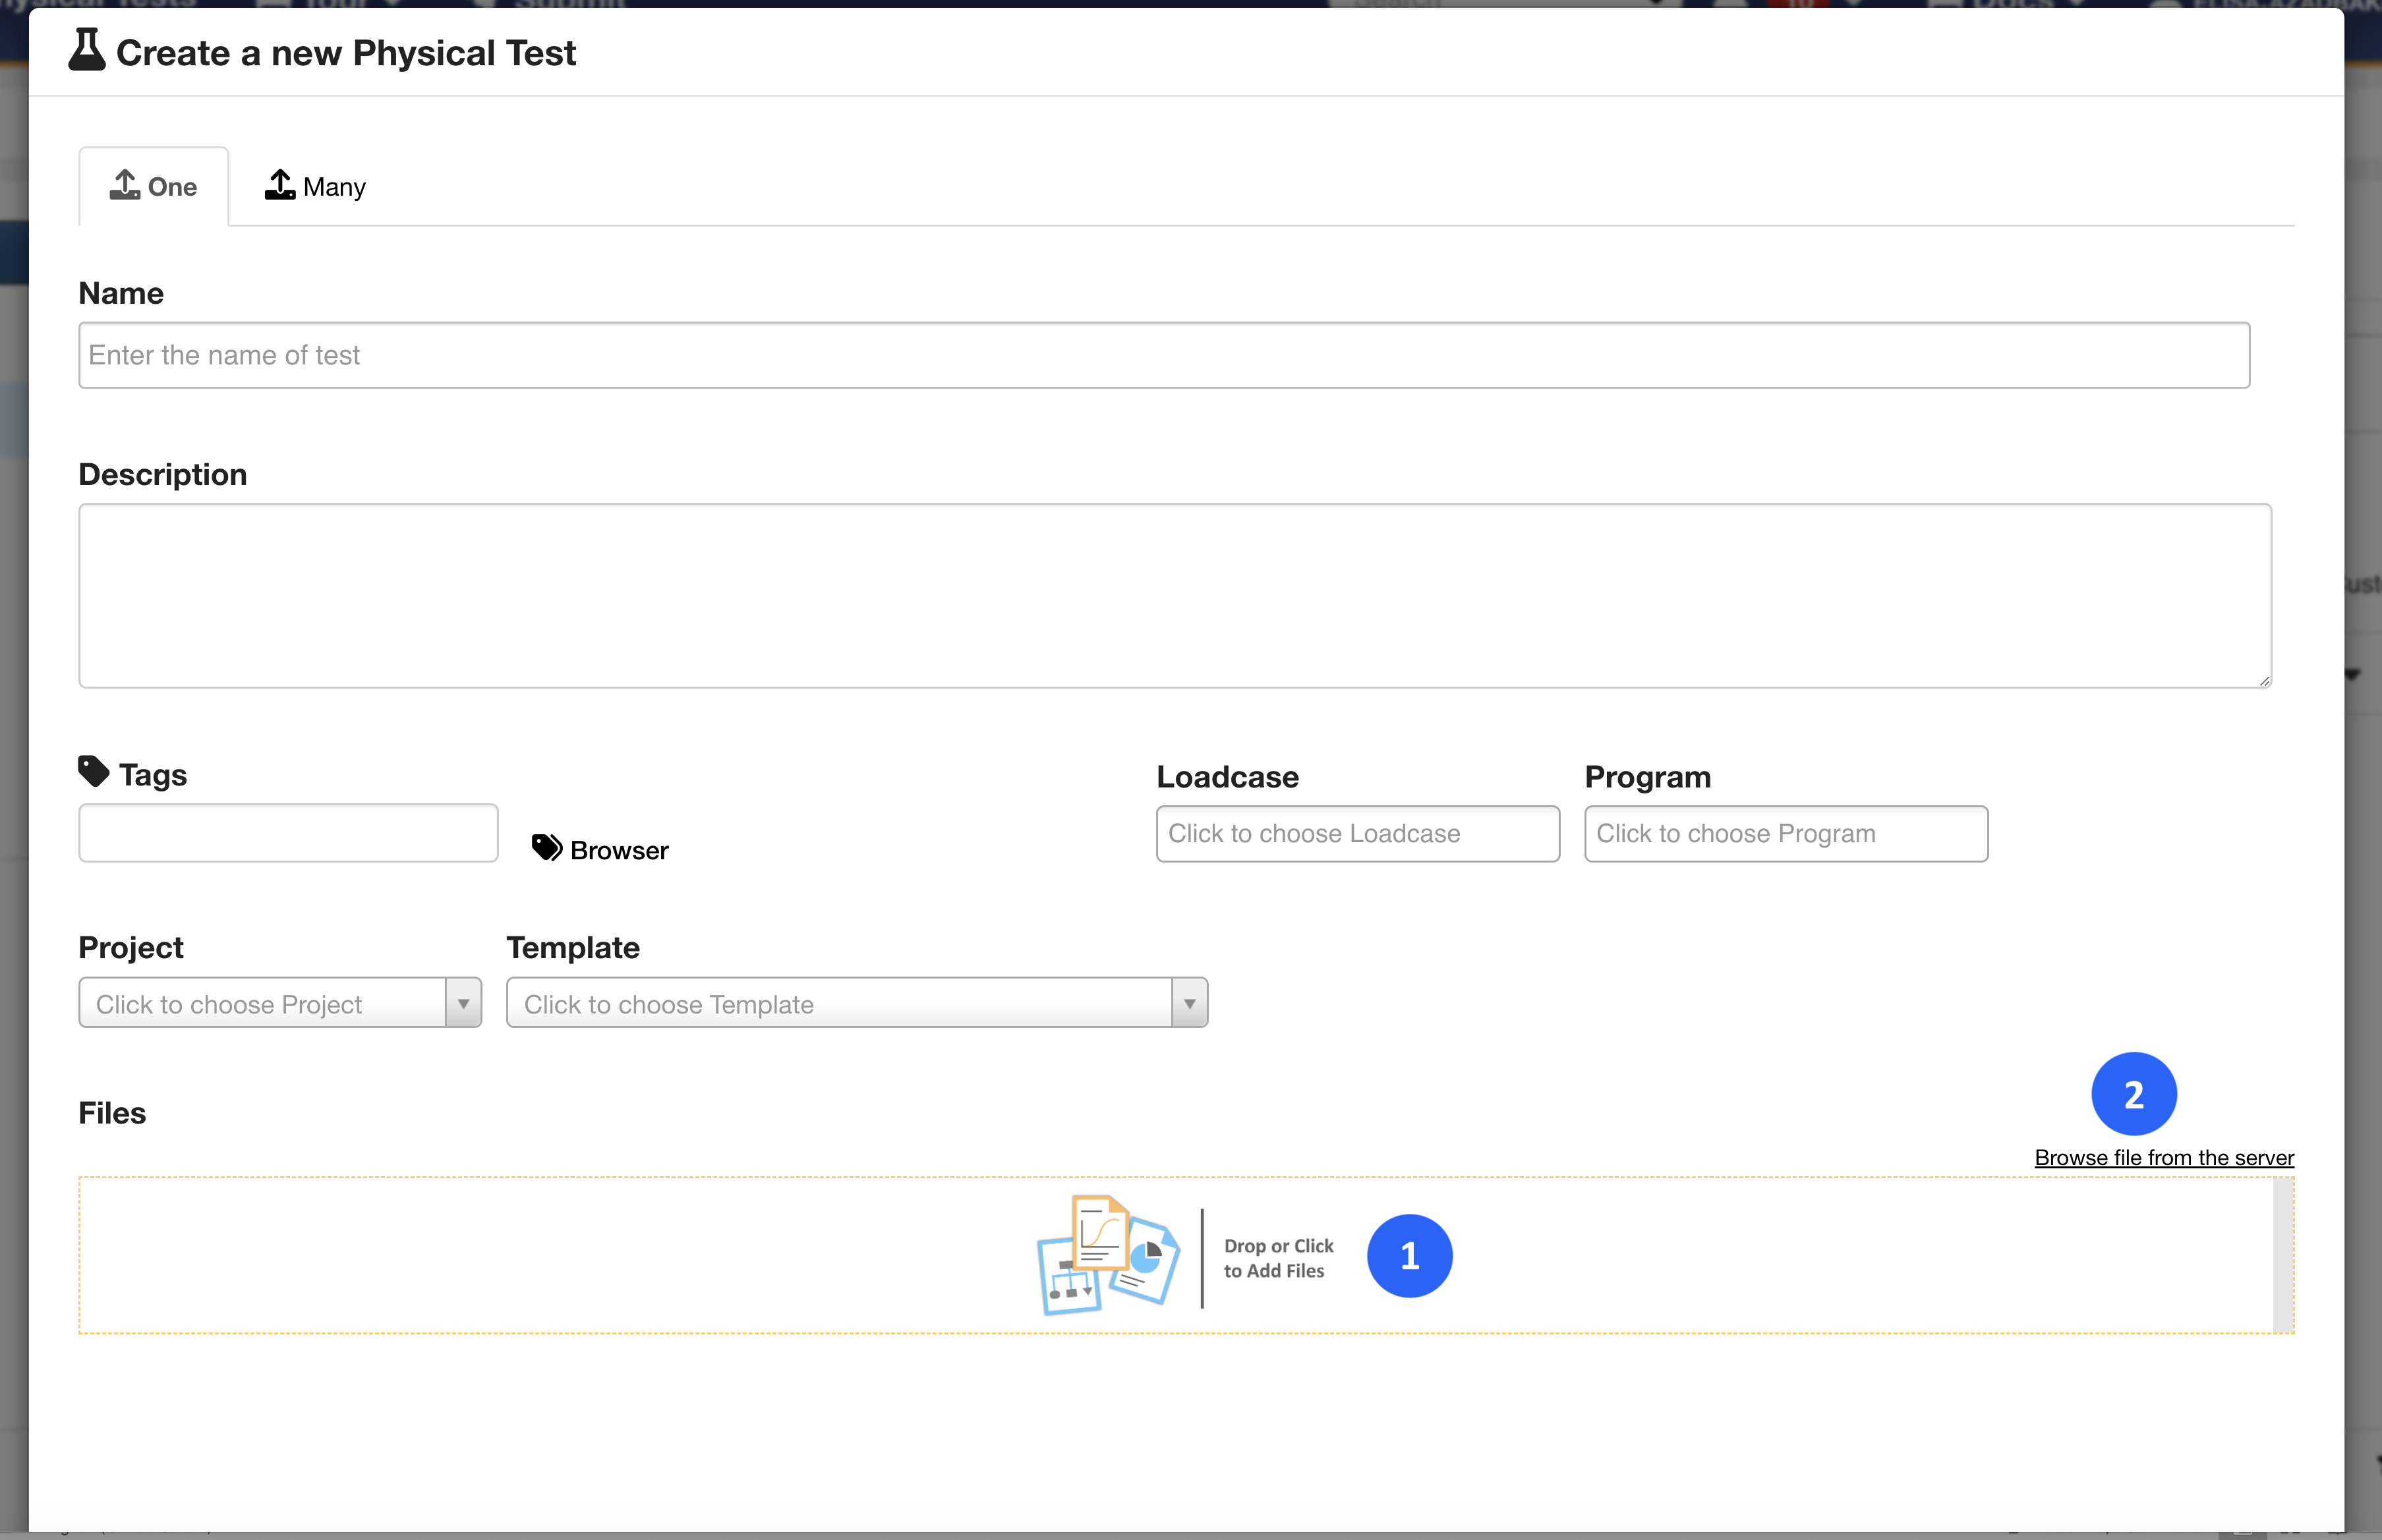
Figure 2: Upload Files from Computer or Server
Clicking on “Browse Server Files” will open up the following window. Please see the Simulations section to learn more about sifting through these files.
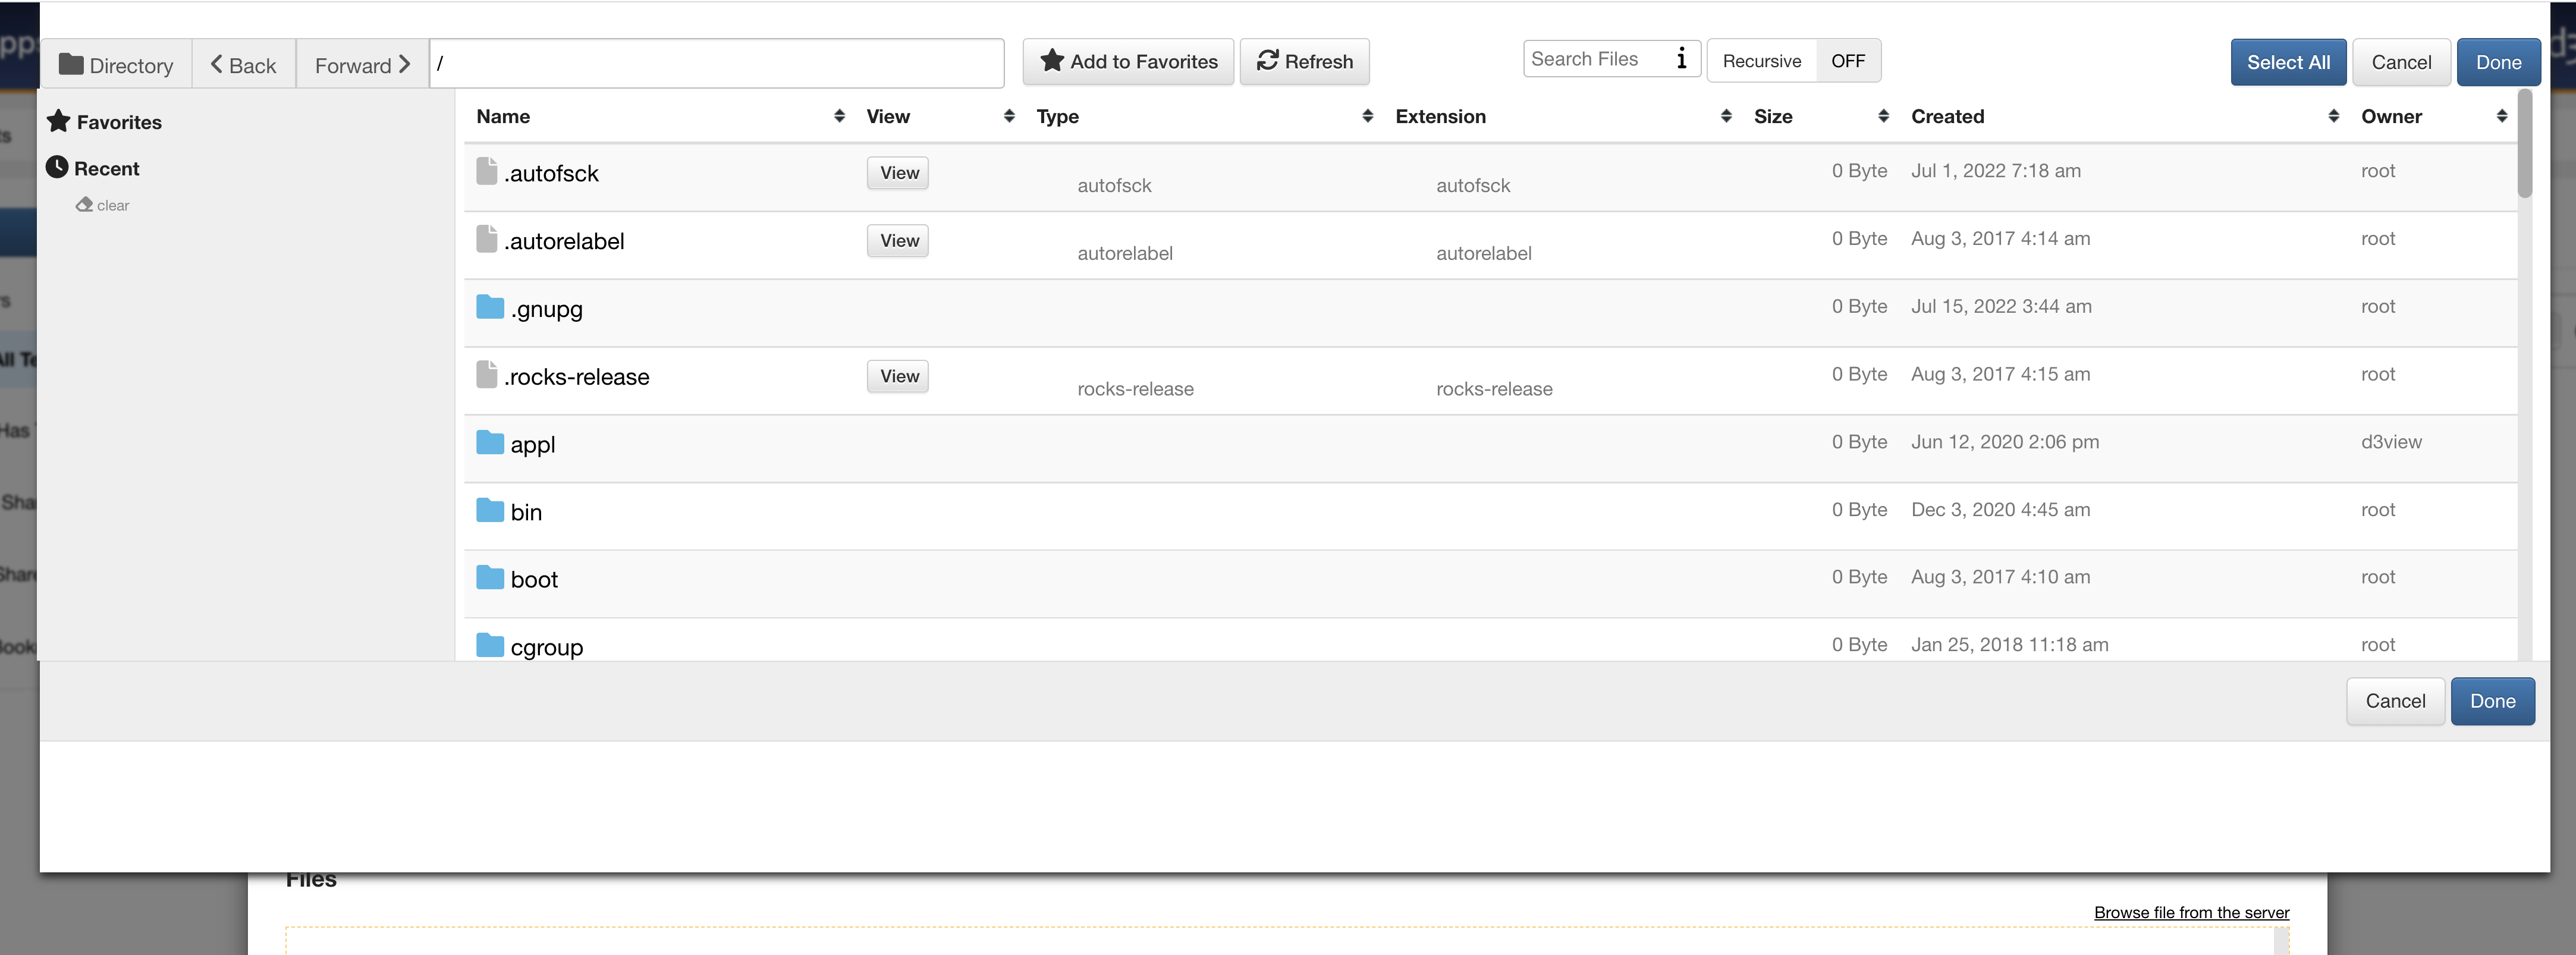
Figure 3: Browse Server Files
Make sure to give your test a name and, if needed, specify the program, loadcase, project or template. d3VIEW provides programs, loadcases and some templates you can select for your test. Once you have set these specifications, click on “Process” to finish the upload.
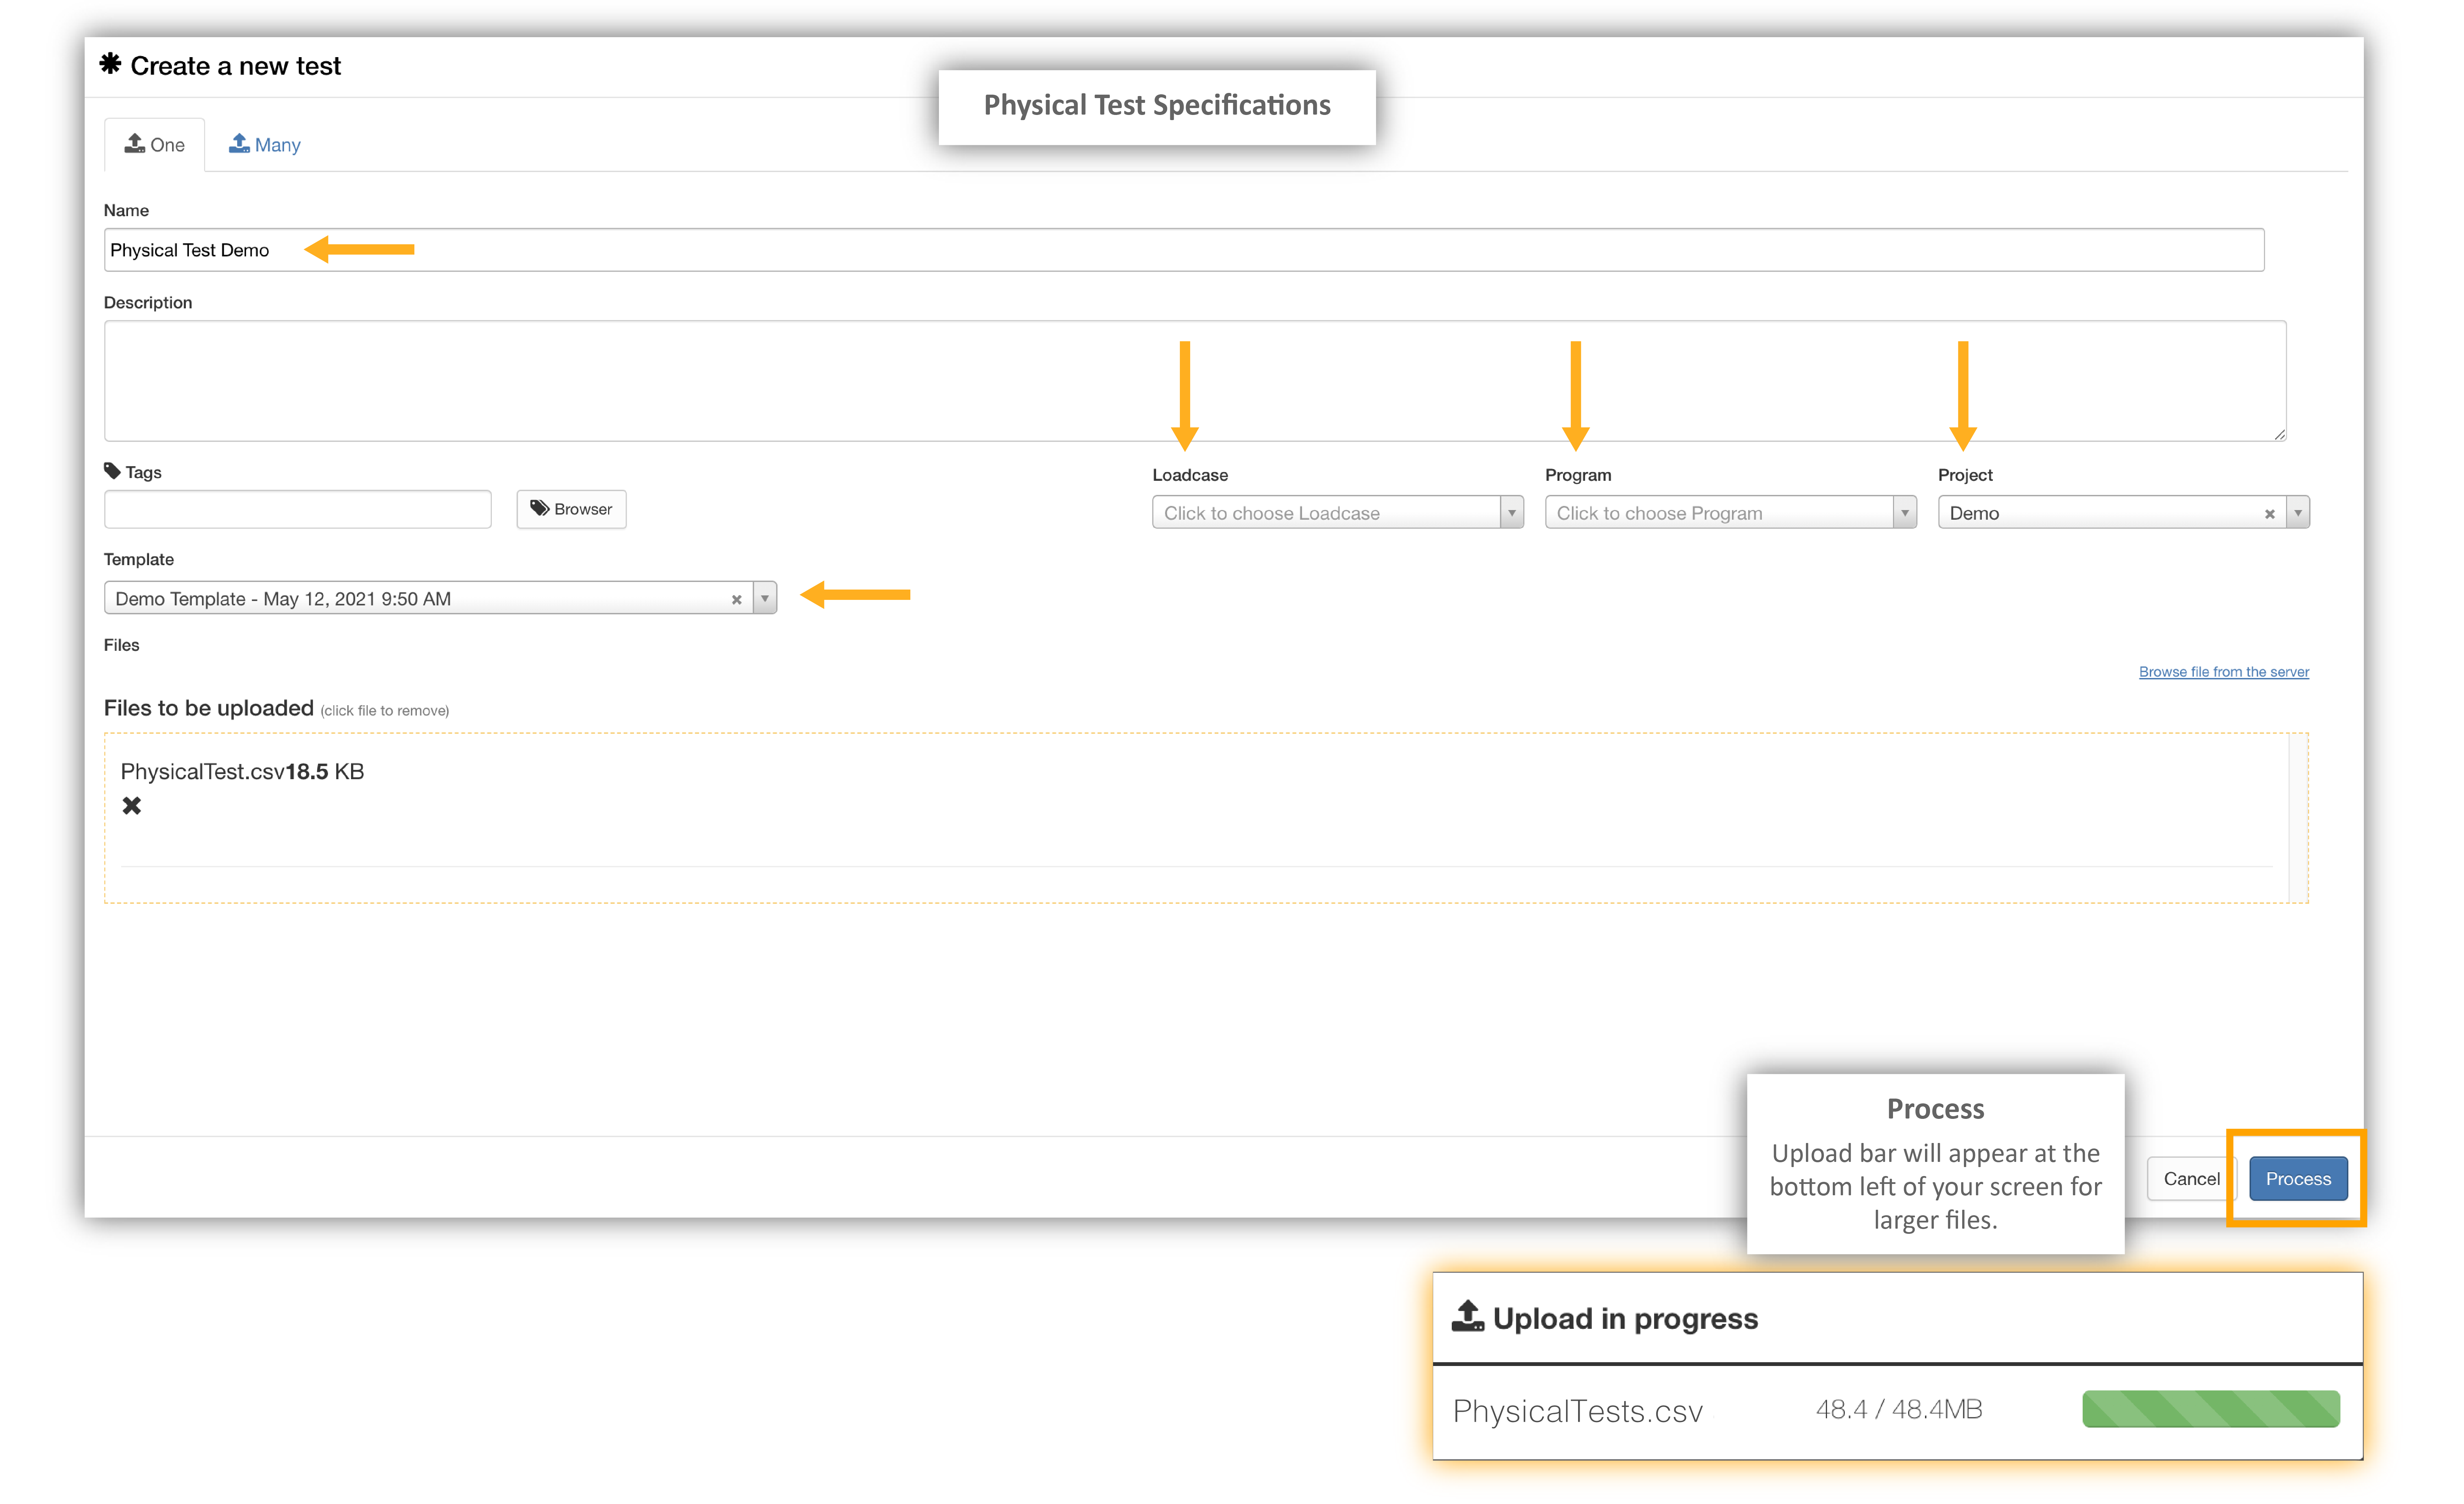
Figure 4: Process Test Import
Importing Many
If you have multiple tests with in the same file or with the same specifications, you can use the “Many” to upload them more efficiently. Upload your files same as before by drag-and-dropping, clicking or exploring server files. Since you are uploading multiple tests, you will not be able to specify any names.
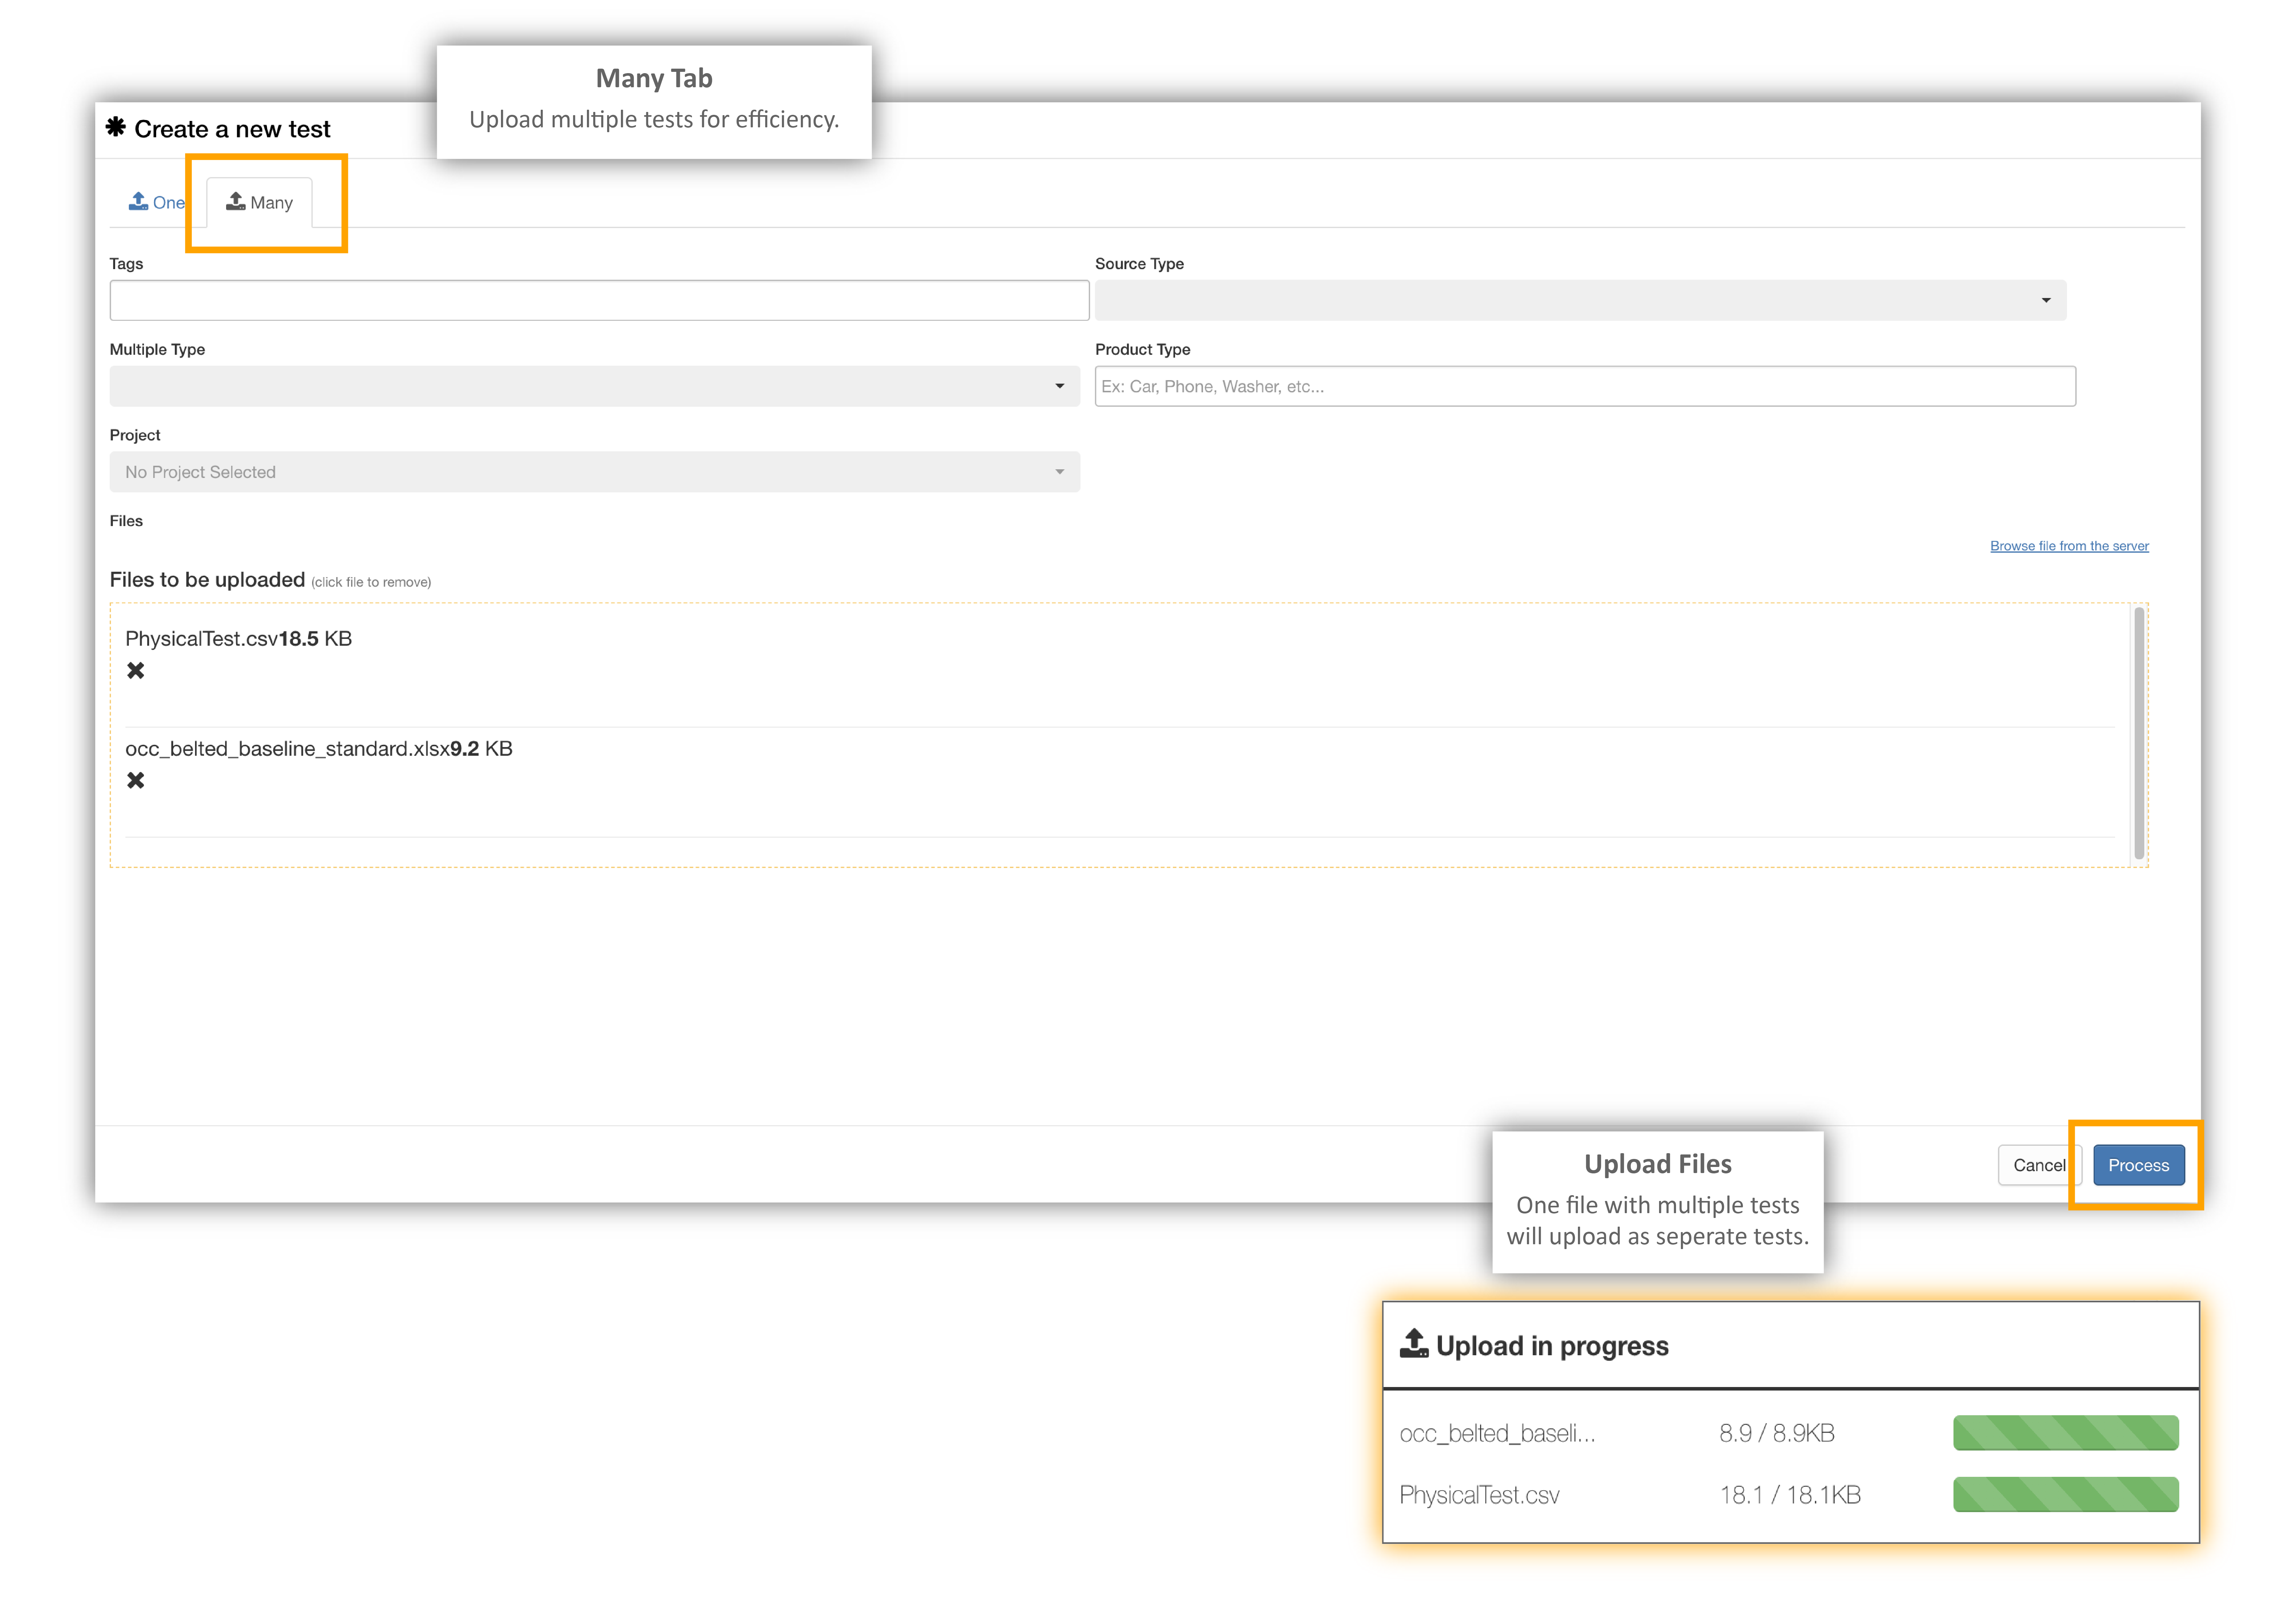
Figure 5: Upload Many Tab
Importing Media Files
If we have media files to include with our physical tests, we’ll want to upload them under the Files tab in our newly created Physical test. To learn how to do this, skip to the “Adding / Viewing Files” section.
Data Storage
Physical Test data storage is based on the unique configuration set-up for your d3VIEW account. Check out this section on data storage to understand how data is generally stored in d3VIEW.
9.2. All Tests Overview
On the Physical Test main page, we have options to sort, review, customize and export all our tests. Let’s review.
Filtering
Use the left side panel generic quick filters to sift through tests quickly.
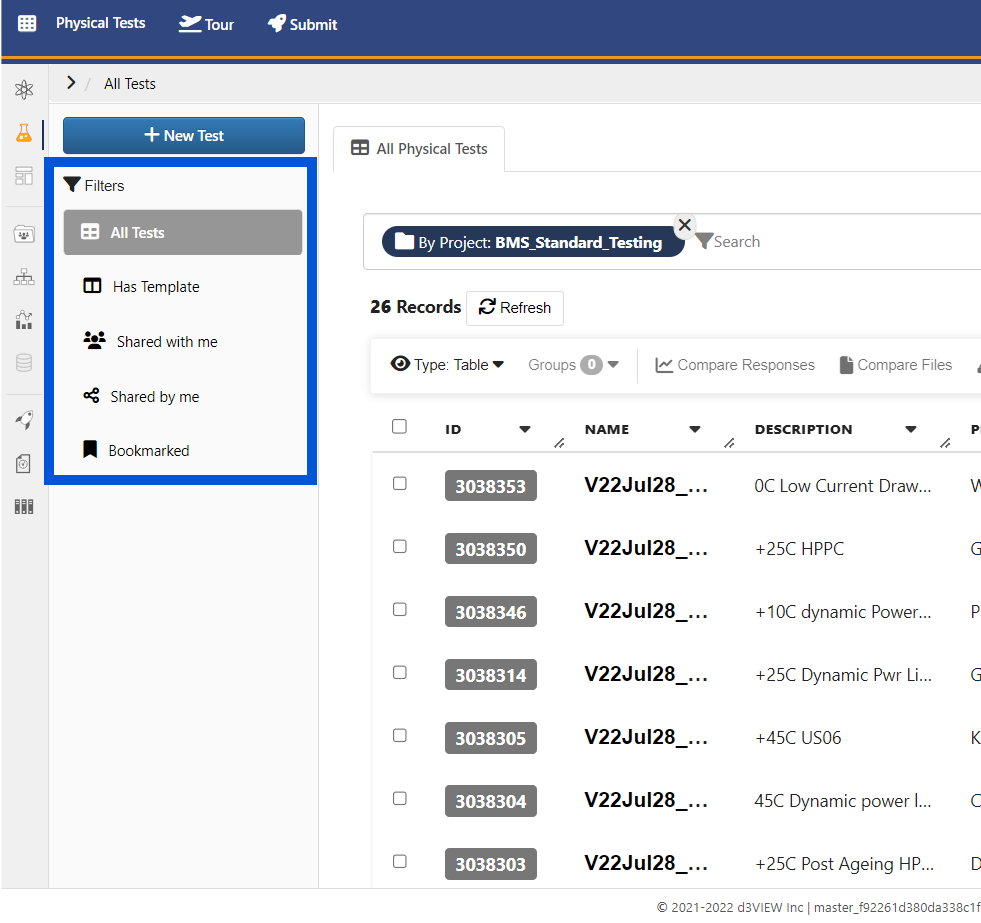
Figure 1: Generic Quick Filters
We can also use advanced filters at the top of our test table to search and find specific tests.
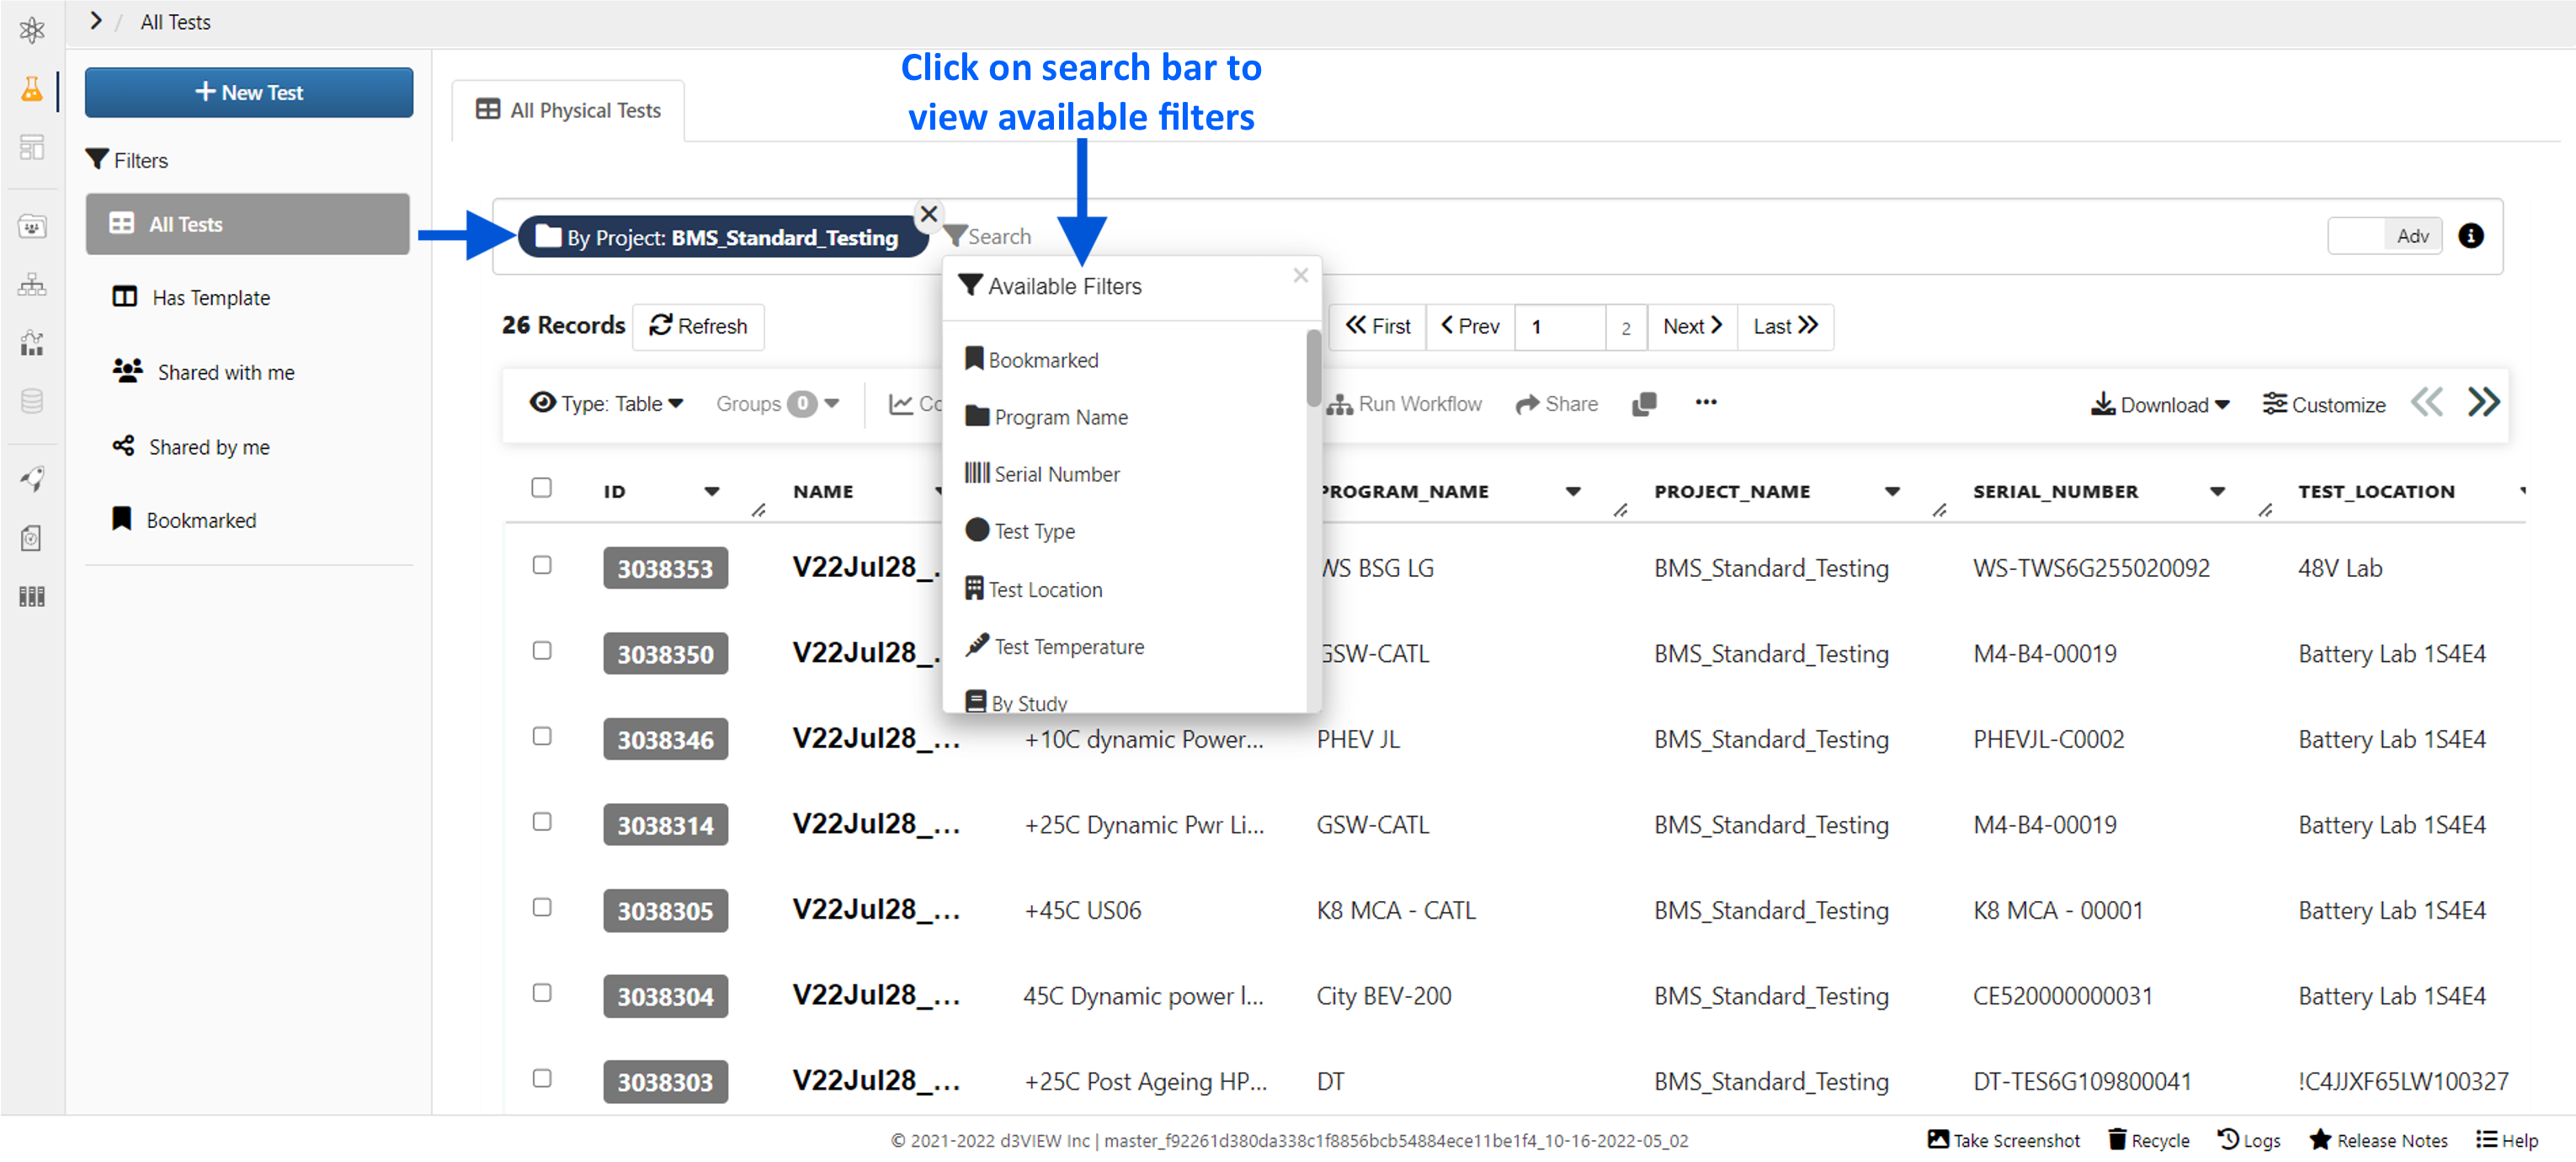
Figure 2: Advanced Specific Filters
Filters
Remote lookup filters (such as Belongs to all Projects, By Projects, etc.) available under Customize option can now be saved to the settings. This will help render the records which are otherwise not available in default settings.
Reviewing
View a summary of all tests by clicking this option at the top of the table.
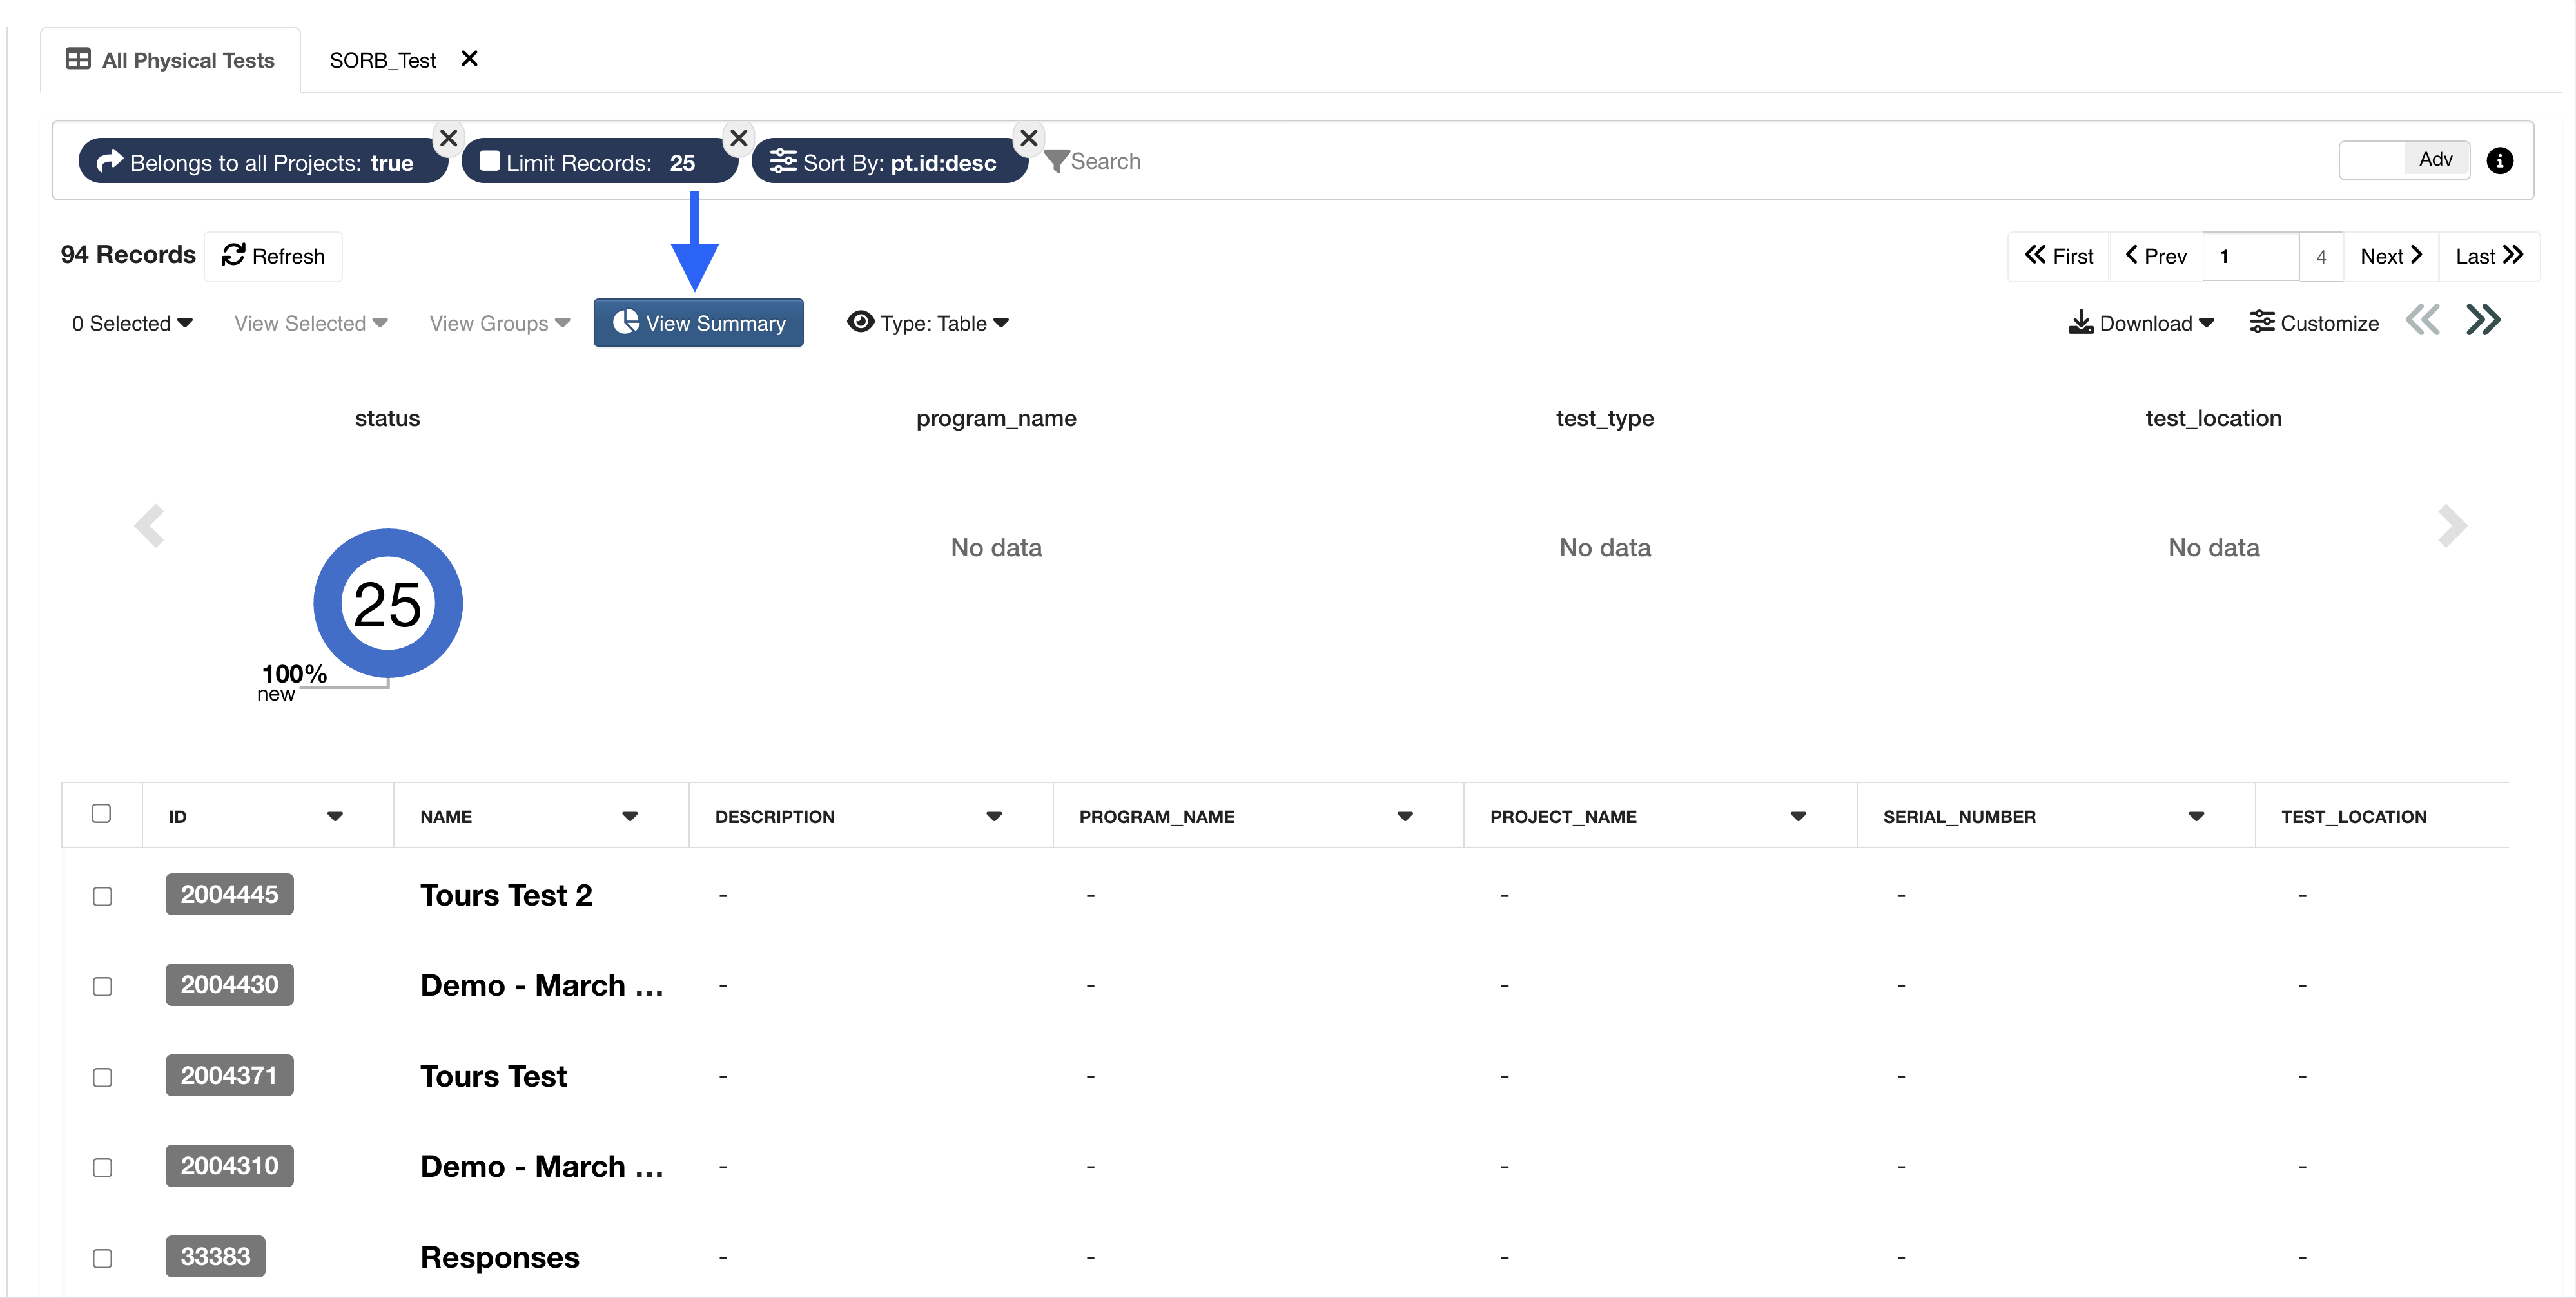
Figure 3: Test Summary
We can also view our table in alternative visualizations under the eye icon type.
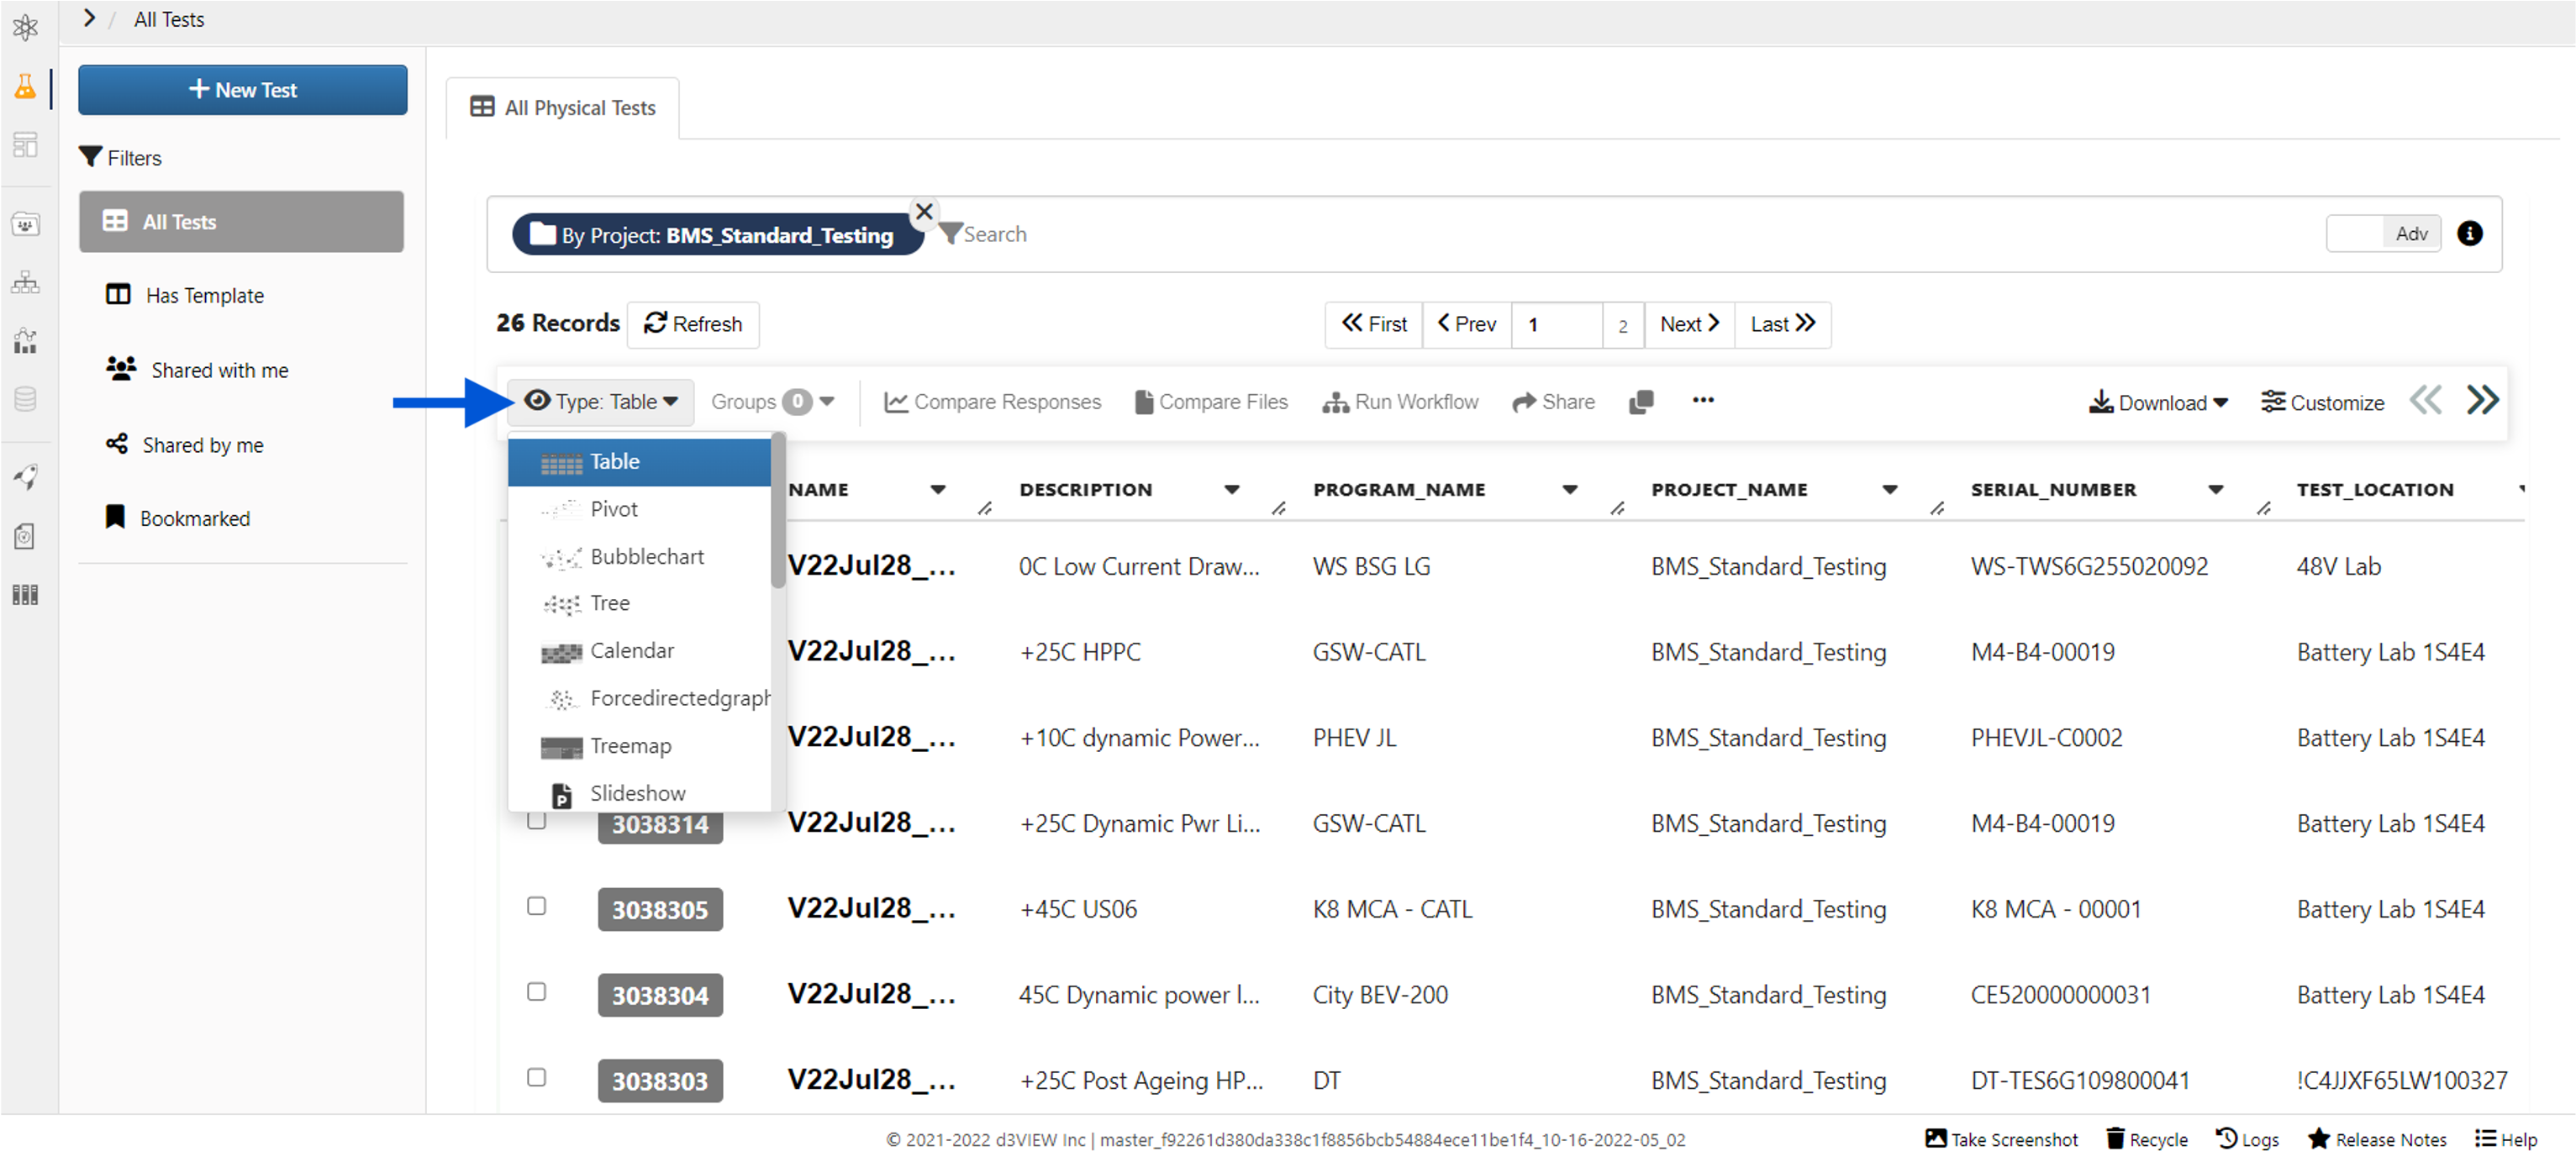
Figure 4: Test Table Views
When choosing a different visualization, we’ll be prompted to set up chart specifications in order to visualize it as we desire.
Customizing
We can customize our table by clicking on this option on the top right corner over the test table.
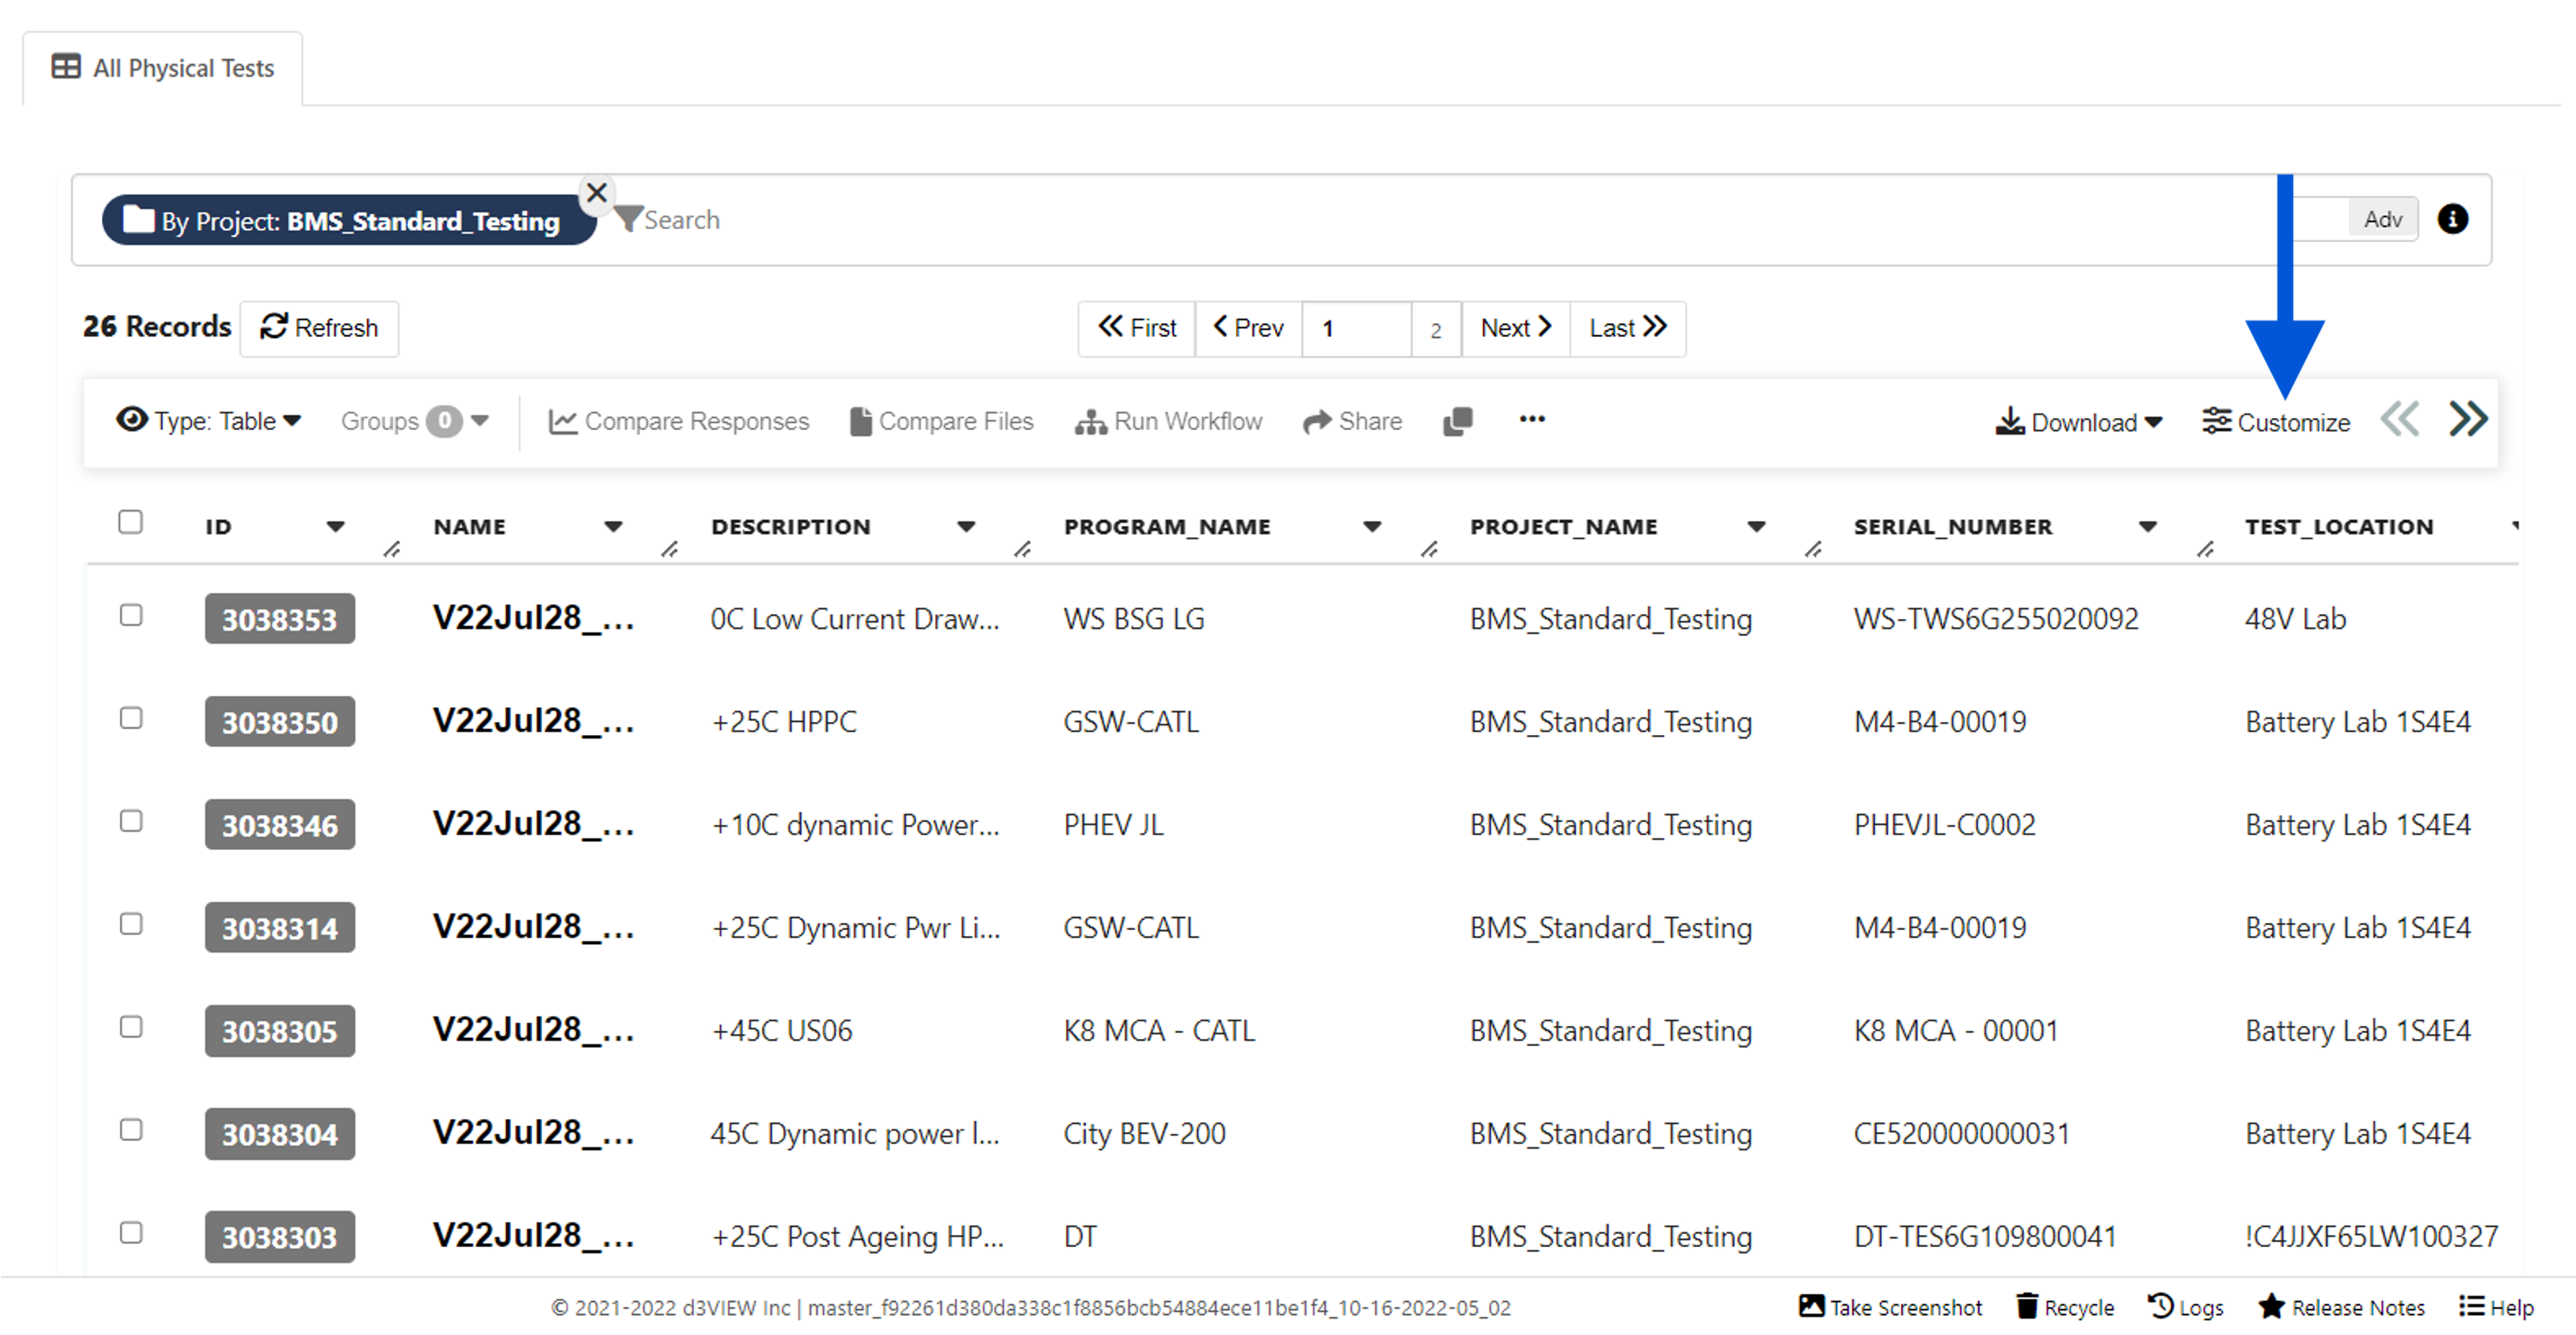
Figure 5: Customize Test Table
Change the look of the table or reorder and exclude columns.
Exporting
Use the Download option on the top right of the test table to export tests in a multitude of ways.
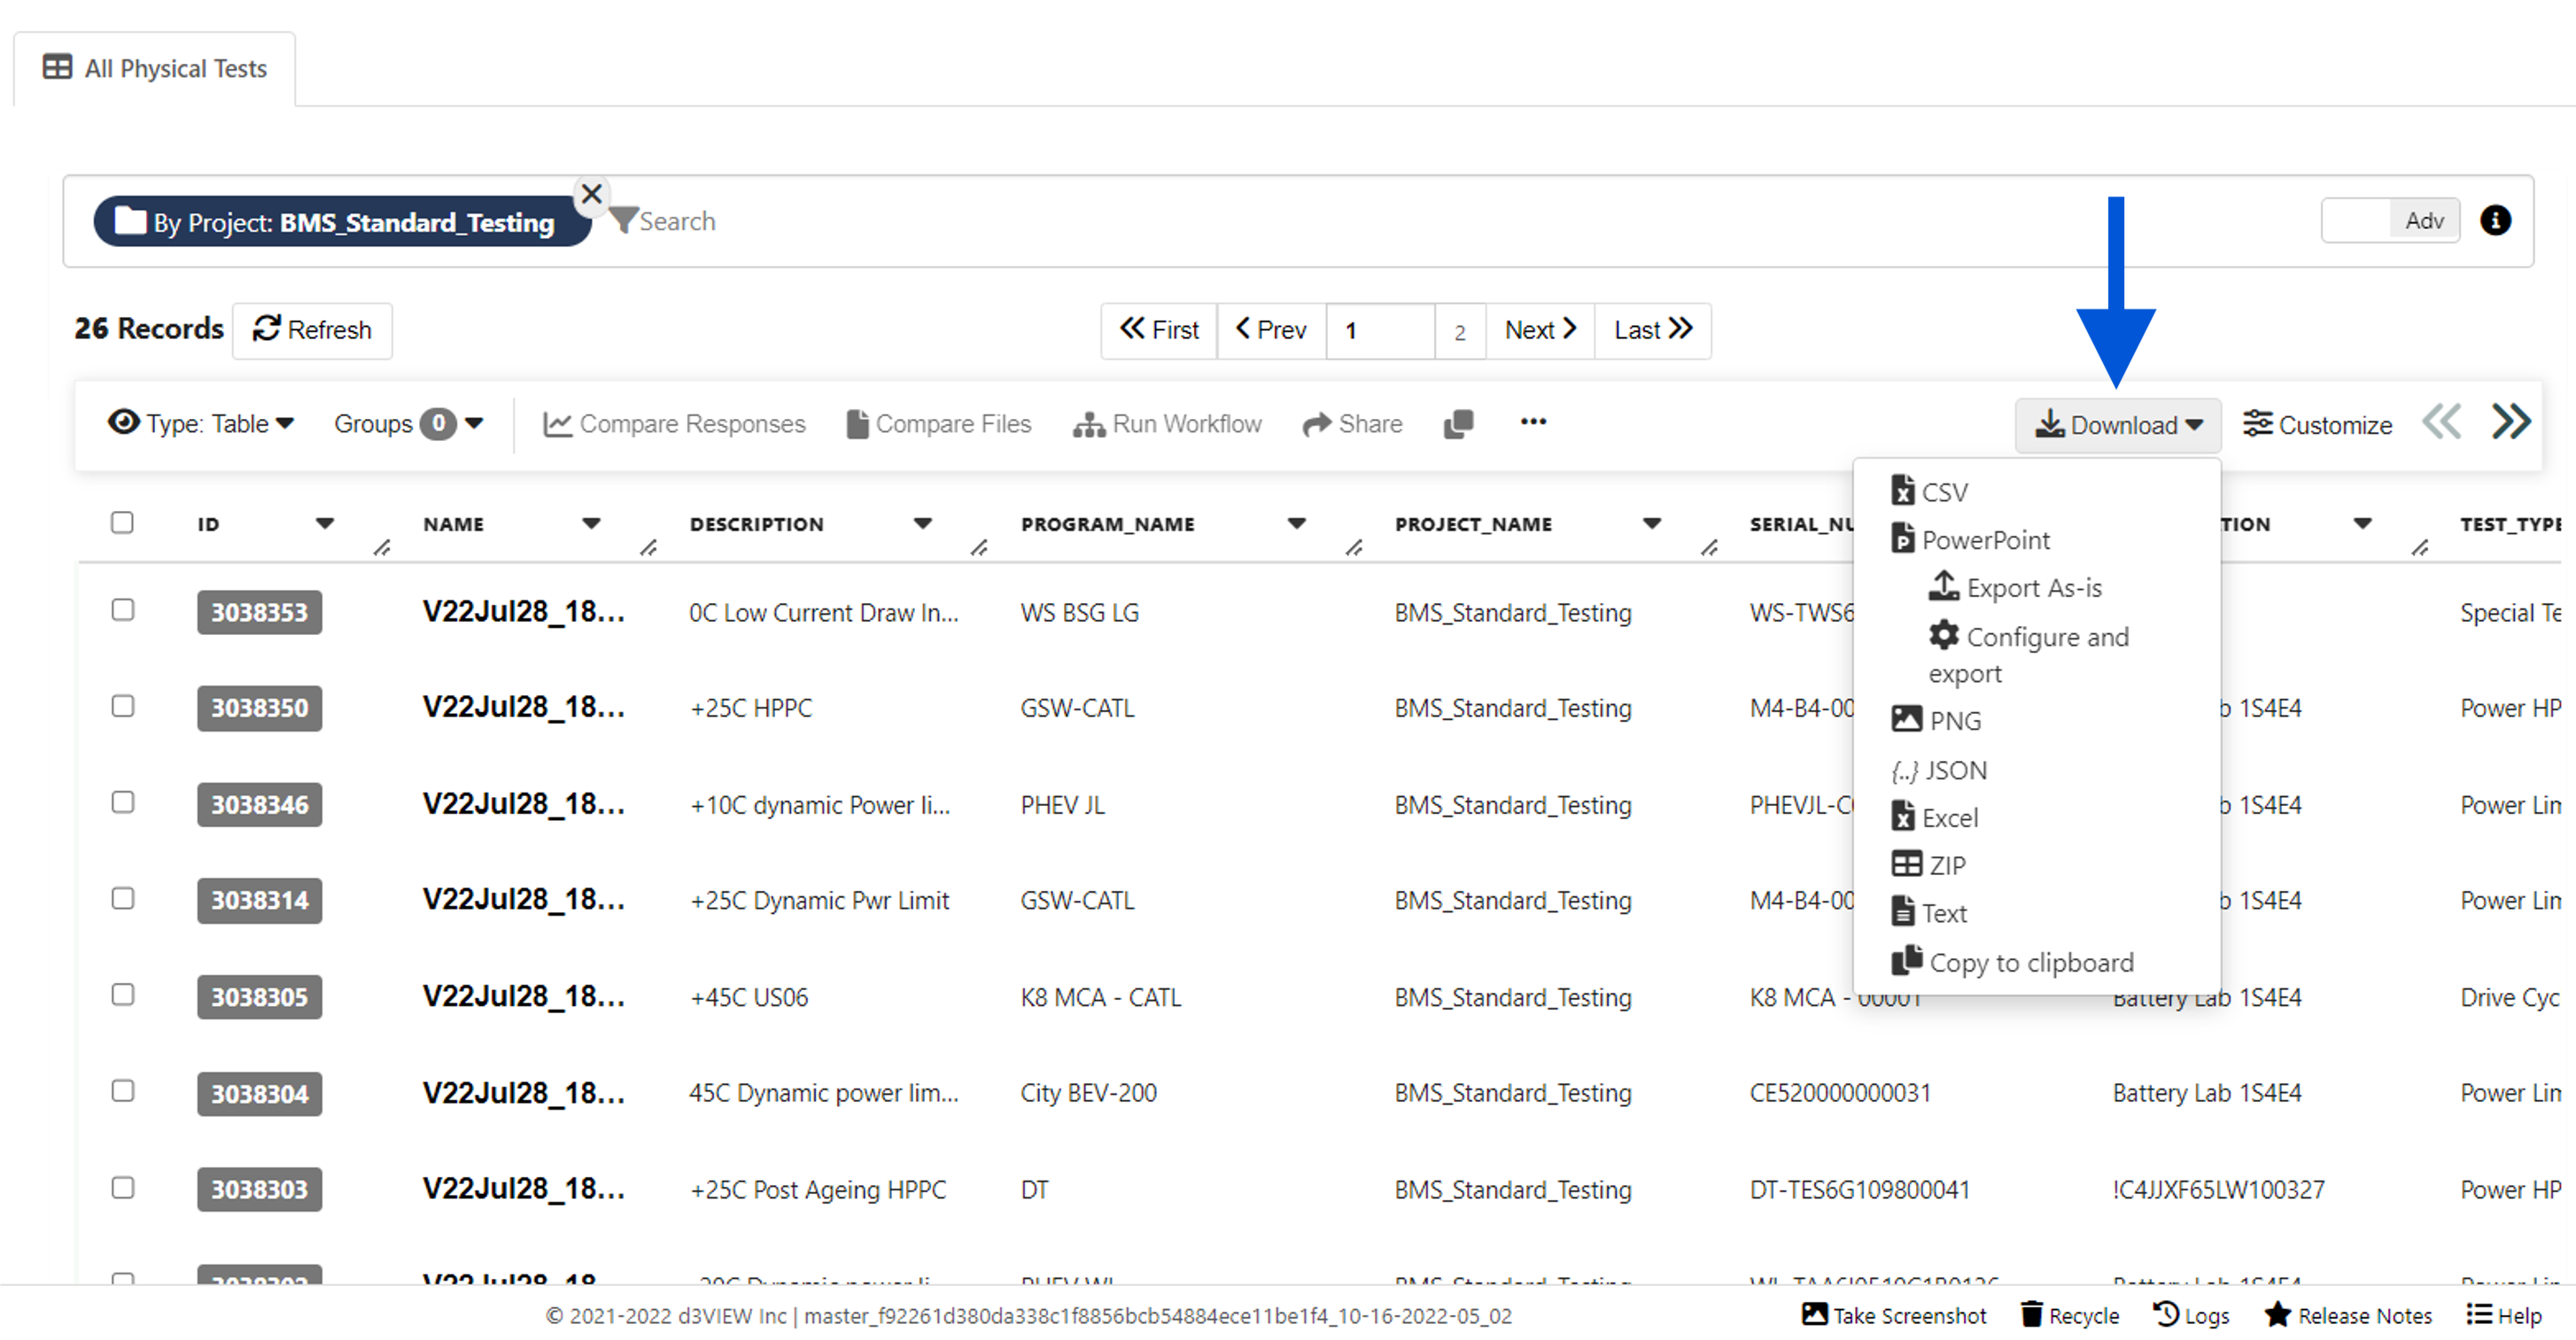
Figure 6: Customize Test Table
9.3. Exploring Test Contents
On the Physical Tests main page, click on the name of a test in the table to view its contents in a new tab.
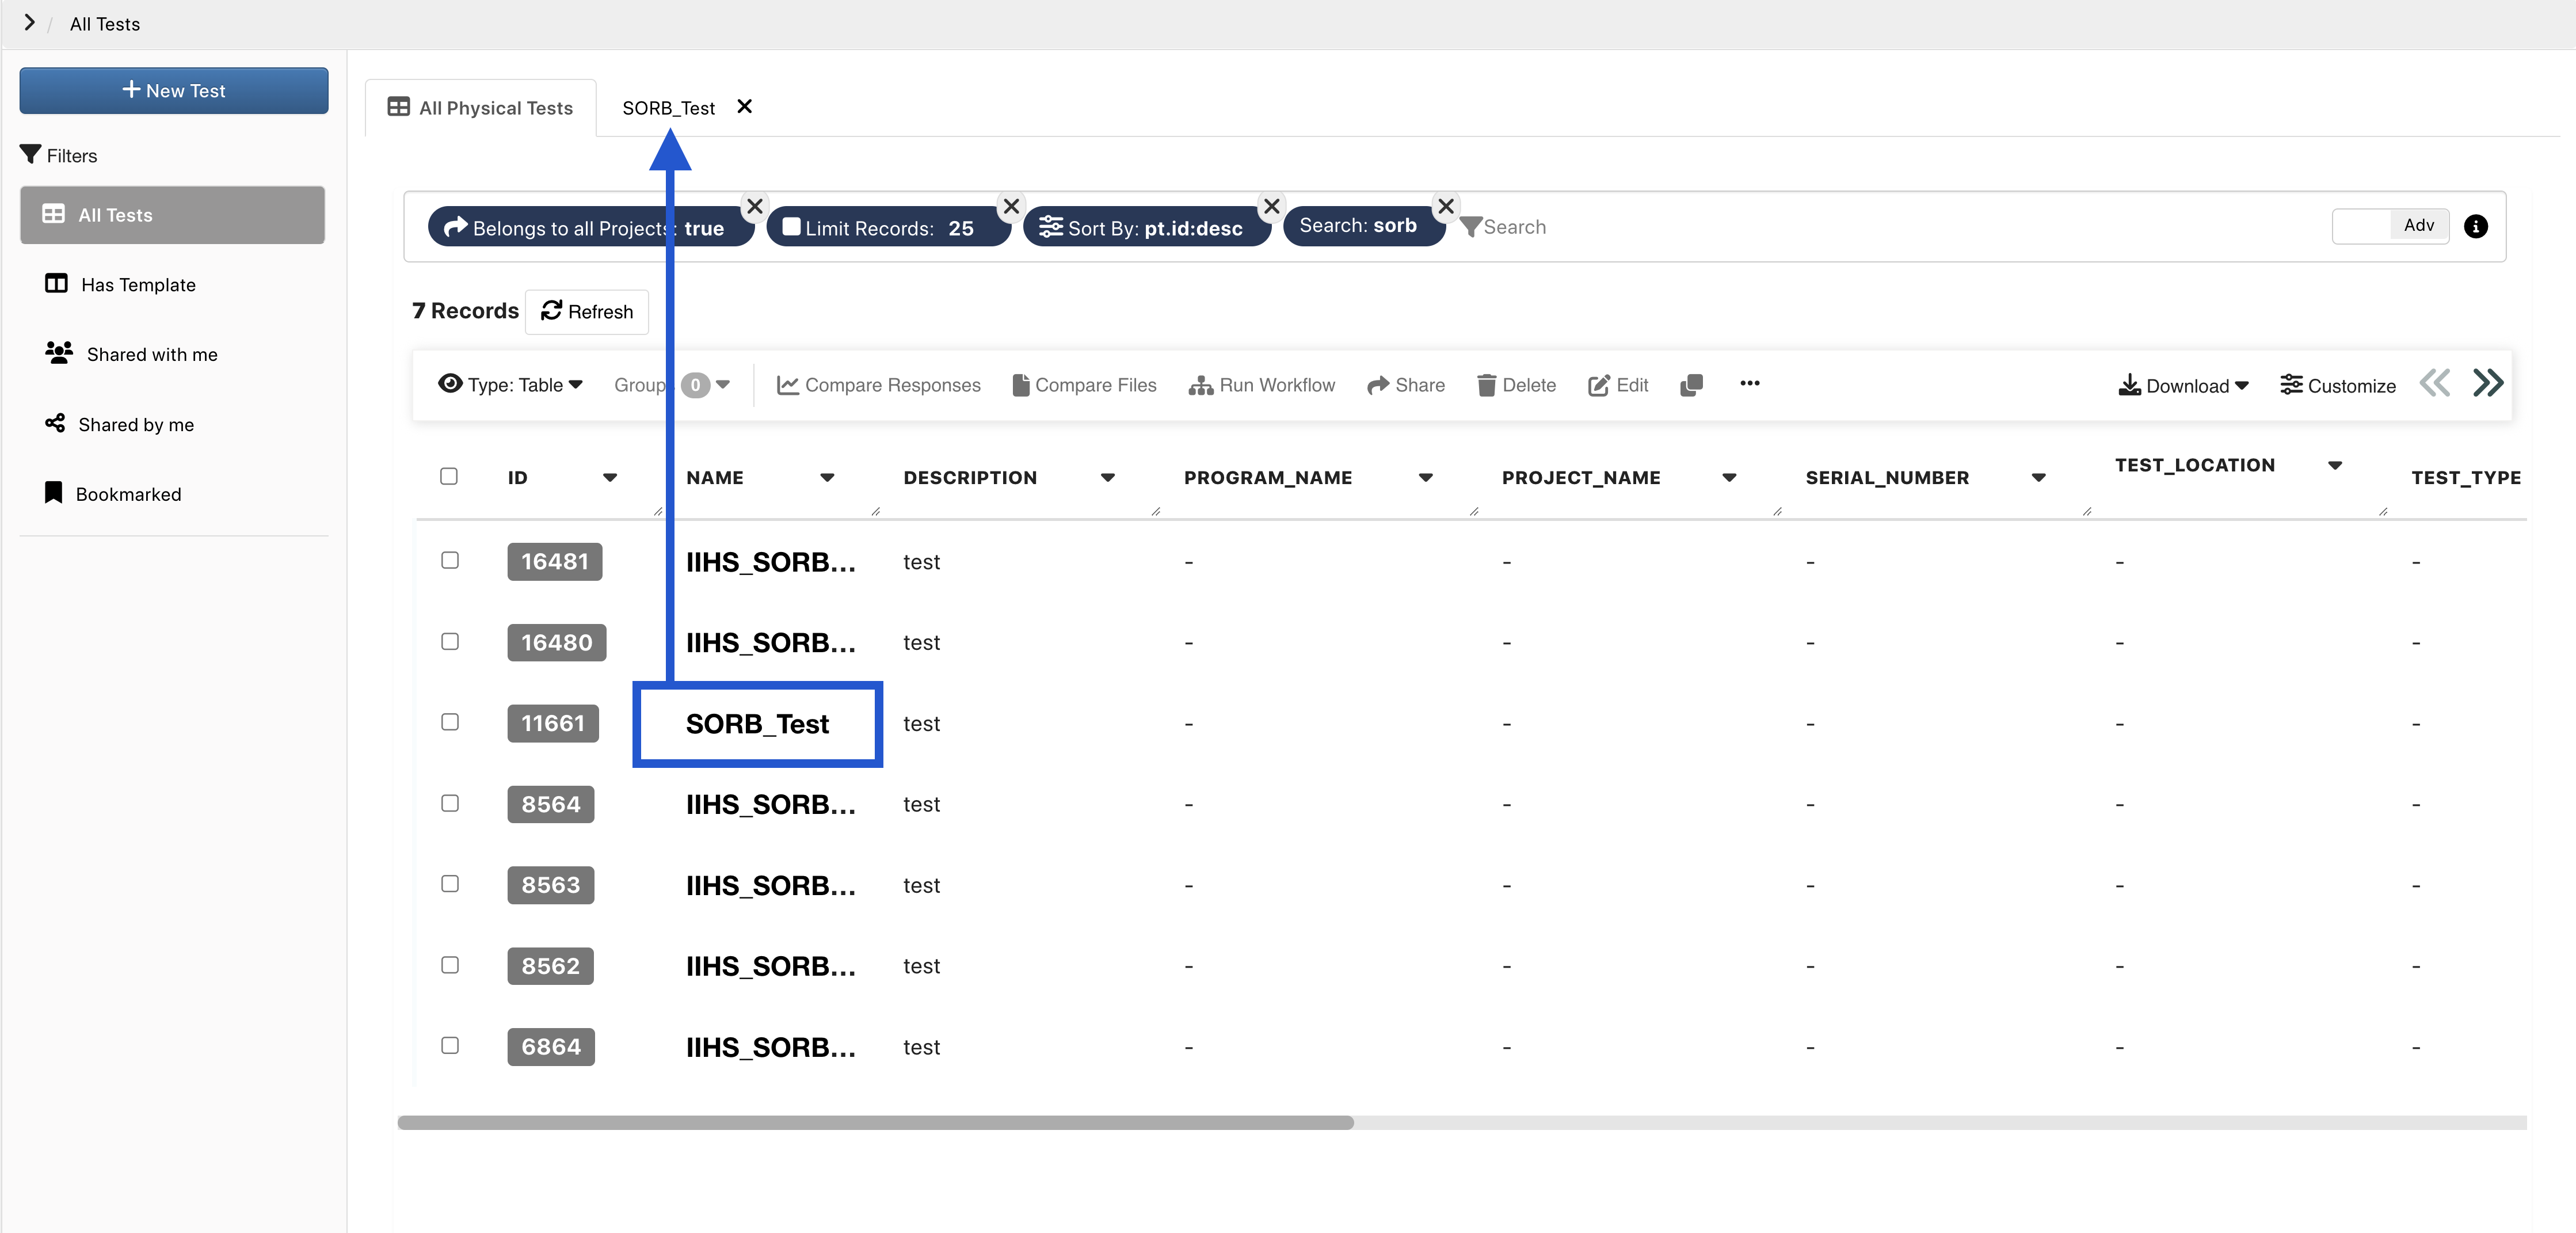
Figure 1: Open Physical Test
The first section (1) presents an overview of the test. You can review responses, files and comments in the other tabs. You can also share, edit and delete this particular Physical Test (2).
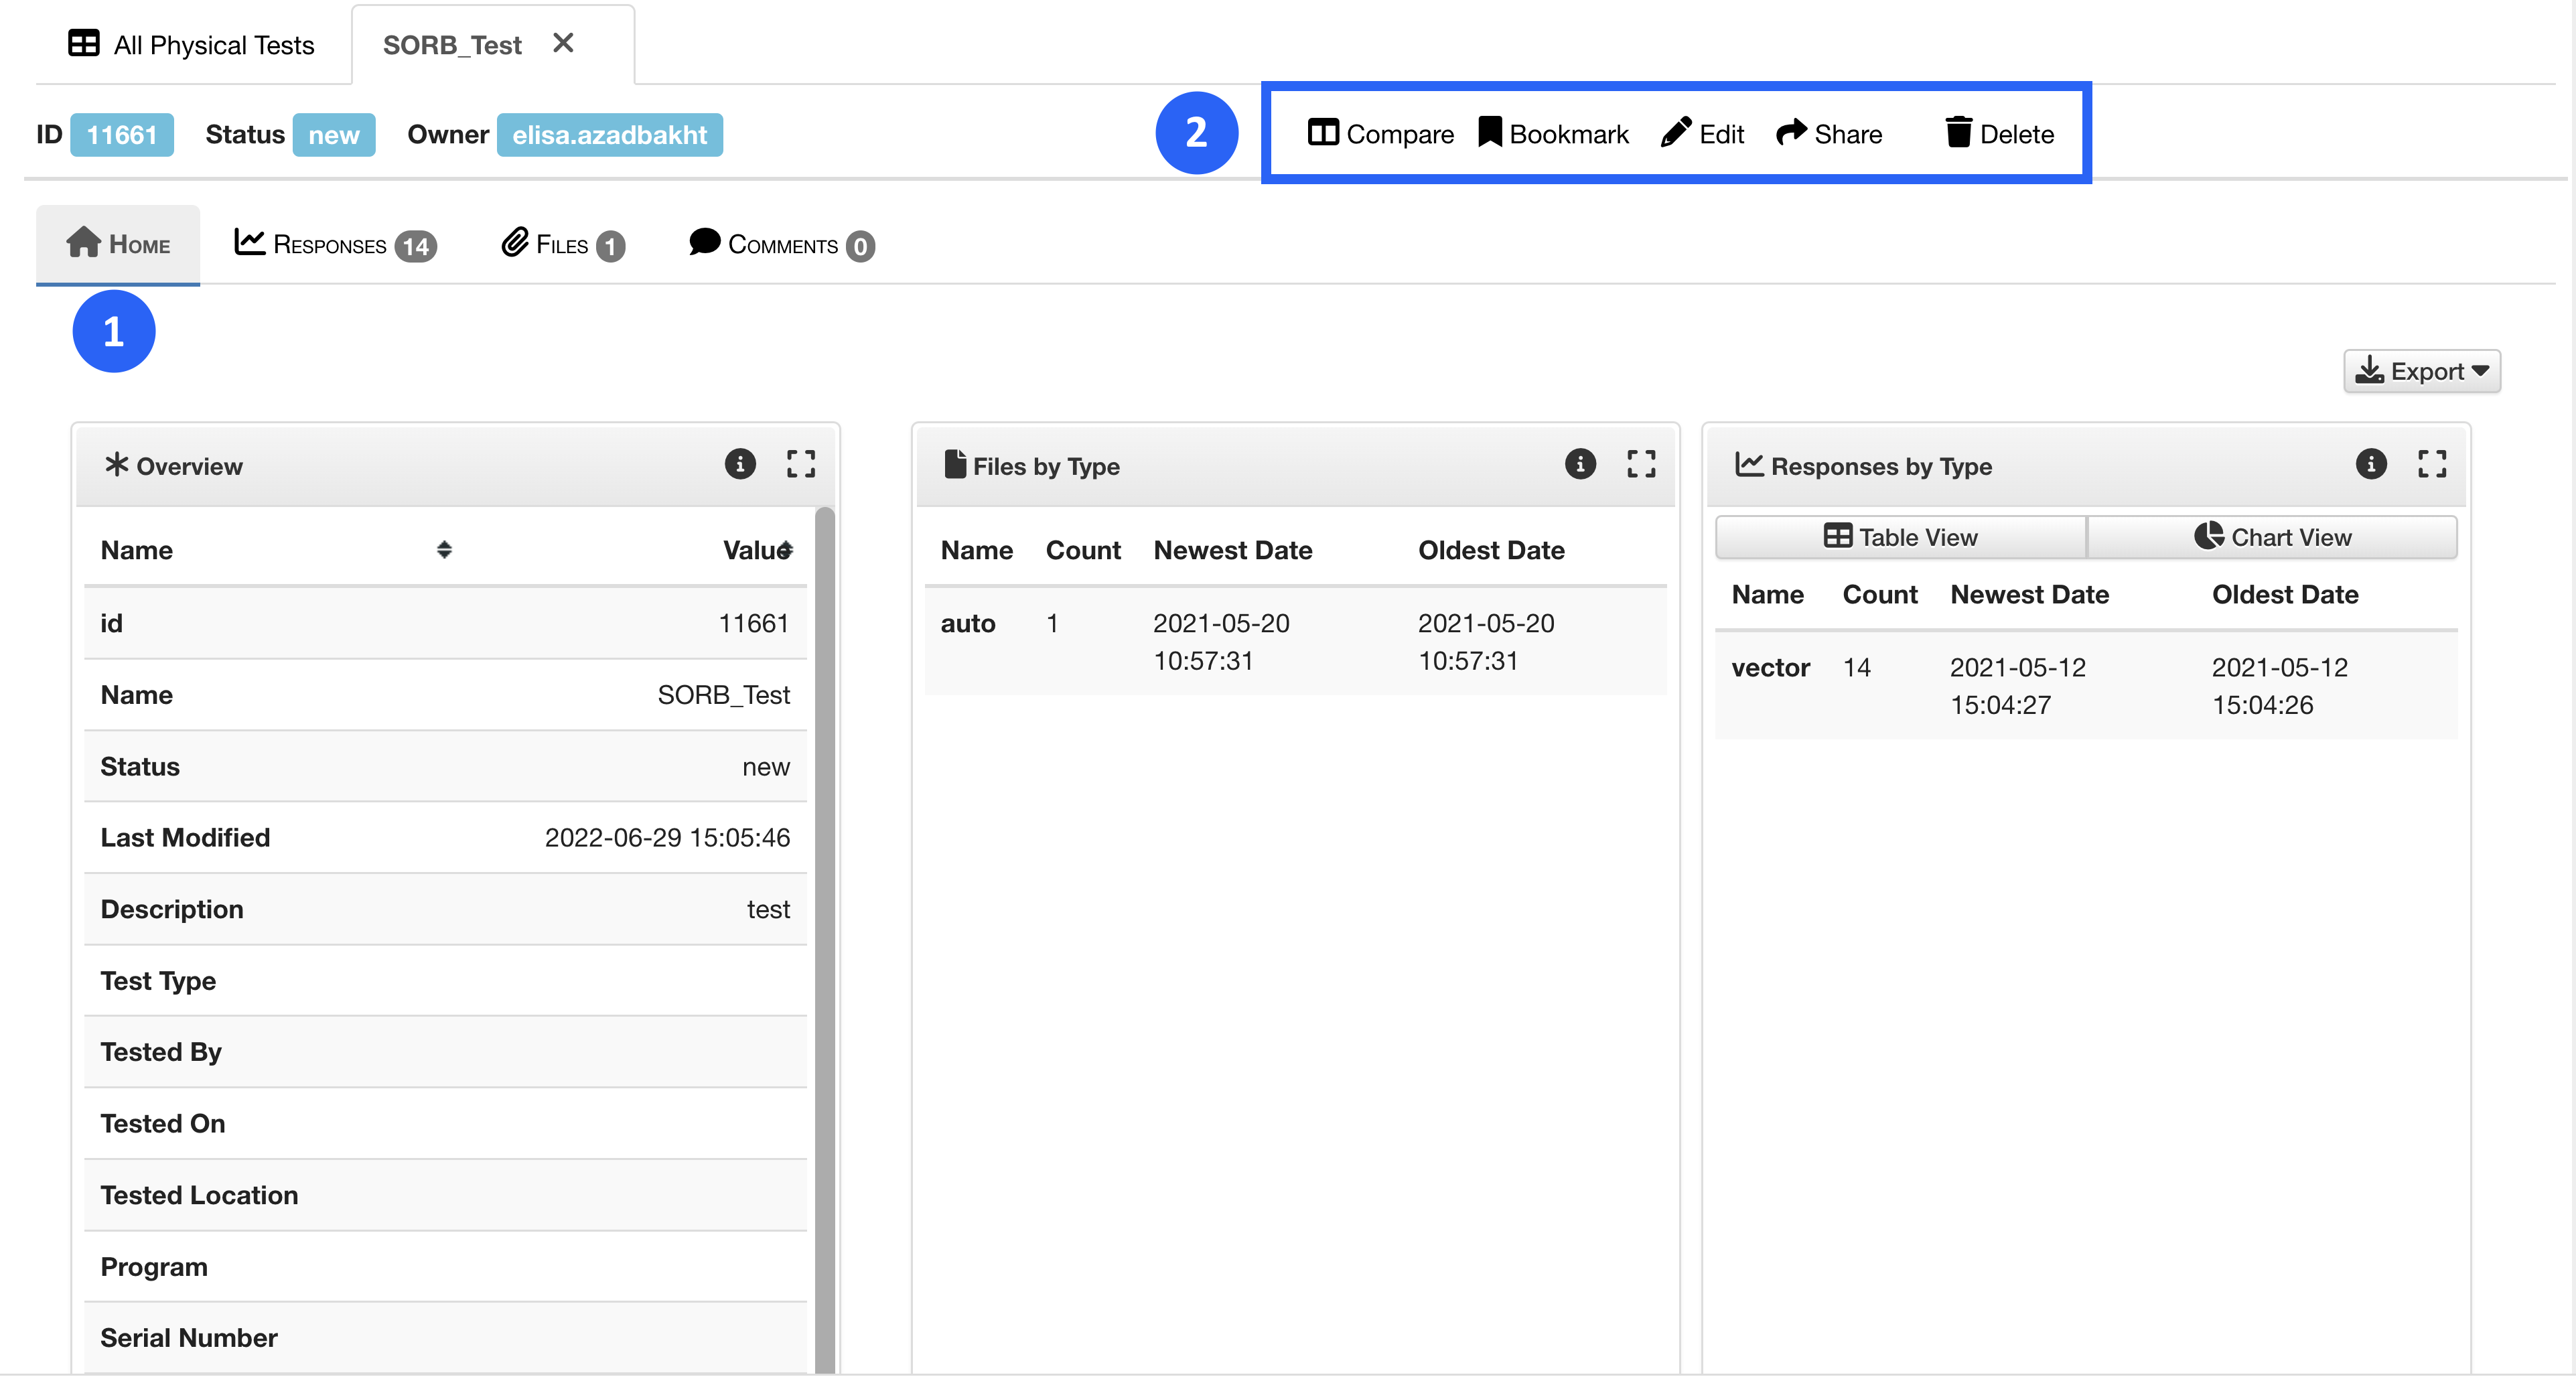
Figure 2: View Physical Test
Adding / Viewing Responses
The Responses tab presents your responses’ summaries and visualizes them when ever possible. Click on the 3 dots next to a response to view actions you can perform on the responses.
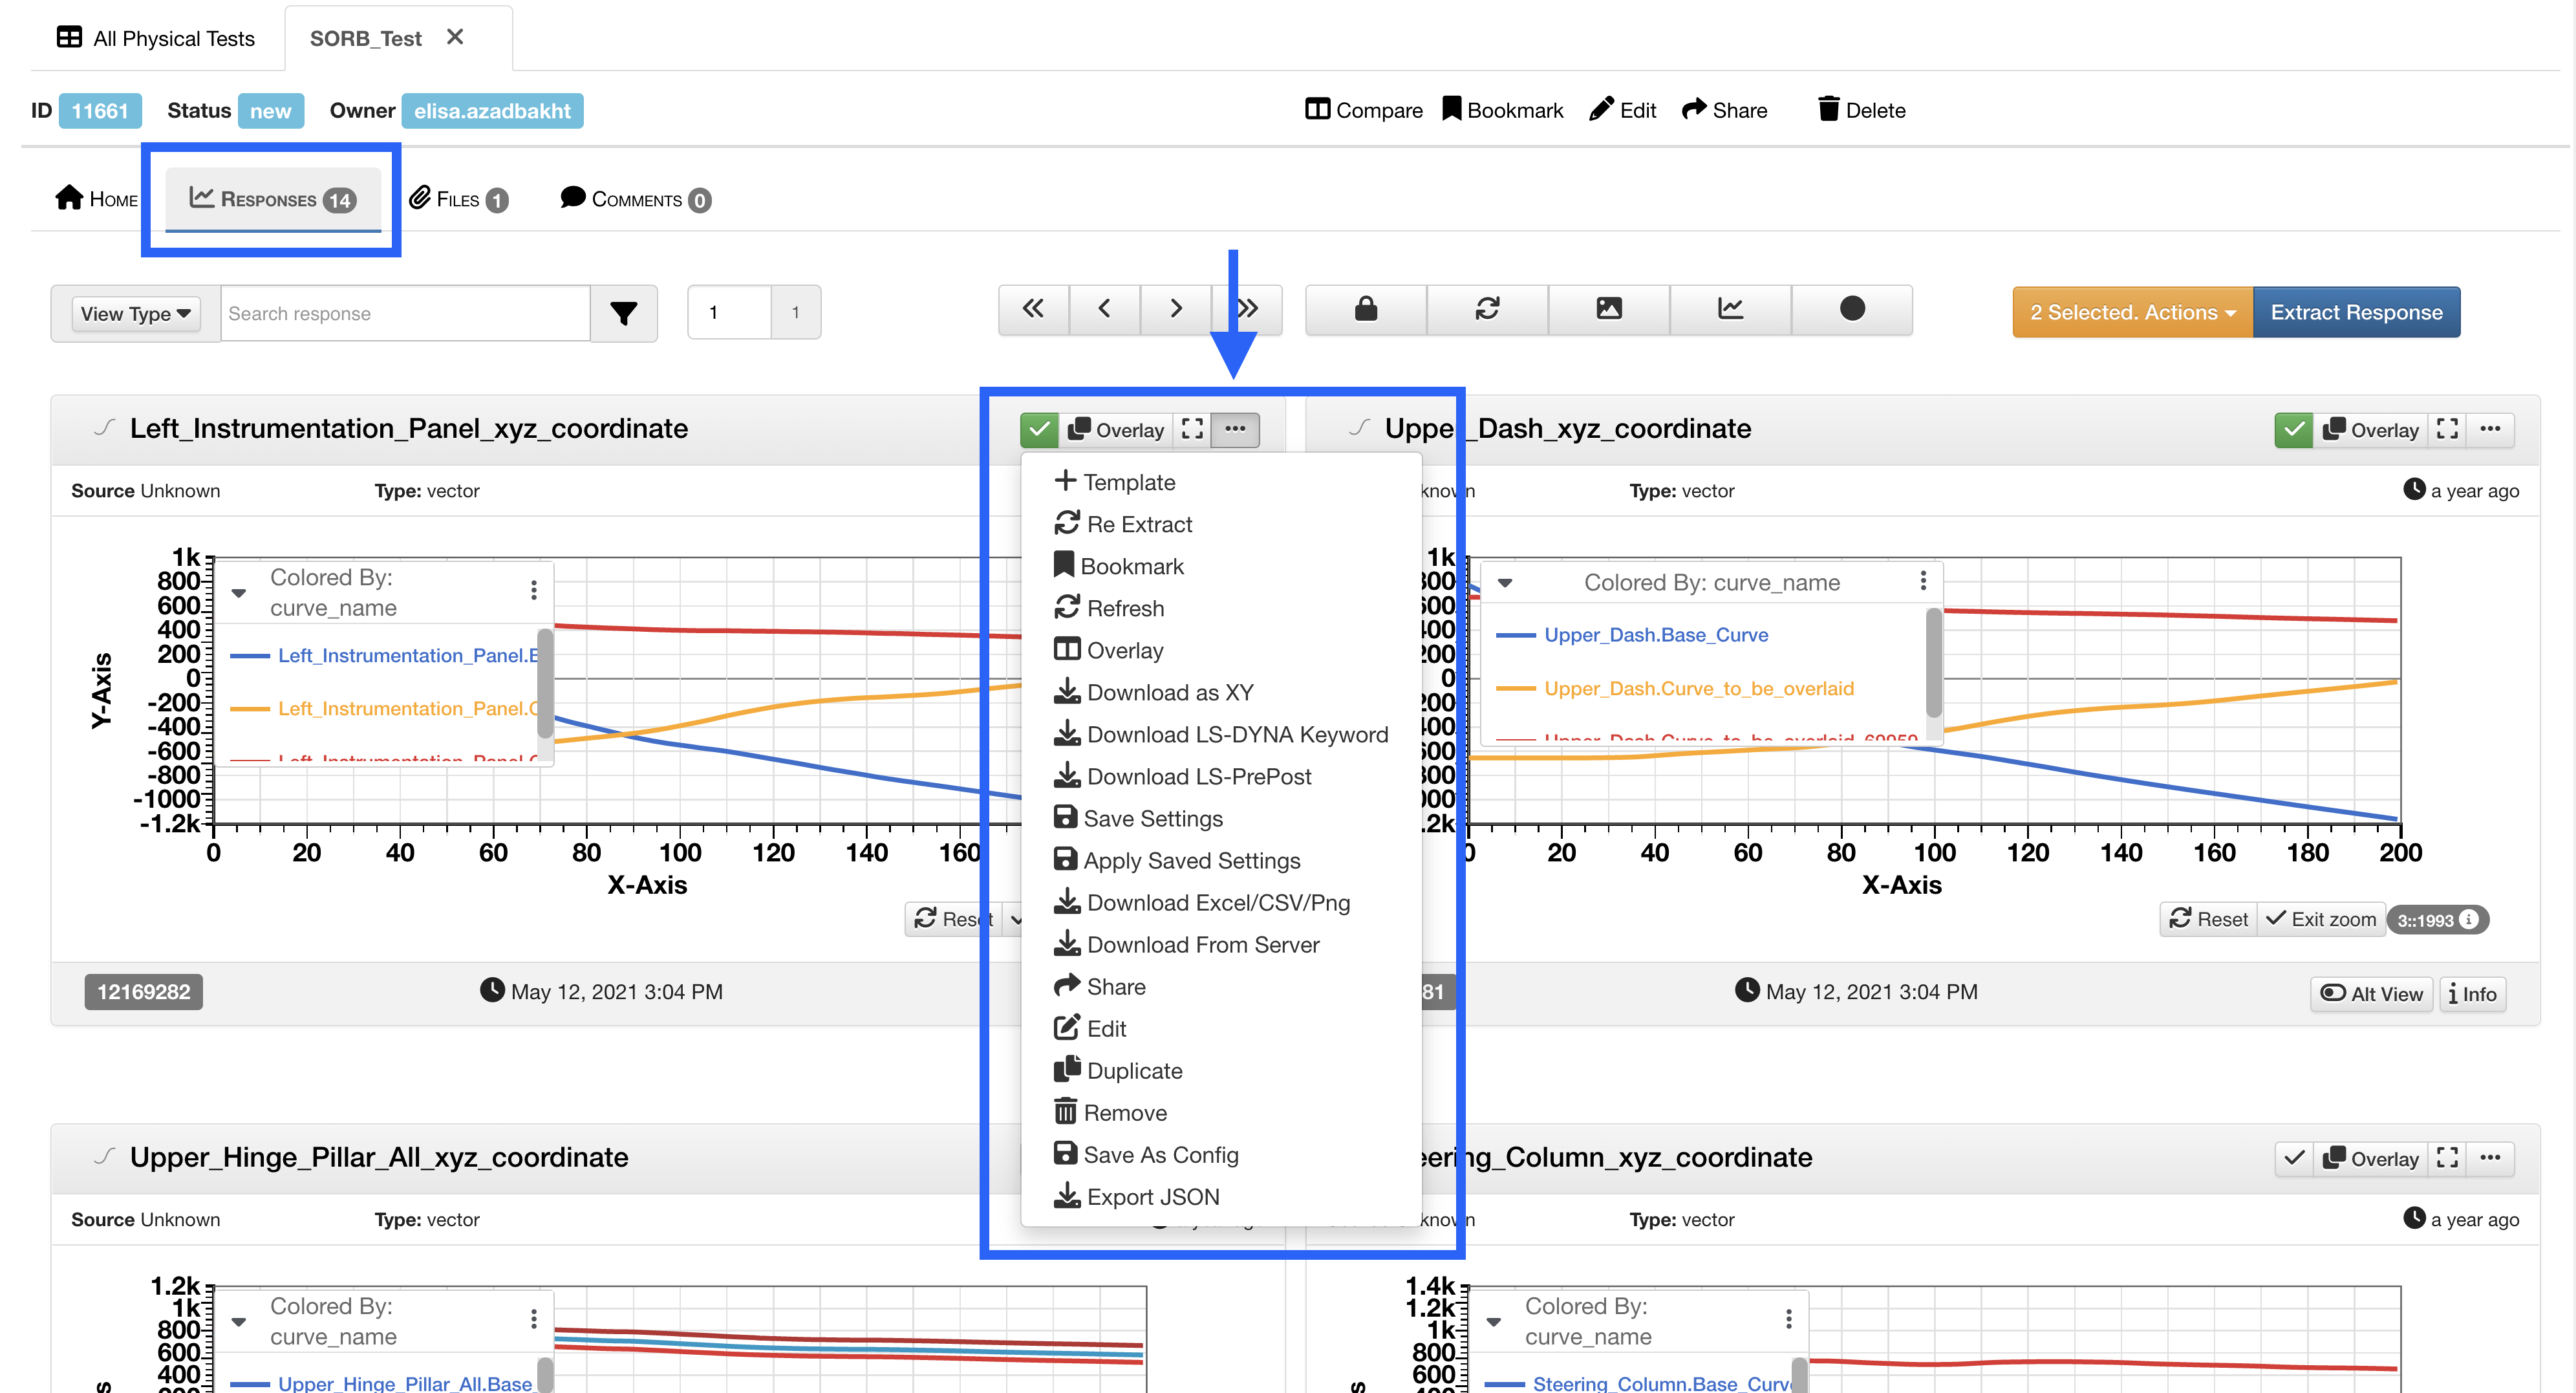
Figure 3: Physical Test Response Actions
You can also select (check) multiple responses and hit the “Selected” drop-down to view all the bulk actions you can perform on them.
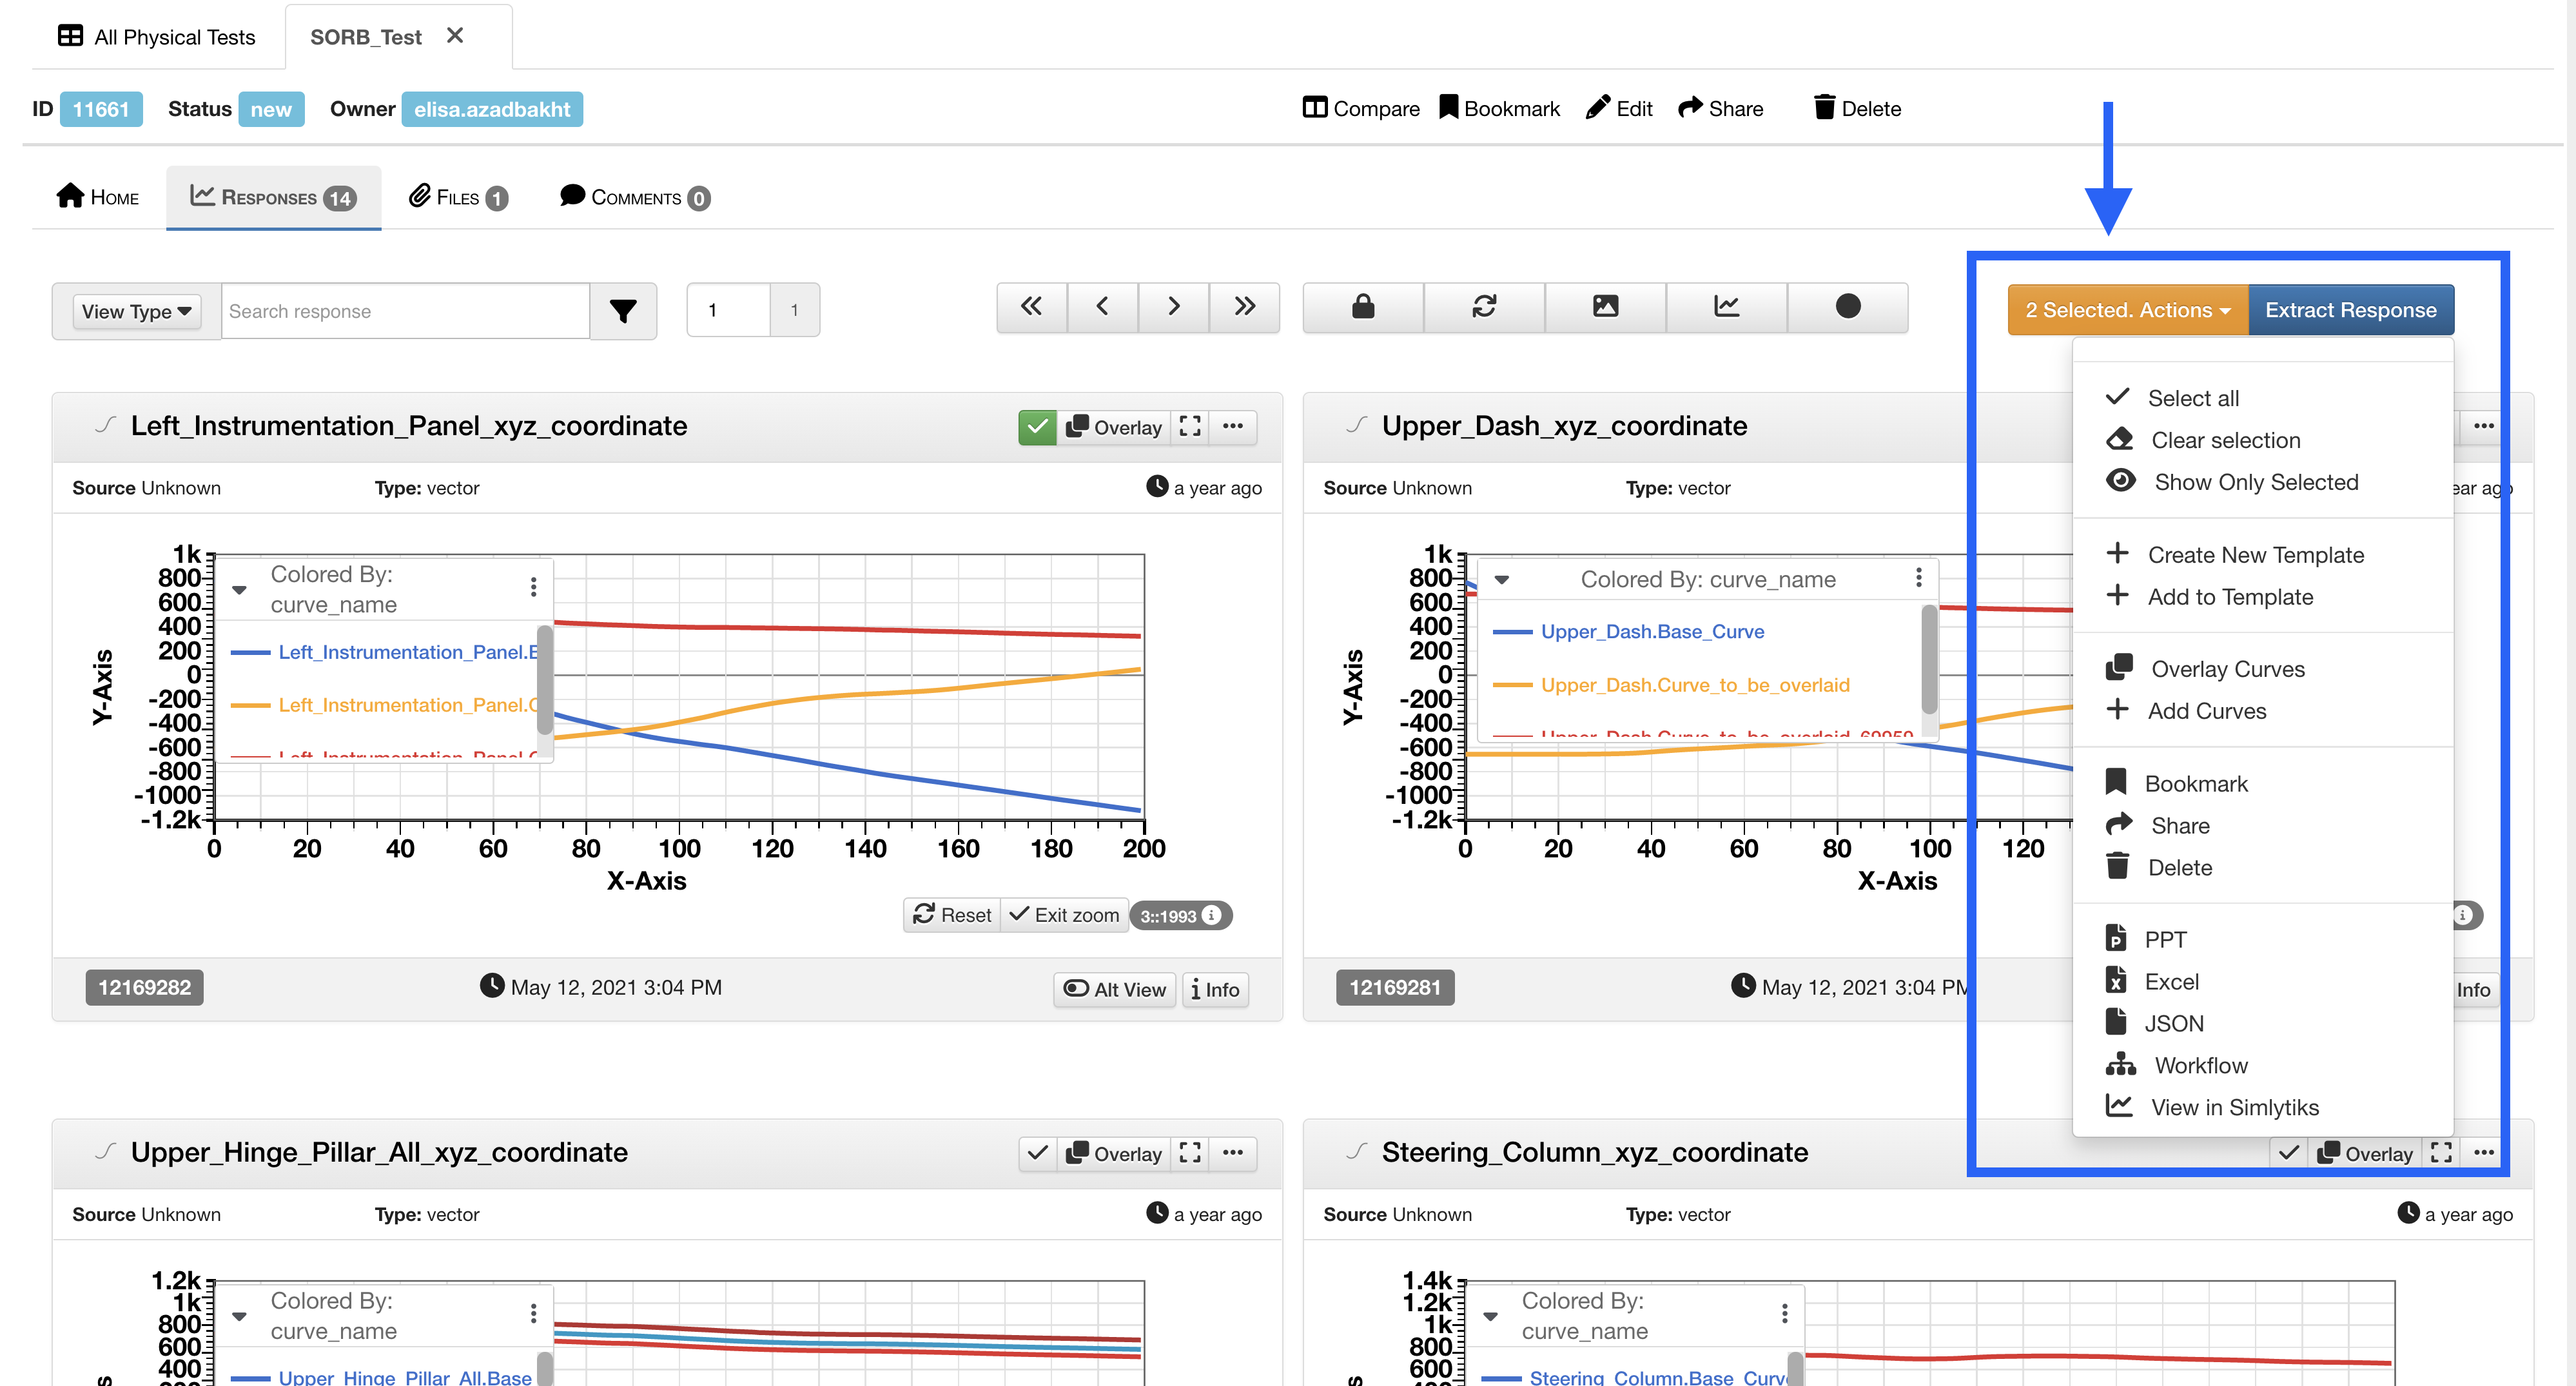
Figure 4: Physical Test Response Actions
Click on “Extract Responses” to create more responses or to apply a template.
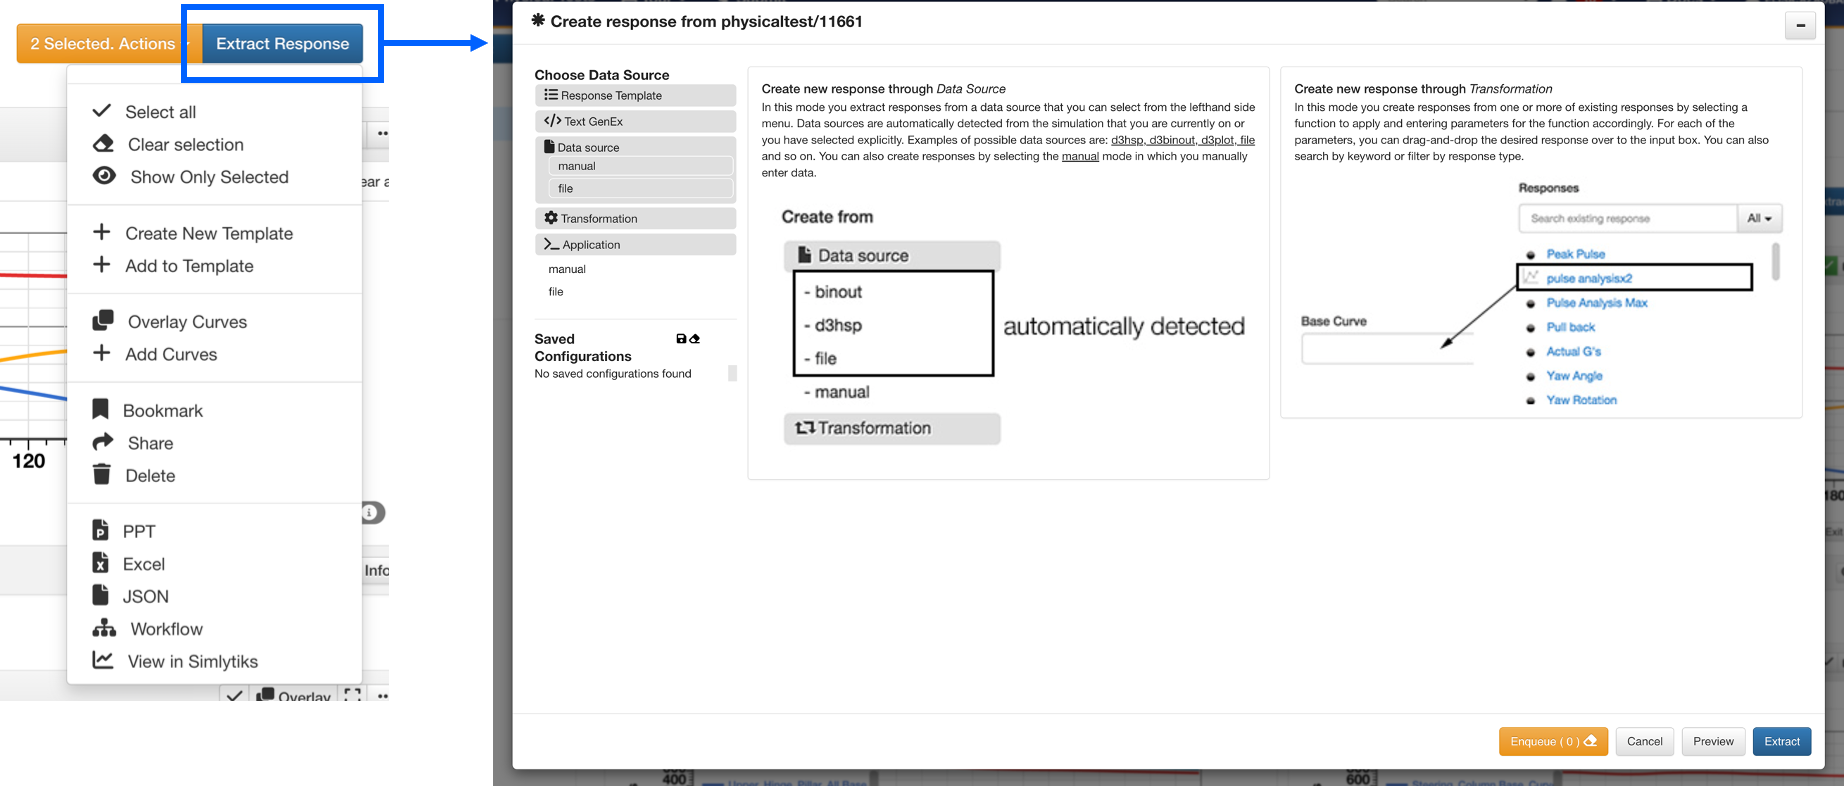
Figure 5: Add Physical Test Response
Curve Responses link with d3VIEW’s Curve Viewing Application Newton for enhanced analysis. To learn about Newton, follow this link.
Filtering Responses
Click on the filter icon at the top to use customized filters for sifting through your physical test responses.
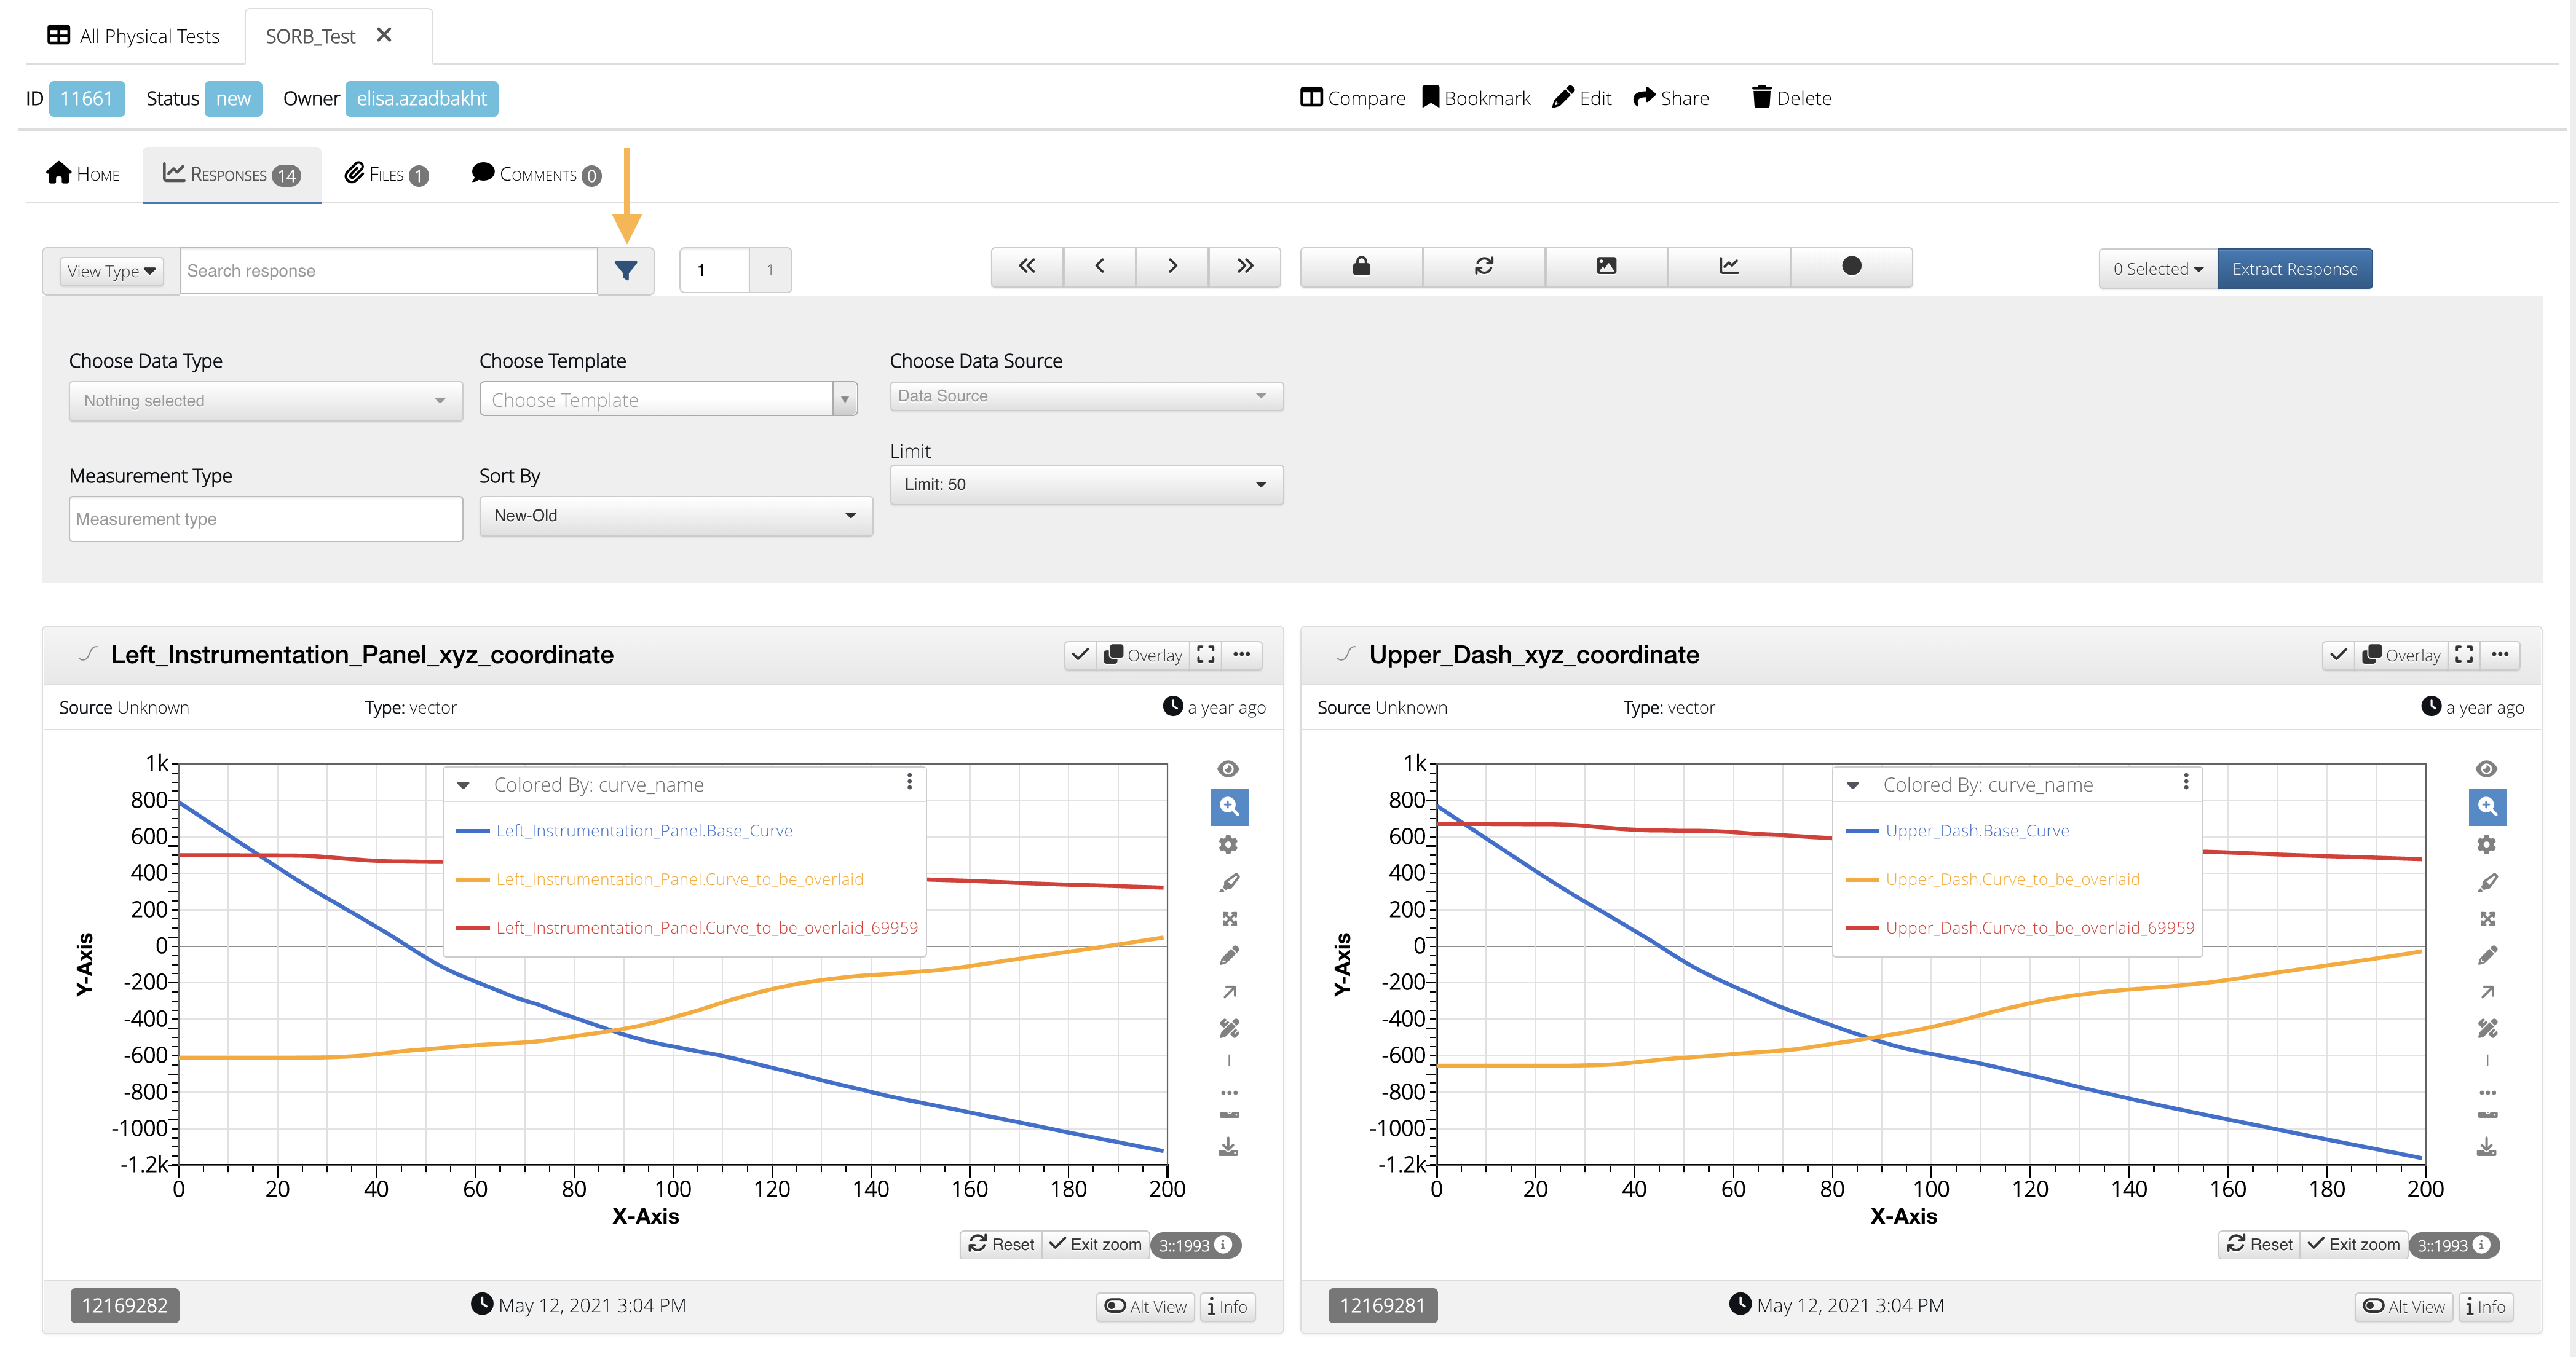
Figure 6: Filter Responses
The datatype filter has an array of filetypes to choose from including MDF/DAT file options which have been adde as of February 16, 2022.
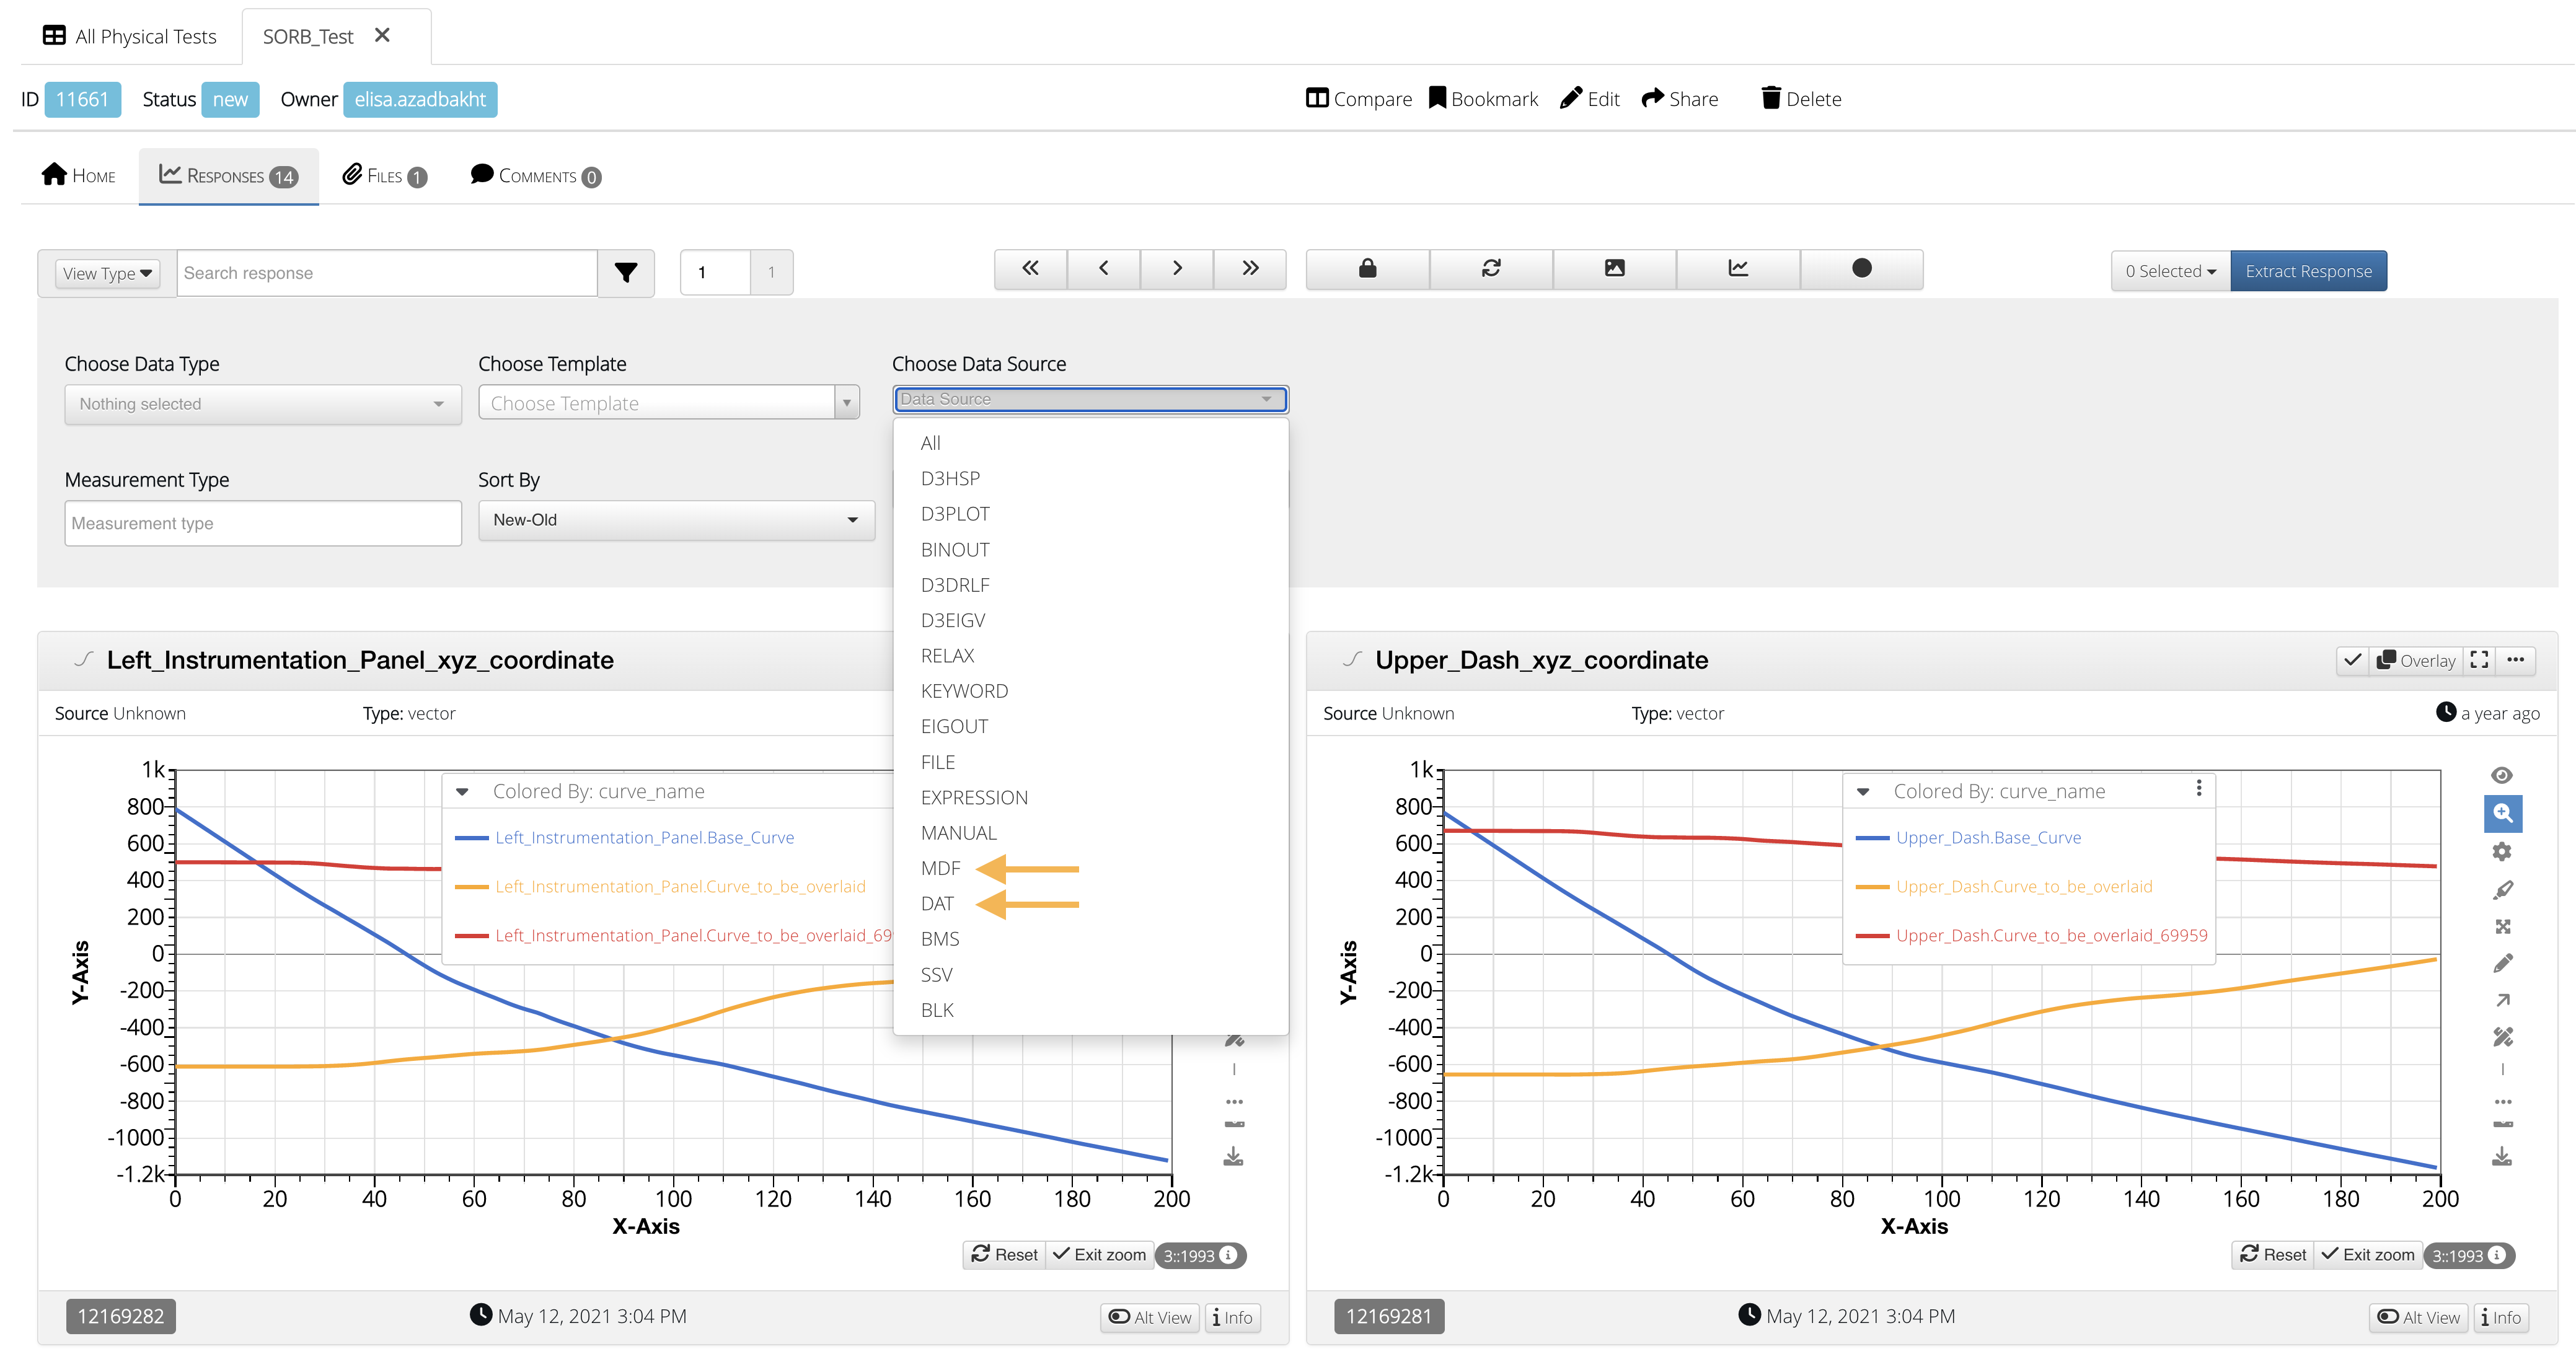
Figure 7: Filter Data Source
Overlay Responses
Overlaying same response from two different Physical tests will now have two legends with different colors.
Adding / Viewing Files
Click on the “Files” tab of your physical test to review your uploaded files. You can also add more files by clicking on the “Add File” button and using the upload box. (Read on to learn how to add media files step-by-step).
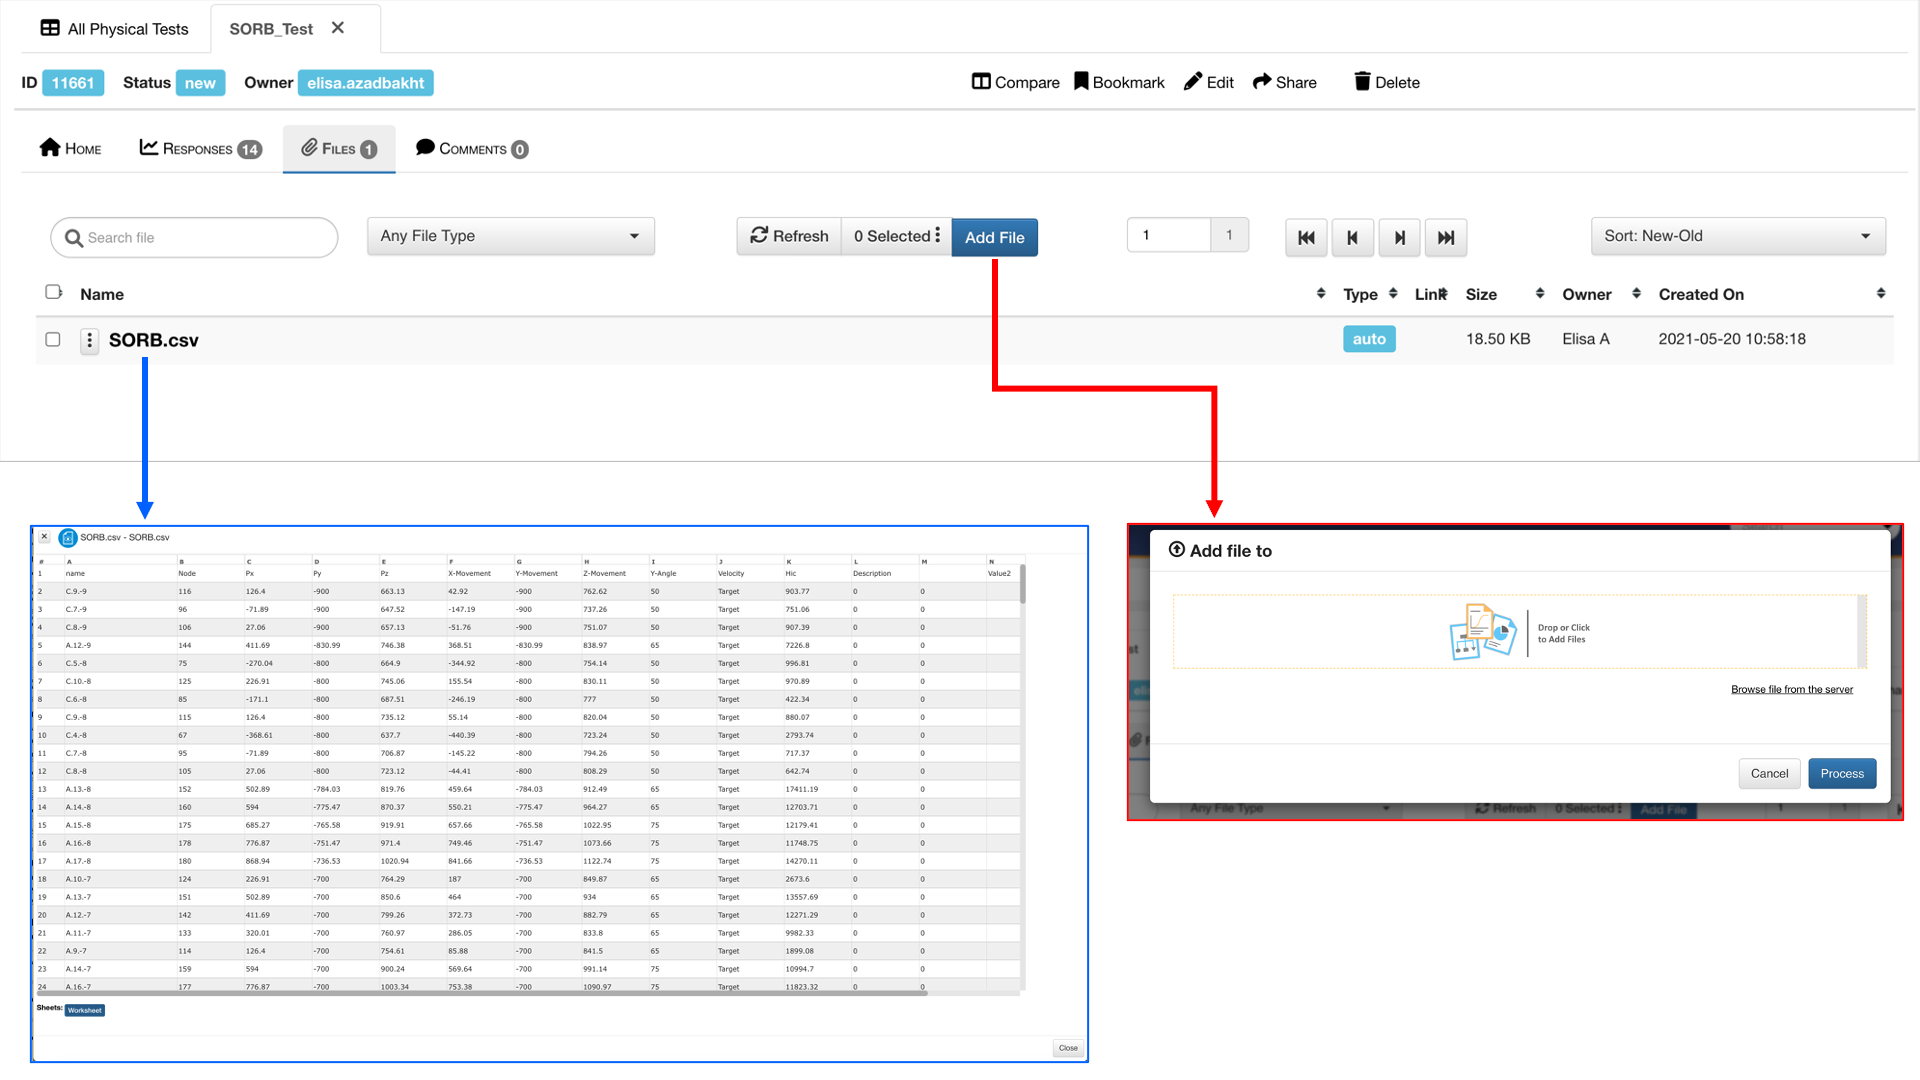
Figure 8: Physical Test Files
Uploading Media Files
Under the files tab, click on the blue Add File button at the top.
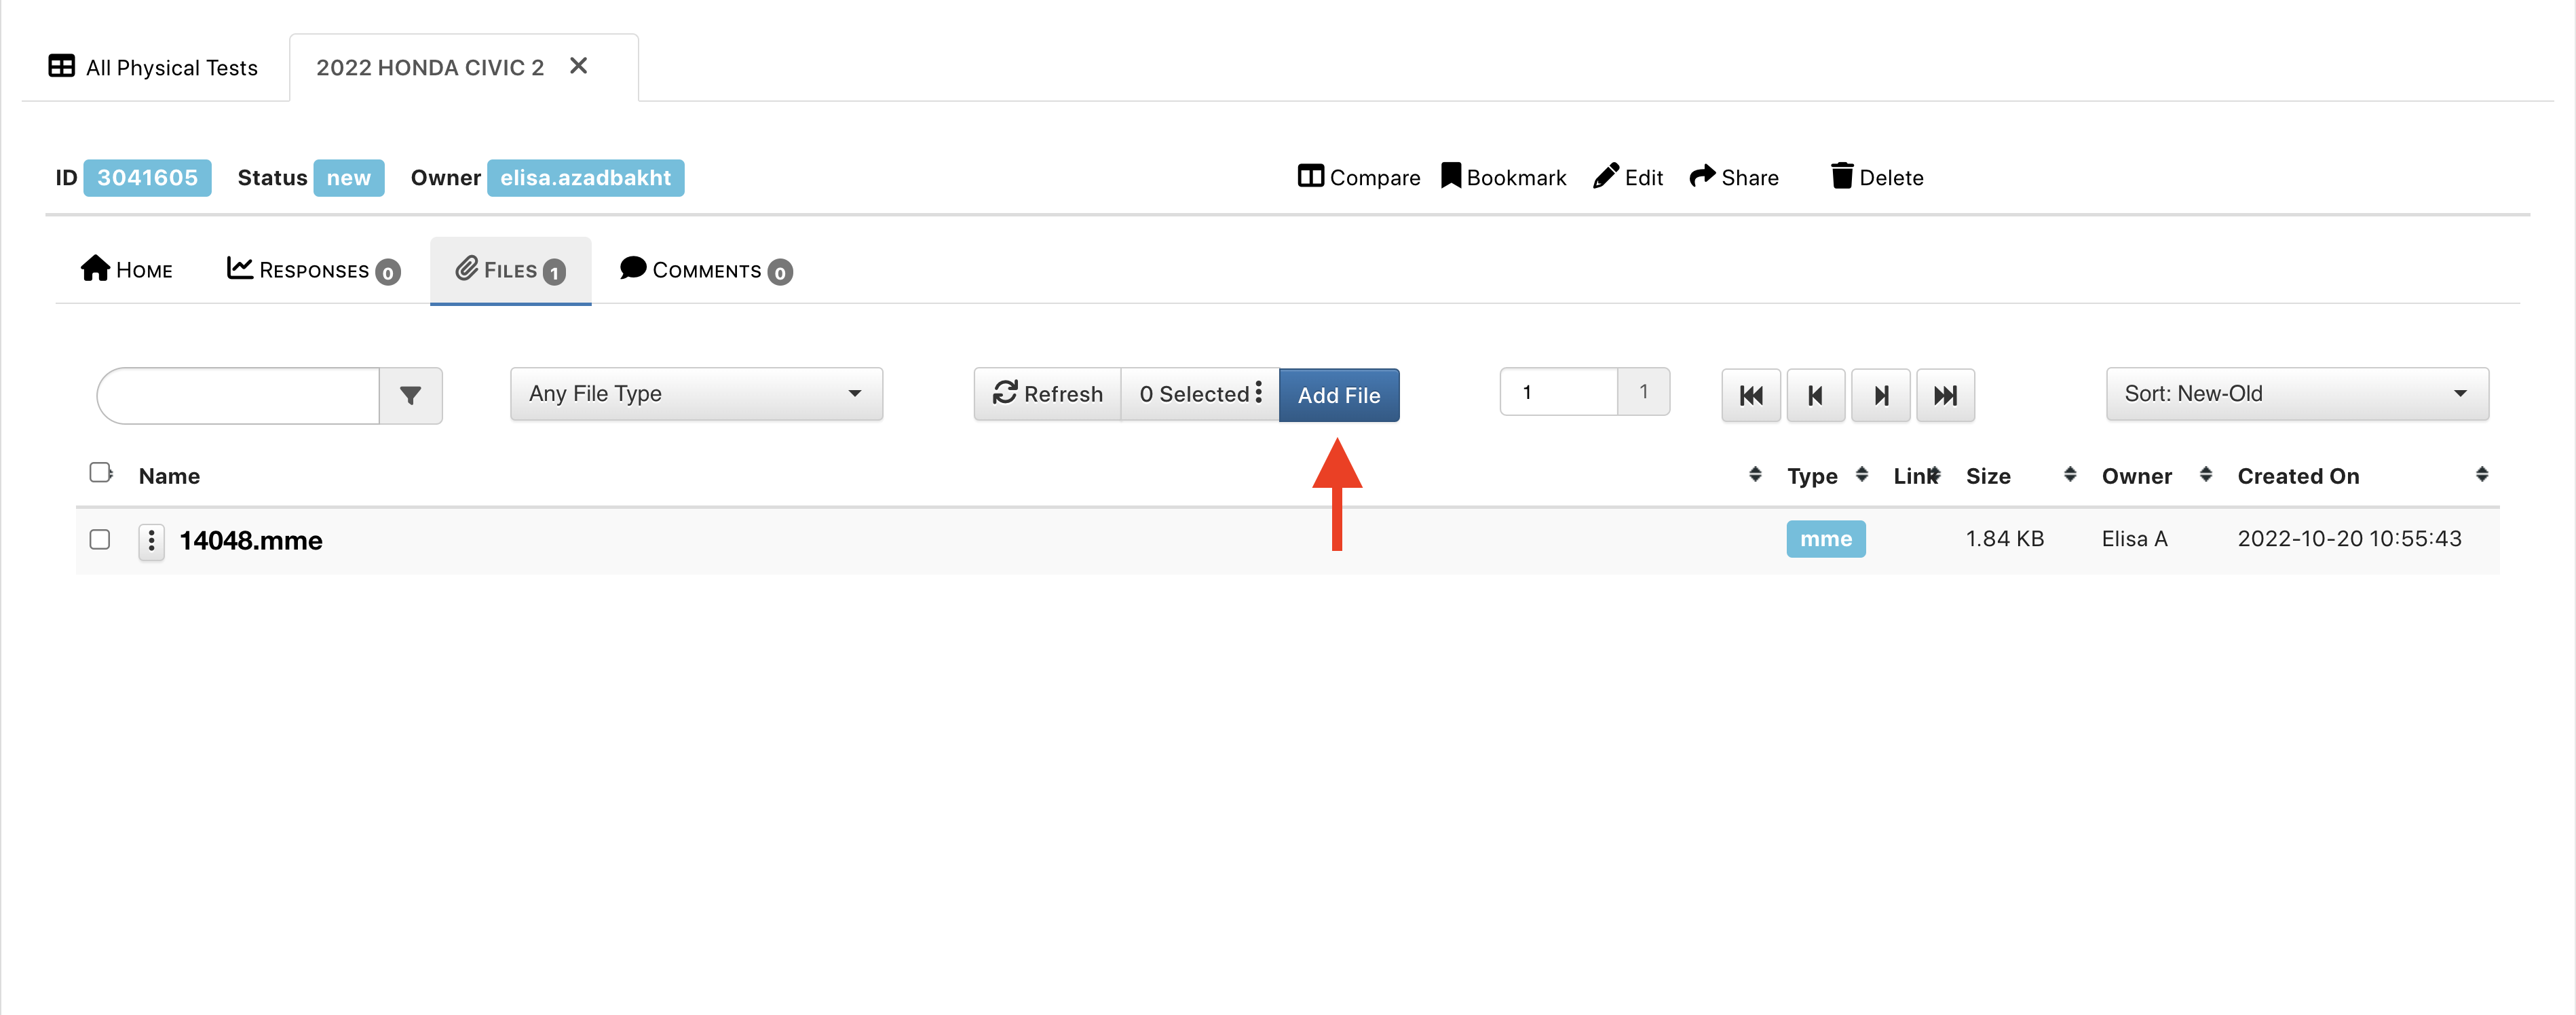
Figure 9: Add Media File
We’ll drag-and-drop all our media into the upload box and click Process.
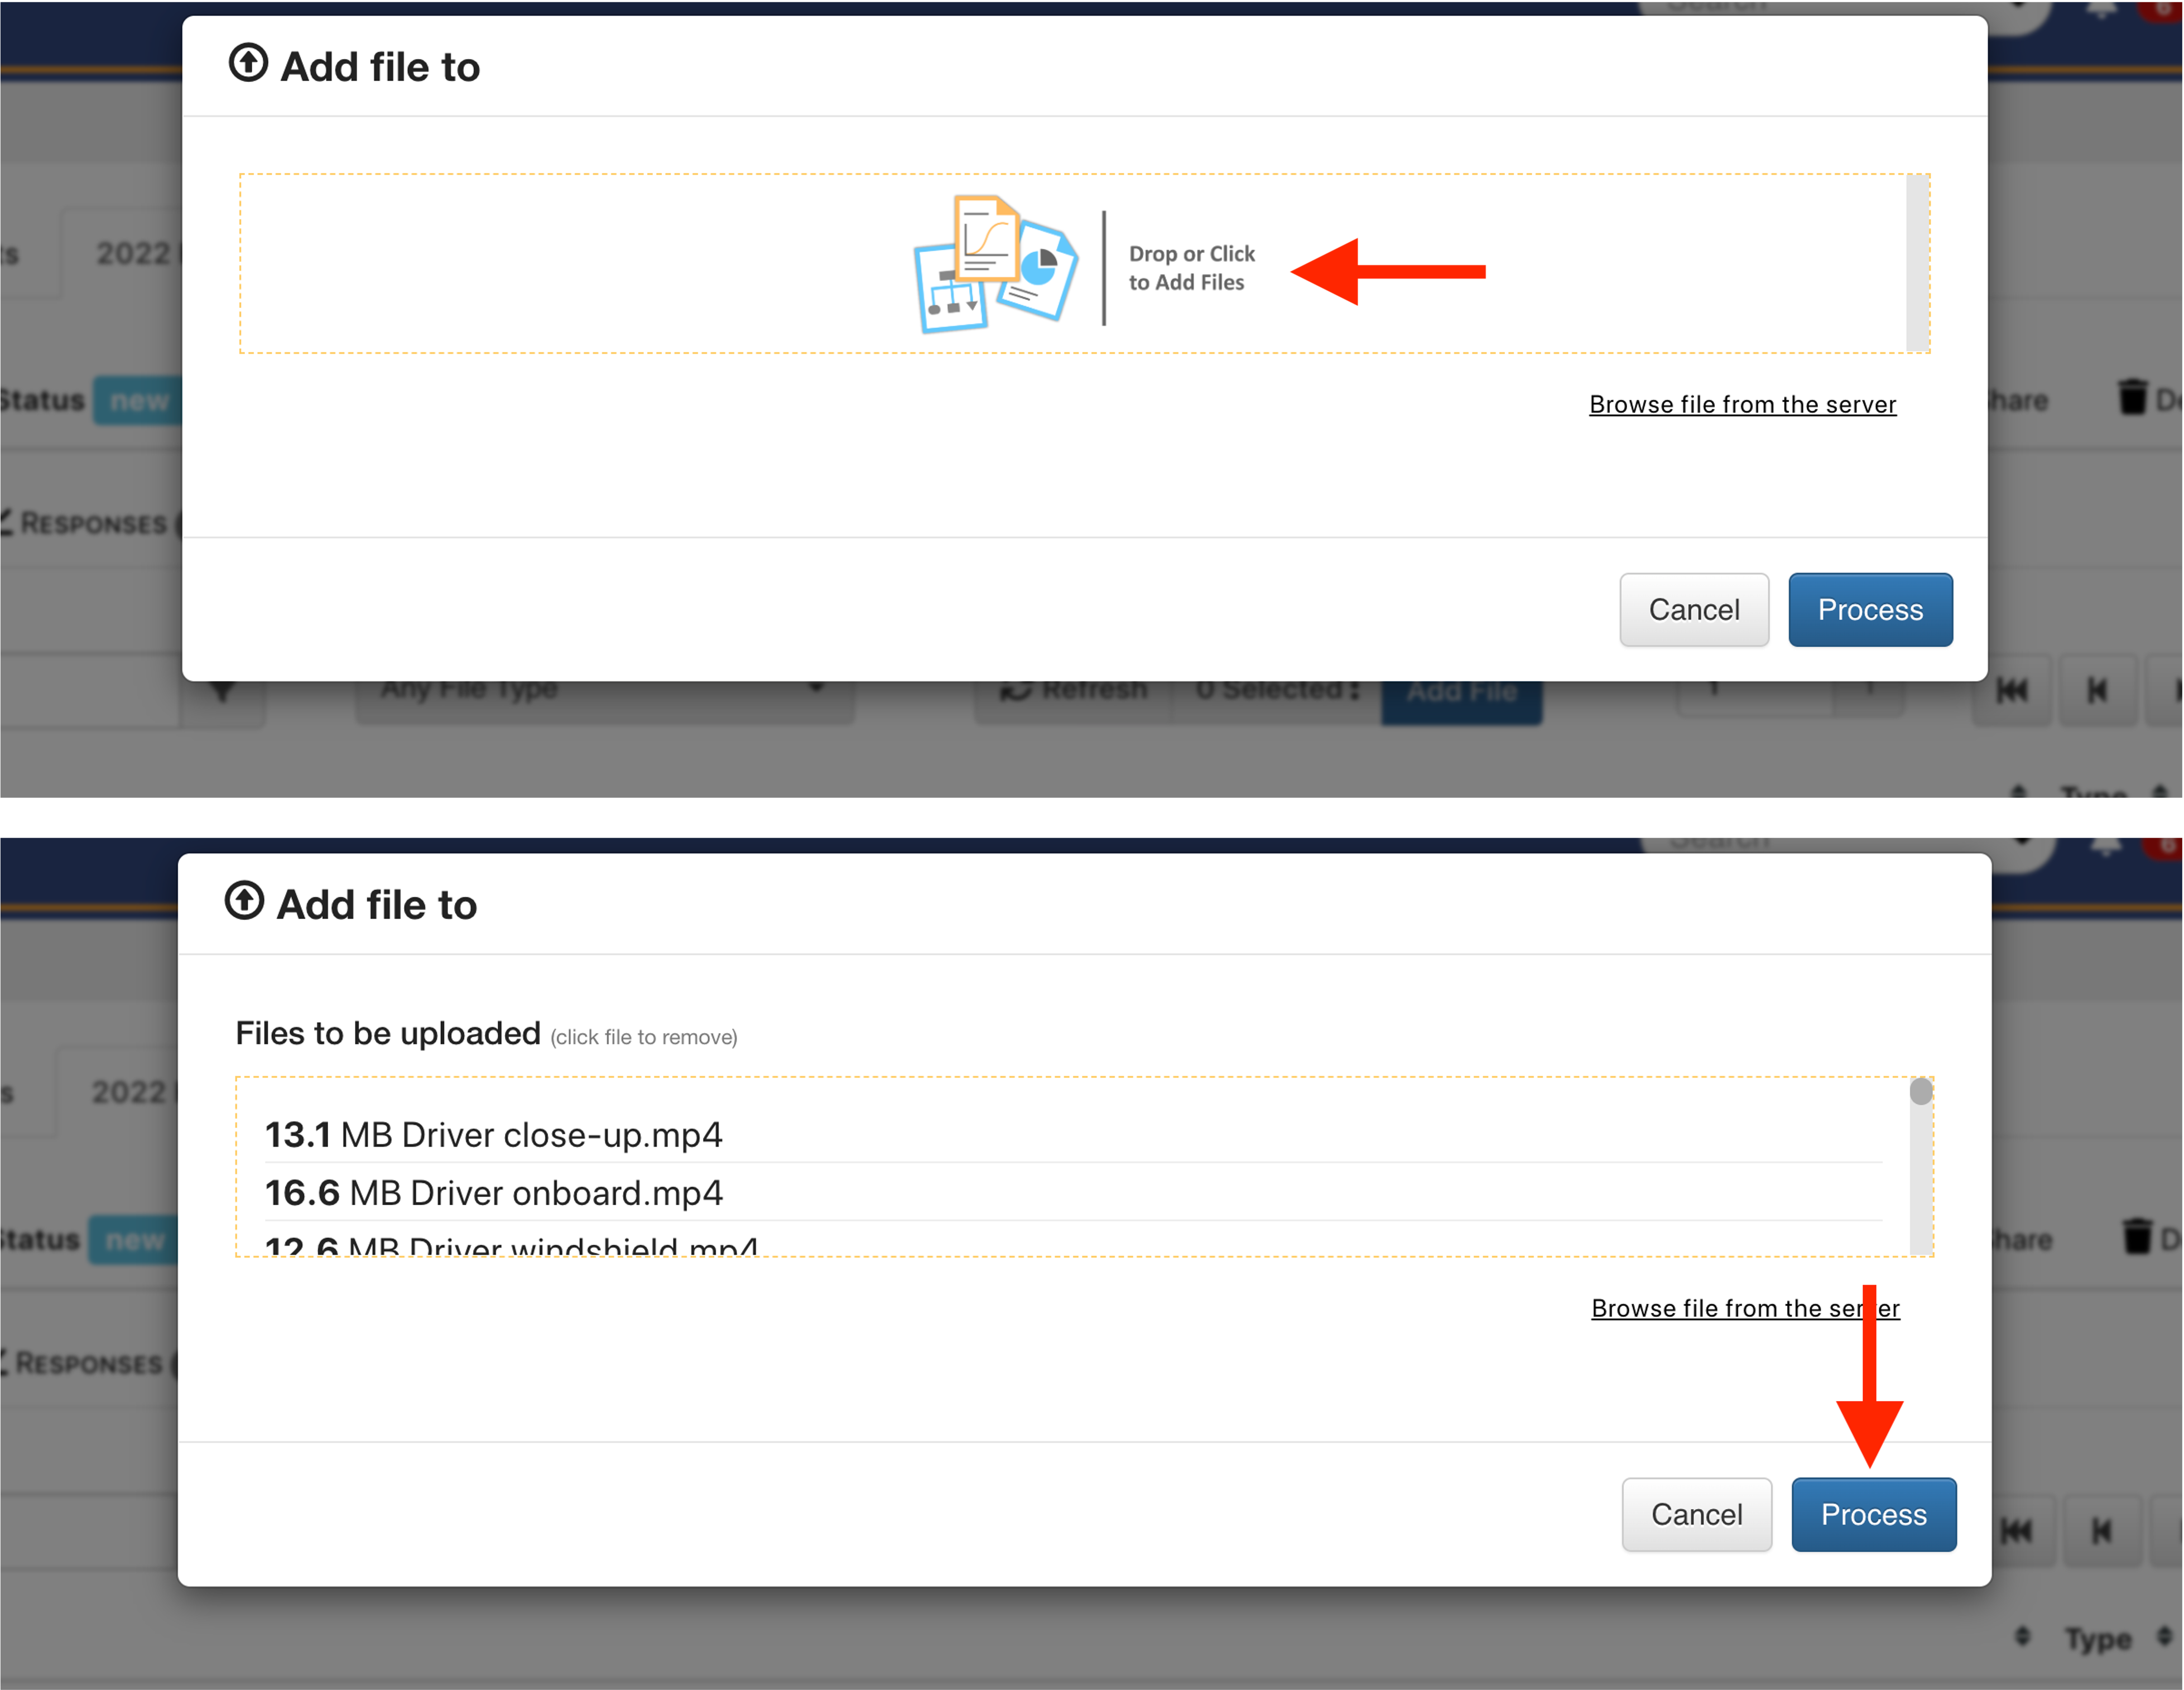
Figure 10: Upload and Process Media Files
Once fully upload, our media files will populate onto the page. (Click Refresh if you do not seem them initially).
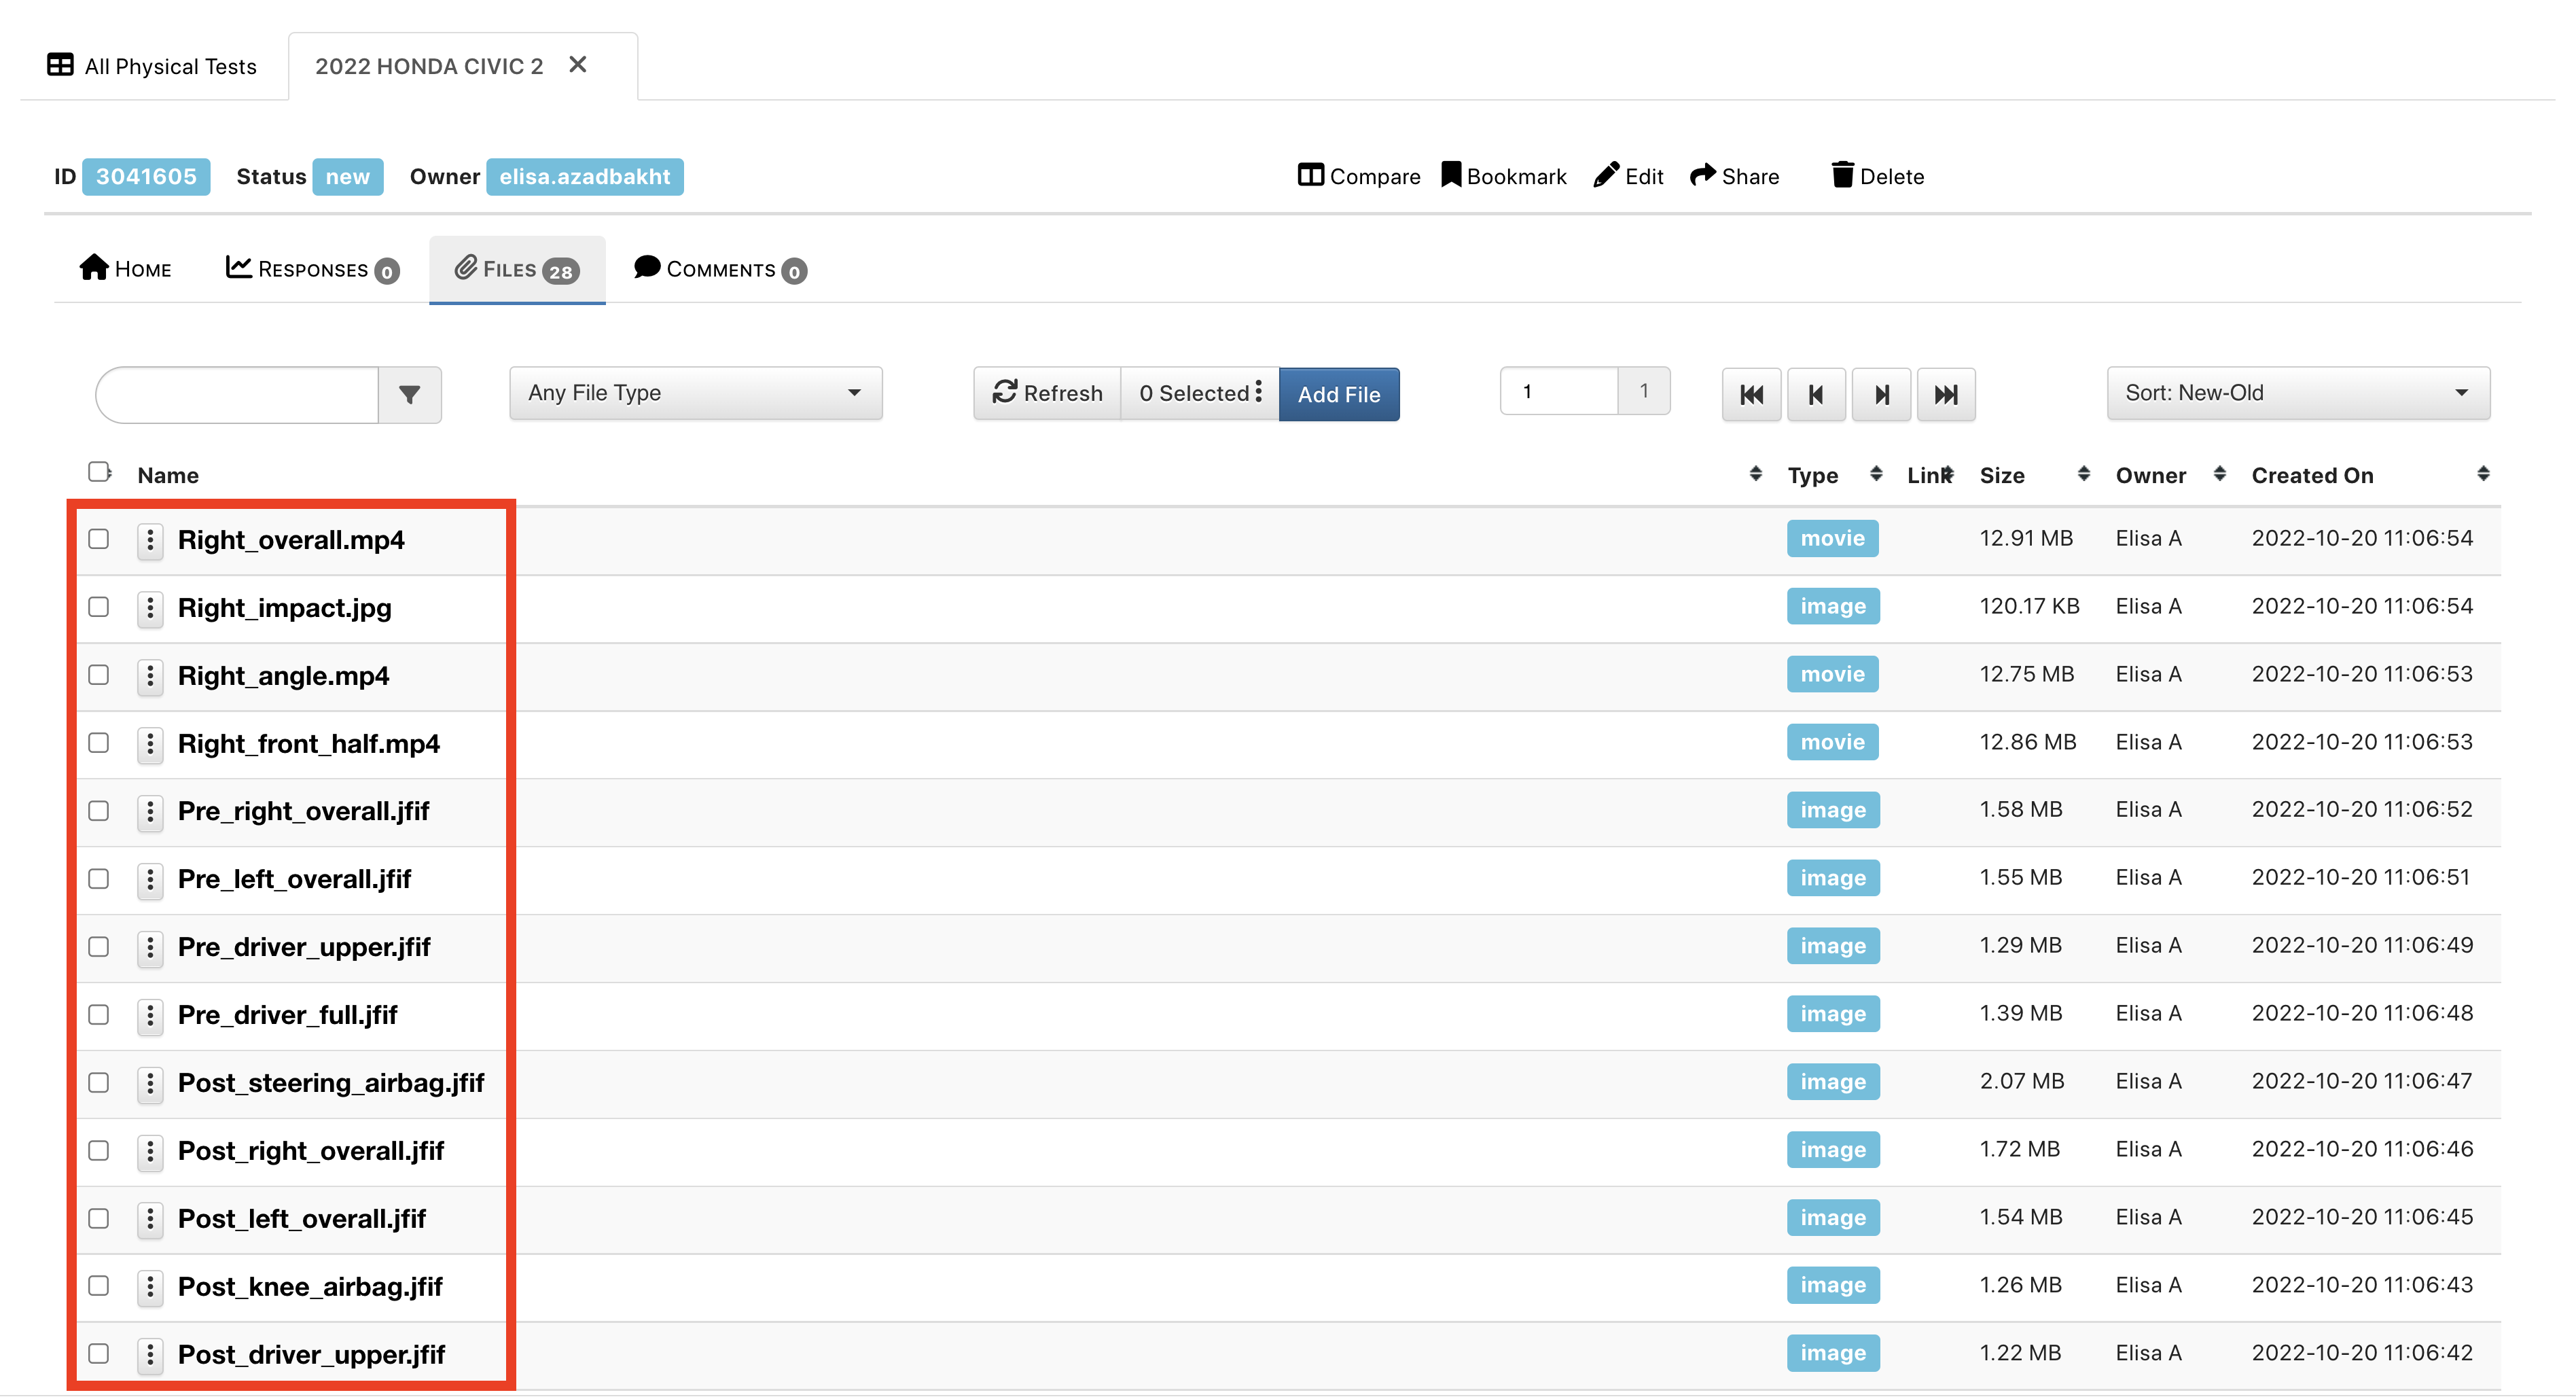
Figure 11: Populated Media Files
Extracting Media Files
If we want to turn our media files into Physical Test responses for comparing with other Physical Tests or Simulations (more on comparisons in the next section), we can do that by extracting them as responses.
Under the Responses tab, click on the blue Extract Response button towards the top right.
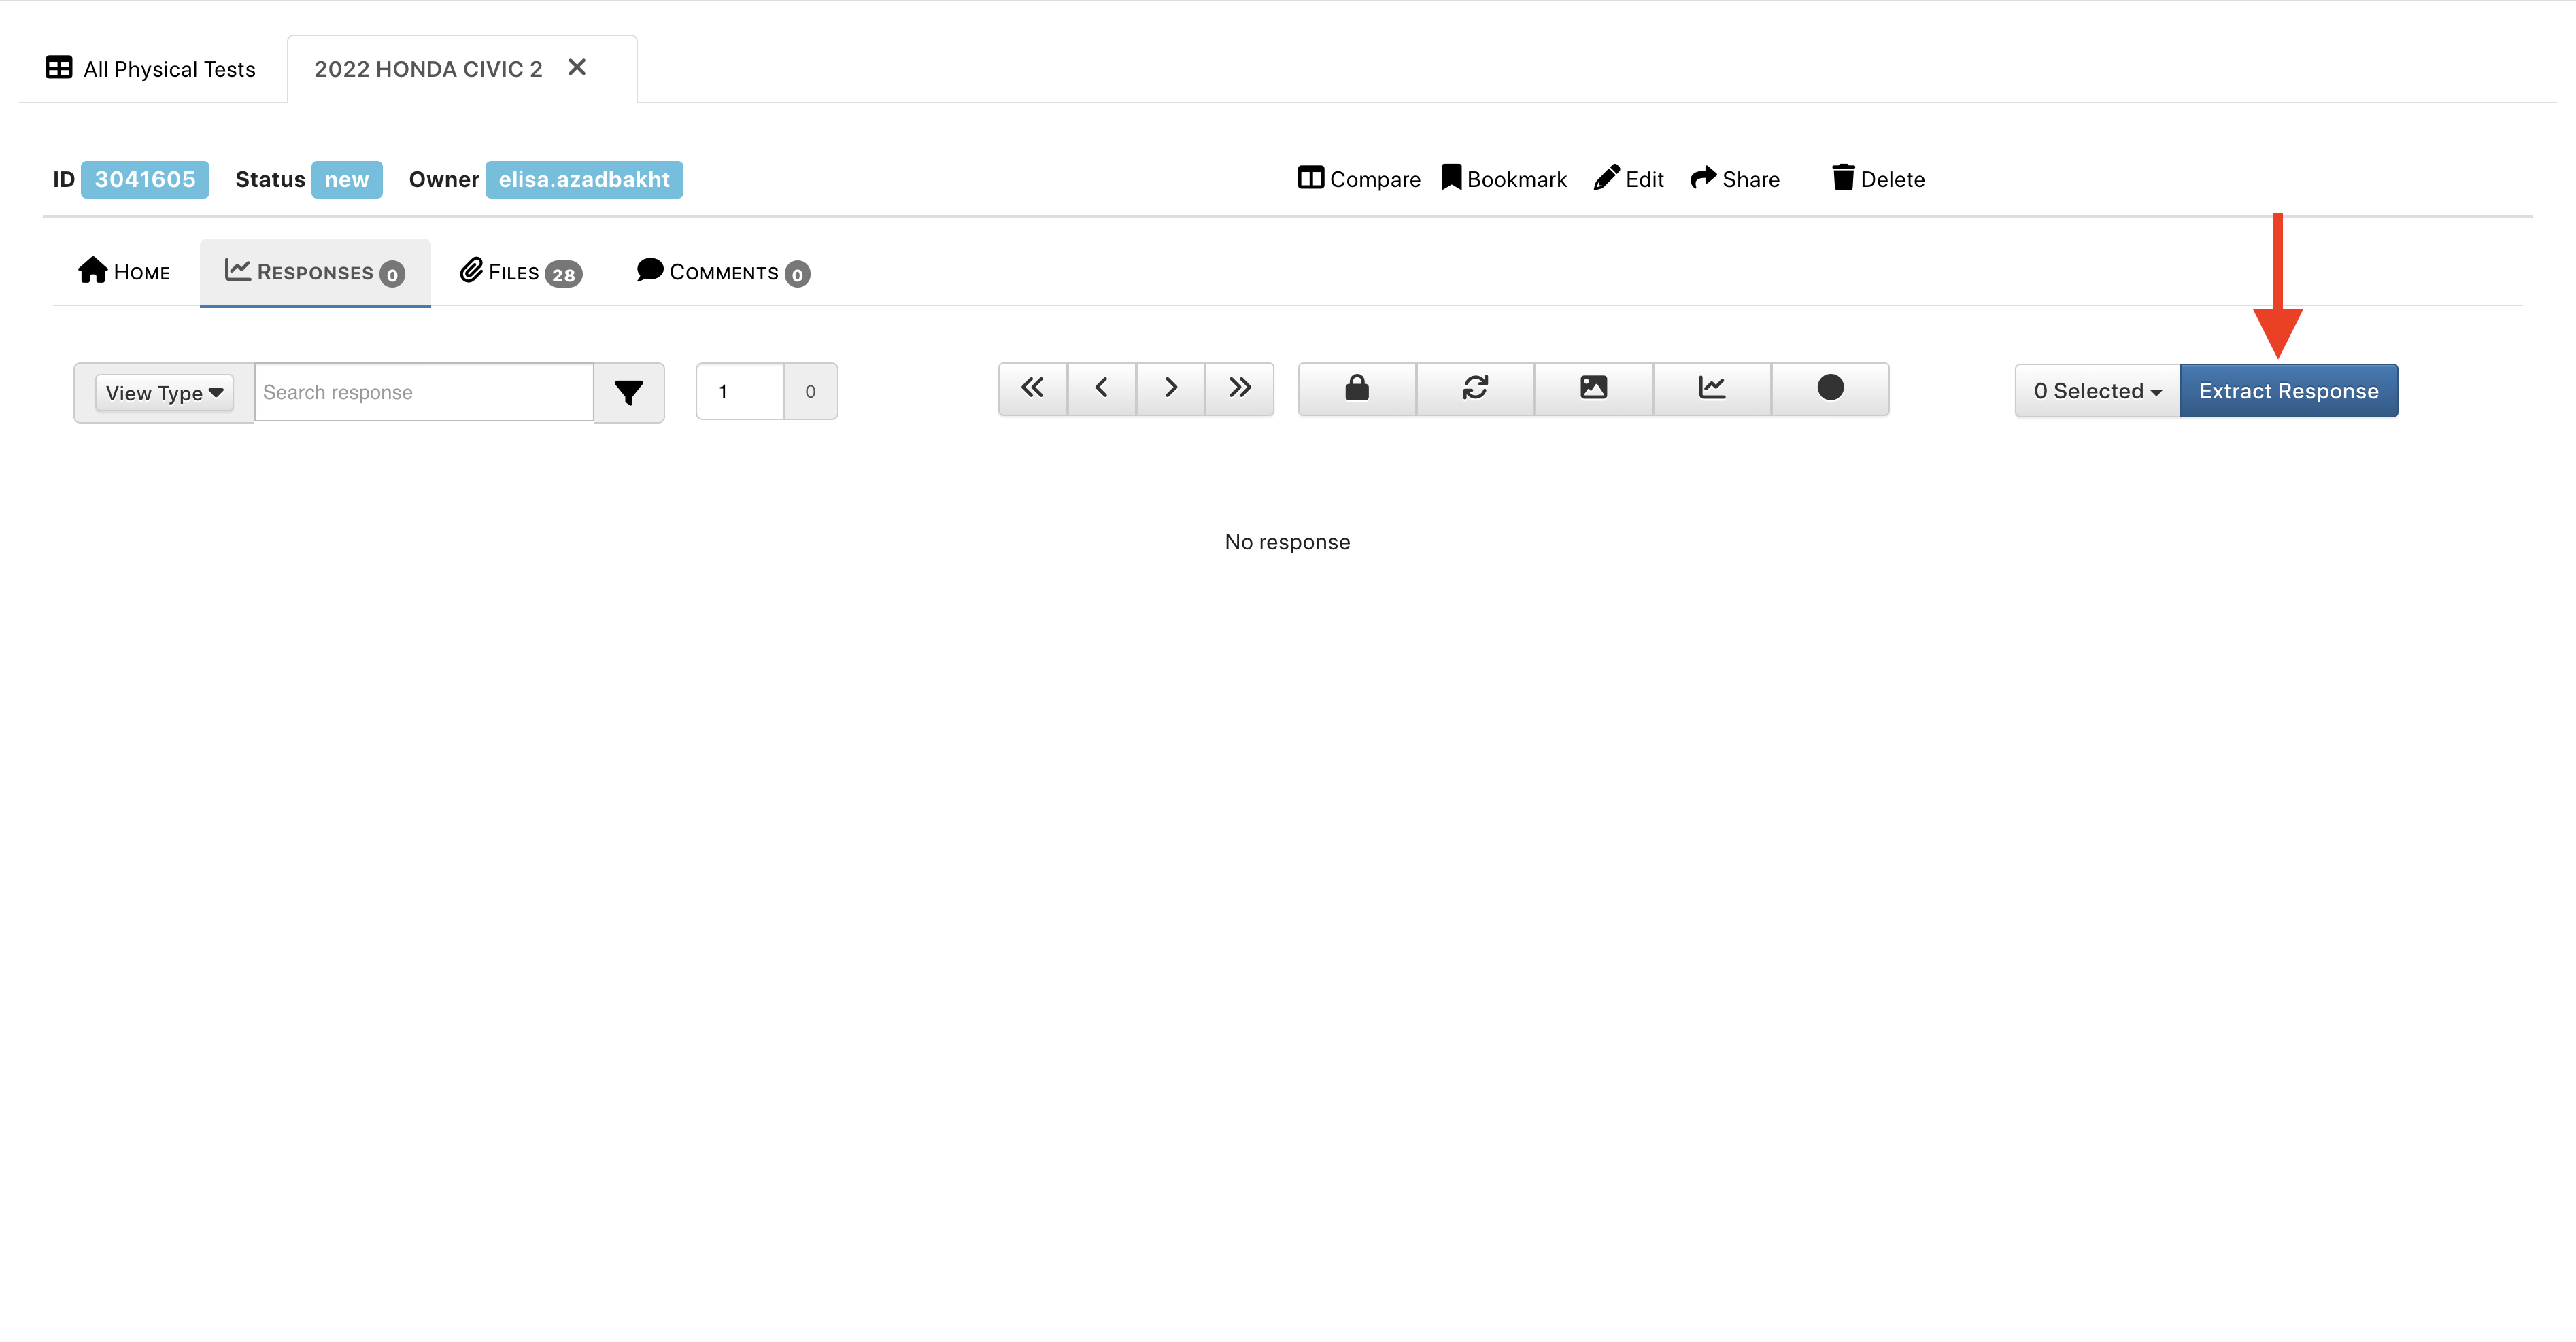
Figure 12: Extract Response
In the next window, choose the Data Source > File option.
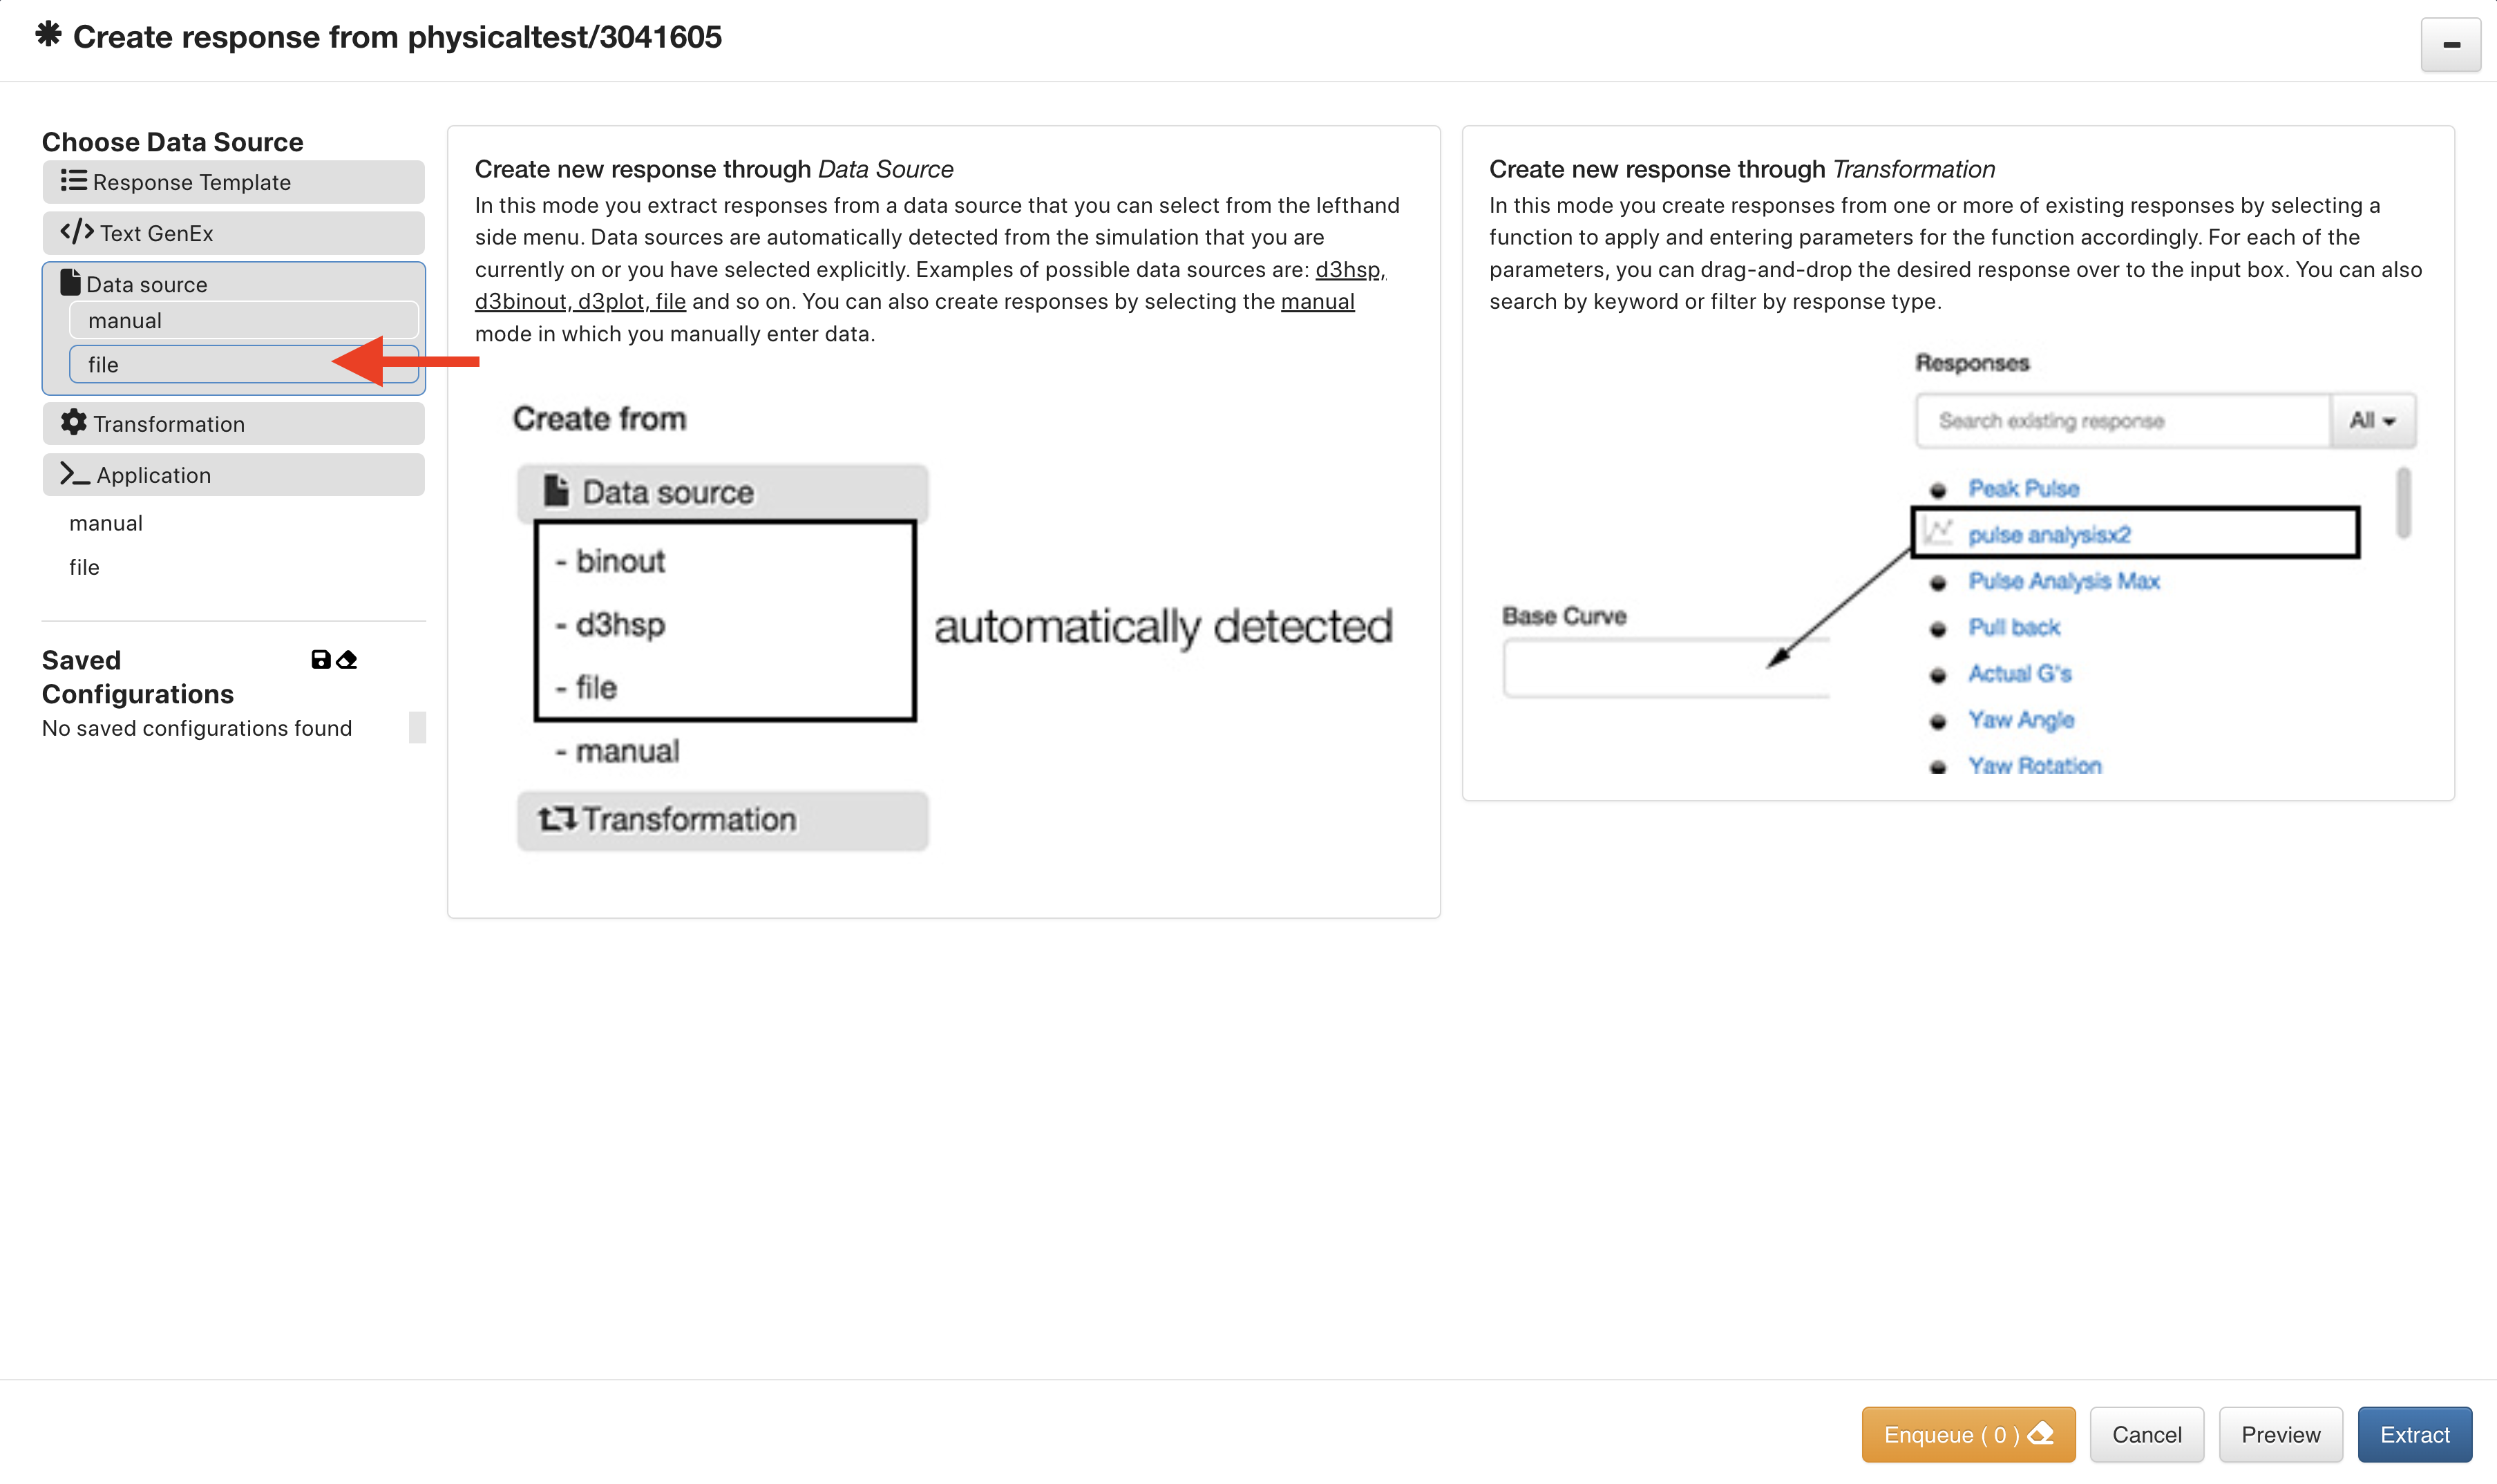
Figure 13: Choose Data Source > File
Name the response and choose which media file to extract from in the attachment drop-down.
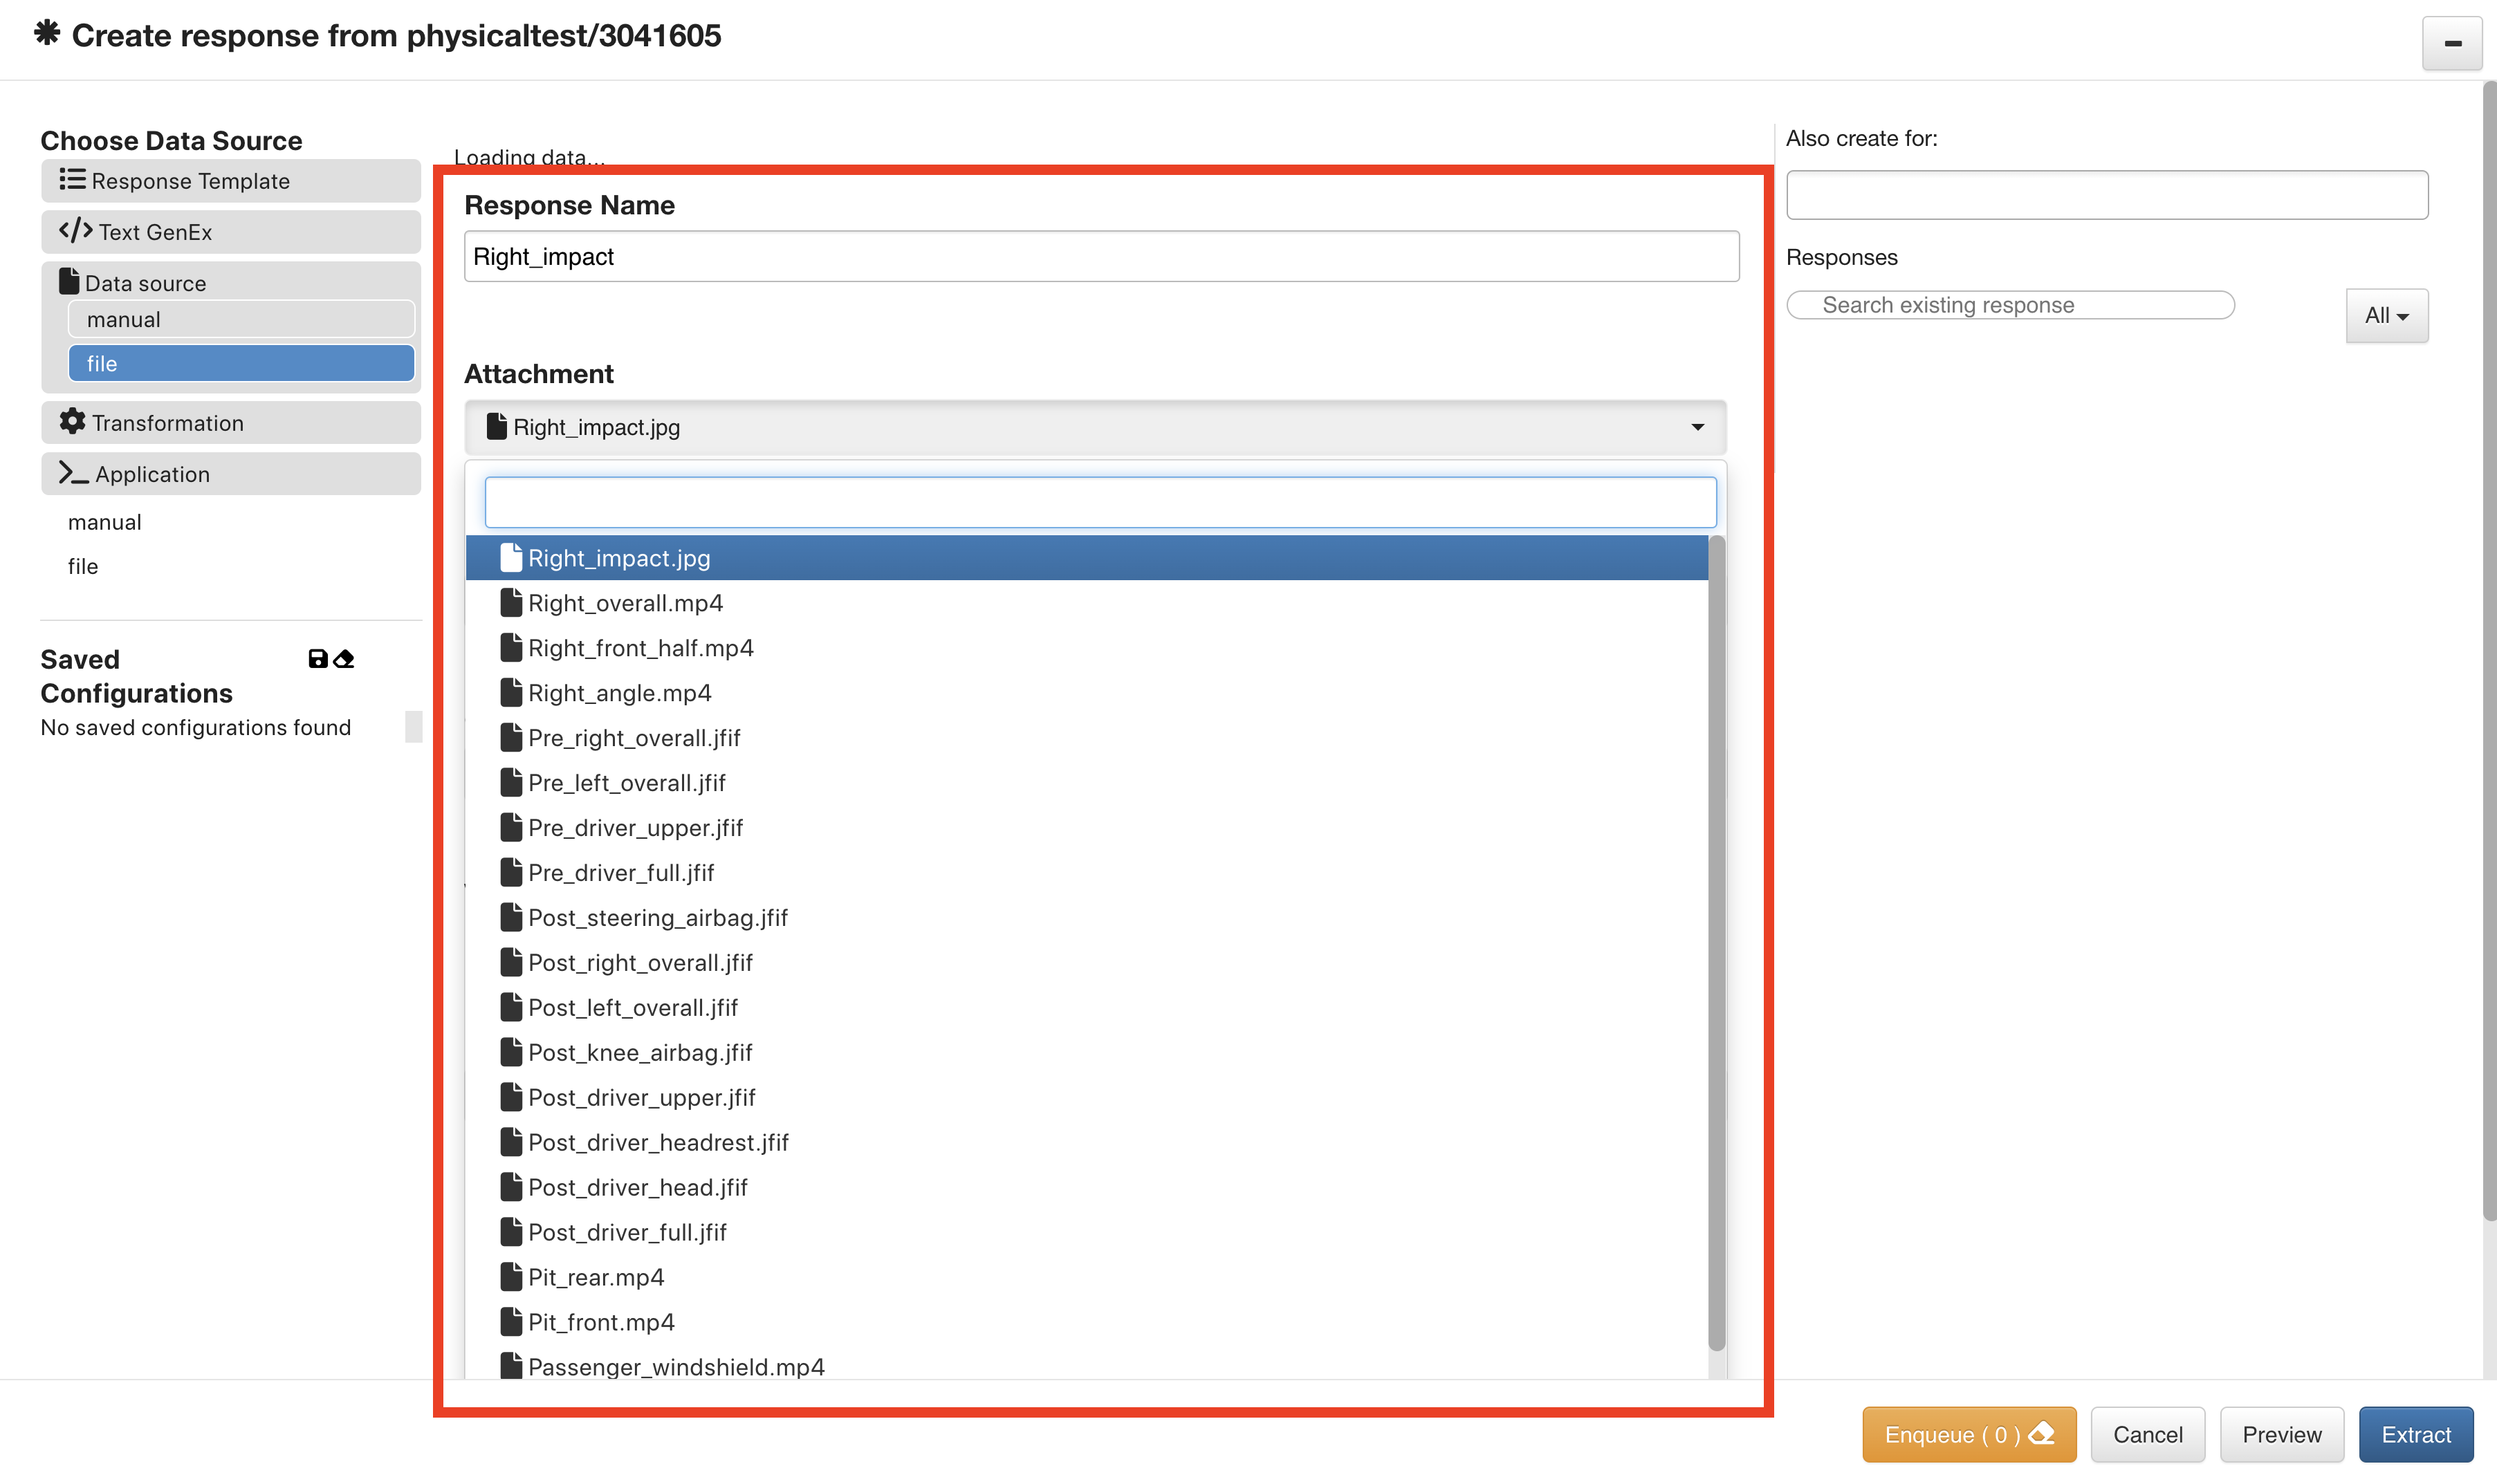
Figure 14: Specify Name and Choose Attachment
Under content type, specify the media file type. Here, we are extracting an image, but there are also other options such as EDP, LS-OPT and JS3D (Peacock 3D).
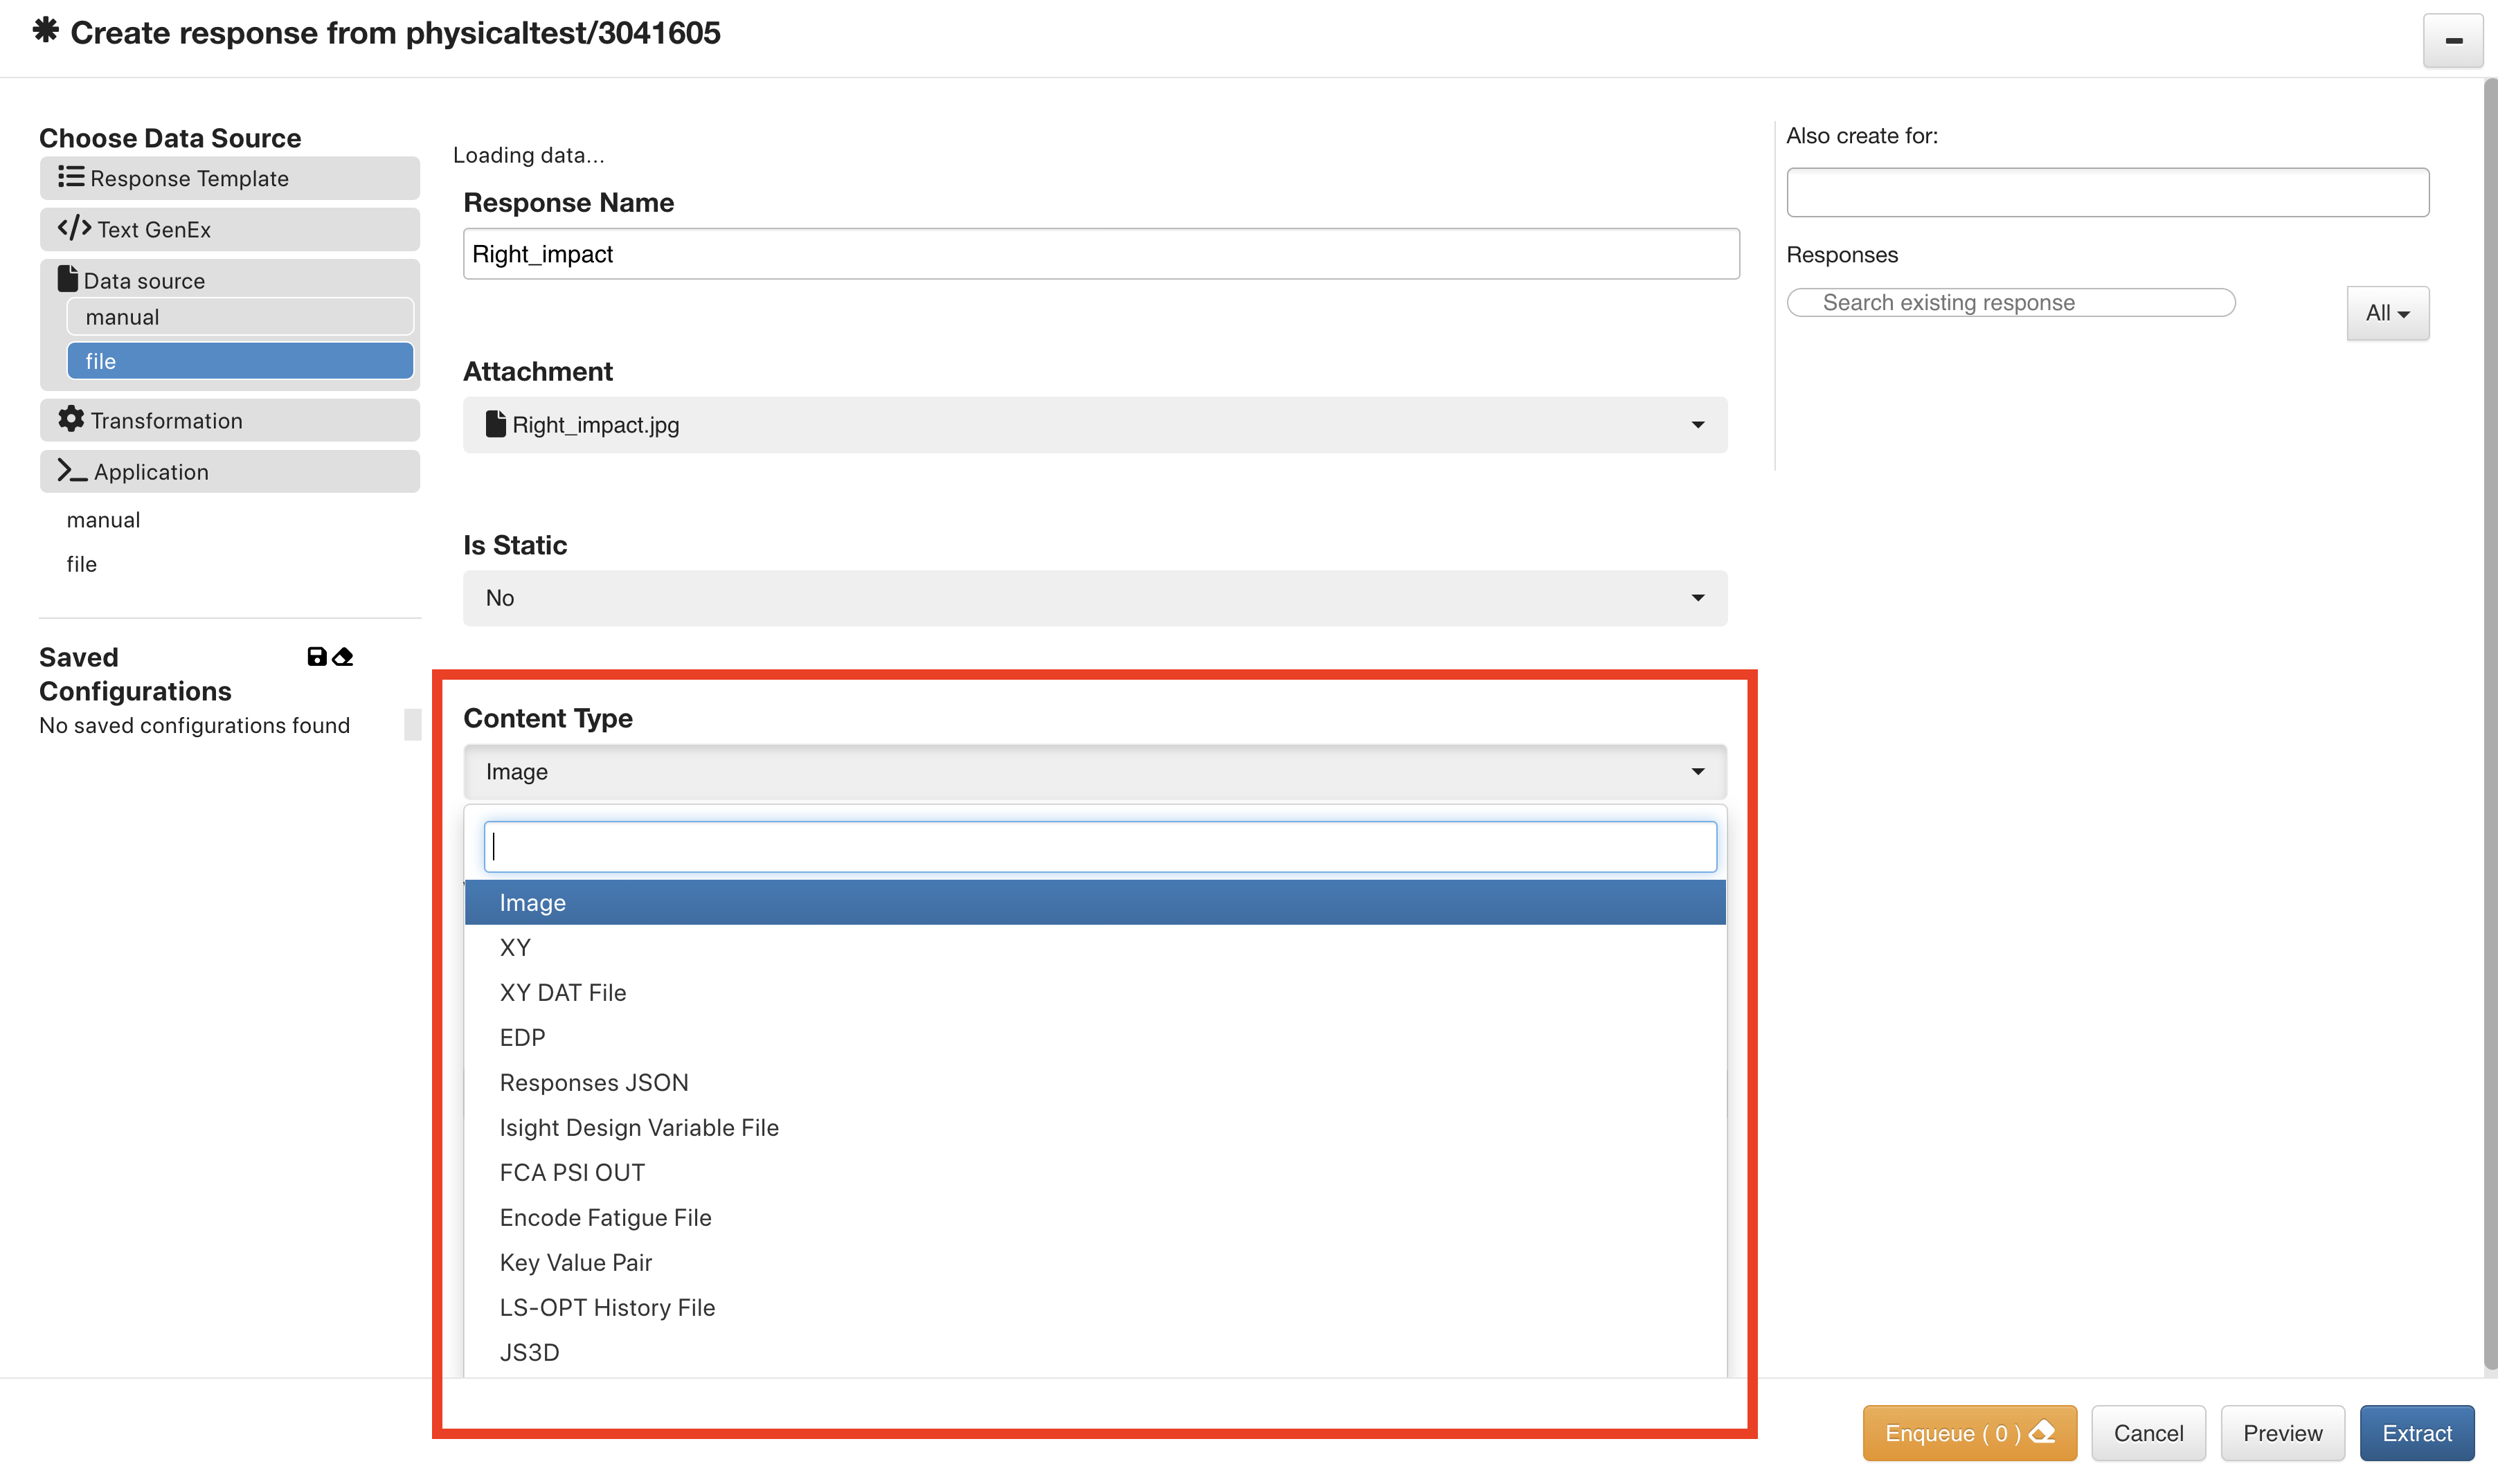
Figure 15: Specify Media File Type
Now, we can click Extract to officially add the image as a response.
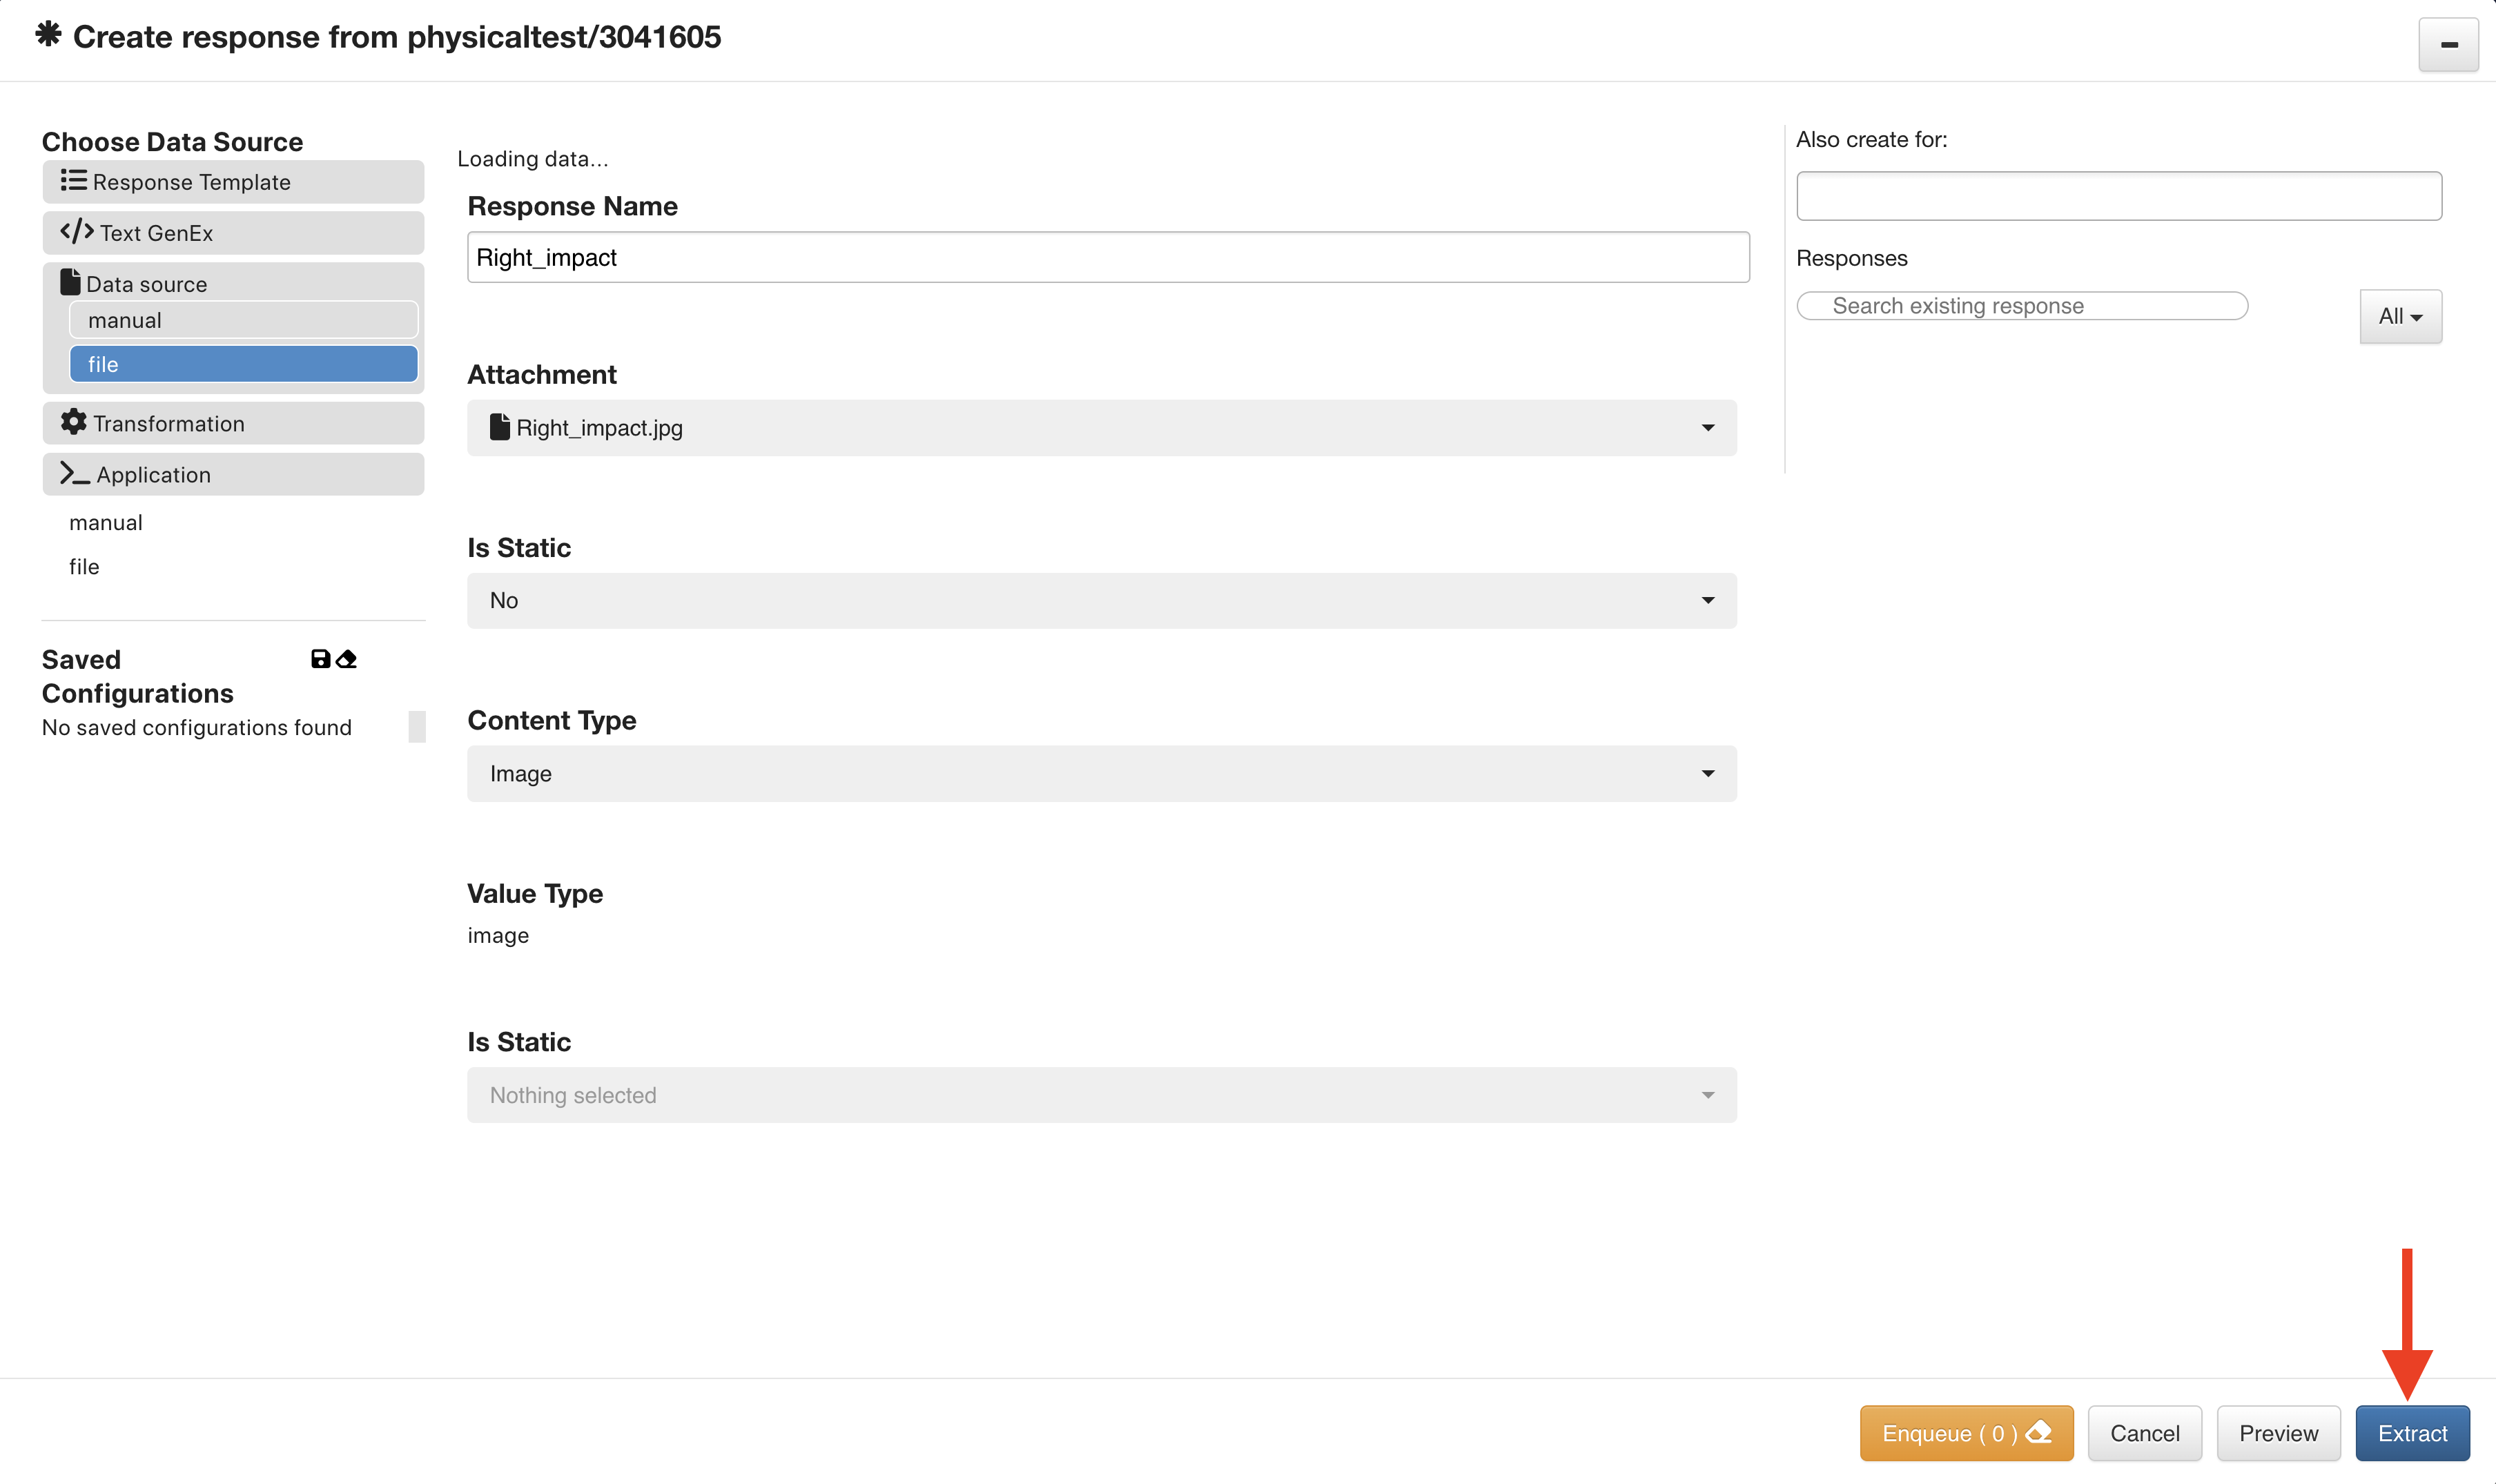
Figure 16: Specify Media File Type
Our new image response with appear as a response in the Response tab. Click Refresh if you do not see it initially).
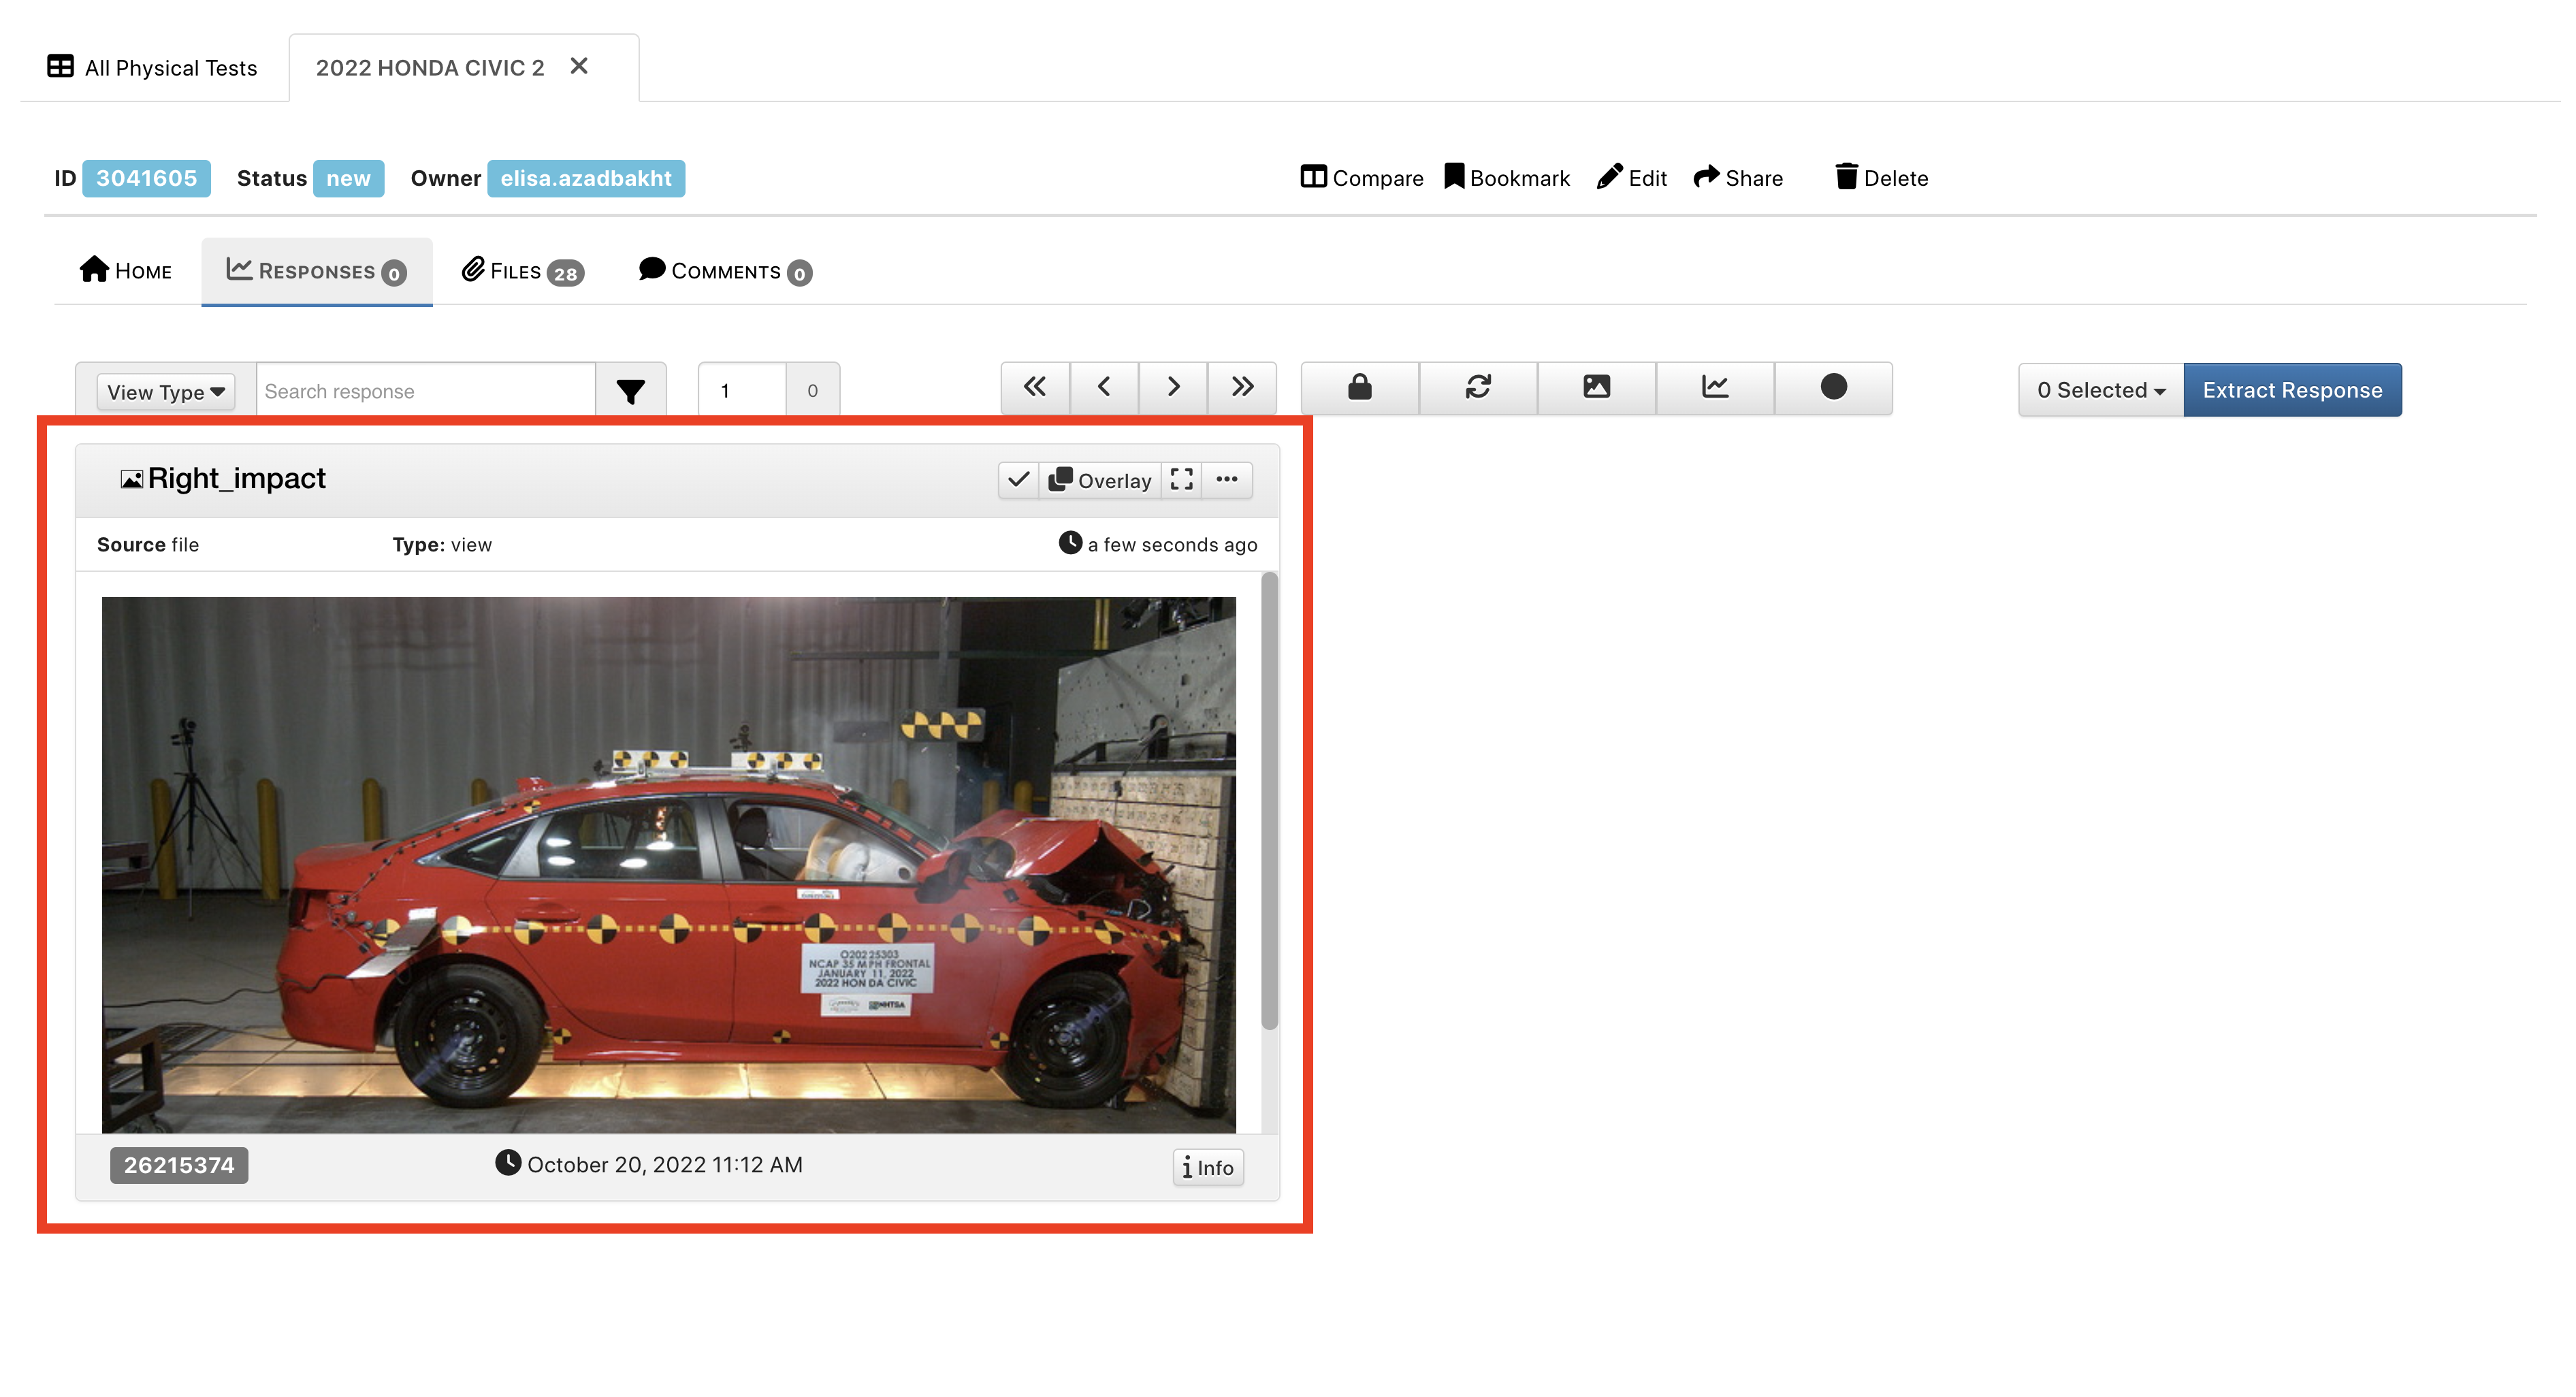
:sup:`Figure 17: New Extracted Image Response
9.4. Comparing Tests with other Records
The platform makes it easy to compare your physical tests with other records, including your simulations, through the Simlytiks visualization application. Start by clicking the check mark box next to a test to select it. Select as many as you would like to compare, and then click “Compare Responses” under the “Selected” drop-down menu or under the right-click menu.
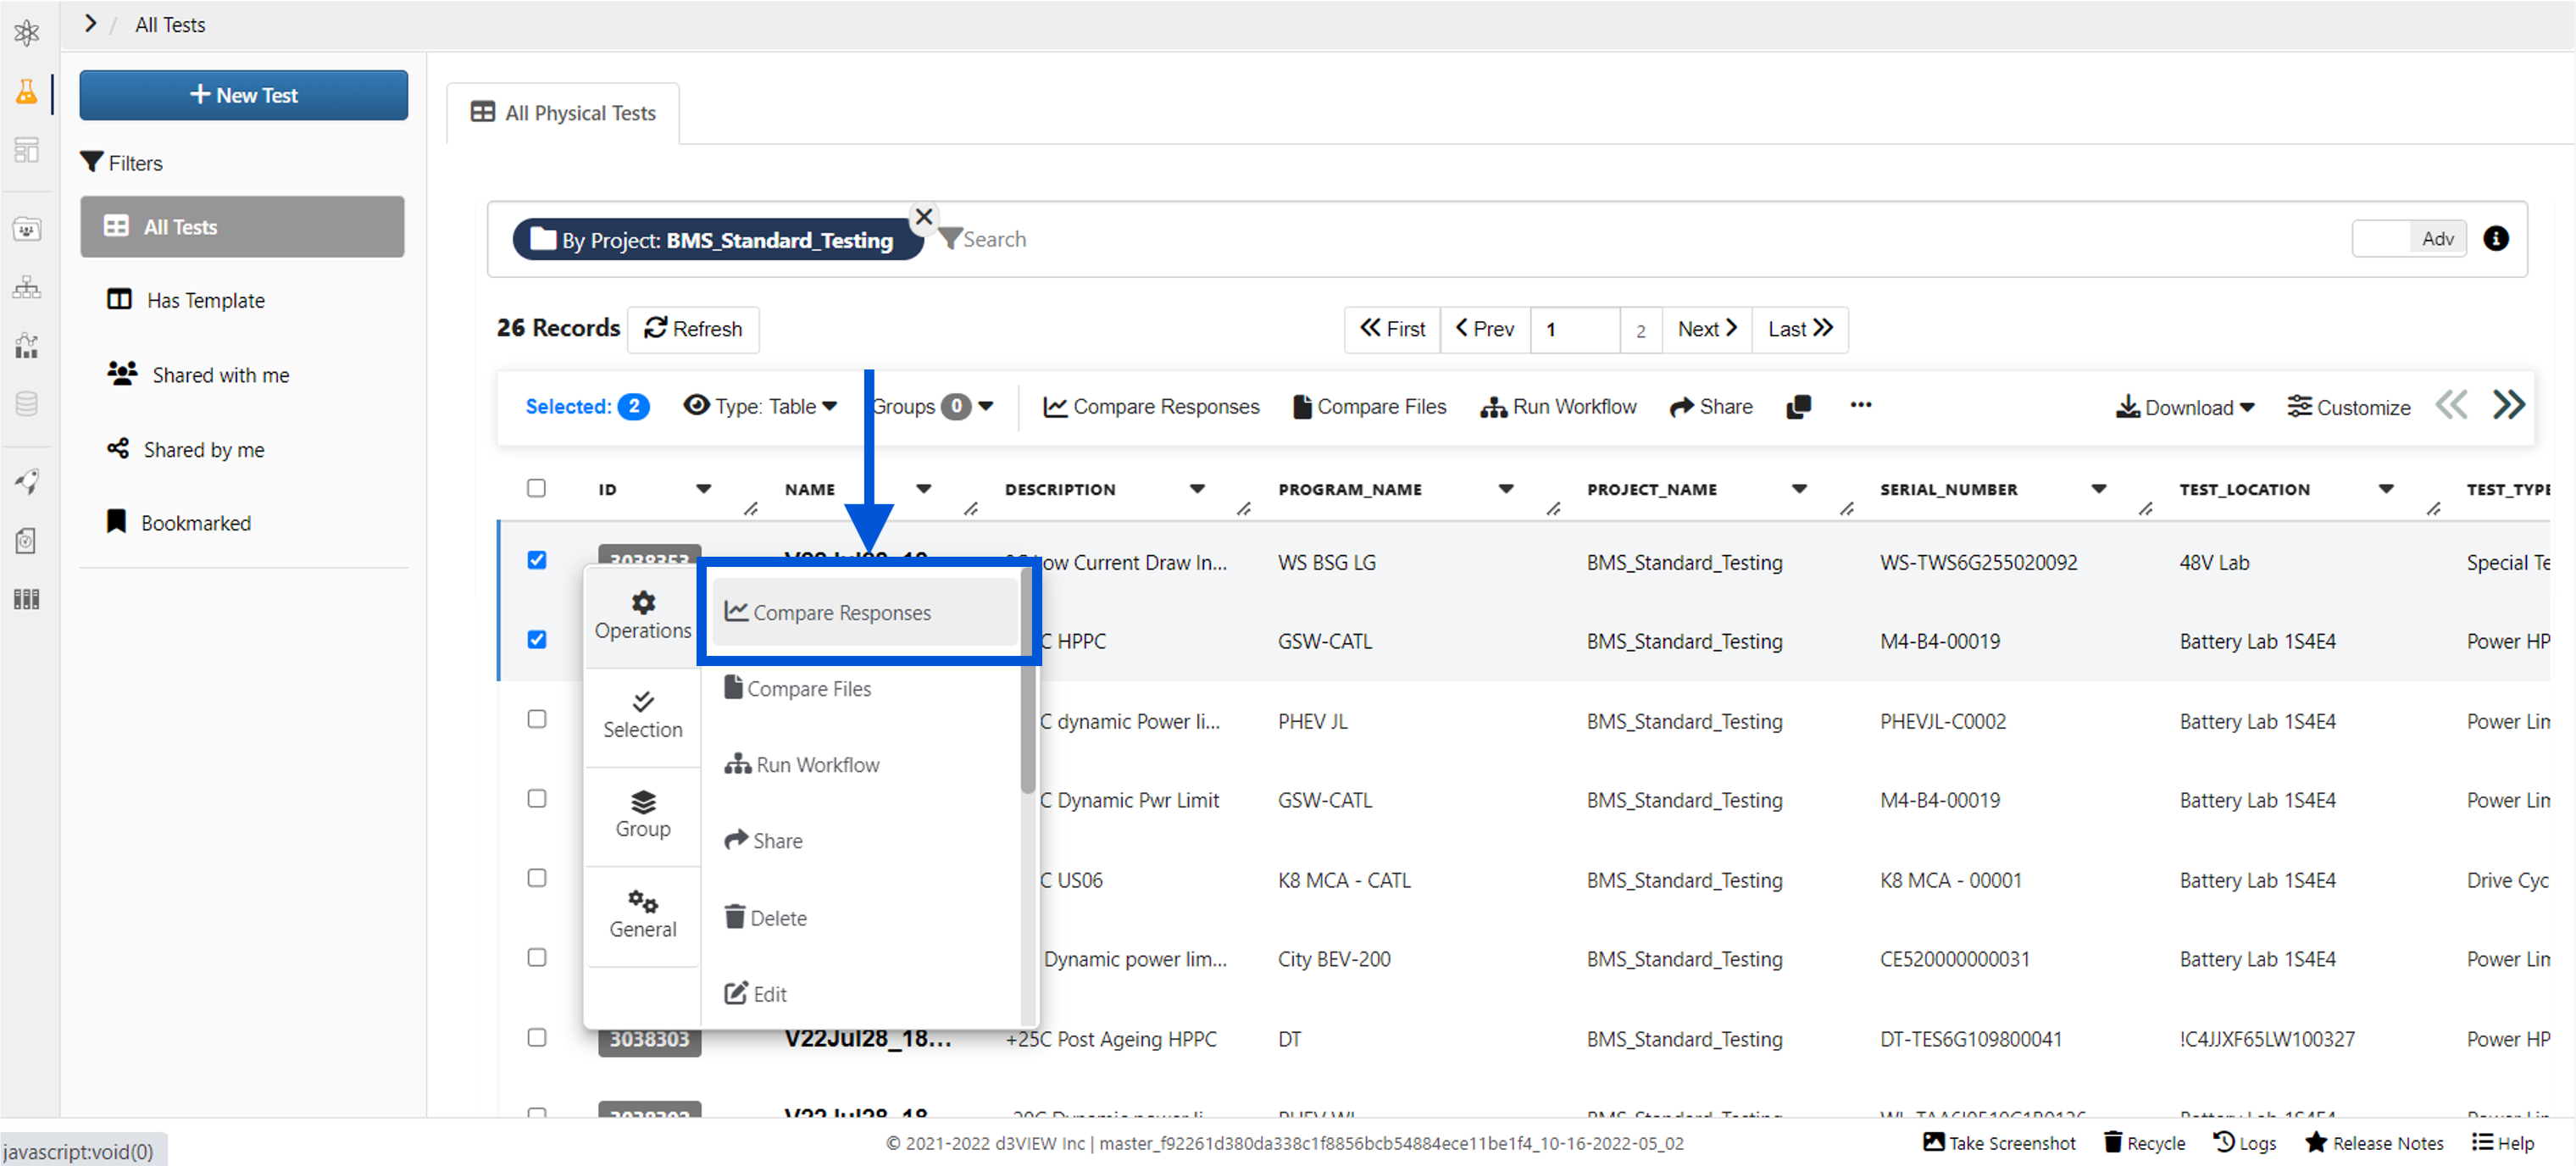
Figure 1: Compare Physical Test Responses
You can also start with a simulation. On the simulations home page, select the simulation(s) and continue similarly by clicking “Compare Responses” under the “Selected” drop-down menu or under the right-click menu.
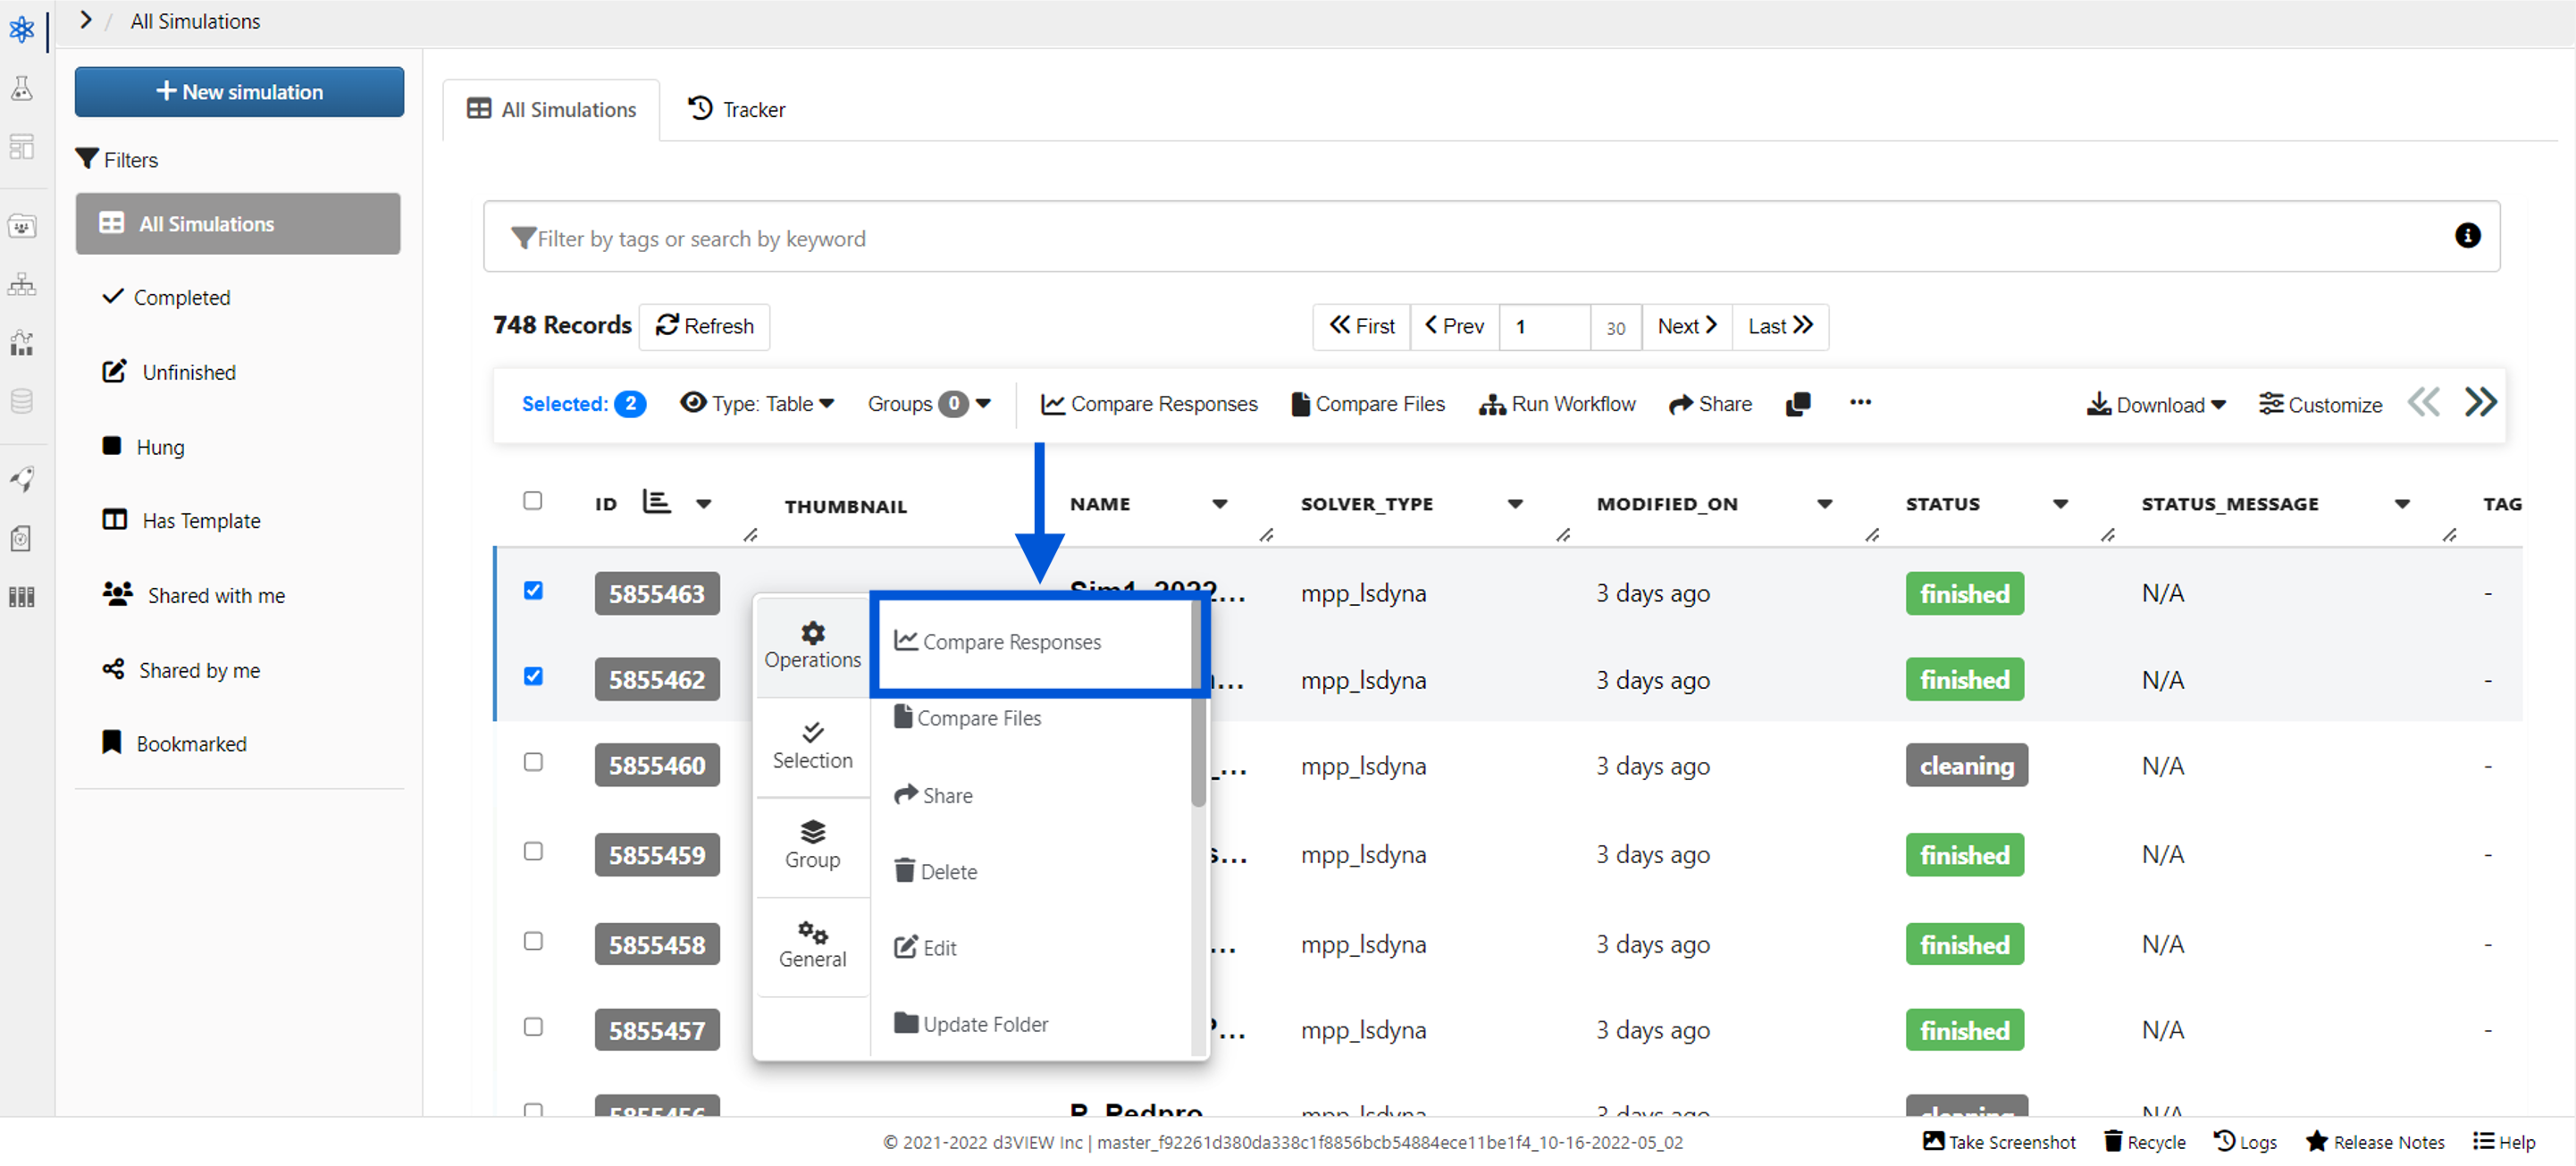
Figure 2: Compare Simulation Responses
Once the window pops up, click “Add Records” at the top to search for and add more records to compare.
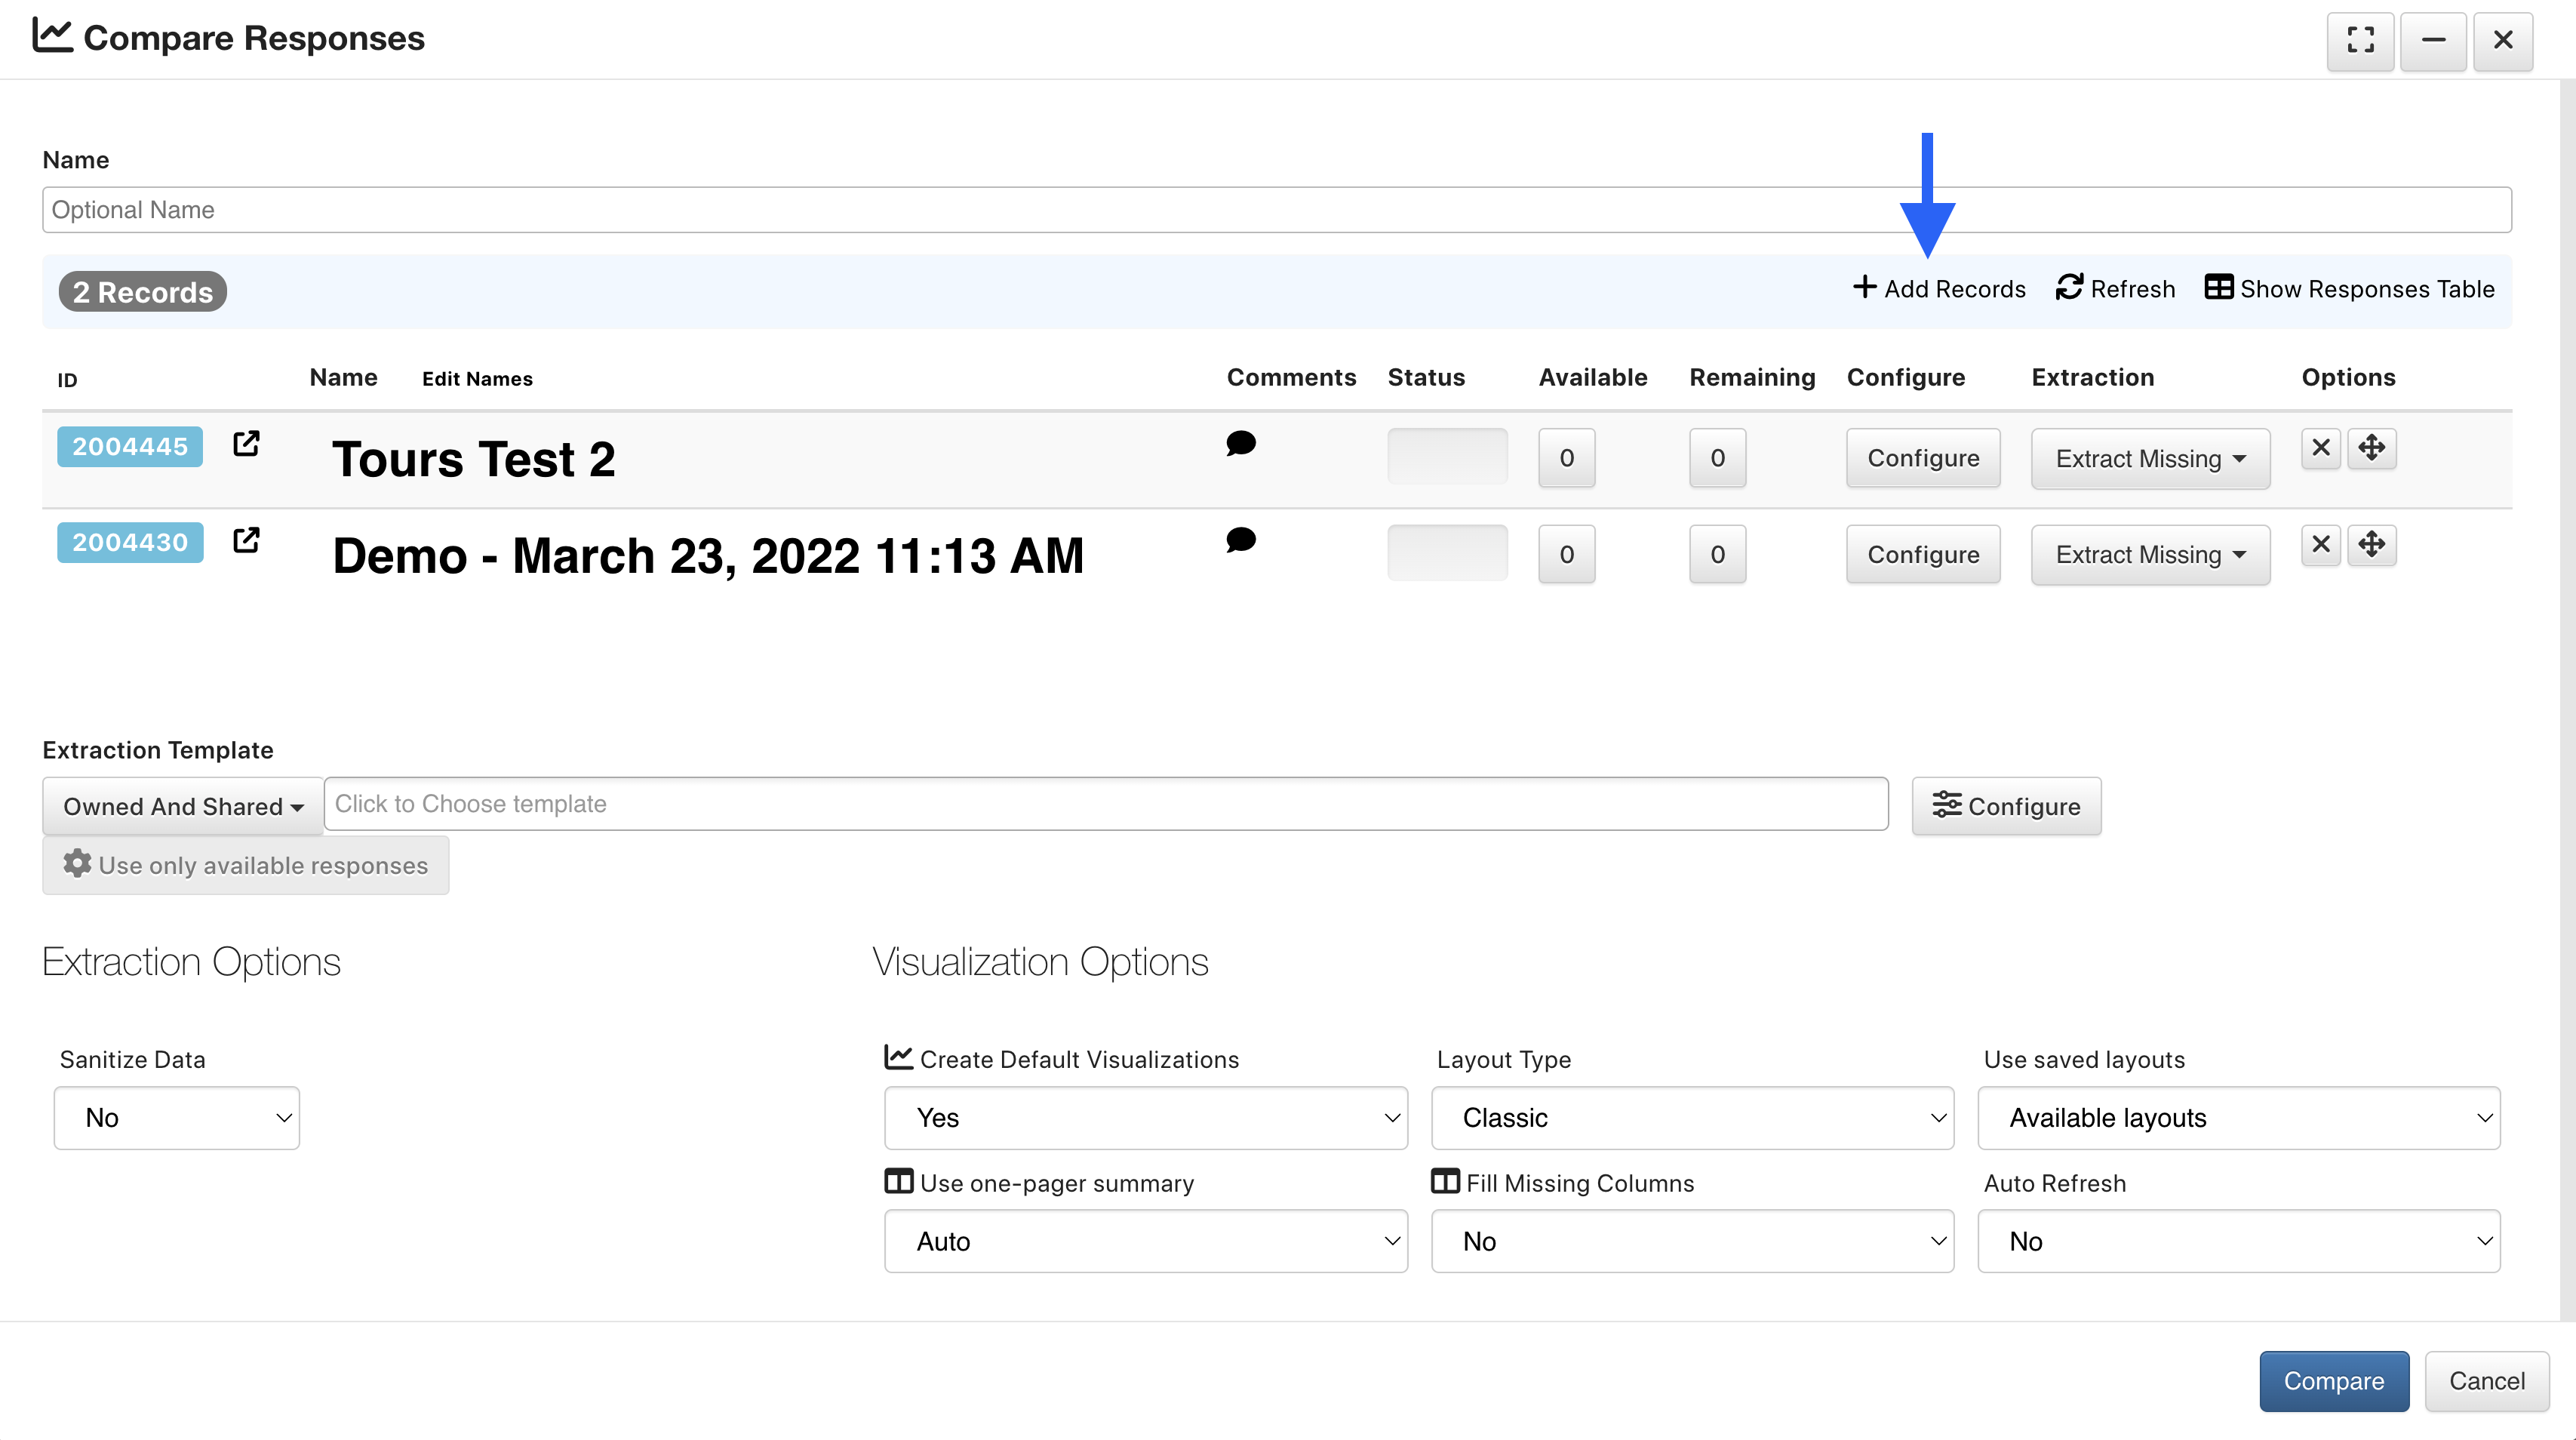
Figure 3: Add More Records Button
Then, use the drop-down menu to switch between your physical tests and simulations (1). All your separate records for the particular chosen section will be shown on the list (2) to the left. Click the “Select” (3) button next to a particular record to add or drag it to the “Selected” list (4) to the right. Click “Done Adding” (5) once you’ve chosen all your responses.
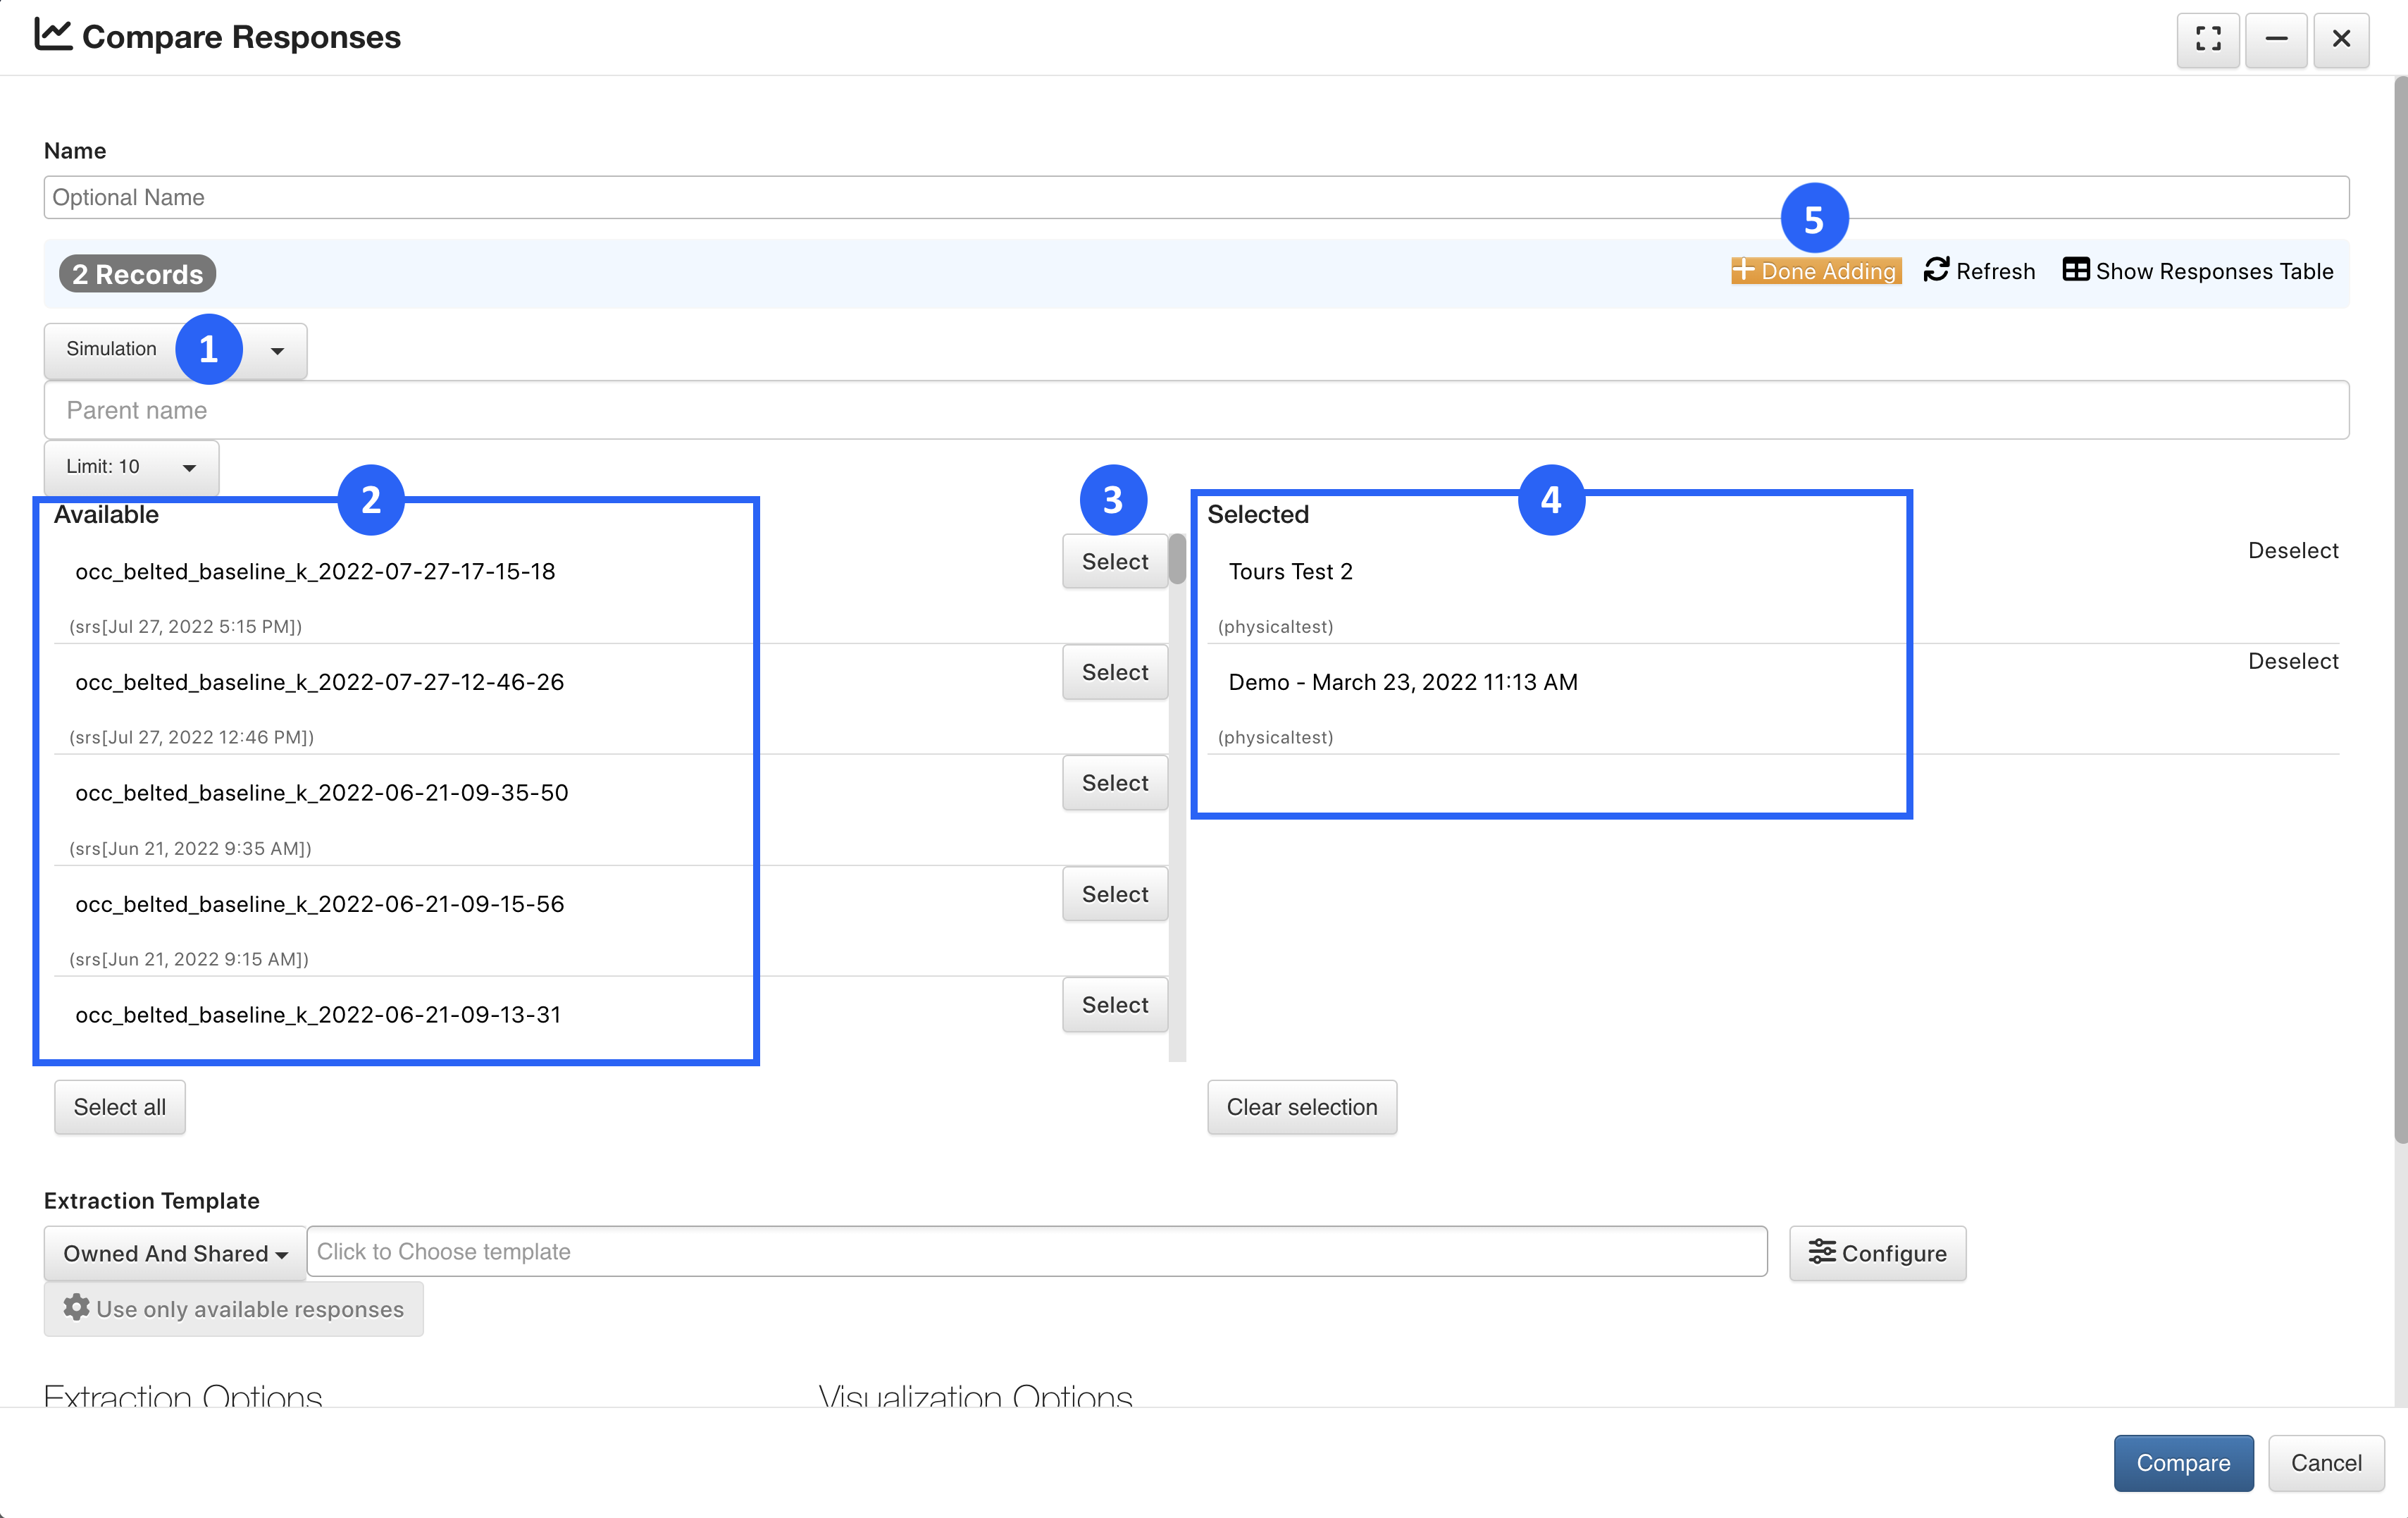
Figure 4: Search for and Add Records
Make sure to choose any corresponding templates (1). Then, click on the “Compare” (2) button at the bottom to open the records in the Simlytiks application.
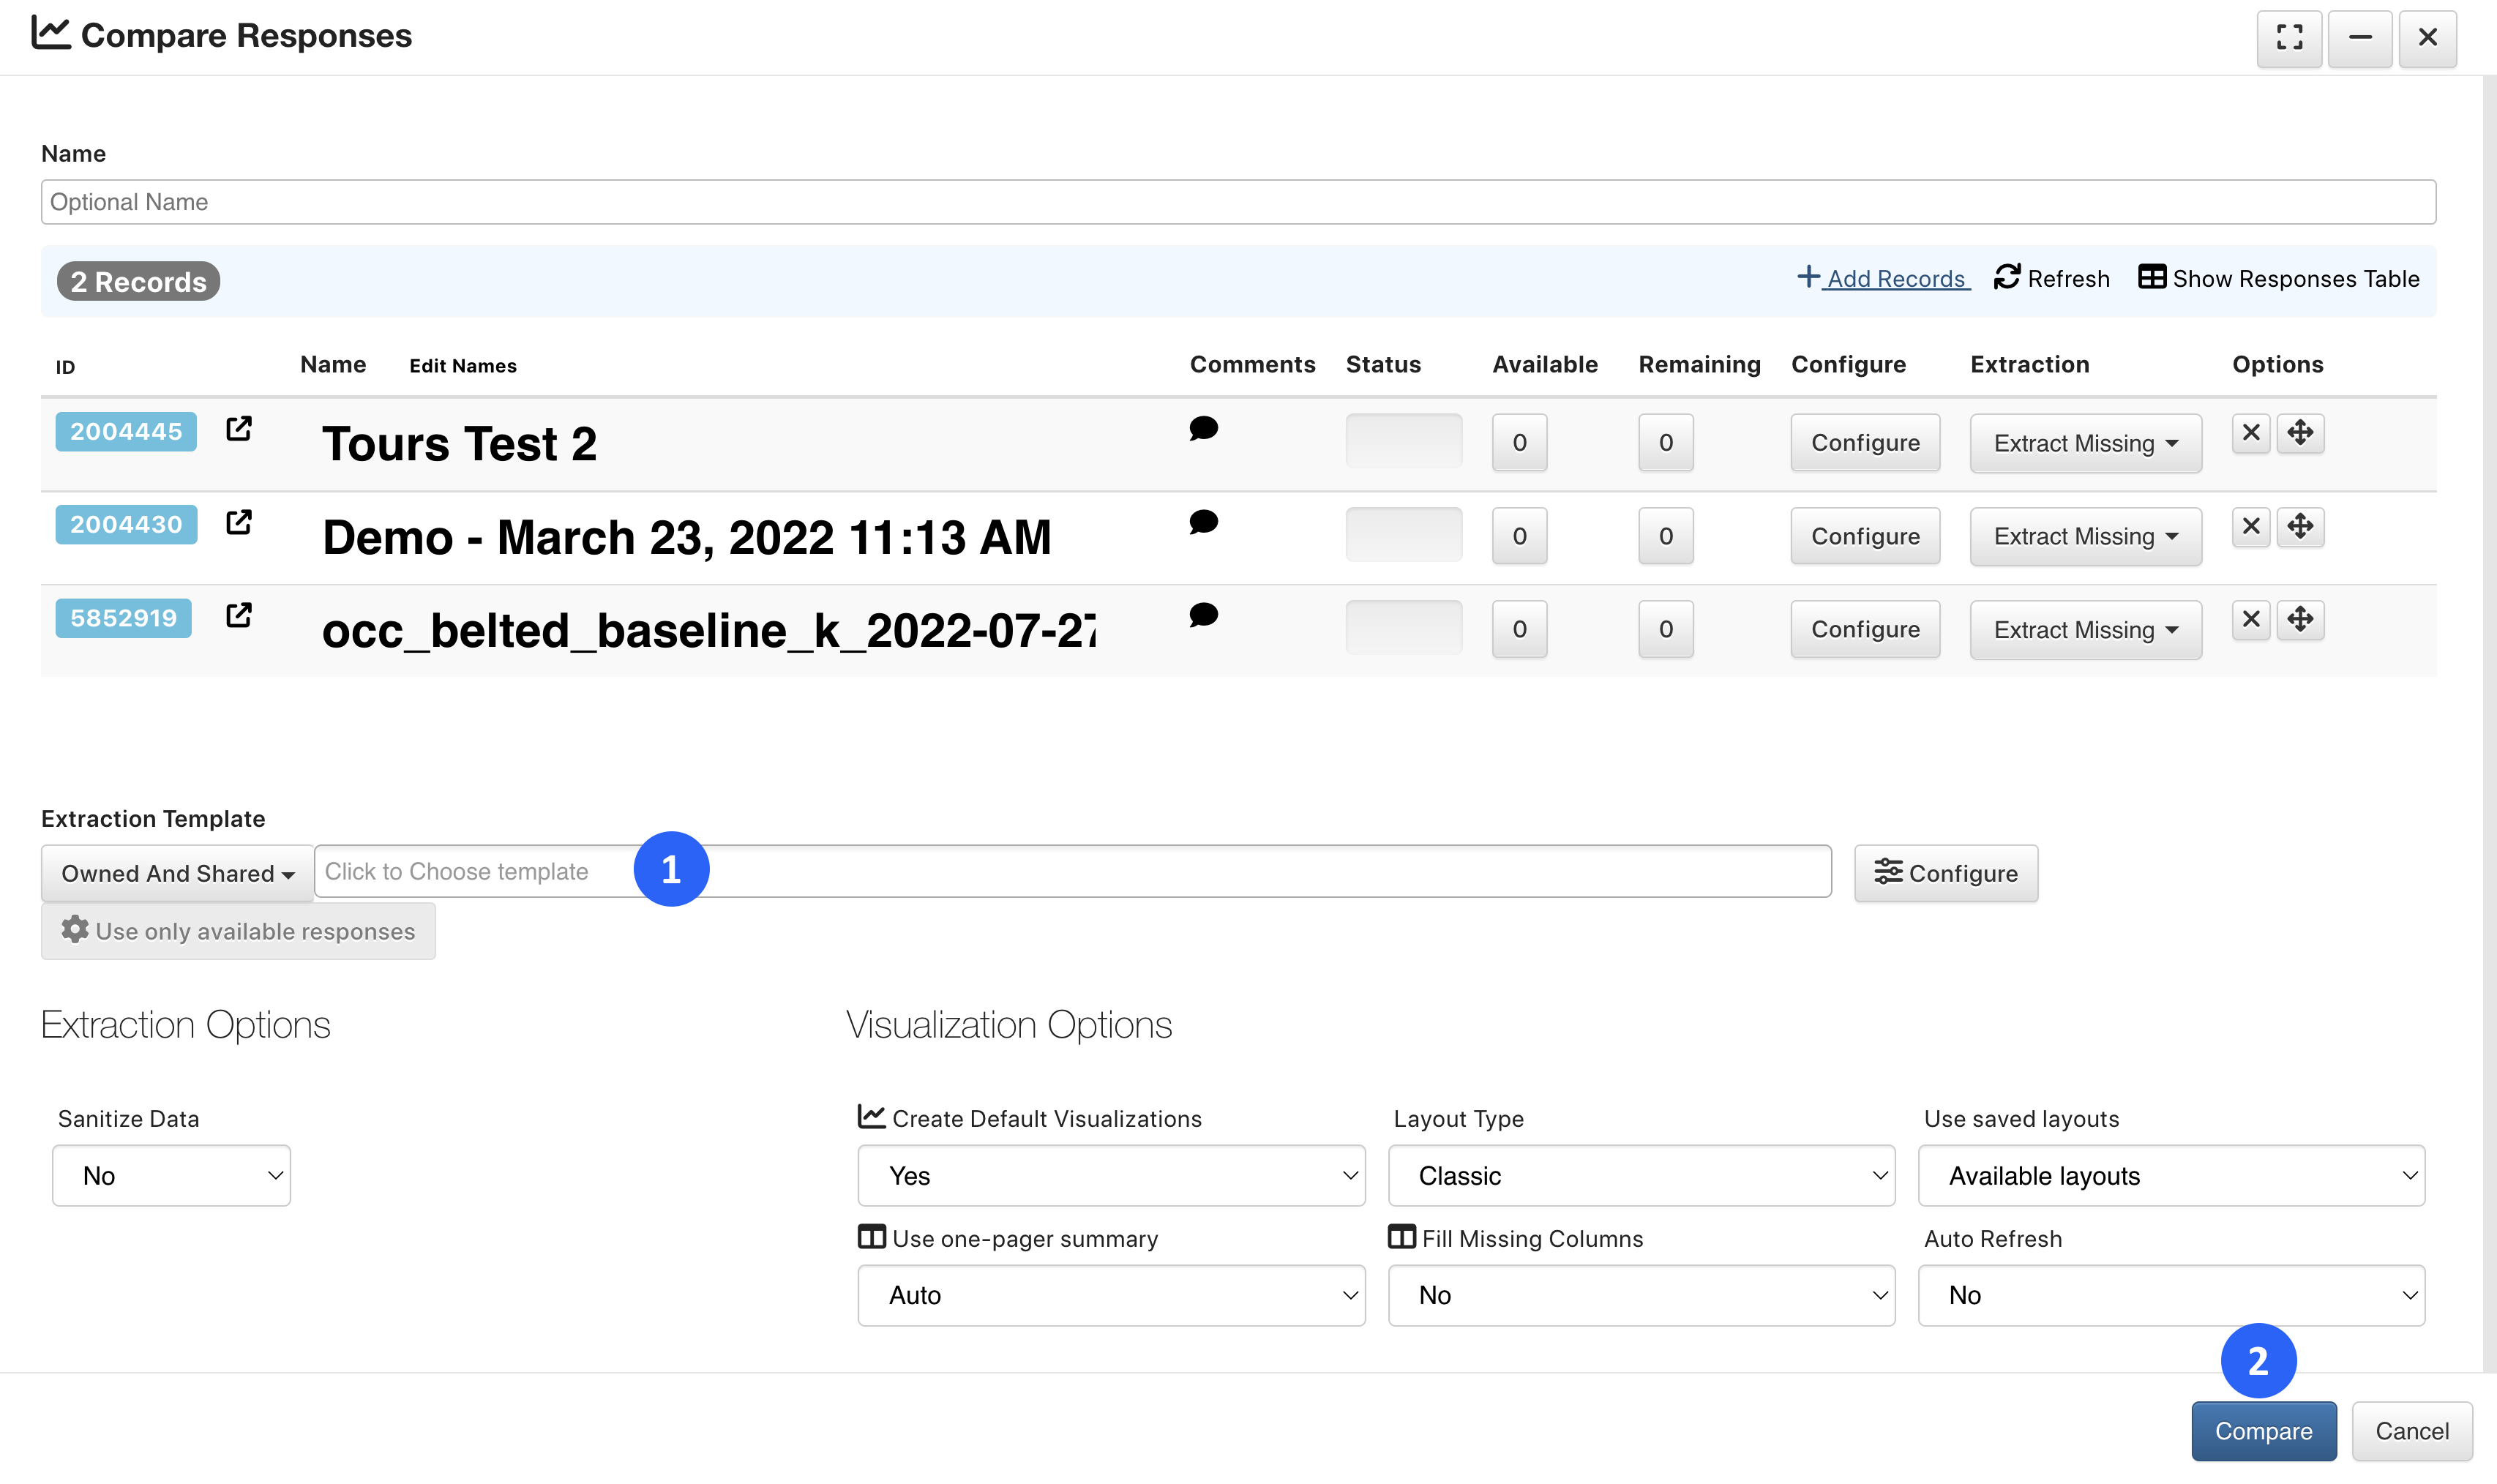
Figure 5: Process Records for Comparison
Here, you can visualize aspects of the records for comparison. Please see the Simlytiks section to better understand how to visualize your records.
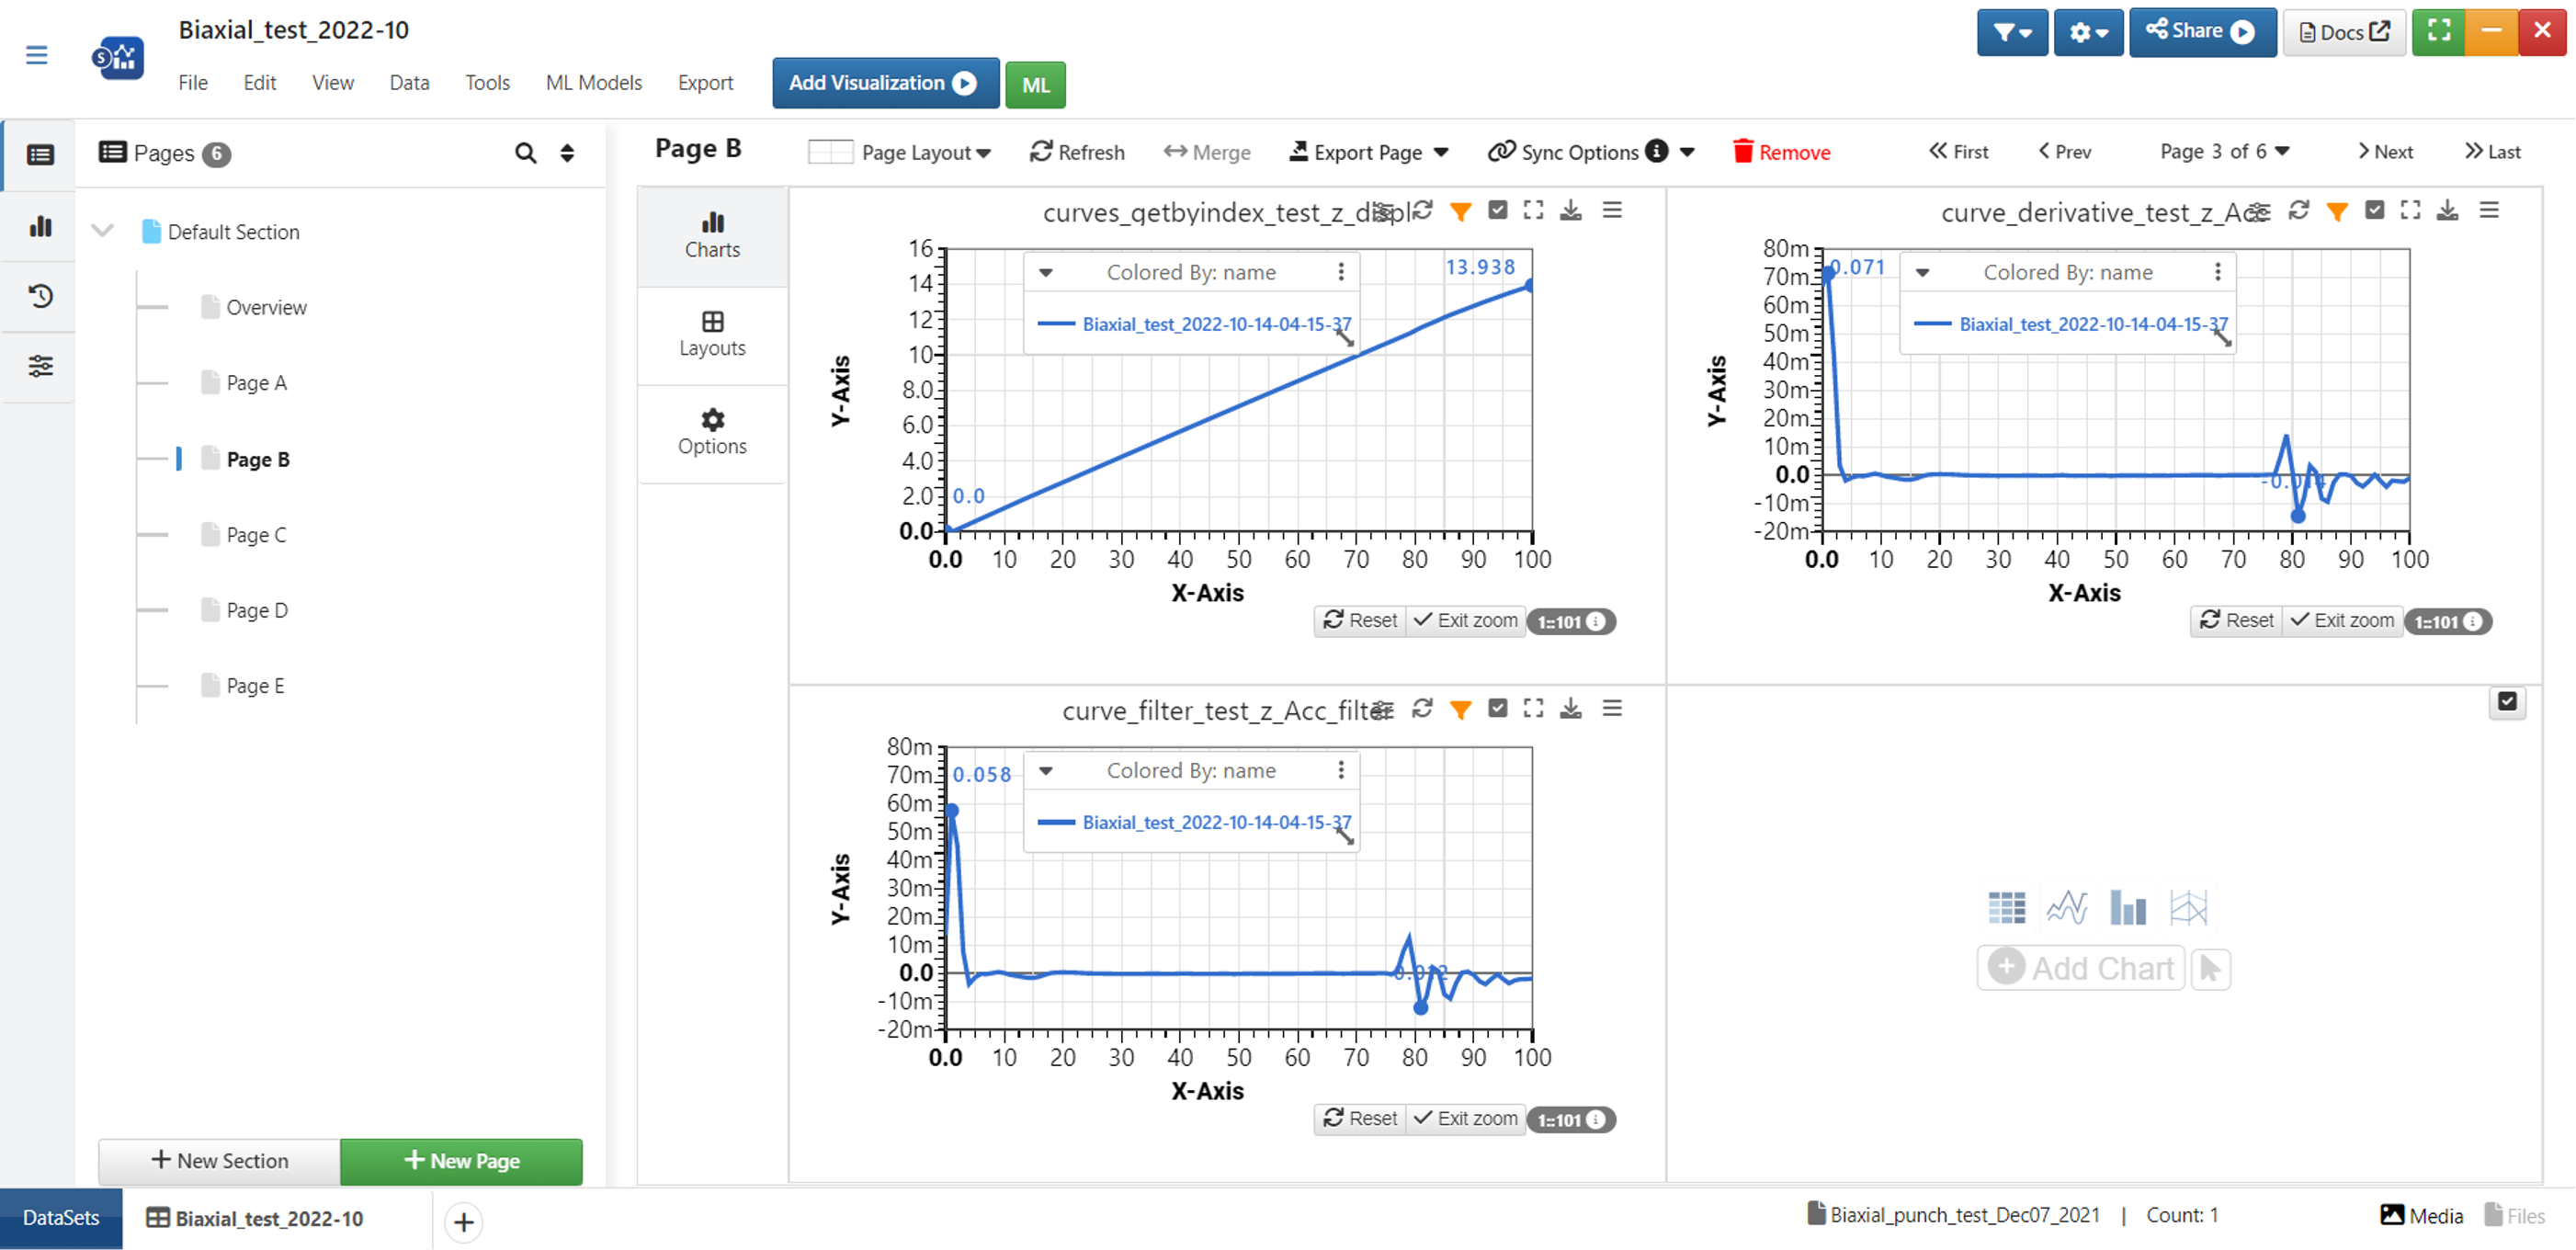
Figure 6: Visualize Records in Simlytiks
New as of June 1, 2002, you can turn on record view for Simlytiks Pivot Table visualizer by enabling the Link Cells to Tests/Simulations option.
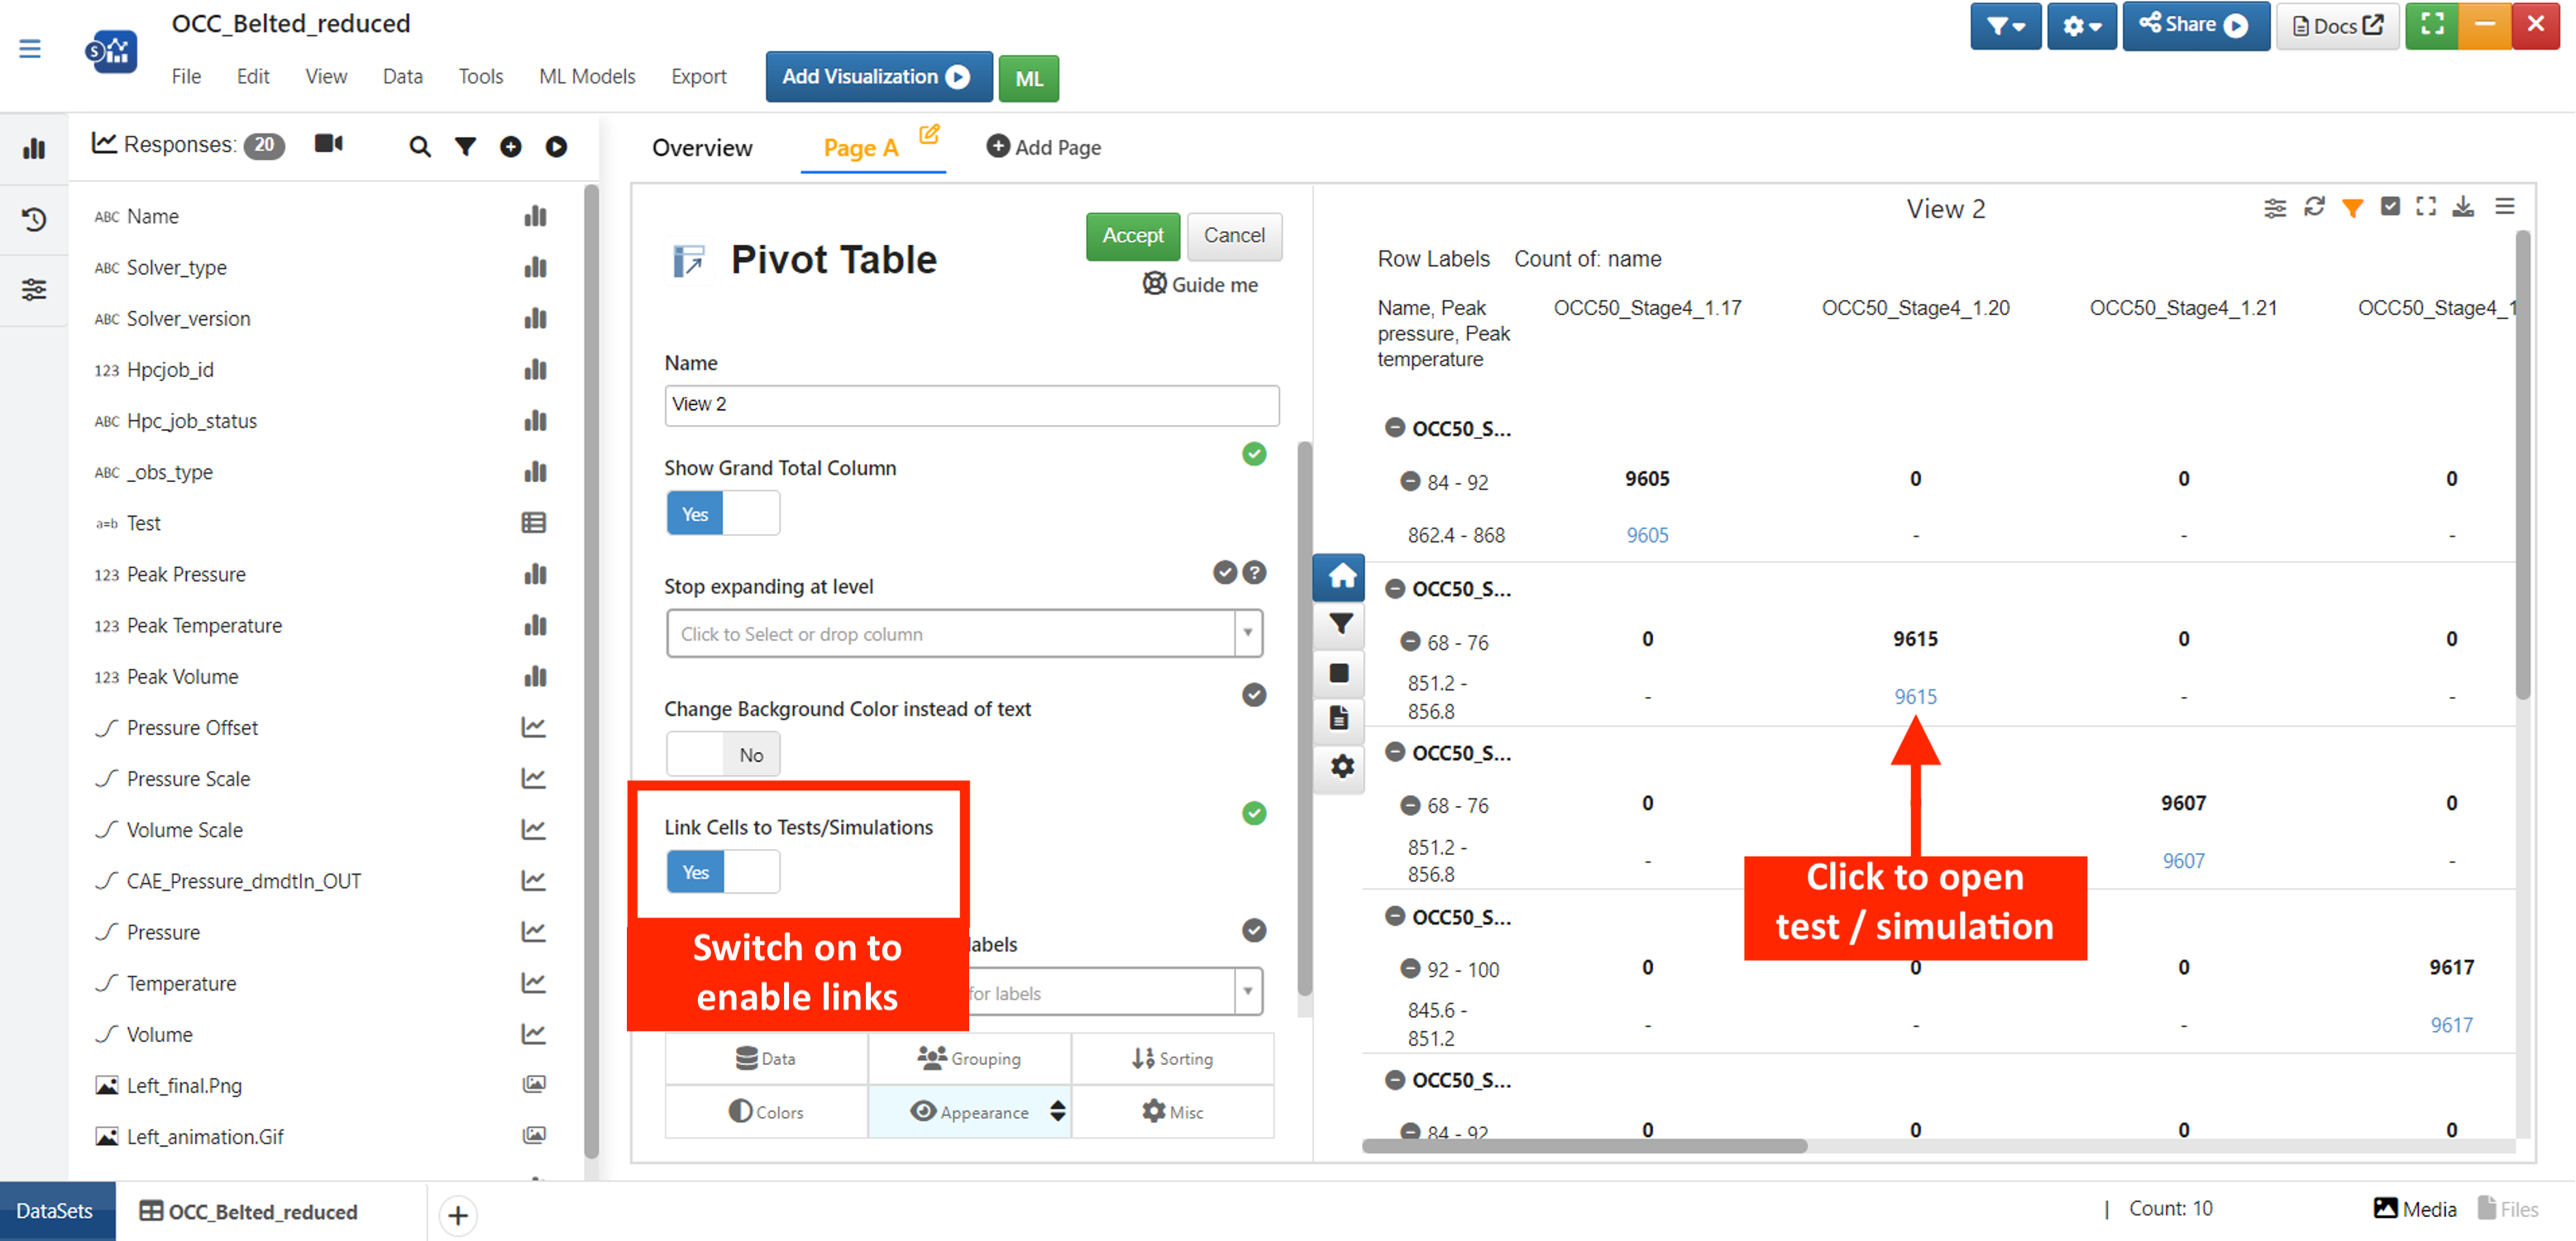
Figure 7: Link Simulation/Test Records
One pager curve responses in Simlytiks now have a default color By to be ‘name’ if the Dataset has a name column.
9.5. Insert to Database
We can now insert one row or multiple rows of Physical tests to Databases and map the responses from the tests to the Databases fields.
The first source will be pre selected in the Mapper modal while inserting Physical test records to database.
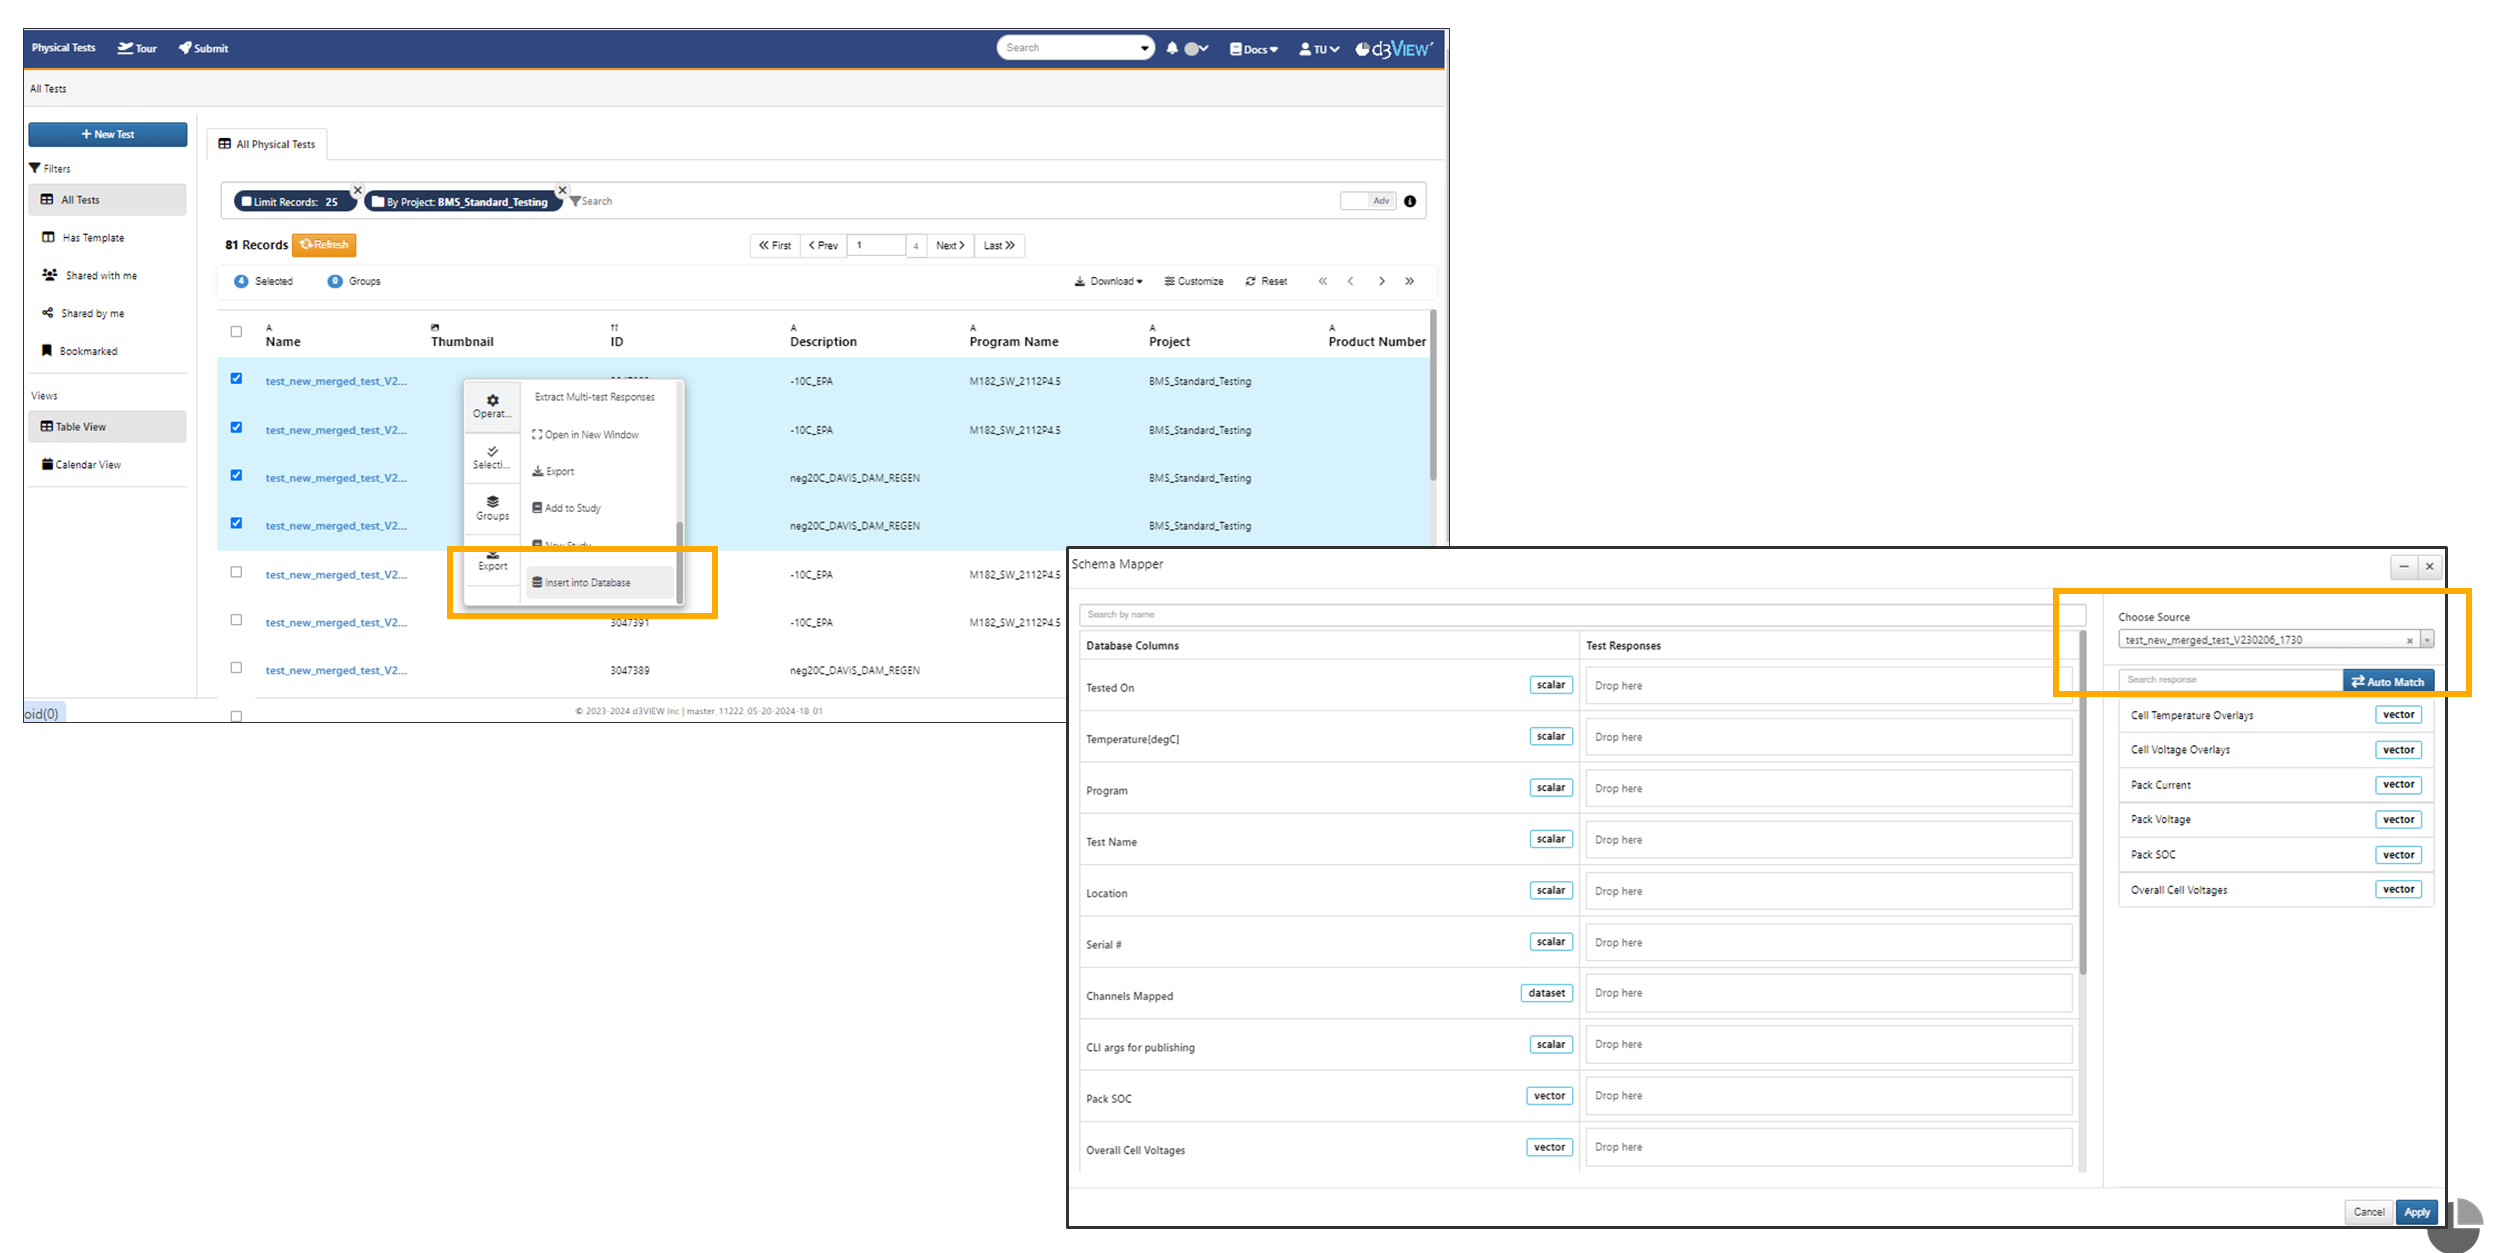
Mapper
The responses can be dragged and dropped on to the Database fields from Physical tests while inserting records to database.
Auto match in schema mapper will map the responses and displays the mapped labels in the input fields.
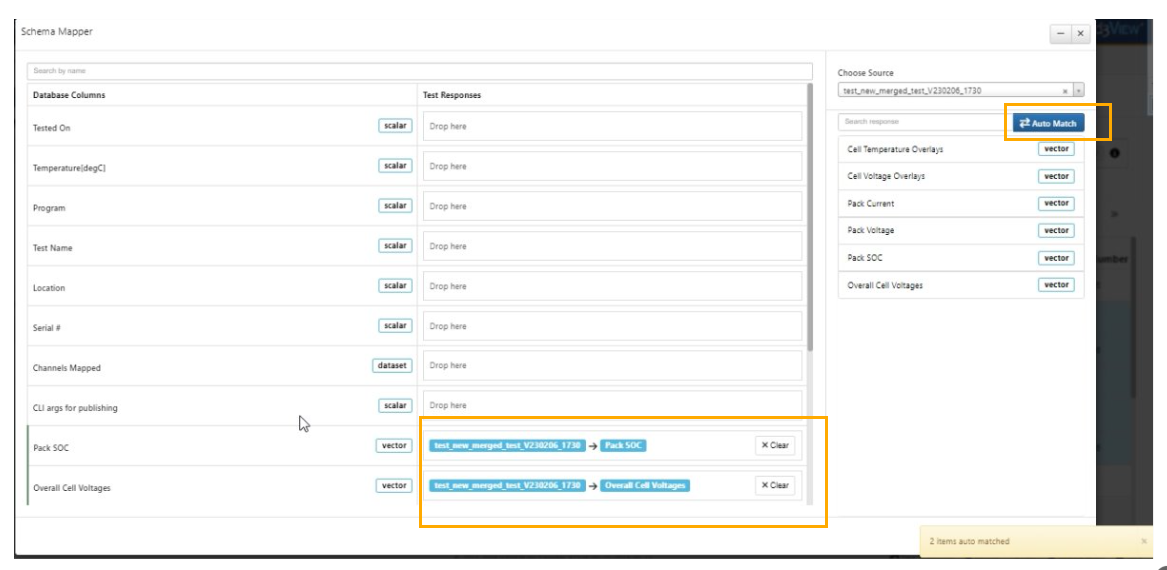
Auto match
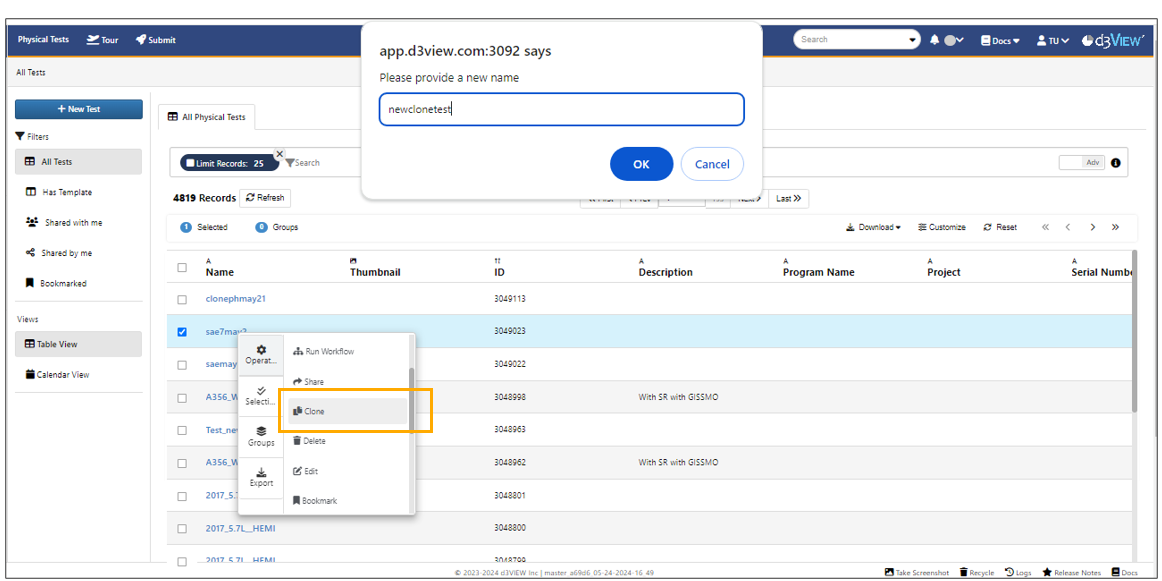
9.7. Edit
Edit Physical test now supports adding/editing projects with filters.
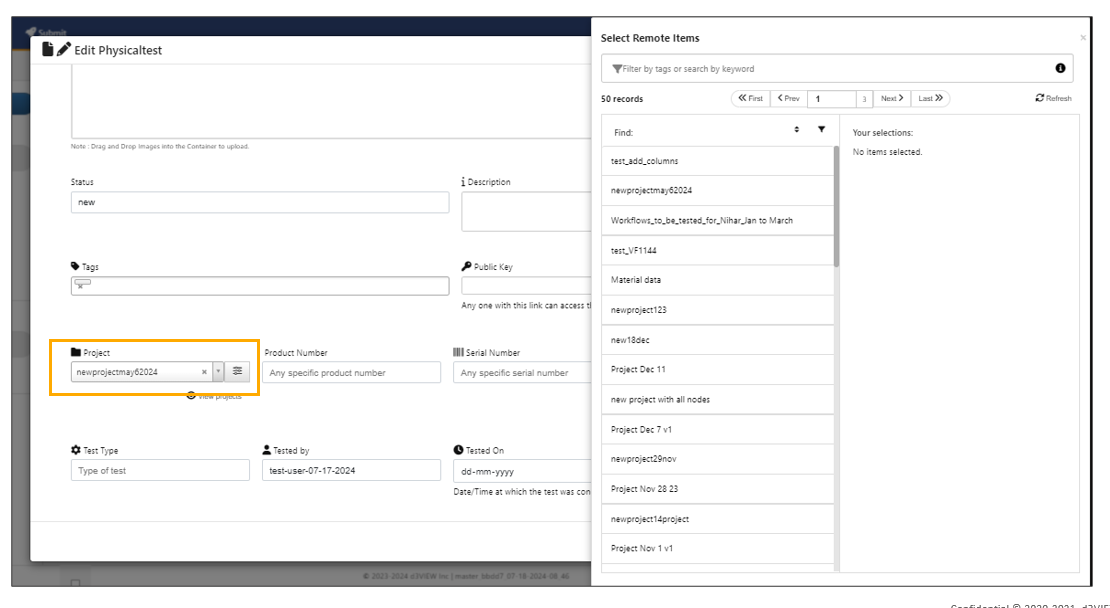
Editing Projects
Edit Physicaltest supports filter based selections for projects.
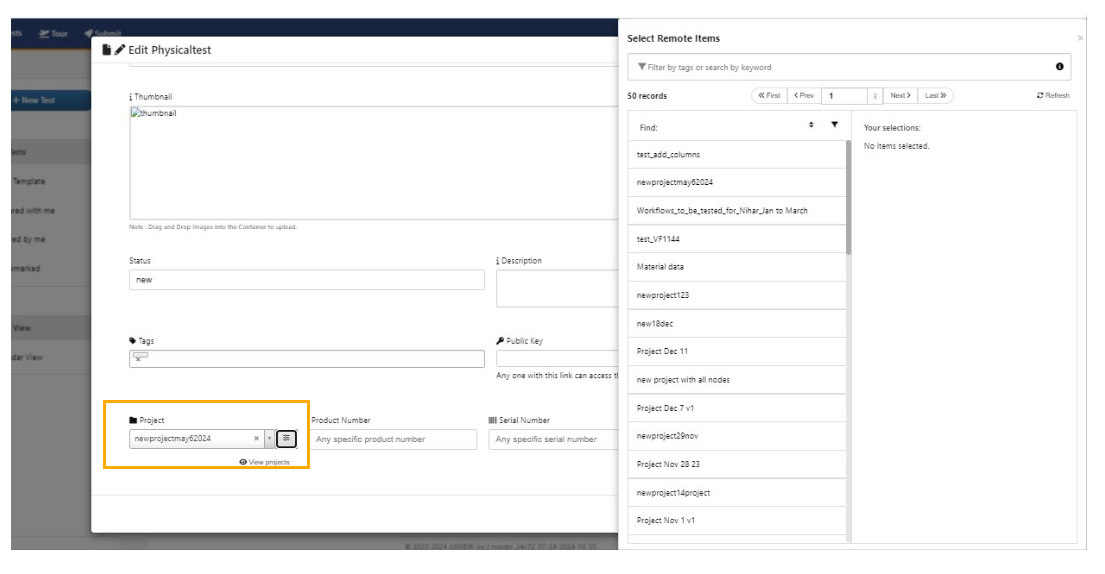
Filter based selections
In the Physical Tests Homepage, enabling Reset for the data table also resets the filters that were set earlier.
9.8. Columns
New columns called Test Software and Test Hardware added with icons to Physical tests.
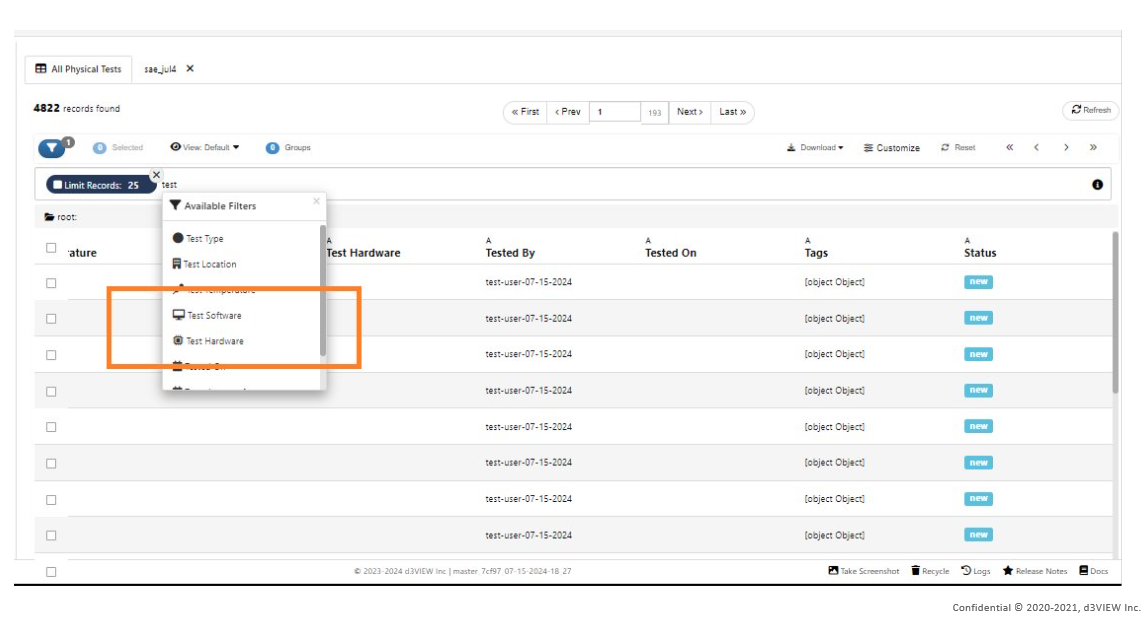
Test Software and Test Hardware
System Model ID is now included in filters and table columns under Physical Tests application.
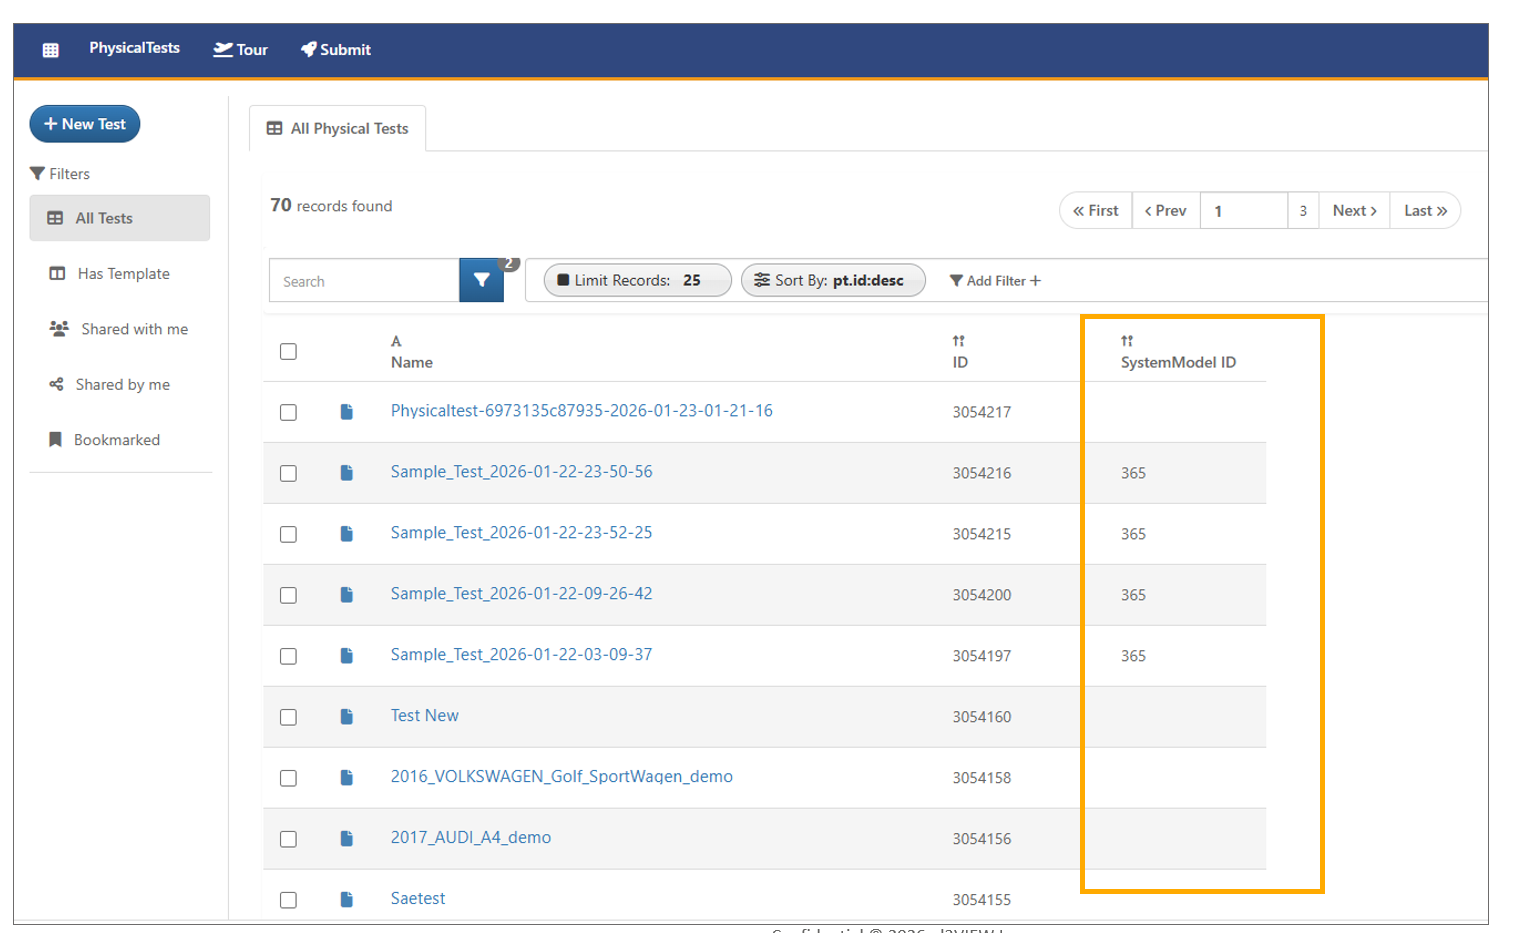
System Model ID
PRODUCT_NAME and PRODUCT_TYPE columns are now available in the table on the Physical Tests page.
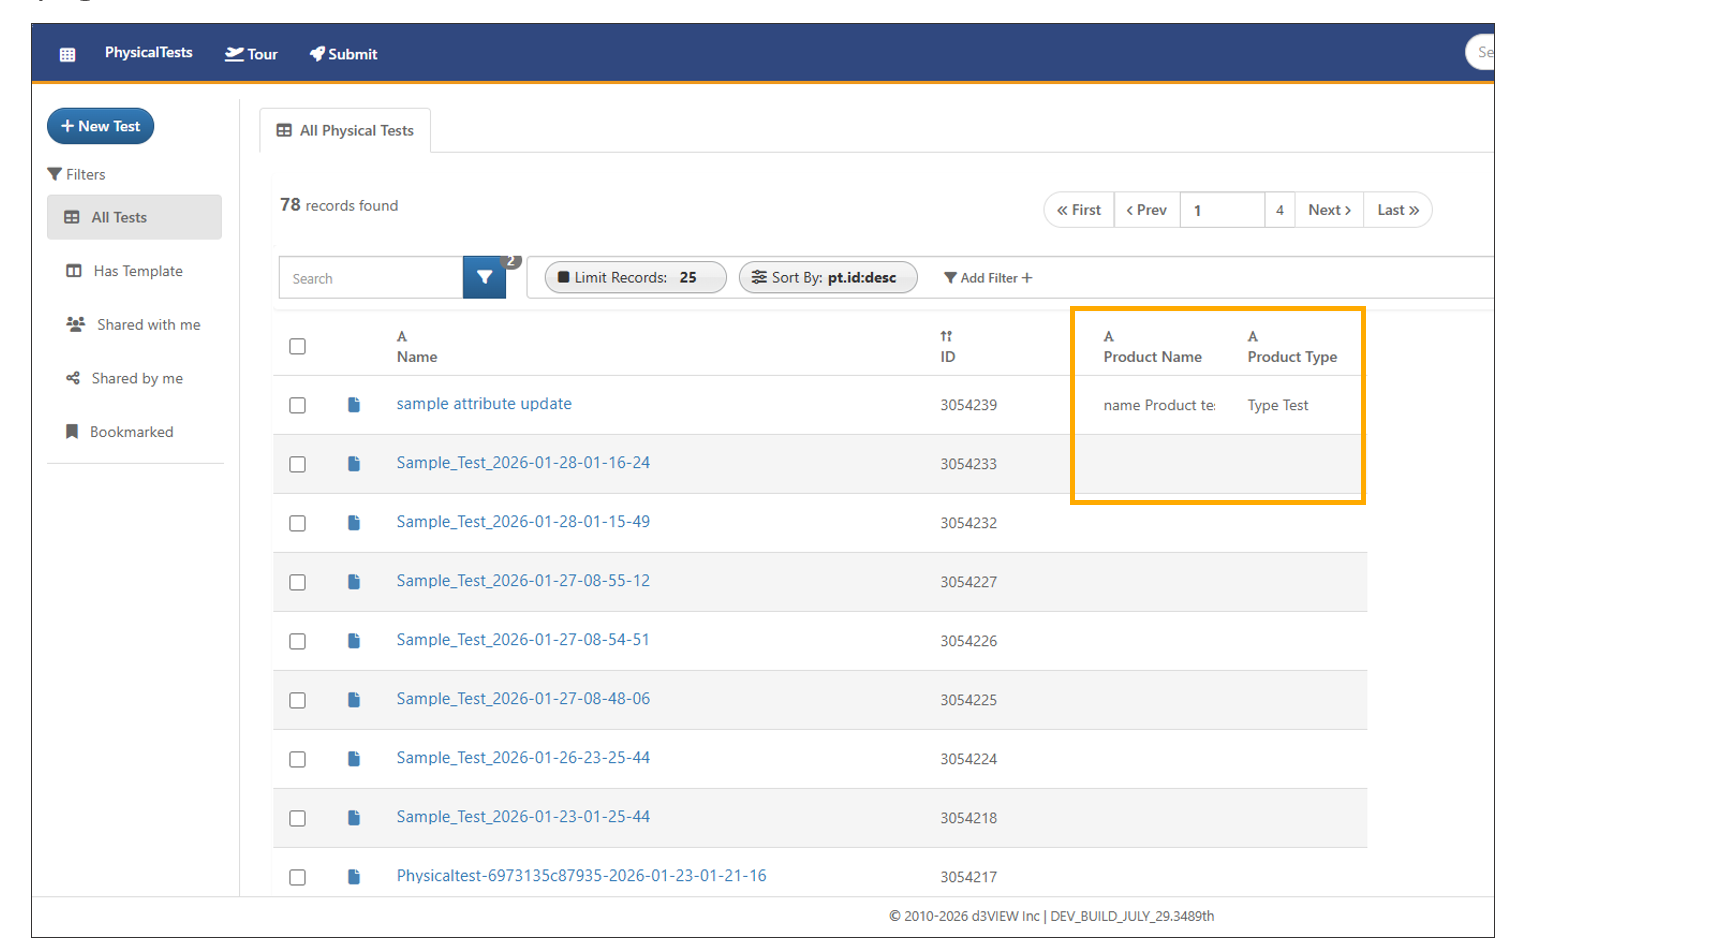
PRODUCT_NAME and PRODUCT_TYPE
Physicaltest_add_responses
The worker *PHYSICALTEST_ADD_RESPONSES can now support name/value in responses dataset input.
For additional questions about how to navigate the d3VIEW platform, please feel free to email our team at: support@d3view.com.
9.9. How to get Responses and Reposnes IDs from Physical tests using Iterator in a workflow
The Physicaltests available in the projects has responses for each test. We can get a consolidated responses list with the IDs as Dataset in Workflows using workers and Iterator.
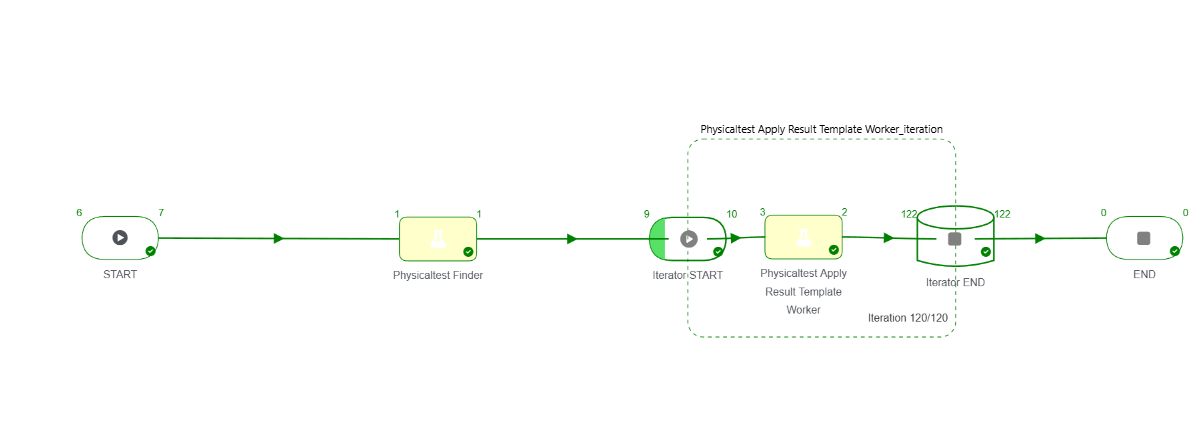
Workflow
Workflow creation
Add *PHYSICALTEST_FINDER worker to the canvas and select tge project in the filters from which the Physical tests are to be obtained and execute the Worker.
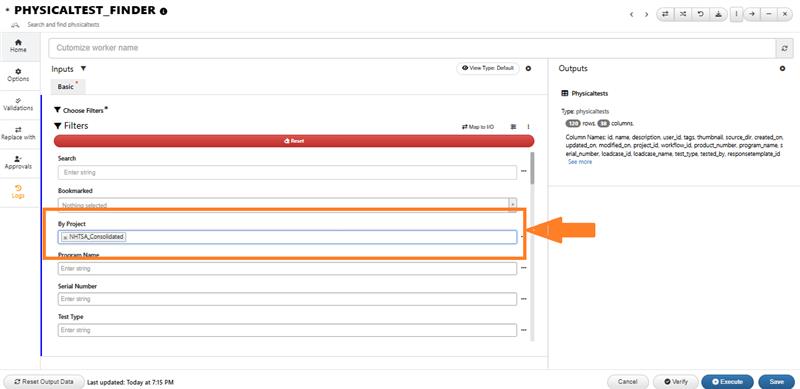
PHYSICALTEST FINDER
After execution we will be fetching all the physical test records in the output of the worker as a Dataset.
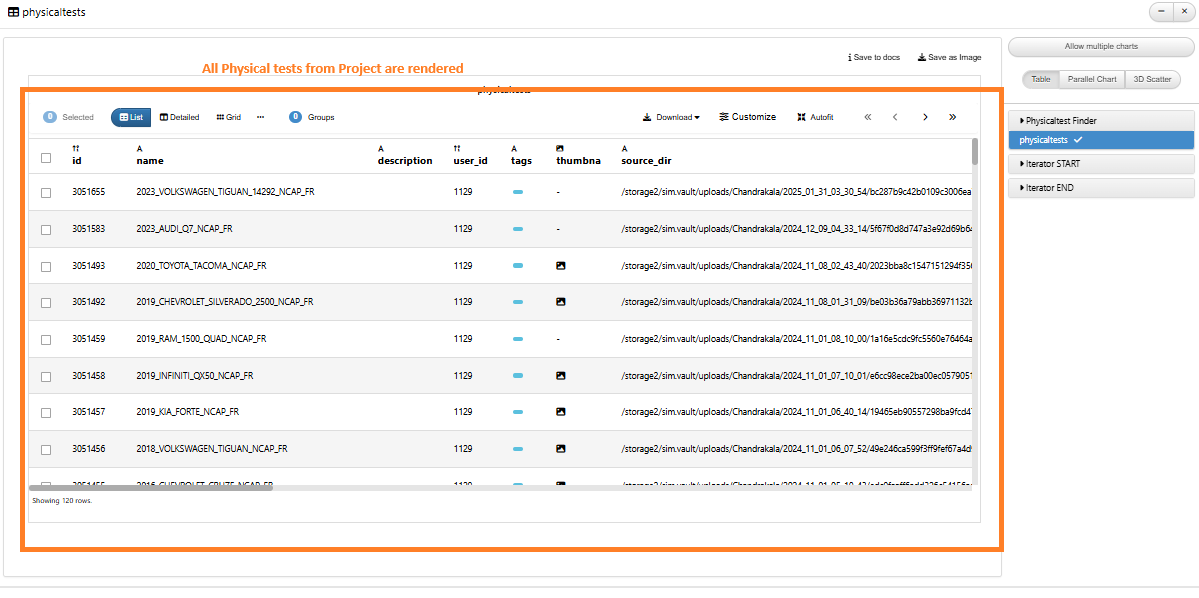
PHYSICALTEST FINDER OUTPUT
Now add *PHYSICALTEST_APPLY_RESULTANT_WORKER to the canvas and add Iterator to the worker using context menu options.
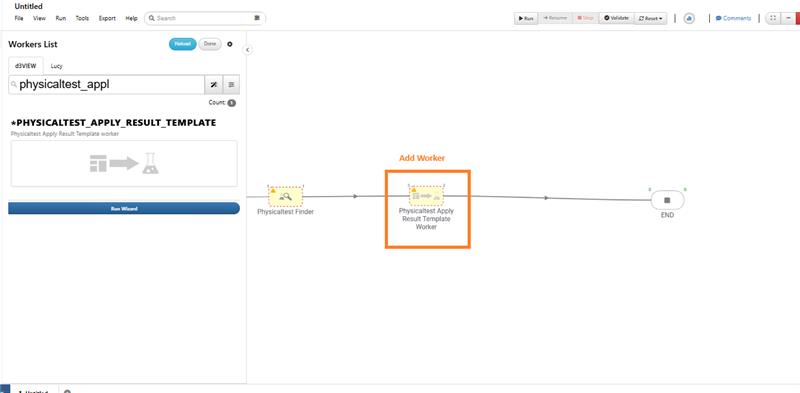
PHYSICALTEST_APPLY_RESULTANT_WORKER
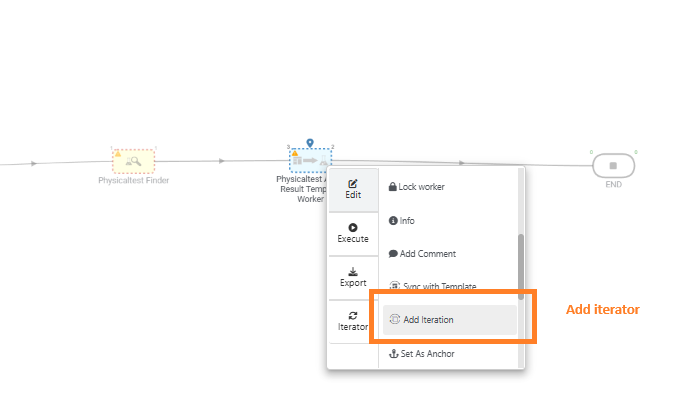
Add Iterator
Add inputs to the Iterator start in different steps to map inputs , Select output to be shown, Enable Parallel executions and Chuck size.
Save the iteraror after adding settings.
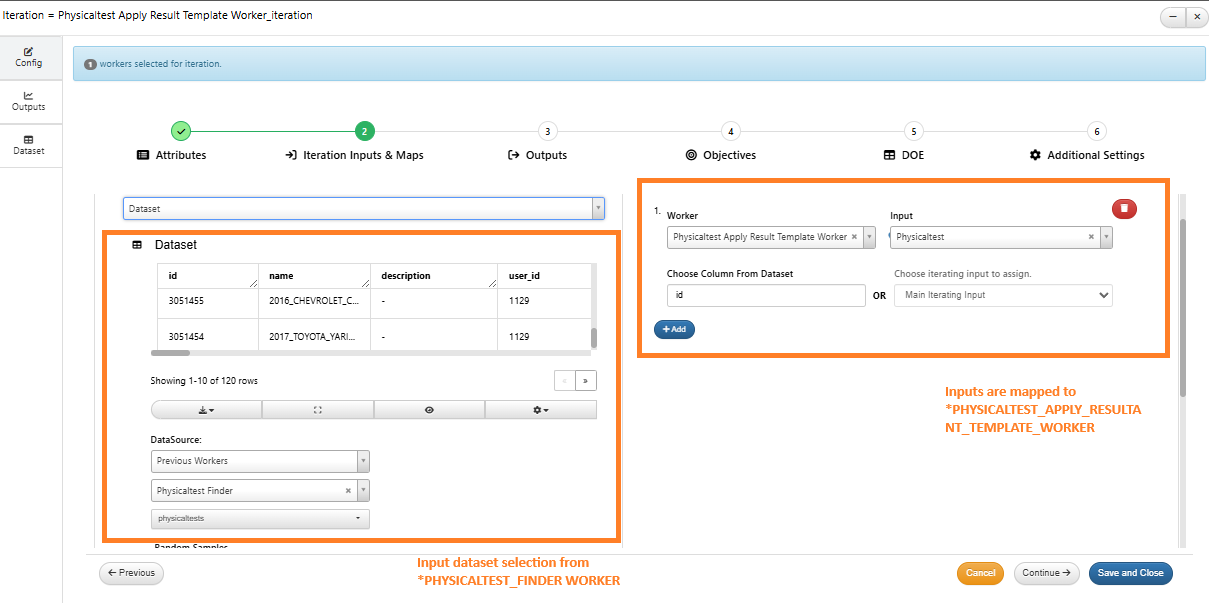
Add Inputs to Iterator
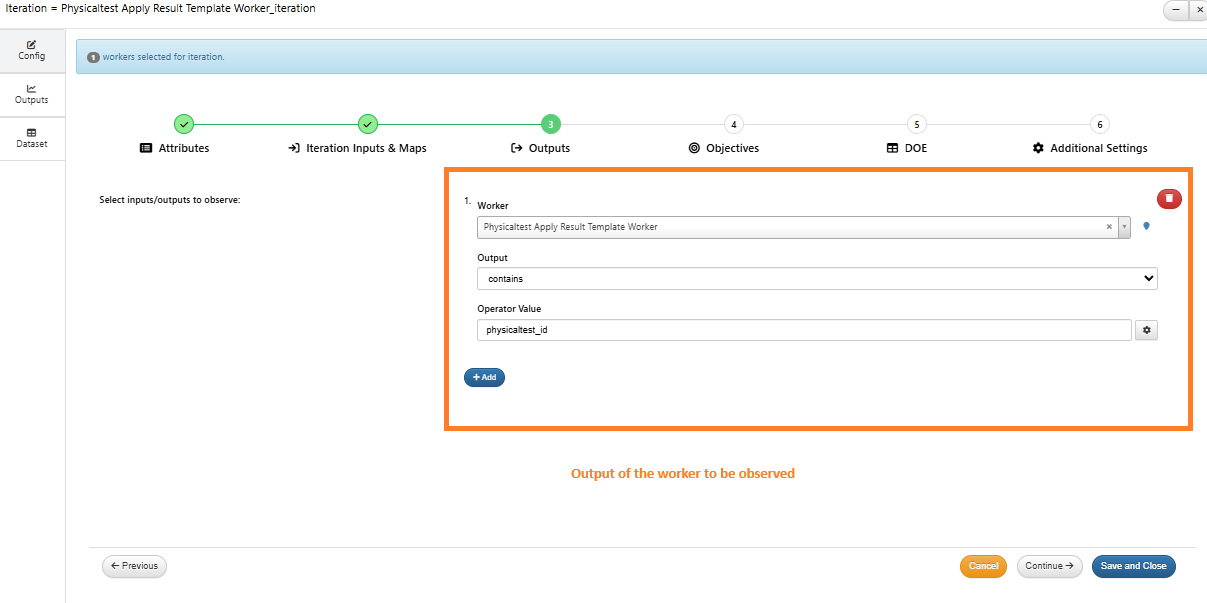
Add Iterator Output step
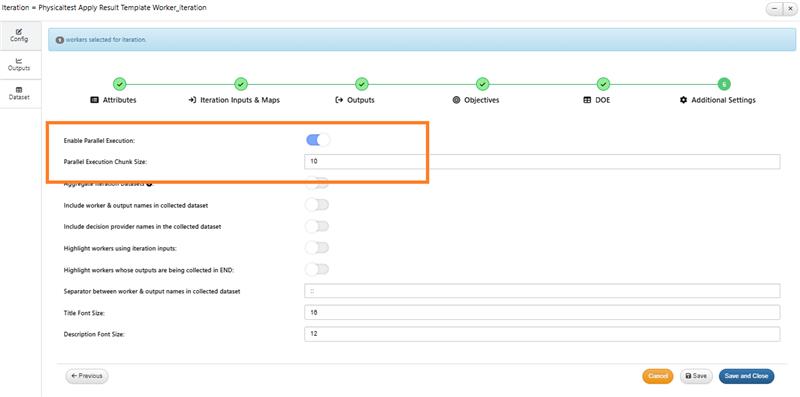
Parallel executions and chunk size
Iteration is saved and added to PHYSICALTEST_APPLY_RESULTANT_WORKER
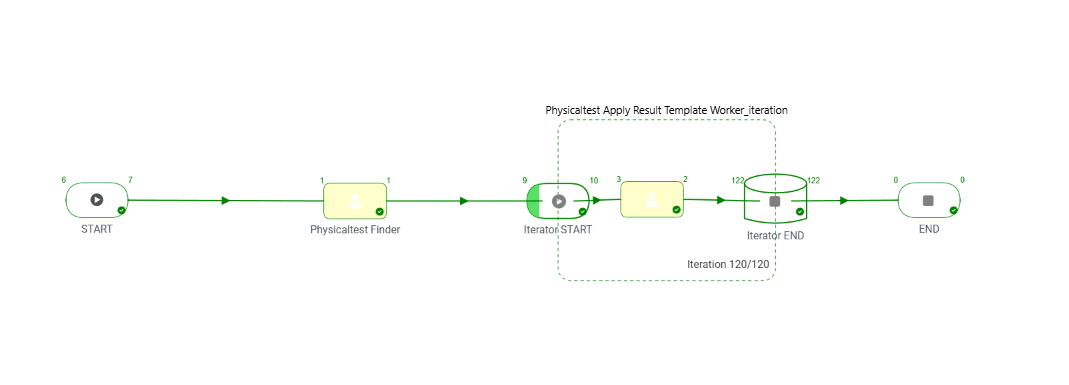
Iteration is saved
Now open *PHYSICALTEST_APPLY_RESULTANT_WORKER and add the Template to be applied.
This worker gives us the responses output for the Physical test selected.
Uing iterator we are fetching all the responses from each Physical test and collected them as Dataset which can be used in otjer workers.
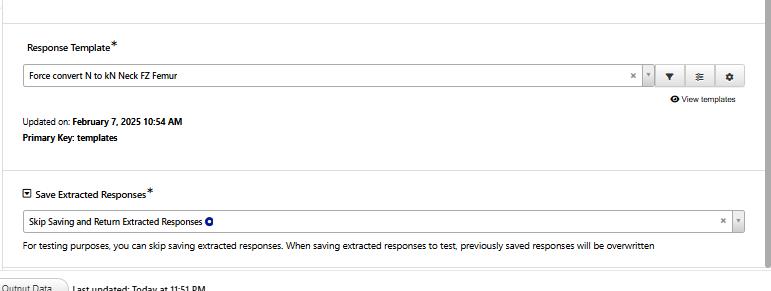
Template selection
Execution and Output
Now excute the Workflow by resuming from Iteration start and once the Workflow is executed we can open the Iteration end worker to view the Output.
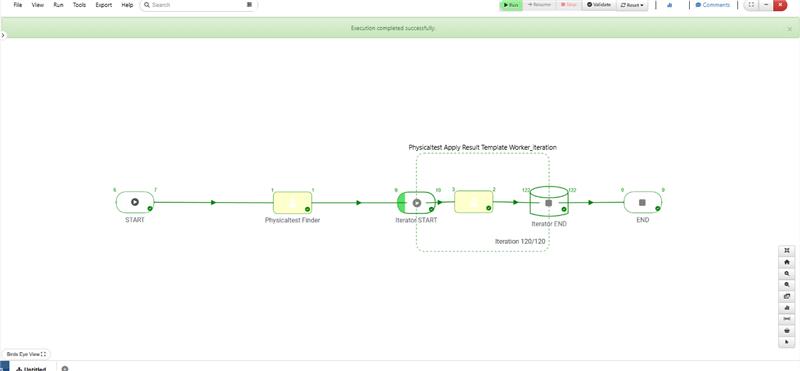
Workflow execution
The Iterator end worker shows the results with all Iterations.
Navigate to the Dataset output tab to fetch all the responses available from the Physical tests along with the IDs.
This is how we fectch responses from Physical tests in a project using Iterator in a Workflow.
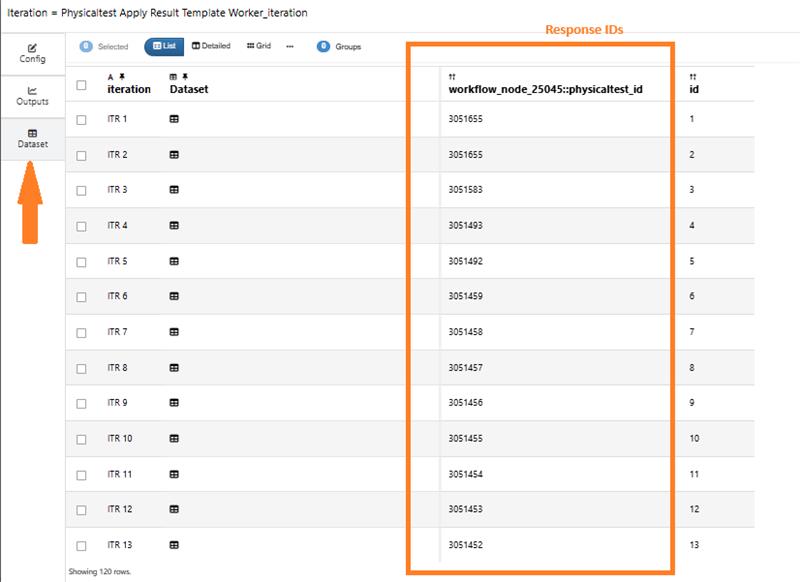
Output Responses