33. Reporter
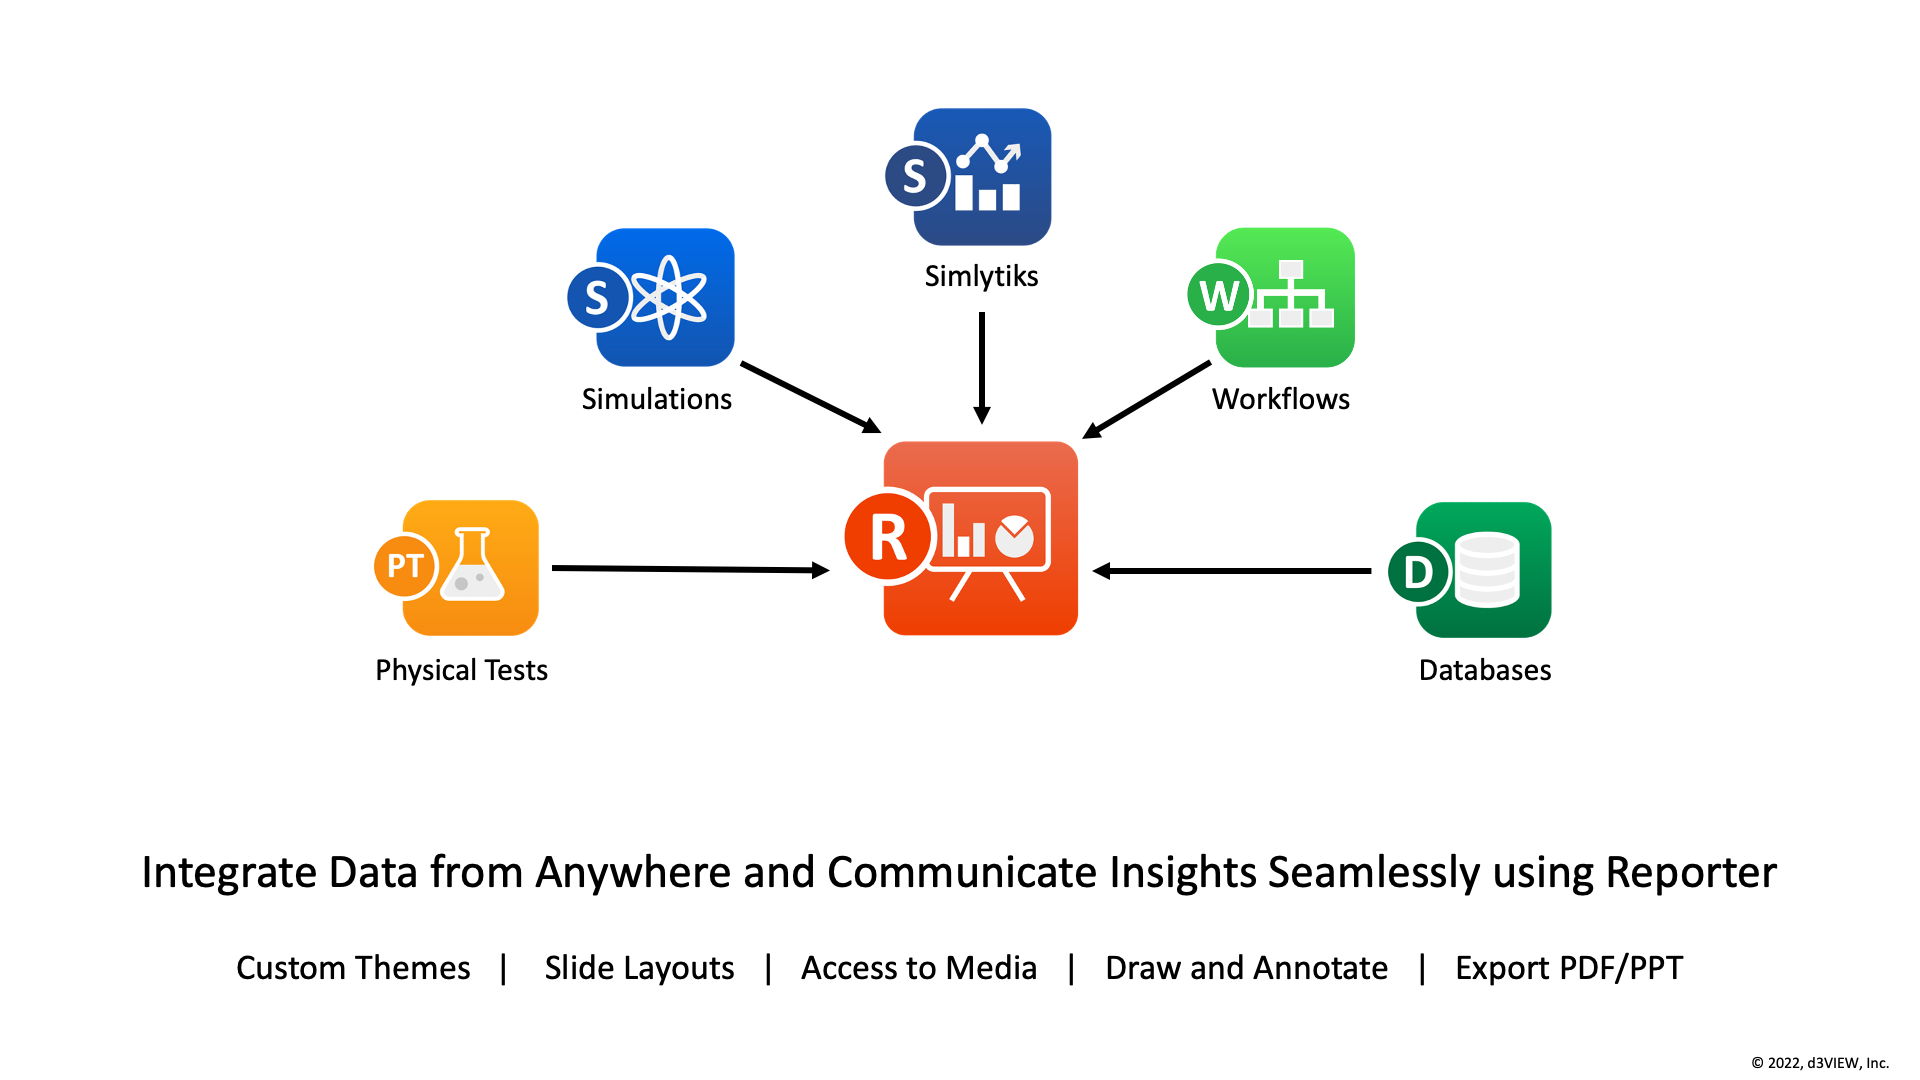
The Reporter application in d3VIEW allows us to create reports from our data directly in the platform. Make edits, design and customize reports to download as a PPT or PDF to share.
What Will Be Covered
- Accessing Reporter
- Editing
- Layouts and Themes
- Customization
- Sharing and Exporting
33.1. Accessing Reporter
Reporter connects to all d3VIEW applications but it’s more commonly accesses through the Simlytiks and Workflows applications. Let’s go over how to open the builder from these applications.
Simlytiks
To edit reports via the Simlytiks application, go to Export > PowerPoint.
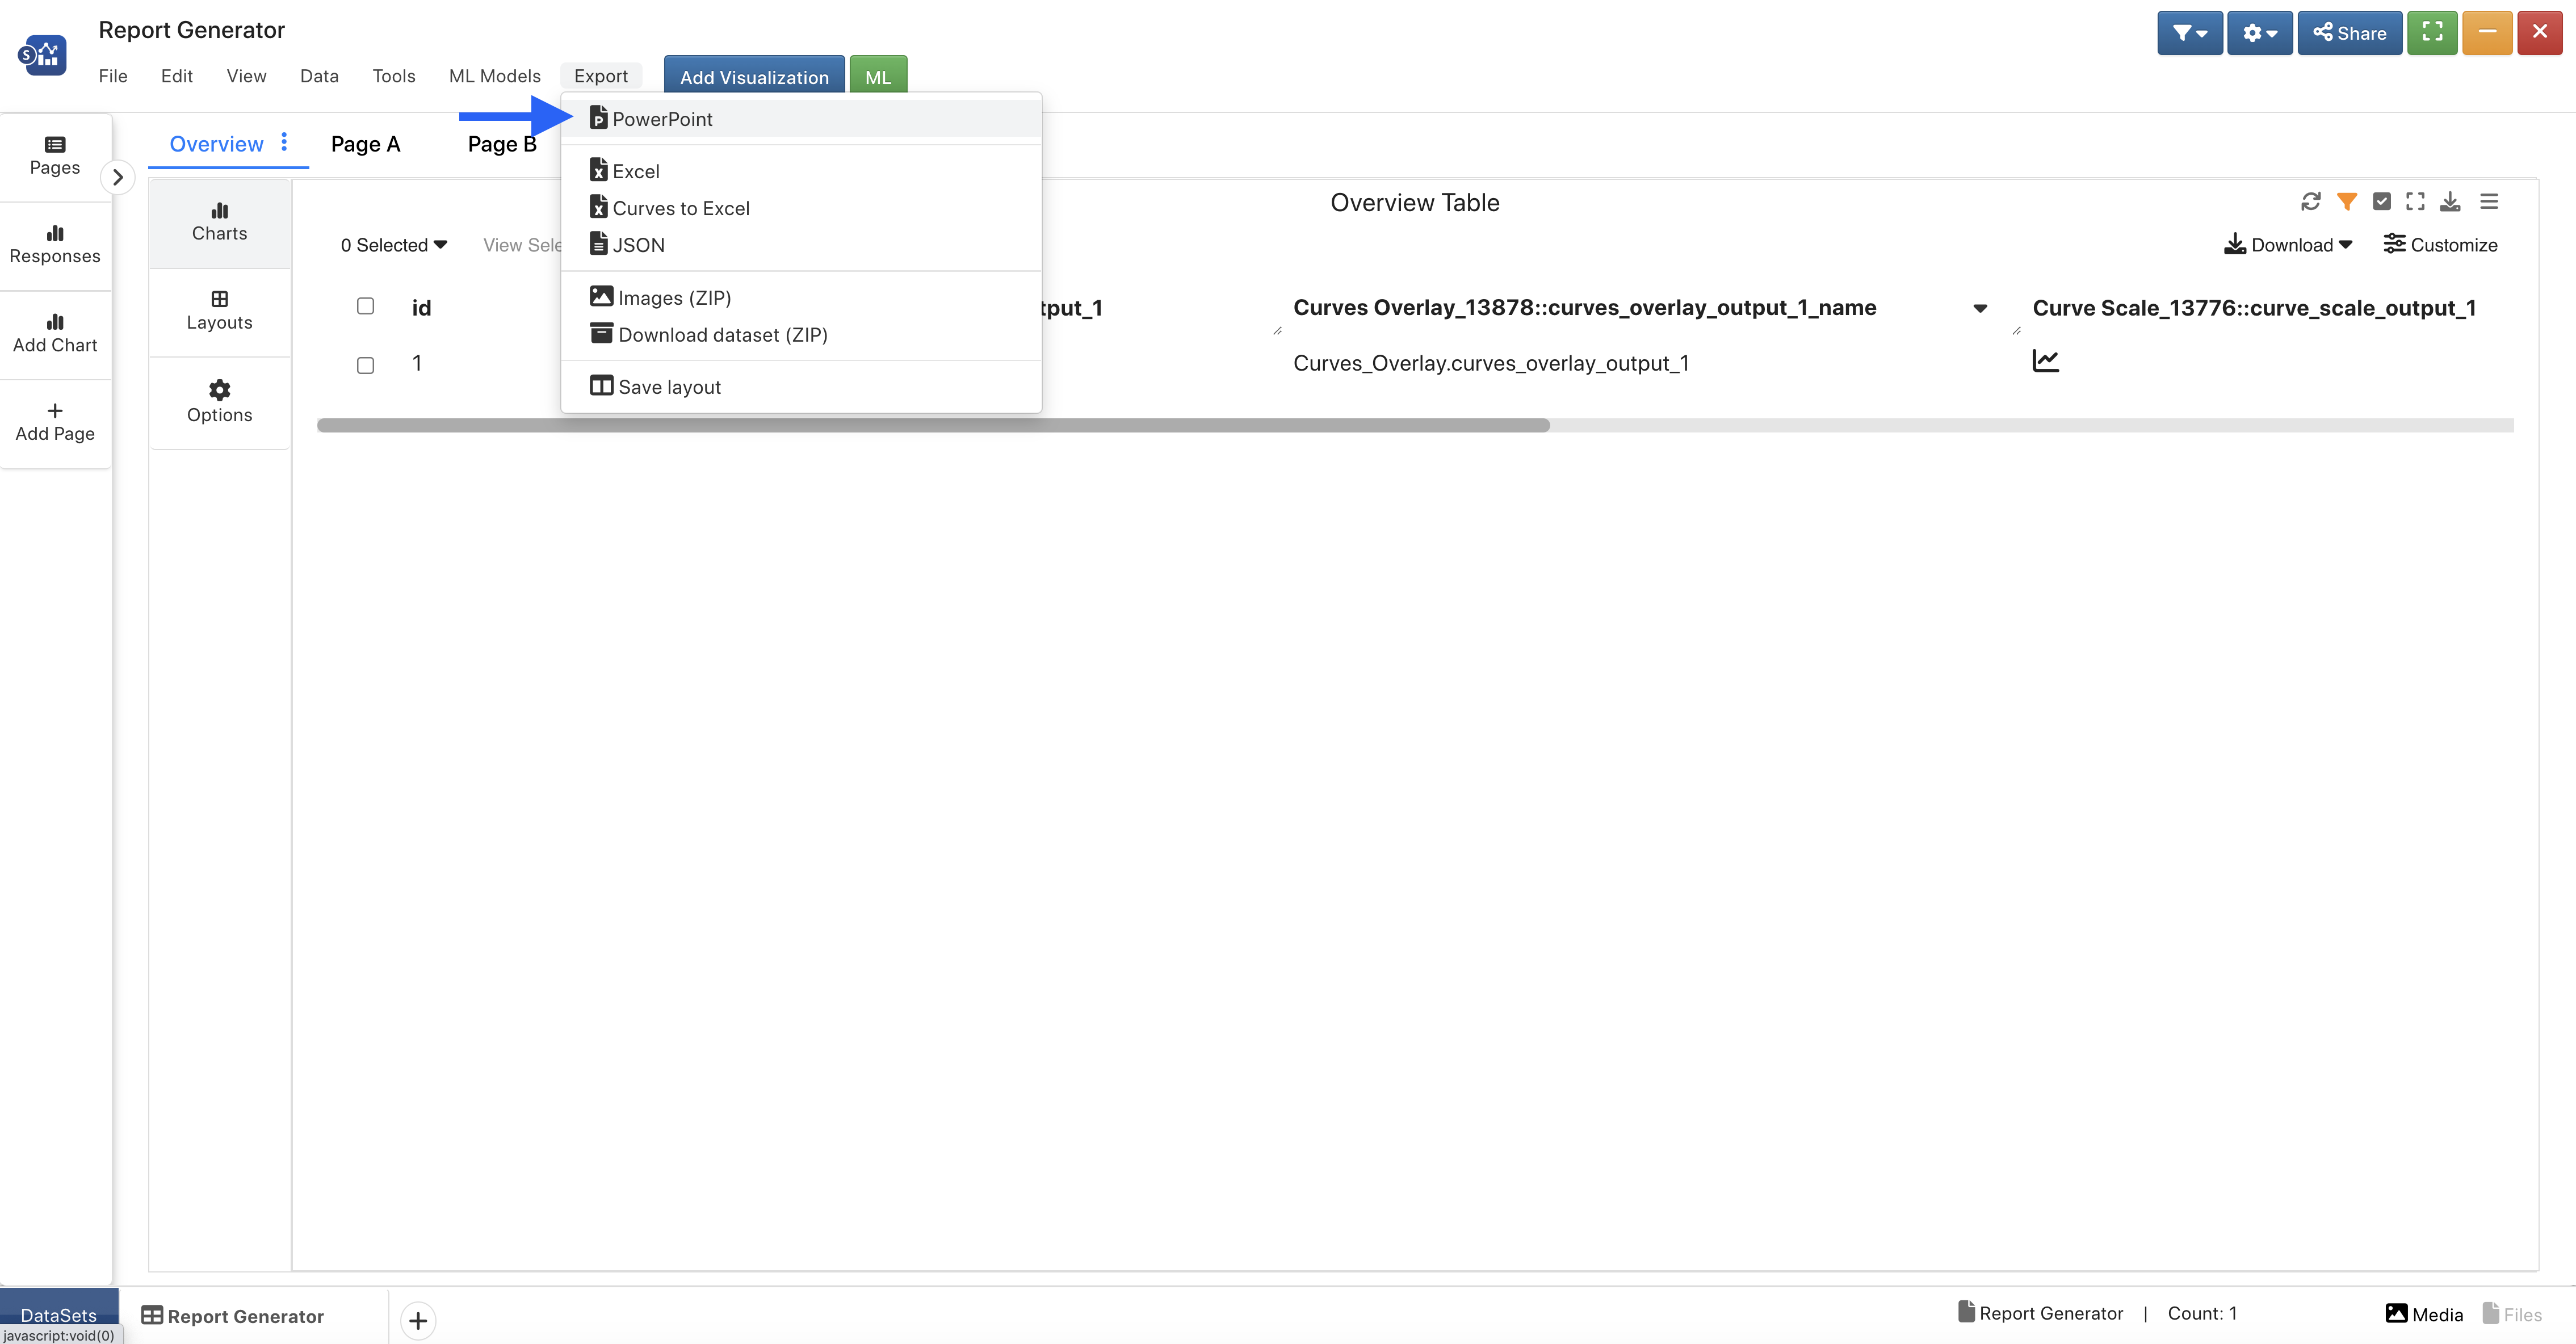
Figure 1: Export PowerPoint from Simlytiks
In the next window, choose Yes to configure in the builder at the bottom (1). Then, click Export (2).
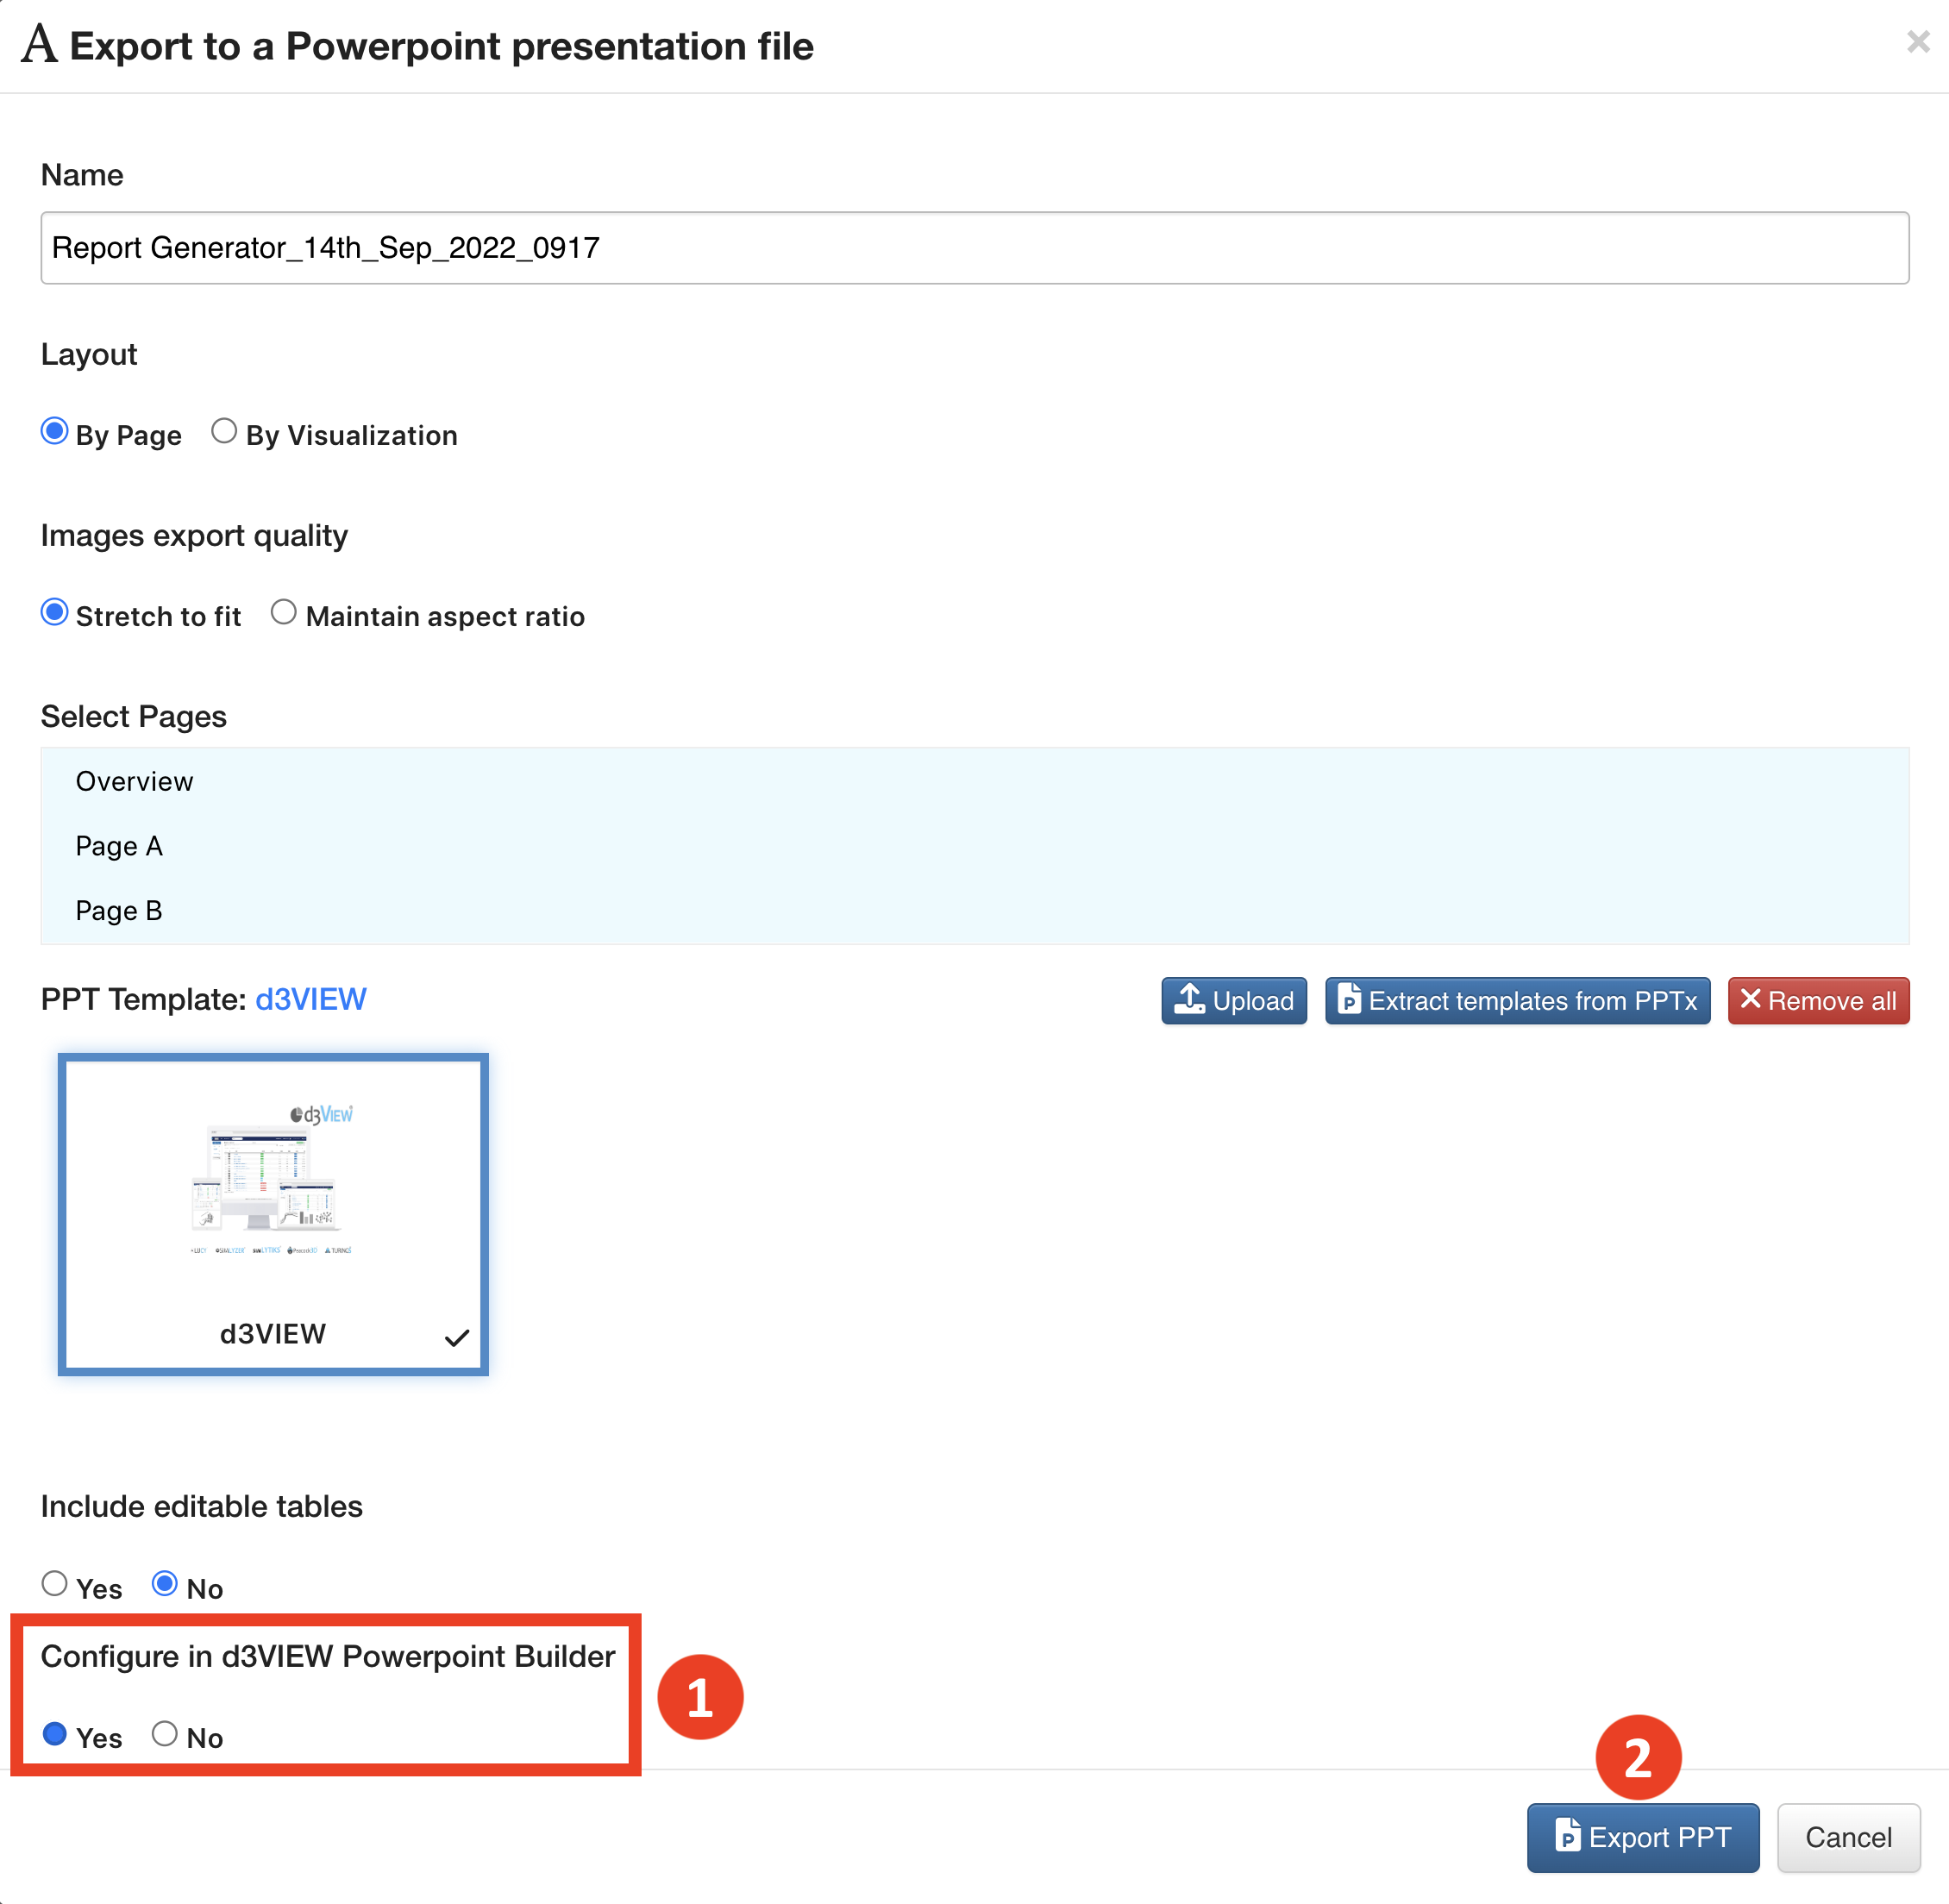
Figure 2: Configure in Builder and Export
From here, the builder will automatically open with our Simlytiks pages as slides.

Figure 3: Report Builder from Simlytiks
Workflows
To edit reports via the Workflows application, open the Report Generator worker after executing the workflow. Learn how to set this worker up here.
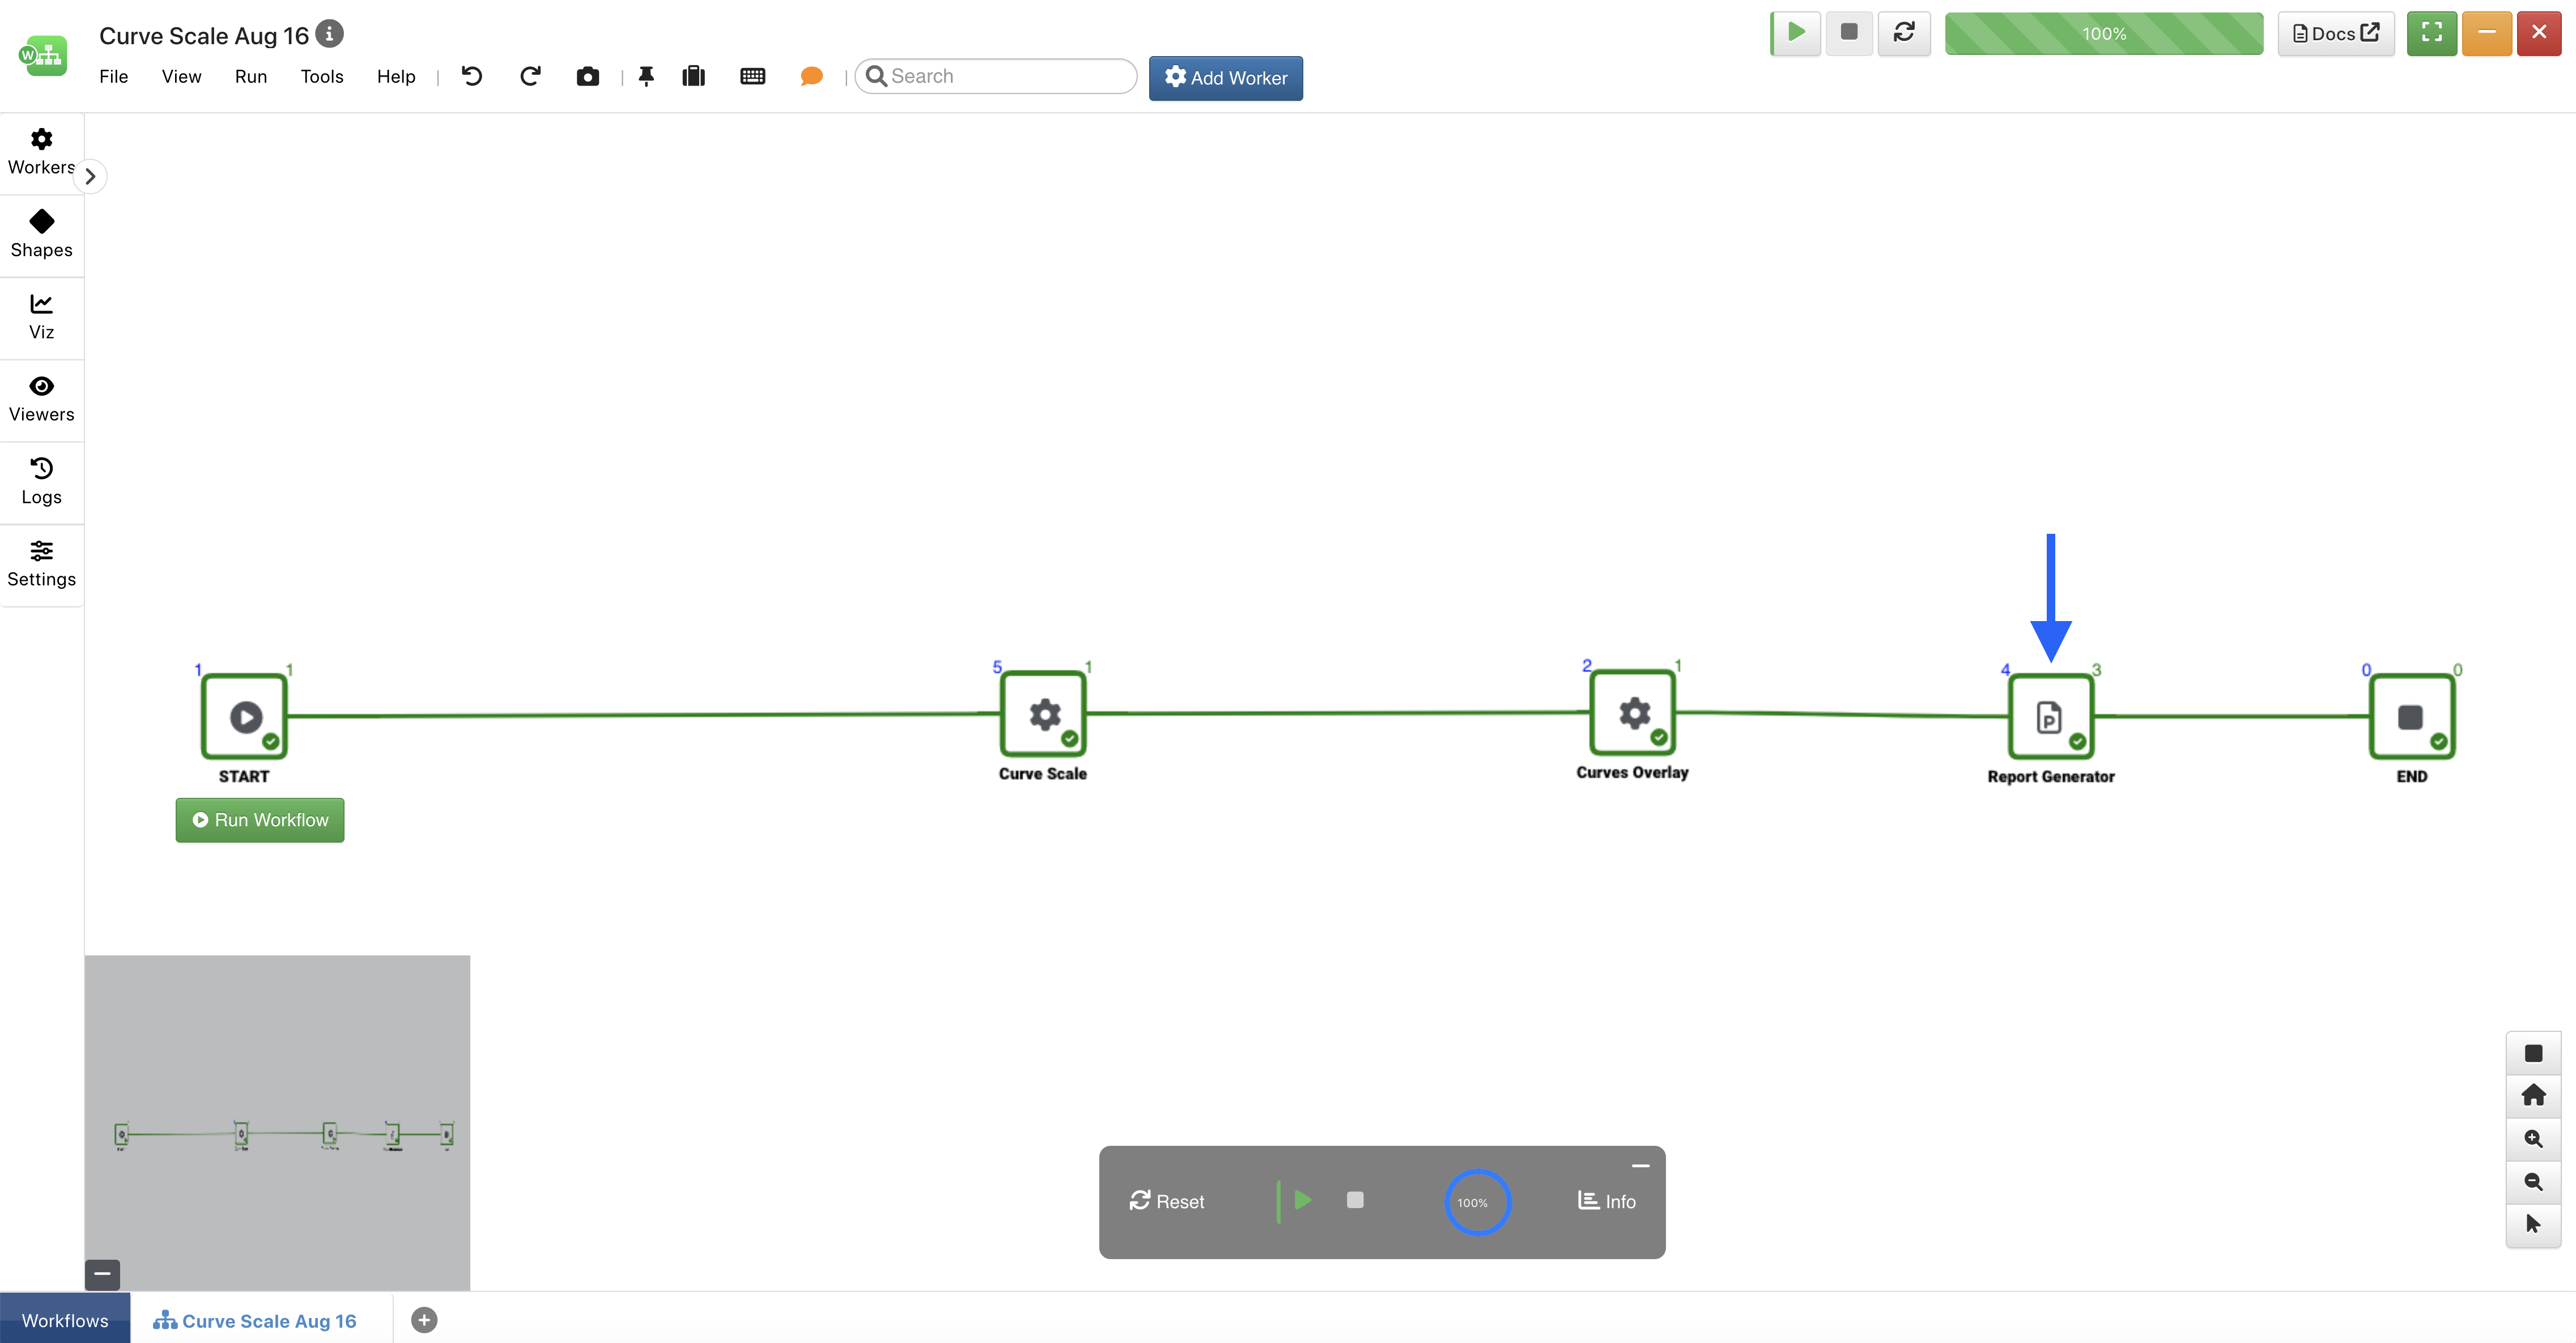
Figure 4: Open Report Generator Worker
Click on View Report to open the builder.
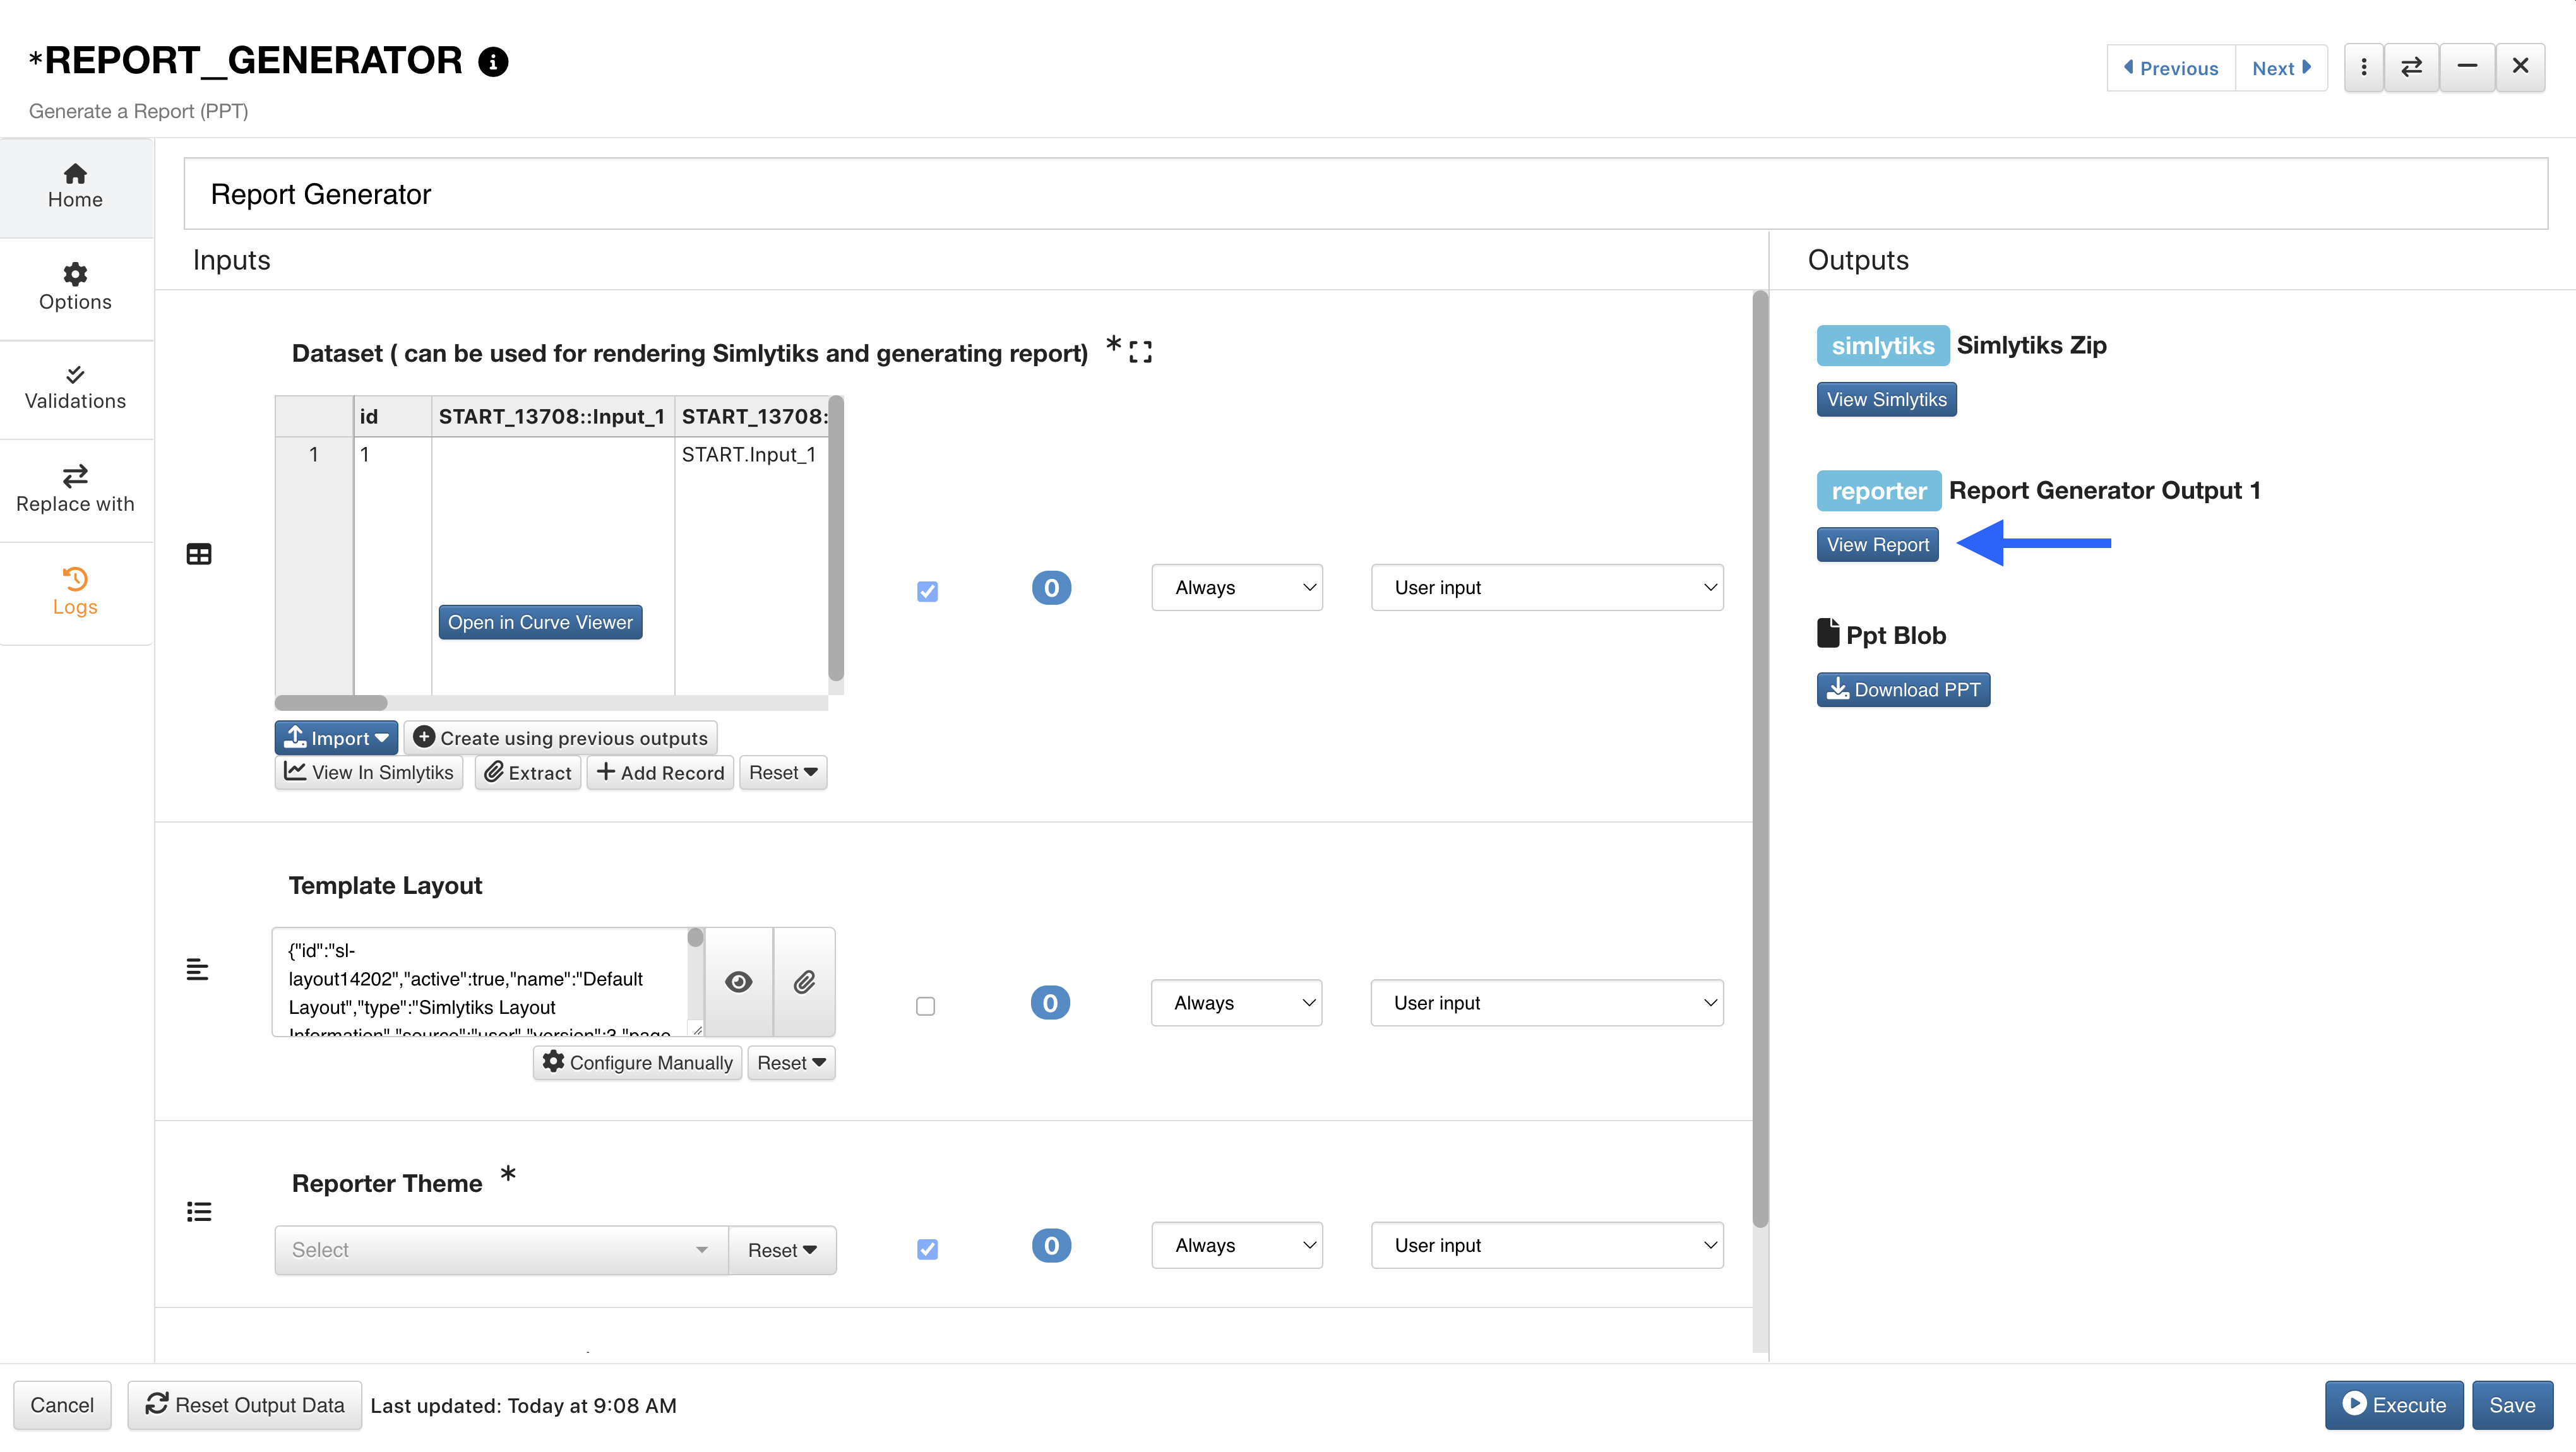
Figure 5: View Report from Report Generator Worker
The builder will open with our configured report pages as the slides.
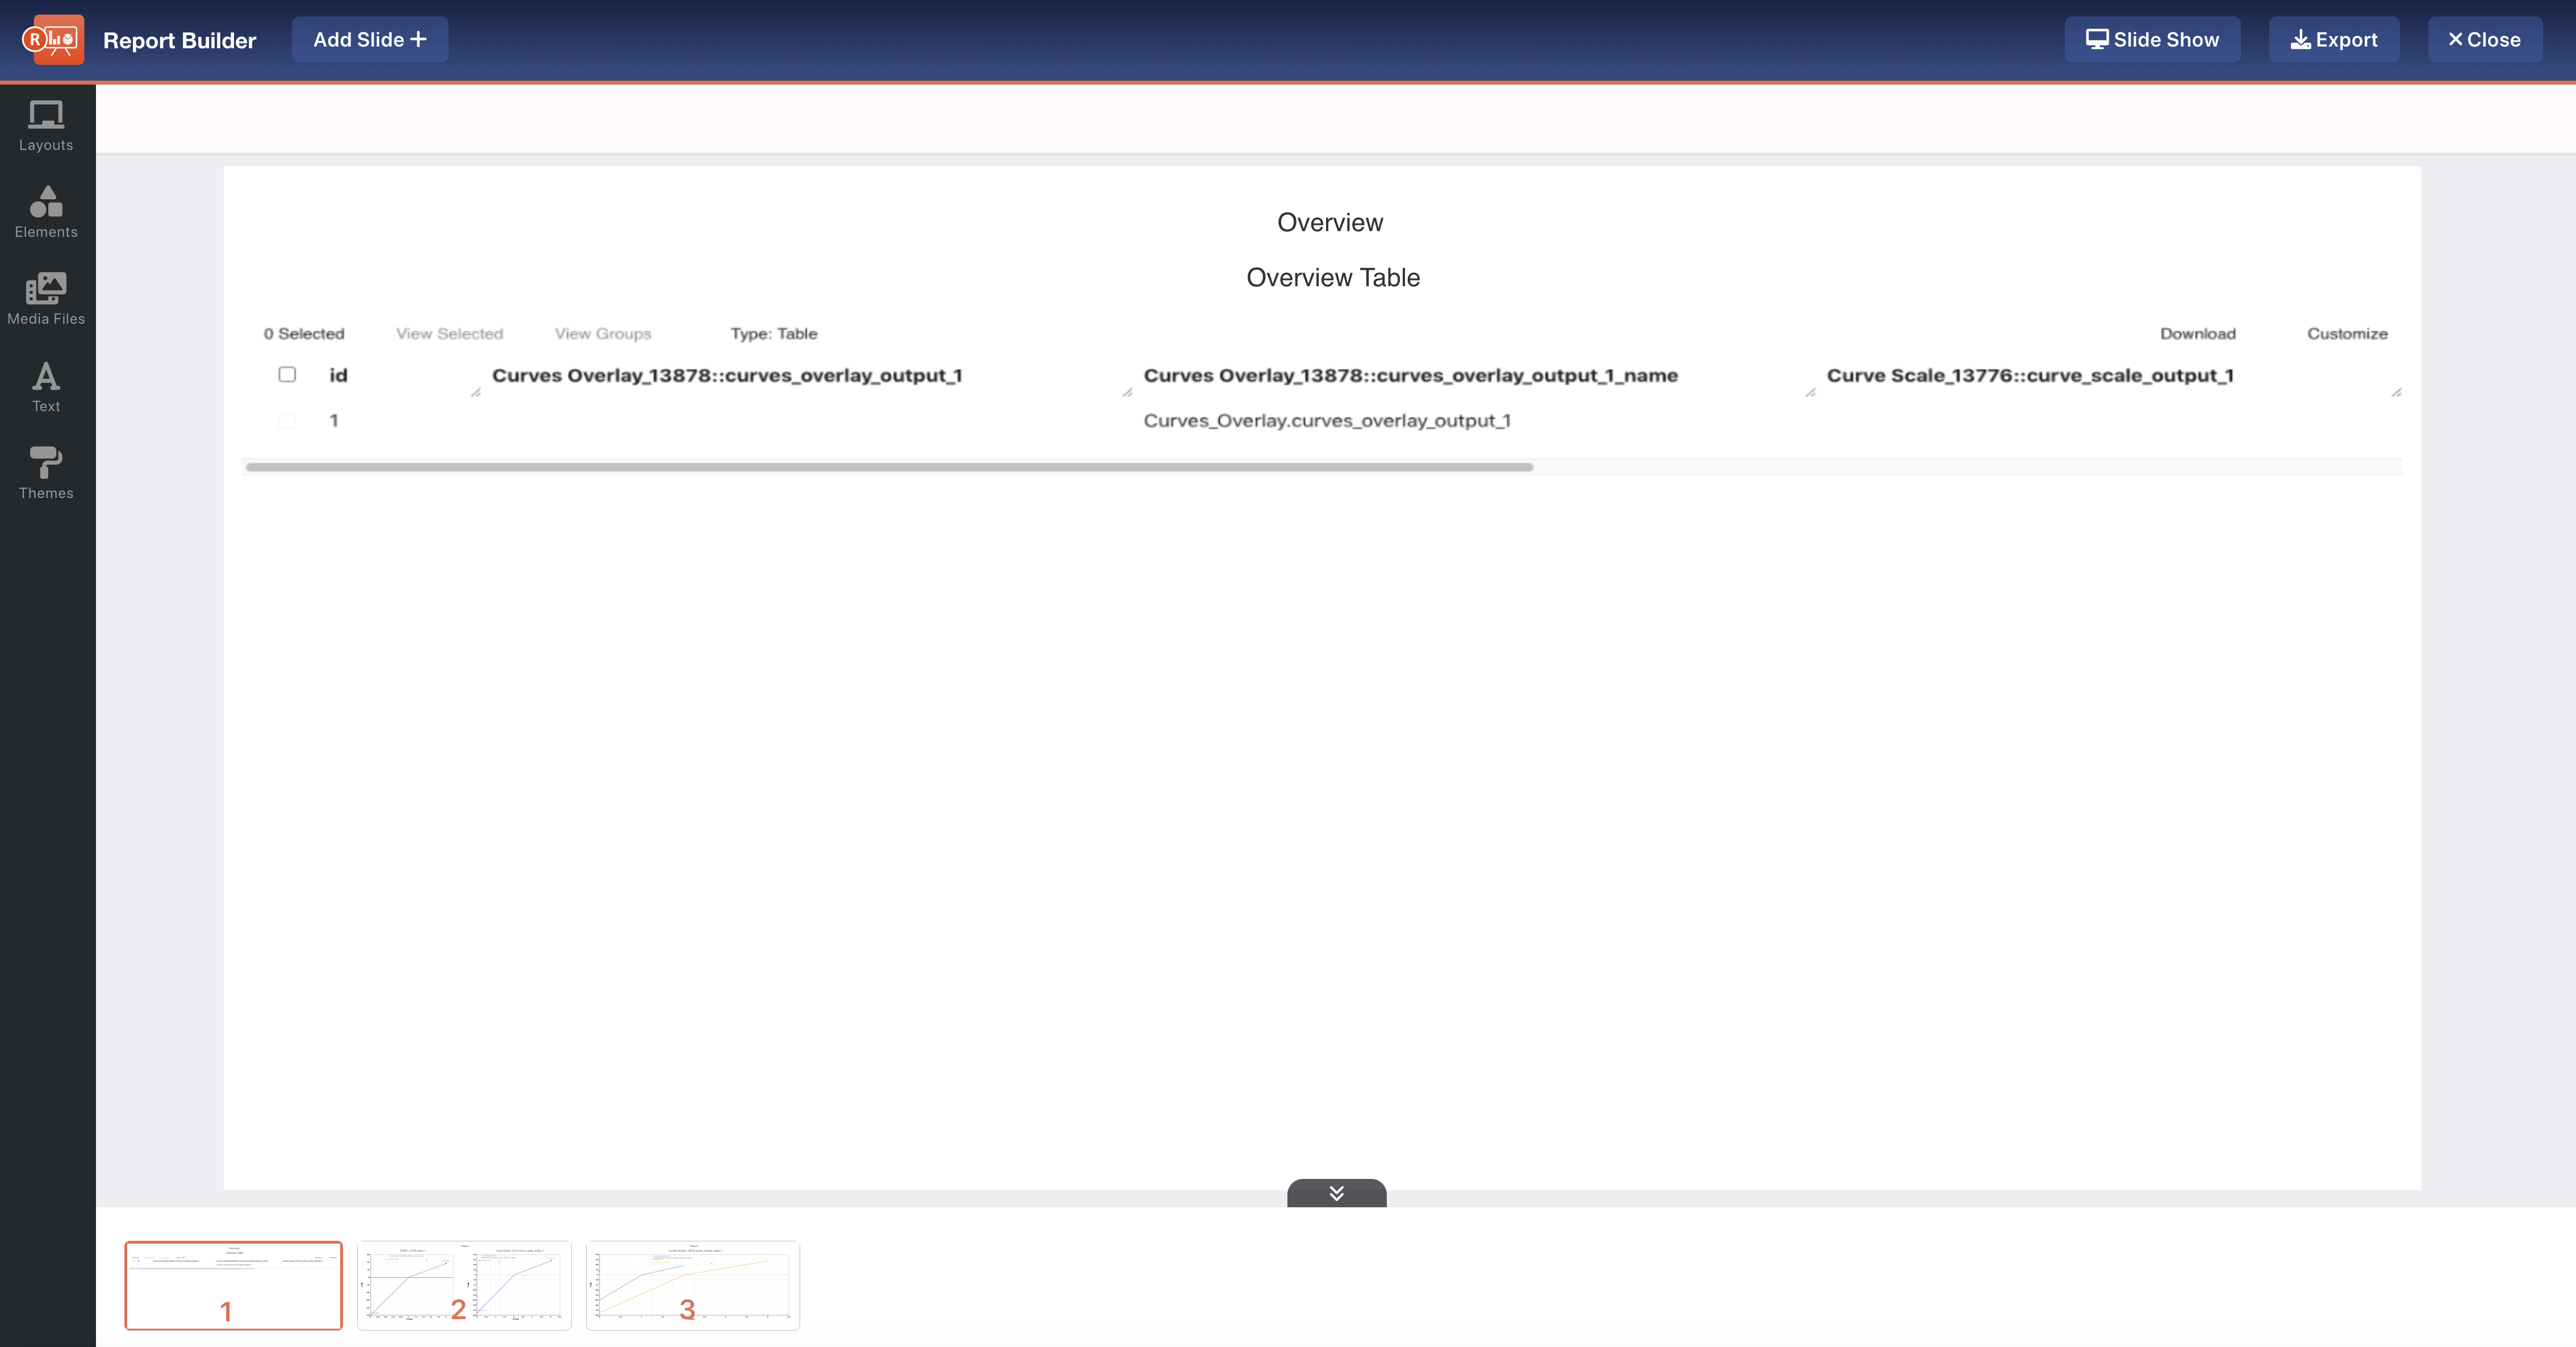
Figure 6: Report Builder from Workflows
33.2. Slides
Let’s go over our reporter slides.
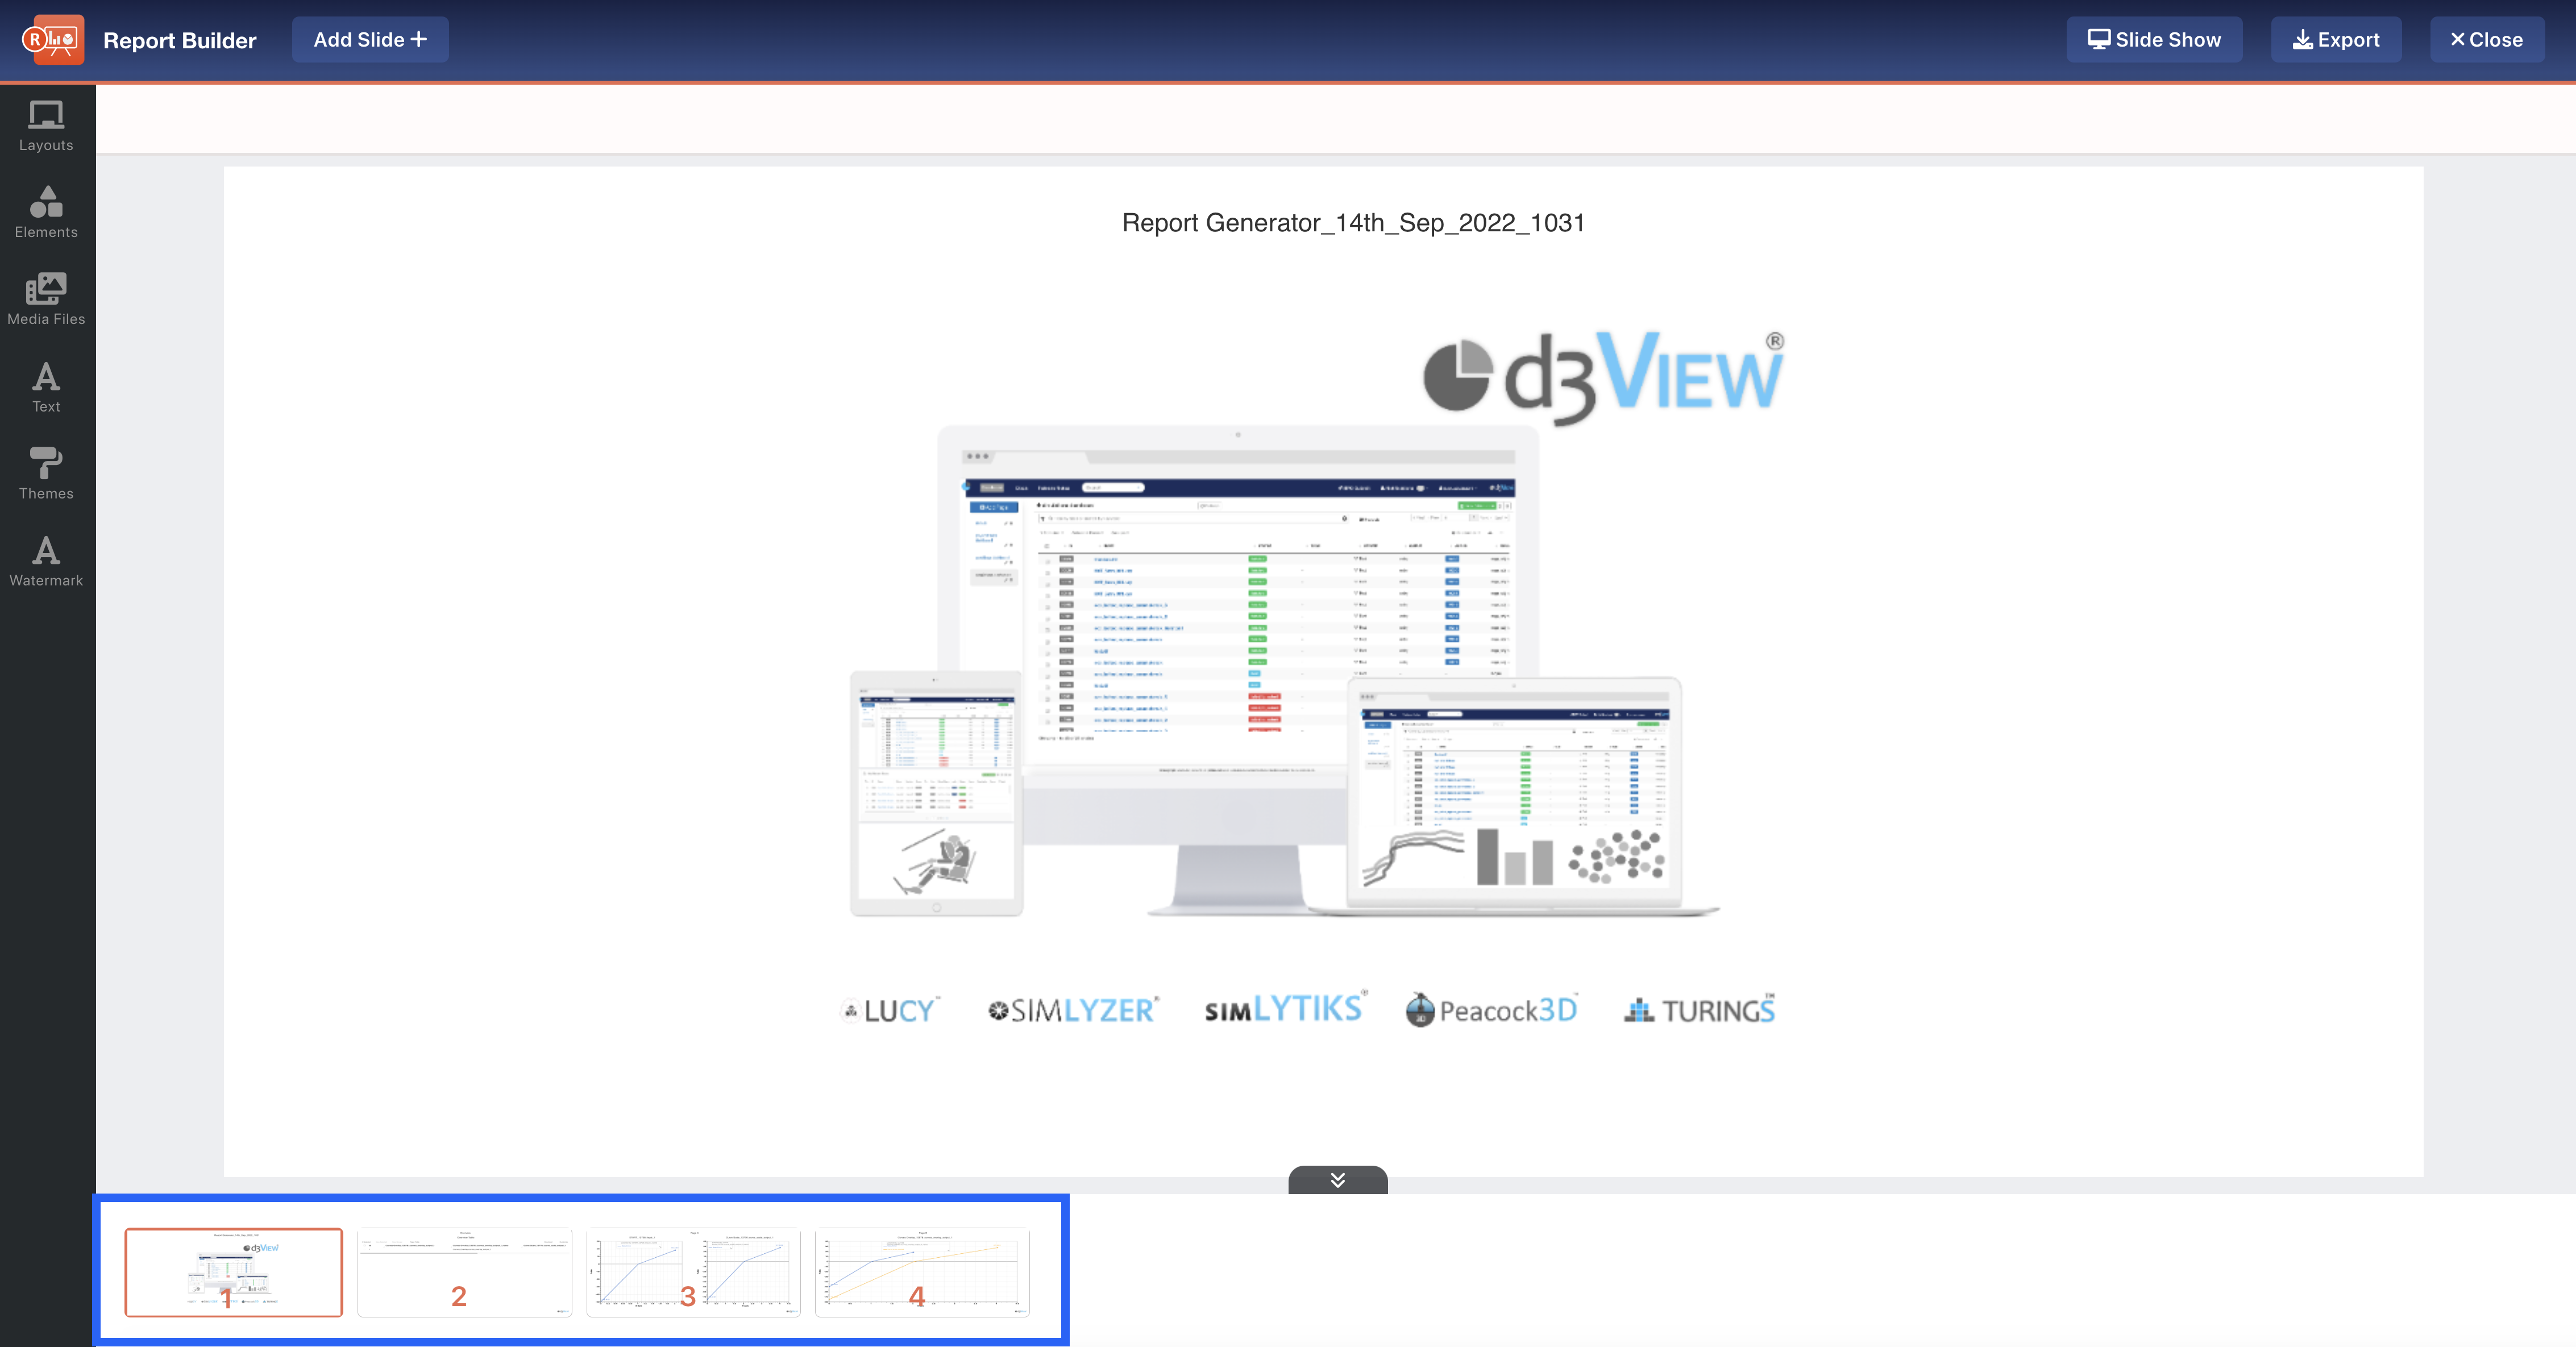
Figure 7: Reporter Slides
Navigate between slides at the bottom of the page. Use the double arrows to hide the slide navigation.
Add Slide
Add a new slide at the top of the page.
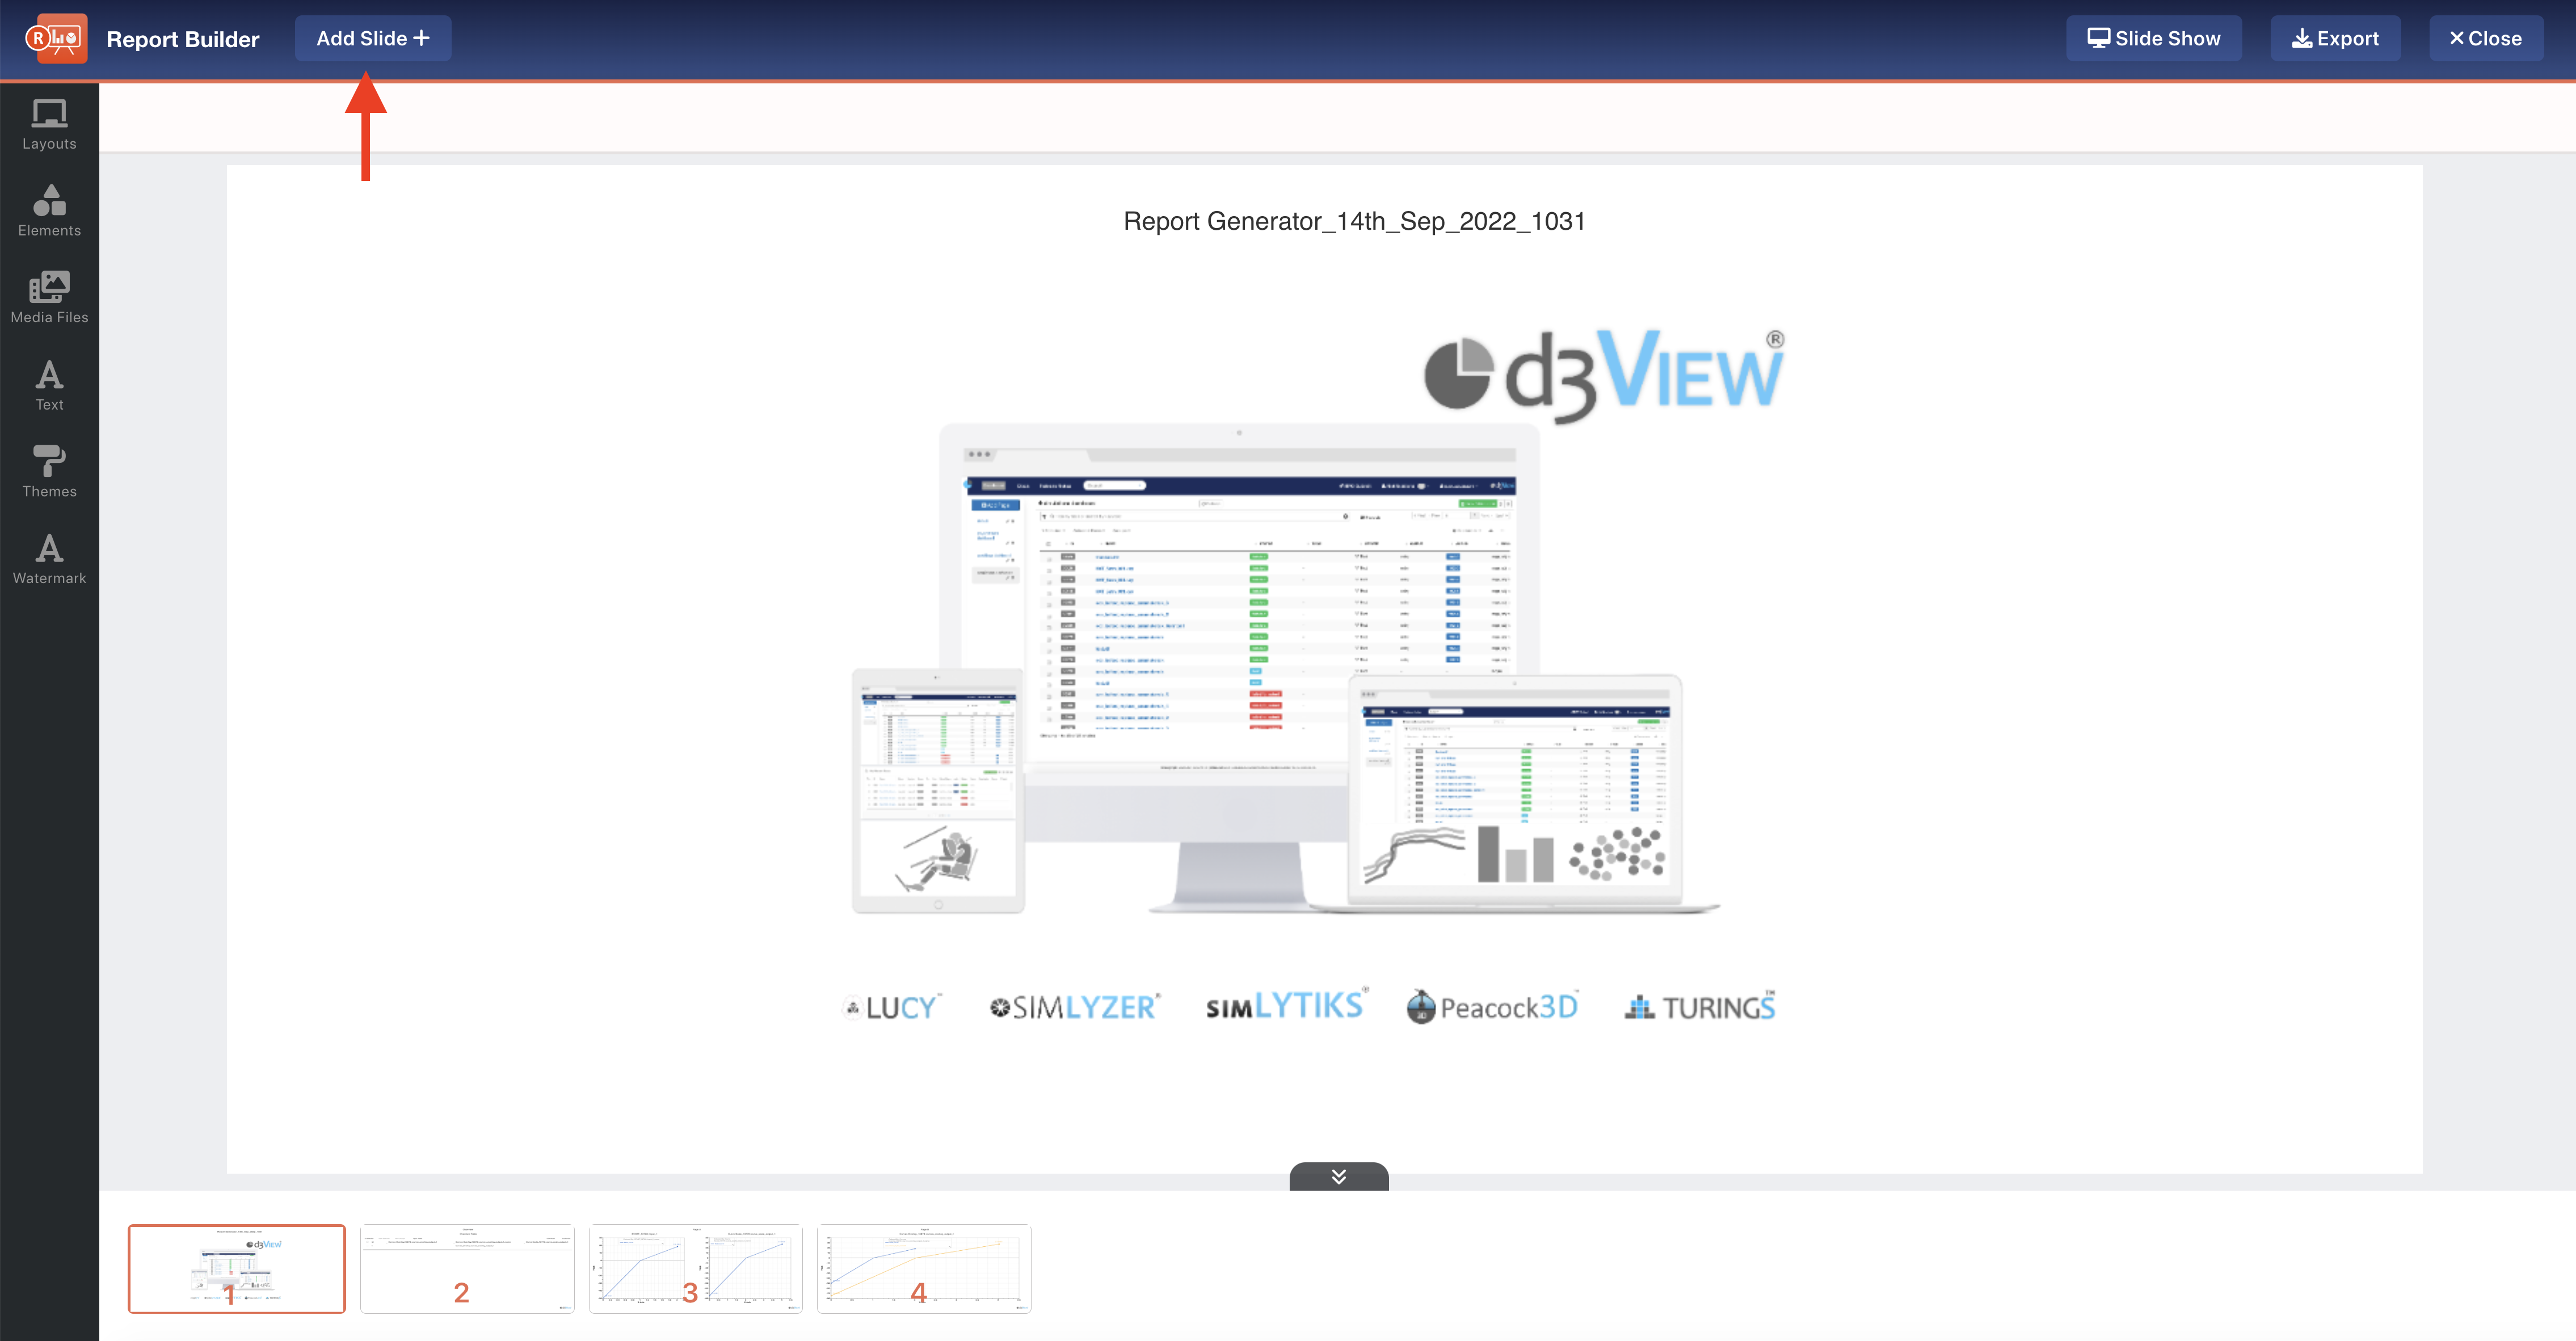
Figure 8: Add Slide
We will be prompted to choose from our currently saved slide layouts. Default layouts include the d3VIEW title and blank slides.
Layouts
Under the layouts tab on the left side, we can update our current slide layout as well as upload more slide layouts.
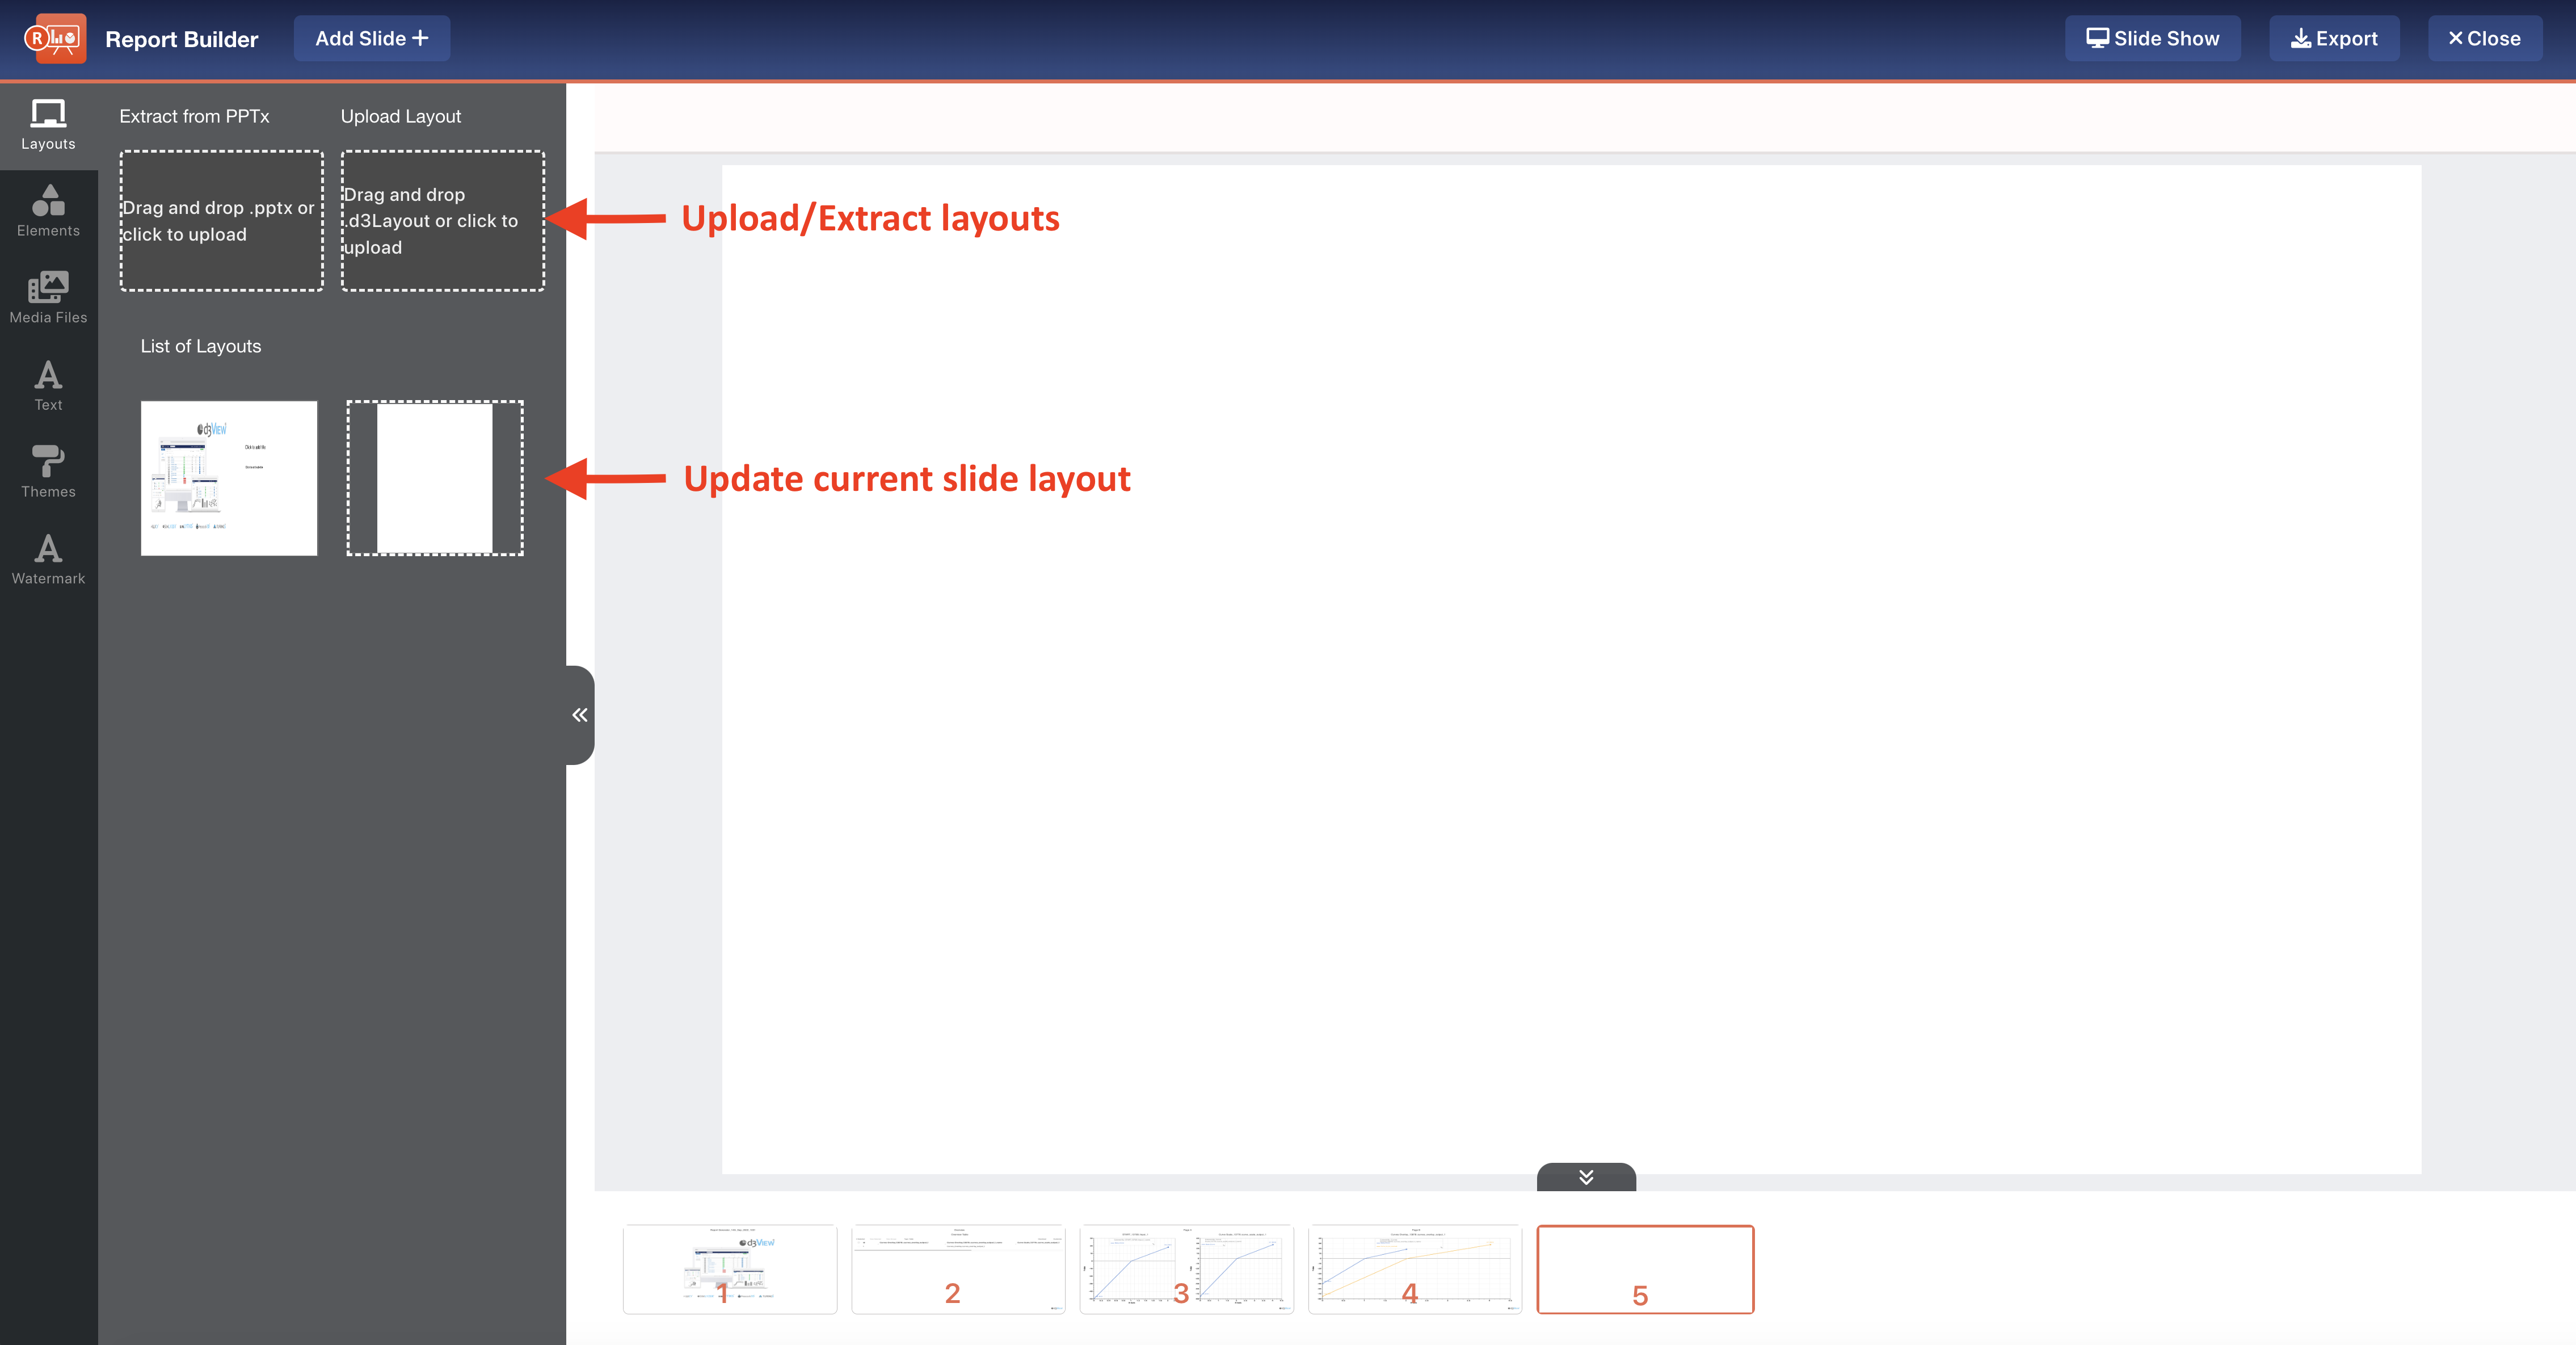
Figure 9: Slide Layout Options
There are two options for uploading layouts:
- Extracting from PPTX: upload a powerpoint with slide layouts you wish to include. Reporter will extract these layouts from the file.
- Upload Layout: upload a d3VIEW generated layout.
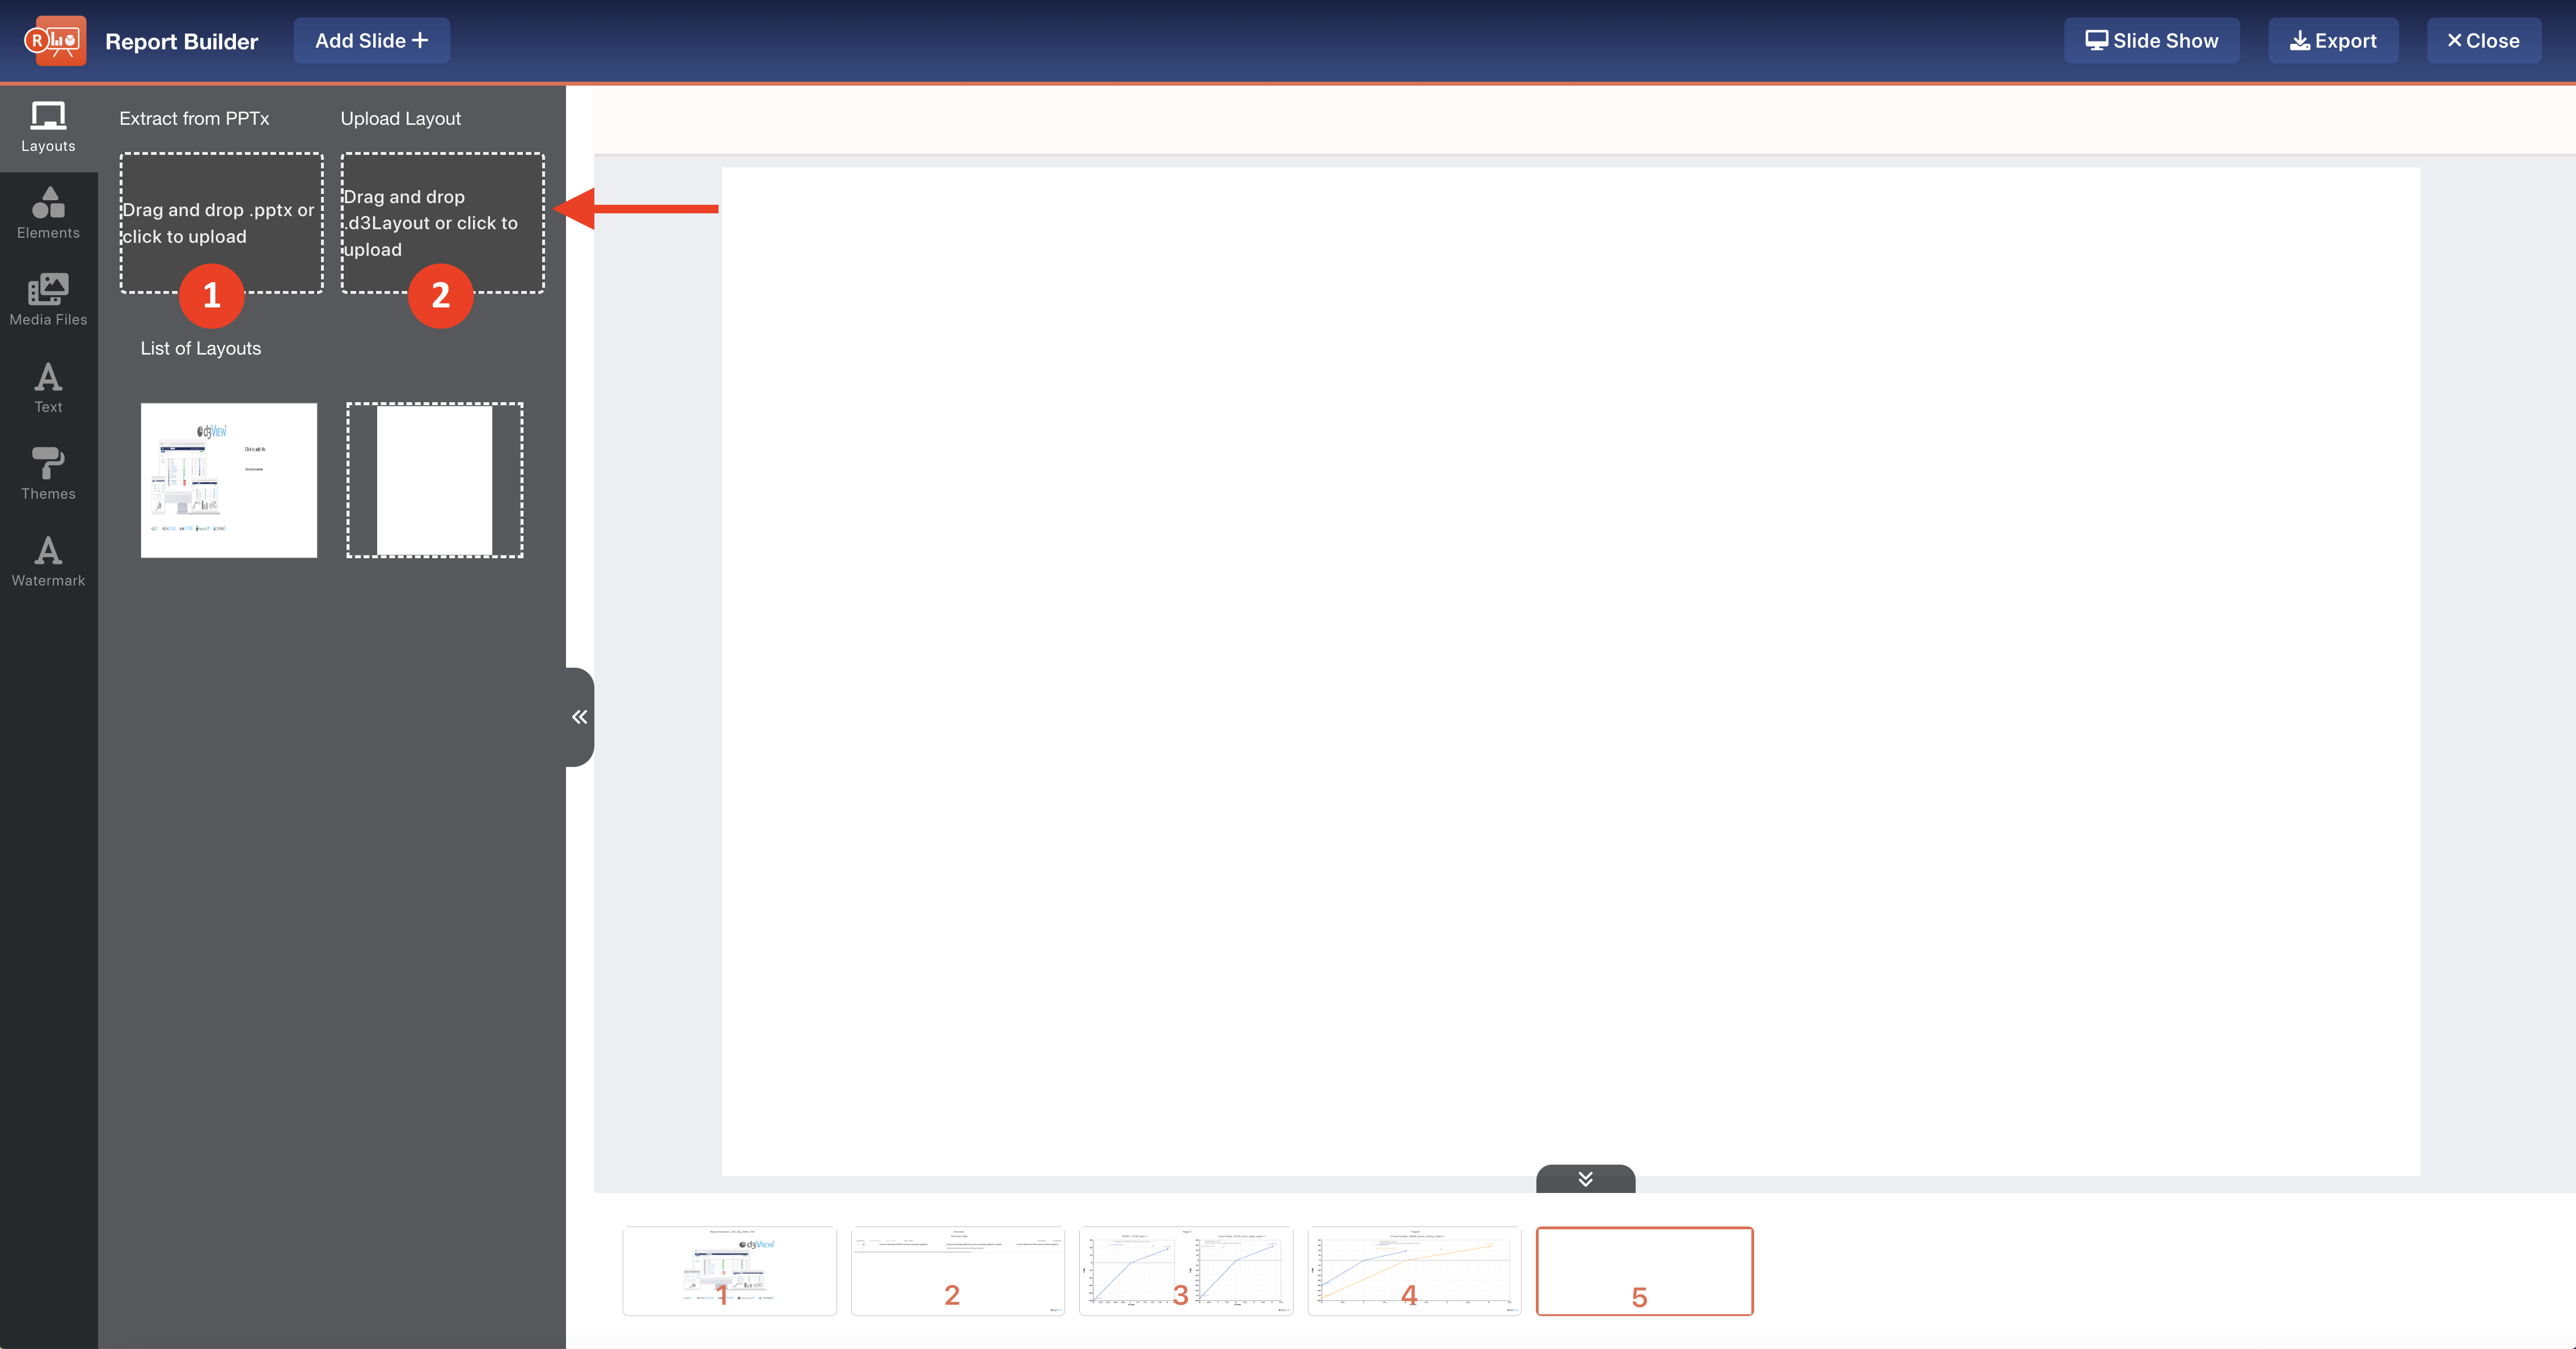
Figure 10: Extract or Upload Layouts
33.3. Designing
Let’s go over ways we can design our slides.
Editing Charts
Click on a chart or chart title until it is outlined in red to edit it.
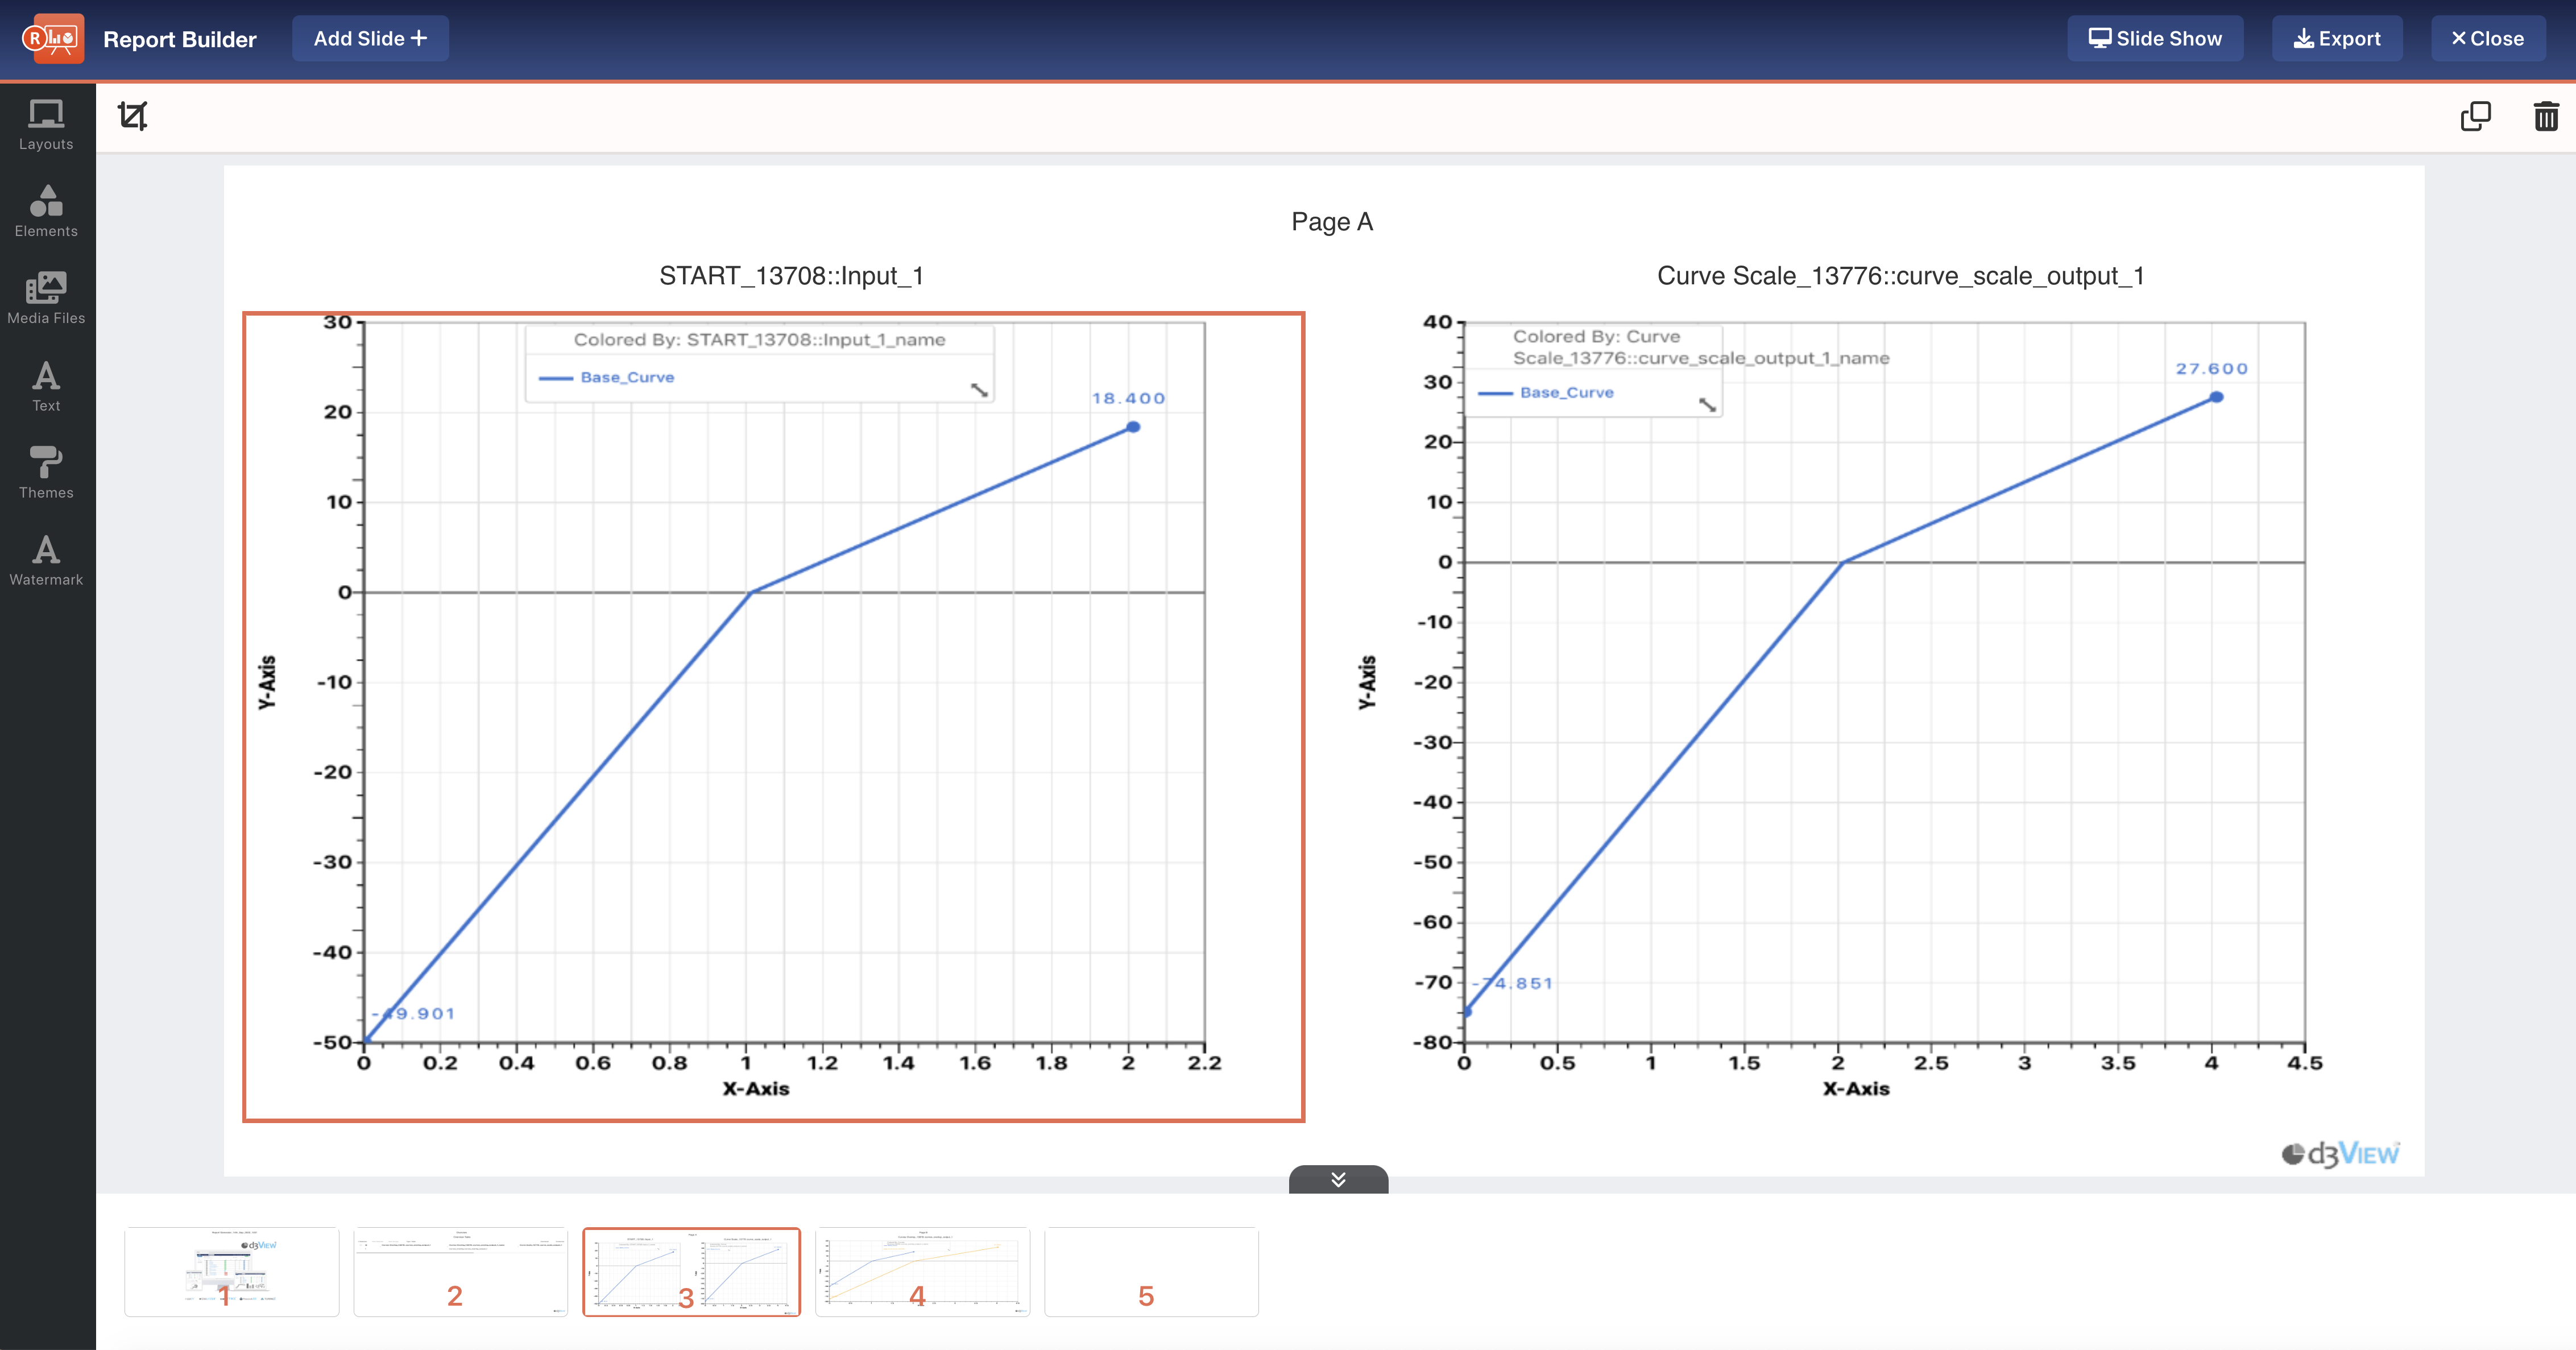
Figure 11: Click on Chart
We can resize our charts and update the title text as we like.
We can also change the visualization settings but right-clicking on the highlighted chart, and choosing “Edit Chart”.
Elements
Under the Elements tab on the left side, we can add shapes, lines and arrows to help annotate or highlight areas of our slides.
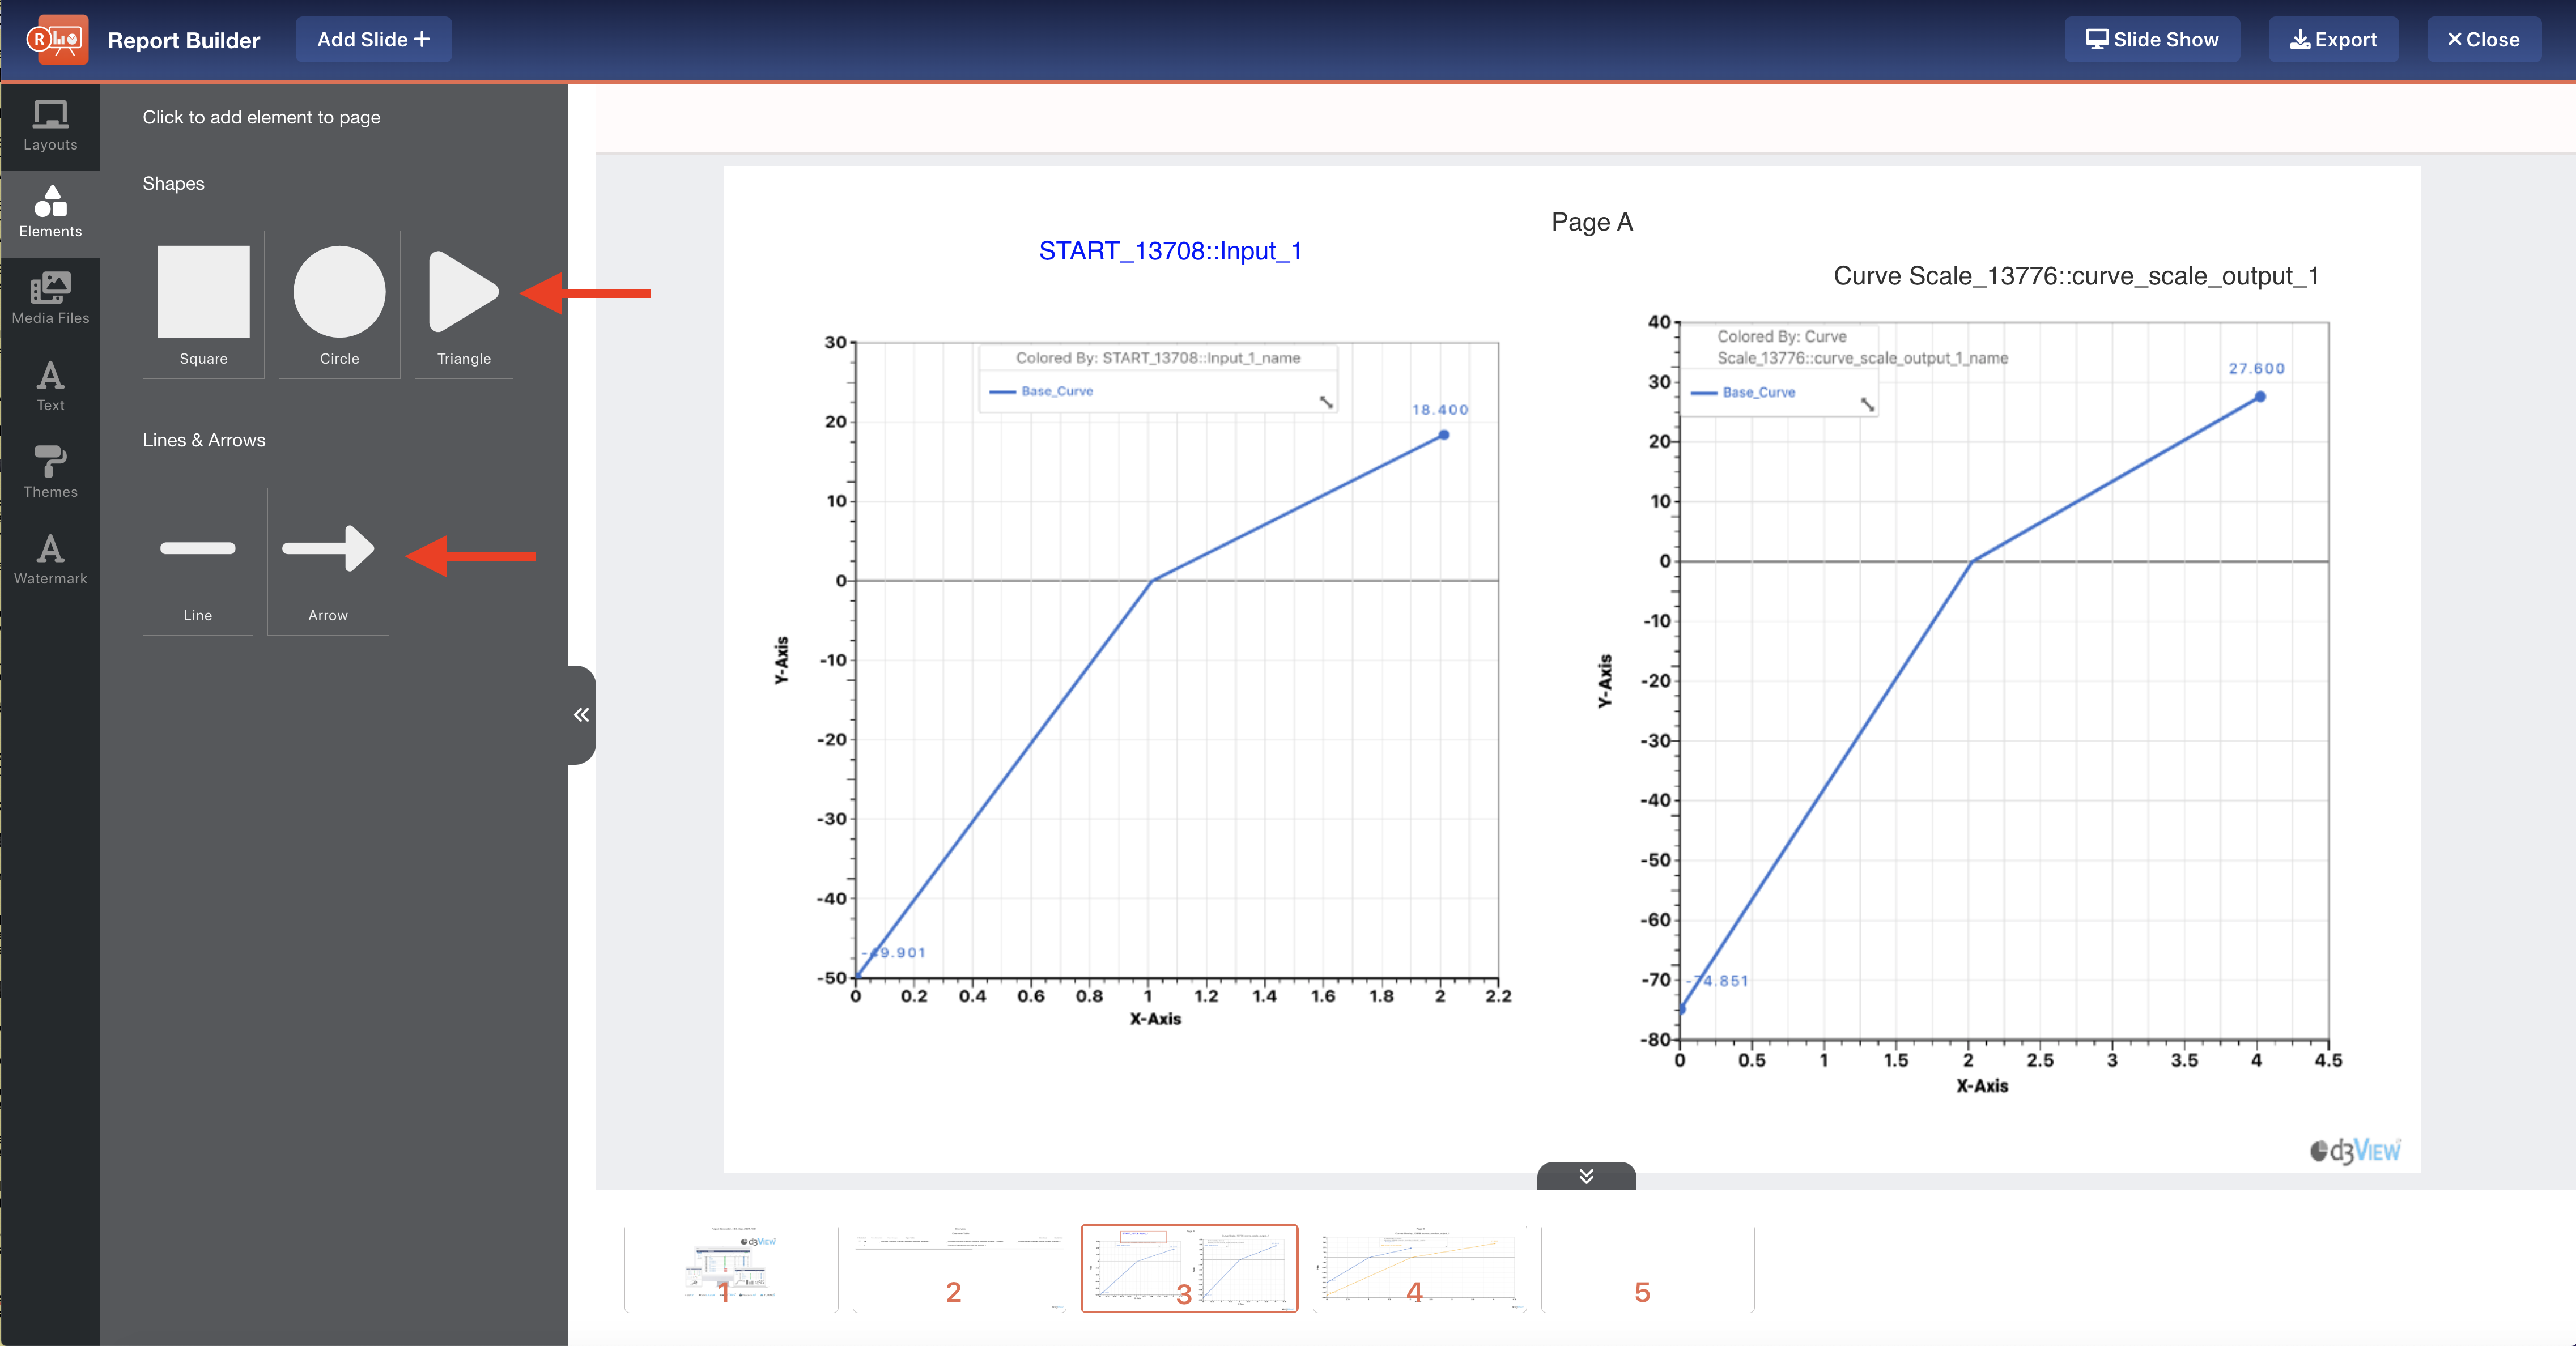
Figure 12: Add Elements
Drag-and-drop or click to add an element. Click on them to resize, move or recolor.
Media Files
Under the Media Files tab, upload images or GIFs to add to your slides.
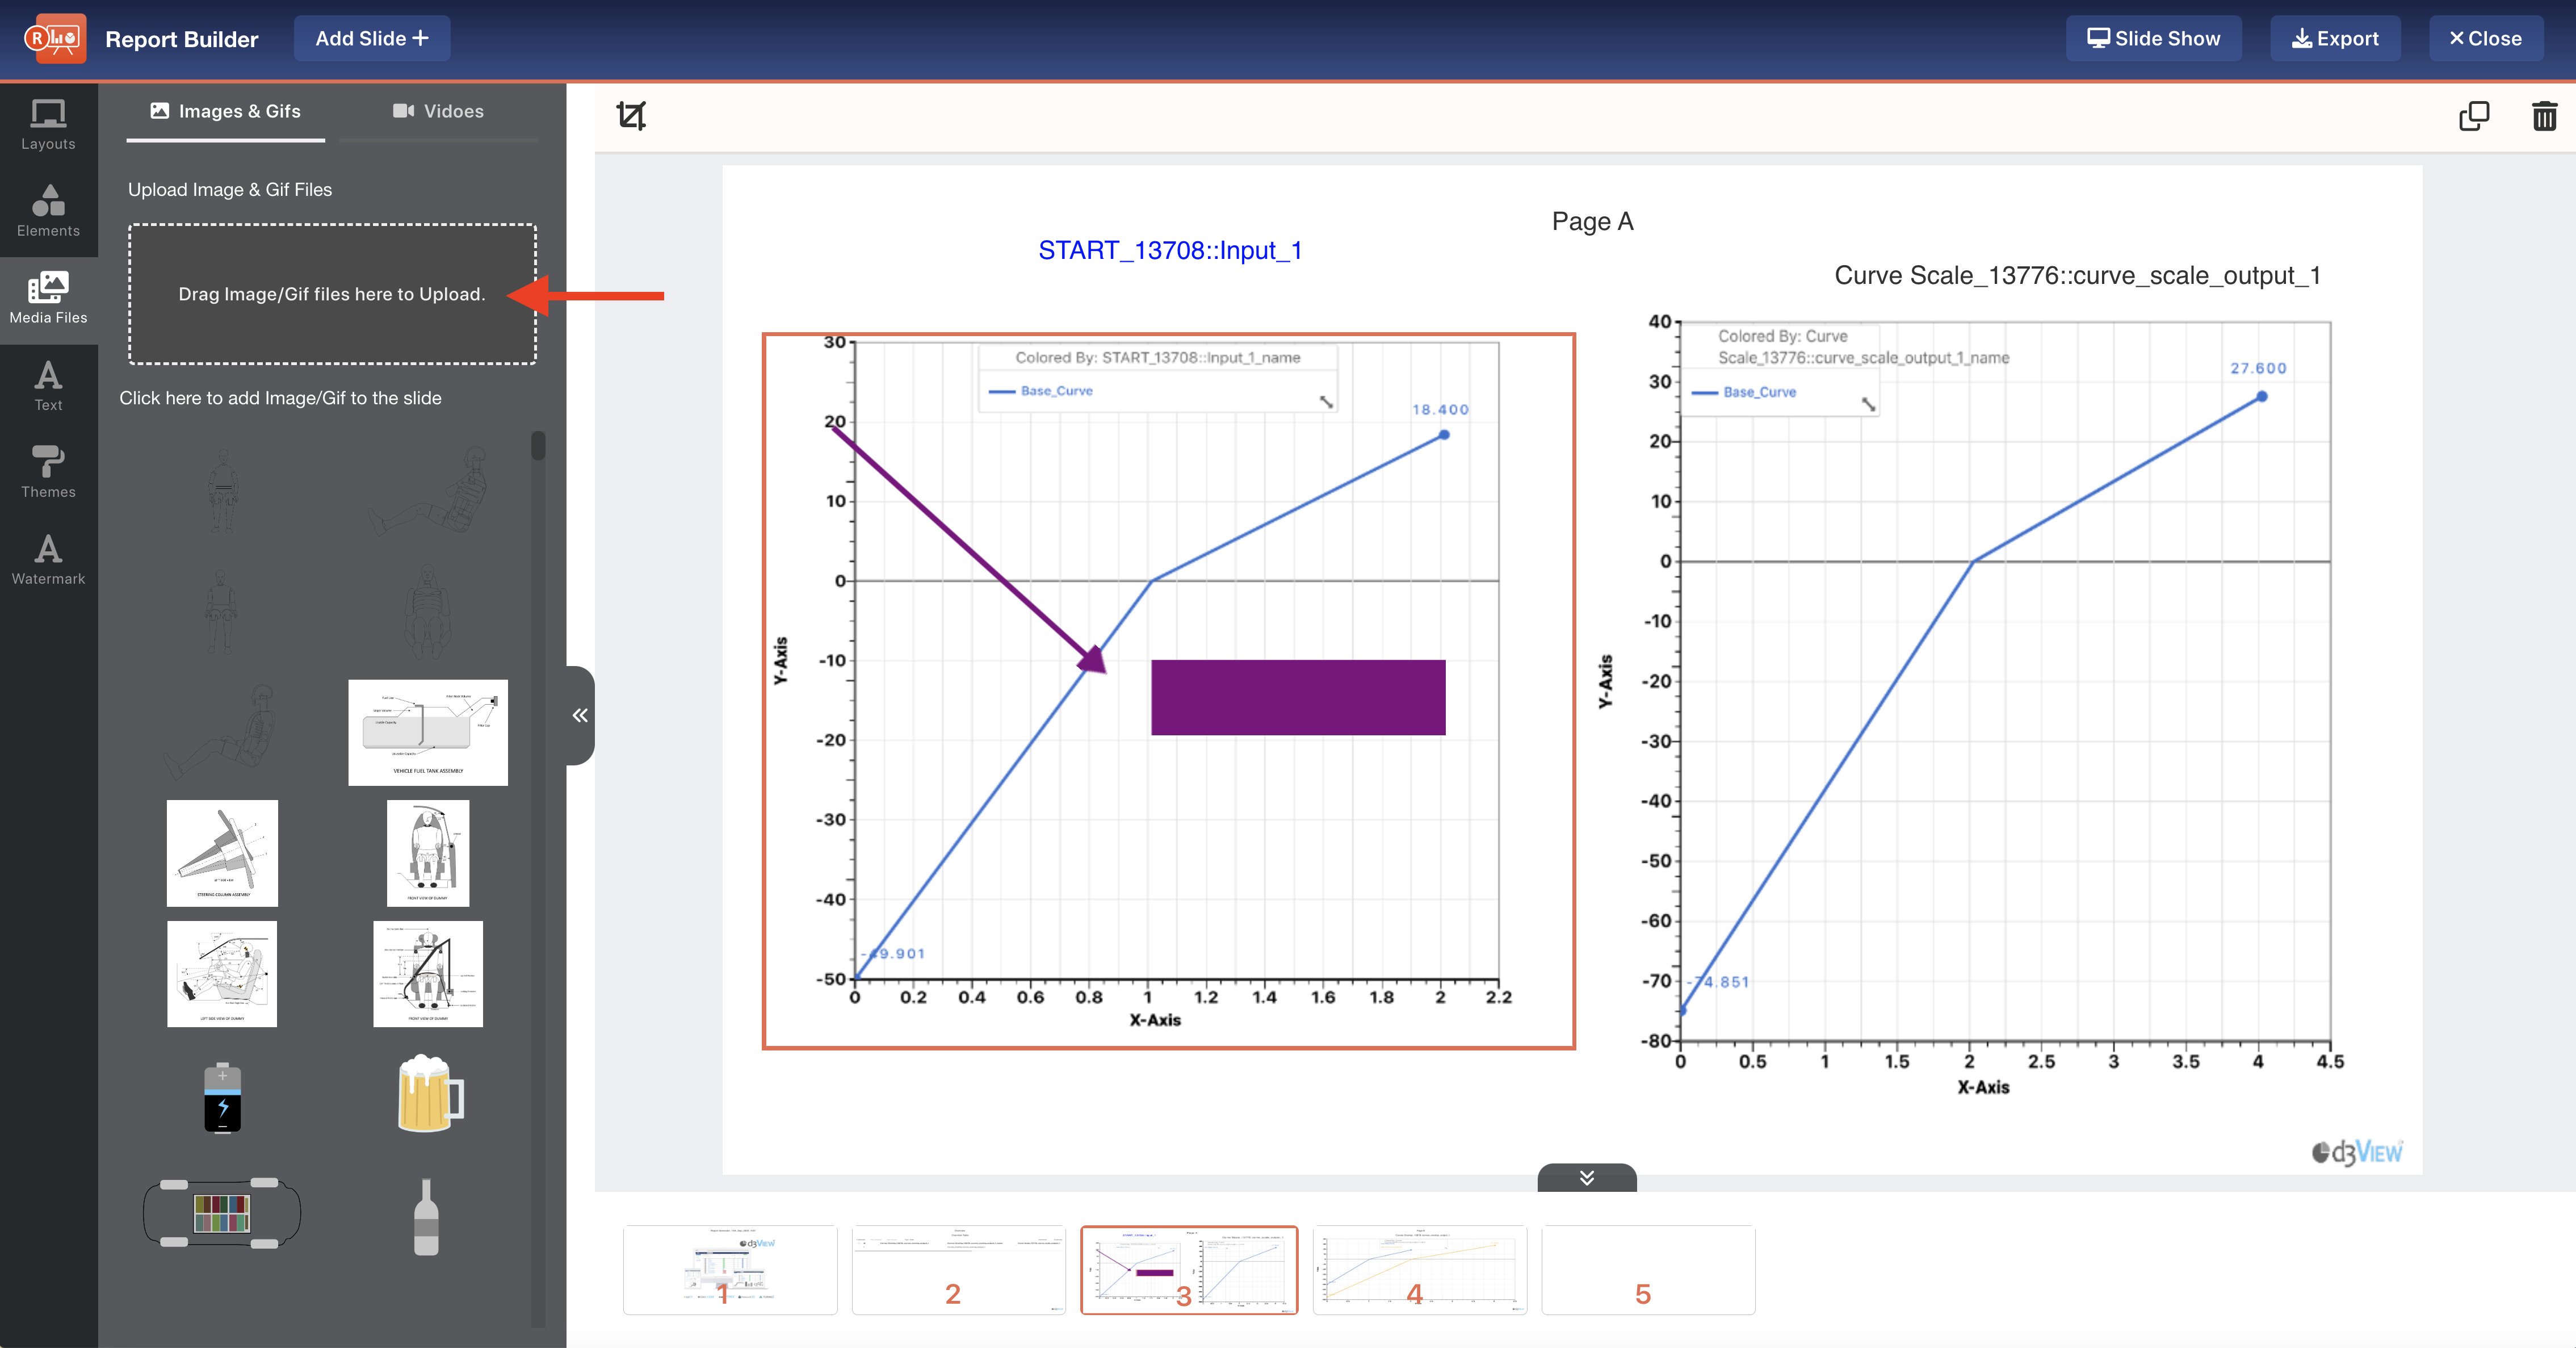
Figure 13: Upload Media
Once uploaded, they will appear in the media library along with the built-in media options for us to add to any of our slides.
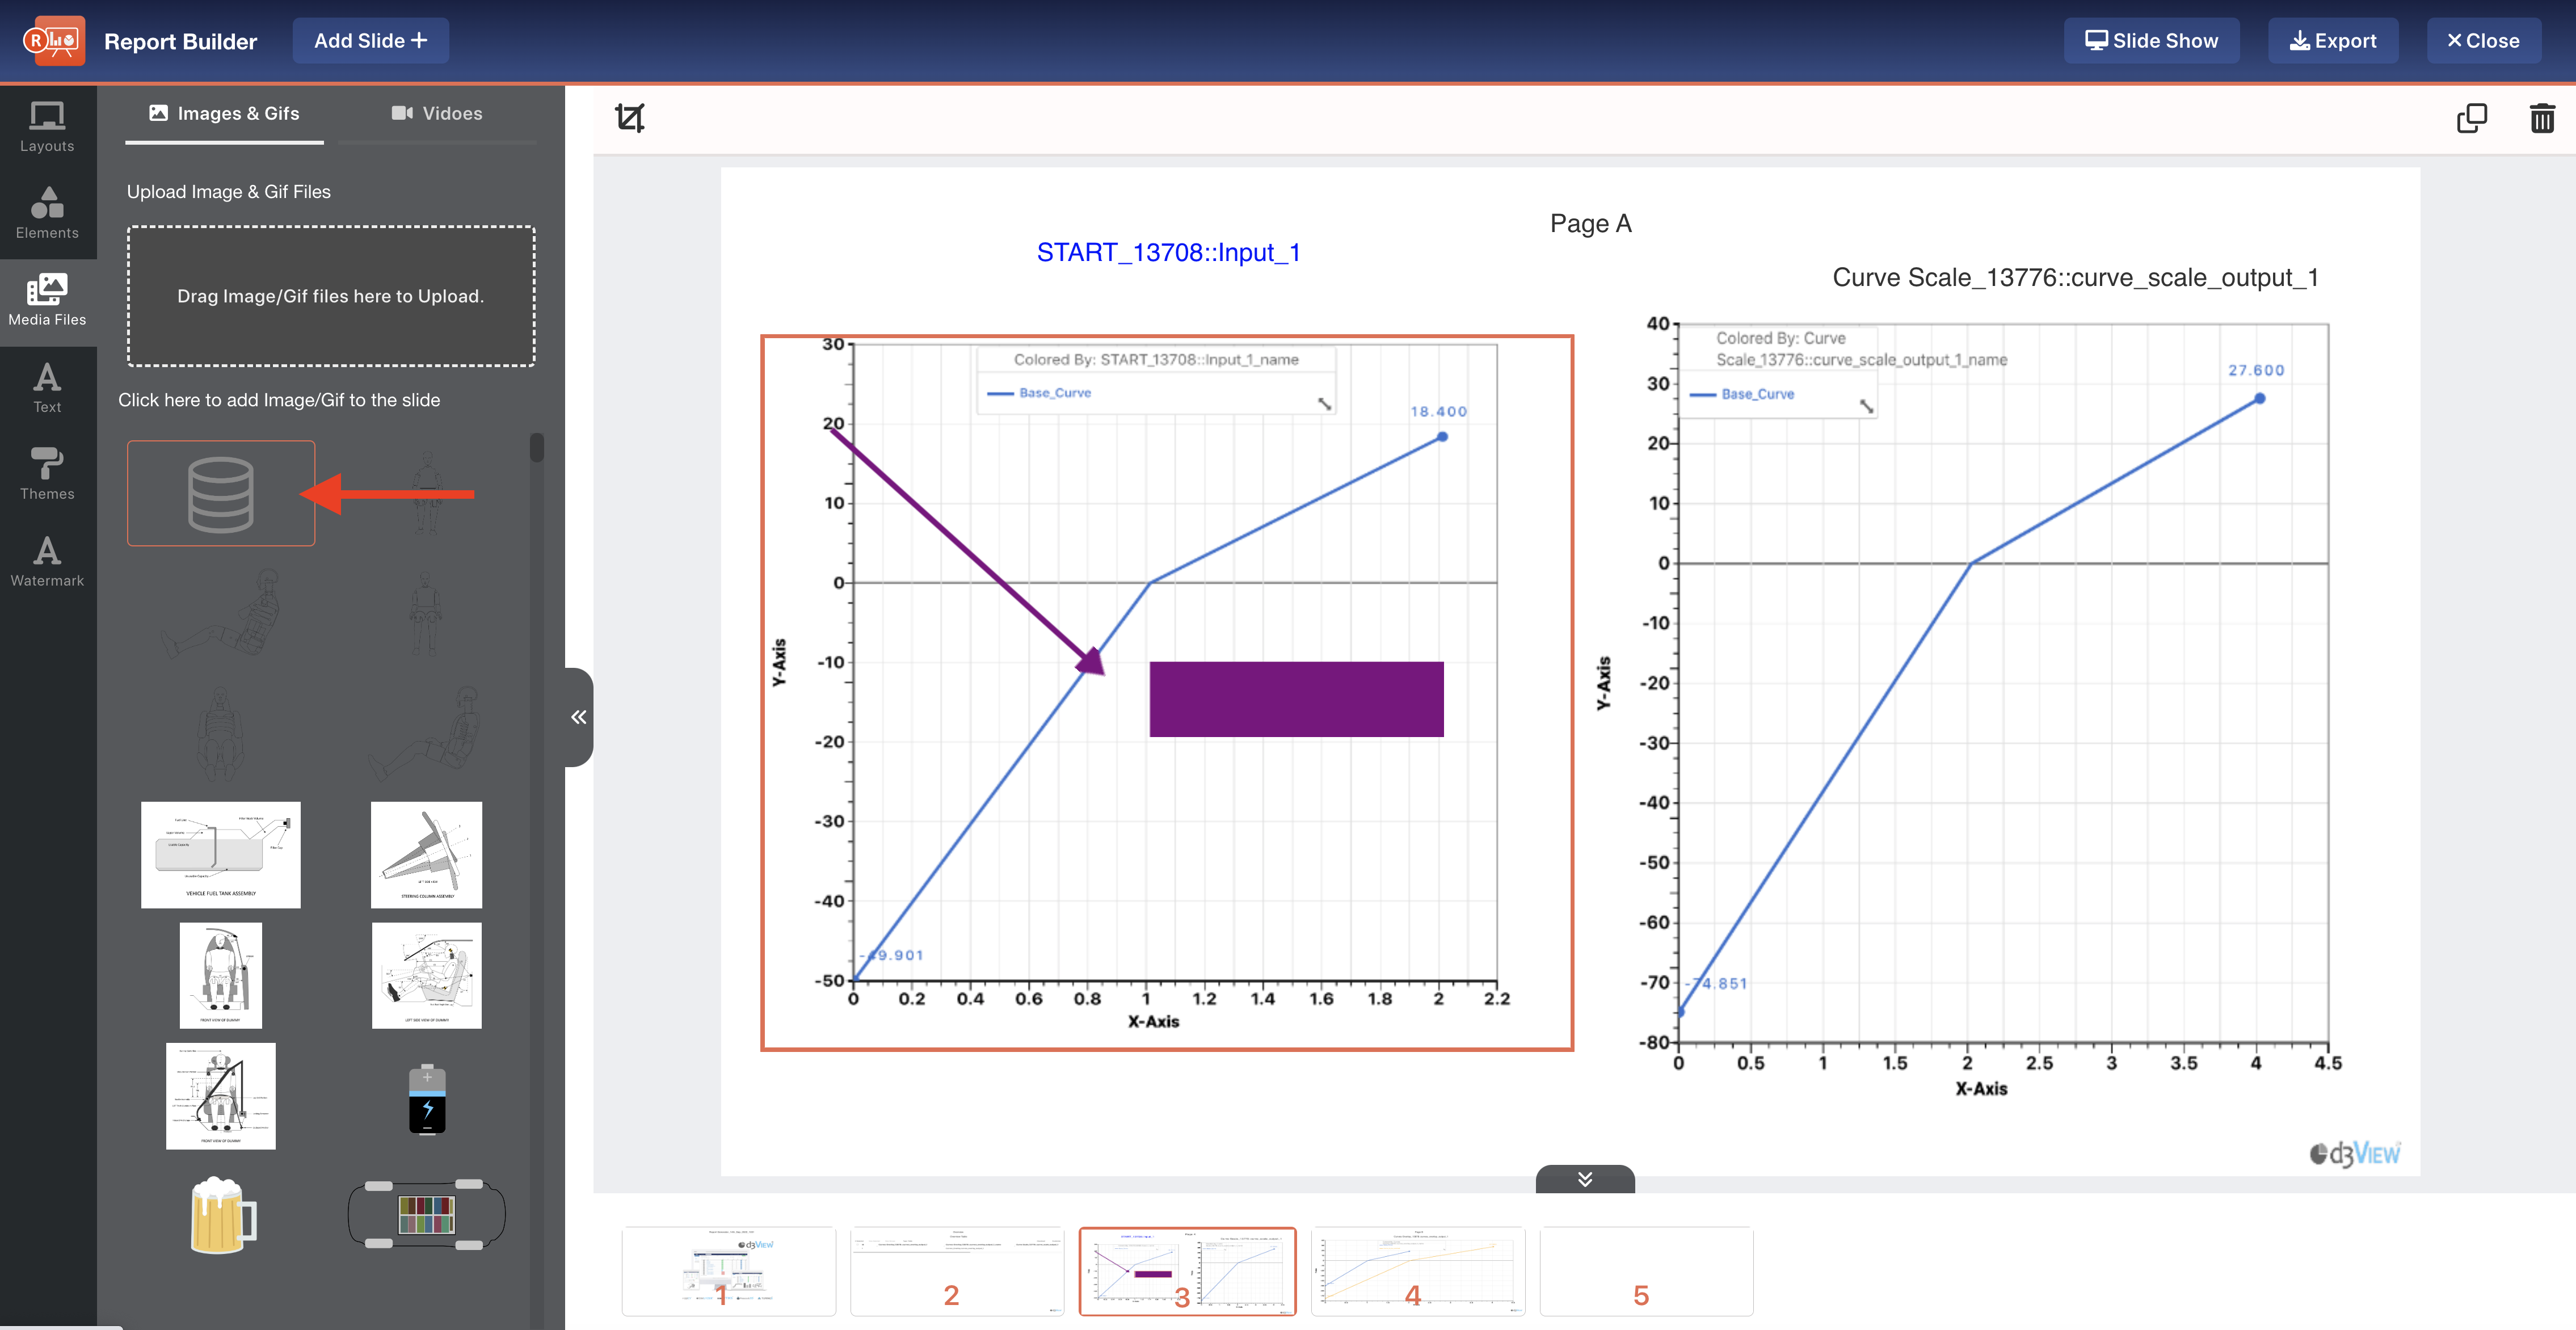
Figure 14: Media Library with Uploaded Image
Drag-and-drop or click to add an image to the slide, and resize or move by clicking and dragging.
Text
Under the Text tab, add headings, subheadings or body text to your slides.
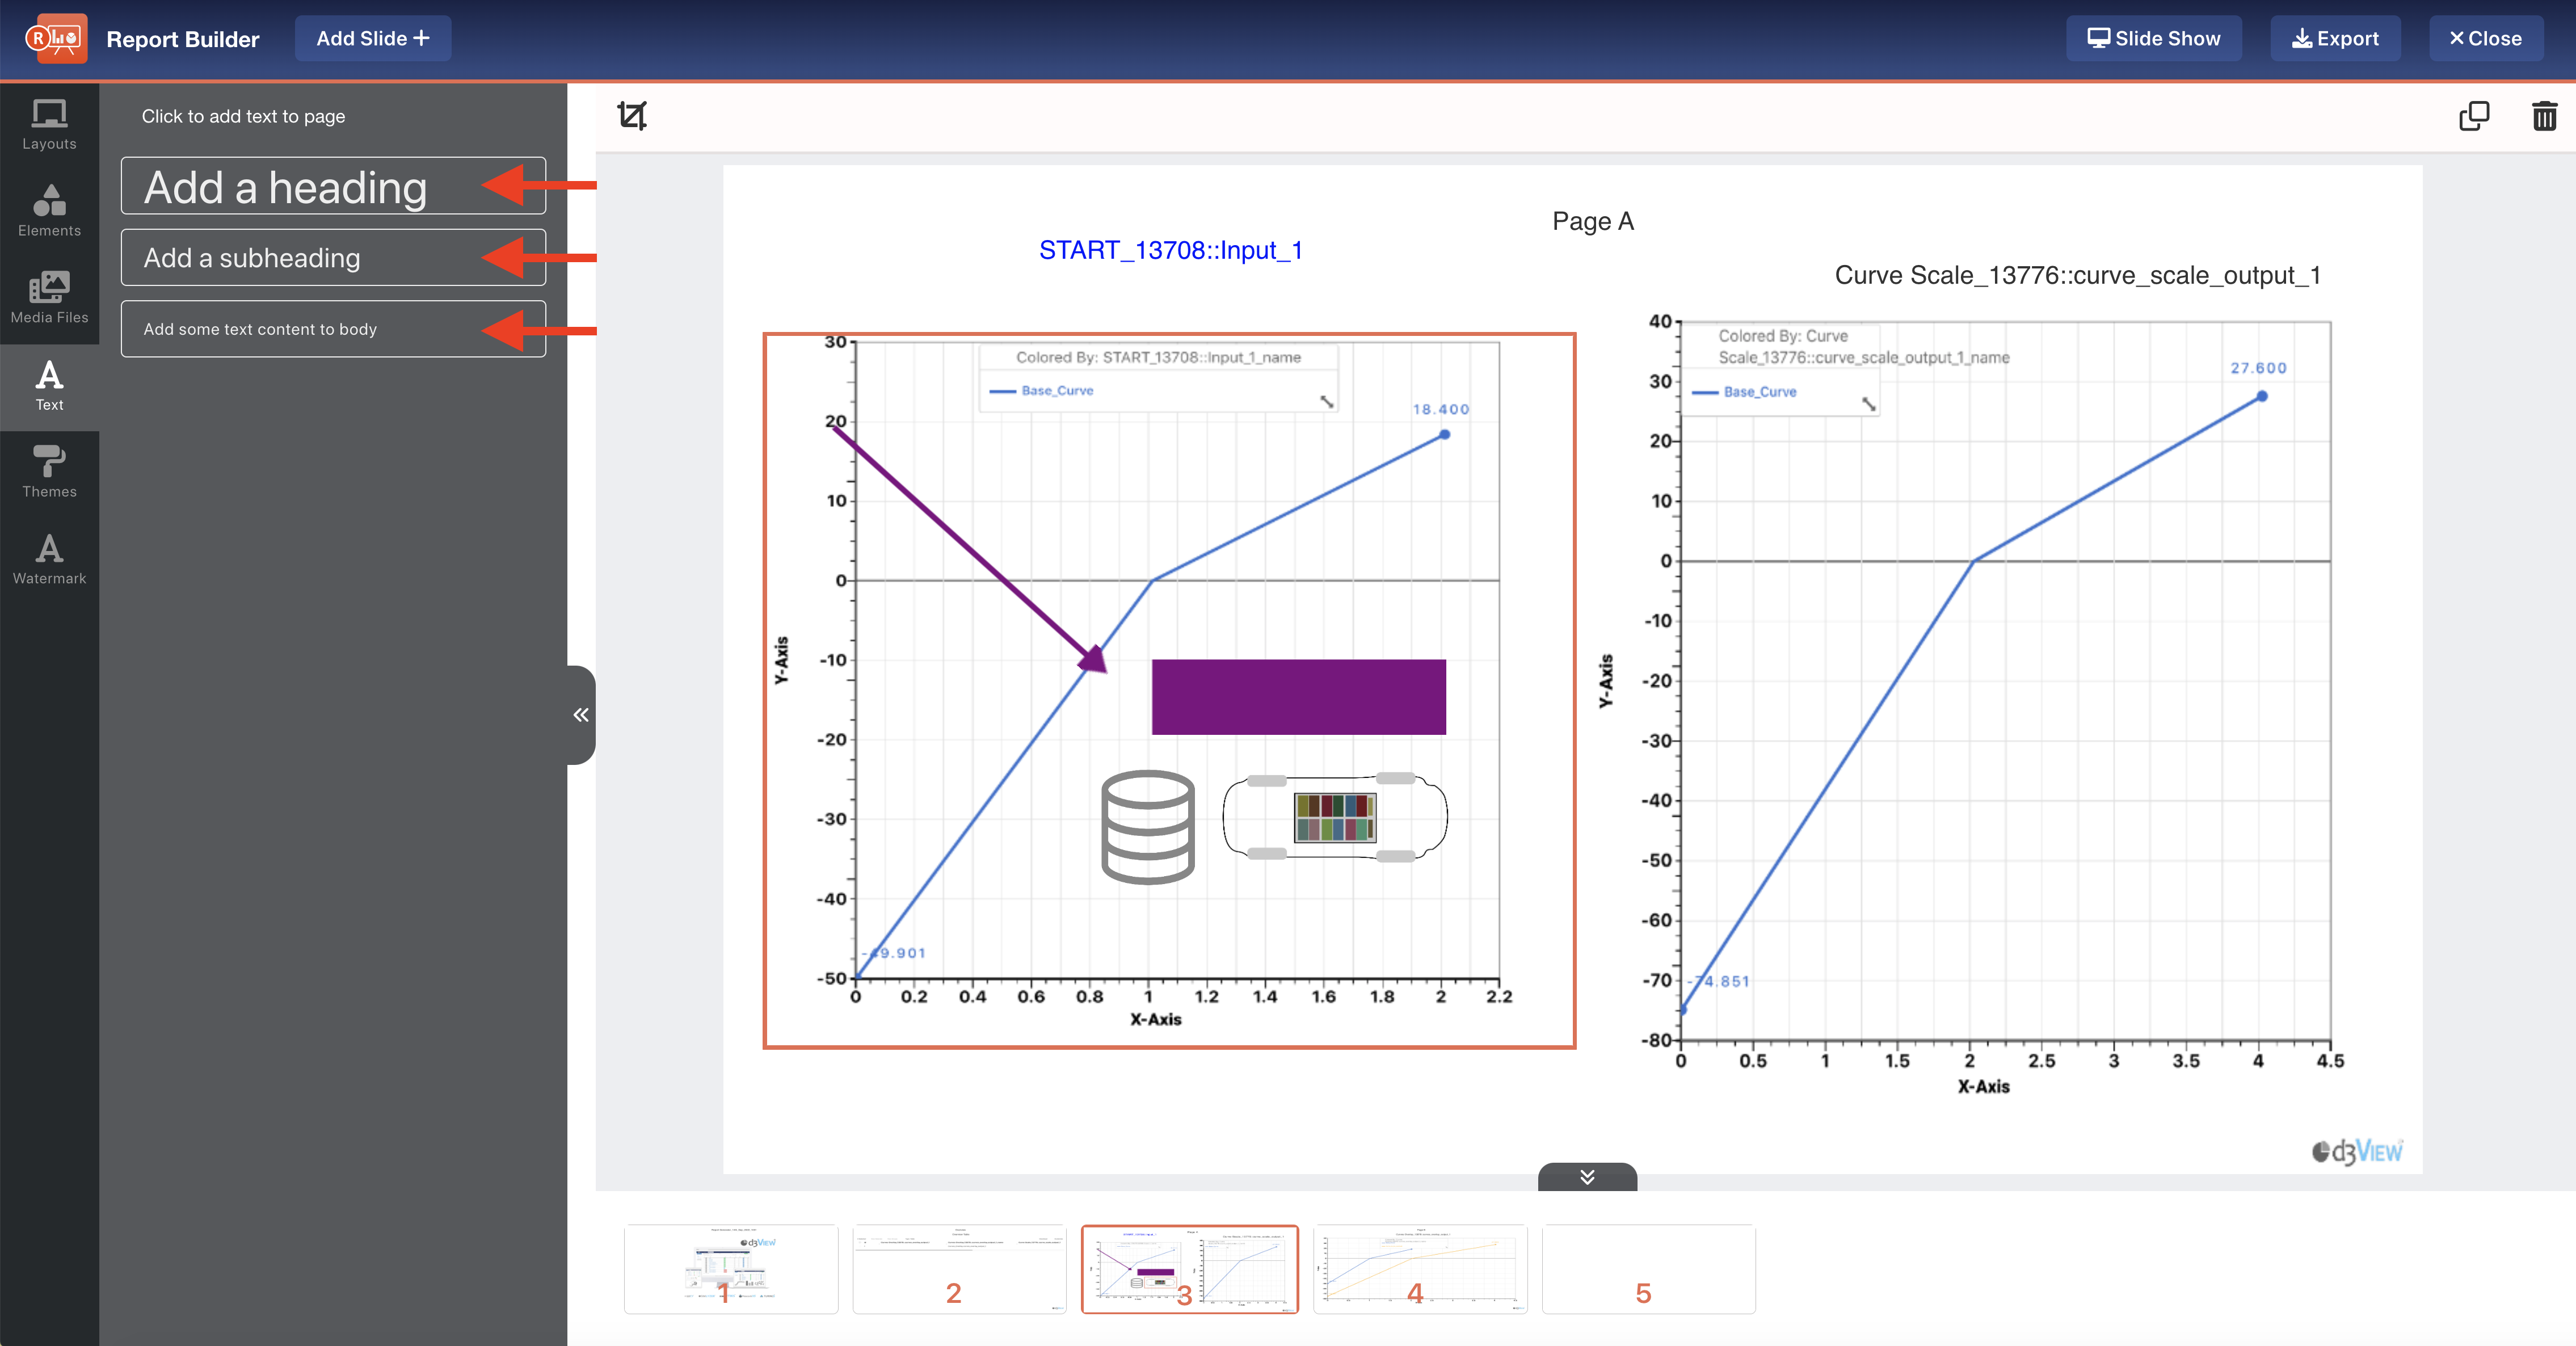
Figure 15: Add Text
Click to add them to the slide, and make any necessary edits such as resizing, moving and recoloring.
33.4. Customizing
Let’s go over a couple ways we can customize our report further.
Themes
Under the Themes tan on the left side, we can upload a d3VIEW generated report theme (10 or choose from a solid theme (2).
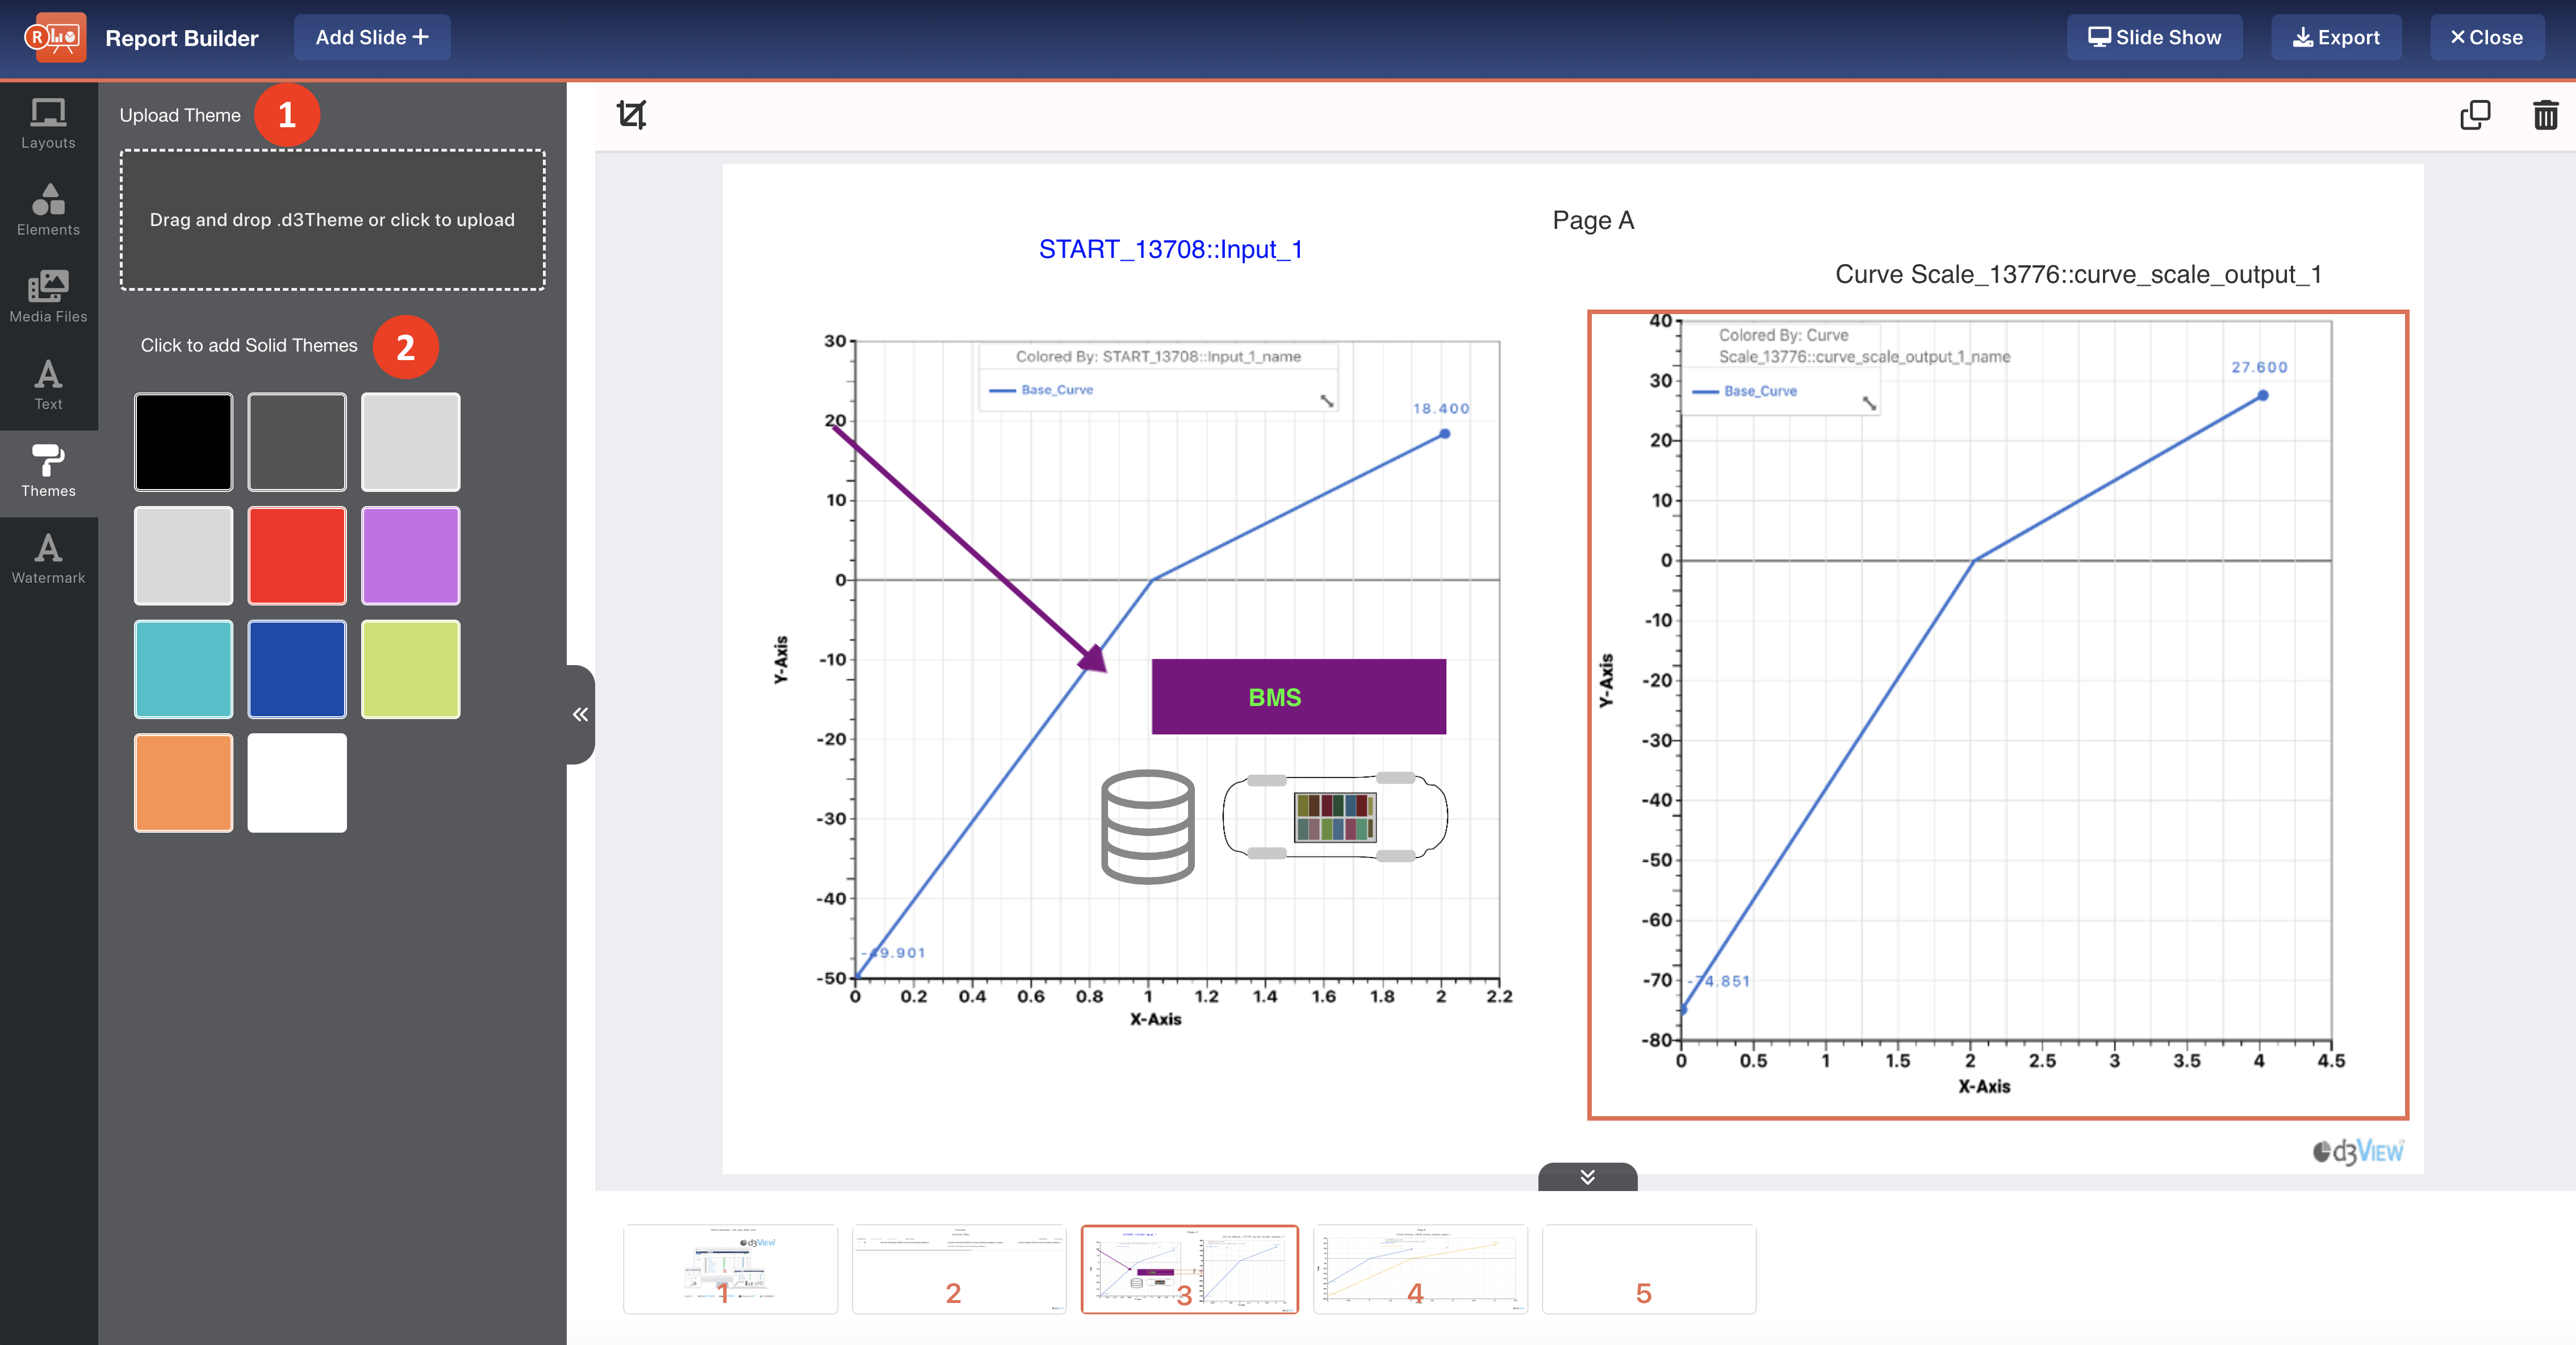
Figure 16: Upload or Choose Theme
Watermark
We also have an option to add a watermark to all slides under the Watermark tab.
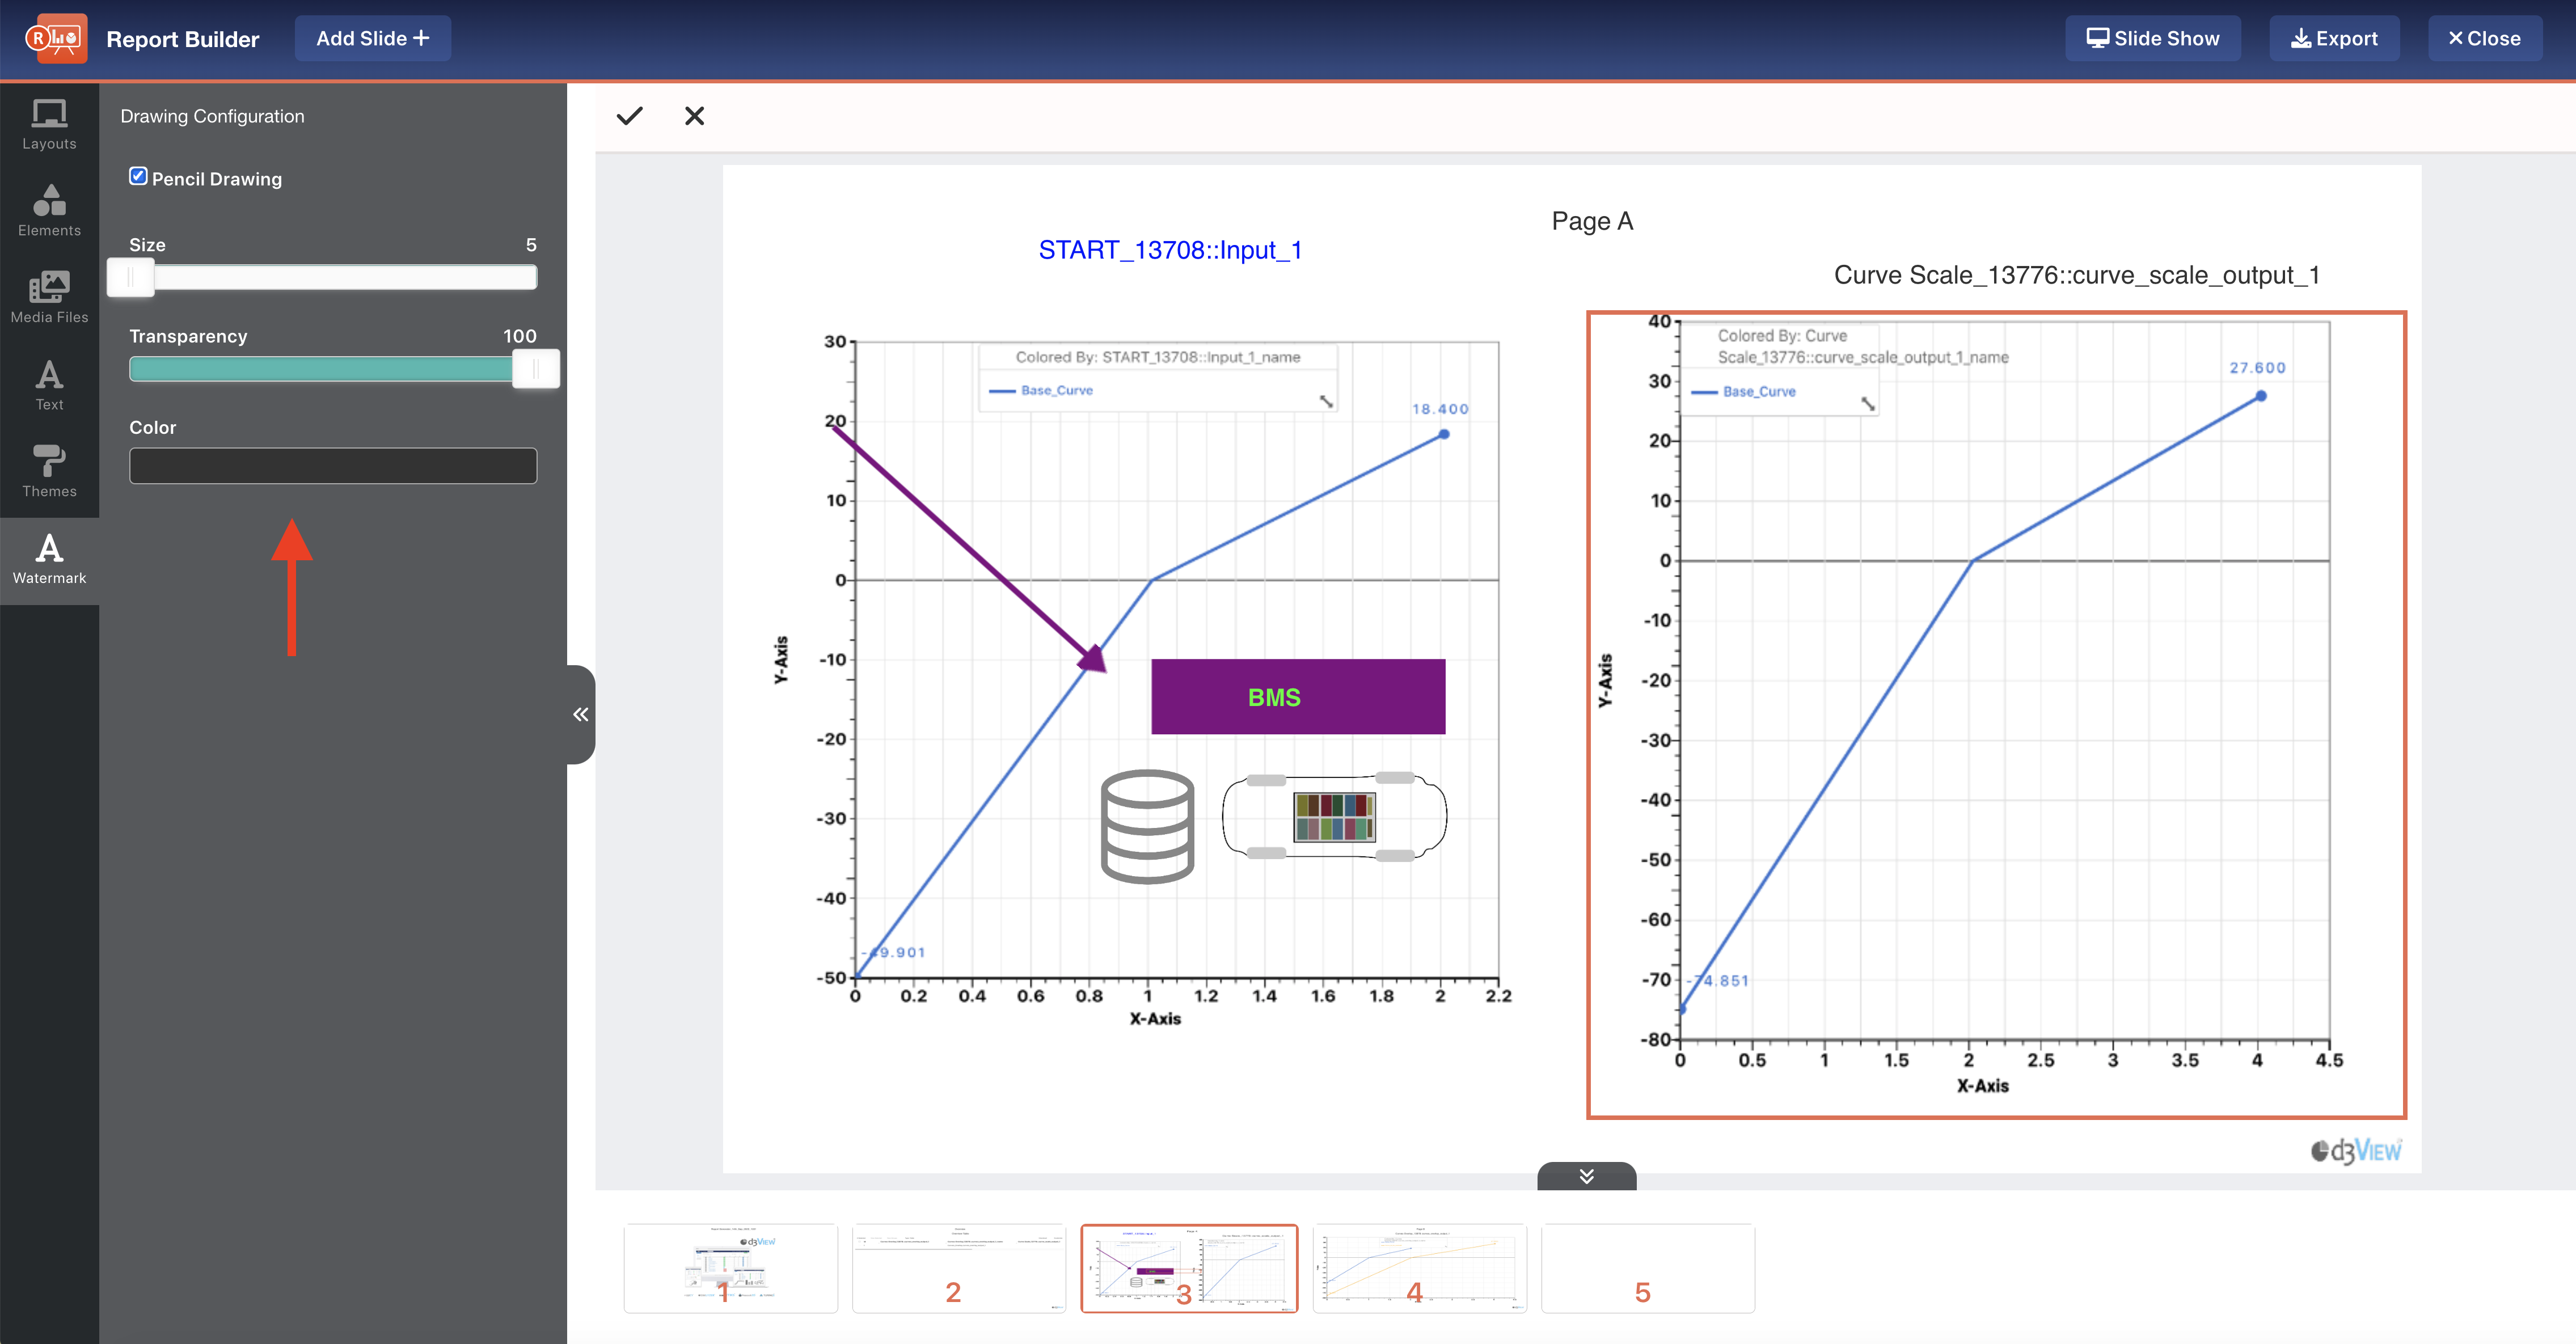
Figure 17: Add Watermark
33.5. Sharing & Exporting
Let’s go over ways we can export our report for sharing.
Slide Show
Use the Slide Show button to preview your report before exporting.
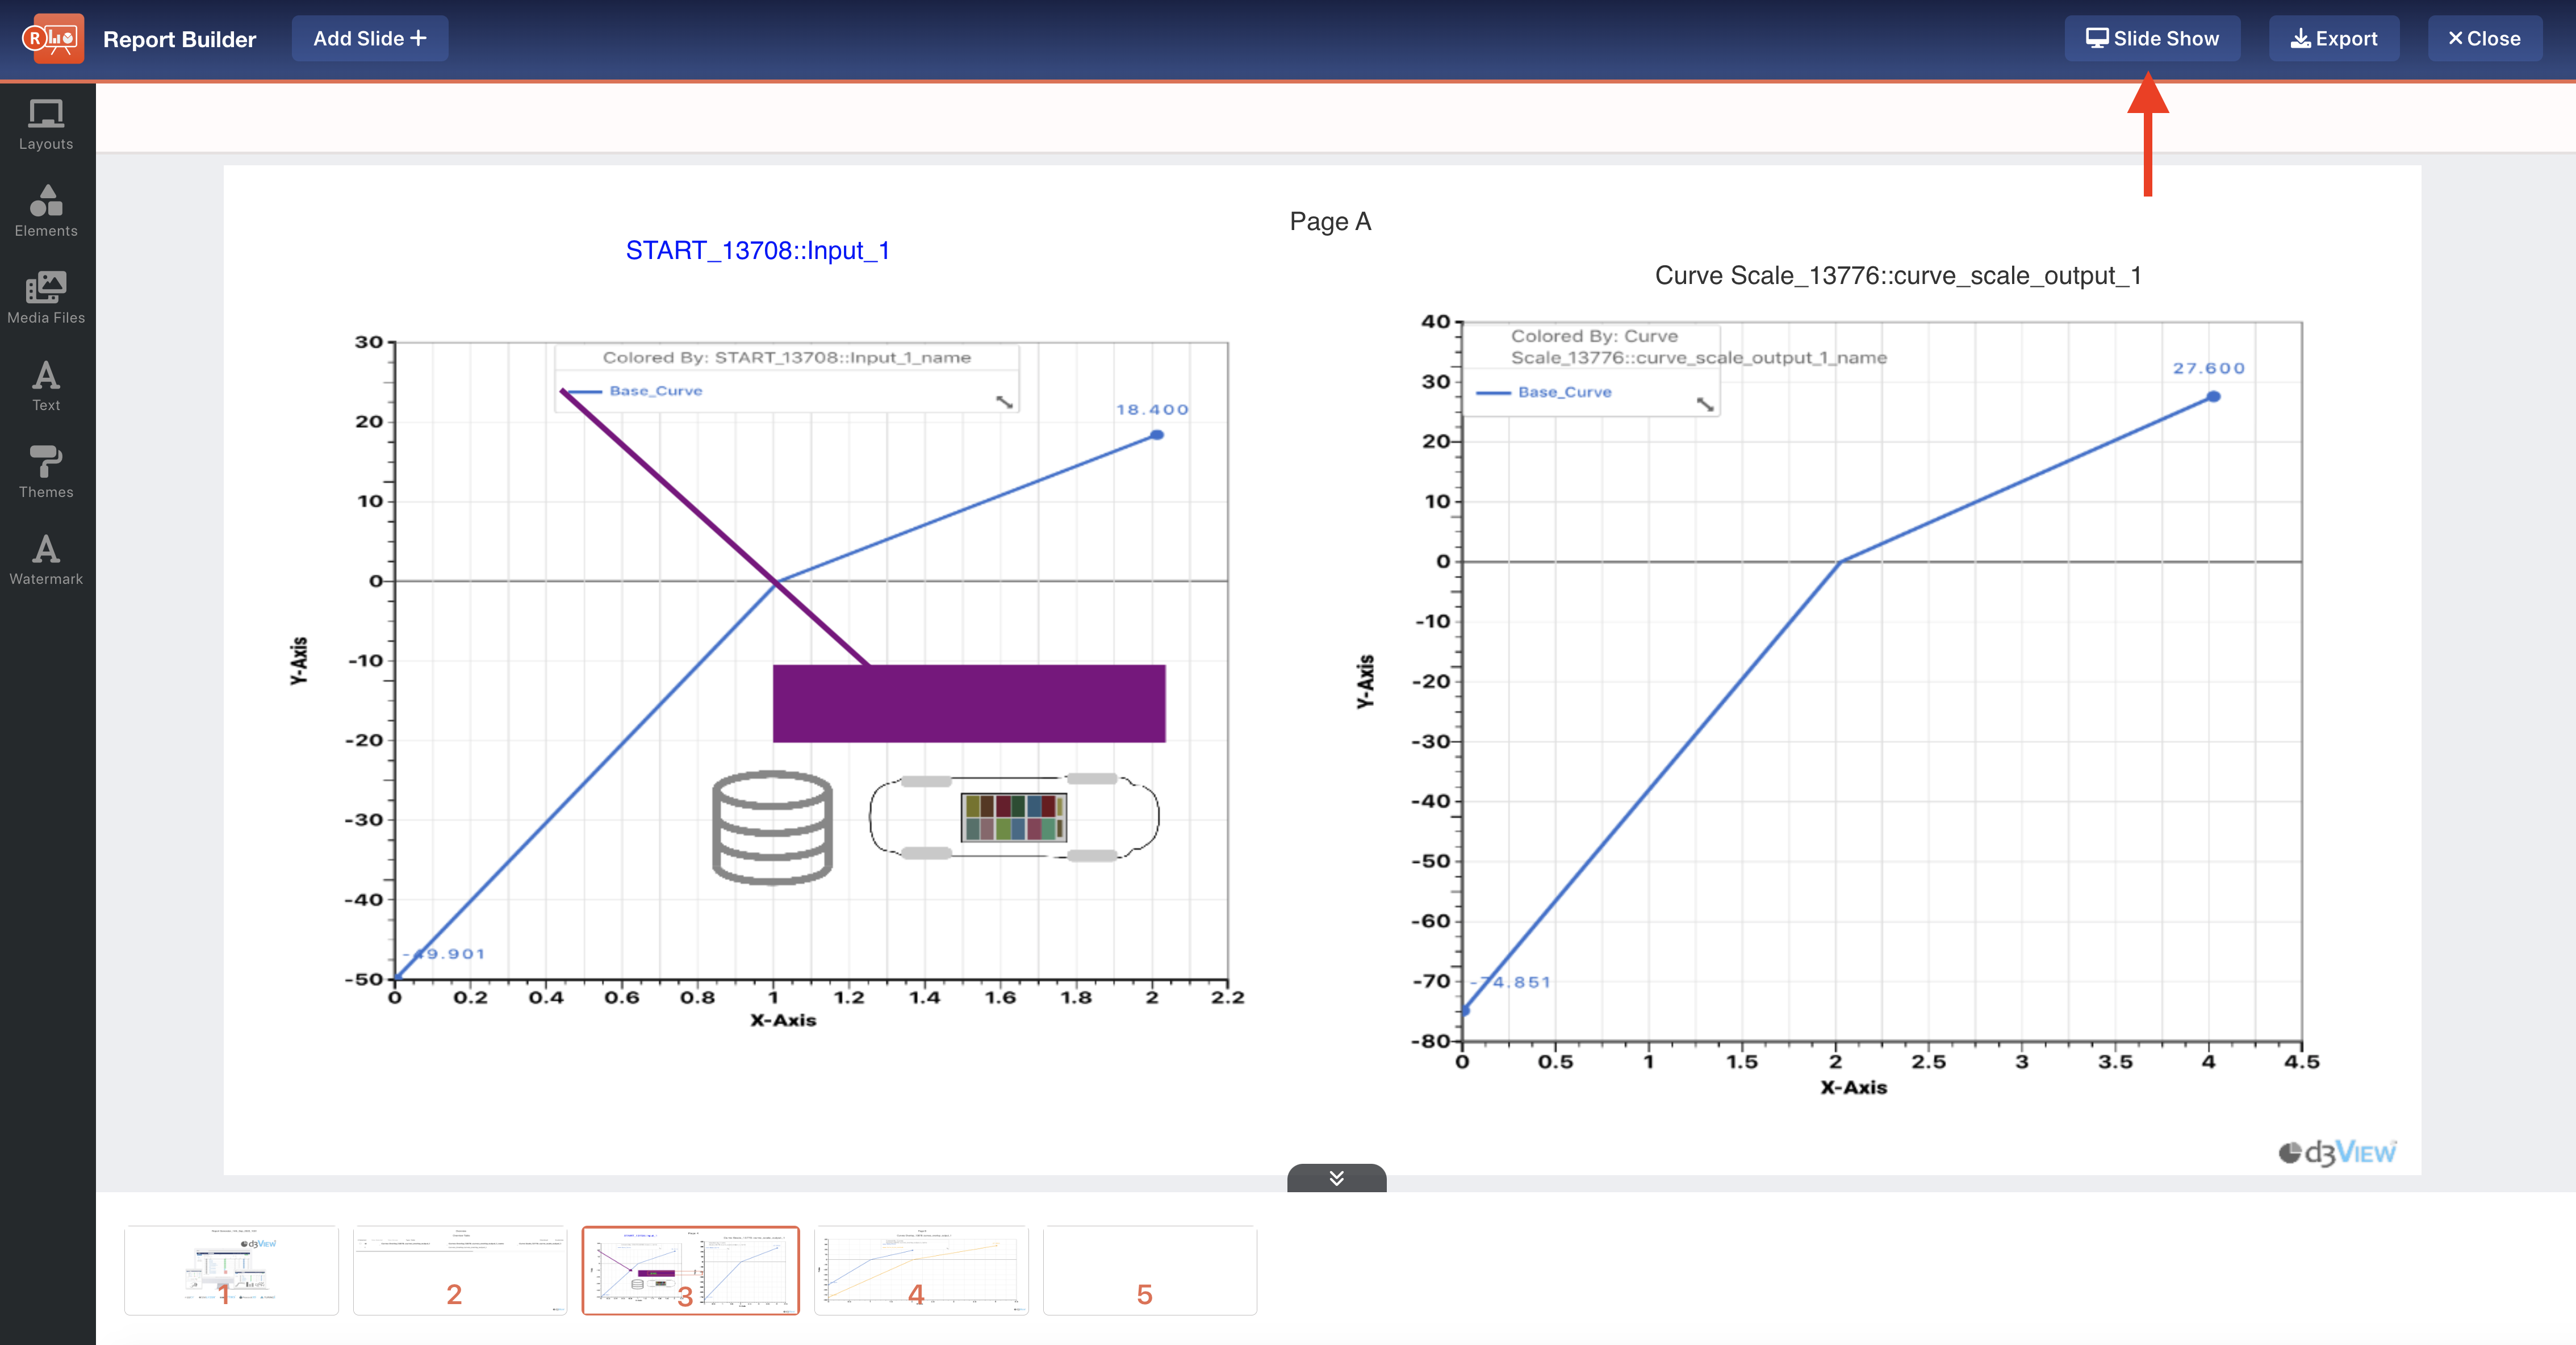
Figure 18: Slide Show
This is also a great option for presenting to colleagues without having to export the report!
Downloading
Click on the Export button to start downloading the report locally.
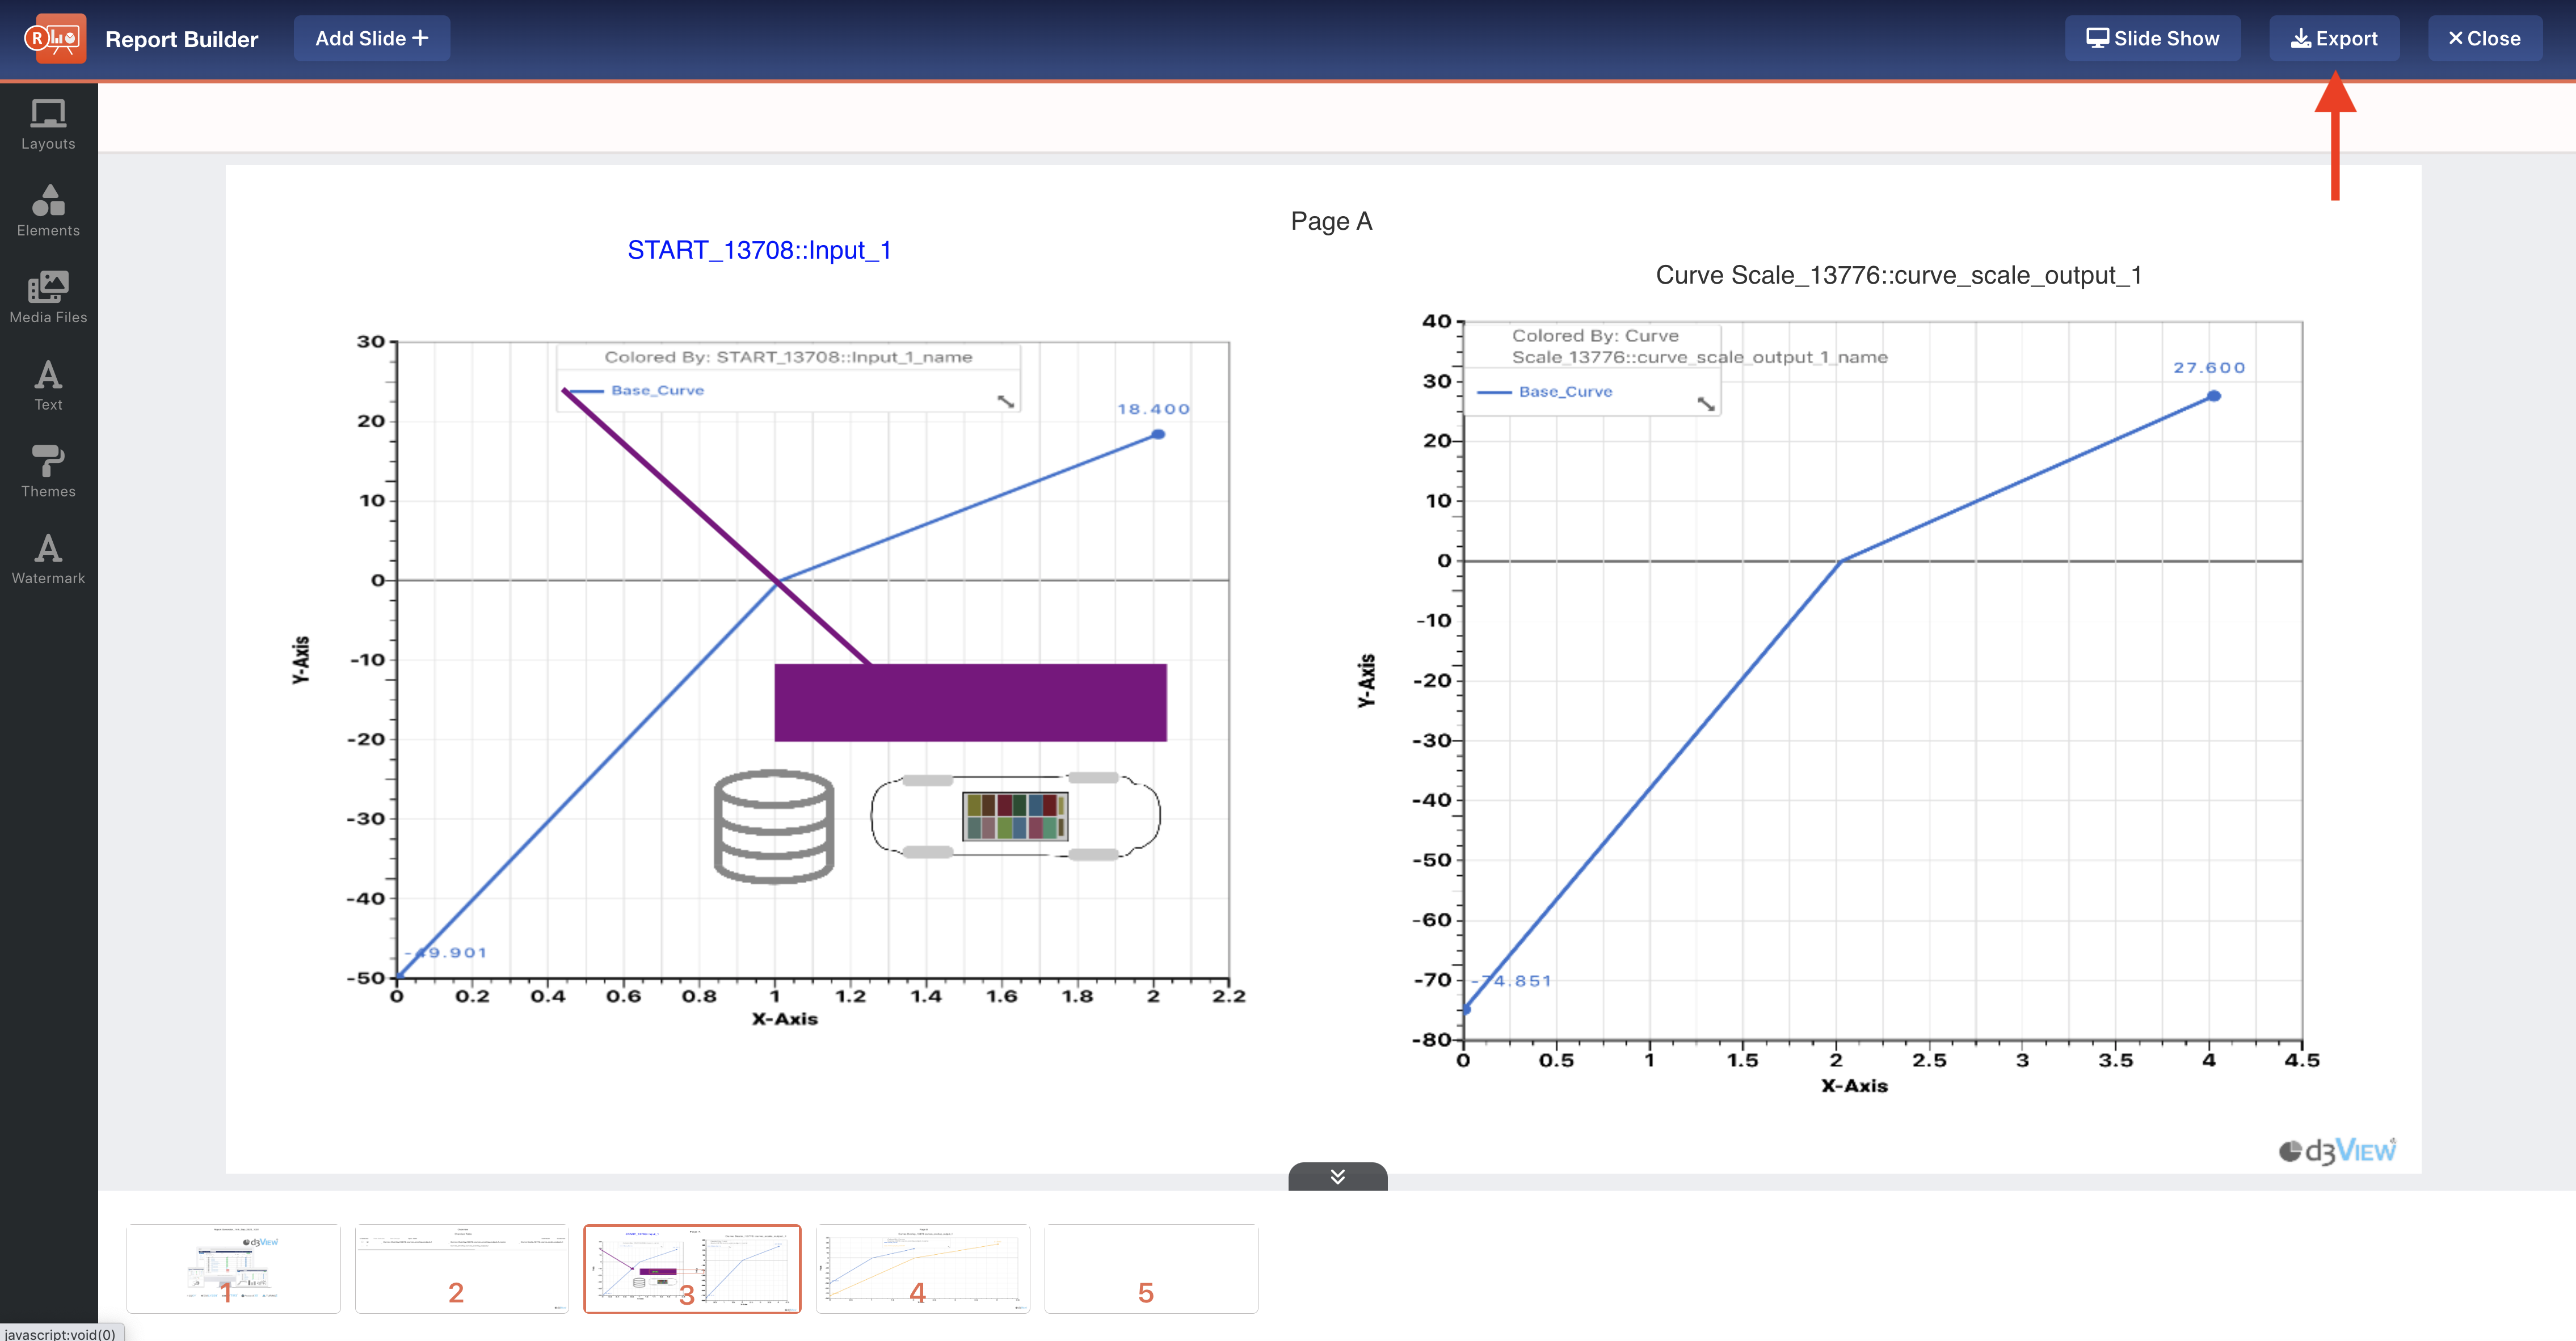
Figure 19: Export Report
Choose between a PPT or PDF file type and whether to include editable tables or the d3VIEW logo. Click Export again to start the download.
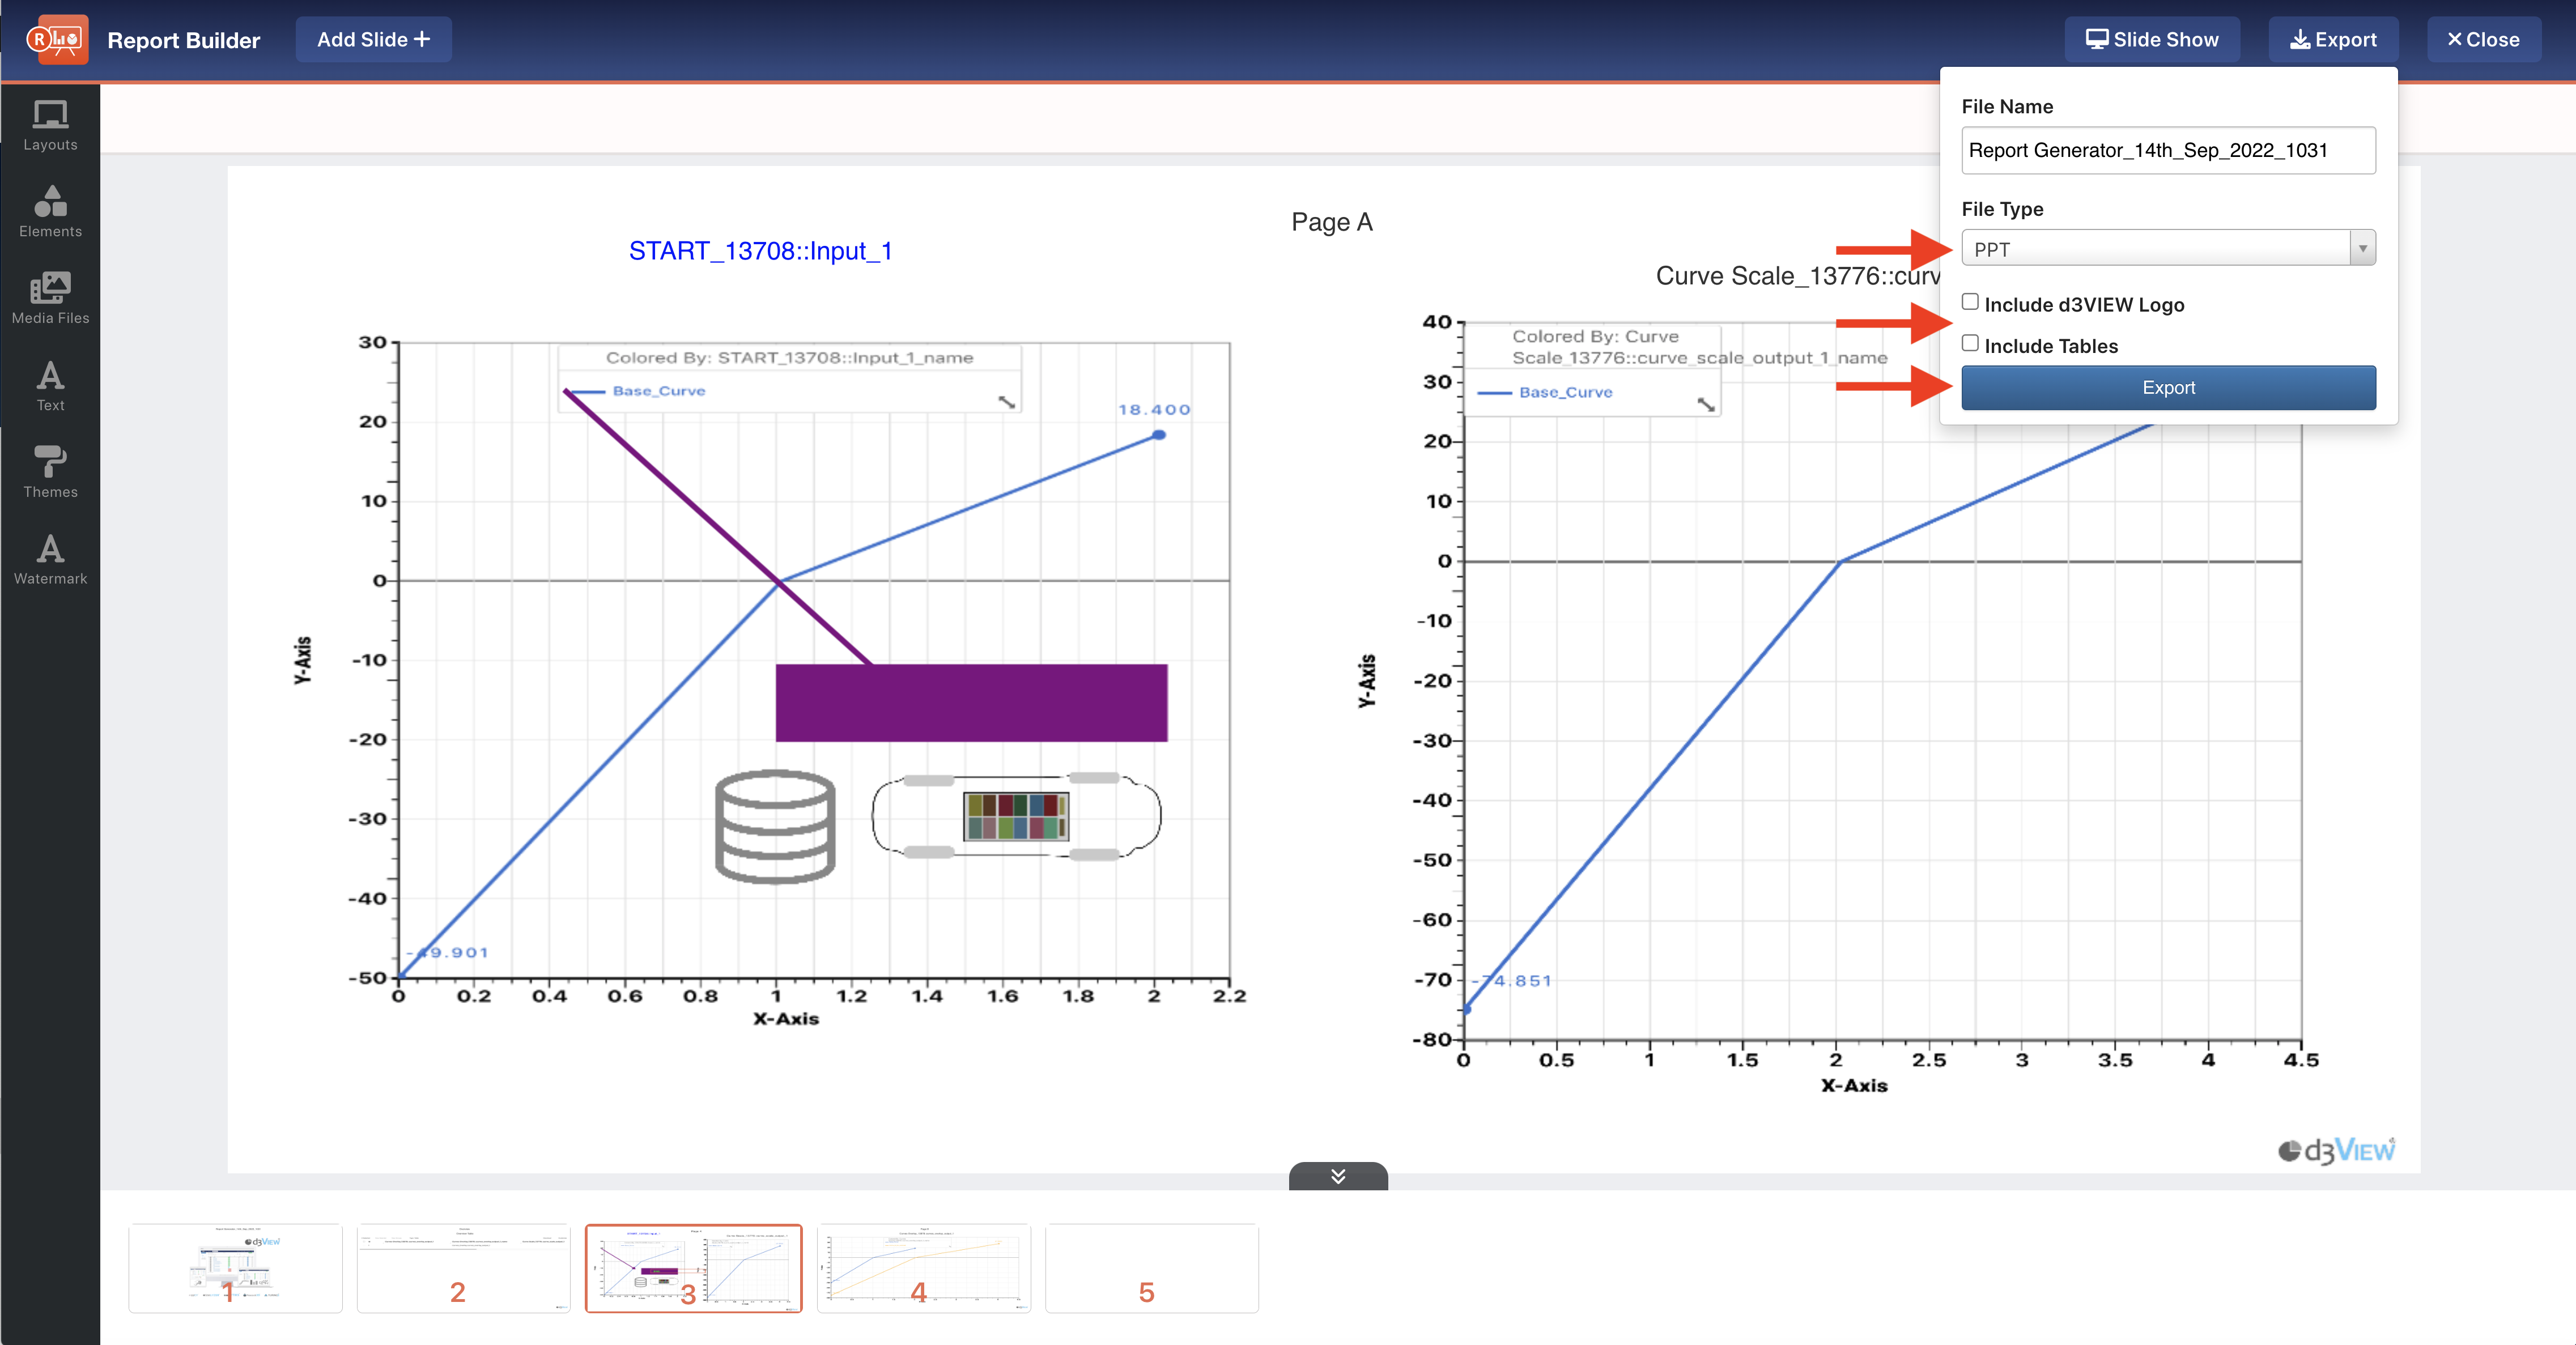
Figure 20: Choose File Type, Editable Tables and Logo, Then Export