Donut Chart Visualization
Donut charts are used to show the proportions of categorical data, with the size of each piece representing the proportion of each category.
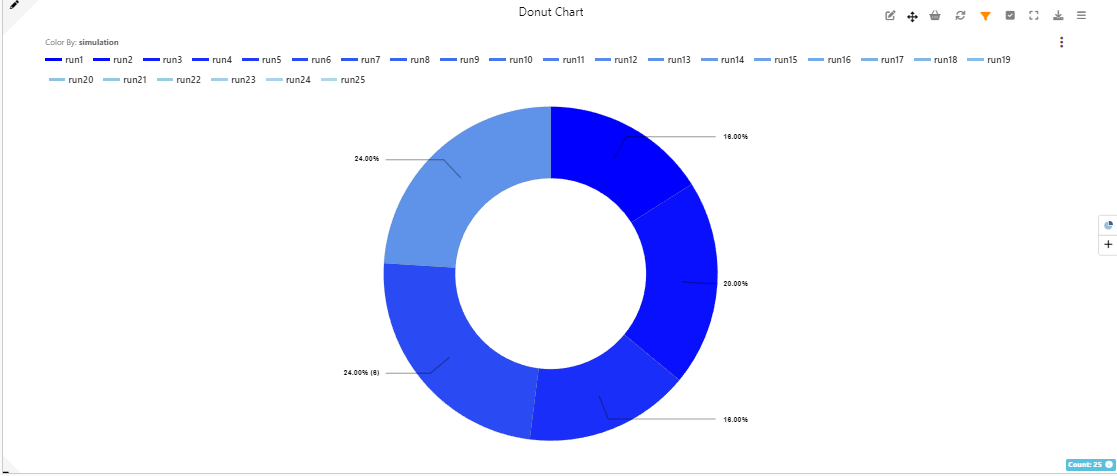
Donut Chart
Donut charts are used to show the proportions of categorical data, with the size of each piece representing the proportion of each category.
Donut Chart