BMS User Guide
This user guide provides introduction to the basics of accessing, navigating, and interacting with test data on d3VIEW.
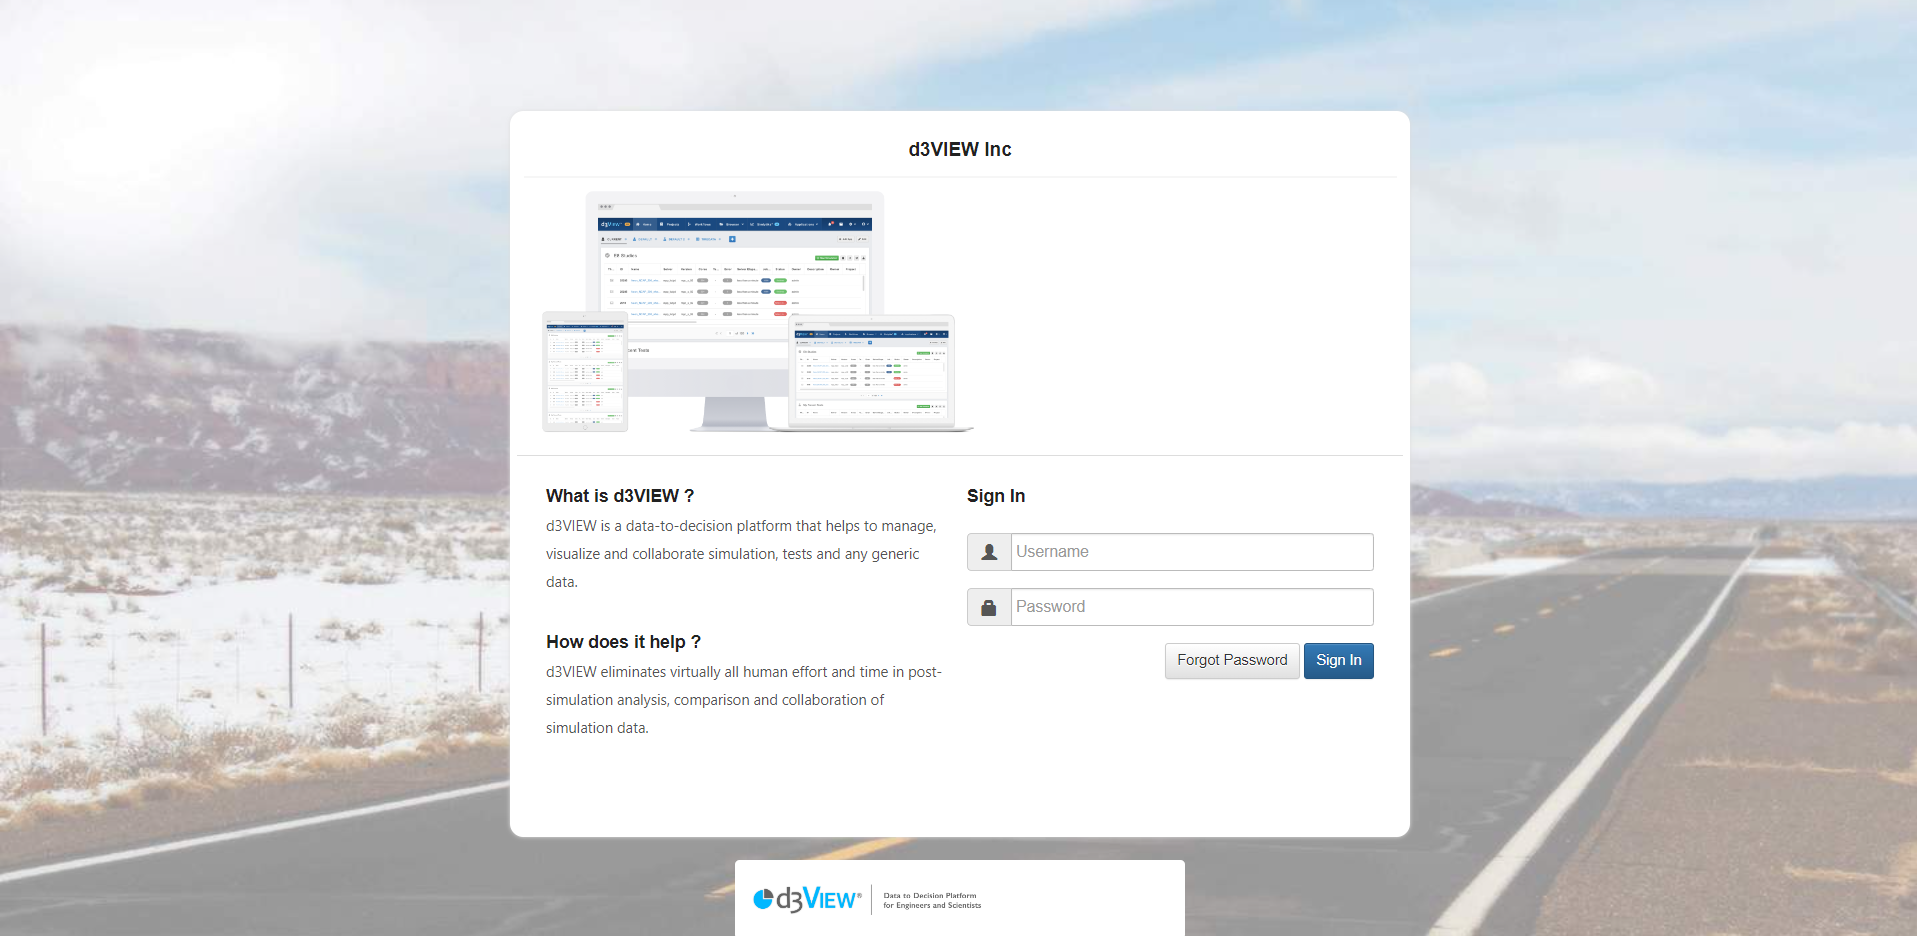
Login to d3VIEW
Click on the link https://Your-D3VIEW-INSTALL/. Login with username and password.
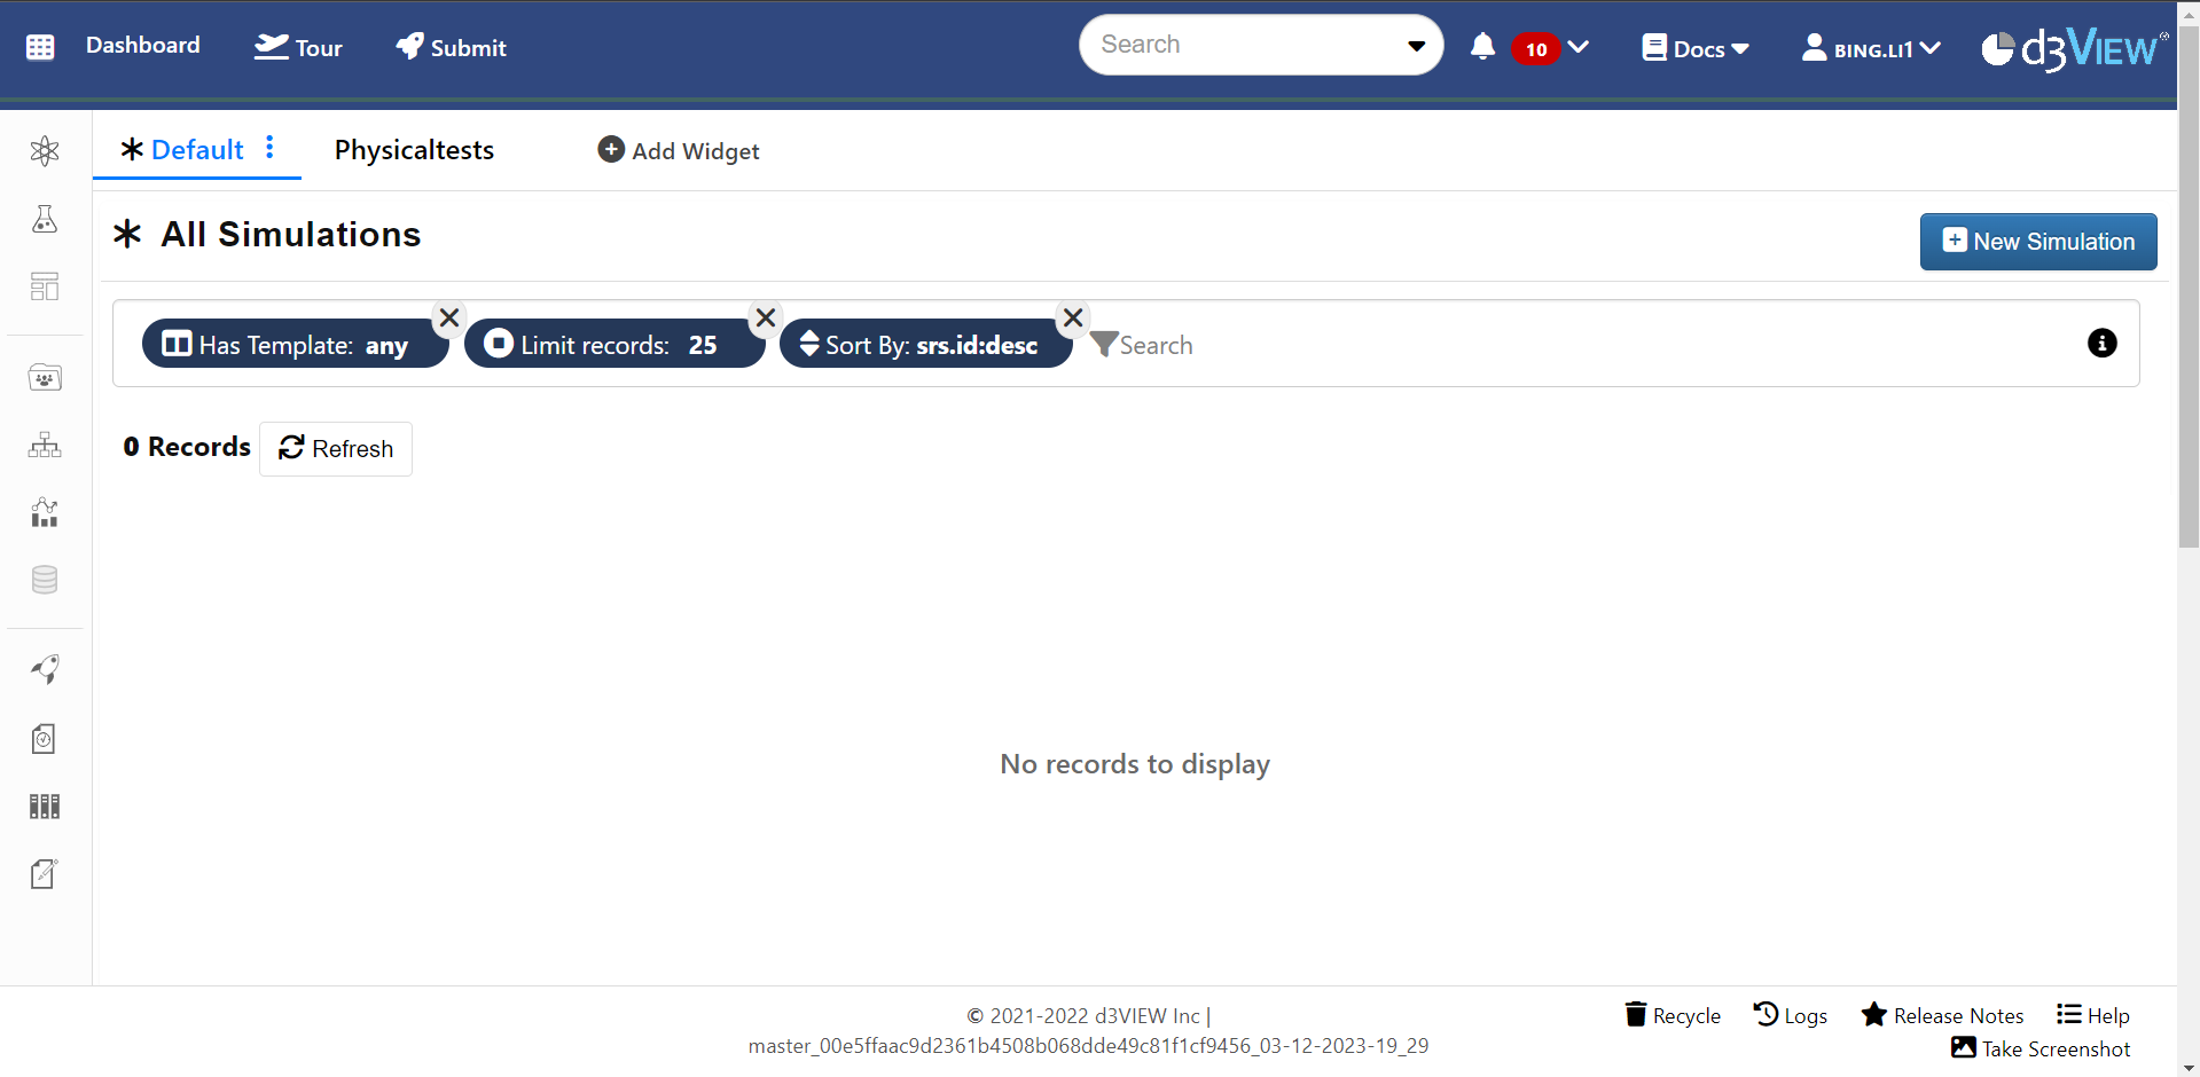
After login, we are at the “Dashboard” application by default. The Dashboard shows the physical tests application, from where we see the tests published/uploaded under the current account. New users usually don’t have anything published at their account. There would no record to show.
Applications
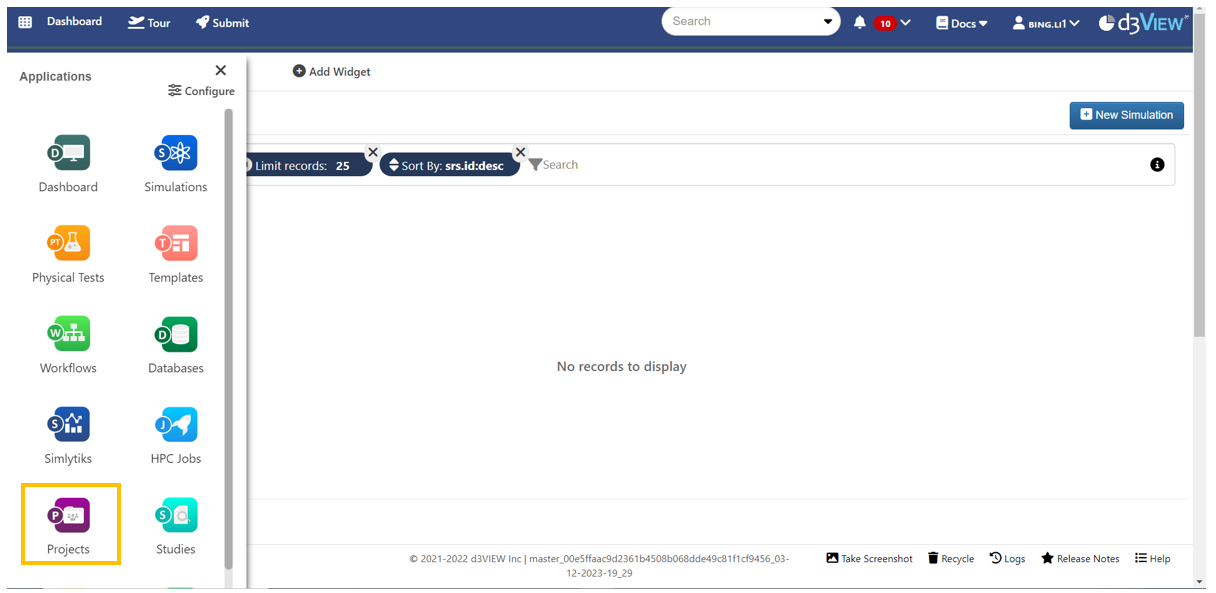
Clicking on the “Apps” icon on the top left corner, we will see a list of applications available on d3VIEW.
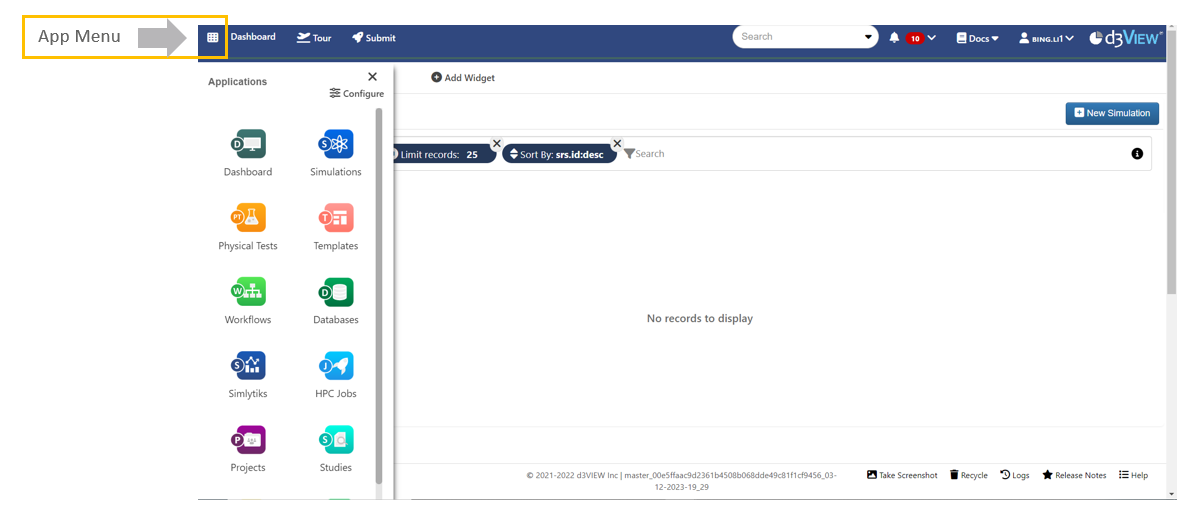
These applications serve different purposes. The table below highlighted four commonly used ones.
| Application | Main function |
|---|---|
| Physical Tests | A list of test records that can be accessed by the current user. |
| Projects | Test records are organized into projects. |
| Workflow | Workflow can be built to perform a variety of computation, analysis, and generate reports to help automate all sorts of tasks, simple or complex. |
| Simlytiks | Data visualization, report viewing and edition. |
Find the test
In order to find the test we are interested, we need to locate where all the test records are located, then use filter to find a specific test that we are looking for. We can locate the test records in either Physical Tests application or Projects application.
Physical Tests
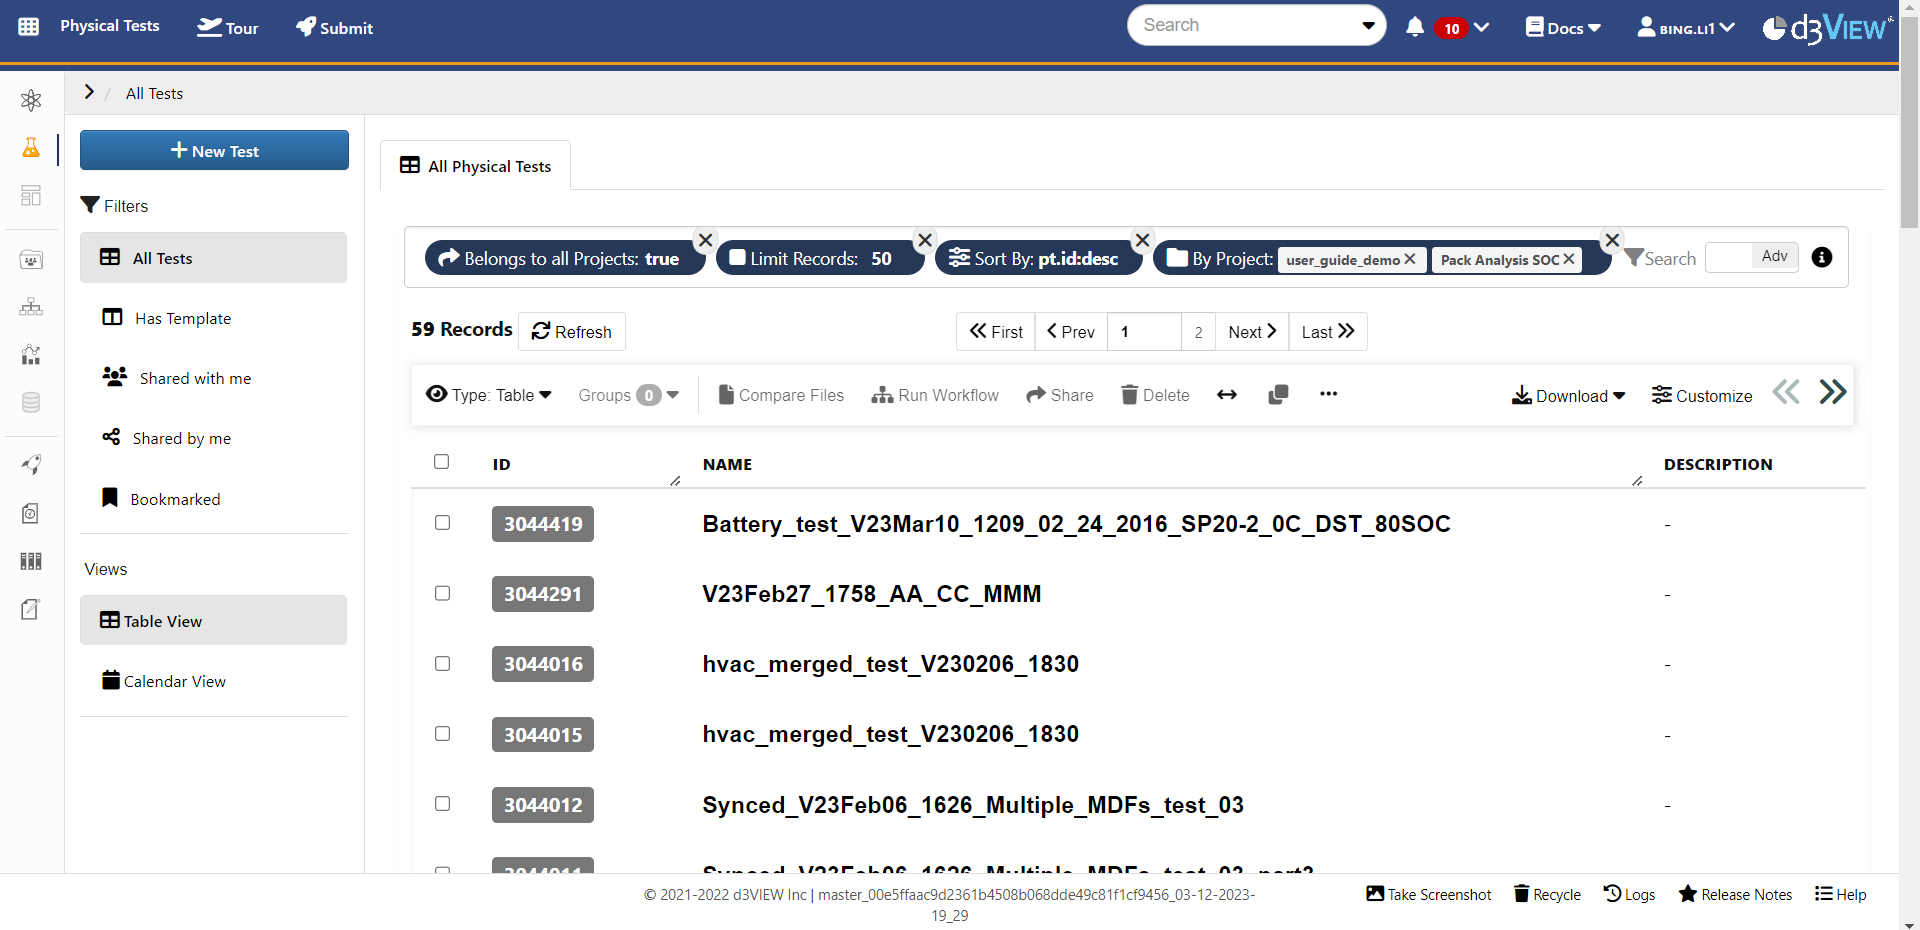
Click the “Physical Tests” icon in the app menu to go to the Physical Tests app. A list of test records from our account will be shown.
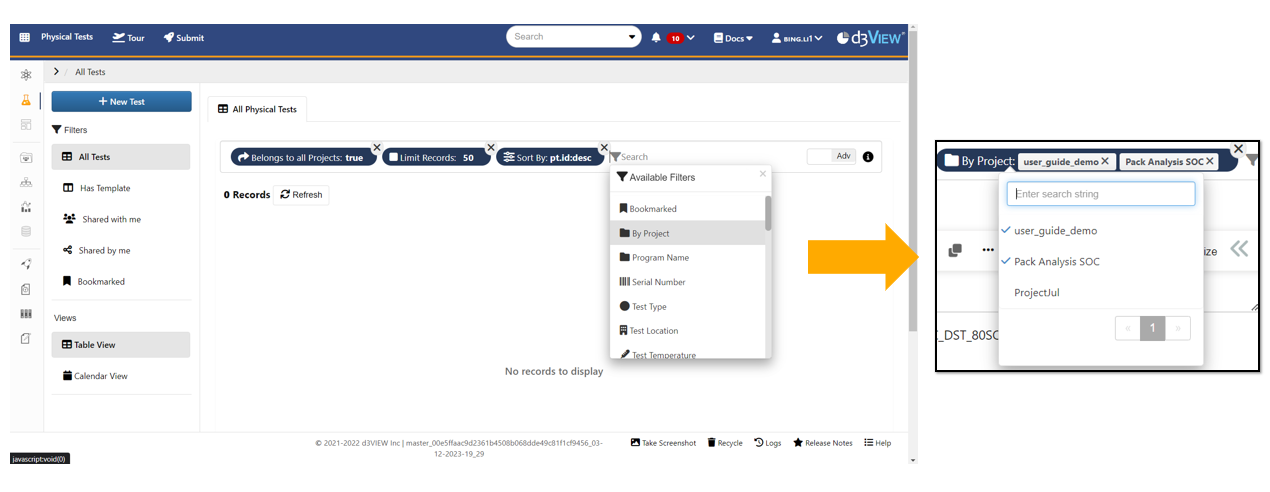
By default, the test records shown in the Physical Tests app are those published or uploaded by the current account. In order to access test records shared with us (published by the other users) stored in certain project, we can use the “By Project” filter and add that project. Then, we will see the test records from that project we selected.
Projects
- Go to the Projects app.
- Click to open interested project
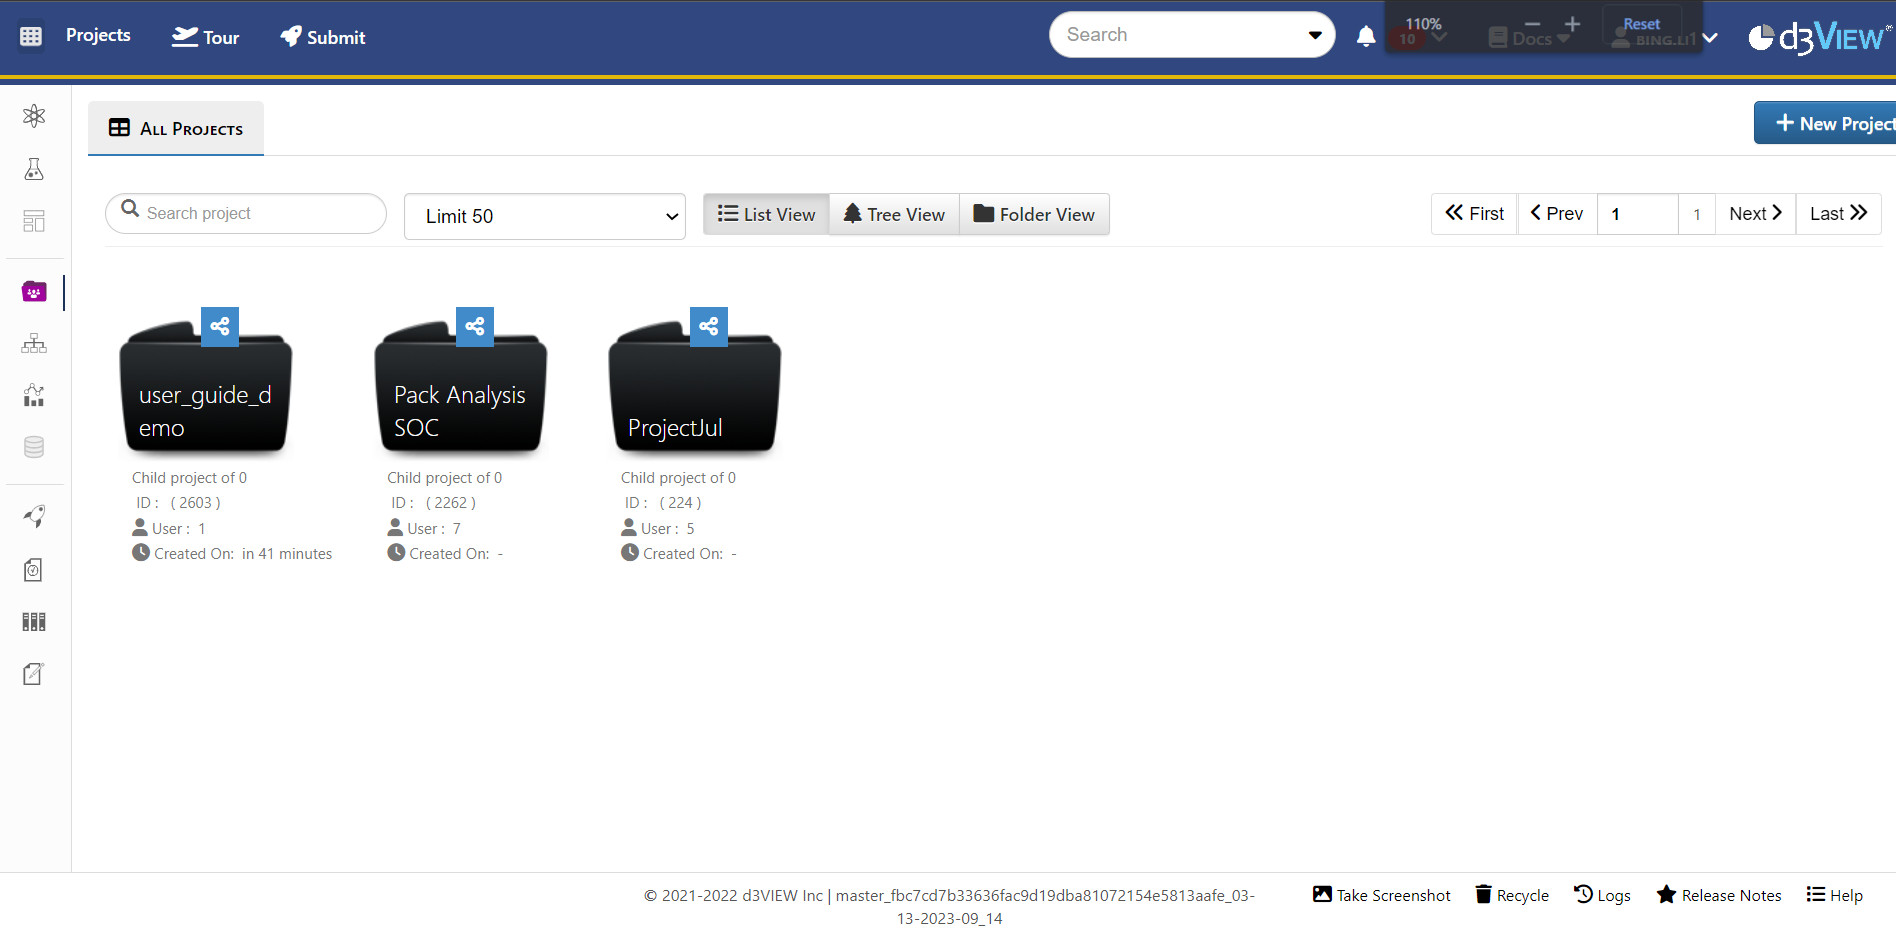
- Click on “Physical Tests” tab on the left panel.
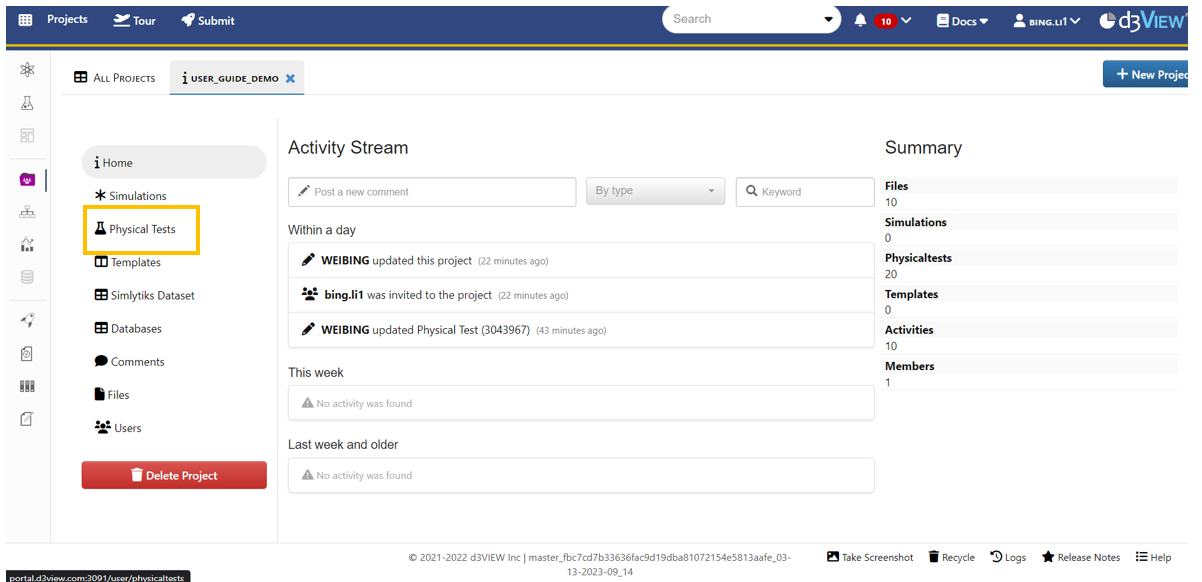
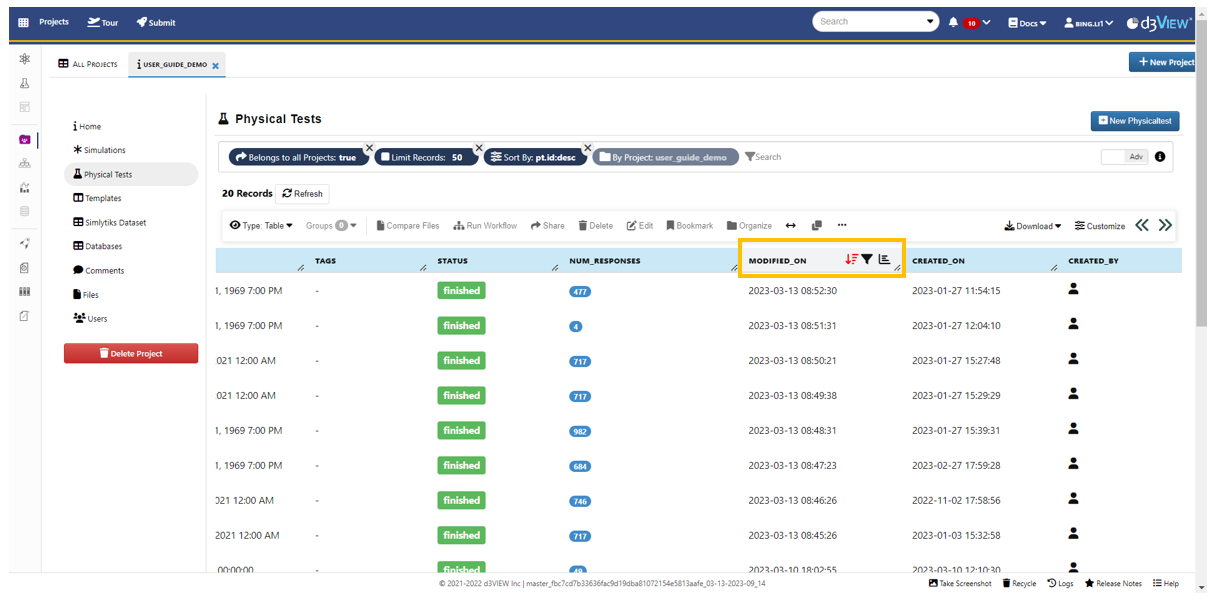
By default, we will see all test records available in the project sorted by the time they are created. This can be changed by clicking the “sort” icon on any column header to sort the test records based on the meta data in ascending or descending orders.
Use filter to find specific tests
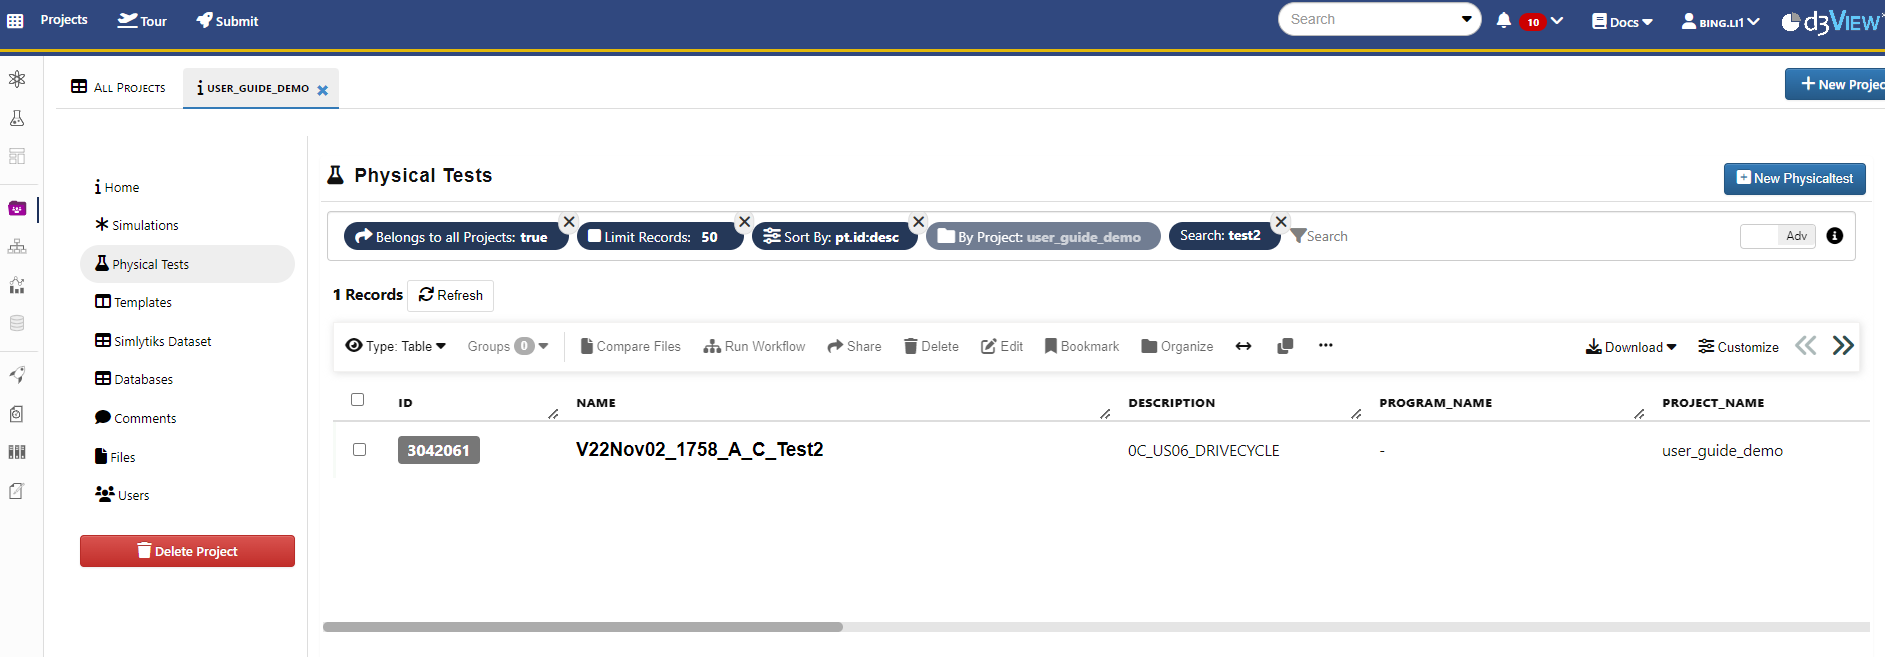
If we know the exact test name or certain text included in the test name, we can directly type that in the search bar and press ‘Enter’. The list of records will automatically update and show us the results contains the text we entered.
We can also use meta data information to help narrow down the list of test records. Click on the search bar, we will see a list of filters we could use. By selecting the filter and choosing the values of the filter, we can filter out the tests that satisfies the filter we added. Some commonly used filters include : By Project, Program Name, Test Type, Test Location, Test Temperature, Serial Number, etc.
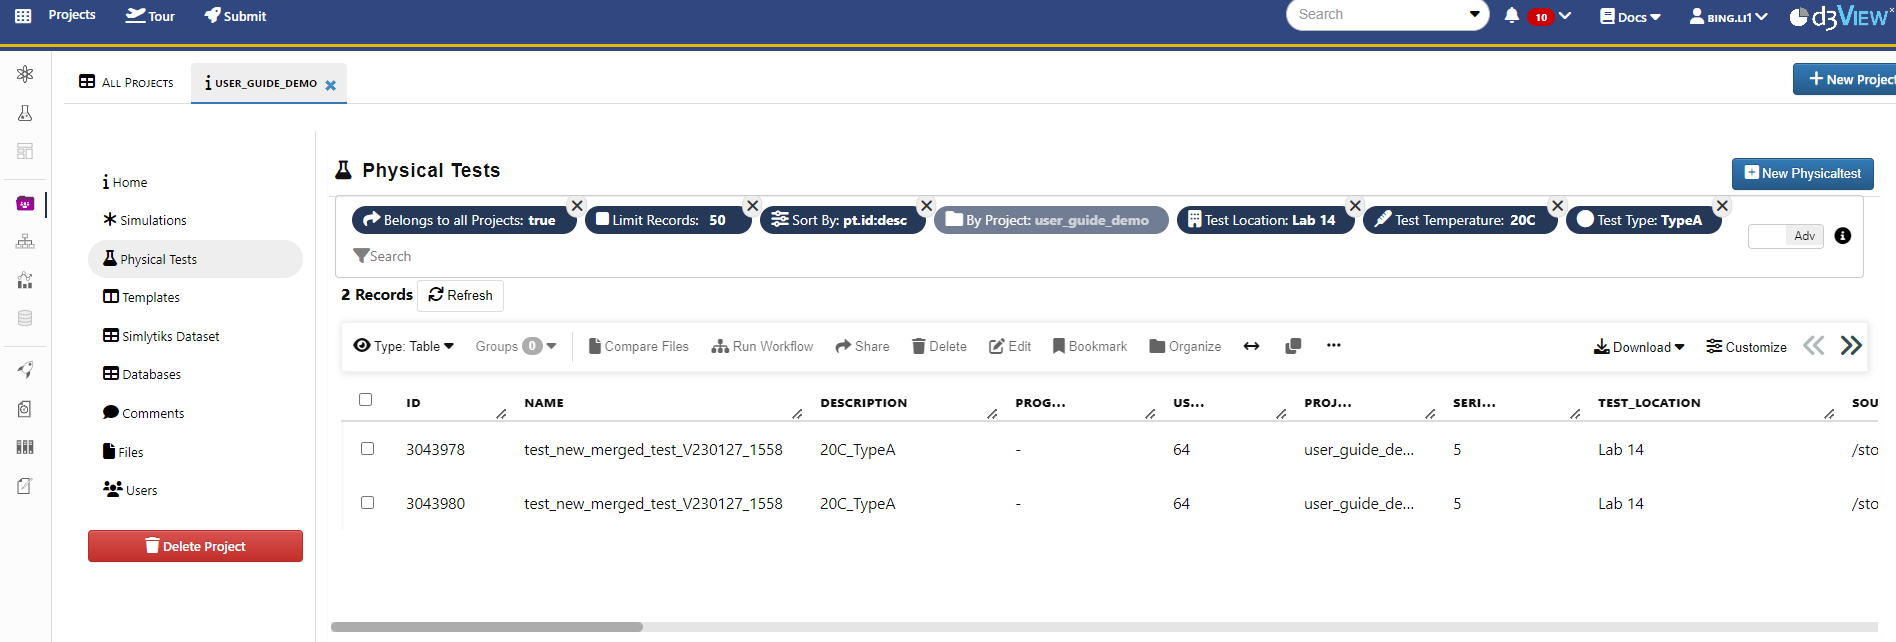
To remove values on the filter we added, we can click on the “close” icon on the value we intend to remove. Similarly, click on the “close” icon on the filter to remove the filter.
Responses
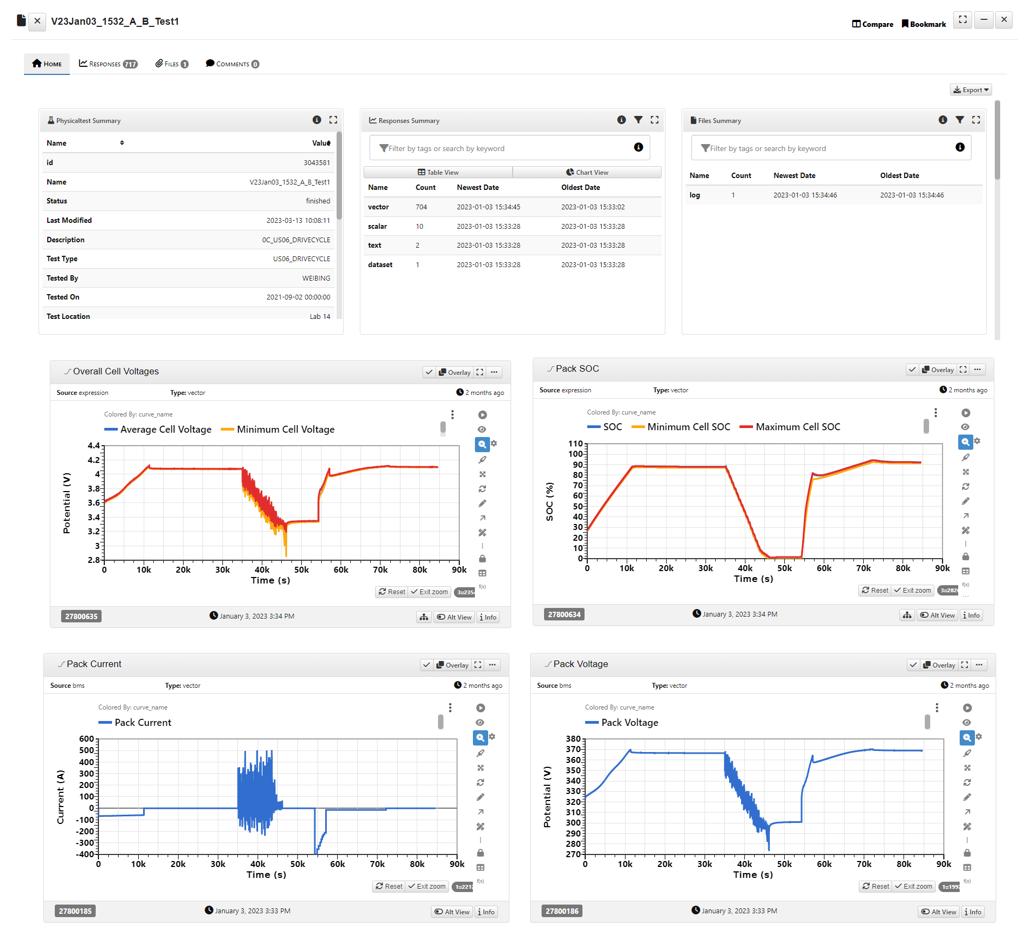
Click on any test record to open a test. Here is what we will see.
Panel with summary of meta data
Tabs : Home, Responses, Files, Comments, etc.
Standard plots.
- Responses tab
- Individual responses
- Filter out intersted responses
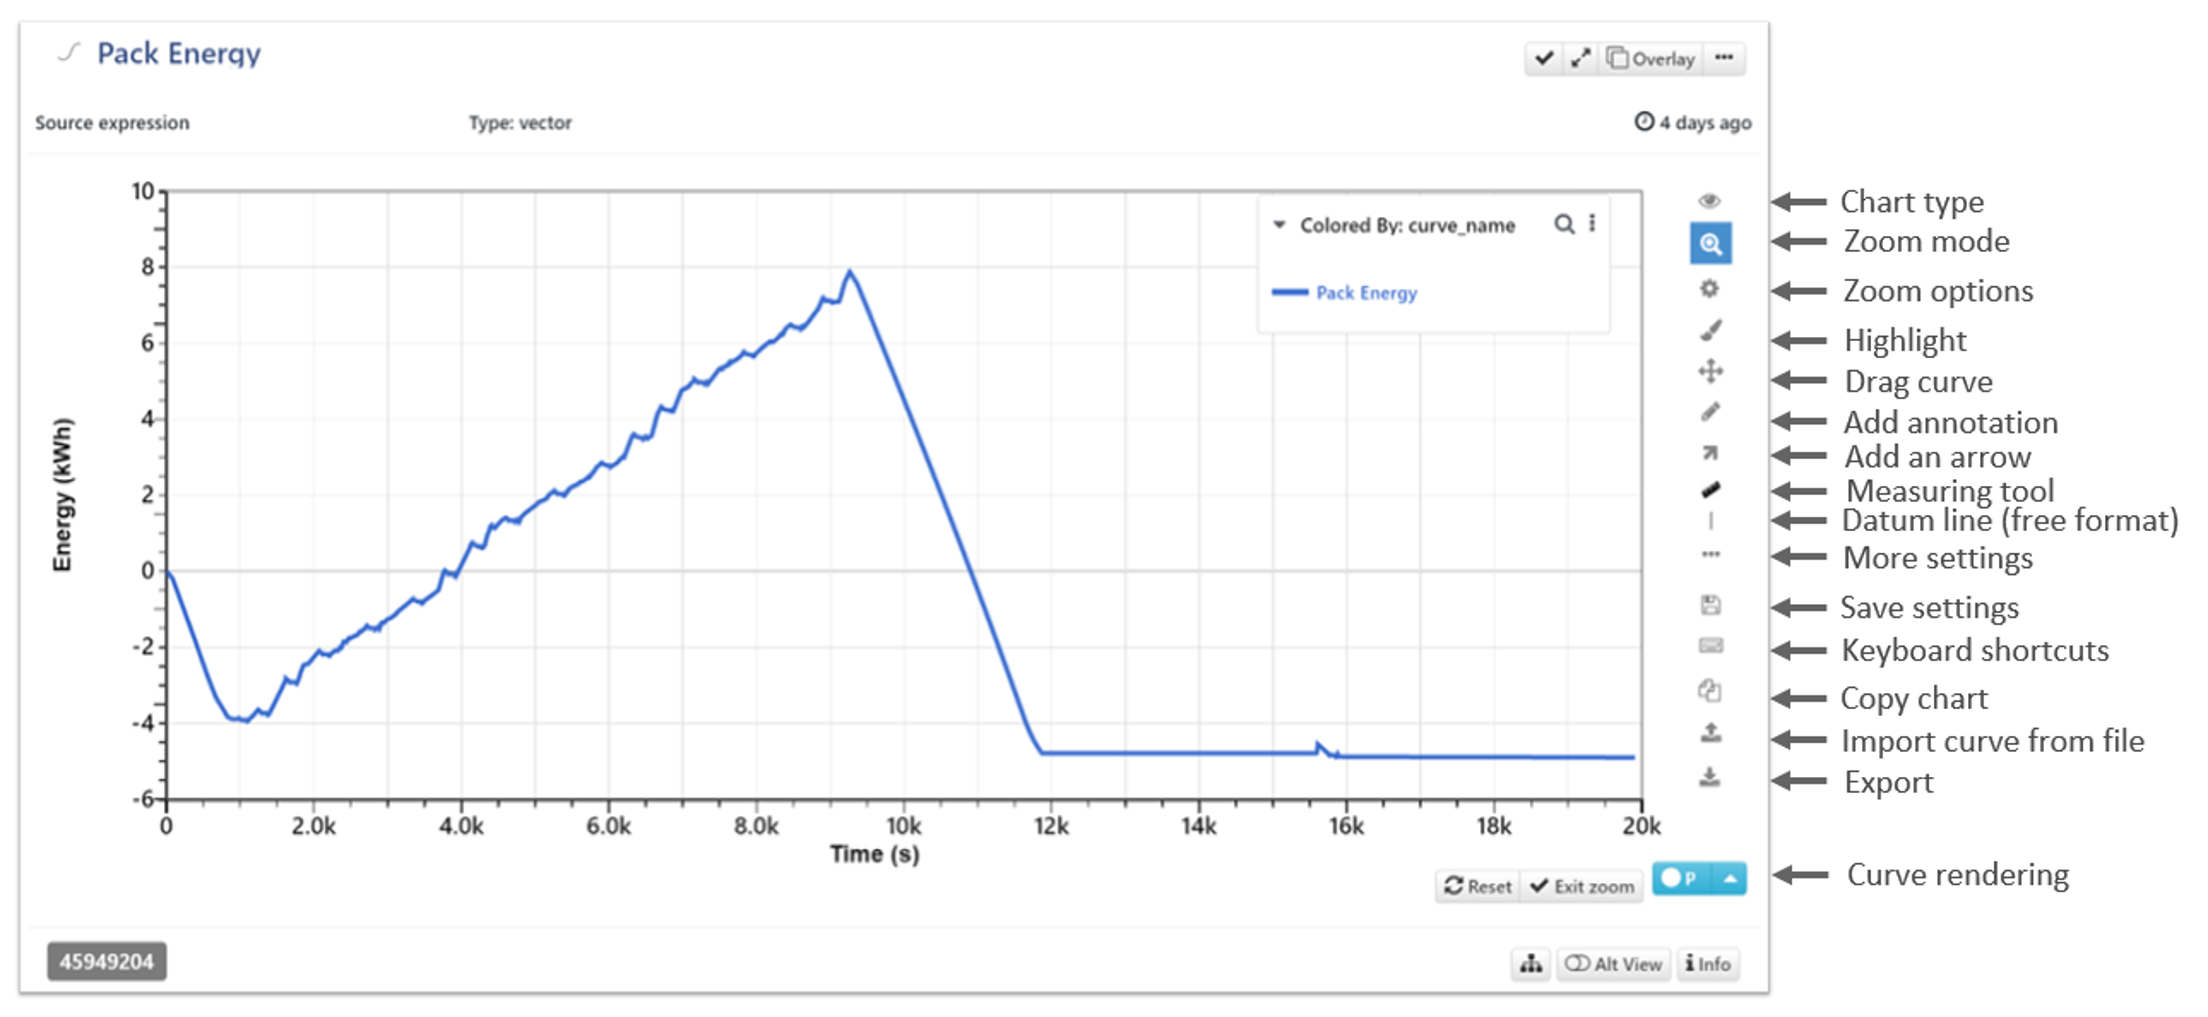
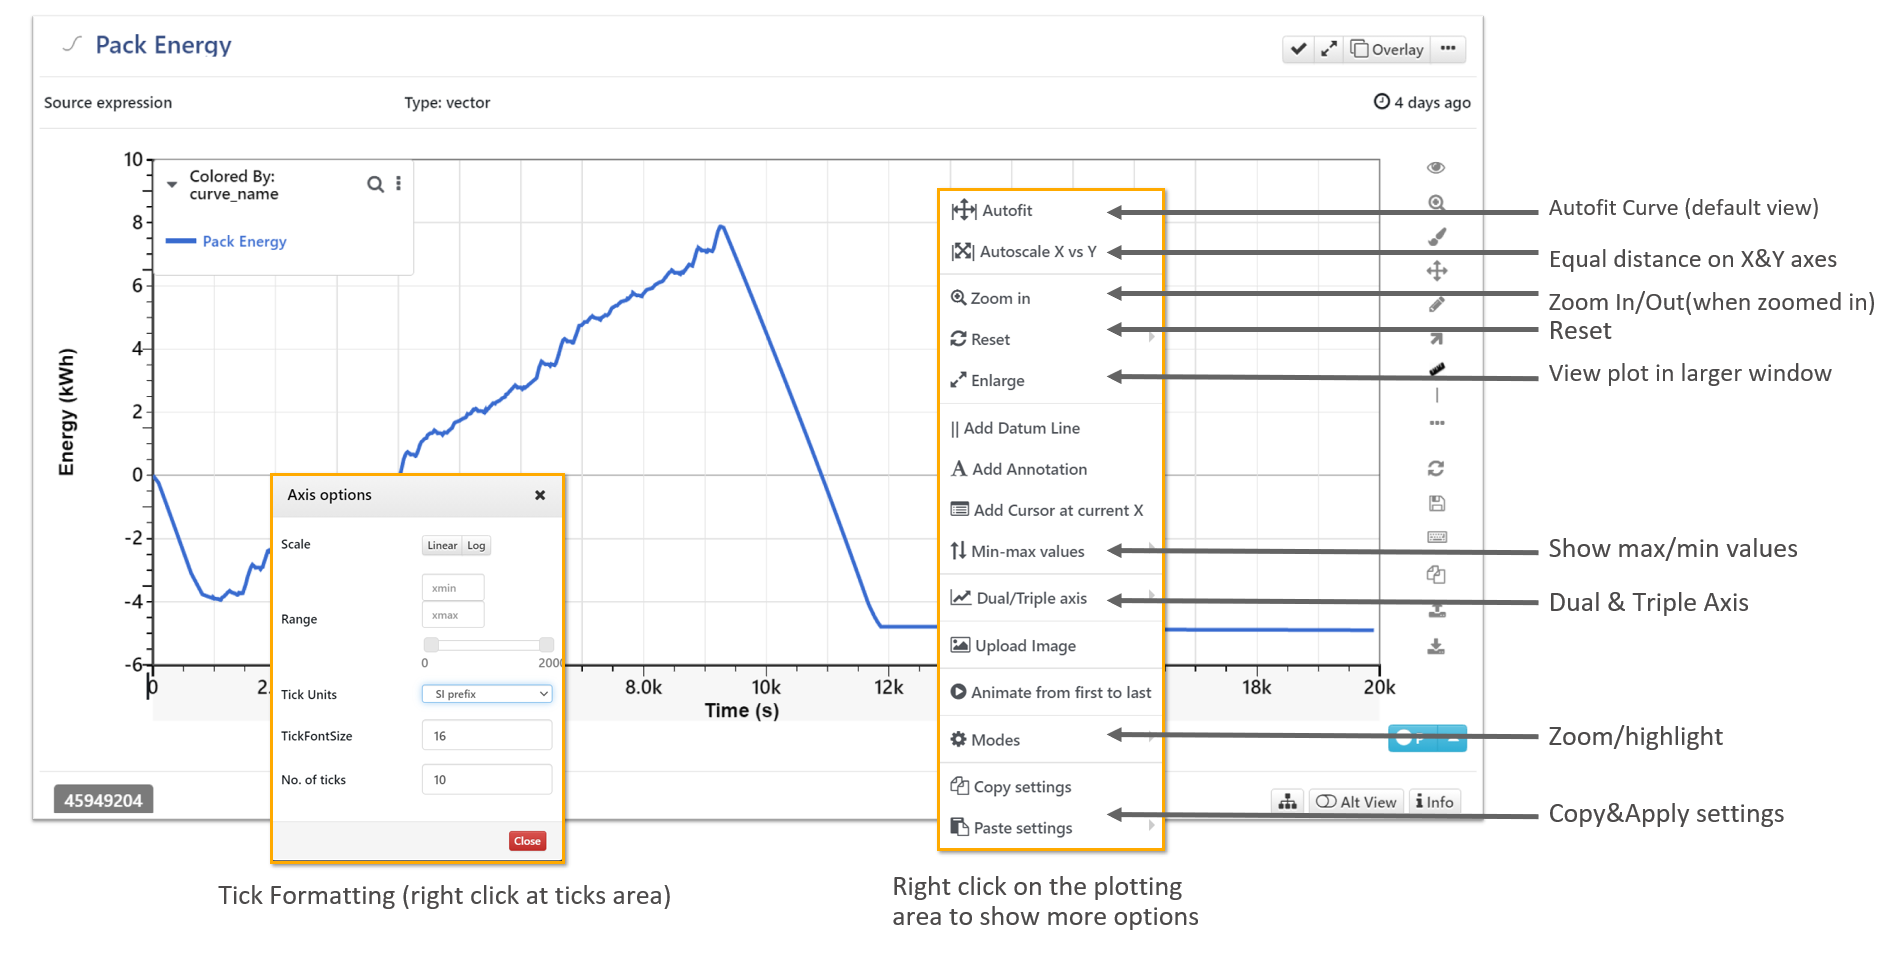
A single response
Canvas where plot is shown
- Some commonly used features
Zoom in/out, and autofit
Render views: progressive, raw
Chart Type: line, points, line and points, table, etc.
- Annotation related
- Add text annotation
- Add arrow
- Add datum line
- Measuring tool
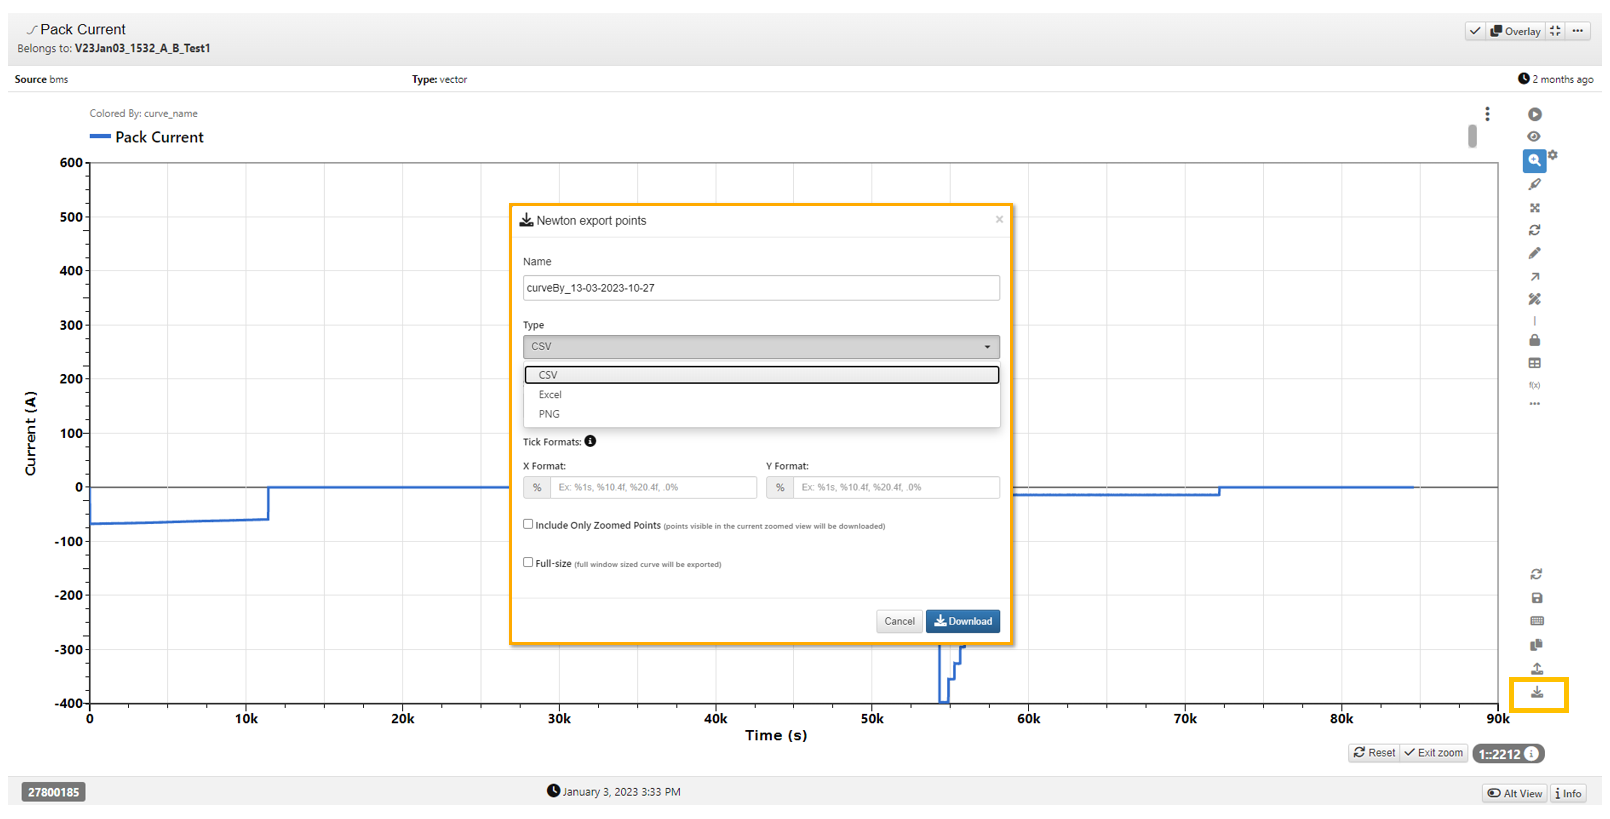
Export responses data
- Export a single response
- Click on the “Export” icon on the right side margin
- Choose the format (png, csv, Excel) of the downloaded data file
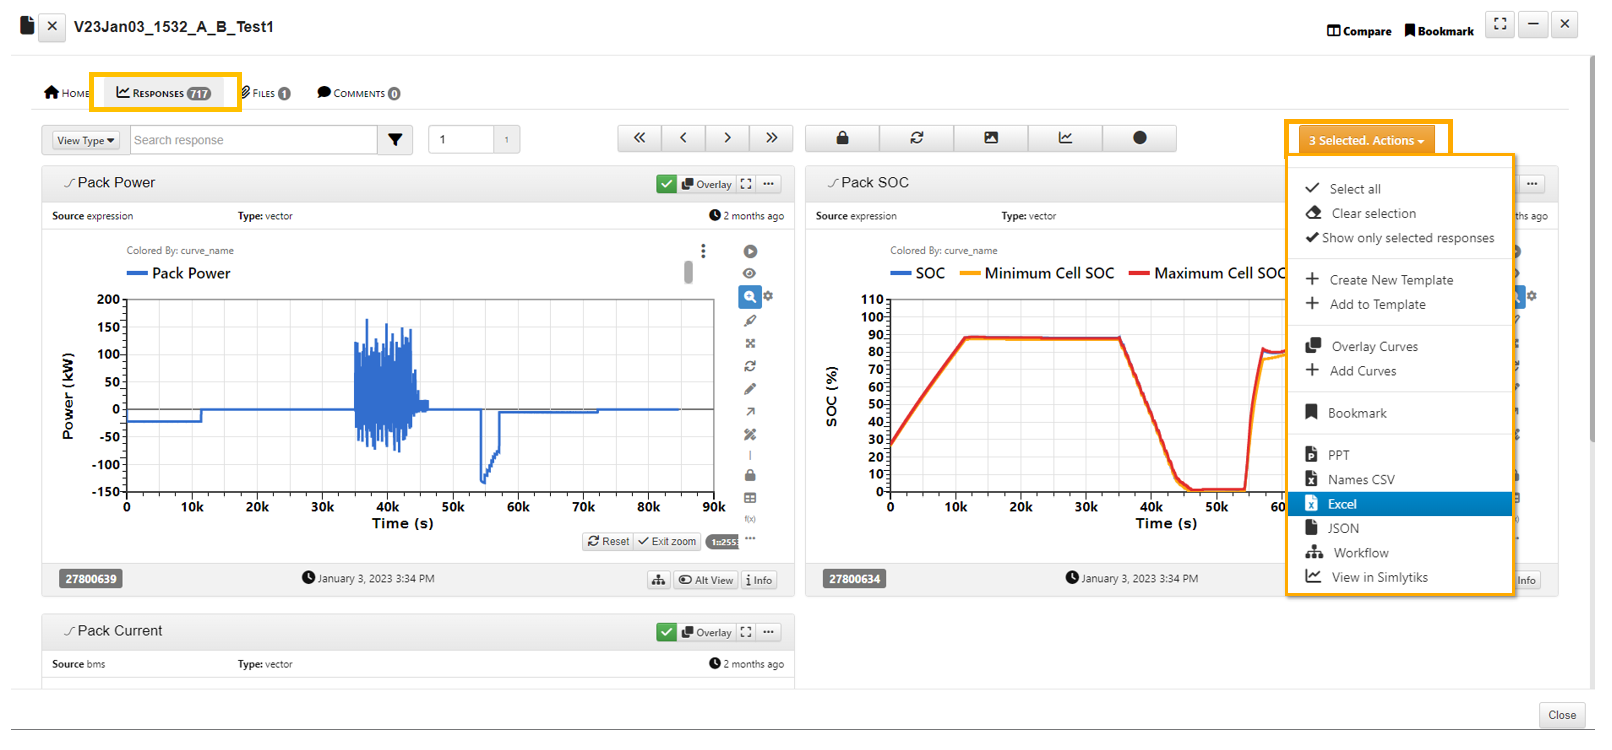
- Export multiple responses within the same tests
- Select responses by checking the “check” mark on each response
- In “Selected Actions”, click “Excel”
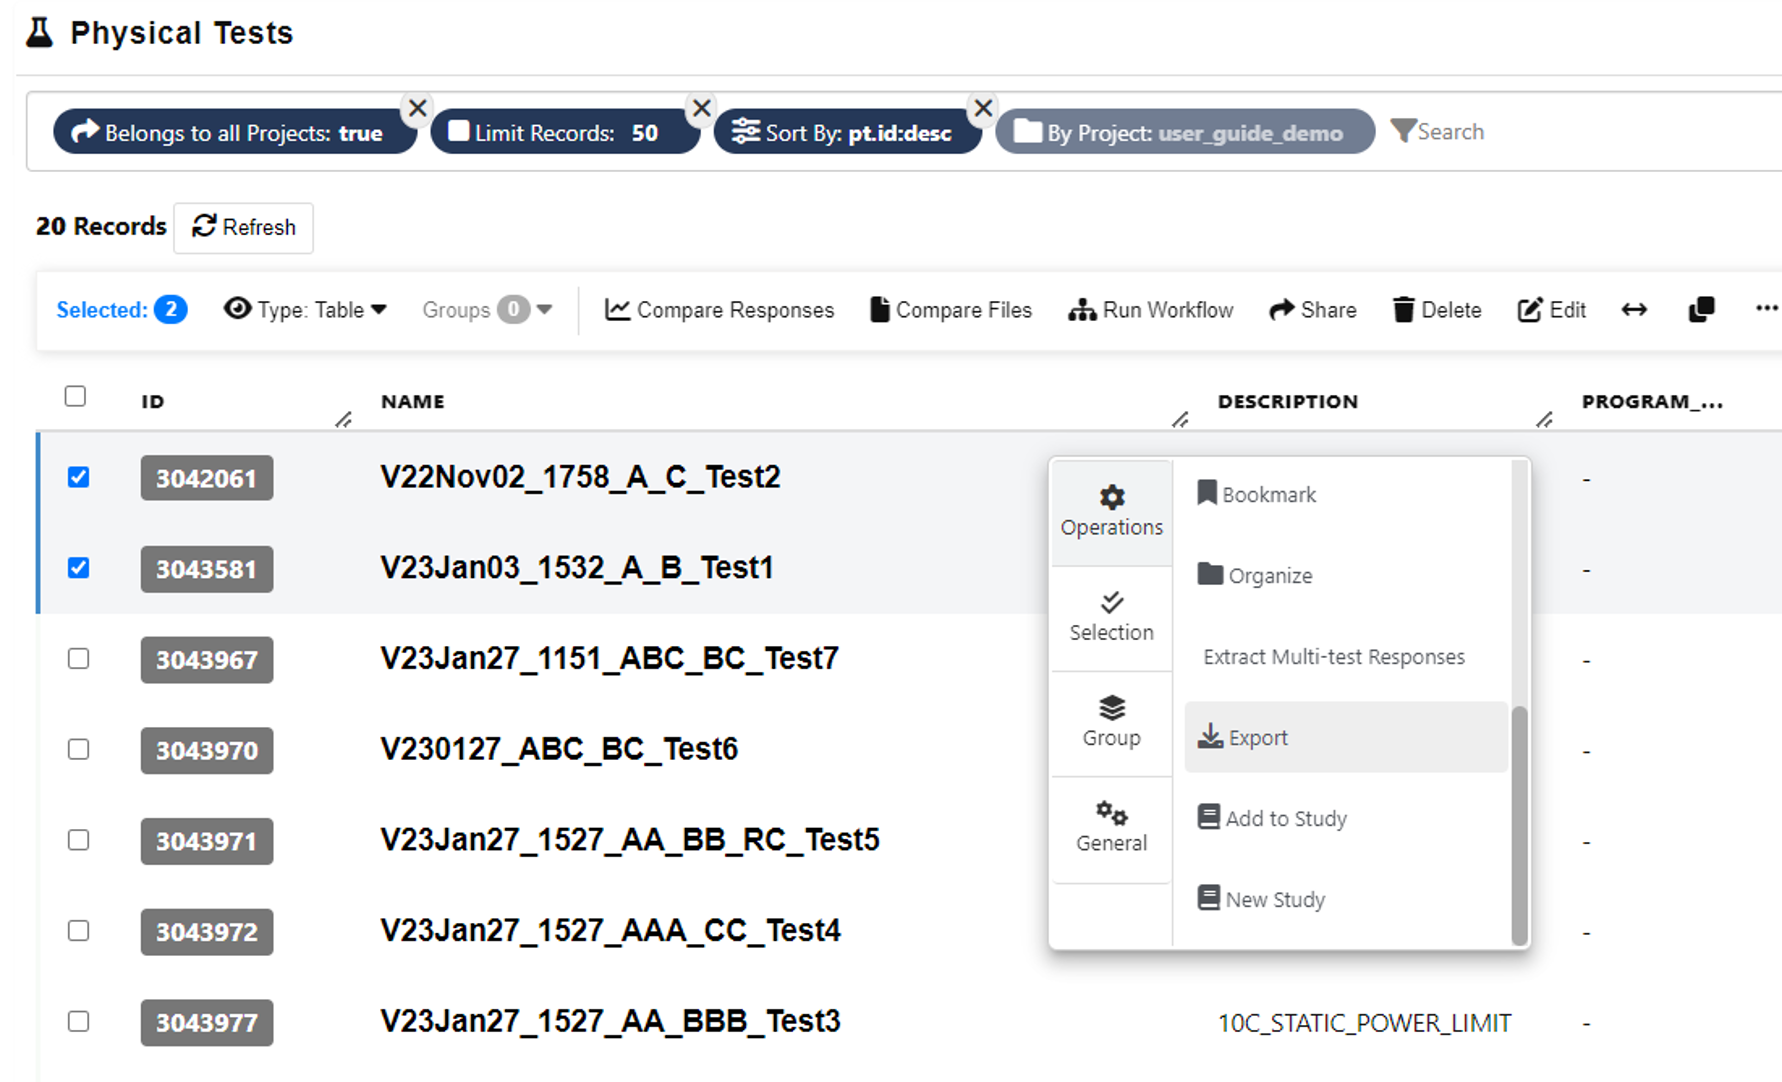
- Export a number of responses from different tests
- Select interested test records
- Right click and select “export”
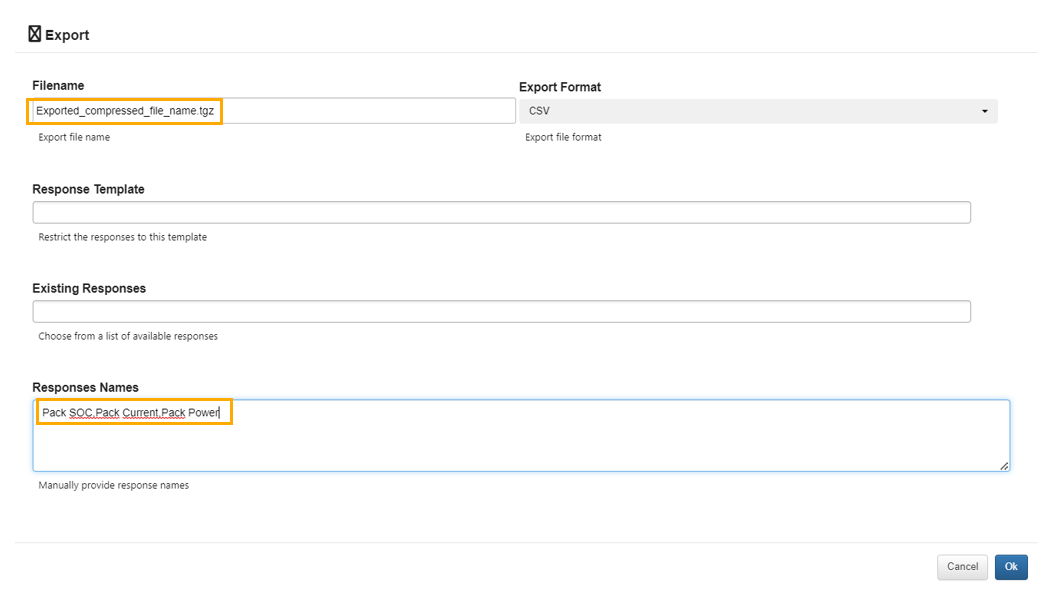
- Edit the name of the file that will be downloaded containing the test data
- Type in the response names separated by comma
- Click Export to download
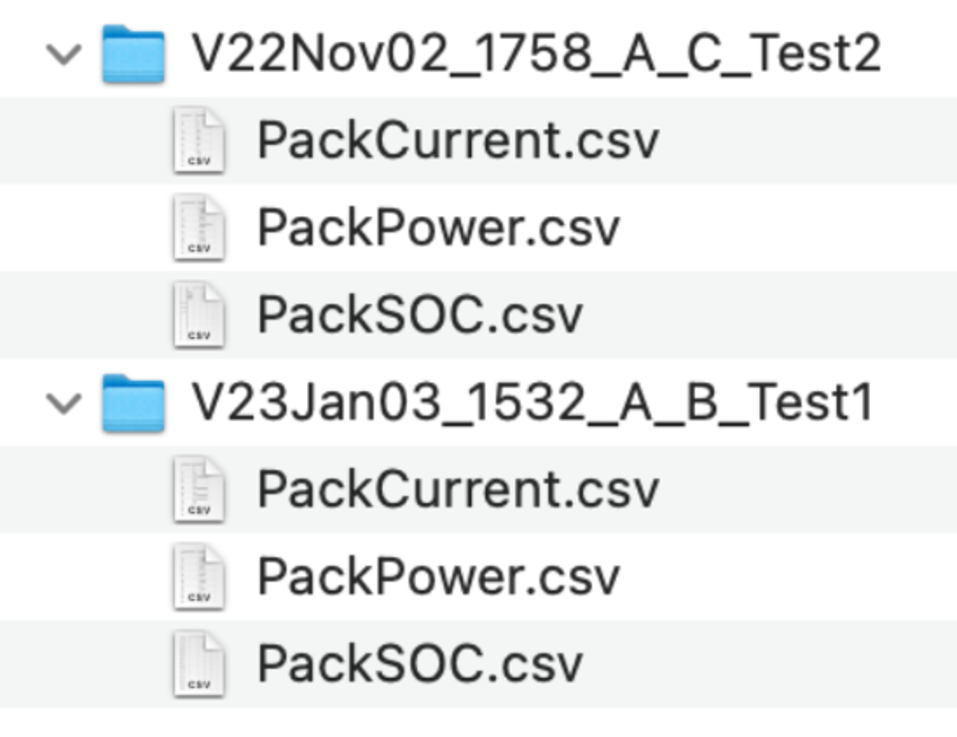
- Unzip the downloaded compressed file and each response is stored separately in each test folder.
Overlay responses
- Overlay with another response from the same test
- Click “Overlay”
- Choose the response to overlay
- Choose preferred setting for axis, offsets, and scale factors
- Click “Apply/Overlay” to apply the overlay
- Click “remove overlay” to remove the overlaid curve
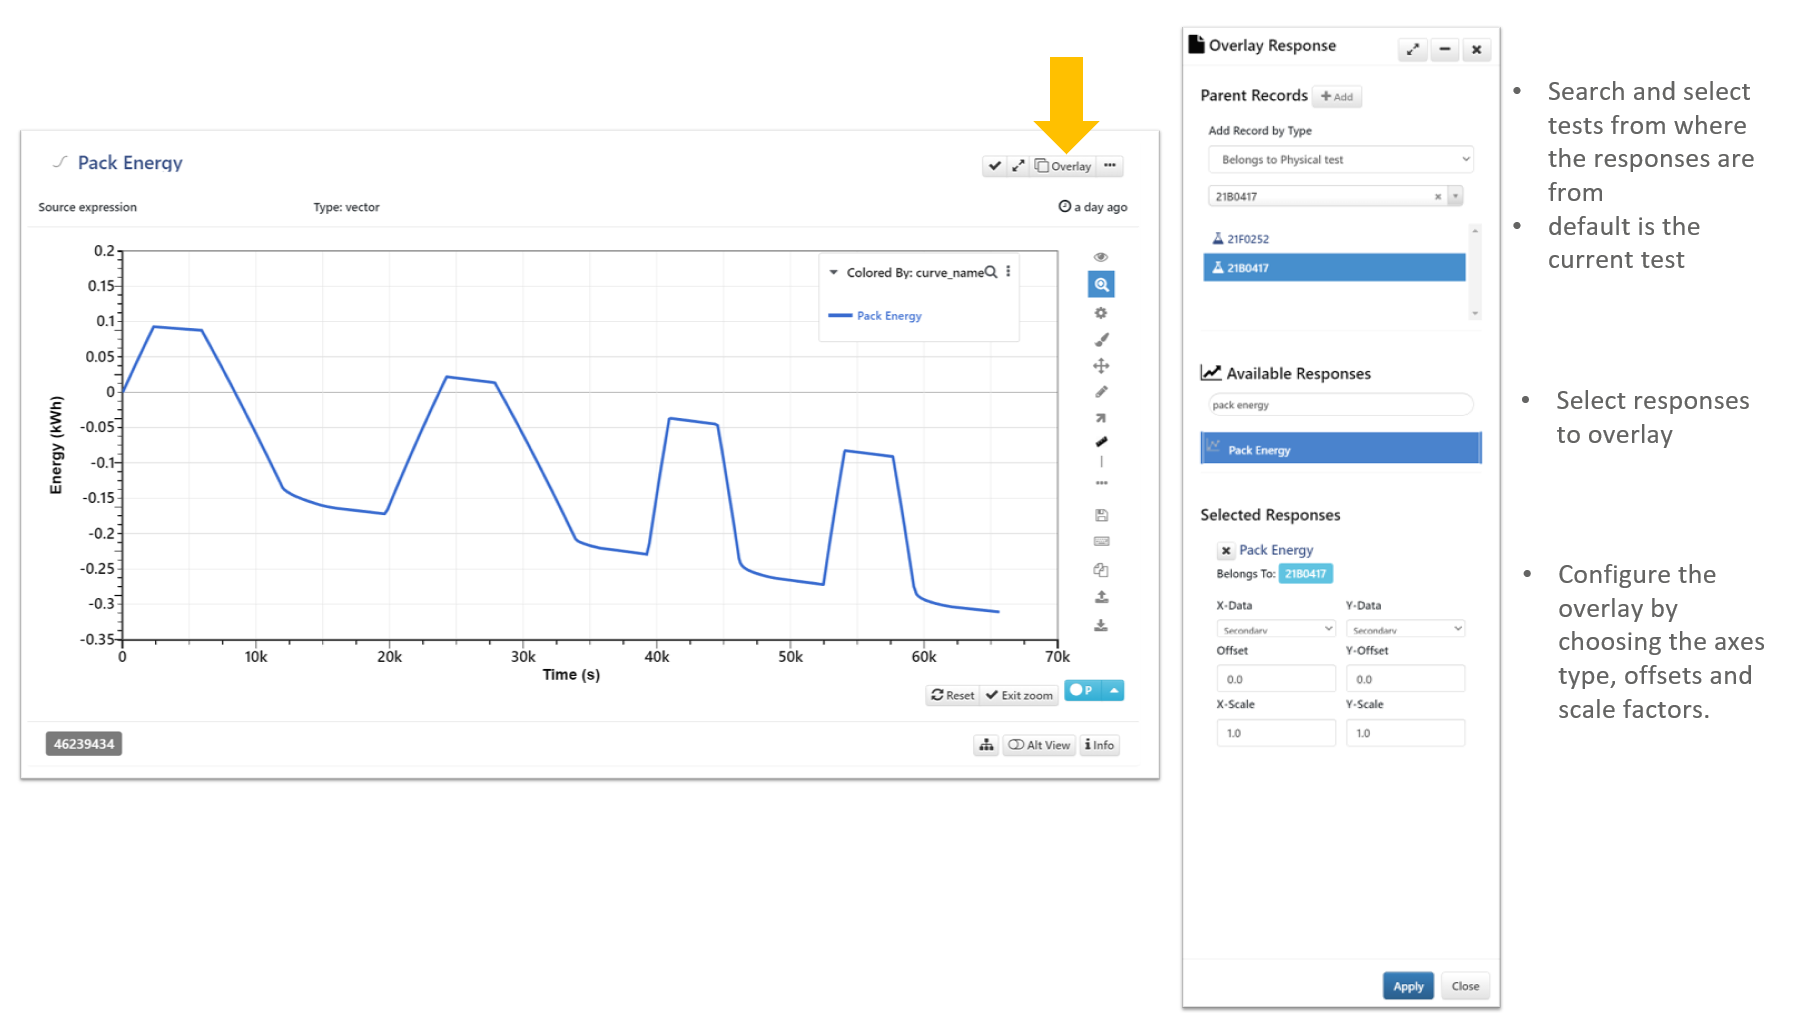
- Overlay with a response from another test
- Click “Overlay”
- Click “add record” to add a new record (records available only includes those published by the current account)
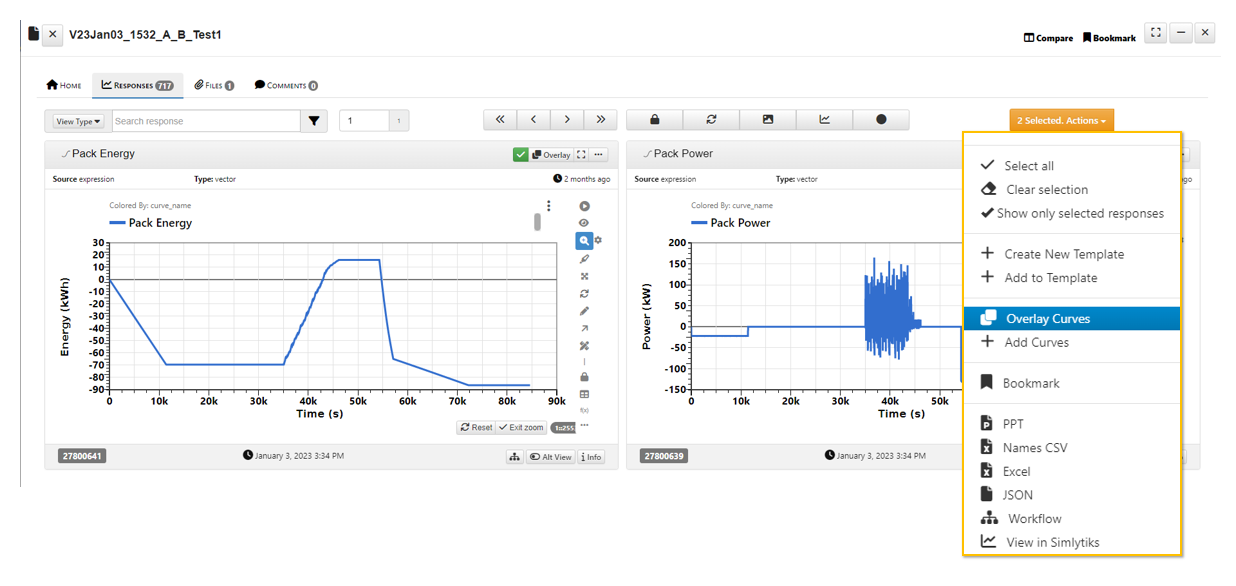
- Overlay responses within the same test and create a new response record
- Select two responses in the “Responses” page
- In “Selected Actions” click “Overlay responses”
- Edit the name of the new response and click “okay”
Compare responses
Method 1. Usually the tests we want to compare are stored in the same project. In this case, we can select the test records we are interested and compare.
- Select multiple test records
- Right click and select “Compare Responses”
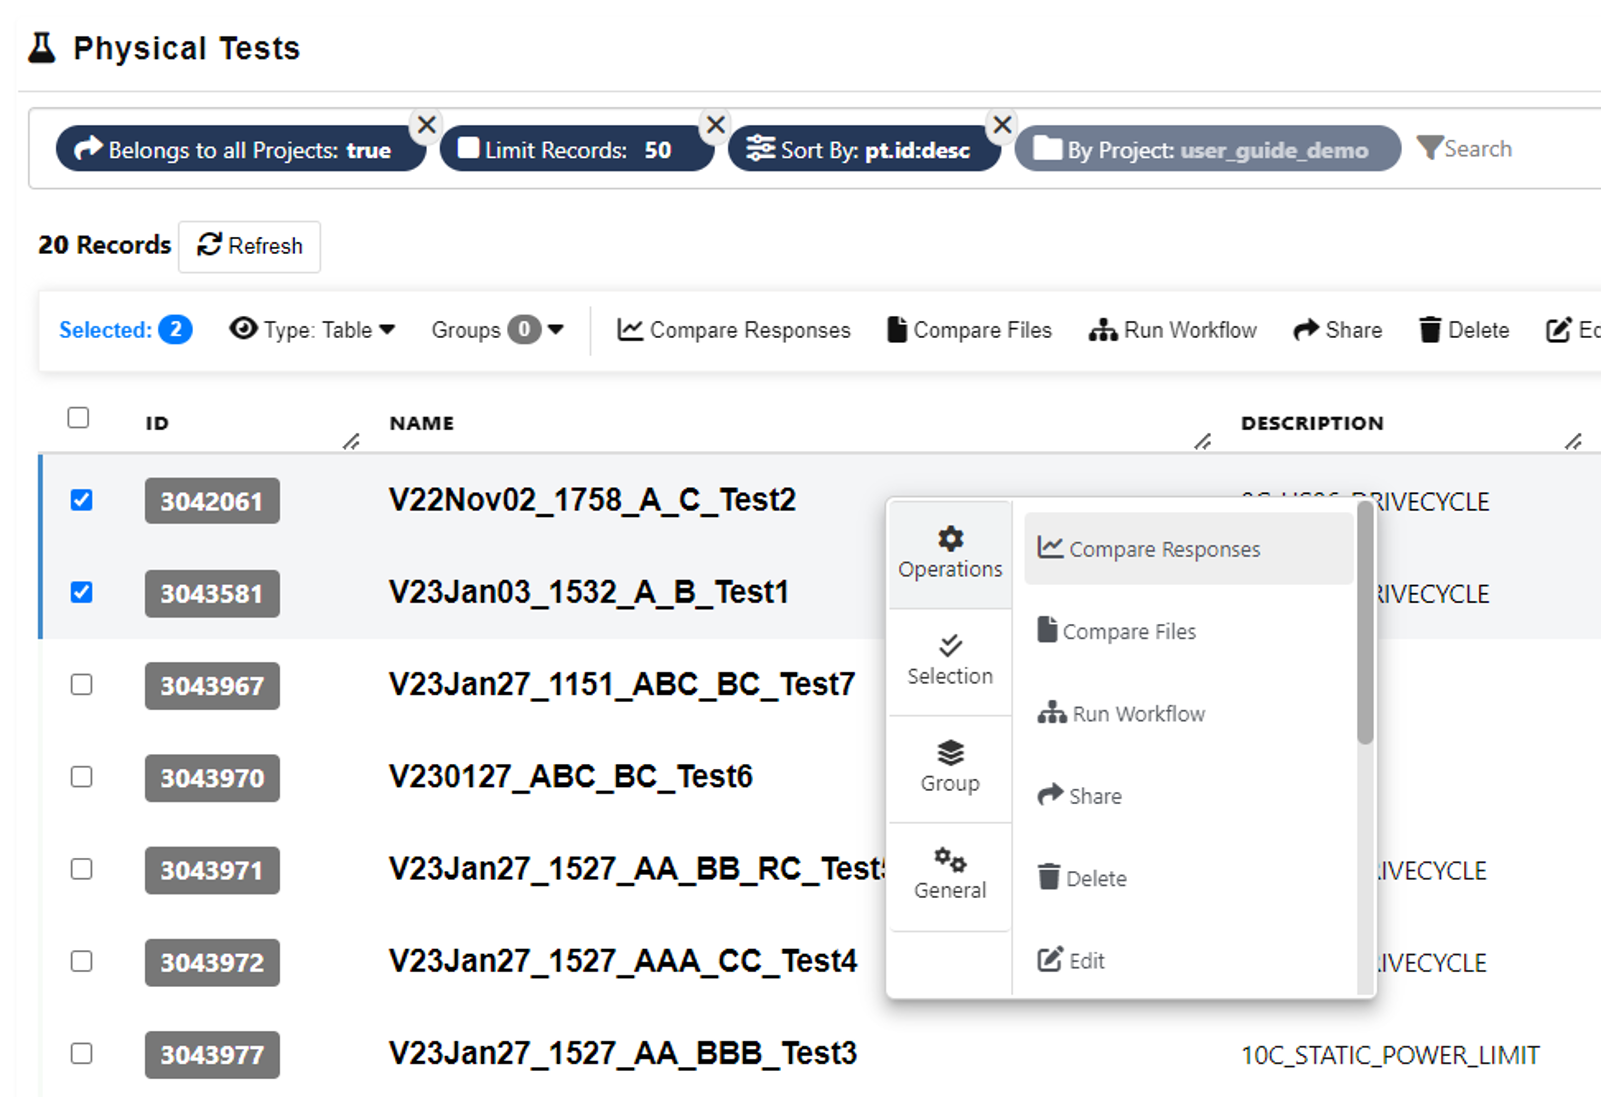
- Select “template” for comparison if available, otherwise, click “Compare”
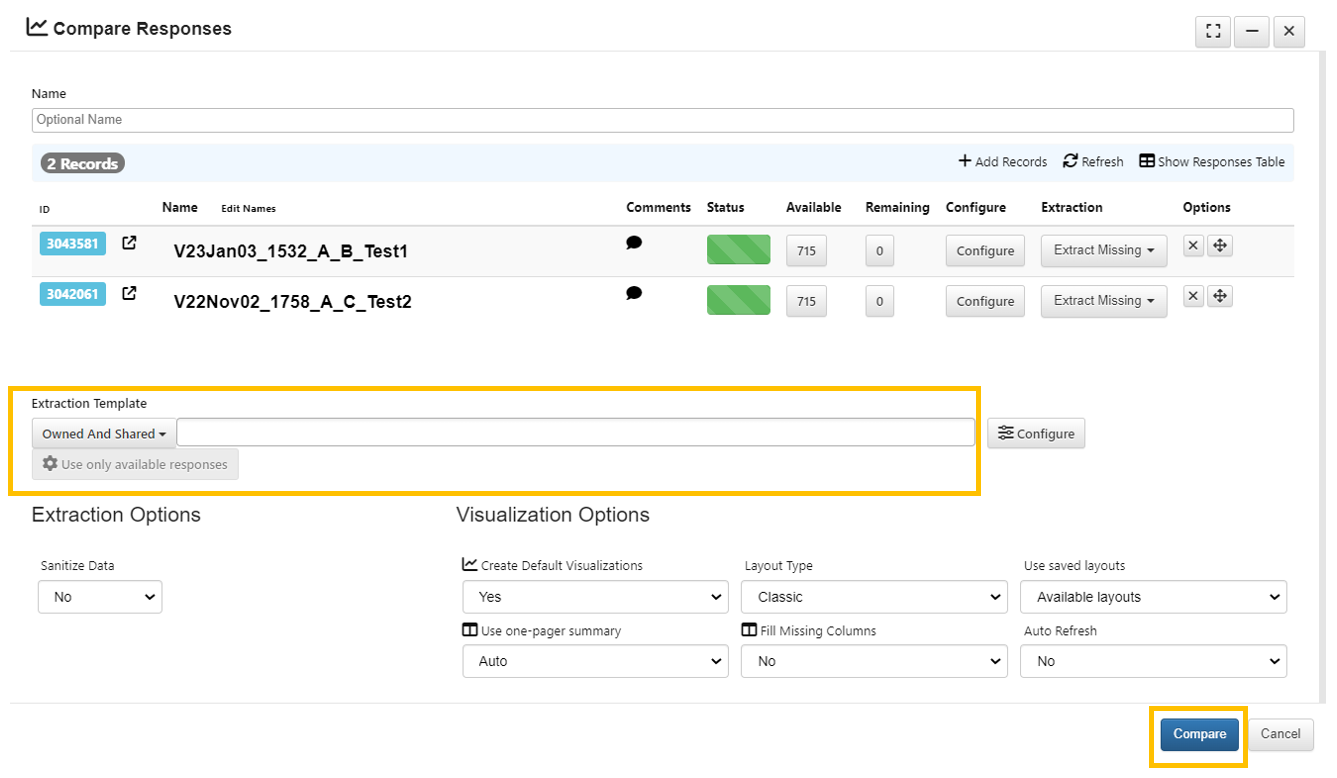
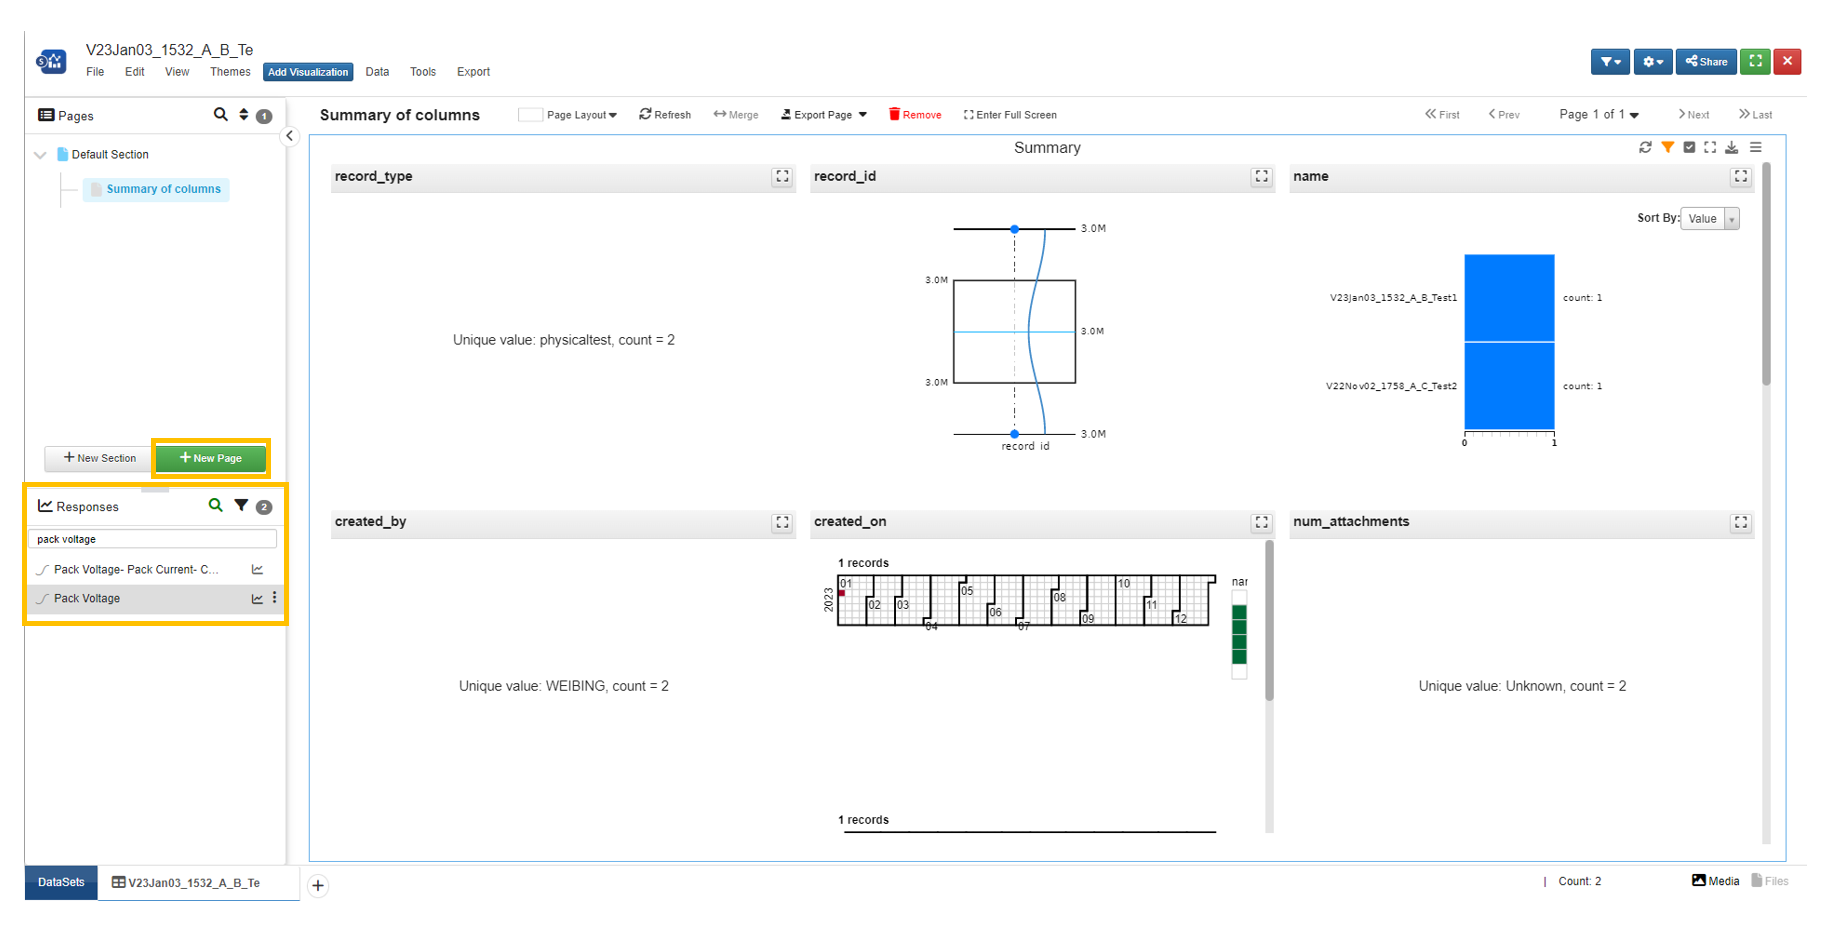
This will bring us to Simlytiks where dataset are visualized and reports are shown and modified.
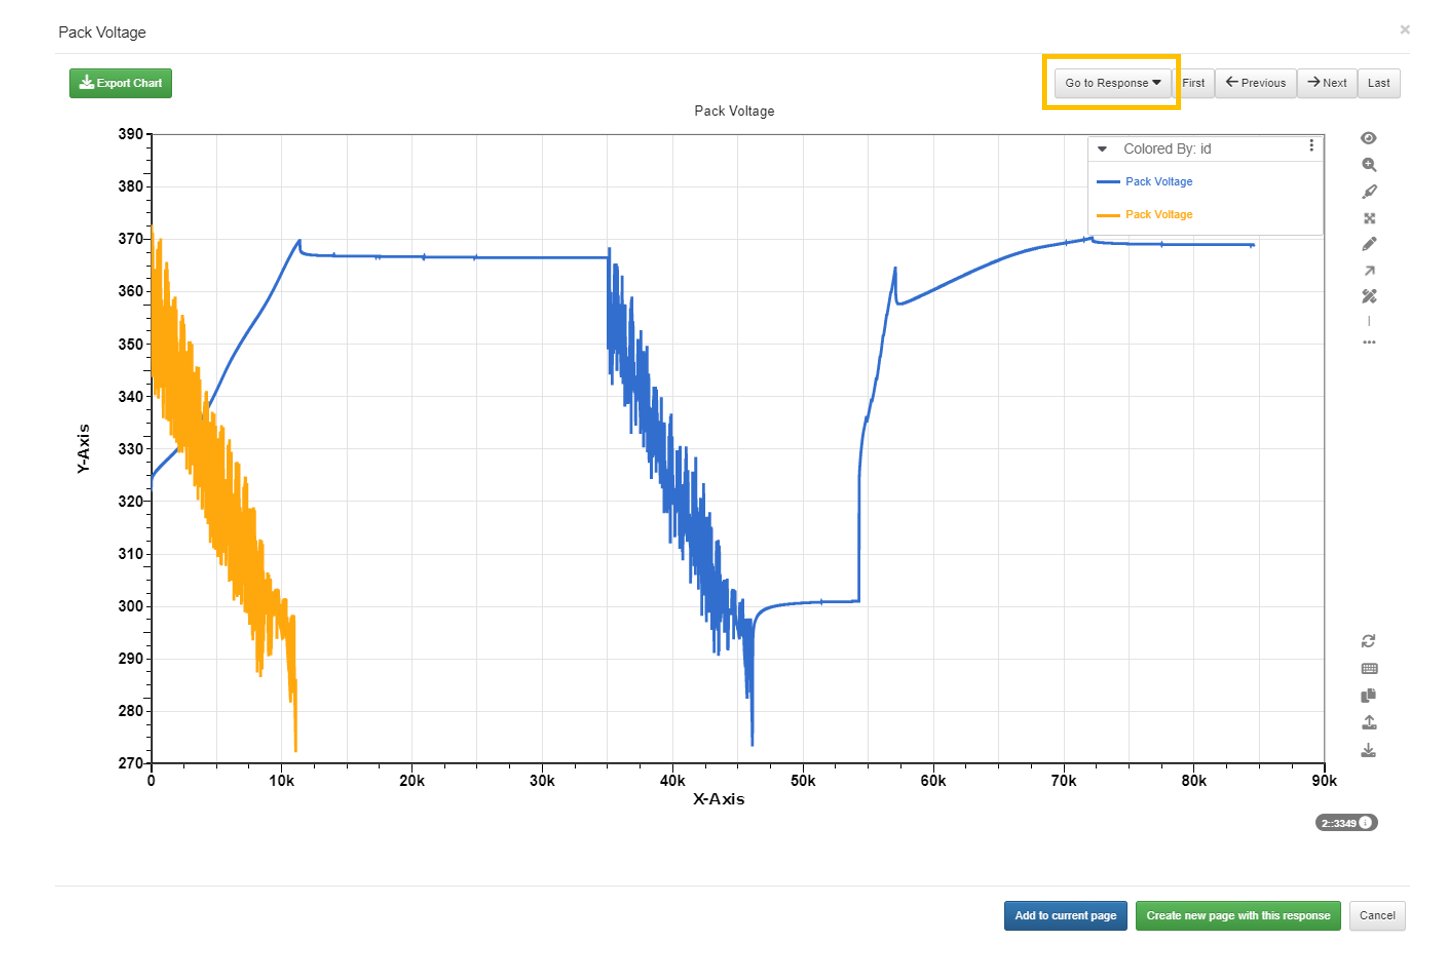
- Quick preview of the responses
- Create a new page
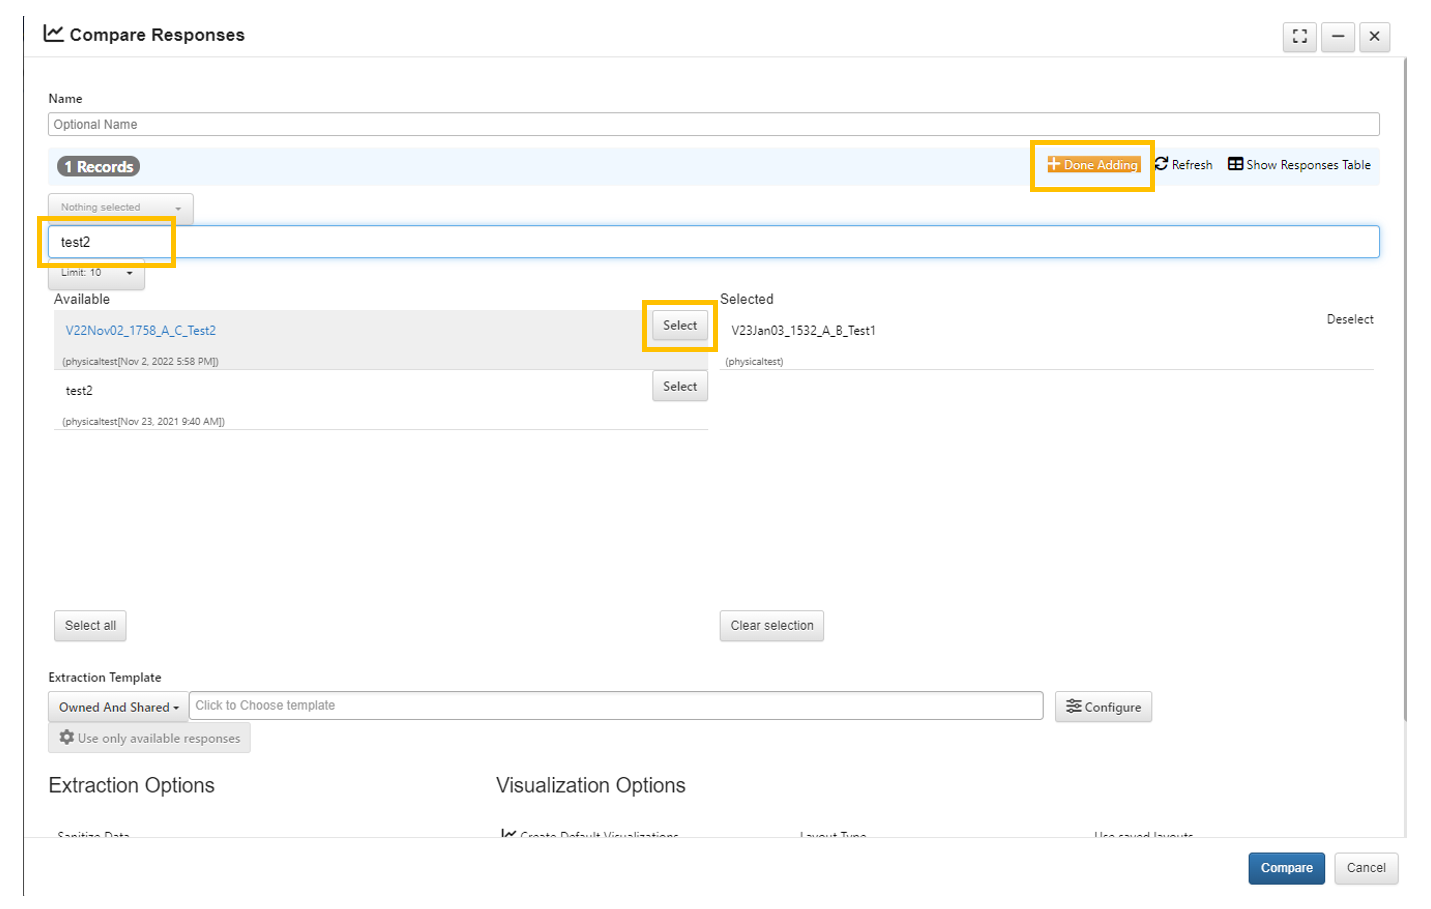
Method 2. When the test records we want to compare are not in the same project, we can open one of them and add the others to compare.
- Right click on one test record to compare and select “Compare Responses” on the top
- Click “Add records”
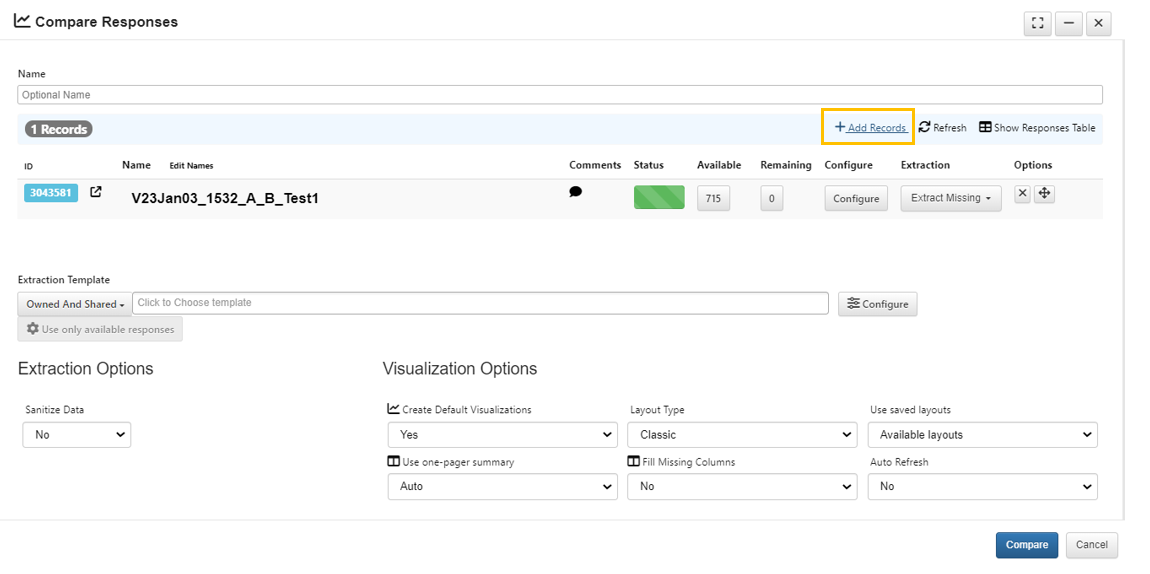
- Search for and select interested records and “Add Records” for comparison and click “Compare”