Curve Visualization
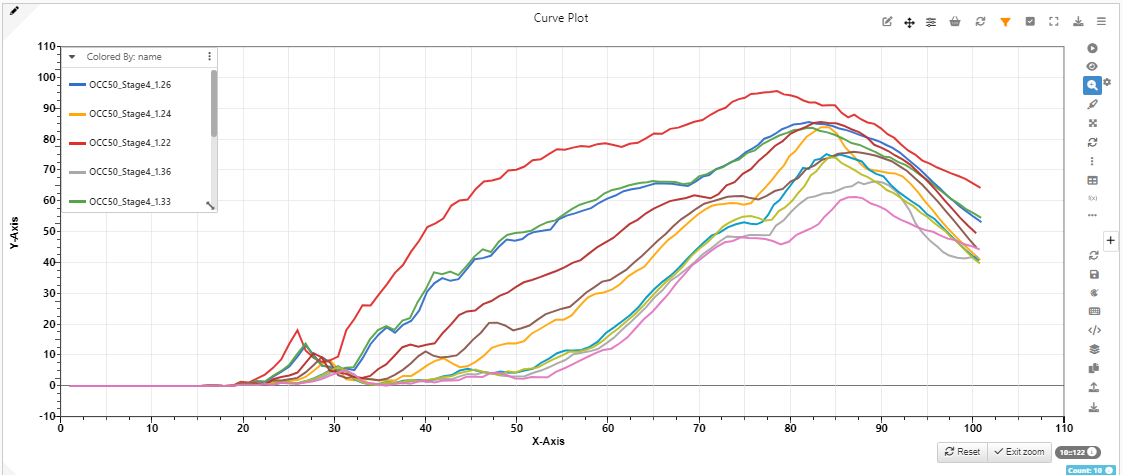
This visualizer plots time-history data and is helpful when both X and Y data are numbers. The color, line and opacity of the curves can be based on other columns which allows visualizing upto 5 dimensions.
Curve Chart